Article

Earthquake-Damaged Buildings Detection in Very High-Resolution Remote Sensing Images Based on Object Context and Boundary Enhanced Loss

1
Key Laboratory of Meteorological Disaster, Ministry of Education (KLME), Nanjing University of Information Science and Technology, Nanjing 210044, China
2
Hubei Key Laboratory of Intelligent Vision Based Monitoring for Hydroelectric Engineering, China Three Gorges University, Yichang 443002, China
3
China Yichang Key Laboratory of Intelligent Vision Based Monitoring for Hydroelectric Engineering, China Three Gorges University, Yichang 443002, China
4
Jiangsu Key Laboratory of Meteorological Observation and Information Processing, Nanjing University of Information Science and Technology, Nanjing 210044, China
5
Shanghai Institute of Microsystem and Information Technology, Chinese Academy of Sciences, University of Chinese Academy of Science, Shanghai 200000, China
*
Author to whom correspondence should be addressed.
Remote Sens. 2021, 13(16), 3119; https://doi.org/10.3390/rs13163119
Submission received: 22 June 2021 / Revised: 1 August 2021 / Accepted: 2 August 2021 / Published: 6 August 2021
(This article belongs to the Special Issue Information Retrieval from Remote Sensing Images)

Abstract

:
Fully convolutional networks (FCN) such as UNet and DeepLabv3+ are highly competitive when being applied in the detection of earthquake-damaged buildings in very high-resolution (VHR) remote sensing images. However, existing methods show some drawbacks, including incomplete extraction of different sizes of buildings and inaccurate boundary prediction. It is attributed to a deficiency in the global context-aware and inaccurate correlation mining in the spatial context as well as failure to consider the relative positional relationship between pixels and boundaries. Hence, a detection method for earthquake-damaged buildings based on the object contextual representations (OCR) and boundary enhanced loss (BE loss) was proposed. At first, the OCR module was separately embedded into high-level feature extractions of the two networks DeepLabv3+ and UNet in order to enhance the feature representation; in addition, a novel loss function, that is, BE loss, was designed according to the distance between the pixels and boundaries to force the networks to pay more attention to the learning of the boundary pixels. Finally, two improved networks (including OB-DeepLabv3+ and OB-UNet) were established according to the two strategies. To verify the performance of the proposed method, two benchmark datasets (including YSH and HTI) for detecting earthquake-damaged buildings were constructed according to the post-earthquake images in China and Haiti in 2010, respectively. The experimental results show that both the embedment of the OCR module and application of BE loss contribute to significantly increasing the detection accuracy of earthquake-damaged buildings and the two proposed networks are feasible and effective.

Graphical Abstract

1. Introduction

Timely and accurately acquiring of earthquake damage information of buildings based on remote sensing images is of great significance for post-earthquake emergency response and post-disaster reconstruction [1,2]. Different from common urban scenes, post-earthquake remote sensing images contain rather complex structures and spatial arrangement and earthquake-damaged buildings with diversified patterns are mingled with undamaged buildings, which greatly challenges the abstract representation and feature modeling of earthquake-damaged buildings [3,4]. The automatic detection technology for earthquake-damaged buildings using very high-resolution (VHR) remote sensing images has become a research hotspot in computer vision.
Compared with traditional machine learning methods, approaches based on deep learning are able to automatically extract high distinguish degree and representative abstract features that are crucial for the application in the detection of earthquake-damaged buildings. Among these approaches, the classical convolutional neural network (CNN) assigns a classification label to an image patch with a fixed size [5,6]. In comparison, the semantic segmentation based on the fully convolutional network (FCN) can obtain pixel-level detection results, which are more favorable for accurate localization of positions and boundaries of the earthquake-damaged buildings [7,8]. On the basis of the FCN, fruitful research results have been achieved for semantic segmentation based on VHR remote sensing images. For example, Diakogiannis et al. [9] proposed a reliable deep learning framework for semantic segmentation of remote sensing data; Chen et al. [10] proposed a dense residual neural network (DR-Net) for remote sensing image building extraction, aimed at reducing the number of parameters and making the low-level features and abstract features fully fused. Nevertheless, these studies mainly focus on object extraction from common urban scenes, while the semantic segmentation method specific for the detection of earthquake-damaged buildings also warrants to be developed. This is because the earthquake-damaged buildings show diversified sizes, shapes and damage types; however, the convolution operation is usually restricted within a fixed range, which is unfavorable for the complete profile extraction of buildings with different sizes. Additionally, undamaged buildings, earthquake-damaged buildings, and other objects are mingled in the post-earthquake scenes. Generally, FCN induces the loss of many spatial details during down-sampling, so that the pixels in the vicinity of the boundary are more difficult to predict than the other pixels. To display the above problem, the common errors in the segmentation results are shown by utilizing DeepLabv3+ and UNet by taking the post-earthquake images of Yushu, Qinghai Province, China in 2010 collected by the GE01 satellite as the example, as shown in Figure 1. It can be seen that both the errors and inconsistent boundaries occur at different degrees in the segmentation results of the two networks for non-collapsed and collapsed buildings.
To deal with the incomplete extraction of different sizes of earthquake-damaged buildings, it is common to expand the local receptive fields by aggregating multi-scale spatial context. However, the features extracted based on the method lack the global context-aware; the self-attention mechanism can estimate the relationship between each position pixel and globality while it fails to consider the difference among different classes of pixels. Therefore, the correlation mining is inaccurate [11,12,13]. The recently proposed OCR augments the representation of one pixel by exploiting the representation of the object region of the corresponding class, so it is able to extract more comprehensive context information. Despite this, because OCR is initially designed for generic semantic segmentation scenes, there are few studies on the embedment of OCR in deep networks (e.g., DeepLabv3+ and UNet) popular in the remote sensing field. Aiming at this, the DeepLabv3+ and UNet embedded with OCR module respectively in different ways are designed in this paper to further learn the relationship between pixel features and different object region features. By doing so, the augmented representation of each pixel is obtained during deep feature extraction. In terms of inaccurate boundary prediction, existing research retains more detailed spatial information mainly through methods such as multi-level feature fusion, which lacks the design of augmented boundary information [14]. It is obviously not reliable to extract object boundaries by adding additional network branches and take this as a basis for boundary refinement [15]. Different from other studies, we directly design a new boundary confidence index (BCI) based on the ground truth map in the training set to quantitatively describe the spatial positional relationship between each pixel and the boundary. On this basis, a novel boundary enhanced loss (BE loss) is proposed to refine segmented boundaries. In this way, the augmented representation of each pixel is obtained via deep feature extraction and BE loss that exploits the spatial position of pixels in objects to refine segmented boundaries.
Based on DeepLabv3+ and UNet networks, we propose an earthquake-damaged buildings detection method in VHR remote sensing images based on object context and BE loss. The method yields PA of separately at most 87% and 93% in the experiments on two benchmark datasets and performs the best when compared with the base networks and two advanced generic semantic segmentation methods. The main contributions of this study are summarized as follows:
(1)
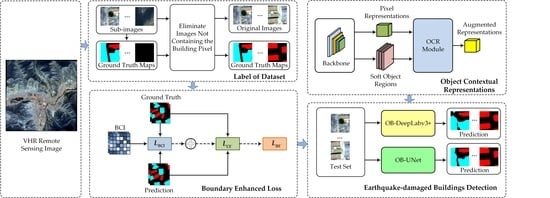
We develop the improved DeepLabv3+ and UNet networks embedded with the OCR module respectively, which realize the significant enhancement of the feature representation ability.
(2)
We propose the BCI to quantitatively describe the spatial position of pixels in objects. Furthermore, a novel BE loss is developed to enhance the segmentation accuracy of the boundaries. This loss automatically assigns pixels with different weights and drives the network to strengthen the training of boundary pixels.
The rest of the study is organized as follows: Section 2 introduces the relevant techniques; Section 3 describes the proposed method in detail; Section 4 displays datasets, experimental settings and results; Section 5 makes some discussion on this study and Section 6 draws conclusions and gives prospects.

2. Related Work

This section briefly introduces the techniques related to the study. To be specific, Section 2.1, Section 2.2, Section 2.3 and Section 2.4 separately describe the FCN for semantic segmentation, spatial context, object context and boundary refinement.

2.1. FCN for Semantic Segmentation

FCN is an end-to-end network for semantic segmentation developed from CNN [16,17]. By replacing fully connected layers in CNN with convolutional layers, FCN realizes the pixel-level segmentation with the aid of bilinear interpolation or transposed convolution [18]. As the encoder-decoder architecture is generally applied in networks, the position information of some pixels is possibly lost during down-sampling and pooling of the input images, which is unfavorable for the dense prediction in the decoding stage. In order to solve the problem, the network is generally improved through two methods: one is to connect the encoder and decoder by shortcuts to recover the detailed information on images, such as UNet and SegNet [19]; the other is to expand the receptive field by using the dilated atrous convolution to replace the pooling layer, such as DeepLab series [20,21,22]. Compared to CNN, the network is not restricted by a patch with a fixed size and realizes the pixel-level segmentation, thus being favorable for flexible positioning and profile extraction of earthquake-damaged buildings.

2.2. Spatial Context

Buildings show different sizes in the post-earthquake scenes; however, the traditional convolutional networks employ a receptive field with a fixed size, so that they perform poorly when segmenting large or small objects. Aiming at the problem, previous research was generally carried out based on the aggregation method of the multi-scale context [23]. For example, different scales of outputs are attained and reused by performing the pooling operation with different window sizes based on the pyramid pooling module (PPM) proposed in PSPNet. The atrous spatial pyramid pooling (ASPP) with different dilation rates used in the DeepLab series strengthens the adaptability to multiple scales through multi-scale receptive fields. Additionally, the attentional mechanism is also widely applied in the dense prediction of pixels [24]. However, only the spatial context is taken into account in a majority of attentional mechanisms, that is, pixels are weighted by calculating the positional relationship or similarity among all pixels to strengthen the feature representation of each pixel. For example, there are position attention module and channel attention module in the DANet, based on which the dependences of the global features in spatial and channel dimensions are separately learned [25]; the adaptive feature pooling (AFP) is introduced in the PANet and combined with the global context to learn the better feature representation [26]; HRCNet employ the light-weight dual attention (LDA) module and the feature enhancement feature pyramid (FEFP) structure to obtain global context information and fuse the contextual information of different scales respectively [27]. Nevertheless, it is common to locally expand the receptive field or collect information from whole images as for the spatial context method, in which the former lacks the global context-aware while the latter leads to inaccurate correlation mining [28,29,30].

2.3. Object Context

The semantic segmentation tasks show a high interclass similarity and adjacent similar pixels are easily misjudged. Therefore, it is essential to enhance the distinction between features [31]. Hence, by calculating the similarity of a pixel with other pixels within an object region, the object context method can augment the representation of the pixel. For example, ACFNet [32] and OCRNet realize the pixel-category-feature mapping on the basis of learning the relationship between pixels and the object region. As a novel attentional mechanism, the object context not only aggregates the same type of object regions but also considers the similarity between pixels and the same type of object region. However, the previous attentional mechanism only considers the relationship among pixels.

2.4. Boundary Refinement

It is generally necessary for the networks for semantic segmentation to perform down-sampling multiple times during the feature extraction, thus losing many spatial details. Therefore, the boundary of images cannot be favorably reproduced in the subsequent up-sampling process, that is, with the boundary refinement problem [33,34]. Thus, some improvements are made in current research from two aspects, i.e., post-processing and training process. For example, performing post-processing on the segmentation result by using DenseCRF can smooth the boundary to some extent, at the cost of long inference time and large computational amount though [35]; SegFix optimizes the result about the boundary region predicted by existing networks through the boundary map and direction map of the test data produced in advance and thus outperforms DenseCRF [36]. AttResUNet benefiting from modeling graph convolutional neural network (GCN) on the superpixel level, the boundaries of objects are restored to a certain extent and there are fewer pixel-level noises in the final classification results [37]. Generic semantic segmentation via multi-task network cascades is proposed based on CascadePSP. It can improve and modify the local boundary of the training data with any resolution and further strengthen the performance of the existing segmentation networks without slight adjustment [38,39,40].

3. Methodology

The proposed method is illustrated in detail in this section. At first, the established networks are overviewed. Afterward, the proposed networks for semantic segmentation embedded with the OCR module and BE loss are elaborated.

3.1. Model Overview

Two advanced networks (DeepLabv3+ and UNet) for semantic segmentation are taken as the basic networks for detecting earthquake-damaged buildings. Based on the encoder-decoder architecture, DeepLabv3+ can expand the receptive field by connecting dilated convolution with different dilation rates after the backbone network, which is favorable for multi-scale feature extraction; UNet can favorably reuse high-level features and low-level features through shortcuts based on the encoder-decoder architecture.
On this basis, two networks are designed such as OCR-BE-DeepLabv3+ (OB-DeepLabv3+) and OCR-BE-UNet (OB-UNet) by separately embedding the OCR module into UNet and DeepLabv3+ and also using the proposed BE loss as the loss function.
(1)
OB-DeepLabv3+: The resnet152 is taken as the backbone of DeepLabv3+ for feature extraction [41]. On this basis, the pyramid pooling module with dilated convolution is connected with the OCR module in series, as shown in Figure 2.
On the basis of resnet50, resnet152 increases the depths of the third and fourth convolutional blocks, thus showing the network structure at a higher level. In addition, new features can be learned based on the input features according to the residual structure of resnet152, thus solving the network degradation. Therefore, using resnet152 makes the network show better feature extraction capability under the allowable hardware conditions and therefore resnet152 is more applicable for semantic segmentation of the post-earthquake remote sensing images under complex scenes. Moreover, the coarse segmentation map underpins the OCR, so the representation of ASPP after concat is applied to predict the coarse segmentation result (object regions) and used as an input of OCR. The result of the representation of ASPP after concat to go through a 3 × 3 convolution is taken as another input of OCR. In this case, the output of OCR means the augmented representation of features.
(2)
OB-UNet: The OCR modules are connected to shortcut connection in the fourth layer of UNet in series considering the symmetry of UNet network structure, as shown in Figure 3 The design aims to, on the one hand, attain a favorable coarse segmentation result from high-level features; on the other hand, high-level features tend to contain numerous semantic features while losing some detail features. Thus, introducing the object contextual attention is favorable for restoring the details of earthquake-damaged buildings.

3.2. OCR Module

The context of each pixel is extremely important for refined pixel-level image classification tasks such as semantic segmentation. Especially, it is easier to result in the wrong segmentation owing to collapsed buildings, non-collapsed buildings, and other surface feature pixels are mingled in complex post-earthquake scenes. Therefore, the OCR module is separately introduced into the two advanced network structures to integrate the contexts of pixels and further attain the augmented pixel representation [42]. The structure of the OCR module is displayed in Figure 4.
As shown in Figure 4, the OCR module mainly comprises three parts:
(1)
Partition of soft object regions: The coarse semantic segmentation of the image is performed by using the backbone network for feature extraction, which is taken as an input for the OCR module. On the basis of the coarse segmentation result, the image is partitioned into K soft object regions, each of which separately represents a class k.
(2)
Object region feature representation: Within the kth object region, all pixels are subjected to the weight sum according to their membership degree in the region. In this way, the feature representation f k of the region is obtained:
f k = i I m ˜ k i   x i ,
where, I , x i and m ˜ k i denote the pixel set in the kth object region, the feature representation of the pixel p i output by the highest level of the network and the normalization degree of the pixel p i belonging to the kth object region obtained by spatial softmax, respectively.
(3)
The augmented feature representation by object context: The relationship between x i and f k is calculated by applying Equation (2):
r i k = e σ ( x i , f k ) j = 1 K e σ ( x i , f j ) ,
where σ ( x , r ) = ϕ ( x ) φ ( r ) refers to the unnormalized relationship function; ϕ ( ) and φ ( ) are two transformation functions. On this basis, the object contextual representation y i of each pixel is calculated according to Equation (3), that is OCR:
y i = ρ ( k = 1 K r i k δ ( r k ) ) ,
where δ ( ) and ρ ( ) denote the transformation functions. Afterward, the final augmented feature representation z i is obtained after aggregating y i with x i :
z i = g ( [ x i y i ] ) ,
where g ( ) stands for the transformation function for fusing x i and y i .

3.3. Boundary Enhanced Loss

The collapsed buildings, non-collapsed buildings and other types of pixels in post-earthquake scenes are more significantly mingled than those in common city scenes. Therefore, it is more difficult to predict pixels at the surface feature boundary. At present, the commonly used loss functions (such as Focal loss) generally only consider the relationship between the prediction probability of a pixel in the training samples and the labels while fail to consider the relative positional relationship between the pixel and the object boundary; moreover, the pixels in the vicinity of the object boundary should get a high loss during the training to improve the elaborate characterization ability of the prediction network for the object boundary.
Based on the above analysis, a boundary confidence index (BCI) is designed and further BE loss is proposed. The calculation process is shown as follows:
  • Step 1: A 3 × 3 window is established centered on a pixel c in a ground truth map, which is used as the initial neighborhood. If a pixel e with a classification label different from that of c is present in the current neighborhood, the neighborhood serves as the final neighborhood; otherwise, the domain is expanded at the step length of 1 until a pixel e showing classification label different from that of c appears in the current neighborhood. The current window size W × W acts as the final neighborhood. Besides, to decrease the difference in different directions, four points at vertexes of the neighborhood are removed to make the neighborhood approximate to a circle. For example, the final neighborhoods when W equals 5 and 9 are shown in Figure 5.
  • Step 2: Owing to objects c and e belong to different classes, the distance between c and e reflects the degree of closeness of c with the object boundary. Based on the assumption, a boundary measurement index corresponding to c is defined as d c = ( W 3 ) / 2 . It is possible to attain the set D of the initial boundary measurement indexes by traversing all pixels.
  • Step 3: As different surface feature objects probably greatly differ in their size and shape, quite large outliers are likely to occur in set D, thus triggering the bias of the statistical results. Hence, the maximum d c corresponding to each of the K classes of pixel points is separately computed in set D and defined as d max k . Furthermore, the minimum d max min in d max k is taken as the upper limit of all d c in set D to attain the updated set D * of the boundary measurement indexes.
  • Step 4: Assuming that the boundary measurement index of c in set D * is d c * and normalized, the corresponding BCI of c is defined as follows:
    D BCI = e 1 d c * d max min ,
    A larger D BCI of a pixel means that the pixel is more likely to occur at the boundary of the object; on the contrary, the pixel is more likely to lie in the interior of the object.
  • Step 5: Given that Focal loss can effectively relieve the problems concerning class imbalance of samples and classification of hard samples, the BCI loss is defined as follows according to BCI and Focal loss:
    L B C I = 1 N n = 1 N k = 1 3 D BCI α k l k n ( 1 p k n ) γ log p k n ,
    where N and l k n separately refer to the number of pixels within a batch and the true label encoded by one-hot corresponding to the nth pixel. Thus, the pixel closer to the boundary makes a greater contribution to the total loss in L B C I , that is, driving the network to strengthen the training of boundary pixels. Moreover, γ refers to the focusing parameter of hard and easy samples, aiming to reduce the weight of the easy samples and further making the network pay more attention to the hard samples during the training. The parameter is generally set as 2 [43]. The introduction of the classification weight α k aims to relieve the class imbalance of the training samples, which is calculated as follows:
    α k = median ( f k ) f k ,
    where f k and median ( f k ) denote the frequency of the kth class of pixels and the median of the frequency of the K classes of pixels, respectively.
  • Step 6: BE loss is defined as follows:
    L B E = L B C I + L C E ,
    where L C E represents the general cross-entropy loss [44]. The purpose of introducing L C E is to prevent the network from being hard to converge due to quite a large D BCI of the boundary in the later training period of the network. Figure 6 shows the schematic diagram of the proposed L B E .

4. Experiments and Results

4.1. Datasets

4.1.1. Research Region

The YSH dataset was carried out based on GE01 satellite remote sensing images of the Yushu region, Qinghai Province, China collected on 6 May 2010. The earthquake happened on 4 April 2010, with the highest order of magnitude of 7.1. The images covered the panchromatic and multispectral (blue, green, red and near-infrared) bands, with spatial resolutions of 0.41 m and 1.65 m, respectively. The images were fused to pan-sharpened RGB images with the spatial resolution of 0.41 m by using ENVI software during the experiment. The original size of the image measured 10,188 × 10,160 pixels, as shown in Figure 7a. The HTI dataset was carried out based on QuickBird satellite remote sensing images of Haiti collected on 15 January 2010. The earthquake happened on 12 January 2010, with the highest order of magnitude of 7.0. The images covered the multispectral (blue, green, red and near-infrared) bands, with the spatial resolution of 0.45 m. The original size of the image measured 6138 × 6662 pixels, as shown in Figure 7b. In the severely affected areas of the Yushu earthquake, almost all wooden structures collapsed, and 80% of brick-concrete structures and 20% of frame structures collapsed or were severely damaged. As aseismic design was not considered for most buildings in Haiti, the Haiti earthquake caused about 105,000 buildings to be completely destroyed. By carrying out experiments on the two datasets collected from different regions in the research, it is beneficial to validating the extensiveness of the work.
In addition, the damage level of buildings is influenced by multiple factors such as the earthquake intensity and construction materials of the buildings. At present, post-earthquake buildings are partitioned into heavily damaged, moderately damaged, slightly damaged, and undamaged buildings according to the commonly used EMS-98 scale standard [45]. Within the research region, the buildings constructed with different materials were damaged at significantly different degrees. For example, many brick-concrete structures were heavily damaged, mostly appearing as collapse; there were a small number of buildings with steel-concrete composite structures that collapsed or partly collapsed; in addition, a majority of moderately damaged buildings and slightly damaged buildings were hard to be elaborately distinguished only according to the spectra and textures of the rooftop. Moreover, the type of buildings was not highly concerned during post-earthquake emergency response. On this basis, undamaged and earthquake-damaged buildings (excluding collapsed buildings) were categorized as non-collapsed buildings. Therefore, the datasets for semantic segmentation were divided into collapsed buildings, non-collapsed buildings and others.

4.1.2. Label of Dataset

In view of the actual size of buildings in images and keeping abundant spatial contexts of buildings as far as possible, the original images are segmented into sub-images with 128 × 128 pixels. By artificially labeling each sub-image and eliminating sub-images not containing the building pixel, the YSH dataset consisting of a total of 1420 samples is attained. On this basis, the YSH dataset is stochastically partitioned according to the proportion of 6:1:3 into 870, 150 and 400 samples, which separately make up a training set, validation set and test set. The HTI dataset contains 1230 samples. According to the same proportion, there are 738, 123, and 369 samples in the training set, validation set and test set, respectively. The Image Labeler in MATLAB2018b is used to label the dataset to attain the ground truth map. Figure 8 shows an original image and its corresponding ground truth map.

4.2. Experimental Settings

The method proposed in this article was implemented based on the PyTorch-1.3.1 framework in the Ubuntu 16.04 environment. All experiments were conducted on an Nvidia GeForce RTX 2080ti GPU with 11GB RAM. In the experiment, the Adam optimizer where the initial learning rate was set to 1 × 10⁻³ and the weight decay was set to 1 × 10⁻⁵ was used to optimize the network. The learning rate dynamic adjustment strategy of exponential decay was adopted, and the attenuation base was set to 0.99. The learning rate would decay exponentially with the increase of the epoch. The number of epochs was set to 100, and the batch size was set to two. The images used for training, validation and test were all cropped into 128 × 128 pixels. Some commonly used data augmentation approaches, including the horizontal flip of the image, random rotation of the image within the angle range of [–15, 15], random scaling was set with 0.75 and 1.5, random clipping of the image to any size and horizontal/vertical ratio, normalization of the mean and standard deviation of the image: Mean = (0.315, 0.319, 0.470), std = (0.144, 0.151, 0.211). According to the proportion of non-collapsed buildings, collapsed buildings and others, Equation (7) was used to calculate the category weight, which α k was respectively set with 1, 1.3952, 0.2662 in the YSH dataset and 1, 4.2668, 0.2437 in the HTI dataset.

4.3. Comparison of Performances of Different Networks

The performances of the two improved networks in Section 3.1. were validated based on the YSH and HTI datasets. On this basis, the DeepLabv3+ and UNet networks were applied as the base networks and separately combined with Focal loss to perform the prediction during the experiment. Furthermore, two advanced generic segmentation methods were carried out for comparison. Among them, MobileNetV2+CA introduces a novel attention mechanism by embedding positional information into channel attention, which helps models to more accurately locate and recognize the objects of interest [46]; UNet 3+ takes advantage of full-scale skip connections and deep supervisions to make full use of the multi-scale features [47]. The results of visualization and quantitative evaluation were analyzed and discussed as for the experimental results obtained through different networks.

4.3.1. Visualization Results

The comparisons with different networks based on visual interpretation are elaborated as follows:
(1)
YSH dataset: The experimental results on the YSH dataset for different networks are shown in Figure 9. It can be seen that the proposed OB-DeepLabv3+ and OB-UNet yield more complete detection results and recover more abundant boundaries and details. DeepLabv3+, UNet, OB-DeepLabv3+ and OB-UNet all exhibit a favorable detection effect when detecting non-collapsed buildings with regular shapes and definite boundaries, basically showing no missing detection. As in the second row of Figure 9, only the DeepLabv3+ shows incomplete boundary extraction for non-collapsed buildings. This indicates that the multi-scale context used by DeepLabv3+ is not enough for recovering the abundant details in VHR remote sensing images. However, DeepLabv3+ and UNet show a high probability of missing detection (as shown in rows 1, 3 and 4 in Figure 9c,d) when detecting collapsed buildings without definite boundaries and regular textures; moreover, the regions detected by using the two methods are scattered. In comparison, the proposed OB-DeepLabv3+ and OB-UNet, as shown in Figure 9g,h), reduce the probability of the missing detection for collapsed buildings to some extent; besides, the integrity of the regions detected thereby is strengthened. Therefore, our improvement of the base networks is conducive to the complete extraction of building profiles and accurate location of boundaries.
Compared with the two advanced generic segmentation methods, when detecting large-scale buildings with irregular shapes, the two improved networks based on UNet obtain different results (the first row of Figure 9): the boundaries of collapsed buildings and roads are mingled and indistinguishable in Figure 9f; while roads and buildings are clearly distinguished in Figure 9h. This is mainly because although UNet 3+ realizes multi-scale skip connections to make full use of multi-scale context, it does not have specific designs for boundaries; in contrast, the spatial location information of pixels in objects is introduced in the proposed OB-UNet, makes the method perform better in recovering boundaries. For complex scenes containing mixed collapsed and non-collapsed buildings, as shown in the third row of Figure 9, non-collapsed buildings are not completely extracted in both Figure 9e,f and some non-collapsed buildings are detected as collapsed ones. Whereas, non-collapsed buildings are completely detected in Figure 9g,h, with clear boundaries. This is mainly because the proposed OB-DeepLabv3+ and OB-UNet networks are capable of learning context features from the object regions due to the embedment of the OCR module, which improves their feature expression ability. In comparison, MobileNetV2+CA does not consider types of pixels despite embedment of location information in the channel attention. The local regions (yellow boxes) in Figure 9 are amplified to more closely observe the object boundary and details in the detection results, as shown in Figure 10. It is observed that the proposed methods provide more refined detection results in earthquake-damaged buildings detection. As shown in the second row of Figure 10g,h, the error detection and missing detection basically do not occur and the boundary of non-collapsed buildings is favorably segmented. Therefore, by fully mining the context and driving the network to strengthen the training of boundary pixels, the proposed methods have significantly superior detection results for earthquake-damaged buildings than the two generic methods compared with.
(2)
HTI dataset: Figure 11 illustrates the detection results of different methods for the HTI dataset. When detecting large-scale buildings, relatively complete buildings are detected only in the fourth row of Figure 11g,h, while the other methods (the fourth row of Figure 11c,f) show different degrees of missing detection and error detection. This indicates that the method of aggregation of the multi-scale context alone is not enough in missions involving greatly varying scales. Compared with the YSH dataset, buildings in the HTI dataset are smaller and distributed more densely, which makes the categorization of seismic damages and prediction of boundaries more difficult. It can be seen that some small-scale non-collapsed buildings are not completely detected when using the UNet and UNet 3+ methods, such as those in the third row of Figure 12d,f. In comparison, OB-UNet completely detects these buildings, such as those in the third row of Figure 12h. These results suggest that it is difficult to completely extract the context of pixels through the aggregation of multi-scale context alone; while attributed to the introduction of object context, OB-UNet significantly improves the completeness of the extracted profiles. Compared with the two methods without OCR module and BE loss (Figure 11c,d), the proposed methods greatly improve the detection accuracy. For example, in the second and third rows of Figure 11, many non-collapsed buildings and the others are detected as collapsed ones in both Figure 11c,d, and the boundaries of non-collapsed buildings are indiscernible; while these problems are well solved in Figure 11g,h. This again demonstrates that the improvement of the base networks in the research is effective.
Although MobileNetV2+CA can extract most buildings, the accuracy is not high. For instance, buildings in rows 1 and 3 of Figure 12e show unclearly segmented boundaries and neighbor buildings are connected. While in the detection results using UNet 3+, the buildings exhibit more definite boundaries (the rows 1 and 3 of Figure 12f). However, some buildings are not completely detected, such as those in the third row of Figure 12f. This indicates that introducing location information only from the perspective of channels or the use of multi-scale context fusion alone fails to completely detect earthquake-damaged buildings and predict clear boundaries.
According to the above analysis, it is concluded that the proposed methods can always detect more complete and more accurate building boundaries in different post-earthquake scenes. Therefore, they have favorable general applicability.

4.3.2. Quantitative Evaluation

The frequency of pixels representing different types of objects is first computed in order to select the proper index for evaluating the accuracy of quantitative evaluation, as shown in Figure 13a,b.
It can be found that the samples of non-collapsed buildings and collapsed buildings are sparser than the other types of samples while they should be highly concerned during the detection of earthquake-damaged buildings. Therefore, apart from pixel accuracy (PA) for reflecting the overall accuracy, the intersection over union (IoU), Recall and F1-score for reflecting the accuracy of a single class are also employed and they are separately defined as follows:
P A = T P + T N T P + F P + T N + F N ,
I o U = T P T P + F P + F N ,
R e c a l l = T P T P + F N ,
F 1 = 2 × R e c a l l × P r e c i s i o n R e c a l l + P r e c i s i o n , P r e c i s i o n = T P T P + F P ,
where TP, TN, FP and FN separately represent true positive, true negative, false positive and false negative. By taking non-collapsed buildings as an example, TP stands for where pixels for non-collapsed buildings are predicted as non-collapsed buildings; TN represents where pixels for collapsed buildings or the others are predicted as collapsed buildings or the others. FP represents where pixels for collapsed buildings or the others are predicted as non-collapsed buildings; FN represents where pixels for non-collapsed buildings are predicted as collapsed buildings or the others. Additionally, mIoU, mRecall and mF1 separately refer to the average values of IoU, Recall and F1-score of all single classes. According to the above evaluation indexes for accuracy, the results of the quantitative evaluation are shown in Table 1.
As shown in Table 1, PA by using both DeepLabv3+ and UNet with the OCR module and BE loss increases by about 1–2% compared to those by applying their corresponding base networks. The single class IoU grows by 3–6%; mRecall (3–10%) and mF1 (3–8%) increase more significantly. Besides, the PA obtained by OB-UNet is 0.4–4% higher than those of the two generic advanced segmentation methods. OB-DeepLabv3+ attains PA improved by 0.5–3% in comparison with the two methods and has slightly lower PA than the UNet 3+ only for the HTI dataset while has higher IoU for collapsed buildings. This is because in samples in the HTI dataset, the numbers of non-collapsed buildings and the others differ greatly (Figure 13b). The BE loss used by OB-DeepLabv3+ involves a category balancing factor, which inhibits pixels of the others in the training while pixels of collapsed building gain more training. At the same time, the classification accuracy for others reduces, so that the overall accuracy (reflected by PA) decreases accordingly. In addition, the overall index obtained by OB-UNet is higher than that by OB-DeepLabv3+. This is because DeepLabv3+ shows a network with a higher level; moreover, the datasets used in the study exhibit a small sample size and therefore the network is not fully fitted; only an intermediate feature layer is introduced in DeepLabv3+ even though the network possesses the encoder-decoder architecture; by contrast, UNet is used to perform shortcut connection on each corresponding layer and therefore it delivers more favorable capability in restoring the image details.

5. Discussion

5.1. Analysis of the Embedment Effect of the OCR Module

The four groups of different networks were compared on the same training setup and loss function to independently validate the embedment effect of the OCR module. The results are displayed in Table 2. In the experiments on the YSH dataset, PA obtained by DeepLabv3+ and UNet with the addition of OCR module increases by 0.2–0.8% compared with those attained by applying DeepLabv3+ and UNet; moreover, mIoU rises by 2–3%. IoU of non-collapsed buildings declines by 0.2% while that of collapsed buildings grows by 6% by UNet with the OCR module. In the experiments on the HTI dataset, PA obtained by DeepLabv3+ and UNet with the addition of OCR module increases by 0.5–0.6% compared with those attained by applying DeepLabv3+ and UNet; besides, mIoU rises about 2%. Therefore, it is necessary to introduce the relationship between object regions and pixels in the detection of earthquake-damaged buildings. From another point of view, the strategy of embedding the OCR module into the two base networks is effective for improving the segmentation performance.

5.2. Analysis of the Effectiveness of BE Loss

CE loss and Focal loss were separately used for comparison during the experiment in order to independently validate the effectiveness of BE loss, as shown in Table 3.
As shown in Table 3, the IoU of collapsed buildings obtained using the network with Focal loss greatly increases compared to that with CE loss. This is because the samples in the dataset show the problem of class imbalance. As shown in Section 4.3.2, the proportion of the collapsed building pixels is only 8.46% and 3.24% while that of non-collapsed building pixels is 72.95% and 77.86% in the YSH and HTI datasets, respectively, which influences the learning effect of the network for collapsed buildings. Focal loss increases the cost of collapsed buildings by growing the weight of different classes of pixels, thus improving the classification accuracy of collapsed buildings. BE loss means adding BCI based on Focal loss. Therefore, the advantage of Focal loss for processing the class imbalance of samples and hard samples is kept in BE loss and also BE loss pays more attention to the boundary pixel. From the results, the IoU and PA obtained by DeepLabv3+ and UNet with BE loss grow compared with those attained by using DeepLabv3+ and UNet with Focal loss. The PA based on BE loss is the highest among the three loss functions, which verifies the effectiveness of BE loss.

5.3. Analysis of the Influence of BE Loss on the Segmentation Effect of the Boundary

To further analyze the influence of BE loss on the segmentation effect of the boundary, trimaps with four different widths were extracted to perform the quantitative evaluation [48]. At first, the object boundary is extracted by taking the width of 1 pixel from the ground truth map and then assigned with the corresponding classification label. On this basis, each boundary pixel grows at different scales to make their widths reach 3, 5 and 7 pixels. By taking four samples in Figure 14 as examples, the set of trimaps with four different widths is extracted from each sample.
According to the extracted set of trimaps, the prediction results by the networks are separately compared with trimaps with different widths. Moreover, the PA is calculated, as shown in Figure 15.
In the experiments on two benchmark datasets, it can be found that BE loss yields the highest PA among the three loss functions when being embedded into DeepLabv3+ and UNet. Therefore, BE loss delivers a positive effect in improving the segmentation accuracy of the boundary pixel. PA obtained by various methods slightly reduces with the increasing trimap width. The reason is that trimap probably expands inwards and outwards during the growth of the boundary pixel. Therefore, more non-boundary pixels are contained with the growth of the width, thus leading to a slight reduction in the accuracy.

5.4. Analysis of the Setting of γ in BE Loss

The accurate segmentation of collapsed and non-collapsed building pixels is the key to the detection of earthquake-damaged buildings. On the one hand, the two types of pixels probably belong to hard samples due to sparse distribution and belonging to the category of buildings. Therefore, they should be paid more attention to during the training; on the other hand, the parameter γ in BE loss directly determines the weight of hard samples in the training process. Therefore, it is necessary to set a reasonable value of γ . Hence, γ is valued within the range of [0.5, 5] at the step length of 0.5 in the two designed network structures to analyze the relationship between the setting of γ and the segmentation accuracy. Table 4 shows the results.
As shown in Table 4, with the increasing value of γ , the PA in the two networks grows at first and then gradually stably fluctuates after γ reaches 2. This indicates that in semantic segmentation, remaining the loss of hard samples while inhibiting that of simple samples is effective in improving the overall accuracy. On the other hand, the strategy for regulating hard and simple samples has limited effectiveness and when the focusing parameter increases constantly to exceed a certain value, hard samples also cannot be learned more. In the experiments on the YSH dataset, the PA at γ = 5 is the largest while it only improves by 0.2% compared with that at γ = 2 in the OB-UNet; the PA at γ = 2 reaches the maximum in the network DeepLabv3+. In the experiments on the HTI dataset, the PA at γ = 2 is the maximum in the two networks. Additionally, the IoU of the two types of pixels in the two networks is computed in order to further analyze the influence of γ on the segmentation accuracy of collapsed and non-collapsed buildings, as shown in Figure 16.
It can be found that as γ gradually rises, IoU of non-collapsed and collapsed buildings basically reaches the first wave crest when γ approximates to two. In the process, training of hard samples is constantly enhanced while that of simple samples is suppressed. In addition, the IoU at γ = 2 is significantly larger than the average value (as indicated by the horizontal dashed line in the figure). According to the above comprehensive analysis, both PA and IoU show an ideal effect at γ = 2 and therefore γ is directly set as two in practical application.

5.5. Analysis of the Influence of the Image Resolution

When images are at a higher spatial resolution, more pixels are included in an image of the same object and thus more details are found. The original images were down-sampled according to the resolution scales of 0.4, 0.6 and 0.8 in order to analyze the influence of the training samples with different resolutions on the training effect of the networks. On this basis, OB-DeepLabv3+ and OB-UNet were trained by separately utilizing the training samples with different resolutions to attain the prediction results. Figure 17b–f display the relationship curves between the spatial resolution and the segmentation accuracy.
It can be seen that the IoU and PA obtained by both the two networks gradually increase with the growing resolution. By taking the results of OB-UNet on the YSH dataset as an example, the IoU of non-collapsed buildings, collapsed buildings and the others after down-sampling at the resolution scale of 0.4 separately decreases by 14.44%, 14.42% and 12.55% compared to the original image. The PA reduces by 10.4%. Moreover, according to the results of OB-DeepLabv3+ on the HTI dataset, the IoU of non-collapsed buildings, collapsed buildings and the others after down-sampling at the resolution scale of 0.4 separately decreases by 36.89%, 36.09% and 28.96% compared with the original image. It shows that as the spatial resolution of images decreases, IoU of collapsed buildings reduces most greatly, followed by non-collapsed buildings. This implies that changes in the resolution remarkably affect the detection results of indistinguishable earthquake-damaged buildings. Therefore, more abundant details contribute to improving the detection accuracy of earthquake-damaged buildings. The higher the resolution in the dataset is, the more abundant the context information that can be provided and the better the training effect of the networks.

6. Conclusions

Great achievements have been realized in semantic segmentation in the field of detecting buildings in high-resolution remote sensing images under common city scenes. Nevertheless, it is still challenging to extract complete building profiles and accurately localize building boundaries during the detection of earthquake-damaged buildings under post-earthquake complex scenes. Hence, a method for semantic segmentation in post-earthquake remote sensing images based on OCR and BE loss was proposed. The augmented feature representation is attained by embedding the OCR module into the high-level feature extraction; additionally, a novel BE loss was designed to drive the networks to pay more attention to the boundary pixels. Finally, OB-DeepLabv3+ and OB-UNet were established based on the two strategies. The experiments carried out according to the YSH and HTI datasets show that the two designed networks present the PA above 87% and 93%, respectively. Additionally, relative to their own base networks, the PA of OB-DeepLabv3+ and OB-UNet increases by 1–2% and the IoU of non-collapsed and collapsed buildings grows by 3–6%. Compared with the MobileNetV2+CA and UNet 3+, PA obtained by using OB-DeepLabv3+ increases separately by 3% and 0.5% at most, while that of OB-UNet shows 4% and 1% increases at most. In addition, we expect that the proposed method will have good usability and effectiveness in other object detection applications which need to deal with the incomplete boundary extraction and inaccurate boundary prediction in VHR remote sensing images. Hence, assessing the suitability of using the proposed method for other applications will be one of our research contents in the future.

Author Contributions

Conceptualization, C.W.; methodology, C.W. and X.Q.; software, X.Q. and W.H.; validation, H.H., X.Q. and S.W.; formal analysis, X.Q. and Y.Z.; investigation, X.C. and S.W.; resources, C.W.; writing—Original draft preparation, X.Q.; writing—Review and editing, C.W.; visualization, C.W. and X.Q.; supervision, C.W., H.H., Y.Z. and X.C.; project administration, C.W. All authors have read and agreed to the published version of the manuscript.

Funding

This work was supported in part by the 2020 Opening fund for Hubei Key Laboratory of Intelligent Vision-Based Monitoring for Hydroelectric Engineering under Grant 2020SDSJ05, the Construction fund for Hubei Key Laboratory of Intelligent Vision-Based Monitoring for Hydroelectric Engineering under Grant 2019ZYYD007, the Six Talent-peak Project in Jiangsu Province under Grant 2019XYDXX135 and the National Key Research and Development Program of China under Grant 2018YFC1505204.

Institutional Review Board Statement

Not applicable.

Informed Consent Statement

Not applicable.

Data Availability Statement

The data presented in this study are available on request from the first author.

Conflicts of Interest

All authors have reviewed the manuscript and approved submission to this journal. The authors declare that there is no conflicts of interest regarding the publication of this article.

Abbreviations

The following abbreviations are used in this manuscript:
FCNFully Convolutional Network
VHRVery High-resolution
OCRObject Contextual Representations
BEBoundary Enhanced
CNNConvolutional Neural Network
PPMPyramid Pooling Module
ASPPAtrous Spatial Pyramid Pooling
AFPAdaptive Feature Pooling
CECross Entropy
BCIBoundary Confidence Index
PAPixel Accuracy
IoUIntersection over Union
TPTrue Positive
TNTrue Negative
FPFalse Positive
FNFalse Negative
SARSynthetic Aperture Radar
DR-NetDense Residual Neural Network
LDALight-weight Dual Attention
FEFPFeature Enhancement Feature Pyramid
GCNGraph Convolutional Neural

References

  1. Li, J.; Zhao, S.; Jin, H.; Li, Y.; Guo, Y. A method of combined texture features and morphology for building seismic damage information extraction based on GF remote sensing images. Acta Seismol. Sin. 2019, 5, 658–670. [Google Scholar]
  2. Jiang, X.; He, Y.; Li, G.; Liu, Y.; Zhang, X.-P. Building Damage Detection via Superpixel-Based Belief Fusion of Space-Borne SAR and Optical Images. IEEE Sens. J. 2019, 20, 2008–2022. [Google Scholar] [CrossRef]
  3. Ji, S.; Wei, S.; Meng, L. Fully Convolutional Networks for Multisource Building Extraction from an Open Aerial and Satellite Imagery Data Set. IEEE Trans. Geosci. Remote. Sens. 2019, 57, 574–586. [Google Scholar] [CrossRef]
  4. Wang, C.; Qiu, X.; Liu, H.; Li, D.; Zhao, K.; Wang, L. Damaged buildings recognition of post-earthquake high-resolution remote sensing images based on feature space and decision tree optimization. Comput. Sci. Inf. Syst. 2020, 1, 619–646. [Google Scholar] [CrossRef]
  5. Janalipour, M.; Mohammadzadeh, A. A novel and automatic framework for producing building damage map using post-event LiDAR data. Int. J. Disaster Risk Reduct. 2019, 39, 101238. [Google Scholar] [CrossRef]
  6. Carvalho, J.; Fonseca, J.; Mora, A. Terrain Classification Using Static and Dynamic Texture Features by UAV Downwash Effect. J. Autom. Mob. Robot. Intell. Syst. 2019, 13, 84–93. [Google Scholar] [CrossRef]
  7. Matos-Carvalho, J.; Fonseca, J.; Mora, A. UAV downwash dynamic texture features for terrain classification on autonomous navigation. In Proceedings of the 2018 Federated Conference on Computer Science and Information Systems, Poznan, Poland, 9–12 September 2018; pp. 1079–1083. [Google Scholar]
  8. Buslaev, A.; Seferbekov, S.; Iglovikov, V.; Shvets, A. Fully Convolutional Network for Automatic Road Extraction from Satellite Imagery. In Proceedings of the 2018 IEEE/CVF Conference on Computer Vision and Pattern Recognition Workshops (CVPRW), Salt Lake City, UT, USA, 18–22 June 2018; pp. 197–200. [Google Scholar]
  9. Diakogiannis, F.I.; Waldner, F.; Caccetta, P.; Wu, C. ResUNet-a: A deep learning framework for semantic segmentation of remotely sensed data. ISPRS J. Photogramm. Remote Sens. 2020, 162, 94–114. [Google Scholar] [CrossRef] [Green Version]
  10. Chen, M.; Wu, J.; Liu, L.; Zhao, W.; Tian, F.; Shen, Q.; Zhao, B.; Du, R. DR-Net: An Improved Network for Building Extraction from High Resolution Remote Sensing Image. Remote. Sens. 2021, 13, 294. [Google Scholar] [CrossRef]
  11. Zhao, H.; Shi, J.; Qi, X.; Jia, J. Pyramid Scene Parsing Network. IEEE Comput. Soc. 2016, 1, 6230–6239. [Google Scholar]
  12. Yang, M.; Yu, K.; Chi, Z.; Li, Z. Dense ASPP for Semantic Segmentation in Street Scenes. In Proceedings of the 2018 IEEE/CVF Conference on Computer Vision and Pattern Recognition, Salt Lake City, UT, USA, 18–23 June 2018; pp. 3684–3692. [Google Scholar]
  13. Huang, R.; Xu, Y.; Hong, D.; Yao, W.; Ghamisi, P.; Stilla, U. Deep point embedding for urban classification using ALS point clouds: A new perspective from local to global. ISPRS J. Photogramm. Remote. Sens. 2020, 163, 62–81. [Google Scholar] [CrossRef]
  14. Ma, H.; Liu, Y.; Ren, Y.; Wang, D.; Yu, L.; Yu, J. Improved CNN Classification Method for Groups of Buildings Damaged by Earthquake, Based on High Resolution Remote Sensing Images. Remote Sens. 2020, 12, 260. [Google Scholar] [CrossRef] [Green Version]
  15. Nong, Z.; Su, X.; Liu, Y.; Zhan, Z.; Yuan, Q. Boundary-Aware Dual-Stream Network for VHR Remote Sensing Images Semantic Segmentation. IEEE J. Sel. Top. Appl. Earth Obs. Remote Sens. 2021, 14, 5260–5268. [Google Scholar] [CrossRef]
  16. Berger, L.; Hyde, E.; Jorge Cardoso, M.; Ourselin, S. An Adaptive Sampling Scheme to Efficiently Train Fully Convolutional Networks for Semantic Segmentation; Springer: Cham, Switzerland, 2017. [Google Scholar]
  17. Ryan, S.; Corizzo, R.; Kiringa, I.; Japkowicz, N. Pattern and Anomaly Localization in Complex and Dynamic Data. In Proceedings of the 2019 18th IEEE International Conference On Machine Learning And Applications (ICMLA), Boca Raton, FL, USA, 16–19 December 2019; pp. 1756–1763. [Google Scholar]
  18. Long, J.; Shelhamer, E.; Darrell, T. Fully Convolutional Networks for Semantic Segmentation. IEEE Trans. Pattern Anal. Mach. Intell. 2015, 39, 640–651. [Google Scholar]
  19. Badrinarayanan, V.; Kendall, A.; Cipolla, R. SegNet: A Deep Convolutional Encoder-Decoder Architecture for Image Segmentation. IEEE Trans. Pattern Anal. Mach. Intell. 2017, 39, 2481–2495. [Google Scholar] [CrossRef]
  20. Chen, L.; Papandreou, G.; Kokkinos, I.; Murphy, K.; Yuille, A.L. Semantic Image Segmentation with Deep Convolutional Nets and Fully Connected CRFs. Comput. Sci. 2014, 40, 357–361. [Google Scholar]
  21. Chen, L.; Papandreou, G.; Kokkinos, I.; Murphy, K.; Yuille, A.L. DeepLab: Semantic Image Segmentation with Deep Convolutional Nets, Atrous Convolution, and Fully Connected CRFs. IEEE Trans. Pattern Anal. Mach. Intell. 2018, 40, 834–848. [Google Scholar] [CrossRef]
  22. Chen, L.C.; Papandreou, G.; Schroff, F.; Adam, H. Rethinking atrous convolution for semantic image segmentation. arXiv 2017, arXiv:1706.05587. [Google Scholar]
  23. He, J.; Deng, Z.; Qiao, Y. Dynamic Multi-Scale Filters for Semantic Segmentation. In Proceedings of the 2019 IEEE/CVF International Conference on Computer Vision (ICCV), Seoul, Korea, 27 October–2 November 2019; pp. 3561–3571. [Google Scholar]
  24. Zhang, X.; Wang, B.; Yuan, D.; Xu, Z.; Xu, G. FPAENet: Pneumonia Detection Network Based on Feature Pyramid Attention Enhancement. arXiv 2020, arXiv:2011.08706. [Google Scholar]
  25. Fu, J.; Liu, J.; Tian, H.; Li, Y.; Bao, Y.; Fang, Z.; Lu, H. Dual attention network for scene segmentation. In Proceedings of the IEEE Conference on Computer Vision and Pattern Recognition, Long Beach, CA, USA, 16–20 June 2019; pp. 3146–3154. [Google Scholar]
  26. Li, H.; Xiong, P.; An, J.; Wang, L. Pyramid Attention Network for Semantic Segmentation. arXiv 2018, arXiv:1805.10180v3. [Google Scholar]
  27. Xu, Z.; Zhang, W.; Zhang, T.; Li, J. HRCNet: High-Resolution Context Extraction Network for Semantic Segmentation of Remote Sensing Images. Remote Sens. 2020, 13, 71. [Google Scholar] [CrossRef]
  28. Lin, L.; Jian, L.; Min, W.; Zhu, H. A Multiple-Feature Reuse Network to Extract Buildings from Remote Sensing Imagery. Remote Sens. 2018, 10, 1350. [Google Scholar]
  29. Yan, Z.; Weihong, L.; Weigou, G.; Wang, Z.; Sun, J. An Improved Boundary-Aware Perceptual Loss for Building Extraction from VHR Images. Remote Sens. 2020, 12, 1195. [Google Scholar]
  30. Cao, Y.; Xu, J.; Lin, S.; Wei, F.; Hu, H. GCNet: Non-Local Networks Meet Squeeze-Excitation Networks and Beyond. arXiv 2020, arXiv:1904.11492. [Google Scholar]
  31. Tong, W.; Chen, W.; Han, W.; Li, X.; Wang, L. Channel-Attention-Based DenseNet Network for Remote Sensing Image Scene Classification. IEEE J. Sel. Top. Appl. Earth Obs. Remote Sens. 2020, 13, 4121–4132. [Google Scholar] [CrossRef]
  32. Zhang, F.; Chen, Y.; Li, Z.; Hong, Z.; Liu, J.; Ma, F.; Han, J.; Ding, E. ACFNet: Attentional Class Feature Network for Semantic Segmentation. In Proceedings of the 2019 IEEE/CVF International Conference on Computer Vision (ICCV), Seoul, Korea, 27 October–2 November 2019; pp. 6797–6806. [Google Scholar]
  33. Ding, L.; Zhang, J.; Bruzzone, L. Semantic Segmentation of Large-Size VHR Remote Sensing Images Using a Two-Stage Multiscale Training Architecture. IEEE Trans. Geosci. Remote Sens. 2020, 58, 5367–5376. [Google Scholar] [CrossRef]
  34. Si, Y.; Gong, D.; Guo, Y.; Zhu, X.; Huang, Q.; Evans, J.; He, S.; Sun, Y. An Advanced Spectral–Spatial Classification Framework for Hyperspectral Imagery Based on DeepLab v3+. Appl. Sci. 2021, 11, 5703. [Google Scholar] [CrossRef]
  35. Krhenbühl, P.; Koltun, V. Efficient Inference in Fully Connected CRFs with Gaussian Edge Potentials. arXiv 2012, arXiv:1210.5644. [Google Scholar]
  36. Yuan, Y.; Xie, J.; Chen, X.; Wang, J. SegFix: Model-Agnostic Boundary Refinement for Segmentation. In Computer Vision—ECCV 2020, Proceedings of the European Conference on Computer Vision, Glasgow, UK, 23–28 August 2020; Vedaldi, A., Bischof, H., Eds.; Springer: Cham, Switzerland, 2020; Volume 12357, pp. 489–506. [Google Scholar]
  37. Ouyang, S.; Li, Y. Combining Deep Semantic Segmentation Network and Graph Convolutional Neural Network for Semantic Segmentation of Remote Sensing Imagery. Remote Sens. 2020, 13, 119. [Google Scholar] [CrossRef]
  38. Cheng, H.K.; Chung, J.; Tai, Y.-W.; Tang, C.-K. CascadePSP: Toward Class-Agnostic and Very High-Resolution Segmentation via Global and Local Refinement. arXiv 2020, arXiv:2005.02551v1. [Google Scholar]
  39. Touzani, S.; Granderson, J. Open Data and Deep Semantic Segmentation for Automated Extraction of Building Footprints. Remote Sens. 2021, 13, 2578. [Google Scholar] [CrossRef]
  40. Yang, N.; Tang, H. Semantic Segmentation of Satellite Images: A Deep Learning Approach Integrated with Geospatial Hash Codes. Remote Sens. 2021, 13, 2723. [Google Scholar] [CrossRef]
  41. McGlinchy, J.; Muller, B.; Johnson, B.; Joseph, M.; Diaz, J. Fully Convolutional Neural Network for Impervious Surface Segmentation in Mixed Urban Environment. Photogramm. Eng. Remote. Sens. 2021, 87, 117–123. [Google Scholar] [CrossRef]
  42. Yuan, Y.; Chen, X.; Wang, J. Object-Contextual Representations for Semantic Segmentation. In Proceedings of the European Conference on Computer Vision (ECCV), Glasgow, UK, 23–28 August 2020; pp. 173–190. [Google Scholar]
  43. Lin, T.; Goyal, P.; Girshick, R.; He, K.; Dollár, P. Focal Loss for Dense Object Detection. IEEE Trans. Pattern Anal. Mach. Intell. 2017, 99, 2999–3007. [Google Scholar]
  44. Qu, Z.; Mei, J.; Liu, L.; Zhou, D.-Y. Crack Detection of Concrete Pavement With Cross-Entropy Loss Function and Improved VGG16 Network Model. IEEE Access 2020, 8, 54564–54573. [Google Scholar] [CrossRef]
  45. Grunthal, G. European Macroseismic Scale (EMS-98); European Seismological Commission: Luxembourg, 1998. [Google Scholar]
  46. Hou, Q.; Zhou, D.; Feng, J. Coordinate Attention for Efficient Mobile Network Design. arXiv 2021, arXiv:2103.02907. [Google Scholar]
  47. Huang, H.; Lin, L.; Tong, R.; Hu, H.; Zhang, Q.; Iwamoto, Y.; Han, X.; Chen, Y.-W.; Wu, J. UNet 3+: A Full-Scale Connected UNet for Medical Image Segmentation. arXiv 2020, arXiv:2004.08790. [Google Scholar]
  48. Jin, Y.; Xu, W.; Zhang, C.; Luo, X.; Jia, H. Boundary-Aware Refined Network for Automatic Building Extraction in Very High-Resolution Urban Aerial Images. Remote. Sens. 2021, 13, 692. [Google Scholar] [CrossRef]
Figure 1. Examples of the detection results of earthquake-damaged buildings by using different networks, (a) original images; (b) ground truth map; (c) predicted results by DeepLabv3+; (d) predicted results by UNet; green, purple, white, blue and red in (bd) separately represent non-collapsed buildings, collapsed buildings, others, false negative and false positive.
Remotesensing 13 03119 g001
Figure 2. Overall structure of the proposed OB-DeepLabv3+.
Remotesensing 13 03119 g002
Figure 3. Overall structure of the proposed OB-UNet.
Remotesensing 13 03119 g003
Figure 4. The structure of the OCR module.
Remotesensing 13 03119 g004
Figure 5. Final neighborhoods with different sizes.
Remotesensing 13 03119 g005
Figure 6. Schematic diagram of the proposed BE loss.
Remotesensing 13 03119 g006
Figure 7. The post-earthquake VHR remote sensing images in the research regions. (a) YSH dataset. (b) HTI dataset.
Remotesensing 13 03119 g007
Figure 8. The original image and its ground truth map; red, blue and black represent the non-collapsed buildings, collapsed buildings and others. (a) Original image. (b) Ground truth map.
Remotesensing 13 03119 g008
Figure 9. Detection results of the YSH dataset by different networks: (a) original image; (b) ground truth map; (c) DeepLabv3+; (d) UNet; (e) MobileNetV2+CA; (f) UNet 3+; (g) OB-DeepLabv3+; (h) OB-UNet; red, blue and black in (bh) separately represent non-collapsed buildings, collapsed buildings and the others.
Remotesensing 13 03119 g009
Figure 10. Partially enlarged images of the detection results of the YSH dataset by different networks: (a) original image; (b) ground truth map; (c) DeepLabv3+; (d) UNet; (e) MobileNetV2+CA; (f) UNet 3+; (g) OB-DeepLabv3+; (h) OB-UNet; red, blue and black in (bh) represent the non-collapsed buildings, collapsed buildings and the others.
Remotesensing 13 03119 g010
Figure 11. Detection results of the HTI dataset by different networks: (a) original image; (b) ground truth map; (c) DeepLabv3+; (d) UNet; (e) MobileNetV2+CA; (f) UNet 3+; (g) OB-DeepLabv3+; (h) OB-UNet; red, blue and black in (bh) separately represent non-collapsed buildings, collapsed buildings and the others.
Remotesensing 13 03119 g011
Figure 12. Partially enlarged images of the detection results of the HTI dataset by different networks: (a) original image; (b) ground truth map; (c) DeepLabv3+; (d) UNet; (e) MobileNetV2+CA; (f) UNet 3+; (g) OB-DeepLabv3+; (h) OB-UNet; red, blue and black in (bh) represent the non-collapsed buildings, collapsed buildings and the others.
Remotesensing 13 03119 g012
Figure 13. Statistical histogram of the proportion of different classes of pixels. (a) YSH dataset. (b) HTI dataset.
Remotesensing 13 03119 g013
Figure 14. Instance of trimaps with different widths. (a,b) are two samples of the YSH dataset; (c,d) are two samples of the HTI dataset.
Remotesensing 13 03119 g014
Figure 15. Results of the quantitative evaluation on the boundary segmentation effect based on trimaps. (a) YSH dataset. (b) HTI dataset.
Remotesensing 13 03119 g015
Figure 16. The influence of the setting of γ on the IoU corresponding to collapsed and non-collapsed buildings. (a) OB-DeepLabv3+ on the YSH dataset. (b) OB-UNet on the YSH dataset. (c) OB-DeepLabv3+ on the HTI dataset. (d) OB-UNet on the HTI dataset.
Remotesensing 13 03119 g016
Figure 17. The influence of the spatial resolution of images on the segmentation accuracy: (a) down-sampling results of original images at the resolution scales of 0.8, 0.6 and 0.4 based on the YSH dataset; (b) IoU and PA curves by OB-DeepLabv3+ for images with different resolutions based on the YSH dataset; (c) IoU and PA curves by OB-UNet for images with different resolutions based on the YSH dataset; (d) down-sampling results of original images at the resolution scales of 0.8, 0.6 and 0.4 based on the HTI dataset; (e) IoU and PA curves by OB-DeepLabv3+ for images with different resolutions based on the HTI dataset; (f) IoU and PA curves by OB-UNet for images with different resolutions based on the HTI dataset.
Remotesensing 13 03119 g017
Table 1. Results of quantitative evaluation. The entries in bold denote the best on the corresponding dataset.
DatasetsMethodsObject Class IoU (%)mIoU (%)PA (%)mRecall (%)mF1 (%)
Non-CollapsedCollapsedOthers
YSHDeepLabv3+60.8734.4882.8159.3985.2967.6772.67
UNet66.9845.1283.4265.3186.6367.3371.33
MobileNetV2+CA [46]61.6542.3380.6061.5383.7776.6674.67
UNet 3+ [47]66.8142.5082.3863.9085.2778.3376.67
OB-DeepLabv3+ (ours)64.7440.7383.7763.0886.3772.6776.00
OB-UNet (ours)69.5445.5385.2466.7787.7277.3379.00
HTIDeepLabv3+57.2939.4588.9161.8890.0375.0074.67
UNet67.4040.3991.5266.4492.5273.3378.33
MobileNetV2+CA [46]68.9639.6691.2666.6392.3675.6778.00
UNet 3+ [47]71.3239.6492.1767.7193.1176.0078.67
OB-DeepLabv3+ (ours)70.5642.3991.7668.2492.8078.0079.67
OB-UNet (ours)73.8046.4992.5670.9593.5879.6781.33
Table 2. Analysis of the embedment effect of the OCR module. The entries in bold denote the best on the corresponding dataset. √ and—Separately represent that a module is used and not used.
DatasetsNetworksOCR BE LossObject Class IoU (%)mIoU (%)PA (%)
Non-CollapsedCollapsedOthers
YSHDeepLabv3+60.9838.0782.9560.6785.51
DeepLabv3+64.7440.7383.7763.0886.37
UNet69.7339.6385.1164.8387.56
UNet69.5445.5385.2466.7787.72
HTIDeepLabv3+67.6140.8291.2266.5592.28
DeepLabv3+70.5642.3991.7668.2492.80
UNet70.5243.0491.9868.5193.01
UNet73.8046.4992.5670.9593.58
Table 3. Comparison and analysis of the effects of BE loss and other loss functions. The entries in bold denote the best on the corresponding dataset.
DatasetsNetworksLossObject Class IoU (%)mIoU (%)PA (%)
Non-CollapsedCollapsedOthers
YSHDeepLabv3+CE loss63.4118.9882.4654.9584.89
DeepLabv3+Focal loss60.8734.4882.8159.3985.29
DeepLabv3+BE loss60.9838.0782.9560.6785.51
UNetCE loss66.6327.3983.8459.1585.82
UNetFocal loss66.9845.1283.4265.1786.63
UNetBE loss69.7339.6385.1164.8387.56
HTIDeepLabv3+CE loss58.2232.7089.0659.9990.21
DeepLabv3+Focal loss57.2939.4588.9161.8890.03
DeepLabv3+BE loss67.6140.8291.2266.5592.28
UNetCE loss67.0339.8591.1966.0292.29
UNetFocal loss67.4040.3991.5266.4492.52
UNetBE loss70.5243.0491.9868.5193.01
Table 4. The influence of the setting of γ on PA. The entries in bold denote the best on the corresponding dataset.
DatasetsMethods γ 0.511.522.533.544.55
YSHOB-DeepLabv3+PA85.0985.5785.9086.3786.0386.0485.8585.8385.5885.81
OB-UNetPA86.9087.1087.3987.7287.3887.1387.3287.4187.7387.91
HTIOB-DeepLabv3+PA92.1092.3792.4292.8092.4092.2892.2092.4792.6492.62
OB-UNetPA93.3193.4893.5493.5893.3193.4393.4593.5293.4693.55
Publisher’s Note: MDPI stays neutral with regard to jurisdictional claims in published maps and institutional affiliations.

