Remote Sens. 2021, 13(16), 3103; https://doi.org/10.3390/rs13163103 - 6 Aug 2021
Cited by 20 | Viewed by 4721
Abstract
In recent years, there has been a growing demand for 3D reconstructions of tunnel pits, underground pipe networks, and building interiors. For such scenarios, weak textures, repeated textures, or even no textures are common. To reconstruct these scenes, we propose covering the lighting
[...] Read more.
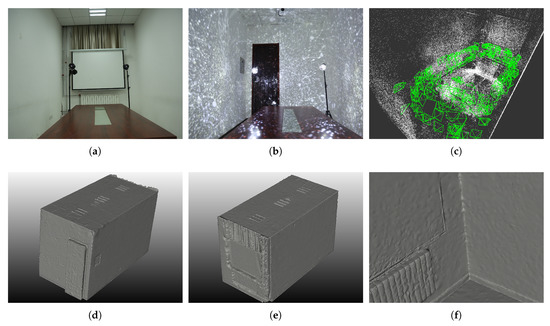
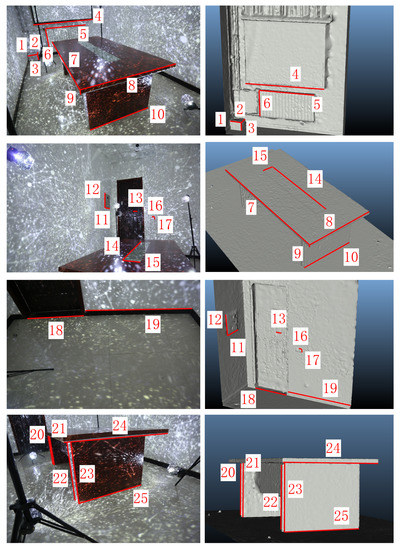
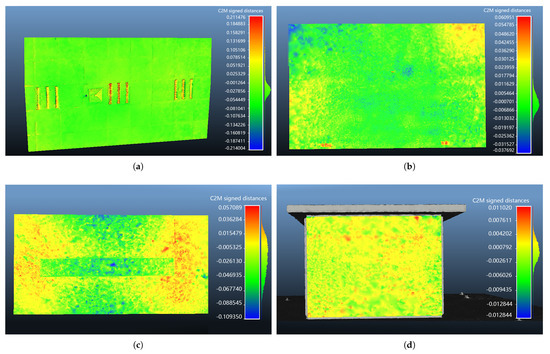
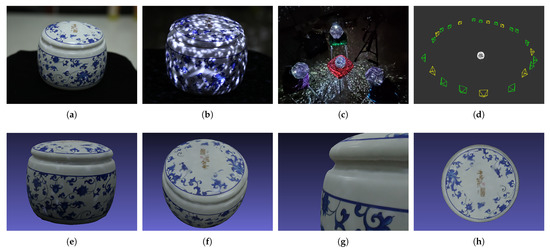
In recent years, there has been a growing demand for 3D reconstructions of tunnel pits, underground pipe networks, and building interiors. For such scenarios, weak textures, repeated textures, or even no textures are common. To reconstruct these scenes, we propose covering the lighting sources with films of spark patterns to “add” textures to the scenes. We use a calibrated camera to take pictures from multiple views and then utilize structure from motion (SFM) and multi-view stereo (MVS) algorithms to carry out a high-precision 3D reconstruction. To improve the effectiveness of our reconstruction, we combine deep learning algorithms with traditional methods to extract and match feature points. Our experiments have verified the feasibility and efficiency of the proposed method.
Full article
(This article belongs to the Special Issue Image Processing and Analysis: Trends in Registration, Data Fusion, 3D Reconstruction, and Change Detection II)
►
Show Figures

Figure 1


