Article

Snow Lapse Rate Changes in the Atlas Mountain in Morocco Based on MODIS Time Series during the Period 2000–2016

by
Ahmed Marchane
1,*,
Abdelghani Boudhar
1,2,
Mohammed Wassim Baba
1,
Lahoucine Hanich
1,3 and
Abdelghani Chehbouni
1,4
1
Center for Remote Sensing Application (CRSA), Mohammed VI Polytechnic University (UM6P), Ben Guerir 43150, Morocco
2
Water Resources Management and Valorization and Remote Sensing Team (GEVARET), Faculty of Sciences and Technics, Sultan Moulay Slimane University, Beni Mellal 23000, Morocco
3
Laboratoire de Géoressources, Géoenvironnement et Génie Civil-Département des Sciences de la Terre, Faculté des Sciences et Techniques Guéliz, Université Cadi Ayyad, Av. A. Khattabi, BP 549, Marrakech 40000, Morocco
4
CESBIO, Université de Toulouse, UMR (CNES-CNRS-INRAE-IRD, U. de Toulouse), 31400 Toulouse, France
*
Author to whom correspondence should be addressed.
Remote Sens. 2021, 13(17), 3370; https://doi.org/10.3390/rs13173370
Submission received: 19 July 2021 / Revised: 13 August 2021 / Accepted: 18 August 2021 / Published: 25 August 2021
(This article belongs to the Special Issue The Cryosphere Observations Based on Using Remote Sensing Techniques)

Abstract

:
The spatio-temporal distribution of snow cover metrics in a mountainous area is mainly related to the climatic conditions as well as to the prevailing morphological conditions. The present study aimed to investigate the altitudinal sensitivity of snow cover metrics using the MODIS Terra snow cover product (MOD10A1 v5). Annual snow metrics, including start of snow season (SOSS), end of snow season (EOSS), and snow cover duration (SCD) were extracted from snow-covered area (SCA) maps, which had been pre-processed using a cloud removal algorithm; the maps were of the Atlas Mountains, taken from the period of 2001–2016. In addition, a linear regression was applied to derive an annual altitudinal gradient for each snow metric in relation to various spatial scales in order to analyze the interdependency between snow and topography, and especially to assess the potential temporal trend of the snow gradient. Results indicated that elevation was the principal regulator of snow presence where snow was mostly accumulated above 2500 m. The annual altitudinal gradients for EOSS and SCD showed a marked negative trend beginning in 2007. However, the SOSS altitudinal gradient was marked by a positive trend. The mean SCD gradient for the entire Atlas Mountains decreased from 6 days/100 m to 3 days/100 m. This is a new and important finding since it may indicate the impact of climate change on the dynamics of snow metrics and provides guidance for water managers to better manage the snowmelt water with different terrain features.

Graphical Abstract

1. Introduction

Meltwater issued from a snow-covered area is a significant component of the water balance in many of the world’s catchments [1]. Snow accumulation during the cold season presents a major source of fresh water during the melt period, particularly in a mountainous region. Consequently, it also provides water for irrigation, aquifer recharges, and contributes to fill dams, which are important for agriculture and also hydropower generation [2,3,4].
In Morocco, a place dominated by an arid and semi-arid climate, the mountainous regions (e.g., High and Middle Atlas) receive a significant amount of precipitation as snowfall during winter. As a result, the runoff regime in the high-elevation catchments is highly dependent on snow cover, and snowmelt contribution is roughly estimated to be between 15% and 50% of the total annual discharge in the Tensift river sub-basins [5].
Snow cover in the Atlas range is irregularly distributed with respect to both time and space, and it is characterized by a strong inter-annual dynamic [6]. Generally, snowpack can completely melt within a few days after its deposition [7].
Understanding snowpack dynamics and its seasonality through snow metrics mapping could constitute the key indicators of the effects of climate change. They have been the subject of numerous studies assessing the impact of climate change on snow cover evolution, which point to a possible change in the timing and duration of the snow season [8,9].
Despite its importance, an understanding of snowpack seasonality in the Atlas Mountains remains limited due to the absence of comprehensive in situ snow measurements [10]. To our knowledge, except for the snow measurements provided by the joint international laboratory TREMA (a French acronym for ‘Remote Sensing and Water Resources in the Semi-arid Mediterranean’; http://trema.ucam.ac.ma, accessed on 1 July 2021) [3], SUDMED [2], and IMPETUS [11] programs, long-term records of snow-related measurements are scarce in the Atlas. To fill this void of in situ observations, optical remote sensing could be an alternative source for the extraction of snow phenology information. At present, optical sensors offer different products, from moderate to high resolution (from 5 m to 500 m, depending on the sensor) and an acceptable revisit time (from 1 day to 16 days). This range of data allows one to monitor the high spatio-temporal variability of the snowpack [12]. This time frequency enables the acquisition of the main snow metrics throughout each season.
One of the most important sensors used in the analysis of snow cover variability in several regions of the world is the Moderate Resolution Imaging Spectroradiometer (MODIS). The accuracy of this product has been proven in mountainous regions and over very cloudy areas, principally making use of space and temporal techniques to correct the cloud effect [6,13]. The absolute accuracy of the snow cover product (MOD10A1 v5) is generally reported to be ~93%. The performance is lower in forest areas, at the beginning and end of the snow season [1].
Several snow parameters were used to monitor the occurrence and presence of snow based on snow cover extent (SCE) time series, determined from remote sensing data. The SCE dataset was used to calculate the seasonal snow metrics (SCD, SOSS, EOSS, Probability of snow detection, SCE max, date of SCE max, and SCE slope regression). According to Brown and Mote [14], SCD was the most climate-sensitive snow variable, with sensitivity varying with climate regime and elevation.
The heterogeneous distribution of snow cover metrics arises from variations in climatic conditions (temperature and precipitation) [15,16] and topographic characteristics (elevation, aspect, and slope) [17,18,19,20,21]. These changes are due to variations in radiation, energy balances, and different accumulation regimes caused by wind and drift effects [22]. Due to the altitude dependency of temperature, which is crucial for snowpack formation by differentiating between the solid and liquid portions of precipitation, the accumulation of snow is also more frequent in high mountain areas [19]. Thus, physiographical features control snowpack evolution since temperature is a melting factor [15]. In practice, the temperature lapse rate is often assumed to equal the mean environmental lapse rate (MELR) of about −0.65 °C/100 m, depending on regional contexts. This issue of computing the temperature lapse rate was treated by various research in Morocco [10,23,24], which revealed that the mean values are about −0.56 °C/100 m and vary from year to year, and from one season to another.
Trends in snow cover metrics can also be influenced by elevation [25]. In several regions of the world, a decrease in seasonal snow cover with elevation has been observed [26]. But until now, the very few investigations on snow cover variability and its trend in the Atlas Mountains have not reported any significant change [6]. This absence of any long-term trend in snow cover duration in the Atlas Mountain provides a motivation for the investigation of the possible trends on snow metrics gradient (lapse rate).
Previous snow studies were carried out in Morocco and have mainly been focused on: (1) modelling snow processes at a local scale [11,27,28]; (2) modelling snow processes at large scale [23,29]; (3) monitoring snow cover variability at a large scale from remotely sensed data [6,7,30,31]; (4) assessing snow component contribution through hydrological models [5,32]; and (5) linkages between climate and snow-covered area (SCA) derived from remote sensing observations [33]. Despite all these investigations, there has not been any systematic study on the effects of topographic characteristics on snow cover seasonality over the Atlas Mountains.
The aims of this paper are: (1) to assess the inter-annual variations in snow cover parameters (i.e., SOSS, EOSS, and SCD) over the whole Atlas Mountain during the period of 2001–2016; (2) to analyze topographic factors, including elevation, aspect, and slope, in snow cover variability; (3) to estimate the altitudinal gradient using long-term trends of the selected snow metrics.

2. Study Site

This work covers the mountainous region of the northern part of the Moroccan Kingdom, stretching from 2°W to 10°W longitude, and from 30°N to 35°N latitude. In this study, the mountain domain is defined as the area above 1000 m (Figure 1). The reason for this delimitation is to only account for regularly covered snow areas. The study domain covers an area of 121,000 km2, with 54.42% of the elevation range located between 1000 and 1500 m, 44.58% of the elevation band lying between 1500 and 3000 m, and with only 1% of the area located above 3000 m (Table 1). The study area is composed of seven main catchments in Morocco (Moulouya, Oum Er rbii, Sebou, Ziz Rheris, Tensift, Souss, and Draa).
The climate in this region is governed by the complex influence of the Atlantic Ocean to the west, the Mediterranean Sea to the north, and the Sahara Desert to the south. The aspect of the study zone is predominantly northerly (29%), while the other exposures (West, East, and South) vary between 20% and 27% (Table 2).

3. Data and Methods

3.1. MODIS Daily Fractional Snow Product (MOD10A1)

We used data derived from version 5 of MODIS/Terra Snow Cover Daily (MOD10A1) at 500 m resolution [35]. The snow mapping technique used by the MOD10A1 data is based on an algorithm called SNOWMAP, which determines the occurrence of snow using the Normalized Differential Snow Index (NDSI) combined with additional criteria [35,36,37].
The MOD10A1 represents the fraction of snow cover (percentage of snow cover of the observed pixel). This snow cover fraction is calculated as a function of NDSI using the following equation [37]:
FSC = −0.01 + 1.45 NDSI
The FSC dataset was pre-processed using a three-step cloud-correction method and evaluated over the Moroccan mountains by Marchane and others [6]. The post-processed dataset showed a drastic reduction in the number of cloud-covered pixels, from 22.6% (raw data) to 0.8% (post-filtered data), estimated for the period between 2001 and 2013.
The assessment of these adjusted data products by comparing them to the automatic snow depth measurements of 5 stations and to a unique satellite dataset from the formosat-2 sensor at 8 m resolution showed that the accuracy of this product was at 89% [6].
The daily MODIS product has shown good capabilities in the production of timing characteristics (onset, melt-out dates, and snow cover duration) despite the difficult detection conditions in the Moroccan mountains [6].

3.2. Extraction of Snow Cover Metrics

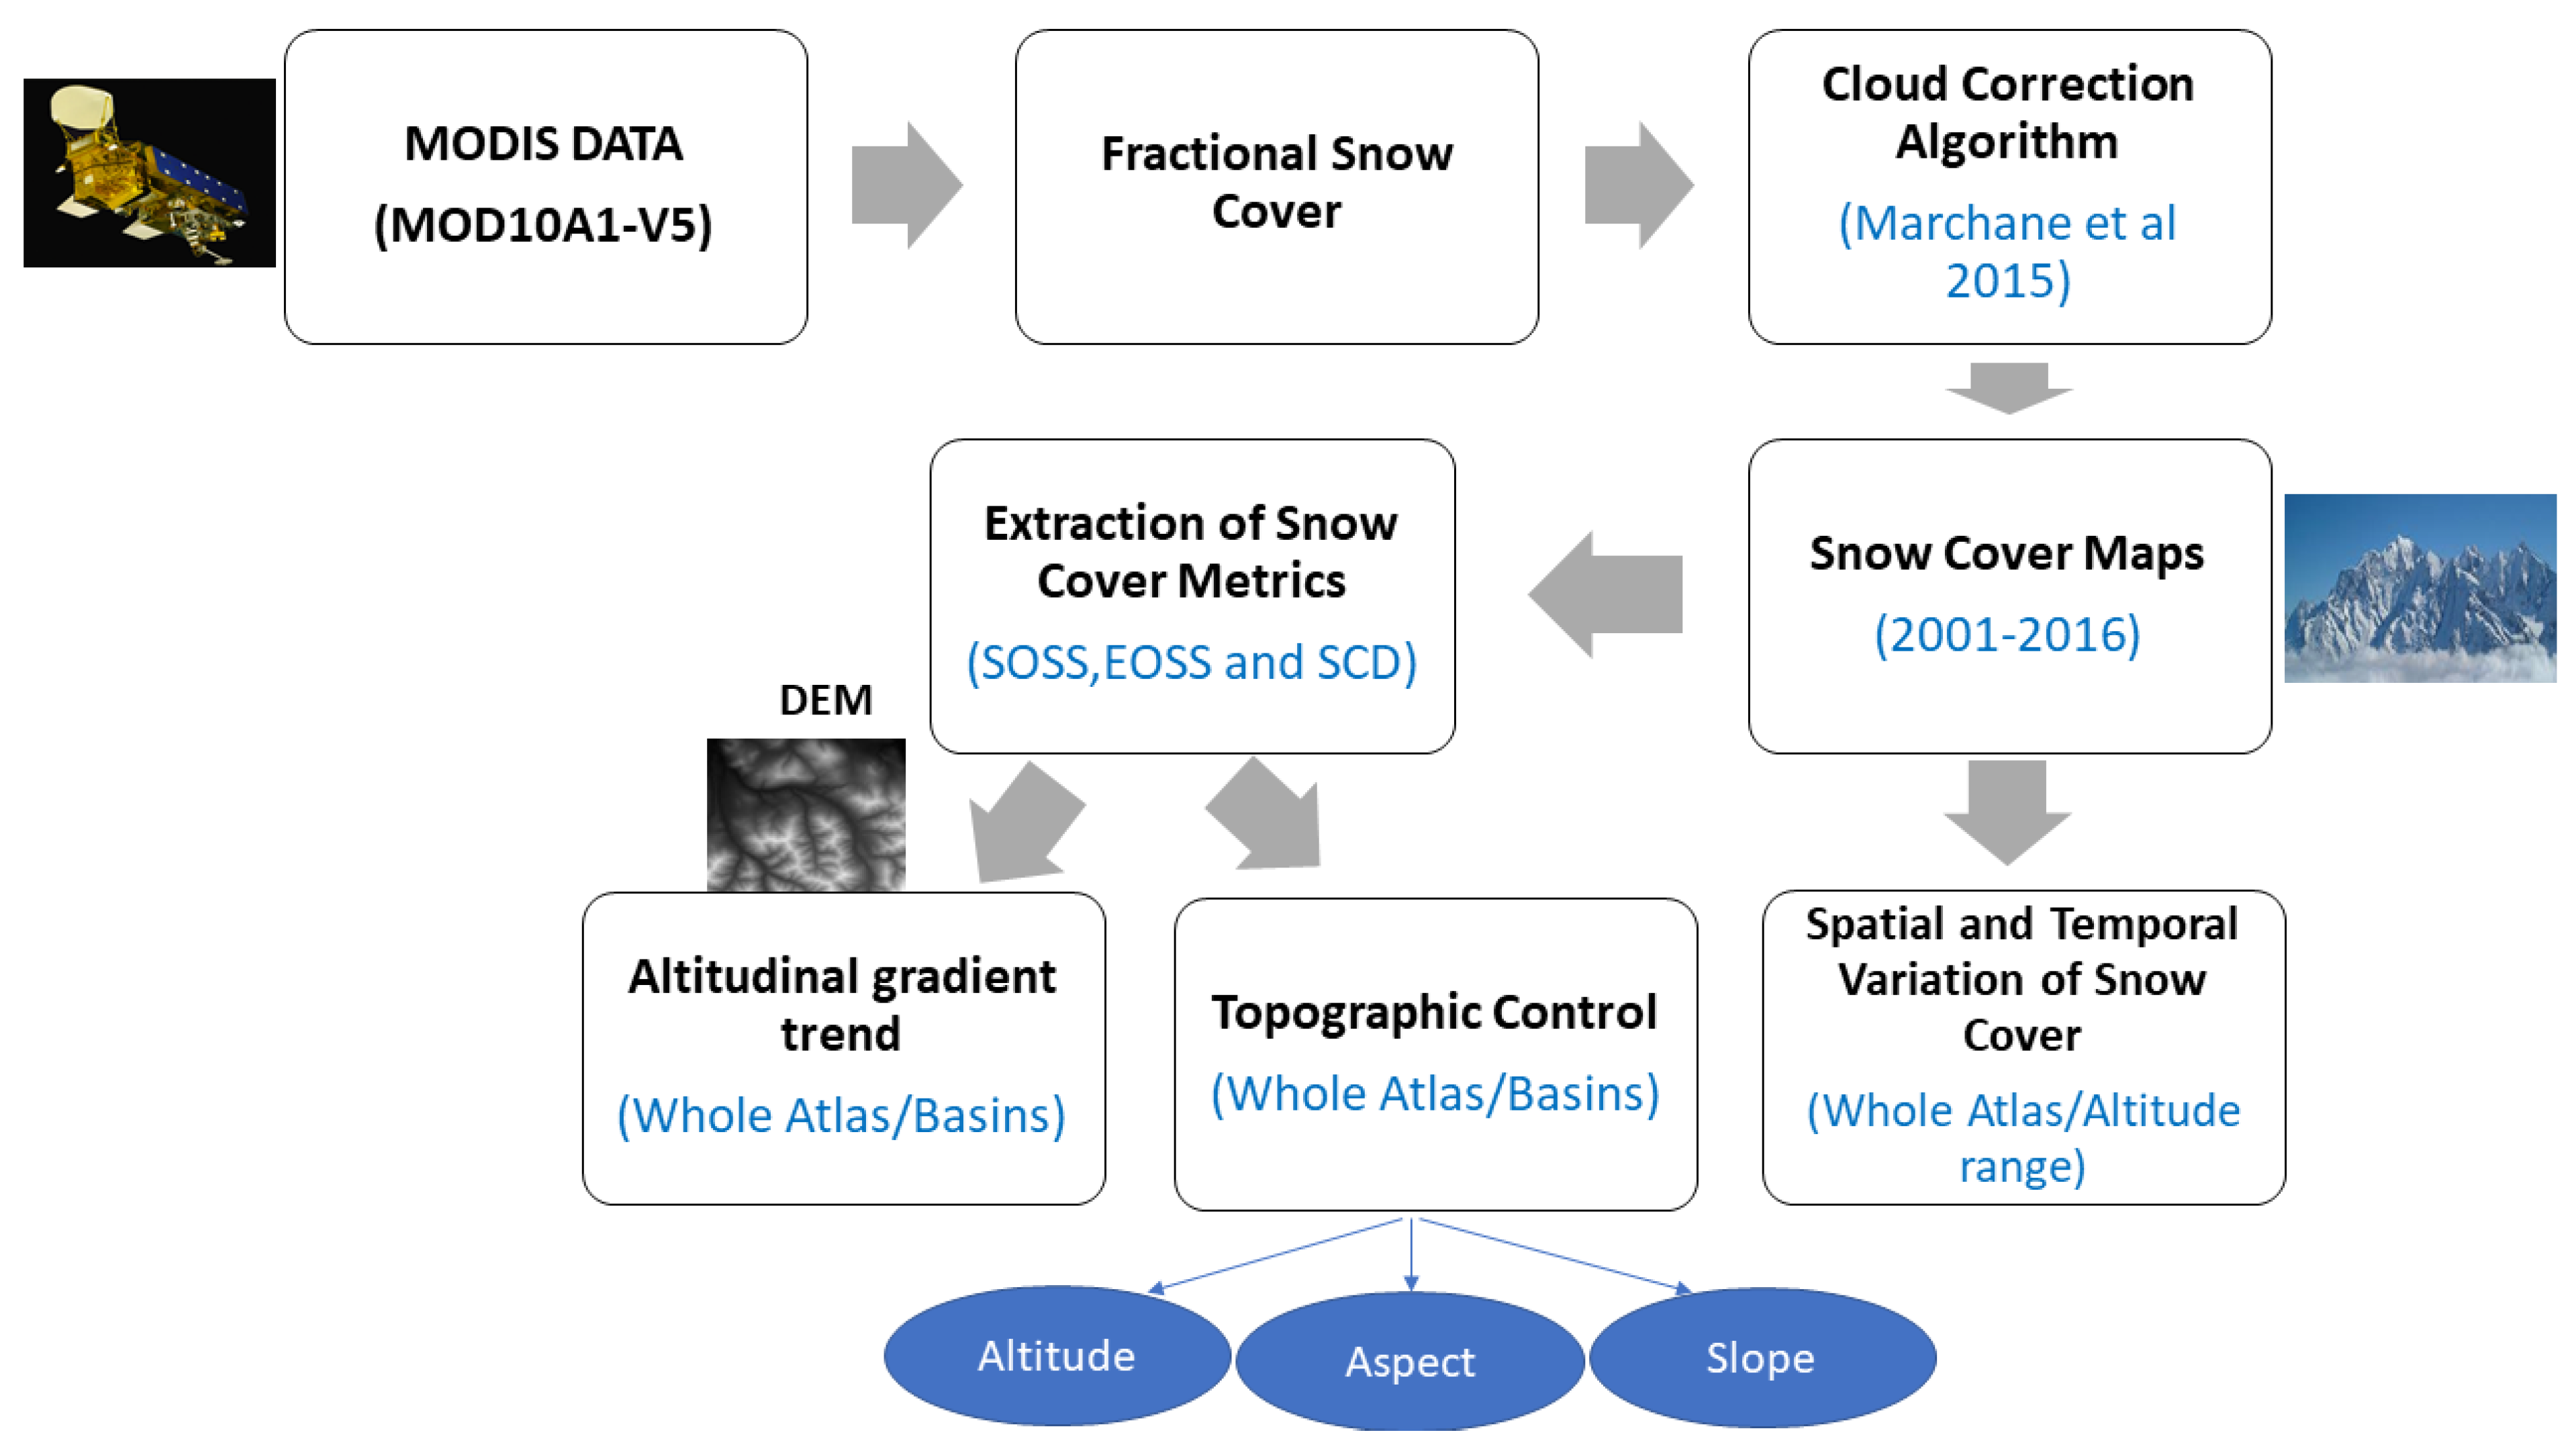
The snow parameters (SOSS, EOSS, SCD) were extracted from the snow cover maps for 16 snow seasons (from September 2001 to June 2016). They served to estimate the possible trends in the snow metrics gradient and to analyze the relationship with topographic variables (Figure 2).
The timing of the snow season can be considered hypsometrically by elevation bands, spatially by pixel, or globally (study area) [38], which gives multiple metrics. The start of snow season (SOSS) was calculated as the date when a pixel exceeded a threshold of fractional snow cover (FSC). The end of snow season (EOSS) was determined when data remained below the threshold for at least 20 days. In this case, the minimum threshold of FSC was set to 50%, consistent with the approach of [26]. The length of the SCD was calculated as the difference in days between the SOSS and the EOSS. A similar approach was adopted to detect timing indicators from the SCA at the study area level, except that the threshold was chosen to be 5% of the maximum snow-covered area. Calculating the snow metrics for each hydrological year from 2001 to 2016 also allowed for the calculation of the coefficient of variation (CV) as follows:
CV = σ/µ
where σ is the standard deviation of metrics and µ is the mean over 16 years. CV is used here as an efficient way to calculate the relative dispersion of data on the mean [28].

3.3. Topographic Effects

The extraction of topographic characteristics was completed using the Digital Elevation Model (DEM), derived from NASA’s Shuttle Radar Topography Mission (SRTM) images. The SRTM data were used for its proven accuracy in complex terrains, as reported by many authors [39,40]. This DEM was resampled at a 500 m spatial resolution to make it consistent with the MODIS data.

4. Results and Discussion

4.1. Spatial and Temporal Variation of Snow Cover

Figure 3 shows the inter-annual variation of snow-covered areas across the entire Atlas Mountains for altitudes higher than 1000 m. The 10-day fractional snow-covered area (fSCA) showed a high seasonal variability, which differs greatly by elevation.
Generally, snow season starts effectively at the beginning of November and finishes in early April, except for altitudes superior to 3500 m, where snow can occur from October and persists until May (Figure 4). As expected, the maximum snow cover is registered during the winter months (December, January, and February). The evolution of fSCA is elevation-dependent (Figure 4), while its behavior is different. For the 1000–1500 m altitude range, the snow is almost absent in winter and the fSCA median values are lower than 0.1%. In the altitude range of 1500–2000 m, the fSCA maximum median value is around 2%, with a delay in terms of snow season start (end of December). From 2000 m, the behavior of fSCA is similar to that described for the entire study area, with a maximum median value above 10% and a maximum value of fSCA at 40%. However, the median value in the altitudes above 3000 m is more than 50% during the winter season.
At altitudes between 2000 and 3000 m, the snow season starts at the beginning of November, while it starts a little early for altitudes above 3000 m (mid-October). The end of the snow season is also variable according to altitude range, with early dates for the 1000–1500 m altitude range (end of January) and later dates for altitudes above 3500 m (end of May).
To characterize the spatial distributions of seasonal snow cover, the main snow metrics (SCD, SOSS, EOSS) and their coefficient of variation (CV) are averaged during the 16 years over the Atlas Mountain and its seven river basins (Figure 5). The SCD map shows that the occurrence of snow increases with altitude and tends to follow the contours of the terrain, with the highest SCD concentrated on the mountain’s top (Figure 5a). The highest SCD values for more than 120 days were detected in the Moulouya, Tensift, and Oum’Erbia basins where the elevation exceeds 3500 m.
However, the CV-SCD map (Figure 5d) highlights an opposite variation to SCD. At the high elevations, CV-SCD was generally less than 30%. The CV-SCD increases significantly at lower altitudes, indicating the relatively short SCD and the high inter-annual variability associated with it. Ultimately, the control of elevation on the SCD is apparent in the Atlas Mountains.
Snow seasons start earlier at high altitudes. Meanwhile, first snow at the foothills comes later during the snow season (Figure 5b). The average of SOSS over the study area is spread over two months, with the earliest starting around the first of November. The latest is recorded at low altitudes of less than 2000 m around the first of January.
A distribution map of the CV-SOSS (Figure 5e) highlights the degree of spatio-temporal variability associated with SOSS, with values ranging from 18% to 40%. High CV-SOSS values are recorded at low altitudes, which are marked by high variability in SOSS dates. In contrast, at high altitudes, CV-SOSS values are relatively lower since these areas record less variable SOSS dates. The spatial variation of the average melt dates over the period of 2001–2016 is shown in Figure 5c; the earliest dates are recorded at lower elevations, while the latest dates occurred at the highest elevations. Generally, the melting dates vary from the beginning of March to the end of May. Concerning CV-EOSS, its relationship with elevation is the same as that between CV-SOSS and elevation.

4.2. Global Altitudinal Effect on Snow Cover Metrics

In previous studies, the snow extent in the Atlas Mountains was mainly associated with elevation [6,30]. The specific concern here is to quantify the rate of snow metrics variations against altitudes during the 16 years studied over the whole Atlas bands. We also focused on analyzing the change of the altitudinal gradient of the snow metrics in relation to both space and time scales.
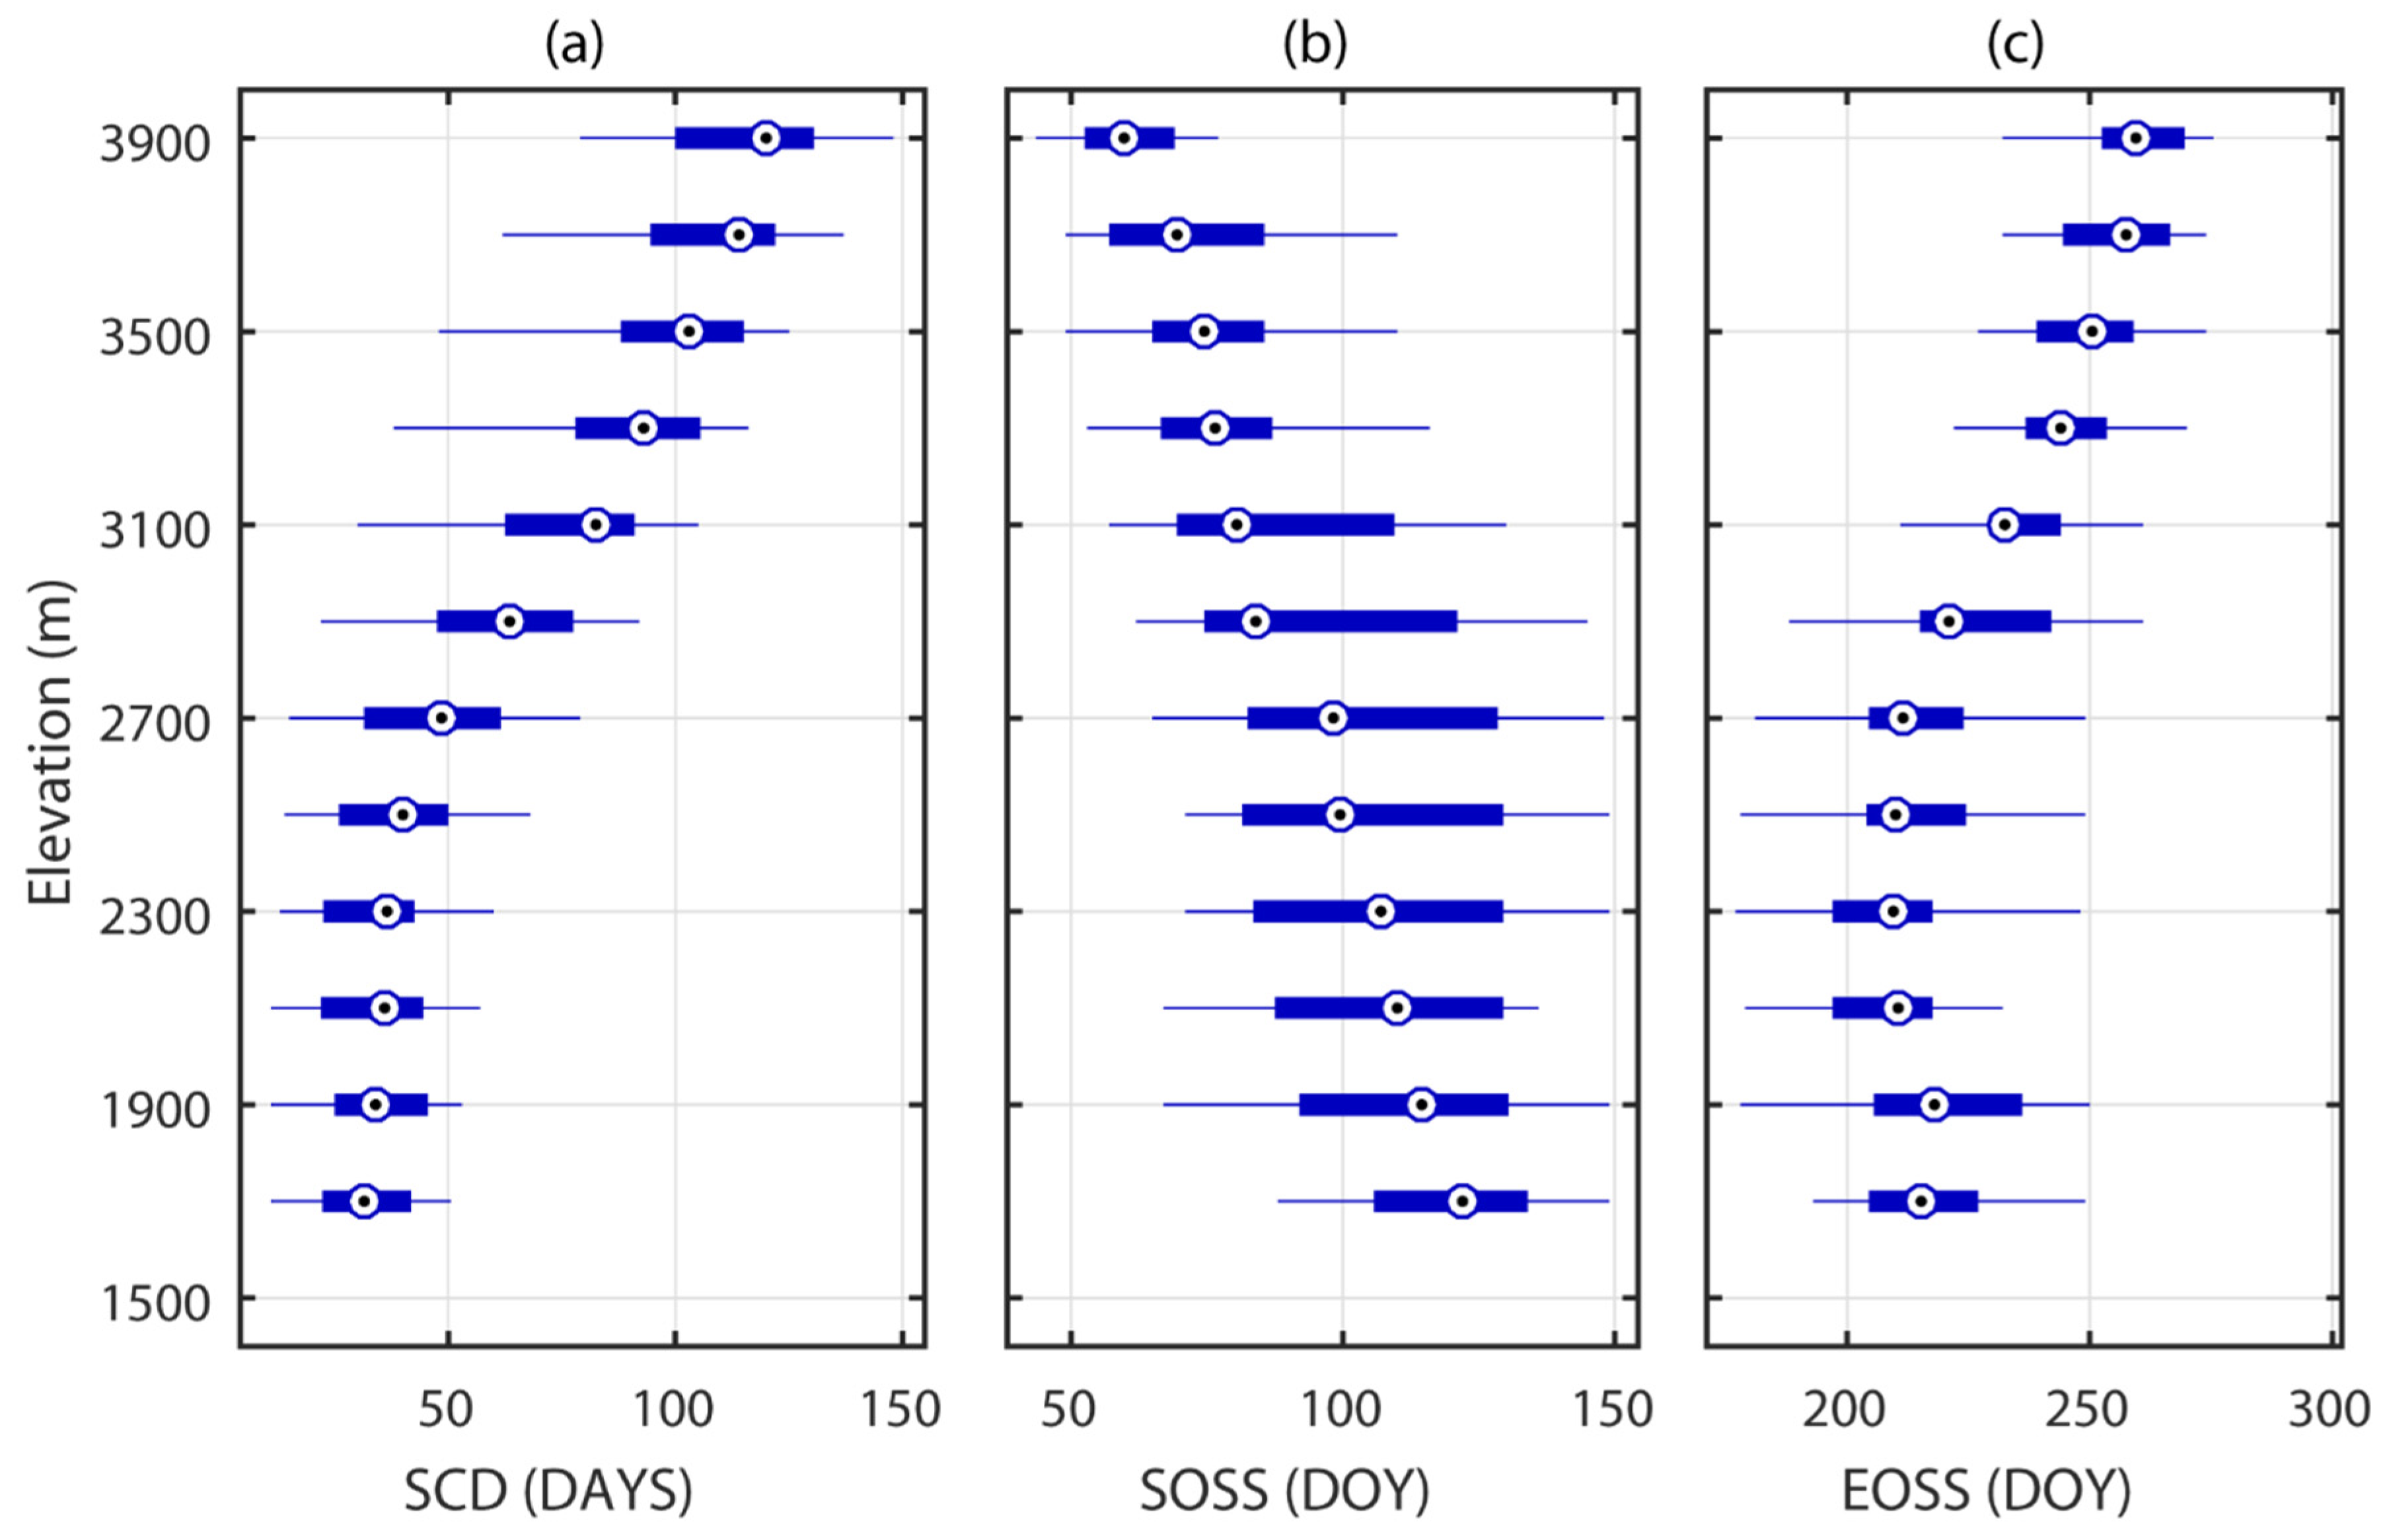
Figure 6a shows the average of snow cover metrics based on elevation zones, with an elevation step of 200 m. As we have visually noticed from the SCD map, the increase in the duration of the snow cover season (SCD) seems to be consistent with the increase in altitude. The control of the elevation on the SCD is very clear from altitudes above 2500 m. SCD is positively and linearly correlated with elevation. The main altitudinal gradient of SCD is about 4 days/100 m. However, SOSS is negatively correlated with elevation, but with strong variability at altitudes below 3000 m.
The EOSS is positively correlated with elevation. Moreover, a significant relationship occurs at elevations above 2500 m. The analysis of the effect of altitude on the snow cover metrics at the scale of the watershed (not shown here) shows the same results obtained in the Atlas Mountains.
For all snow seasons (2001–2016), SCD is less than 54 (days) at altitudes below 2000 m (Figure 6). The values of SCD for the areas located between 2000 and 3000 m ranged from 12 to 94 days, recorded in 2002 and 2015, respectively. These SCD values increase with altitude and can reach more than 150 (days) as in the case of the year 2004. The SOSS dates are also highly variable, with the earliest dates generally occurring at high altitudes; however, on the piedmont areas, the first snows are later. Nevertheless, several differences are visible. The 2007–2008 season had the earliest dates of SOSS during the study period (1st October). The variation of the EOSS follows the same pattern as that of the SCD, with the latest dates registered at high altitudes. Once again, we note a high inter-annual variability in EOSS dates, from very exceptional years (very late EOSS) to less important years (early EOSS). The 2008–2009 and 2010–2011 seasons had the later dates of EOSS throughout the Atlas.

4.3. Snow Cover Metrics in Relation to Aspect

The orientation aspect determines the duration of the insolation and the intensity of the received radiation [19]. In our study area, this parameter is more contrasted. The reduction of solar radiation in the shade areas helps to conserve soil moisture and reduces the evaporative power of the air. This parameter has a great influence on the snowmelt process and thus on snow distribution.
Generally, the south-facing slopes receive more solar radiation; therefore, snow accumulation and snow duration on south-facing slopes were more sensitive to temperature increment than those on north-facing slopes [19,21]. Figure 7 displays the evolution of the annual SCDs of four aspects in each hydrologic year, from 2001 to 2016.
In contrast to previous studies highlighting that snow accumulates more on north-facing slopes [16,30], the control of the aspect on the SCD—extracted using the MODIS product—is not clear, either at the scale of the entire Atlas or at the scale of the basin. The results show that the snow duration on the north and south-facing slopes do not display a significant difference. In some years, we found a maximum SCD in the south-facing slopes. The variability of snow duration induced by the exposure effect is mainly lost and not captured with the MODIS resolution (500 m).
This result is consistent with a recent study by [24], which indicated that MODIS is not able to capture the differences in snow cover due to the contrasting melt rates between north and south facing slopes.
The seasonality of the Atlas climate is also determined essentially by the atmospheric conditions [41]. During winter, this region is dominated by polar front perturbations whose cold air masses reach the Maghrib from continental and maritime areas, often in connection with the Azores anticyclone, or from the Eurasian continent [41]. The North Atlantic Oscillation (NAO) is the principal mode of atmospheric variability in the northern hemisphere [42], which includes Mediterranean mountainous areas. Marchane et al. [33] analyzed the linkages between snow cover and the NAO over the Atlas Mountains and suggested that the NAO is likely to strongly govern snowpack dynamics in the region.
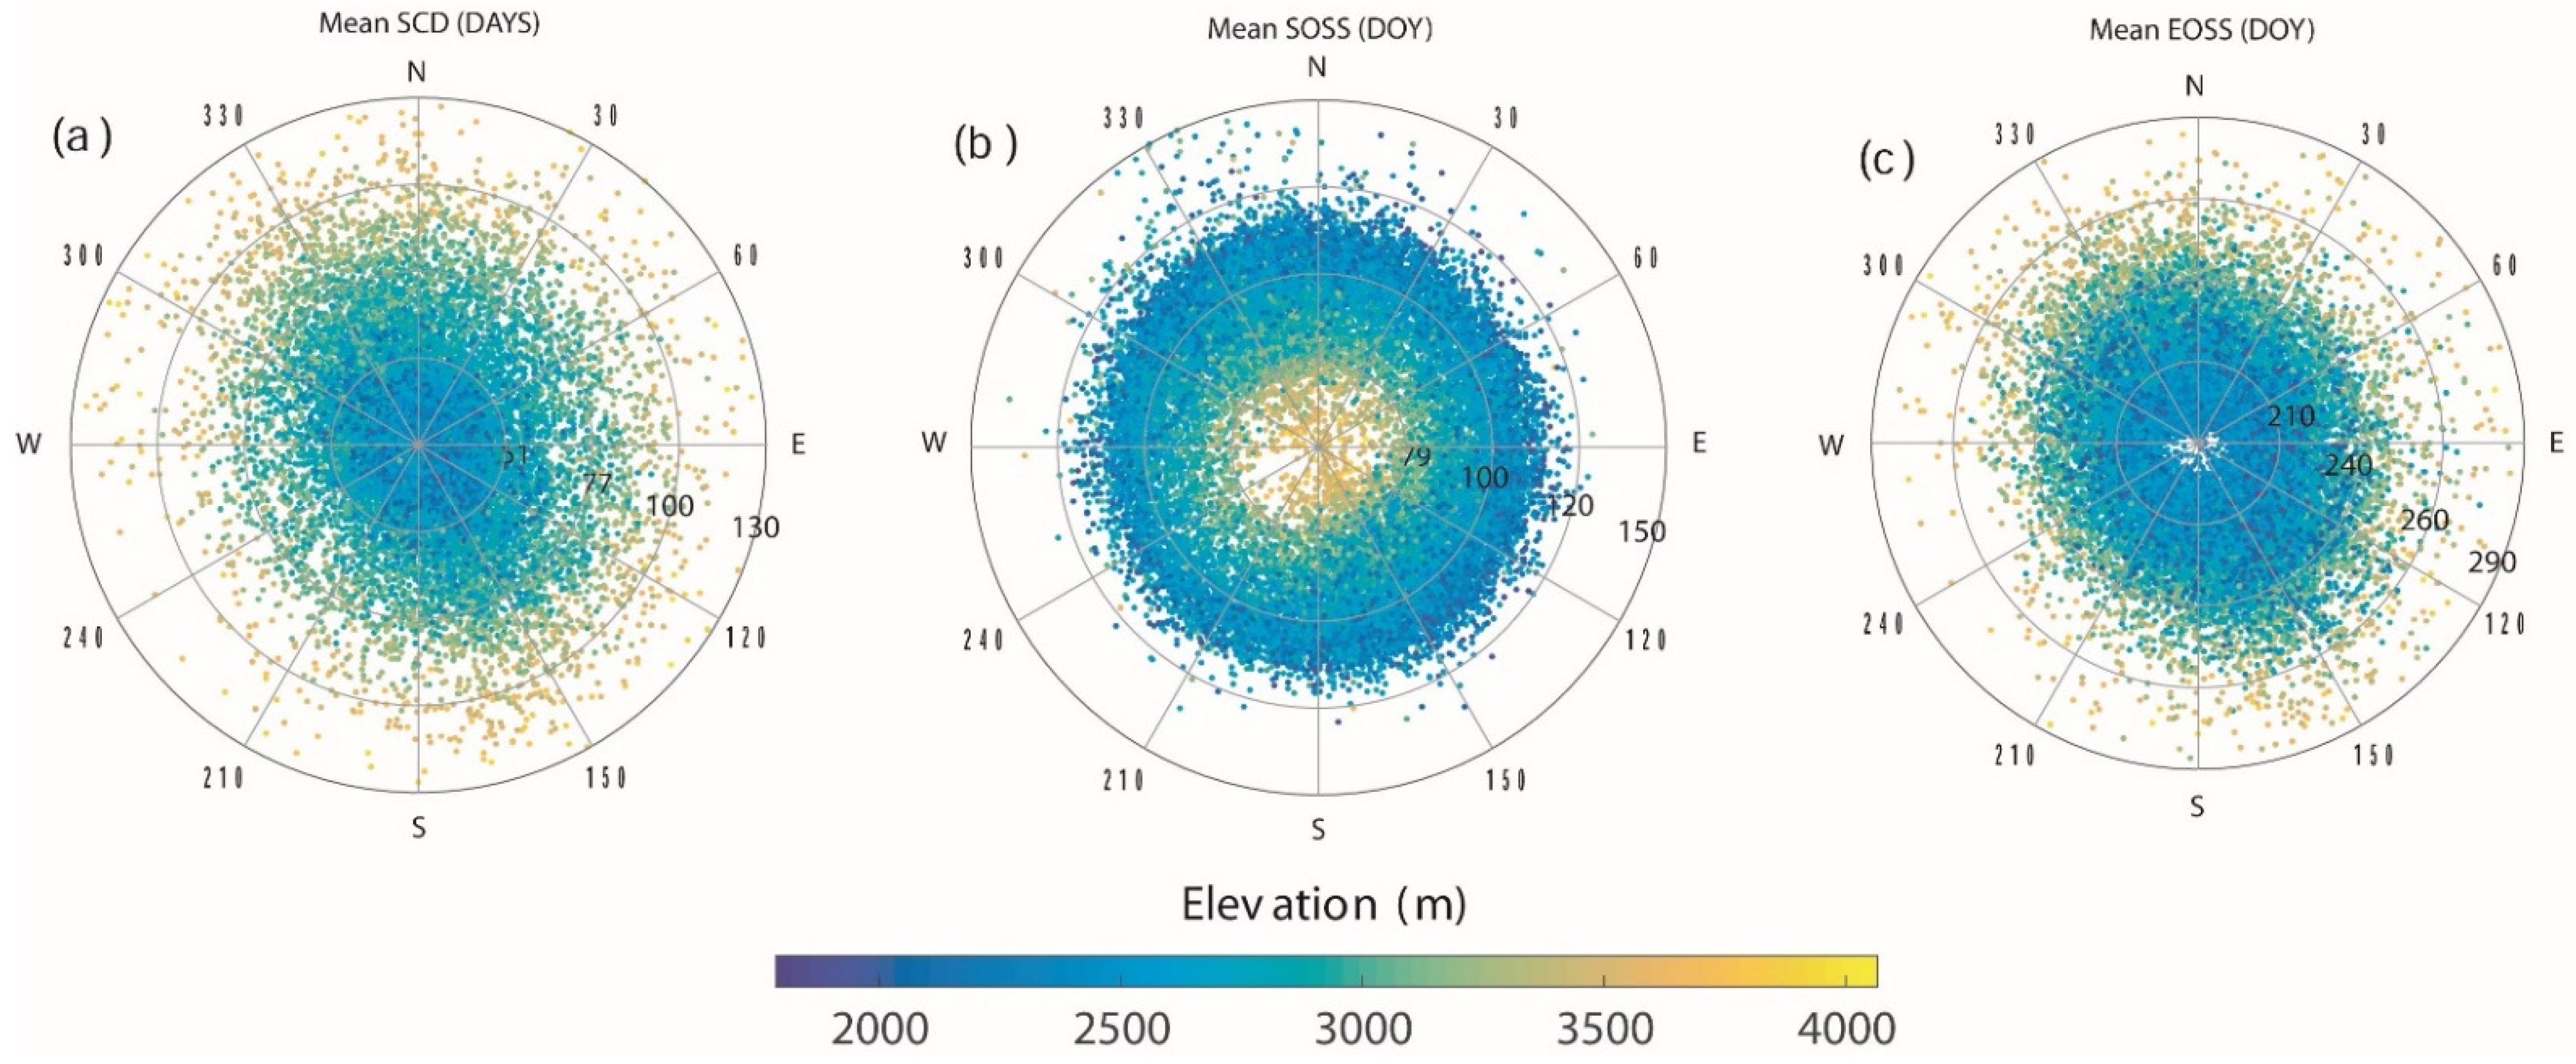
At the pixel scale, the effect of orientation on snow duration is not clear enough. From Figure 8a, we can see that most of the pixels with SCD > 120 (days) have a southern aspect, between 120° and 180°, and an elevation above 3500 m. The role of the aspect disappears as the elevation increases. These results are also consistent with the study of [43], who explained that the control of topography is not important when the snow cover is homogeneous (at high altitudes).
The latest dates of SOSS are recorded from the aspect of 300° to 0°, and an altitude lower than 2500 m (Figure 8b). Regarding snowmelt dates, we also notice that the impact of the aspect on the distribution of EOSS dates is not very clear (Figure 8c).
Generally, based on the spatial resolution of MODIS (500 m), the aspect control on seasonal snow measurements is not clear, either at the Atlas level or even by basin.

4.4. Snow Cover Metrics in Relation to Slope

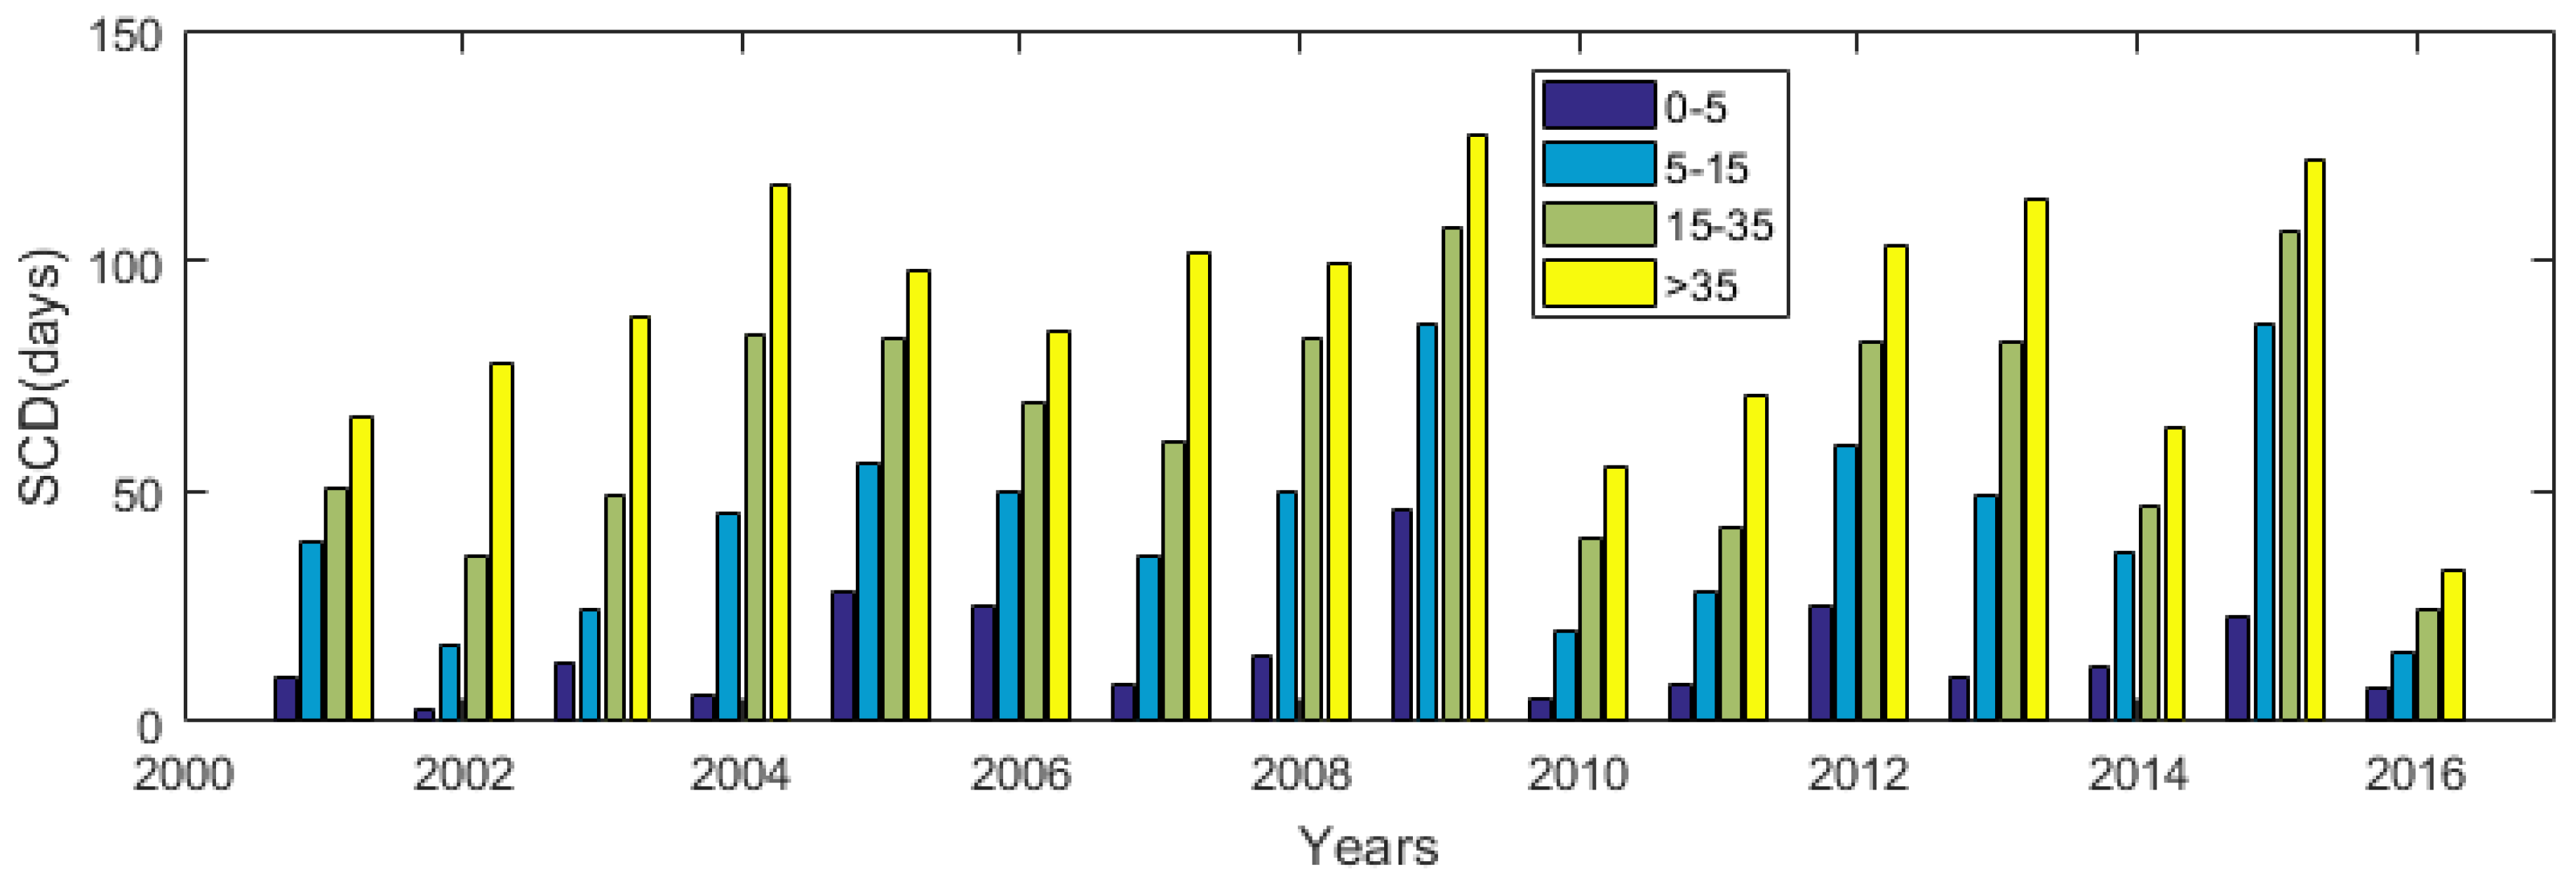
The results obtained for the duration of the snow cover confirm the data obtained for SCA, with a maximum duration at slopes > 35°. On the one hand, this is due to the fact that a steeper slope receives less radiation than a flatter surface; on the other hand, it is because a significant part of steep slopes is located at high altitudes.
The variation in the SCD based on the slope shows strong inter-annual variability (Figure 9). The longest period is recorded in the hydrological year 2009, while the shortest period of snow cover is recorded in the year 2016. An analysis of the slope control on the snow metrics distribution in the Moroccan Atlas shows that its effect on SOSS and EOSS is not homogeneous and especially influenced by the altitude.

4.5. Snow Metrics Lapse Rate Change

The snow metrics variability in mountain regions can serve as a good indicator of climate change. In the region of the Atlas Mountains, an earlier melting could limit water availability in the neighboring plains in the summer. The very few investigations on the snow cover variability in the Atlas Mountains did not report any significant trend. In order to investigate the possible change in snow cover metrics more precisely, we analyzed the variation of the altitudinal gradient of the selected snow metrics over the study period (2001–2016).
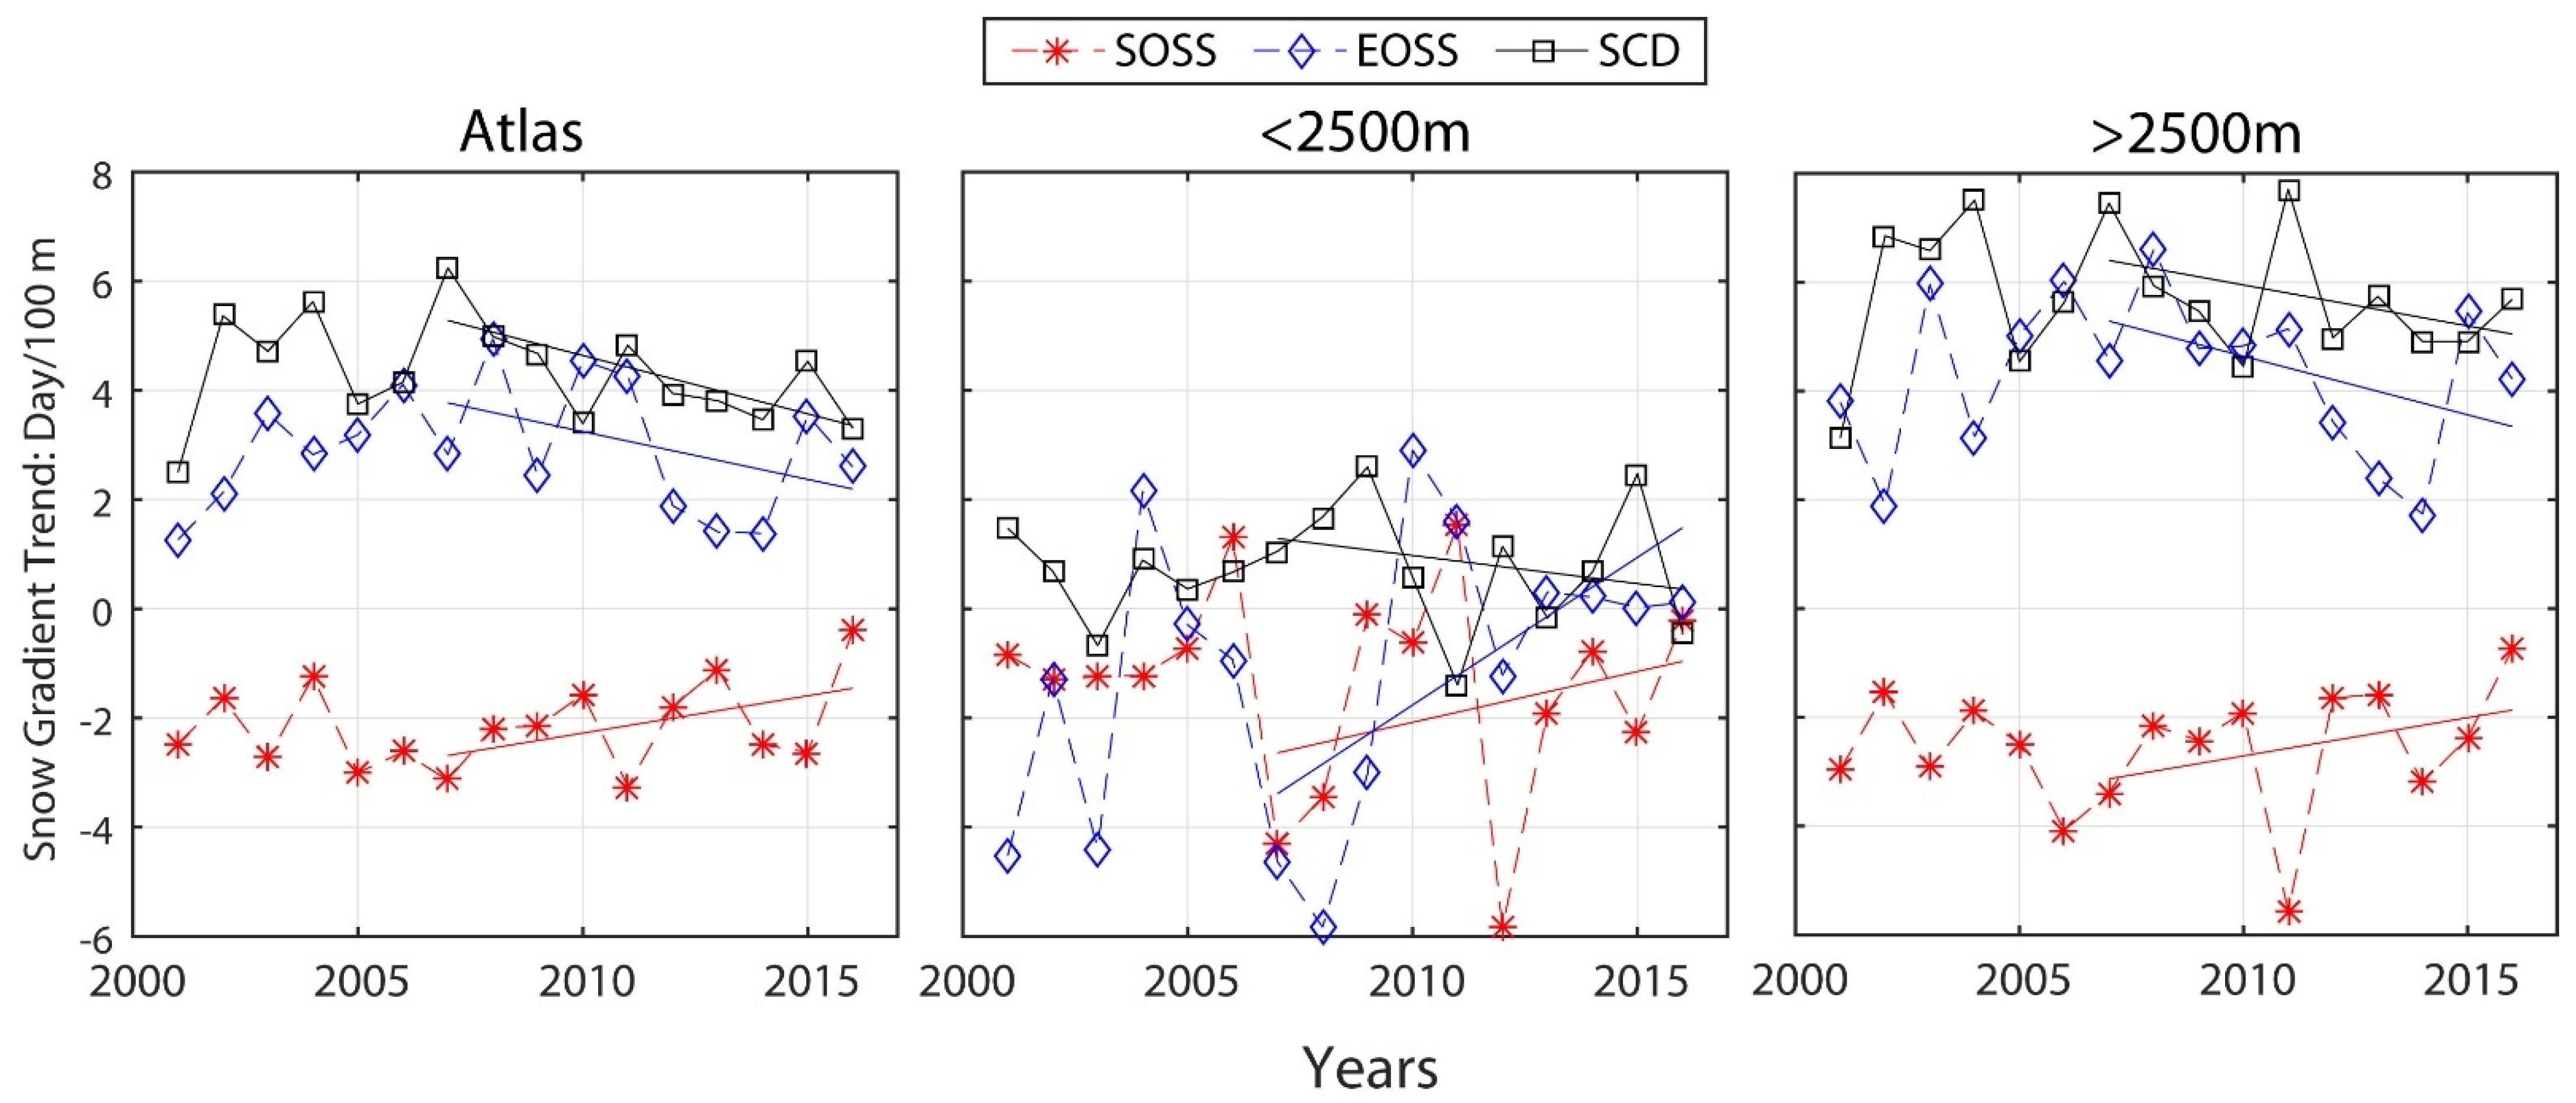
A time series of altitudinal sensitivity of snow metrics in the Atlas Mountains are plotted in Figure 10. Generally, the snow metrics gradient exhibited large inter-annual variability. The results of linear regression analysis indicate that the altitudinal sensitivity of SCD and EOSS exhibit a decreasing trend, with slopes of −0.21 and −0.18, respectively. In 2007, the duration of snow cover increased by an average of 6 days for each 100 meters. This value was reduced to 3 days in 2016. However, the change of SOSS altitudinal gradient is marked by a positive slope of 0.14. The response of the SOSS to climate change at different altitudes is similar to that of the SCD.
A trend analysis shows that EOSS gradient increases below 2500 m, but decreases between 2500 and 4000 m, indicating that EOSS at high and low altitudes show a contrasting response to climate change. The analysis above further confirms that the effect of EOSS dates on the length of the SCD on the Atlas Mountains is greater than that of SOSS dates. This decrease in the SCD gradient was largely driven by an earlier snowmelt and partly by a later snow onset.
The direct reasons for this change in the snow metric gradient must be linked to the long-term change and variability of air temperature and precipitation. The proof of this connection can be provided by climate projections over Morocco that agree on robust warming and drying trends under greenhouse gas forcing. According to Marchane et al. [44], future projections in the High Atlas indicate an increase in temperature (+1.4 °C to +2.6 °C) and a decrease in total precipitation (from −22% to −31%), depending on the emissions scenario.
Table 3 shows the difference between the average of the snow metrics lapse rate over two periods of 8 years each. This comparison also shows that the SCD and EOSS gradients decreased by 0.67 day and 0.35 day, respectively, between the two periods. In contrast, the SOSS gradient shows a positive change signal of about 0.5 day.
The gradient variability of the snow metrics was analyzed by watershed for two reasons: firstly, because it is the scale of decision making for water managers, and secondly, in order to compare it with the results found at the Atlas scale. Figure 11 presents the variability of the altitudinal gradient of the snow metrics for the seven watersheds covering the Moroccan Atlas, for the period of 2001–2016. The results highlight the strong inter-annual variability of the altitudinal gradient in relation to the strong spatio-temporal variability of snowfall for all the studied basins. From 2007 to 2016, we notice a decreasing trend in the altitudinal gradient of the SCD.
For the Oum-ER Bia watershed, which is the most important in terms of snow surface among the seven studied basins, the SCD gradient decreased from 7 days/100 m to 3 days/100 m. For the Tensift, Moulouya, Sebou, Souss, and Ziz basins, the SCD gradient varied from 6 days/100 m to less than 3 days/100 m. However, the Draa watershed has the maximum altitudinal gradient, at around 9 days/100 m, recorded in 2010–2011. In general, the variation of the SCD gradient at the watershed level is identical to that found at the Atlas scale from 2007 to 2016, with some differences in terms of the magnitude of the trend.
The variation of the EOSS gradient across watersheds is not consistent. For the period 2007–2016, there are only four basins (Oum-Er Bia, Draa, Souss, and slightly Tensift) that show a decreasing trend in the EOSS gradient (as seen in the Atlas). The results of a linear regression analysis for the basins Sebou, Ziz, and Moulouya show no clear trend during the period 2007–2016.
Regarding SOSS, the gradient variation results for all the basins examined are close to the Atlas findings, with an increasing trend. The greatest variation in the SOSS gradient is recorded in the southern watersheds, which are characterized by low snow surfaces and high variability in snow season starts.

5. Conclusions

The study highlights the topographic controls on the snow-covered area of the Atlas Mountains based on snow cover estimation during the 2001–2016 period. The following conclusions are drawn:
  • The snow cover is mainly affected by elevation, inducing a remarkable snow lapse rate. The quantity and timing (onset and melt-out dates and duration) of snow cover share the same pattern in their vertical distribution across the Atlas Mountains.
  • The altitudinal gradient of the SCD shows a decreasing trend. Since 2007, the SCD gradient in the Atlas Mountains has decreased from 6 days/100 m to 3 days/100 m. However, the change in the altitudinal gradient of SOSS is marked by a positive trend.
  • The altitudinal gradient of EOSS presents a potential contrasting response to climate change, with an increasing trend for elevations below 2500 m and a decreasing trend for altitudes between 2500 and 4000 m. The controls of orientation on snow cover metrics are not clear enough at the Atlas scale and even by basin, which can be related to the coarse spatial resolution of MODIS images that do not take into account the aspect control. The snowpack homogeneity can be considered as an important factor for spatial snow distribution associated with other topographic features. Both SCA and SCD increase with the slope. This can be explained by the fact that a significant part of the steep slopes is located at high altitudes, and steeper slopes receive less radiation than flatter surfaces.
The findings in this study represent an important advance towards the understanding of snow dynamics over the Atlas chain in Morocco and will contribute to improving our knowledge on the availability of water resources in relation to potential future climate change impacts. The analysis of snow lapse rate changes, as performed in this paper, constitute a novel approach that may be considered when producing a future scenario for water management at the river basin scale.

Author Contributions

Conceptualization, A.M. and A.B.; methodology, A.M., with the help of A.B.; A.M., A.B., and A.C. analyzed the results. A.M. and A.B. wrote the paper, with inputs from all the co-authors. All authors have read and agreed to the published version of the manuscript.

Funding

This research was funded by the research program “MorSnow-1” (Accord spécifique n39 entre OCP S.A et UM6P).

Data Availability Statement

Publicly available datasets were analyzed in this study. This data can be found here: http://nsidc.org/data/modis/data_summaries/index.html, accessed on 1 July 2021.

Conflicts of Interest

The authors declare no conflict of interest.

References

  1. Hall, D.K.; Riggs, G.A. Accuracy assessment of the MODIS snow products. Hydrol. Process. 2007, 21, 1534–1547. [Google Scholar] [CrossRef]
  2. Chehbouni, A.; Escadafal, R.; Duchemin, B.; Boulet, G.; Simonneaux, V.; Dedieu, G.; Mougenot, B.; Khabba, S.; Kharrou, H.; Maisongrande, P.; et al. An integrated modelling and remote sensing approach for hydrological study in arid and semi-arid regions: The SUDMED Programme. Int. J. Remote Sens. 2008, 29, 5161–5181. [Google Scholar] [CrossRef] [Green Version]
  3. Jarlan, L.; Khabba, S.; Er-Raki, S.; Le Page, M.; Hanich, L.; Fakir, Y.; Merlin, O.; Mangiarotti, S.; Gascoin, S.; Ezzahar, J.; et al. Remote Sensing of Water Resources in Semi-Arid Mediterranean Areas: The joint international laboratory TREMA. Int. J. Remote Sens. 2015, 36, 4879–4917. [Google Scholar] [CrossRef]
  4. Saydi, M.; Ding, J.-L.; Sagan, V.; Qin, Y. Snowmelt modeling using two melt-rate models in the Urumqi River watershed, Xinjiang Uyghur Autonomous Region, China. J. Mt. Sci. 2019, 16, 2271–2284. [Google Scholar] [CrossRef]
  5. Boudhar, A.; Hanich, L.; Boulet, G.; Duchemin, B.; Berjamy, B.; Chehbouni, A. Evaluation of the Snowmelt Runoff Model in the Moroccan High Atlas Mountains using two snow-cover estimates. Hydrol. Sci. J. 2009, 54, 1094–1113. [Google Scholar] [CrossRef]
  6. Marchane, A.; Jarlan, L.; Hanich, L.; Boudhar, A.; Gascoin, S.; Tavernier, A.; Filali, N.; Le Page, M.; Hagolle, O.; Berjamy, B. Assessment of daily MODIS snow cover products to monitor snow cover dynamics over the Moroccan Atlas mountain range. Remote Sens. Environ. 2015, 160, 72–86. [Google Scholar] [CrossRef]
  7. Chaponnière, A.; Maisongrande, P.; Duchemin, B.; Hanich, L.; Boulet, G.; Escadafal, R.; Elouaddat, S. A combined high and low spatial resolution approach for mapping snow covered areas in the Atlas Mountains. Int. J. Remote Sens. 2005, 26, 2755–2777. [Google Scholar] [CrossRef] [Green Version]
  8. Choi, G.; Robinson, D.A.; Kang, S. Changing Northern Hemisphere Snow Seasons. J. Clim. 2010, 23, 5305–5310. [Google Scholar] [CrossRef]
  9. Peng, S.; Piao, S.; Ciais, P.; Friedlingstein, P.; Zhou, L.; Wang, T. Change in snow phenology and its potential feedback to temperature in the Northern Hemisphere over the last three decades. Environ. Res. Lett. 2013, 8, 014008. [Google Scholar] [CrossRef] [Green Version]
  10. Boudhar, A.; Duchemin, B.; Hanich, L.; Boulet, G.; Chehbouni, A. Spatial distribution of the air temperature in mountainous areas using satellite thermal infra-red data. Comptes Rendus Geosci. 2011, 343, 32–42. [Google Scholar] [CrossRef] [Green Version]
  11. Schulz, O.; De Jong, C. Snowmelt and sublimation: Field experiments and modelling in the High Atlas Mountains of Morocco. Hydrol. Earth Syst. Sci. 2004, 8, 1076–1089. [Google Scholar] [CrossRef] [Green Version]
  12. Frei, A.; Tedesco, M.; Lee, S.; Foster, J.; Hall, D.K.; Kelly, R.; Robinson, D.A. A review of global satellite-derived snow products. Adv. Space Res. 2012, 50, 1007–1029. [Google Scholar] [CrossRef] [Green Version]
  13. Calleja, J.F.; Corbea-Pérez, A.; Fernández, S.; Recondo, C.; Peón, J.; de Pablo, M.Á. Snow Albedo Seasonality and Trend from MODIS Sensor and Ground Data at Johnsons Glacier, Livingston Island, Maritime Antarctica. Sensors 2019, 19, 3569. [Google Scholar] [CrossRef] [PubMed] [Green Version]
  14. Brown, R.D.; Mote, P.W. The Response of Northern Hemisphere Snow Cover to a Changing Climate. J. Clim. 2009, 22, 2124–2145. [Google Scholar] [CrossRef]
  15. López-Moreno, J.I.; Pomeroy, J.W.; Revuelto, J.; Vicente-Serrano, S.M. Response of snow processes to climate change: Spatial variability in a small basin in the Spanish Pyrenees. Hydrol. Process. 2013, 27, 2637–2650. [Google Scholar] [CrossRef]
  16. López-Moreno, J.I.; Revuelto, J.; Gilaberte, M.; Morán-Tejeda, E.; Pons, M.; Jover, E.; Esteban, P.; García, C.; Pomeroy, J.W. The effect of slope aspect on the response of snowpack to climate warming in the Pyrenees. Theor. Appl. Clim. 2013, 117, 207–219. [Google Scholar] [CrossRef] [Green Version]
  17. Lehning, M.; Völksch, I.; Gustafsson, D.; Nguyen, T.A.; Stähli, M.; Zappa, M. ALPINE3D: A detailed model of mountain surface processes and its application to snow hydrology. Hydrol. Process. 2006, 20, 2111–2128. [Google Scholar] [CrossRef]
  18. Letsinger, S.L.; Olyphant, G.A. Distributed energy-balance modeling of snow-cover evolution and melt in rugged terrain: Tobacco Root Mountains, Montana, USA. J. Hydrol. 2007, 336, 48–60. [Google Scholar] [CrossRef]
  19. Lopez-Moreno, I.; Stähli, M. Statistical analysis of the snow cover variability in a subalpine watershed: Assessing the role of topography and forest interactions. J. Hydrol. 2008, 348, 379–394. [Google Scholar] [CrossRef]
  20. Lee, W.-L.; Liou, K.N.; Wang, C.-C. Impact of 3-D topography on surface radiation budget over the Tibetan Plateau. Theor. Appl. Clim. 2012, 113, 95–103. [Google Scholar] [CrossRef]
  21. Baba, M.W.; Gascoin, S.; Kinnard, C.; Marchane, A.; Hanich, L. Effect of Digital Elevation Model Resolution on the Simulation of the Snow Cover Evolution in the High Atlas. Water Resour. Res. 2019, 55, 5360–5378. [Google Scholar] [CrossRef]
  22. Tong, J.; Déry, S.J.; Jackson, P.L. Topographic control of snow distribution in an alpine watershed of western Canada inferred from spatially-filtered MODIS snow products. Hydrol. Earth Syst. Sci. 2009, 13, 319–326. [Google Scholar] [CrossRef] [Green Version]
  23. Baba, M.W.; Gascoin, S.; Jarlan, L.; Simonneaux, V.; Hanich, L. Variations of the Snow Water Equivalent in the Ourika Catchment (Morocco) over 2000–2018 Using Downscaled MERRA-2 Data. Water 2018, 10, 1120. [Google Scholar] [CrossRef] [Green Version]
  24. Bouamri, H.; Kinnard, C.; Boudhar, A.; Gascoin, S.; Hanich, L.; Chehbouni, A. MODIS Does Not Capture the Spatial Heterogeneity of Snow Cover Induced by Solar Radiation. Front. Earth Sci. 2021, 9, 640250. [Google Scholar] [CrossRef]
  25. Dietz, A.J.; Conrad, C.; Kuenzer, C.; Gesell, G.; Dech, S. Identifying Changing Snow Cover Characteristics in Central Asia between 1986 and 2014 from Remote Sensing Data. Remote Sens. 2014, 6, 12752–12775. [Google Scholar] [CrossRef] [Green Version]
  26. Bormann, K.J.; Brown, R.D.; Derksen, C.; Painter, T.H. Estimating snow-cover trends from space. Nat. Clim. Chang. 2018, 8, 924–928. [Google Scholar] [CrossRef]
  27. Boudhar, A.; Boulet, G.; Hanich, L.; Sicart, J.E.; Chehbouni, A. Energy fluxes and melt rate of a seasonal snow cover in the Moroccan High Atlas. Hydrol. Sci. J. 2016, 61, 931–943. [Google Scholar] [CrossRef]
  28. Bouamri, H.; Boudhar, A.; Gascoin, S.; Kinnard, C. Performance of temperature and radiation index models for point-scale snow water equivalent (SWE) simulations in the Moroccan High Atlas Mountains. Hydrol. Sci. J. 2018, 63, 1844–1862. [Google Scholar] [CrossRef]
  29. Baba, M.; Boudhar, A.; Gascoin, S.; Hanich, L.; Marchane, A.; Chehbouni, A. Assessment of MERRA-2 and ERA5 to Model the Snow Water Equivalent in the High Atlas (1981–2019). Water 2021, 13, 890. [Google Scholar] [CrossRef]
  30. Boudhar, A.; Duchemin, B.; Hanich, L.; Jarlan, L.; Chaponnière, A.; Maisongrande, P.; Boulet, G.; Chehbouni, A. Long-term analysis of snow-covered area in the Moroccan High-Atlas through remote sensing. Int. J. Appl. Earth Obs. Geoinf. 2010, 12, S109–S115. [Google Scholar] [CrossRef] [Green Version]
  31. Baba, M.; Gascoin, S.; Hagolle, O.; Bourgeois, E.; Desjardins, C.; Dedieu, G. Evaluation of Methods for Mapping the Snow Cover Area at High Spatio-Temporal Resolution with VENμS. Remote Sens. 2020, 12, 3058. [Google Scholar] [CrossRef]
  32. Chaponnière, A.; Boulet, G.; Chehbouni, A.; Aresmouk, M. Understanding hydrological processes with scarce data in a mountain environment. Hydrol. Process. 2008, 22, 1908–1921. [Google Scholar] [CrossRef] [Green Version]
  33. Marchane, A.; Jarlan, L.; Boudhar, A.; Tramblay, Y.; Hanich, L. Linkages between snow cover, temperature and rainfall and the North Atlantic Oscillation over Morocco. Clim. Res. 2016, 69, 229–238. [Google Scholar] [CrossRef]
  34. Abrams, M.; Bailey, B.; Tsu, H.; Hato, M. The ASTER Global DEM. Photogram. Eng. Remote Sens. 2010, 76, 344–348. [Google Scholar]
  35. Hall, D.K.; Riggs, G.A.; Salomonson, V.V.; DiGirolamo, N.E.; Bayr, K.J. MODIS snow-cover products. Remote Sens. Environ. 2002, 83, 181–194. [Google Scholar] [CrossRef] [Green Version]
  36. Hall, D.K.; Riggs, G.A.; Salomonson, V.V. Development of methods for mapping global snow cover using moderate resolution imaging spectroradiometer data. Remote Sens. Environ. 1995, 54, 127–140. [Google Scholar] [CrossRef]
  37. Salomonson, V.V.; Appel, I. Estimating fractional snow cover from MODIS using the normalized difference snow index. Remote Sens. Environ. 2004, 89, 351–360. [Google Scholar] [CrossRef]
  38. Gascoin, S.; Hagolle, O.; Huc, M.; Jarlan, L.; Dejoux, J.-F.; Szczypta, C.; Marti, R.; Sánchez, R. A snow cover climatology for the Pyrenees from MODIS snow products. Hydrol. Earth Syst. Sci. 2015, 19, 2337–2351. [Google Scholar] [CrossRef] [Green Version]
  39. Doumit, J. Comparison of SRTM DEM and ASTER GDEM Derived Digital Elevation Models with elevation points over the Lebanese territory. J. Leban. Soc. Geogr. 2013, 27, 7–28. [Google Scholar]
  40. Jing, C.; Shortridge, A.; Lin, S.; Wu, J. Comparison and validation of SRTM and ASTER GDEM for a subtropical landscape in Southeastern China. Int. J. Digit. Earth 2013, 7, 969–992. [Google Scholar] [CrossRef]
  41. Peyron, M. Les chutes de neige dans l’Atlas marocain. Rev. Géographie Alp. 1980, 68, 237–254. [Google Scholar] [CrossRef]
  42. Barnston, A.G.; Livezey, R.E. Classification, Seasonality and Persistence of Low-Frequency Atmospheric Circulation Patterns. Mon. Weather. Rev. 1987, 115, 1083–1126. [Google Scholar] [CrossRef]
  43. Calleja, J.F.; Muniz, R.; Fernandez, S.; Corbea-Perez, A.; Peon, J.; Otero, J.; Navarro, F. Snow Albedo Seasonal Decay and Its relation with Shortwave Radiation, Surface Temperature and Topography Over an Antarctic Ice Cap. IEEE J. Sel. Top. Appl. Earth Obs. Remote Sens. 2021, 14, 2162–2172. [Google Scholar] [CrossRef]
  44. Marchane, A.; Tramblay, Y.; Hanich, L.; Ruelland, D.; Jarlan, L. Climate change impacts on surface water resources in the Rheraya catchment (High Atlas, Morocco). Hydrol. Sci. J. 2017, 62, 979–995. [Google Scholar] [CrossRef]
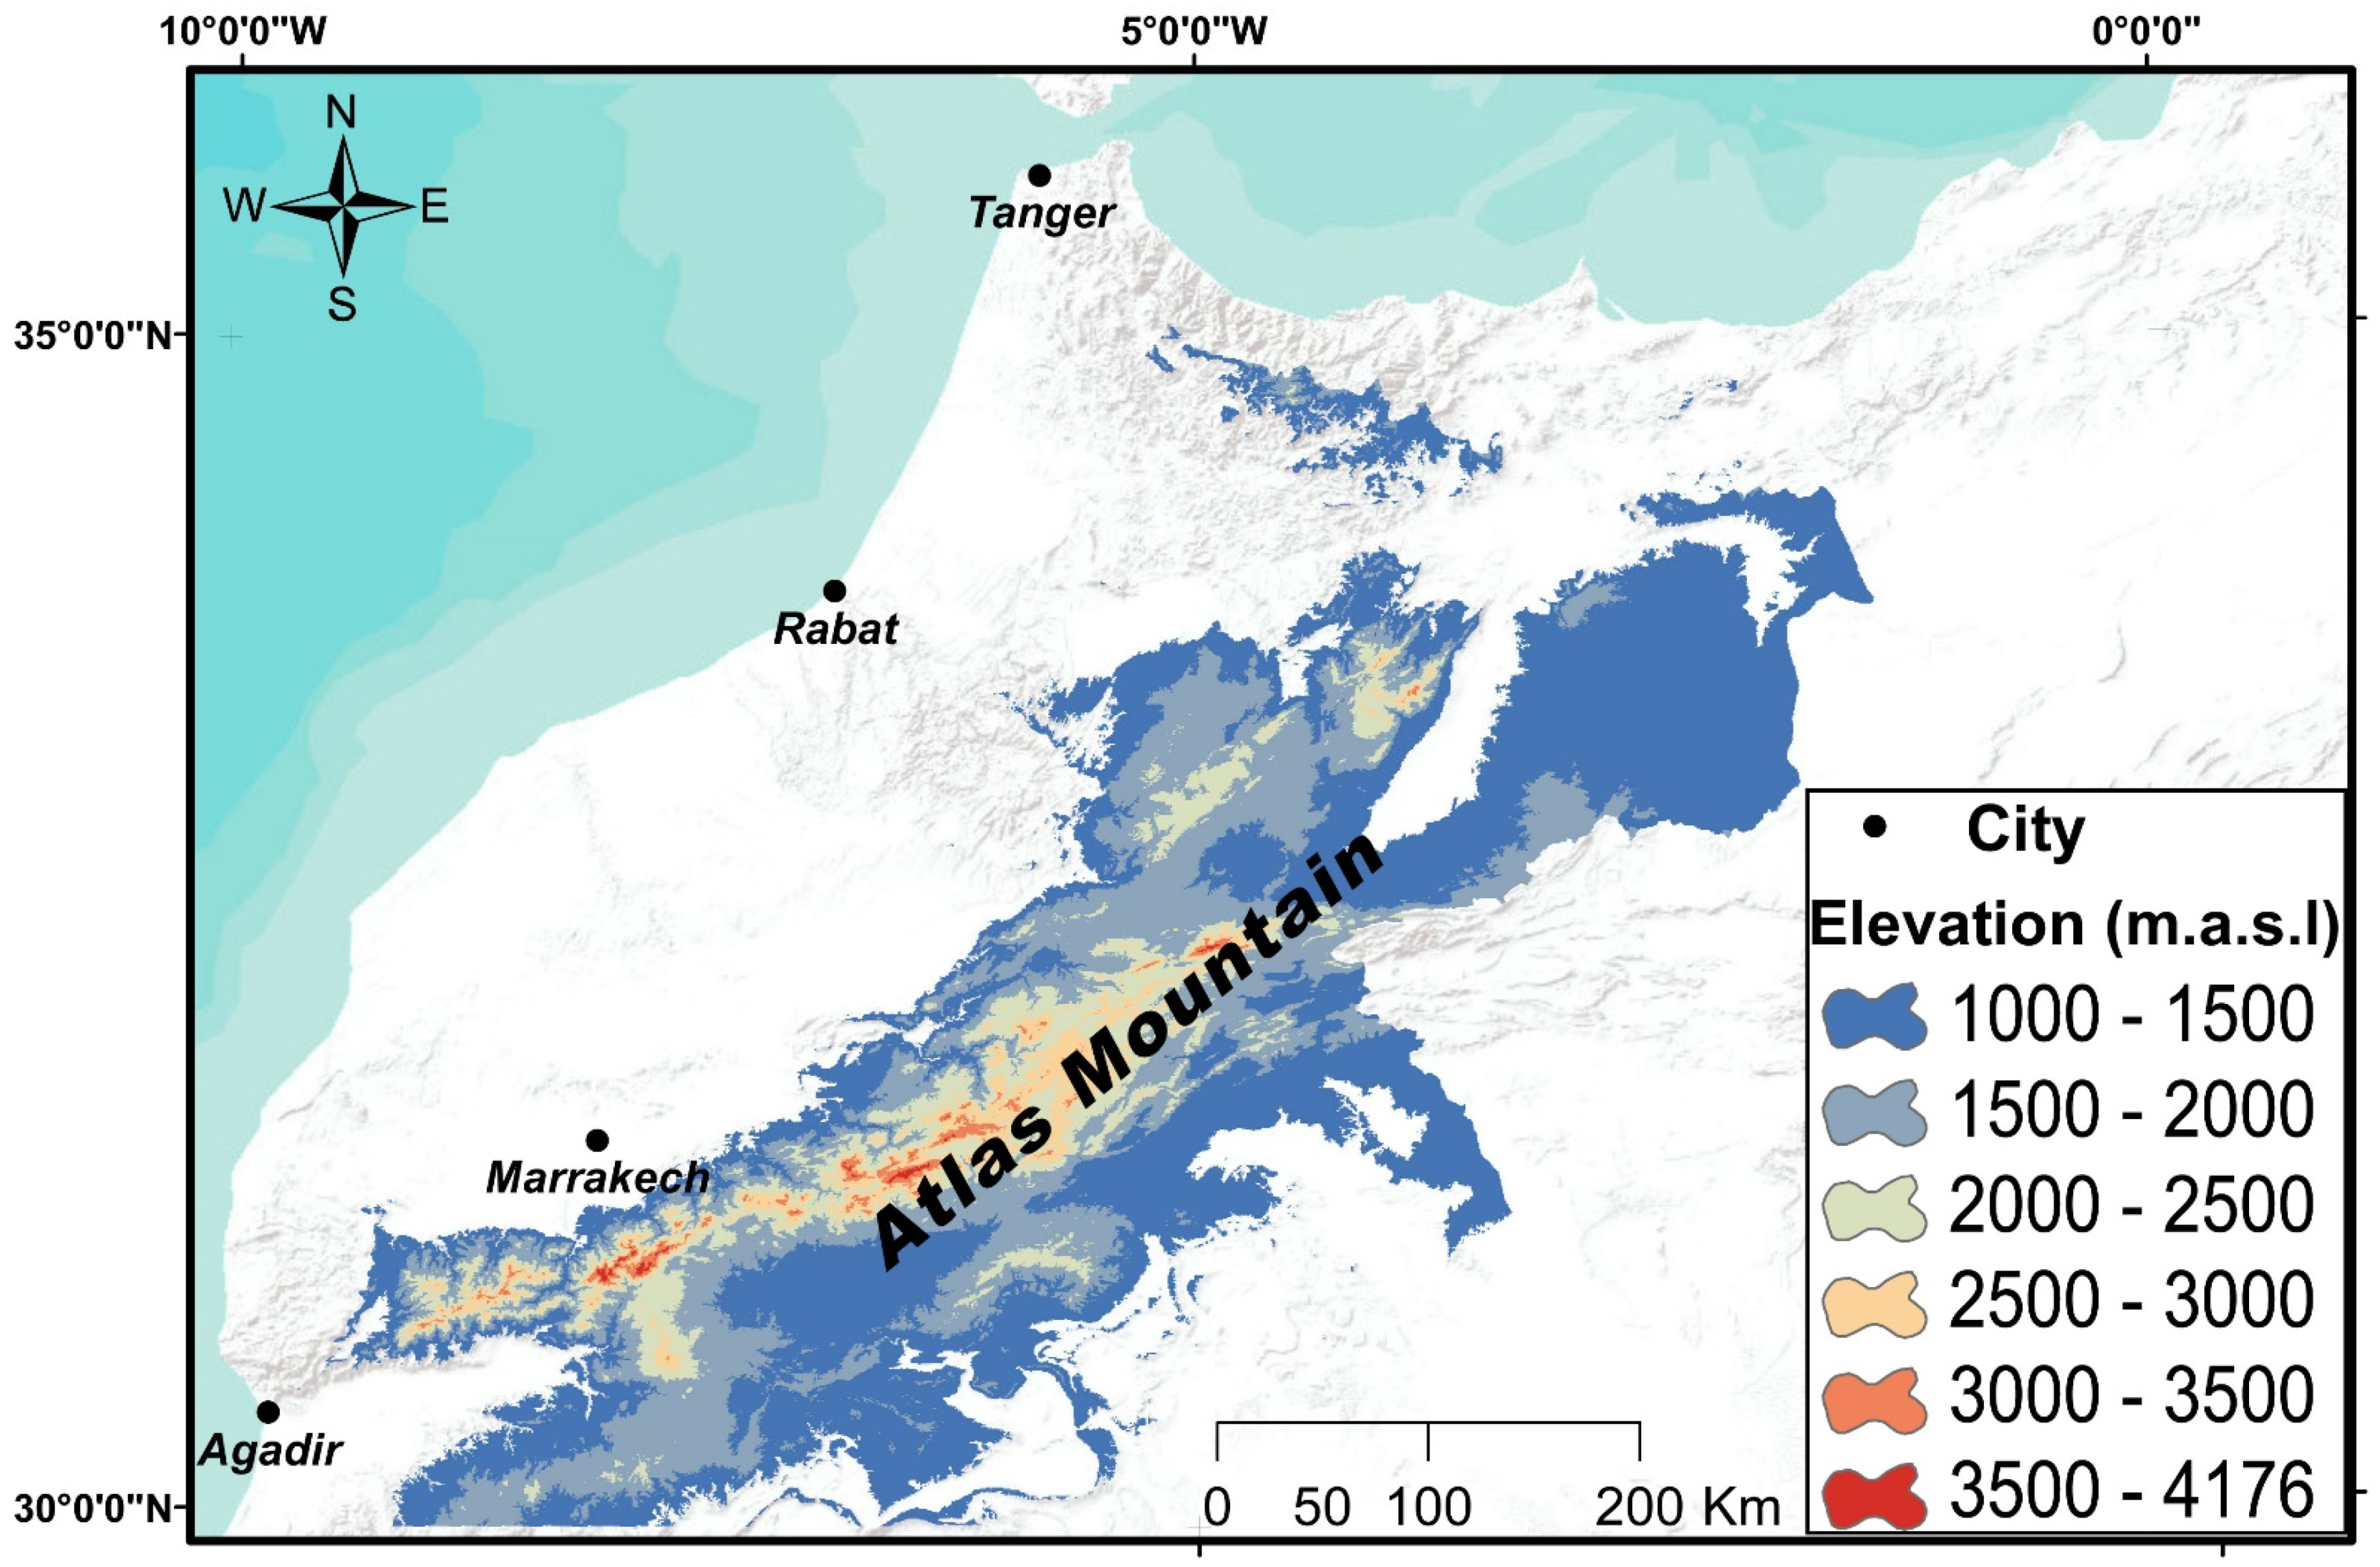
Figure 1. Location of the mountainous area higher than 1000 m in Morocco.
Remotesensing 13 03370 g001
Figure 2. Flowchart of the methodology.
Remotesensing 13 03370 g002
Figure 3. Box plot of the variations in a 10-day fSCA. Area across the snow seasons between 2001 and 2016, Atlas Mountains.
Remotesensing 13 03370 g003
Figure 4. Boxplot of the variations in the 10-day fSCA for the snow seasons between 2001 and 2016, by elevation band: (a) altitudes between 1000 and 1500 m, (b) altitudes between 1500 and 2000 m, (c) altitudes between 2000 and 2500 m, (d) altitudes between 2500 and 3000 m, (e) altitudes between 3000 and 3500 m and (f) altitudes above 3500 m.
Remotesensing 13 03370 g004
Figure 5. Mean annual snow cover metrics (SCD (a), SOSS (b), and EOSS (c), and associated coefficient of variation (df), 2001–2016.
Remotesensing 13 03370 g005
Figure 6. Snow cover metrics based on elevation bands in the Atlas Mountains, 2001–2016. (a) SCD, (b) SOSS, (c) EOSS.
Remotesensing 13 03370 g006
Figure 7. Evolution of the annual SCDs of four aspects in each hydrologic year, from 2001 to 2016, in the Atlas chain.
Remotesensing 13 03370 g007
Figure 8. Mean SCD (a), mean SOSS (b), and mean EOSS (c) based on aspect, 2001–2016.
Remotesensing 13 03370 g008
Figure 9. Evolution of annual SCDs of the four slopes from 2001 to 2016 in the Atlas chain.
Remotesensing 13 03370 g009
Figure 10. The trend of the snow metrics gradient between 2001 and 2016 over the whole Atlas chain and by altitude range.
Remotesensing 13 03370 g010
Figure 11. Snow metrics lapse rate (day/100 m) between 2001 and 2016 over the seven river basins.
Remotesensing 13 03370 g011
Table 1. Classification of vertical elevation zones in the study area based on DEM data [34].
Elevation RangeAverage Elevation (m)Areal Extent (km2)Areal Proportion (%)
1000–1500123166,02854.6
1500–2000171335,46429.3
2000–2500221313,12810.8
2500–3000270151894.3
3000–3500317710370.9
3500–420036441550.1
Table 2. Classification of aspects and slope gradients in the study area based on DEM data.
Classification of OrientationClassification of Slope Gradients
AspectAreal Extent (km)Areal Proportion (%)Range of Slope (°)Areal Extent (km2)Areal Proportion (%)
North-facing34,656.228.60–552,509.743.4
East-facing28,19323.35–1539,816.532.9
South-facing32,783.227.115–3524,195.720.0
West-facing25,34920.9>354477.53.7
Table 3. Change on the mean of snow metrics lapse rate over two time periods (8 years each).
Snow MetricsFirst Time Periods
(2001–2008)
Second Time Periods
(2009–2016)
Change
SOSS−2.38−1.930.46
EOSS3.112.76−0.35
SCD4.673.99−0.67
Publisher’s Note: MDPI stays neutral with regard to jurisdictional claims in published maps and institutional affiliations.