Abstract
Soil moisture monitoring using Global Navigation Satellite System (GNSS) multipath signals has gained continuous interests in recent years. However, traditional GNSS-interferometric reflectometry (GNSS-IR) soil moisture retrieval methods generally utilize a single frequency or single satellite, which fail to take full advantage of different and complementary of satellite signals with different frequencies. An improved algorithm for soil moisture retrieval based on principal component analysis (PCA) and entropy method using multi-frequency amplitude and phase offset fusion data was proposed in this research. The performance of the proposed soil moisture retrieval method was evaluated using data recorded by Plate Boundary Observatory (PBO) H2O networks and a self-built site in Henan, China. The results from GPS and BeiDou both showed that the retrieved soil moisture has a stronger correlation with in situ soil moisture, which can better reflect the fluctuation of ground truth measurements. Compared with the traditional method, the retrieval accuracy of the proposed method in terms of root-mean-square error (RMSE) was improved by 50.93%, and the average correlation coefficient were increased by 11.71%. This research proved that the proposed method could effectively improve retrieval accuracy due to the increasing number of frequencies and tracks clustering. Moreover, this study has illustrated the feasibility of BeiDou signals to precisely estimate surface soil moisture.
1. Introduction
In the last years, the Global Navigation Satellite System (GNSS) has been widely explored as an efficient remote sensing tool, working on surface environmental monitoring. The first use of GNSS reflected signals in remote sensing was proposed by Hall and Cordey to sense ocean wind [1]. Subsequently, GNSS reflectometry (GNSS-R) has been investigated for estimating a range of geophysical parameters, including soil moisture [2,3], sea surface wind speed [4], snow depth [5,6], vegetation state [7,8], and sea-ice monitoring [9,10].
The above studies focused on using specially designed GNSS receivers to estimate changes in environmental conditions, which needed additional expensive antennas and were not conducive to the application of GNSS networks or Continuously Operating Reference Stations (CORS) simultaneously. Since 2008, Larson et al. [11] proposed the GNSS-interferometric reflectometry (GNSS-IR) technique, where the GNSS signal was collected by geodetic GNSS receivers using a Right-Hand Circularly Polarized (RHCP) antenna. The time-evolution of the received Signal-to-Noise Ratio (SNR) was then used to monitor soil moisture variations. Since then, a new and inexpensive source of surface environmental information has become available to a broader scientific community, and different studies have been conducted based on the GNSS-IR technique, such as soil moisture [11,12,13,14], vegetation growth status [15,16,17], and snow depth [18,19,20]. Soil moisture is an important criterion for measuring the circulation of water resources, and its accurate and long-term monitoring is the basis of environmental scientific research. Larson et al. [21] further confirmed that GPS SNR data were more sensitive to the soil with a vertical depth of 1~6 cm, and were consistent with the results measured by traditional soil moisture reflectometer. Chew et al. [22] obtained the relative phase offset, amplitude, and effective reflection height from simulated signal data, which further indicated the sensitivity of phase offset and amplitude to changes in soil moisture. Vey et al. [23] used the SNR data collected at the Sutherland Station in South Africa to construct an empirical model for soil moisture estimation. A GPS multipath electrodynamics model was established by Zavorotny et al. [24] to further investigate how soil moisture fluctuations affect the change of SNR. The inversion of soil moisture from the BeiDou Navigation Satellite System (BDS) B1 and B2 signals through the interference pattern technique and the SNR, were verified by Yang et al. [25]. Zhen et al. [26] used two machine learning algorithms, Back Propagation (BP) neural network and Support Vector Regression (SVR) to construct the soil moisture retrieval model of GNSS satellite reflection signal. Jing et al. [27] proposed an estimation model that uses the entropy method to fuse the dual-frequency amplitude of single satellite. Sun et al. [28] established an inversion model based on the minimum variance method fused with GPS tri-frequency amplitude. Meanwhile, the effect of vegetation on reflected signals was also observed, which needed to be mitigated to achieve better estimation of the soil moisture [29]. Two soil moisture retrieval algorithms, with different complexity to mitigate vegetation effects, were verified in [30]. Zribi M et al. [31] discussed the influence of radar frequency on the relationship between surface soil moisture over bare soils. It proved that L band penetration depth is approximately 5 cm for medium moisture levels, whereas the penetration depth for the C and X bands is around 1 cm.
However, previous traditional regression models have concentrated on the use of single frequency phase offset or amplitude, and failed to take full advantage of the difference and complementarity of satellite signals with different frequencies. Moreover, it is difficult to select a set of optimal SNR combinations from many SNR observations for modeling, which will affect the efficiency of soil moisture retrieval of GNSS-IR. In fact, due to the difference of the satellite transmitting power and the surface environment, soil moisture may also lead to changes of other characteristic parameters, such as the fluctuation of amplitude. Therefore, it is not enough to simply use characteristic parameters from a single GNSS frequency.
In order to make up for the shortcomings of low reliability and poor stability of single-satellite or single-frequency approaches, an algorithm using multi-frequency and multi-satellite amplitude and phase offset fusion data is proposed and verifies its applicability to BDS in this research. The method is validated using experimental data from Plate Boundary Observatory (PBO) H2O networks and Henan, China. After the introduction, we present the principles of traditional GNSS-IR and retrieval procedure of the proposed method. Following this, processing strategies and data collection are described. After that, the performance of the proposed method is shown and evaluated. More details about this method will be described in the following sections. Finally, the conclusions are drawn.
2. Methods
2.1. The Traditional Single-Frequency Retrieval Method of GNSS-IR
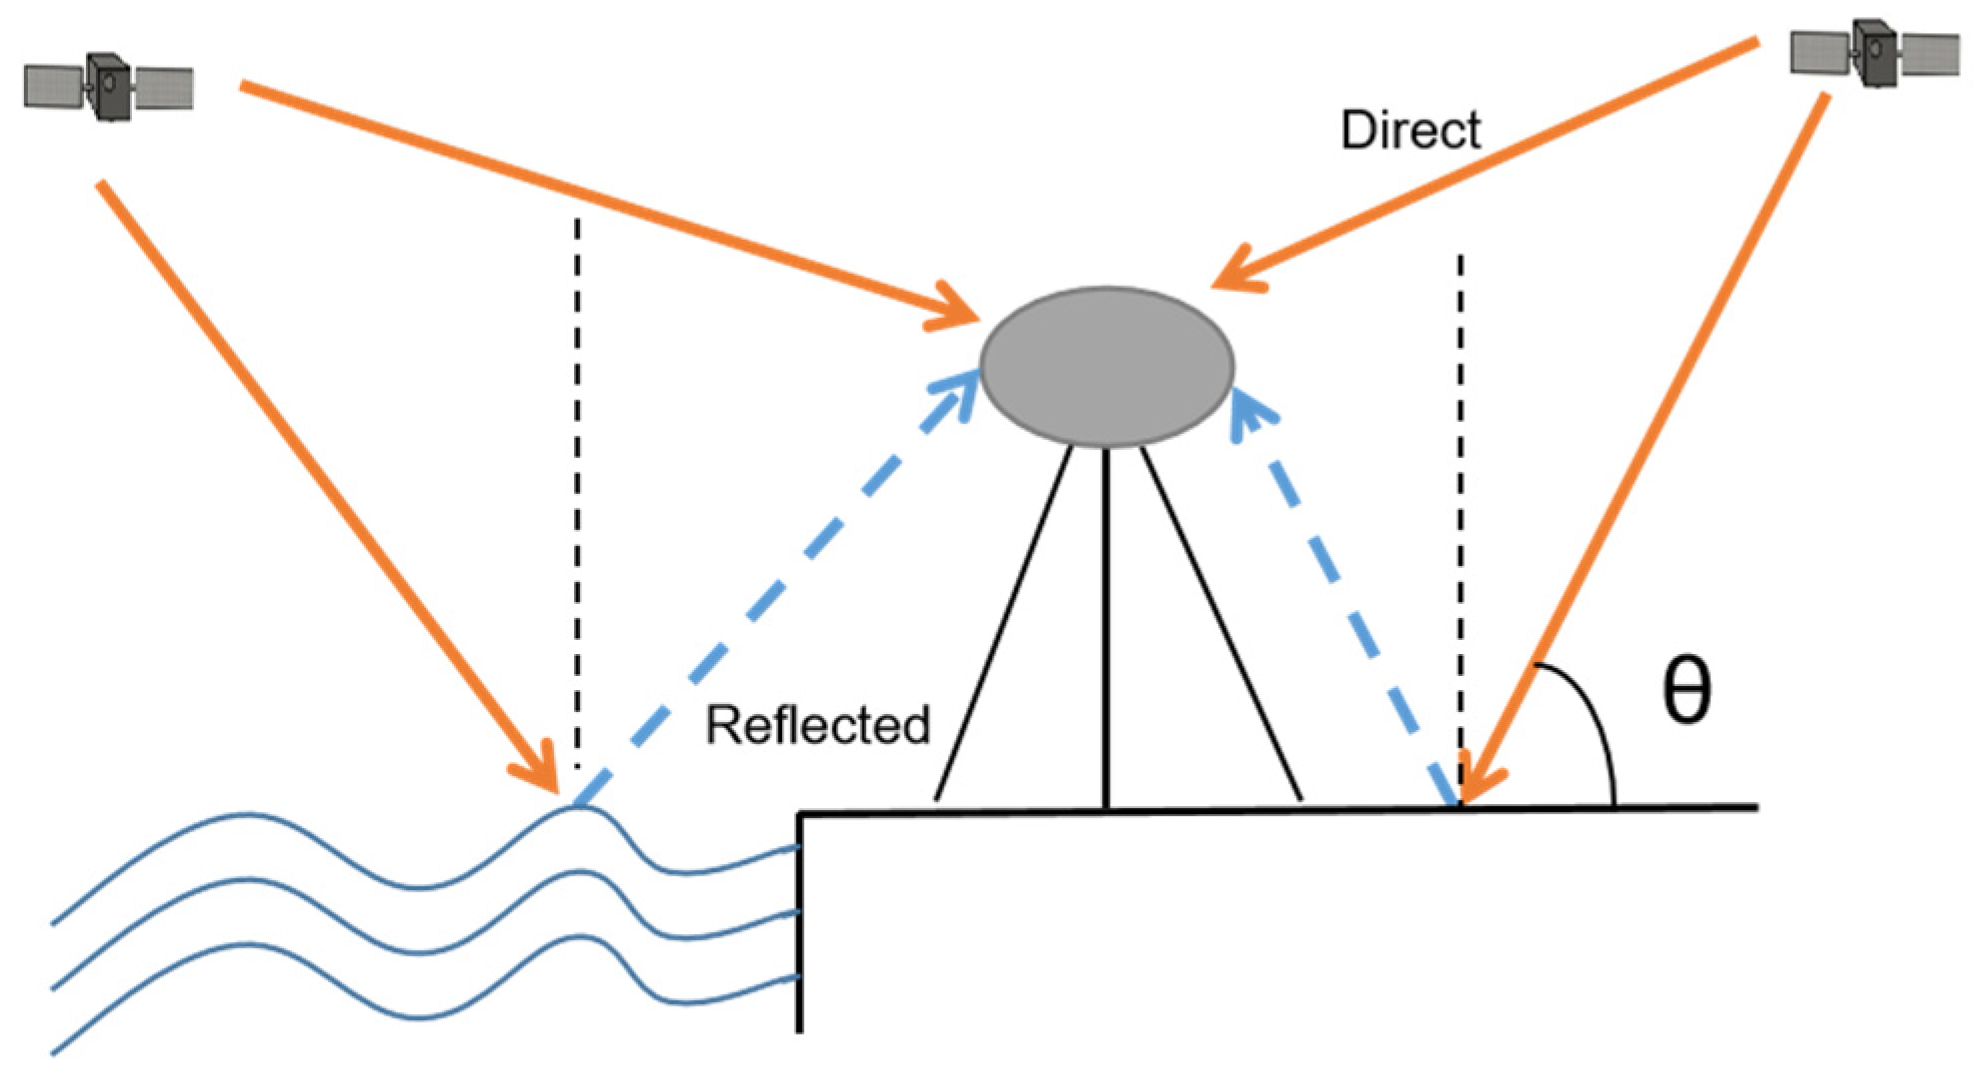
A geodetic-quality GNSS receiver is typically installed as shown in Figure 1. In the ground-based case, due to the reflections from the surrounding environment (sea surface, soil surface, etc.), superimposition at the antenna will produce a relatively stable interference signal, and the interference phenomenon is more obvious under the low elevation angle of the satellite. The interference signal SNR received by the antenna can be given by:
where Ad and Am are the amplitude of the direct and reflected signal, respectively; φ is the phase difference between the direct and reflected signals.
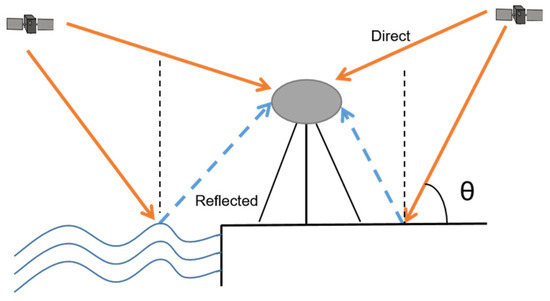
Figure 1.
Schematic diagram of GNSS reflected signal.
Note that the SNR series recorded by a GNSS receiver are typically expressed on a logarithmic scale in units of dB-Hz. In fact, according to Equation (1), the SNR for each satellite track is first converted from dB-Hz to a linear scale (volts/volts) through the function: . When GNSS satellite elevation angle changes, the power of the direct signal is typically much larger than the reflected signal, and the trend of SNR variation is dominated by Ad that does not contain the information about the surface environment. Therefore, direct signal components are first removed through detrending the SNR data using two-order polynomial fitting and mainly focusing on analyzing the reflected signal components [11].
Initial studies characterized the SNR reflection component using the following Equation (2) [9]:
where h denotes the priori reflector height, which is generally replaced by the median of the high reflectance series calculated by Lomb-Scargle periodogram; θ denotes the elevation angle of the satellite; λ refers to the wavelength of the GNSS signal; A is an amplitude term; and φ is a phase offset.
Currently, the characteristic parameters such as amplitude and phase offset in the Equation (2) can be obtained by using the principle of a nonlinear least square fitting algorithm. According to the strong correlation between phase offset and soil moisture, the corresponding unary linear regression statistical model can be given by:
where y refers to the ground truth soil moisture values and a and b are the fitting coefficients.
In summary, the above explanation process is mainly based on GNSS single-frequency SNR data. The emergence of multi-frequency observations is conducive to further improving the retrieval accuracy of soil moisture, so it is necessary to carry out multi-frequency SNR data fusion research.
2.2. An Improved Method
2.2.1. Multi-Frequency Fusion Retrieval Procedure
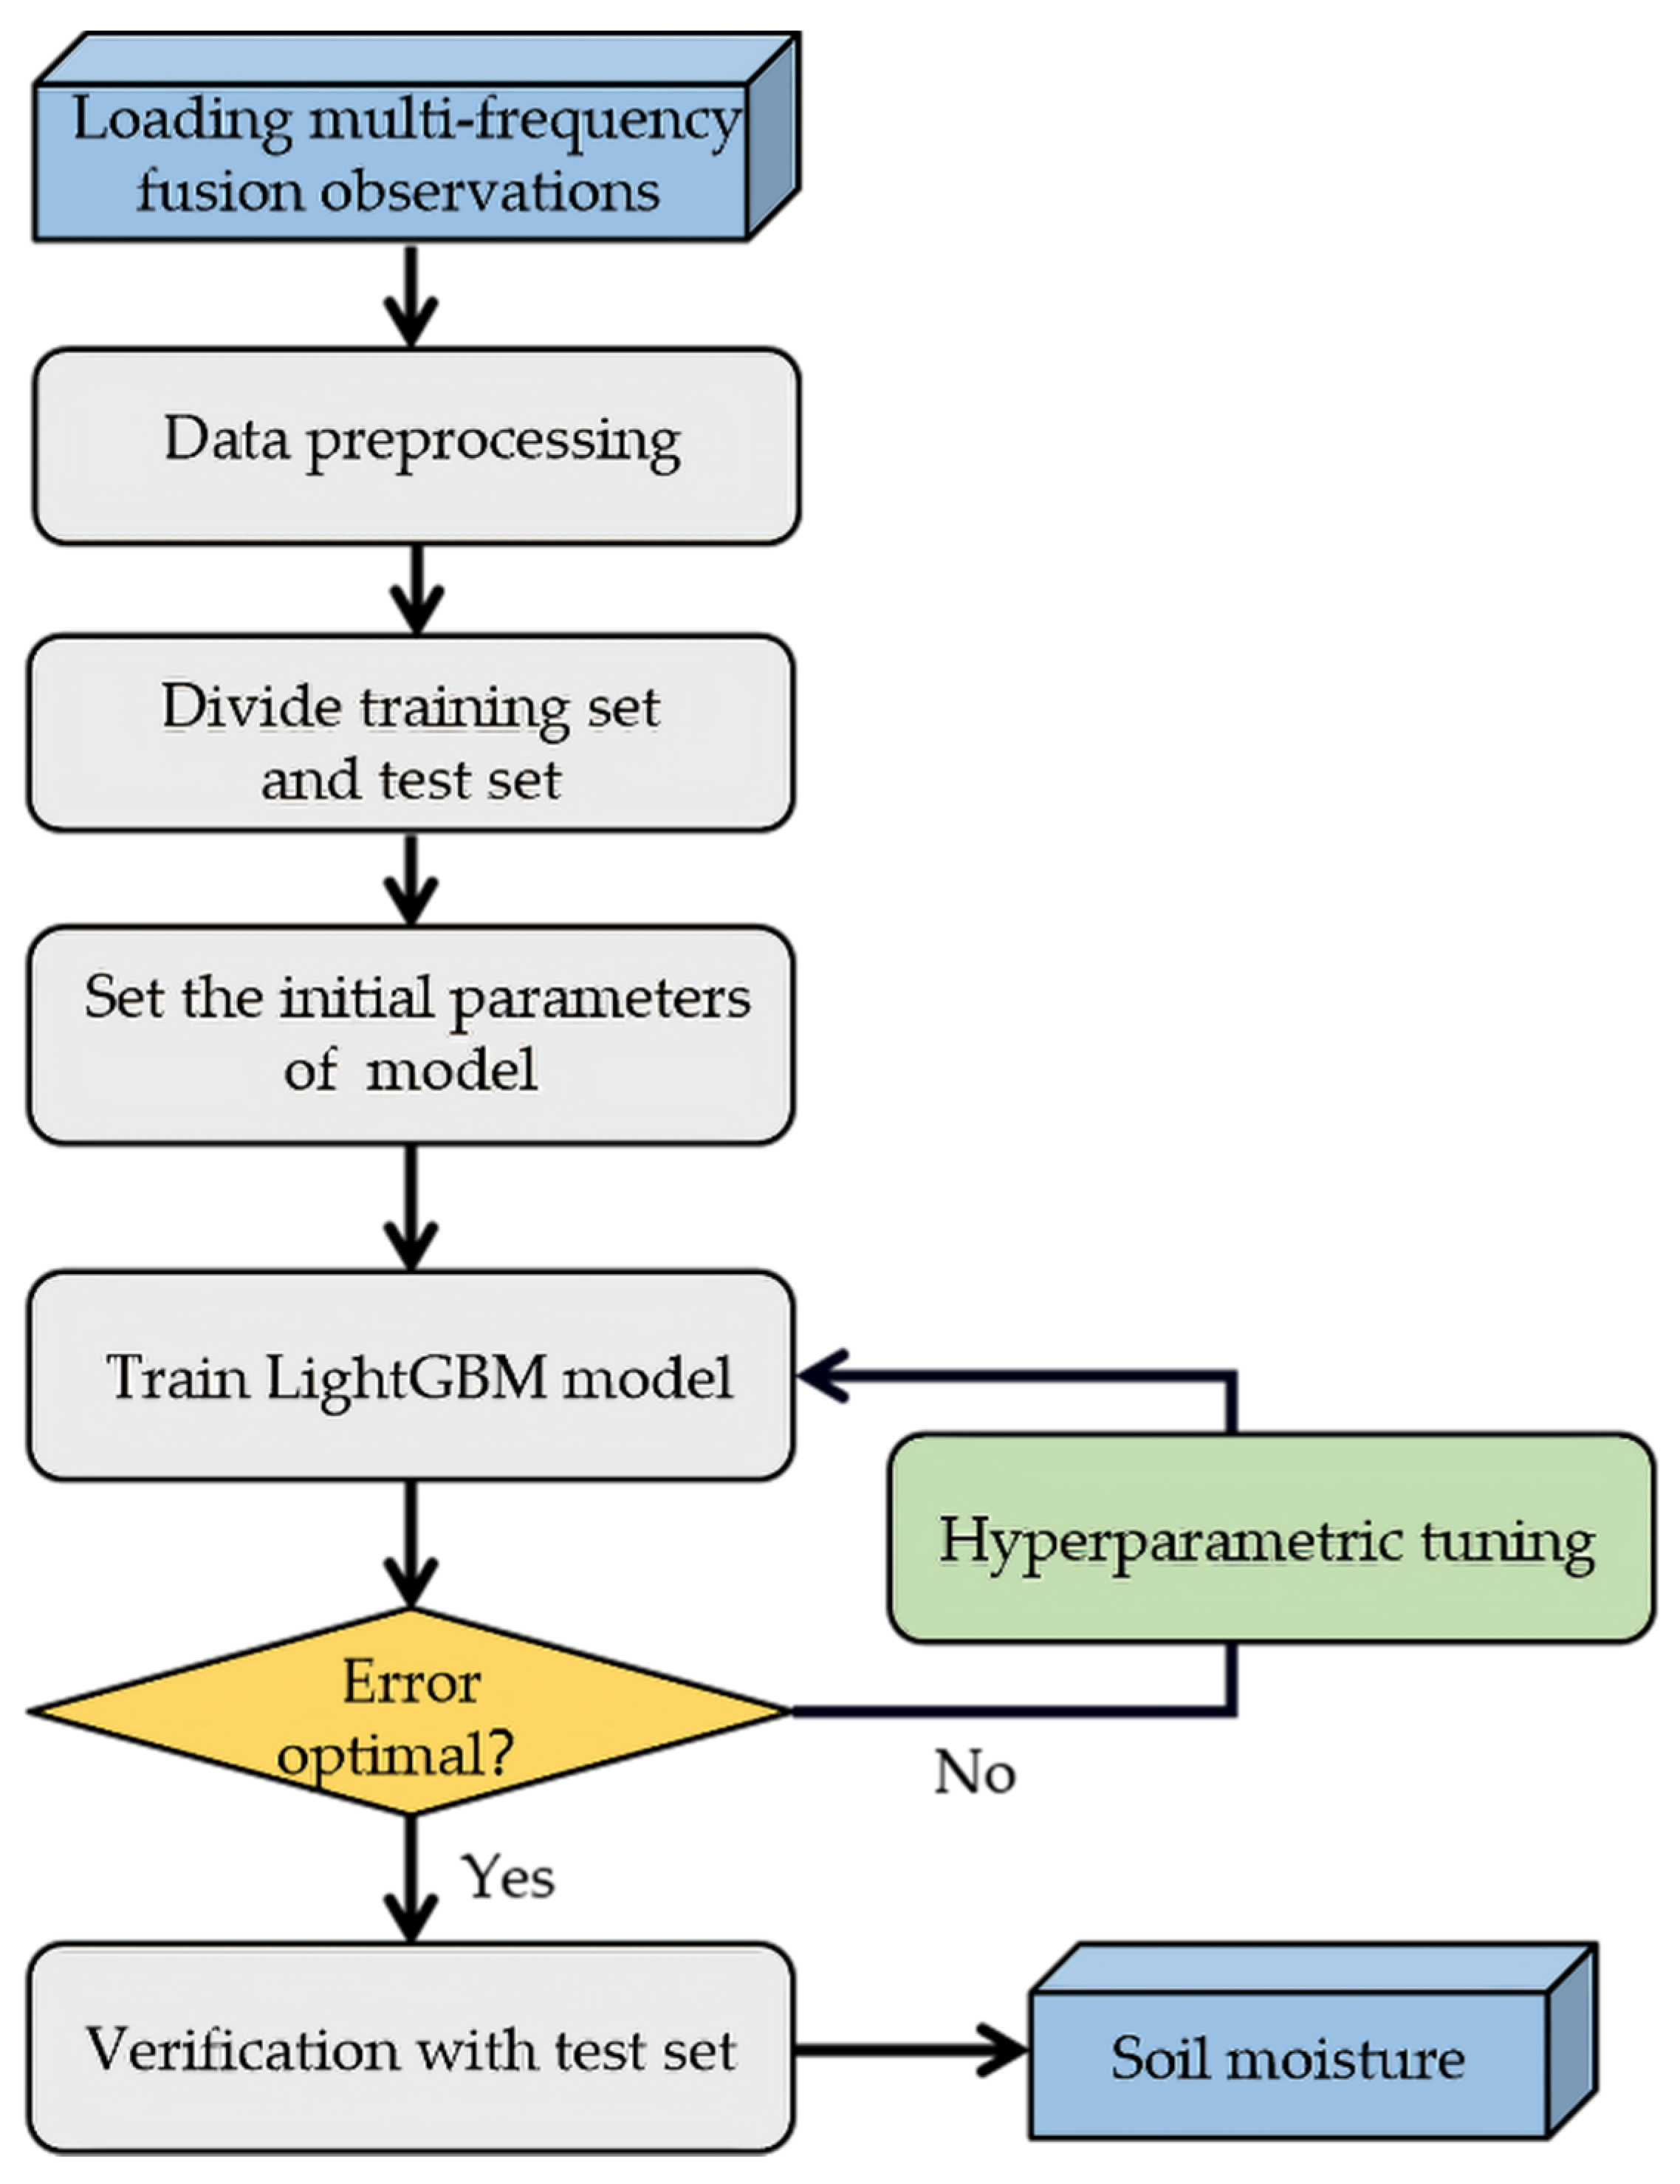
Specifically, the algorithm procedure is shown in Figure 2. The method proposed by Larson was used to calculate the phase offset and amplitude of SNR data within low elevation angles in the range 5°~25°. In order to reduce the complexity of data selection and extract the major feature components, Section 2.2.2. describes the use of principal component analysis (PCA) to cluster the phase offset and amplitude data of different tracks within a 15° sliding window of azimuths. More importantly, to make full use of the complementarity between different frequencies and improve inversion accuracy, the weights are calculated to fuse multi-frequency feature observations in Section 2.2.3. Then the data set is divided into the training set and test set at a ratio of 4:1. With the fusion feature observations based on the proposed method as an input and the ground soil moisture as an output, the retrieval model based on Light Gradient Boosting Machine (LightGBM) is established in Section 2.2.4. Eventually, this model is compared with the multi-satellite unary linear regression model and another model with single-frequency original phase offset series as input, based on LightGBM.
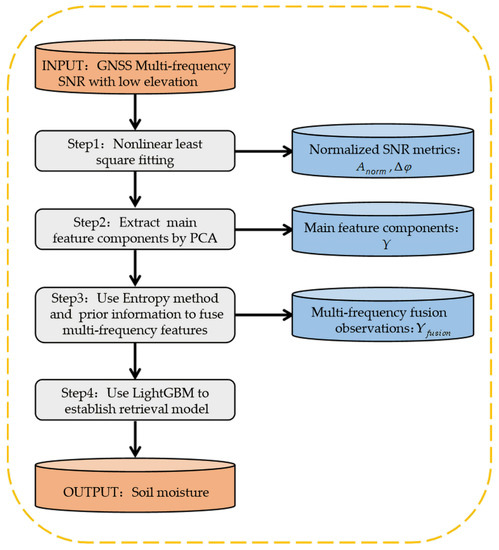
Figure 2.
The flow chart of algorithm retrieval process.
2.2.2. Use PCA to Extract Main Feature Components of Single-Frequency
According to the previous studies [21], the phase offset and amplitude calculated by Equation (2) are different due to many factors, such as the diversity of surface environment around the receiver and satellite transmission power. Therefore, the correlation between the metrics time series of the ascending or descending tracks of different satellites and the soil moisture is quite different.
PCA is a widely used data dimensionality reduction method [32]. The main idea is to map n-dimensional features to k-dimensions (k < n). New features are linear combinations of old features. These linear combinations maximize the sample variance and make the new k features as uncorrelated as possible. On the basis of retaining the major feature components, the noise and unimportant features are reduced [33].
PCA is used to map the single-frequency phase offset and amplitude series within 15° azimuths to one-dimension in this research, so as to extract its main feature components. The normalized phase offset φ and amplitude A time series can be expressed as:
The covariance matrix is calculated:
Then, the eigenvalue decomposition method is used to find the eigenvalue and eigenvectors of the covariance matrix. The eigenvalues are sorted to select the largest one. Its corresponding eigenvectors are used as row vectors to form the eigenvector matrix P.
Eventually, SNR feature series are converted into a new space constructed by a feature vector, which are the main feature components after clustering:
2.2.3. Use Entropy Method and Priori Information to Fuse Multi-Frequency Features
The entropy method is an objective weighting method that draws on the idea of information entropy. According to previous research [34], information entropy can quantitatively measure the uncertainty of information, so the entropy method determines the weight of the index according to the information entropy of the index and the influence of the difference degree of the index on the entire system. In order to obtain the weight, the proportions of characteristic parameters are first calculated in the series [35]:
Then, the index entropy and redundancy are calculated:
Finally, the weight can be expressed as:
where k refers to the number of frequency; n indicates the length of the data; and i is the number of available arc segments.
It is worth noting that although the entropy method avoids the deviation caused by human factors, due to ignoring the importance of the index itself, sometimes the determined index weight will be far from the expected result. Therefore, a priori error and correlation coefficient are introduced to comprehensively determine the weight.
First, the cumulative mean square error and (R2)k are calculated according to the fused characteristic parameters from each frequency:
where is the ground truth soil moisture; is the soil moisture calculated from the fused characteristic parameters; indicates the daily mean square error. The weights obtained from the prior information can be expressed as:
Based on these, the final fusion weight is defined as:
Therefore, the multi-frequency fusion observations can be expressed as:
2.2.4. Use LightGBM to Establish a Retrieval Model
LightGBM is a fast and high-performance distributed gradient boosting framework, proposed by Microsoft in 2015 [36]. It is a variant of the Gradient Boosting Decision Tree (GBDT) model, and the basic principle is still a boosting tree algorithm. The idea of gradient boosting is to iterate variables at one time, add sub models one by one in the iterative process, and ensure that the loss function decreases continuously. It assumes that fi(x) is a sub model and the composite model is defined as:
The loss function is L[FM (x), y]. Every time a new sub model is added, the loss function will gradually decrease towards the variable with the second highest information content:
In addition, LightGBM adds Gradient-based One-Side Sampling (GOSS) and Exclusive Feature Bundling (EFB) to reduce the time complexity of processing samples. GOSS is a sampling algorithm, which can achieve a good balance with the accuracy of a decision tree while reducing the number of data. EFB realizes the binding of mutually exclusive features to reduce the number of features [37]. Through this, the training speed can be improved without losing its accuracy. In addition, the LightGBM algorithm selects ‘Leaf-wise’ leaf growth strategy with depth restriction. This leaf node expansion method can reduce the training error and get better accuracy [38]. Simultaneously, the performance of LightGBM has been significantly improved by technology optimizations such as support for parallel learning, support of the histogram algorithm, and so on.
Due to the great performance and generalization capability of LightGBM, using multi-frequency fusion observations as input and in situ soil moisture as output, soil moisture inversion is regarded as a nonlinear regression problem to establish a retrieval model. Figure 3 shows the framework of the retrieval model.

Figure 3.
The framework of retrieval model.
3. Experiments
3.1. PBO H2O Network Experiments
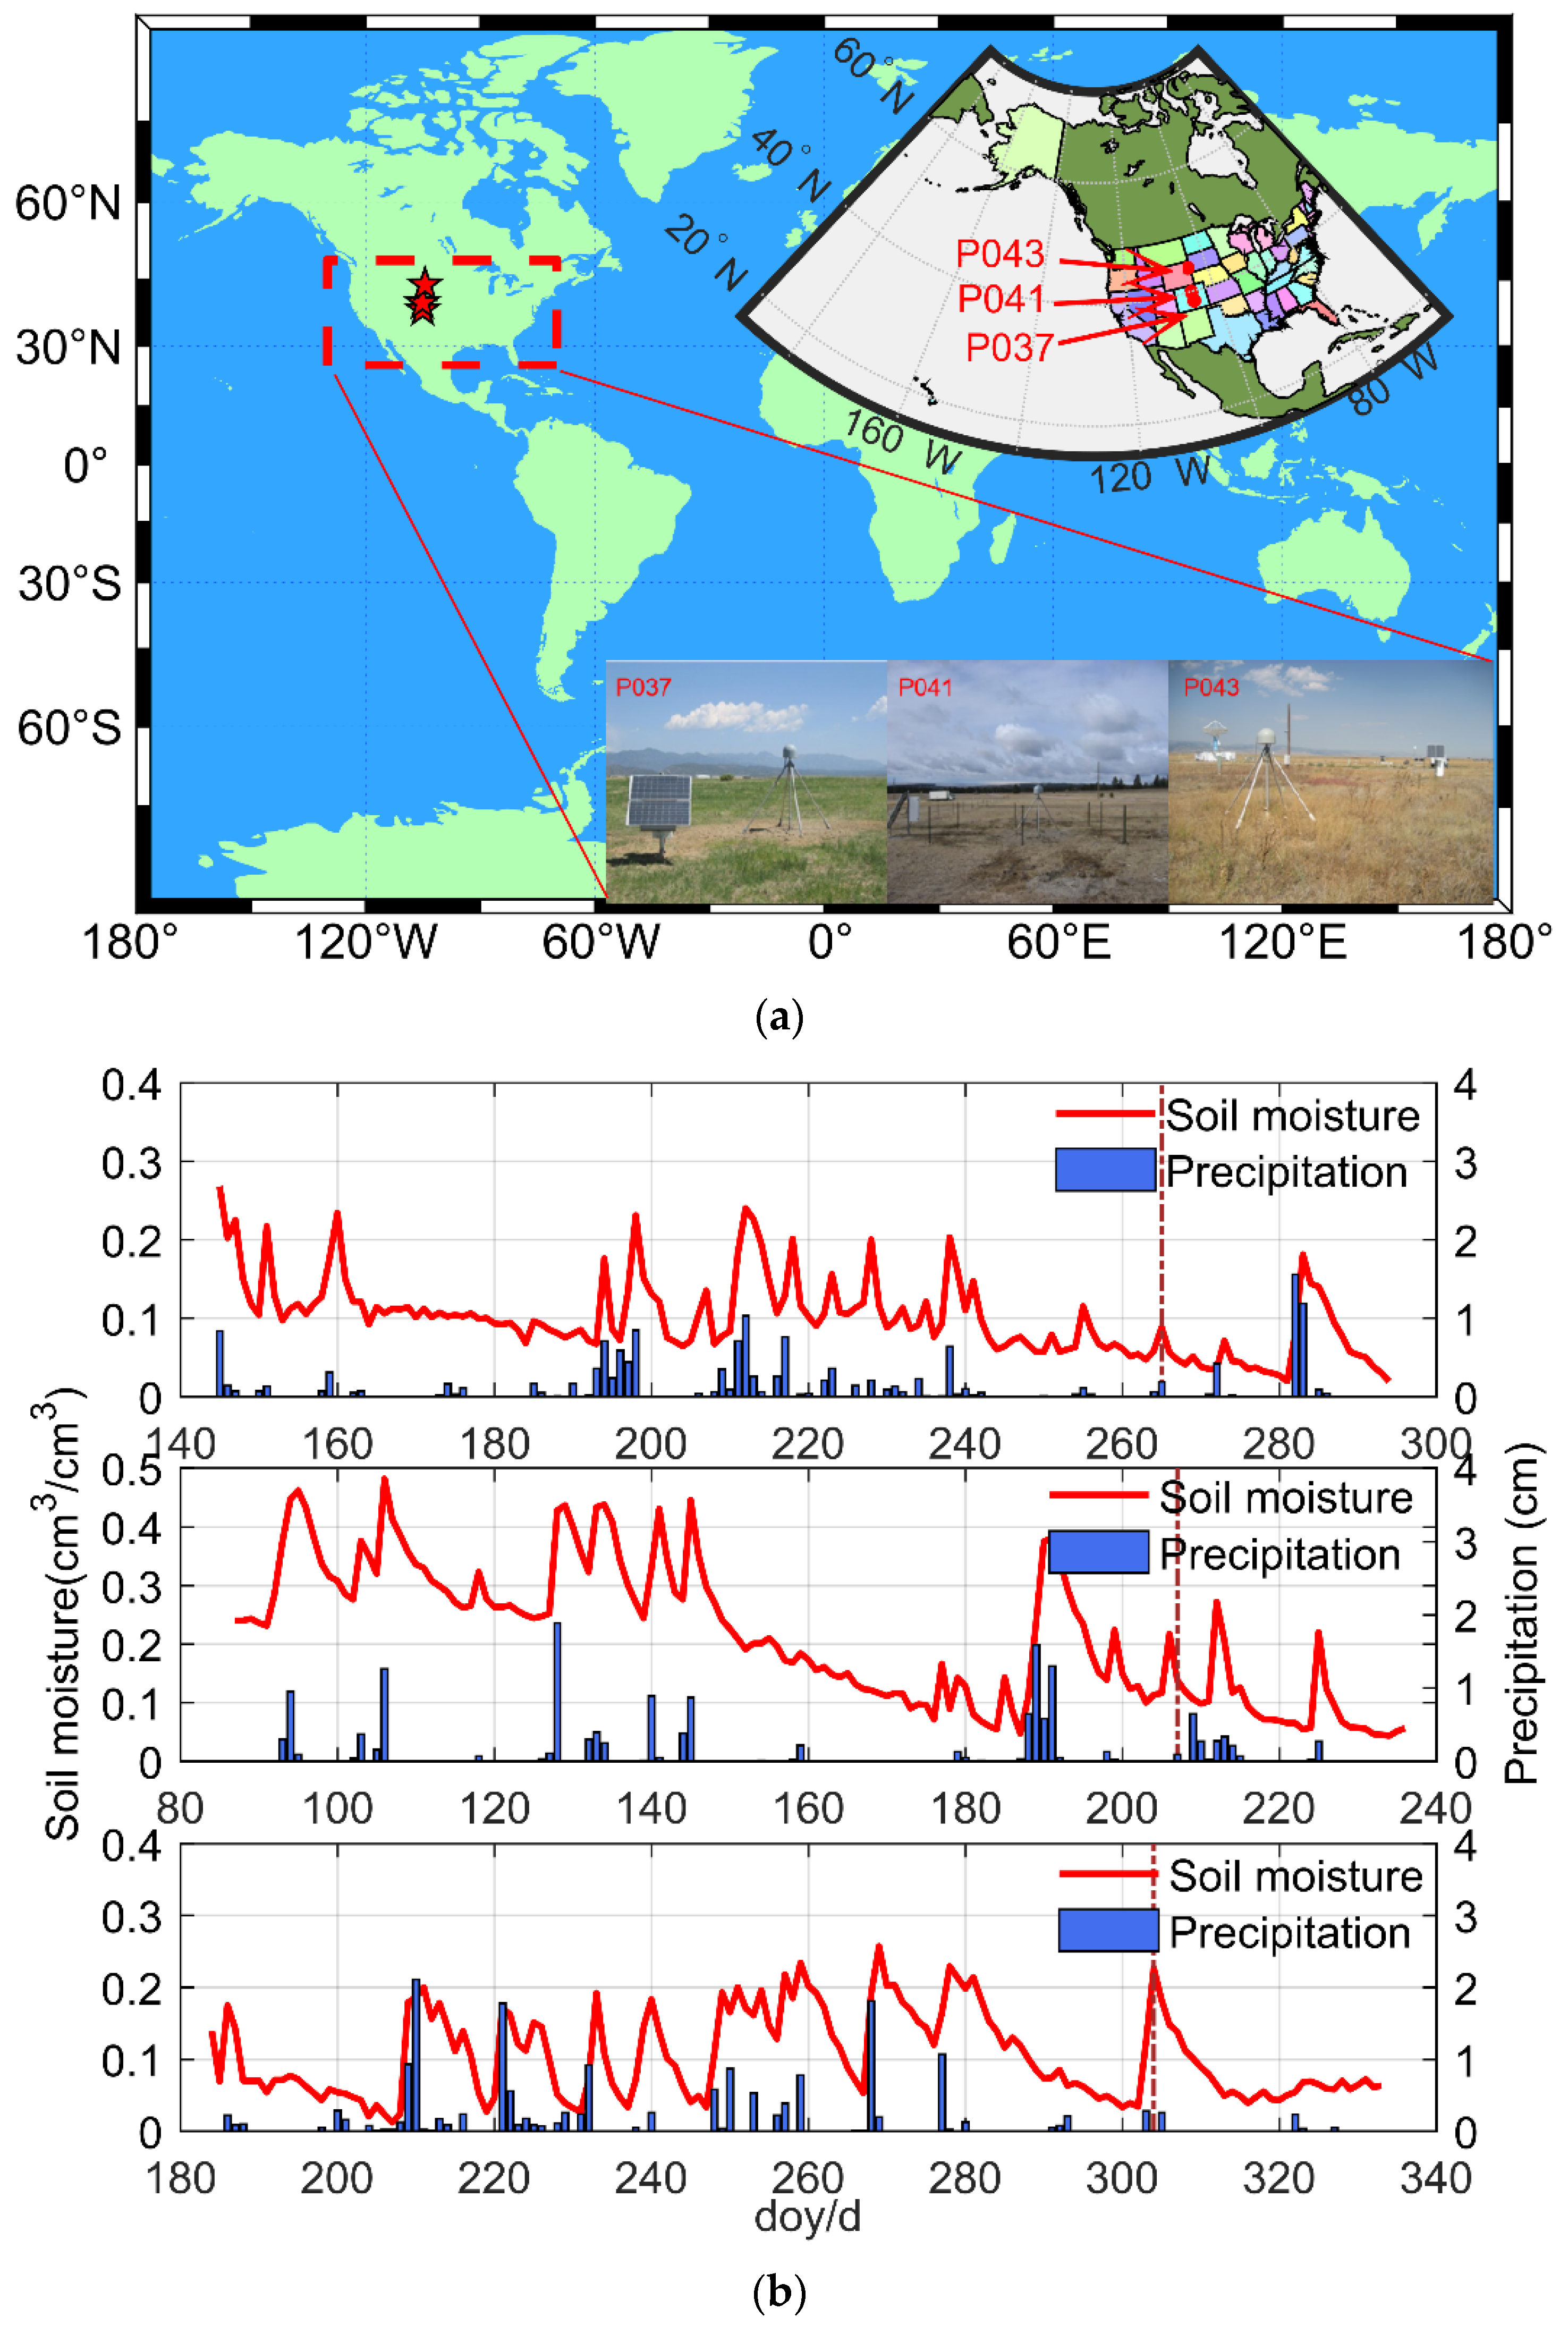
The PBO H2O networks were jointly funded by the National Science Foundation (NSF) and National Aeronautics and Space Administration (NASA). The networks were managed and operated by the NSF. It was mainly used to analyze topographical changes caused by crustal movements and volcanic eruptions. More than 1000 geodetic-quality receivers have been installed in the PBO H2O networks. Based on selection criteria of wide field of view, insignificant vegetation variation and flat terrain, data from three PBO H2O network stations (http://www.unavco.org/ (accessed on 20 April 2021)) are used for validation. Figure 4a indicates the distribution and surrounding environment of three GNSS stations: P037, P041, and P043. These stations can provide users with L1 and L2 dual-frequency observations at a sampling rate of 15 Hz. The change in soil moisture and rainfall at all stations during the experiment is shown in Figure 4b. The rainfall is dominated by products from the North American Land Data Assimilation System (NLDAS). Therefore, we chose these stations for our experimental studies. Meanwhile, the specific time and length of data we used were recorded (see Table 1).

Figure 4.
(a) The distribution and surrounding environment of P037, P041, P043 stations; (b) the soil moisture-rainfall diagram during the experimental period.

Table 1.
Stations data usage.
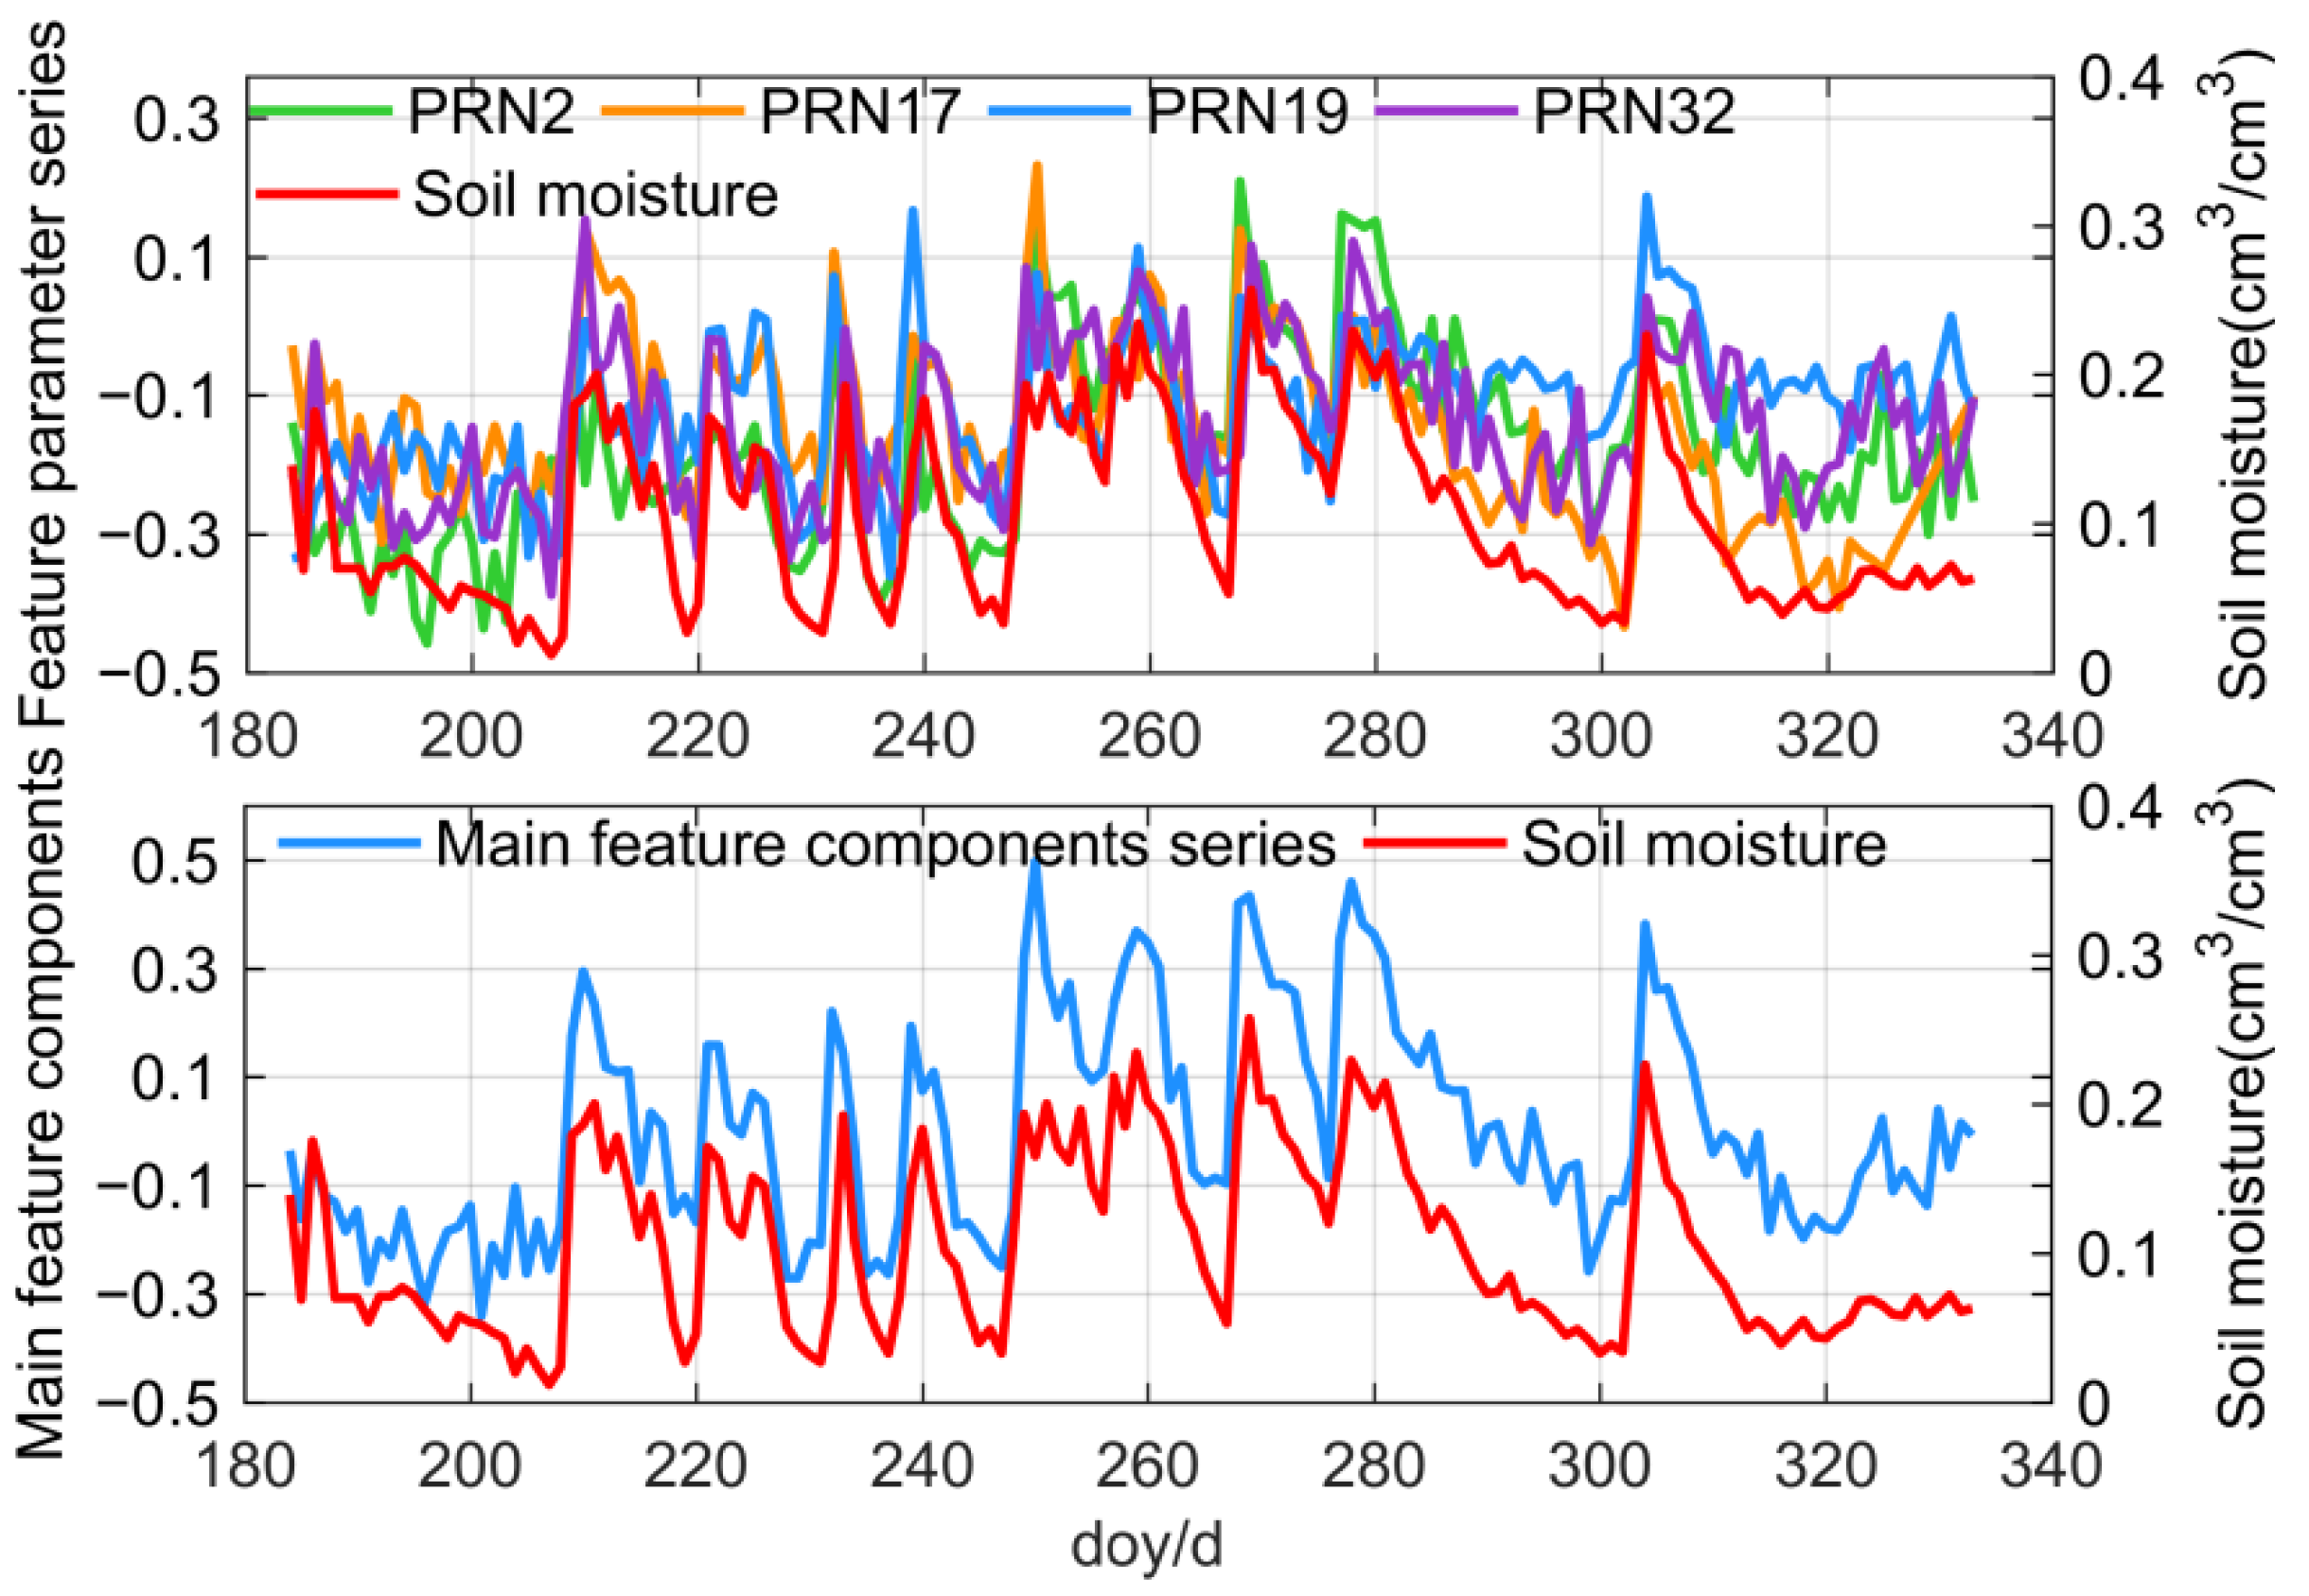
First, according to Section 2.2.2, PCA is adopted to cluster the tracks whose azimuths are within 15°. An example using station P043 is depicted in Figure 5. Due to the different transmitting power of GNSS satellites, the reflected signals recorded by the receiver are not the same. Therefore, the amplitudes and phase offsets calculated by Equation (2) have large differences for different satellites. As shown, for PRN32 and PRN17 (Figure 5, top), the correlation coefficient with the ground truth values is only 0.3723 and 0.6557, showing a large deviation, while after track clustering the correlation coefficient between the main feature components series (Figure 5, bottom) and in situ soil moisture is increased to 0.7887, which further extracts the main information of feature parameters.
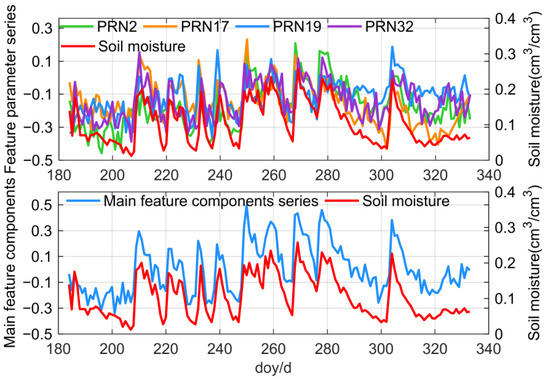
Figure 5.
Clustering results using station P043.
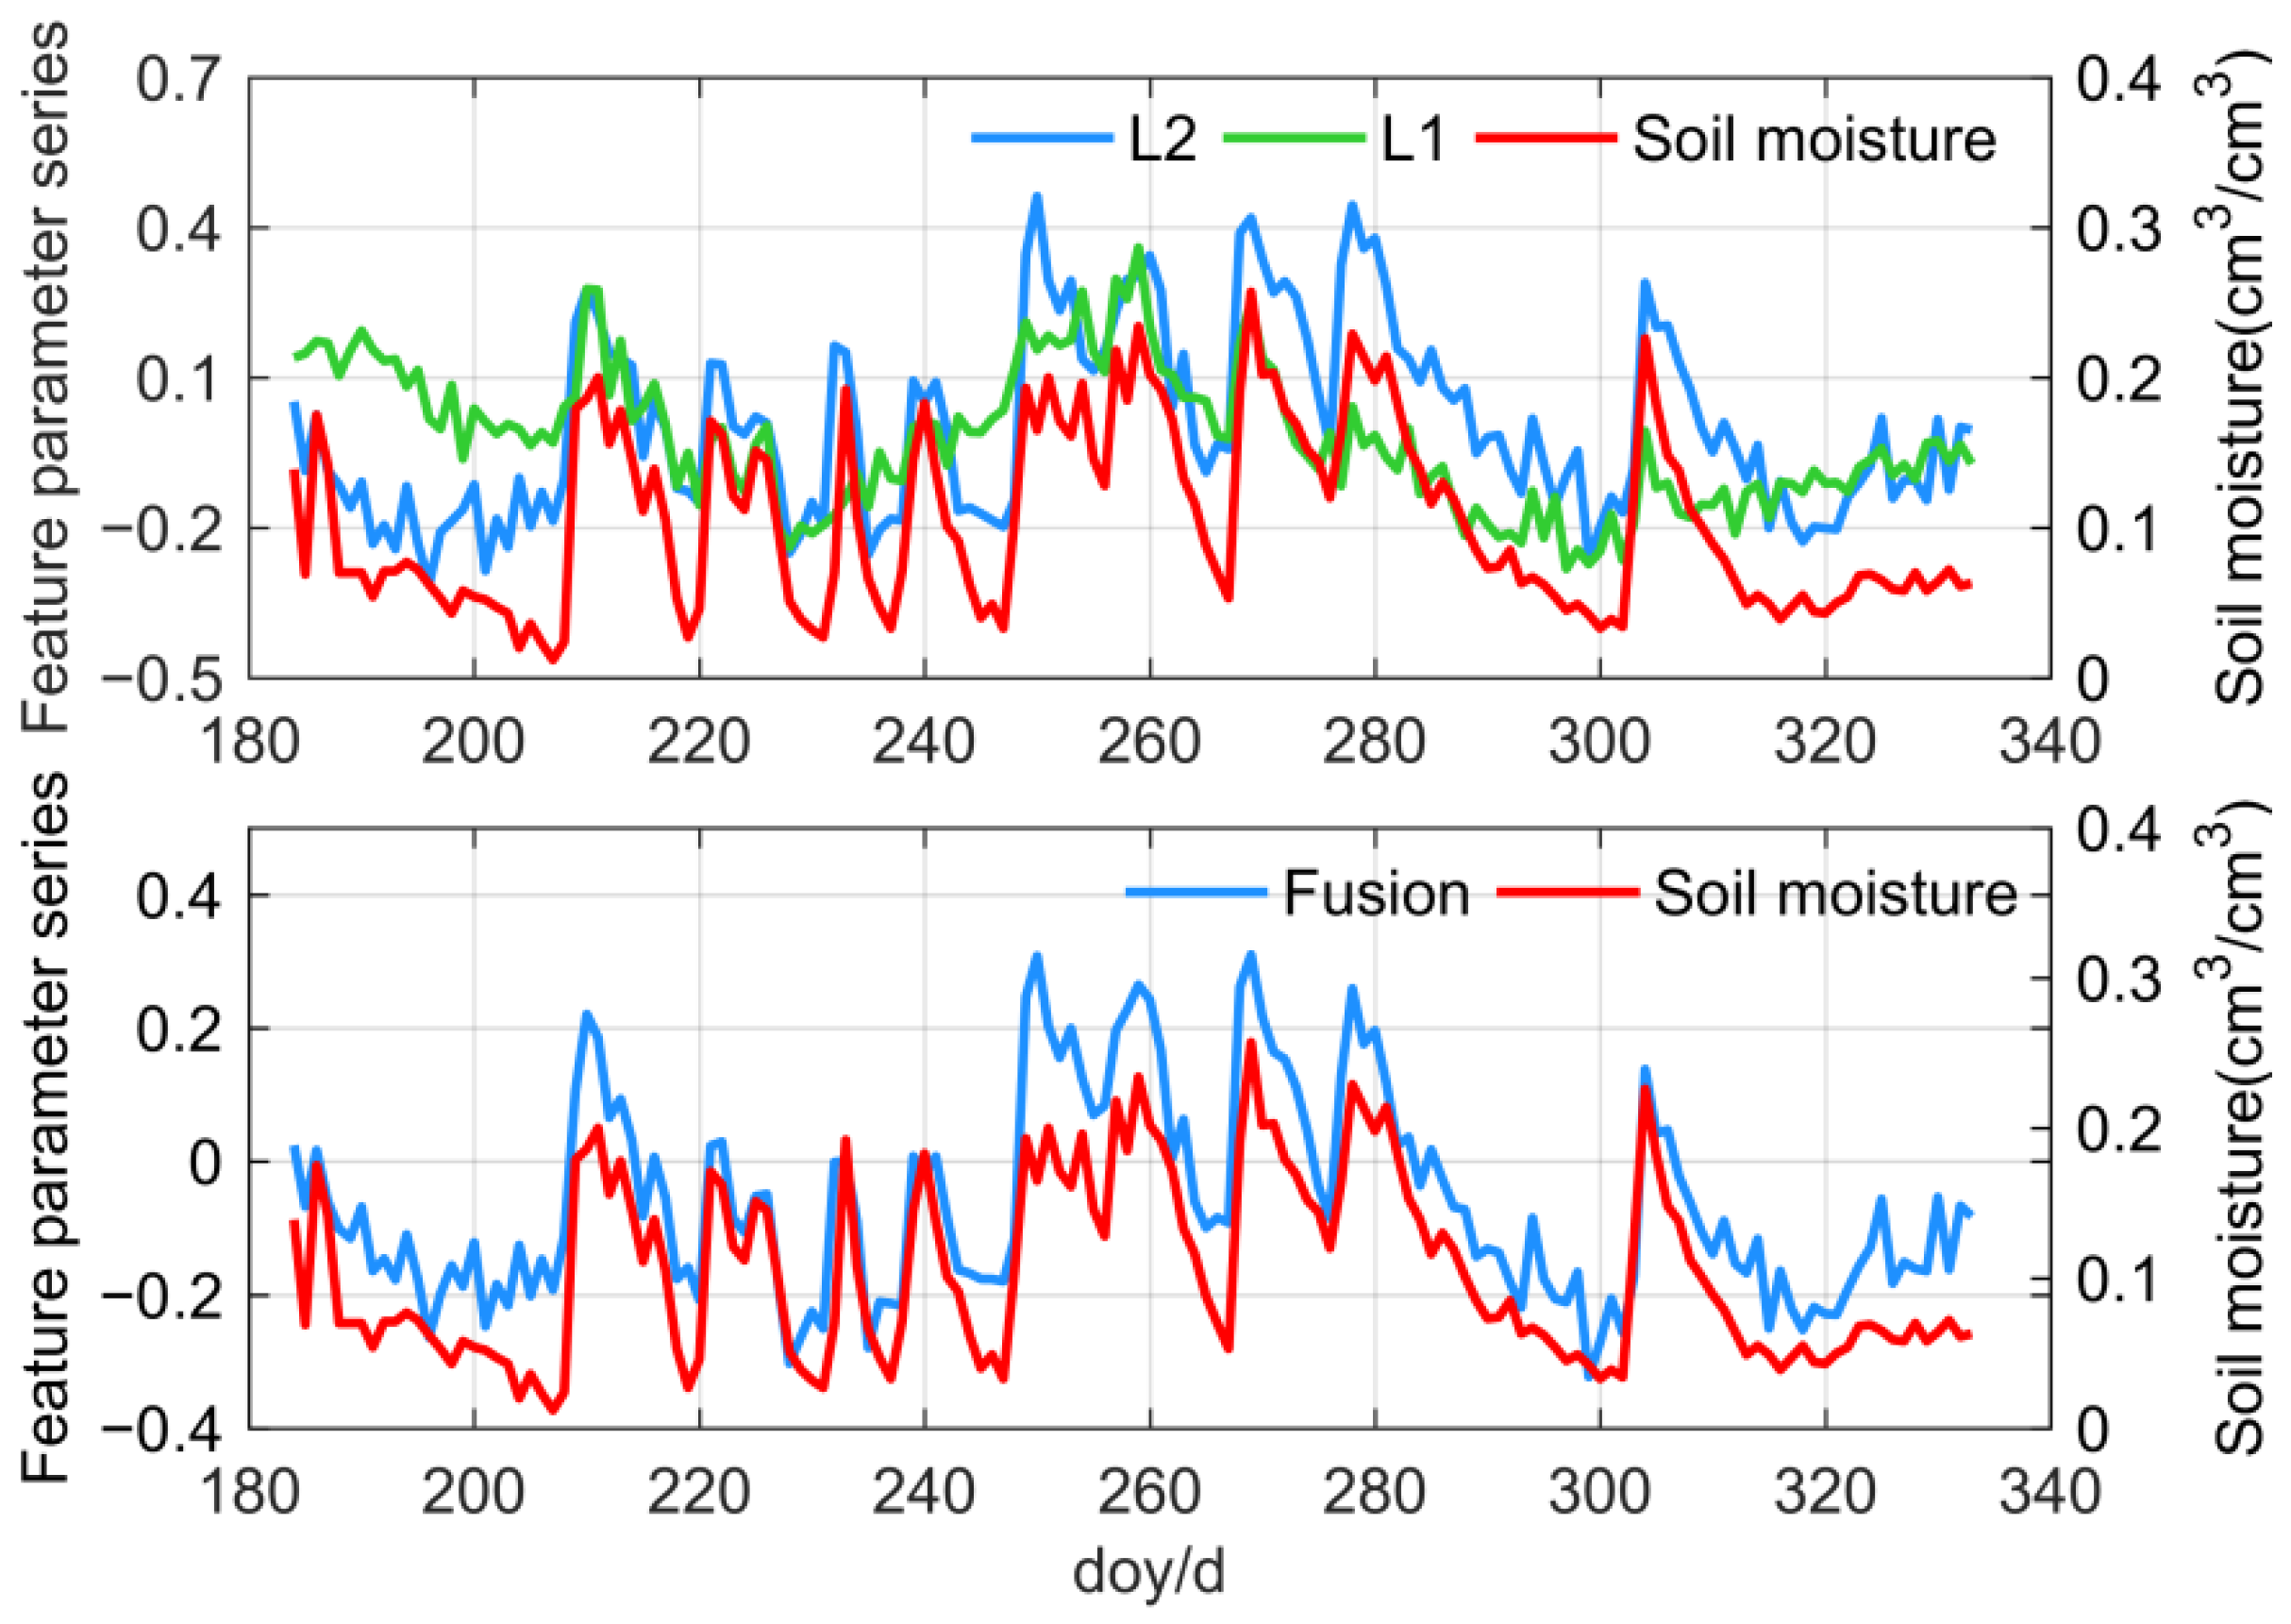
To take full advantage of the complementarity between different frequencies, the weights are calculated by Equations (7)–(16) to fuse multi-frequency feature observations. Figure 6 gives an example of fusion results using station P043. It should be noted that there are relatively large differences between the L1 and L2 frequency, for which the correlation coefficient is 0.3061 and 0.7887, respectively. The possible reason for this phenomenon is that the L1 SNR data are less precise than the L2 SNR data. Specifically, this is related to the new L2C code being more robust than the L1 C/A code and the different tracking power between the L1 and L2 signals [19], which means that the L2 SNR is more conducive to soil moisture retrieval. In contrast, the multi-frequency fusion results show a correlation coefficient of 0.8318 with respect to the ground truth soil moisture, 0.05 larger than the correlation only using the L2 frequency, thus showing that combining data from both frequencies allows a better soil moisture retrieval [27].
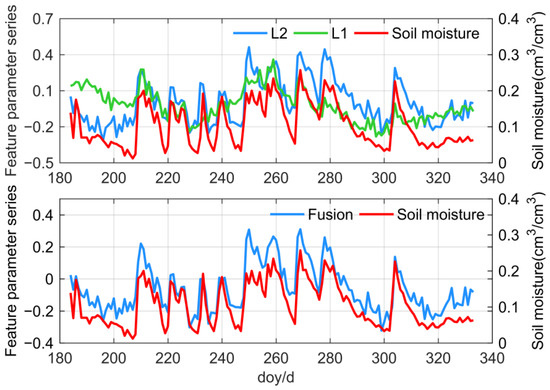
Figure 6.
Fusion results of multi-frequency feature observations.
Then, 120-day training set data are used to train the model by LightGBM and other 30-day test data are used to verify the model. The test set results are also compared with the ground truth soil moisture and results of other two models by statistical regression evaluation index. The method of modeling is consistent for different locations but model parameters are different due to the differences of surface environment and soil components around the station. Thus, the hyper parameter optimization module is used to search for the best parameters.
Figure 7 depicts an example of verification of soil moisture measurements using station P041. The ground truth soil moisture data from three depths (2.5, 7.5, and 20 cm) were collected by the University of Colorado [12], which can provide a daily average soil moisture. It can be seen from Figure 7 that all three methods can roughly reflect the changing provide a moderate accuracy with respect to the ground truth values, showing correlation coefficient of 0.9045, 0.8596, and 0.767, respectively. The retrieval values based on machine learning are in good agreement with the ground truth soil moisture, which fully proves the feasibility and accuracy of the soil moisture retrieval model using machine learning algorithms. However, both using LightGBM, the results of the proposed method are improved and fluctuation is smaller than another method using the L2 signal. Conversely, there is still a large deviation between the results of the linear regression model and ground truth values, especially during days of year (DOYs) 214–224 and 230–235.
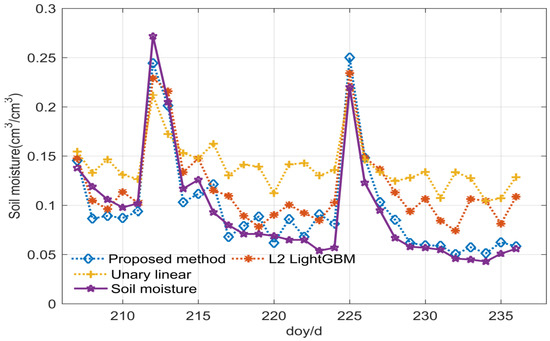
Figure 7.
Retrieval results of three methods with station P041.
3.2. Henan Experiment
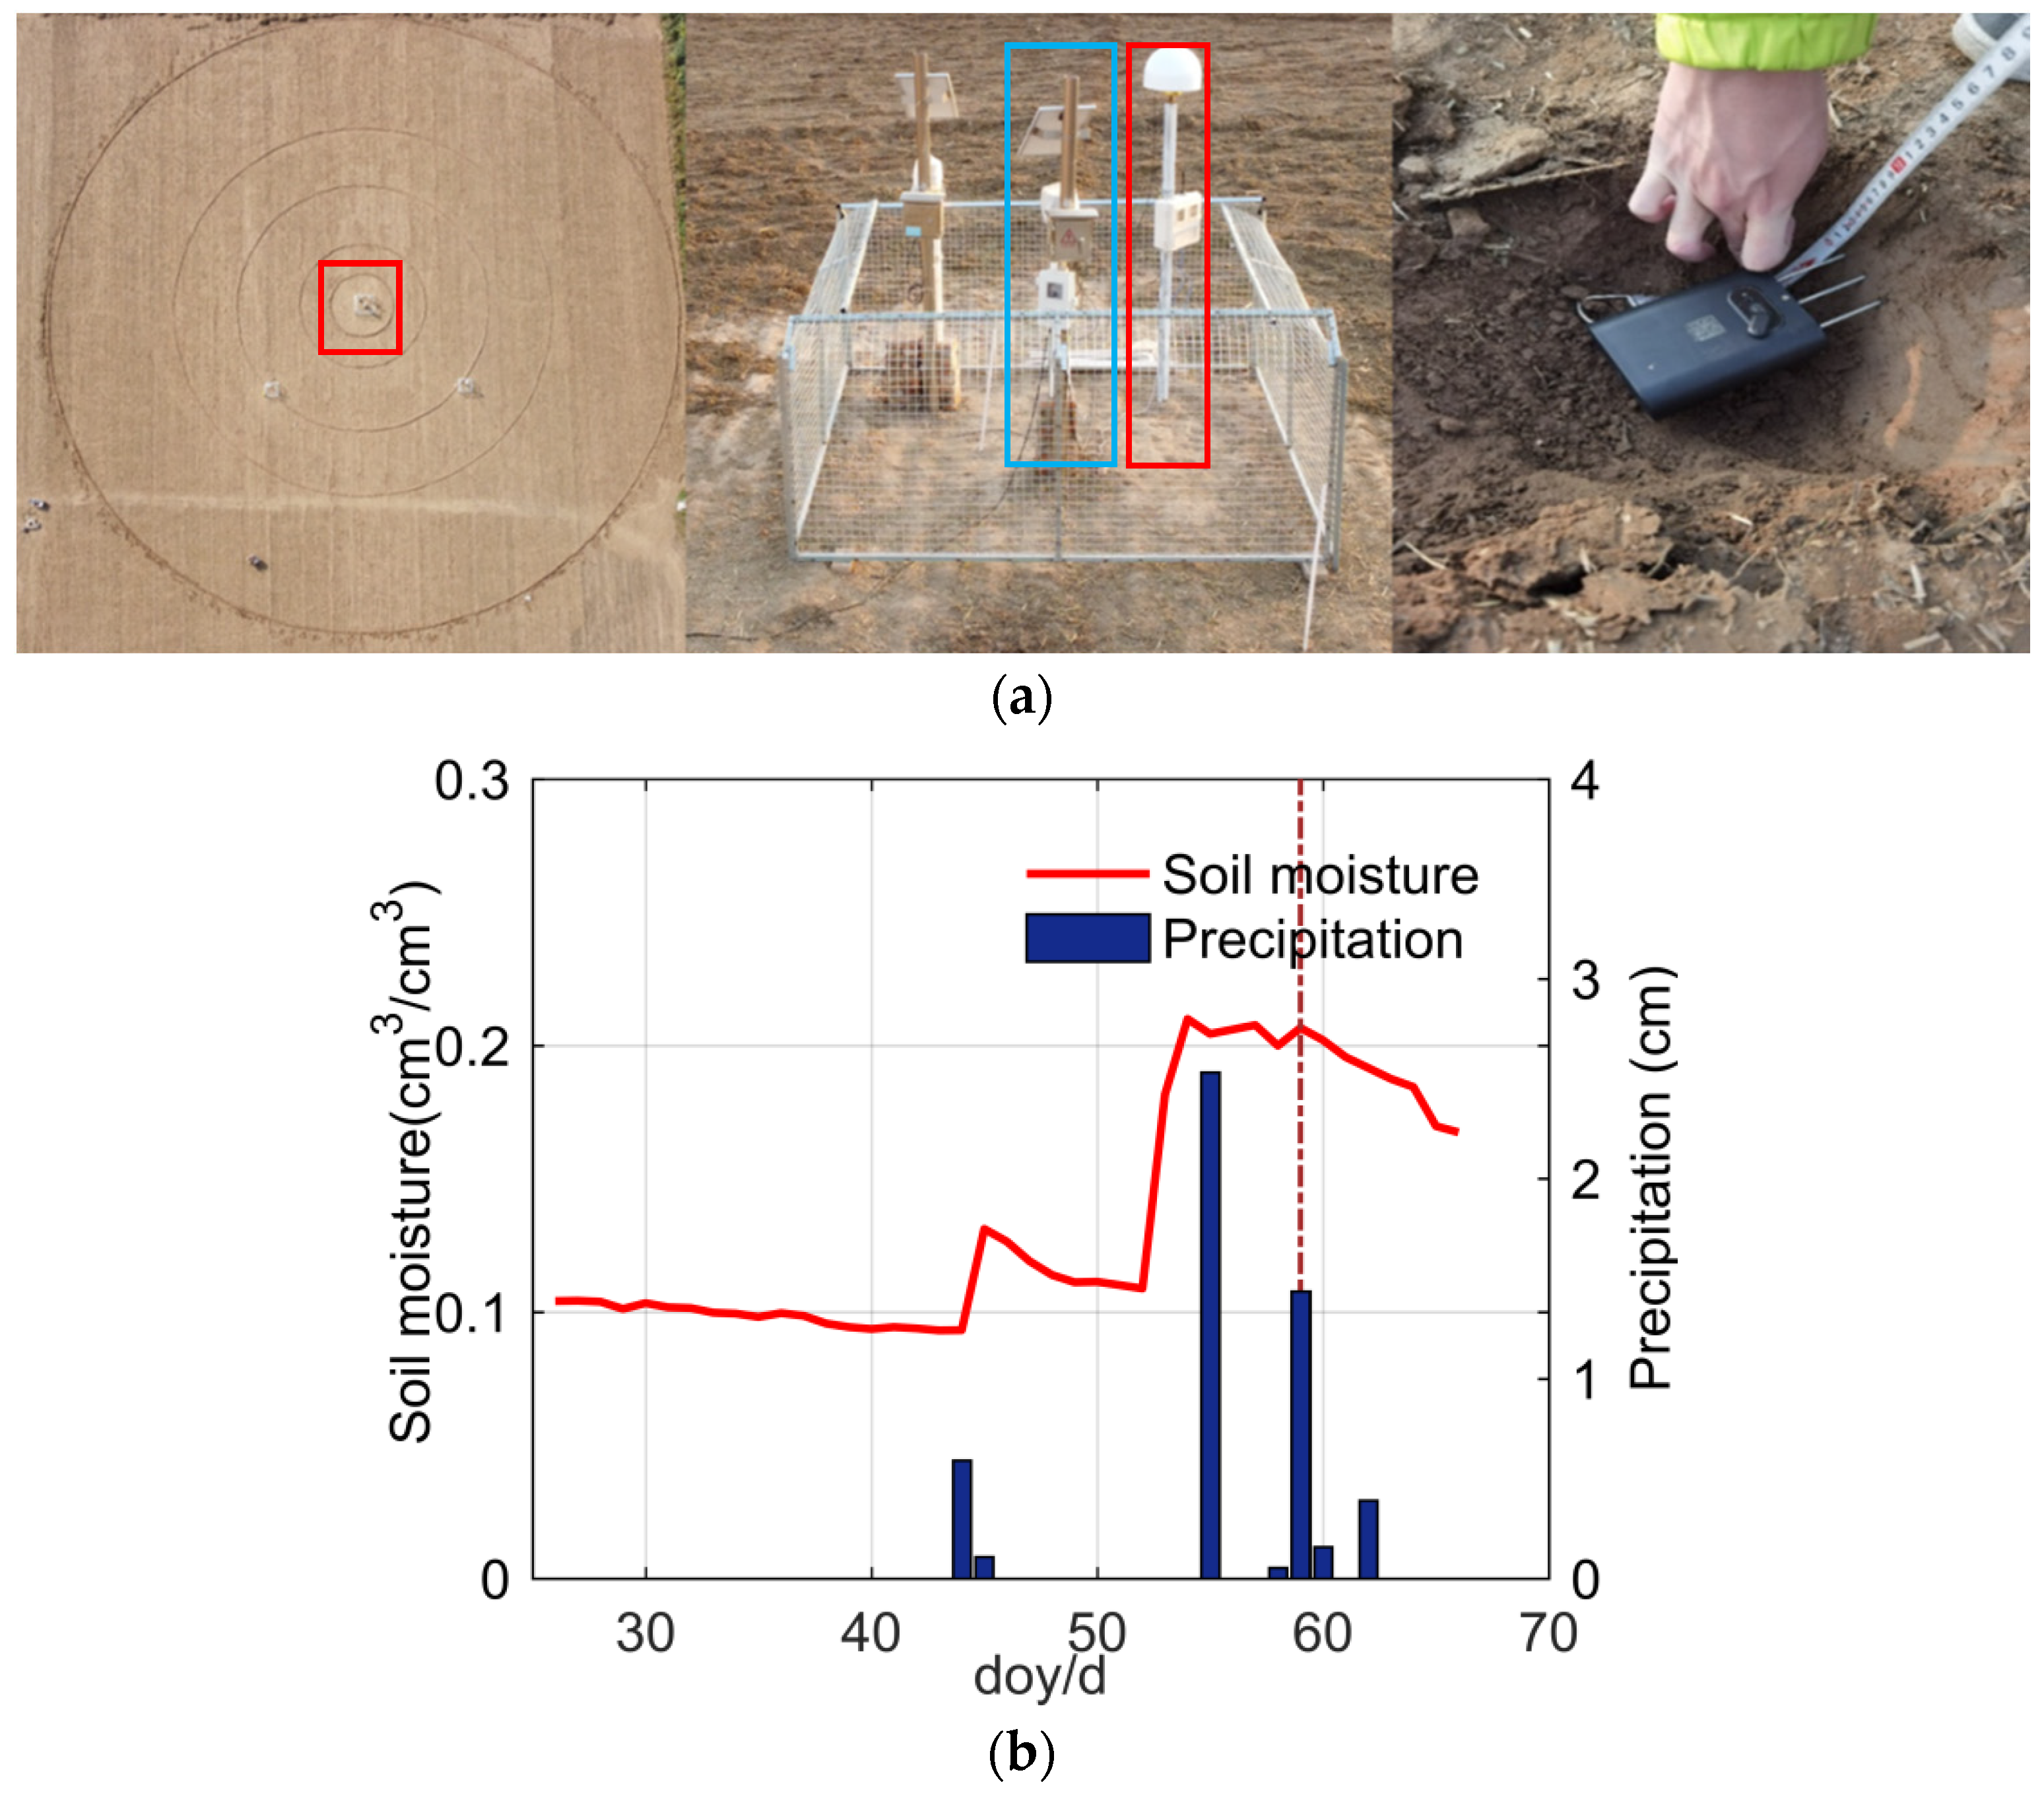
The second experiment was recently performed in Fengqiu Experimental Station for the Agro-ecology Chinese Academy of Sciences, Fengqiu County, Henan Province, China (35.019882°N, 114.547572°E), from 26 January 2021 to 7 March 2021. A Sino M300 Pro GNSS receiver and AT500 GNSS antenna were used to receive GNSS signals which contain multi-frequency signals for multi-GNSS constellations (GPS/GLONASS/Galileo/BDS). The ground soil moisture was measured by a frequency domain reflectometry (FDR) sensor installed at 5 cm depth, which can provide a measured soil moisture value every hour. Figure 8a indicates the station’s surrounding environment and corresponding instruments and equipment. The ground soil moisture and rainfall were shown in Figure 8b, which showed dry and wet variation; such fluctuation could better verify the sensitivity of the proposed method in this research. It is worth noting that there was a snowfall on DOY 56, which led to a significant change of reflection height, so we excluded data for that day.
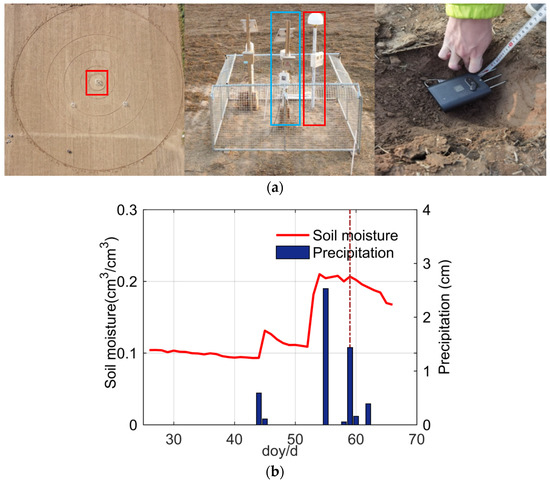
Figure 8.
(a) Instrument and equipment (mid), surrounding environment (left), and soil moisture sensor (right). The red box represents the antenna and receiver; the blue box represents power supply equipment. (b) The soil moisture-rainfall diagram during the experimental period.
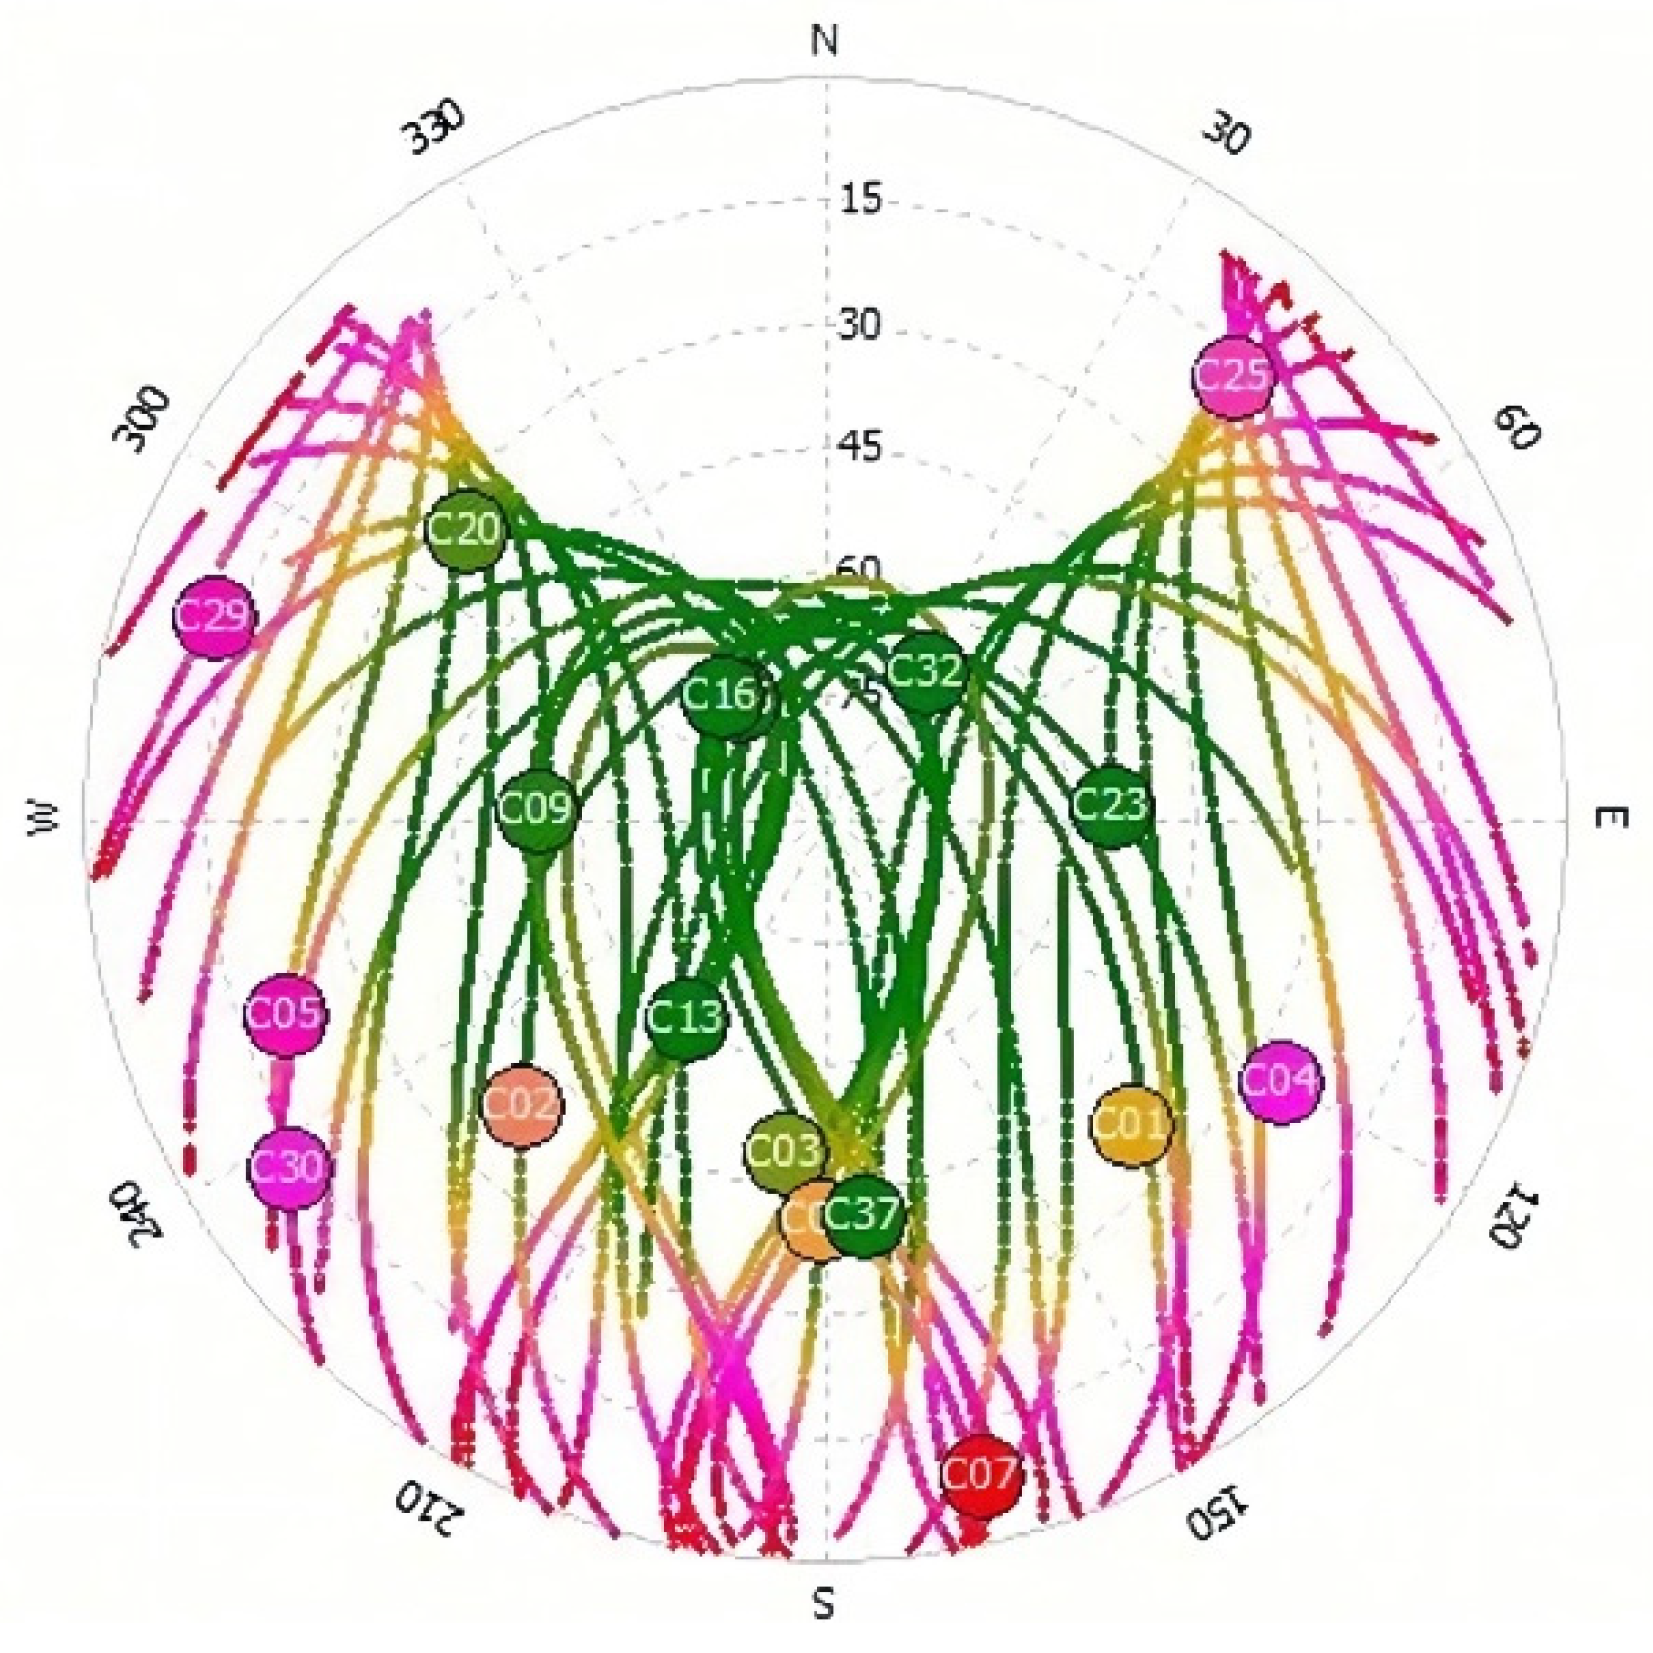
Note that the difference between the previous experiments was that BDS B1-2, B2b, and B3 signals (S2I, S6I, S7X) [39] were chosen to verify the applicability of soil moisture retrieval by BDS. Unlike the other three constellations, BDS consists of satellites in three types of orbits: the Geostationary Orbit (GEO), the Inclined Geosynchronous Orbit (IGSO), and the Medium Earth Orbit (MEO). The trajectories of BDS satellites of station Henan on DOY 30, 2021 are shown in Figure 9. The different trajectories show the different orbit types they belong to. The trajectories shaped like an ‘8’ represent IGSO, and the trajectories showing a point represent GEO. As there is almost no change in the elevation angle for GEO satellites, the SNR arcs from GEO satellites have no multipath oscillation, so the traditional method cannot be used for retrieval. Due to the characteristics of BDS mixed constellation and the different orbital parameters, the pre-processing of IGSO and MEO is slightly different. As shown in Table 2, the revisit periods of BDS satellites are much longer than those of GPS. MEO satellites need seven times the amount of GPS data, which puts forward certain requirements for the amount of data. In the case of short observation time, the average value is considered to be used. Specifically, MEO use the average phase offset and amplitude within 5° azimuths, while IGSO processes in the same way as GPS.

Figure 9.
Trajectories of BDS satellites.
Table 2.
Revisit periods of GPS and BDS constellations.
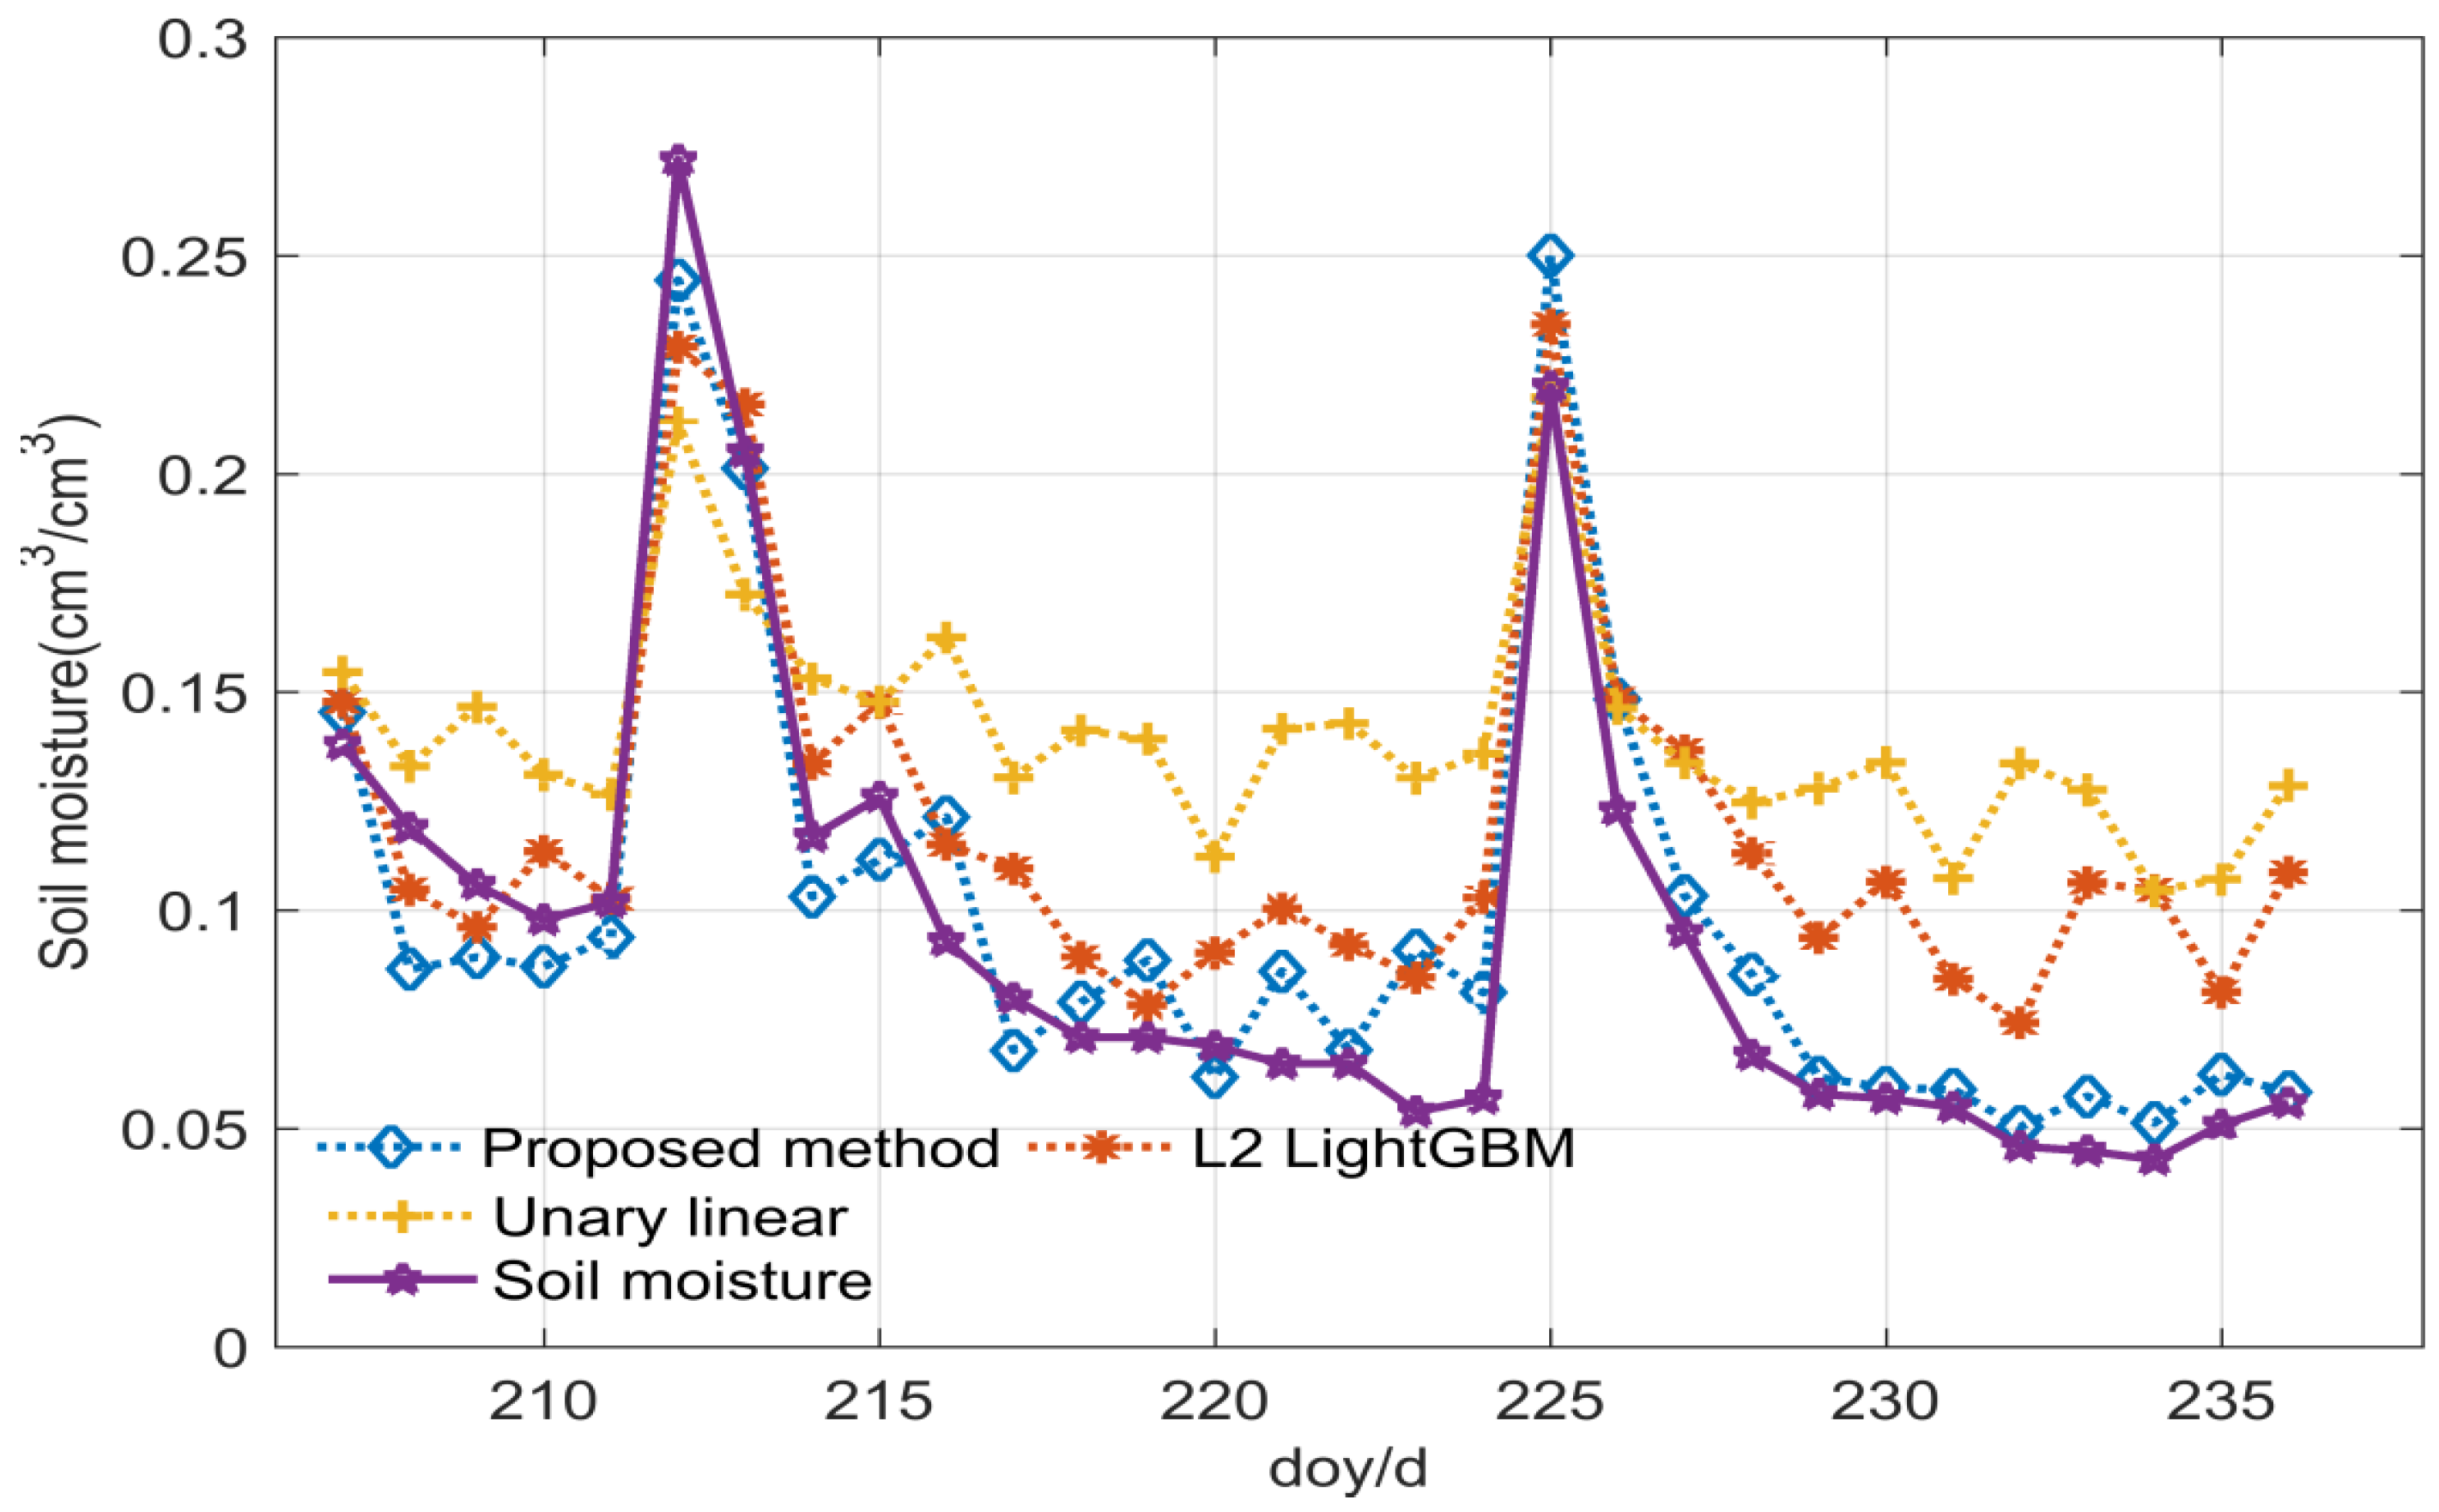
According to the method proposed above, the soil moisture can be calculated. Figure 10 depicts the retrieval results of the Henan experiment. These indicate that the estimation obtained from two methods agrees well with the in situ soil moisture, which proves that BDS has a similar potential to GPS in soil moisture retrieval. However, there is a significant deviation in unary linear regression model, with 0.03 , approximately. This further proves that the direct retrieval of soil moisture from single-satellite or single-frequency data involves relatively large uncertainties, which may be caused by the differences among the geometric motion trajectories relative to the satellites during the experiment and the performance of the satellites. On the contrary, the proposed one has better retrieval performance in the whole experiment period, which shows great correspondence with in situ soil moisture.
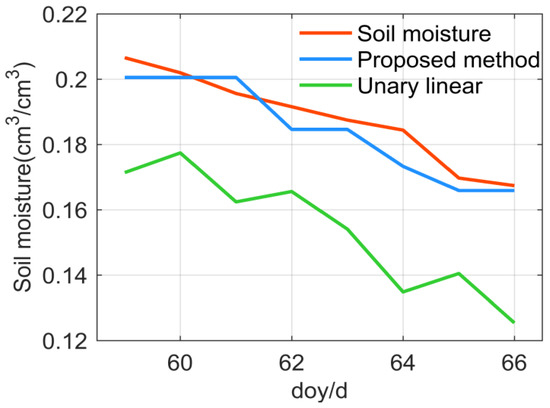
Figure 10.
Retrieval results of Henan experiment.
4. Discussions
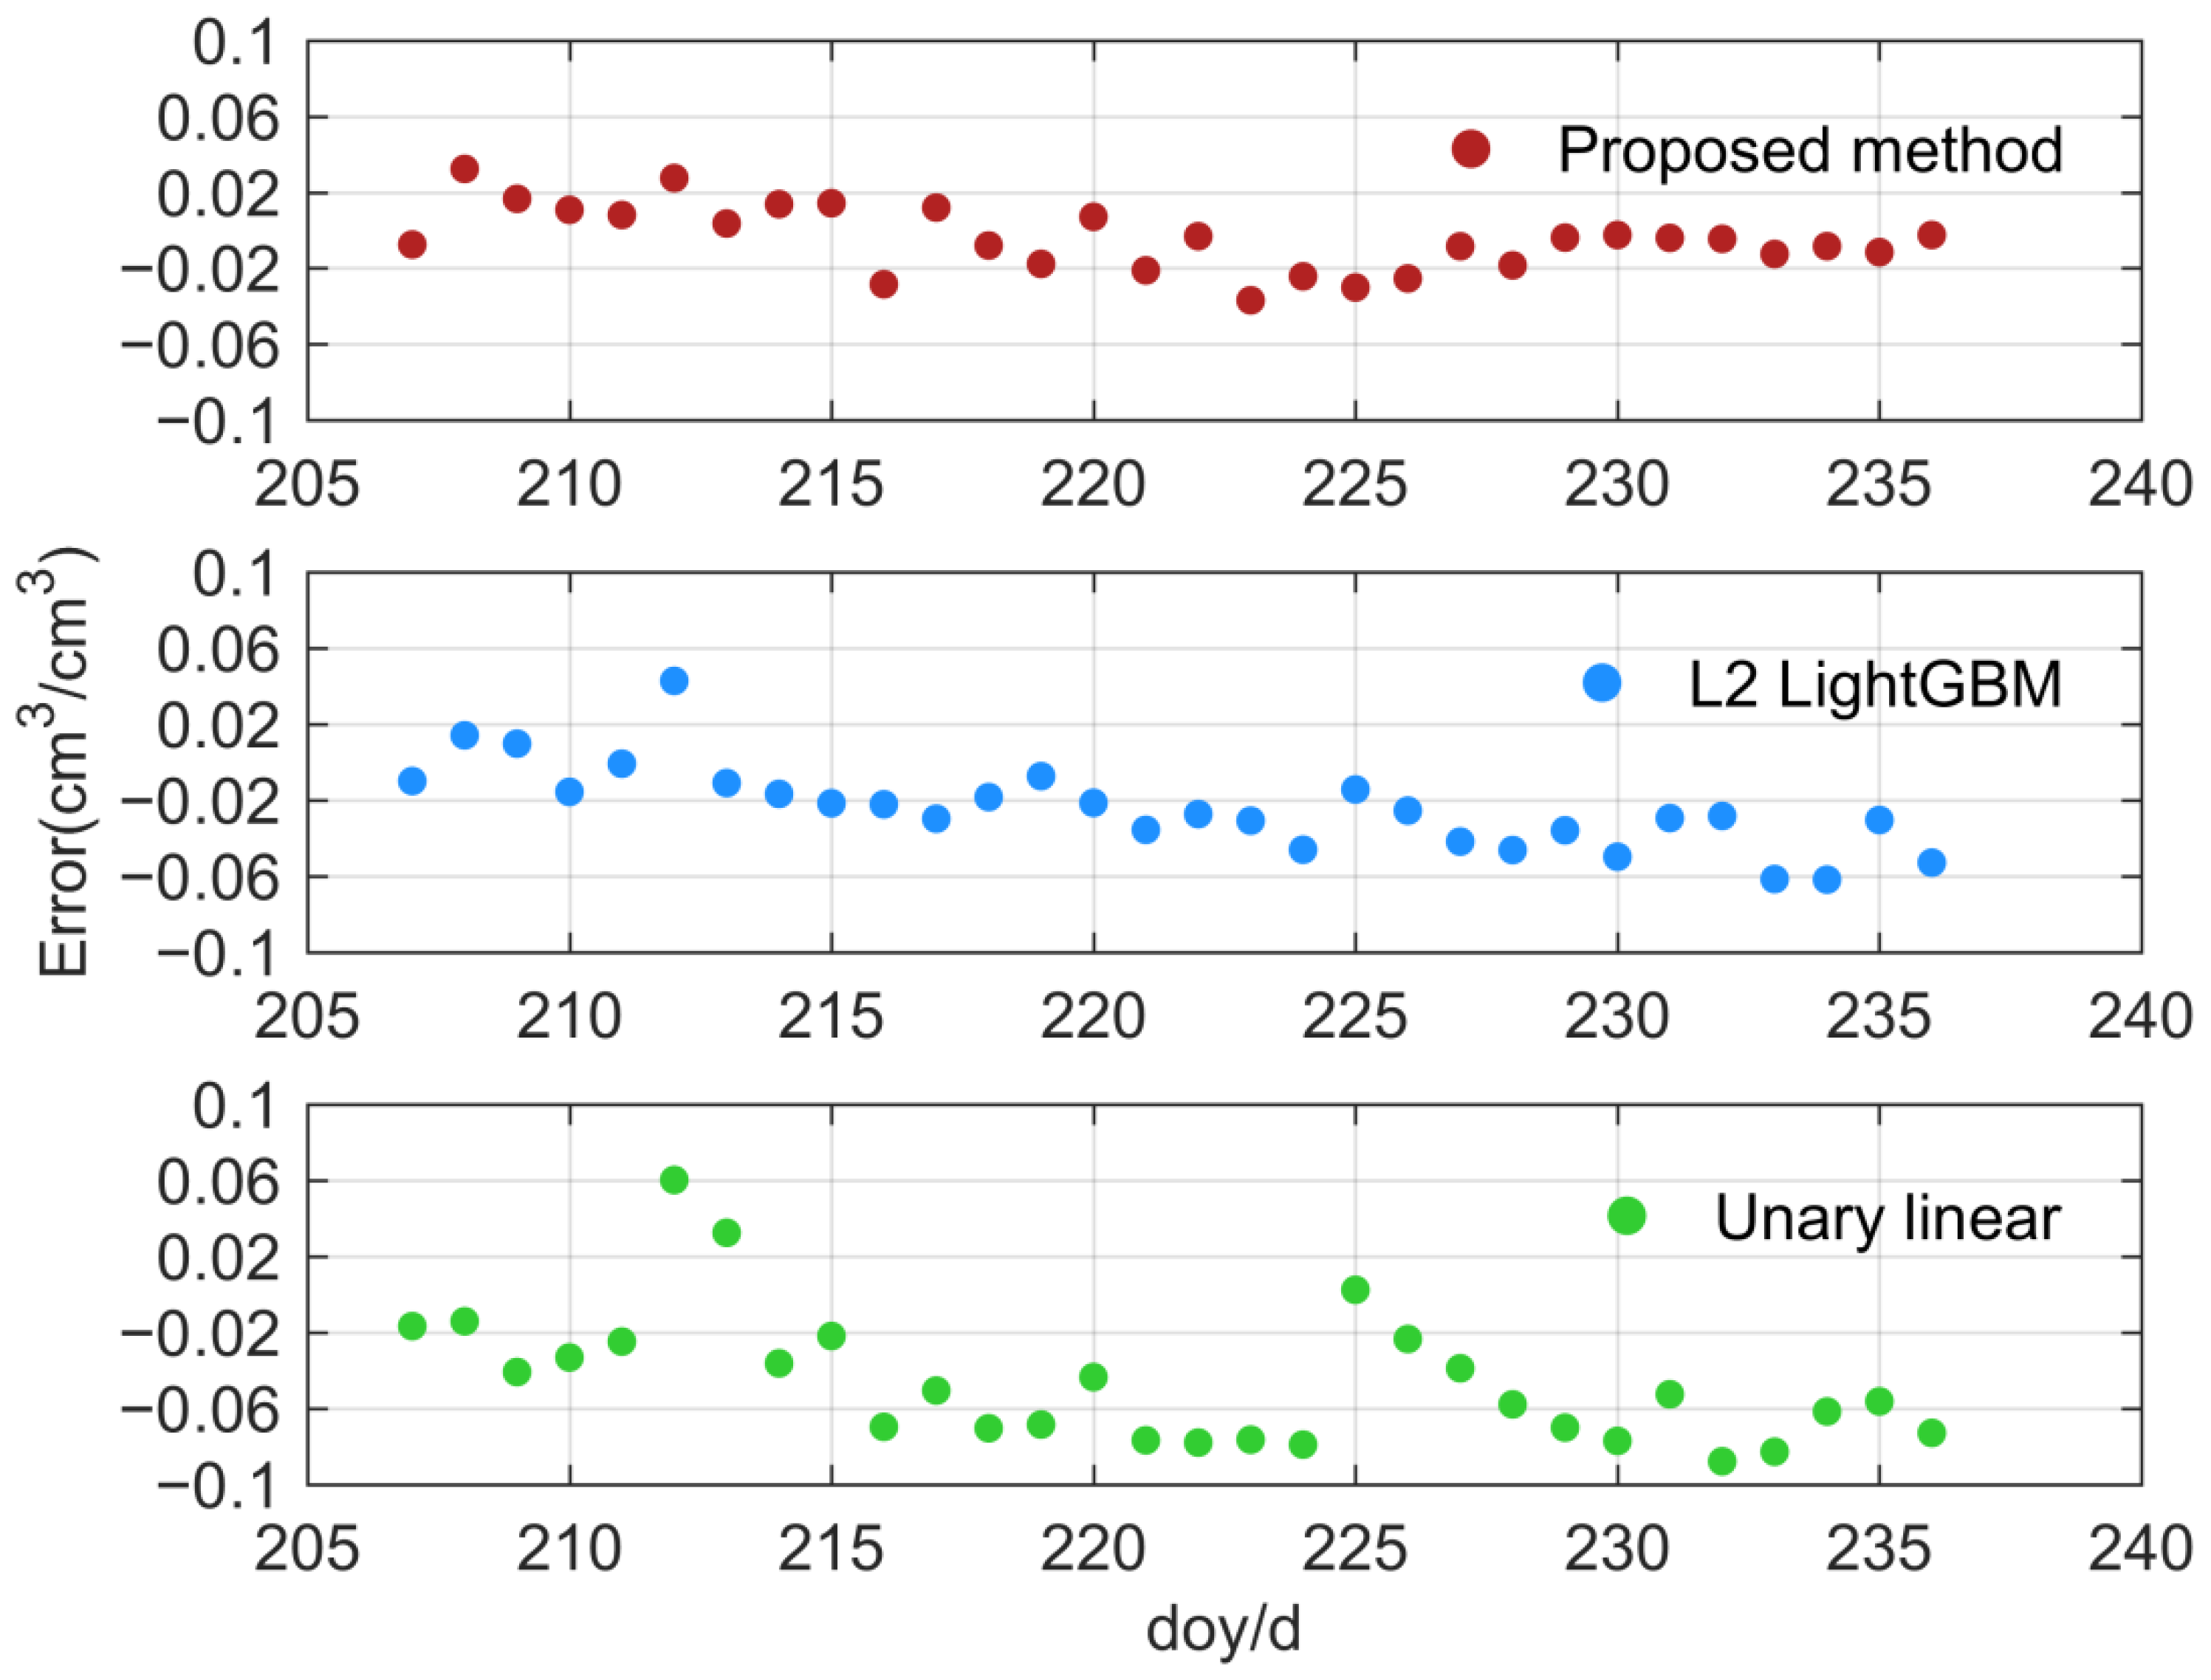
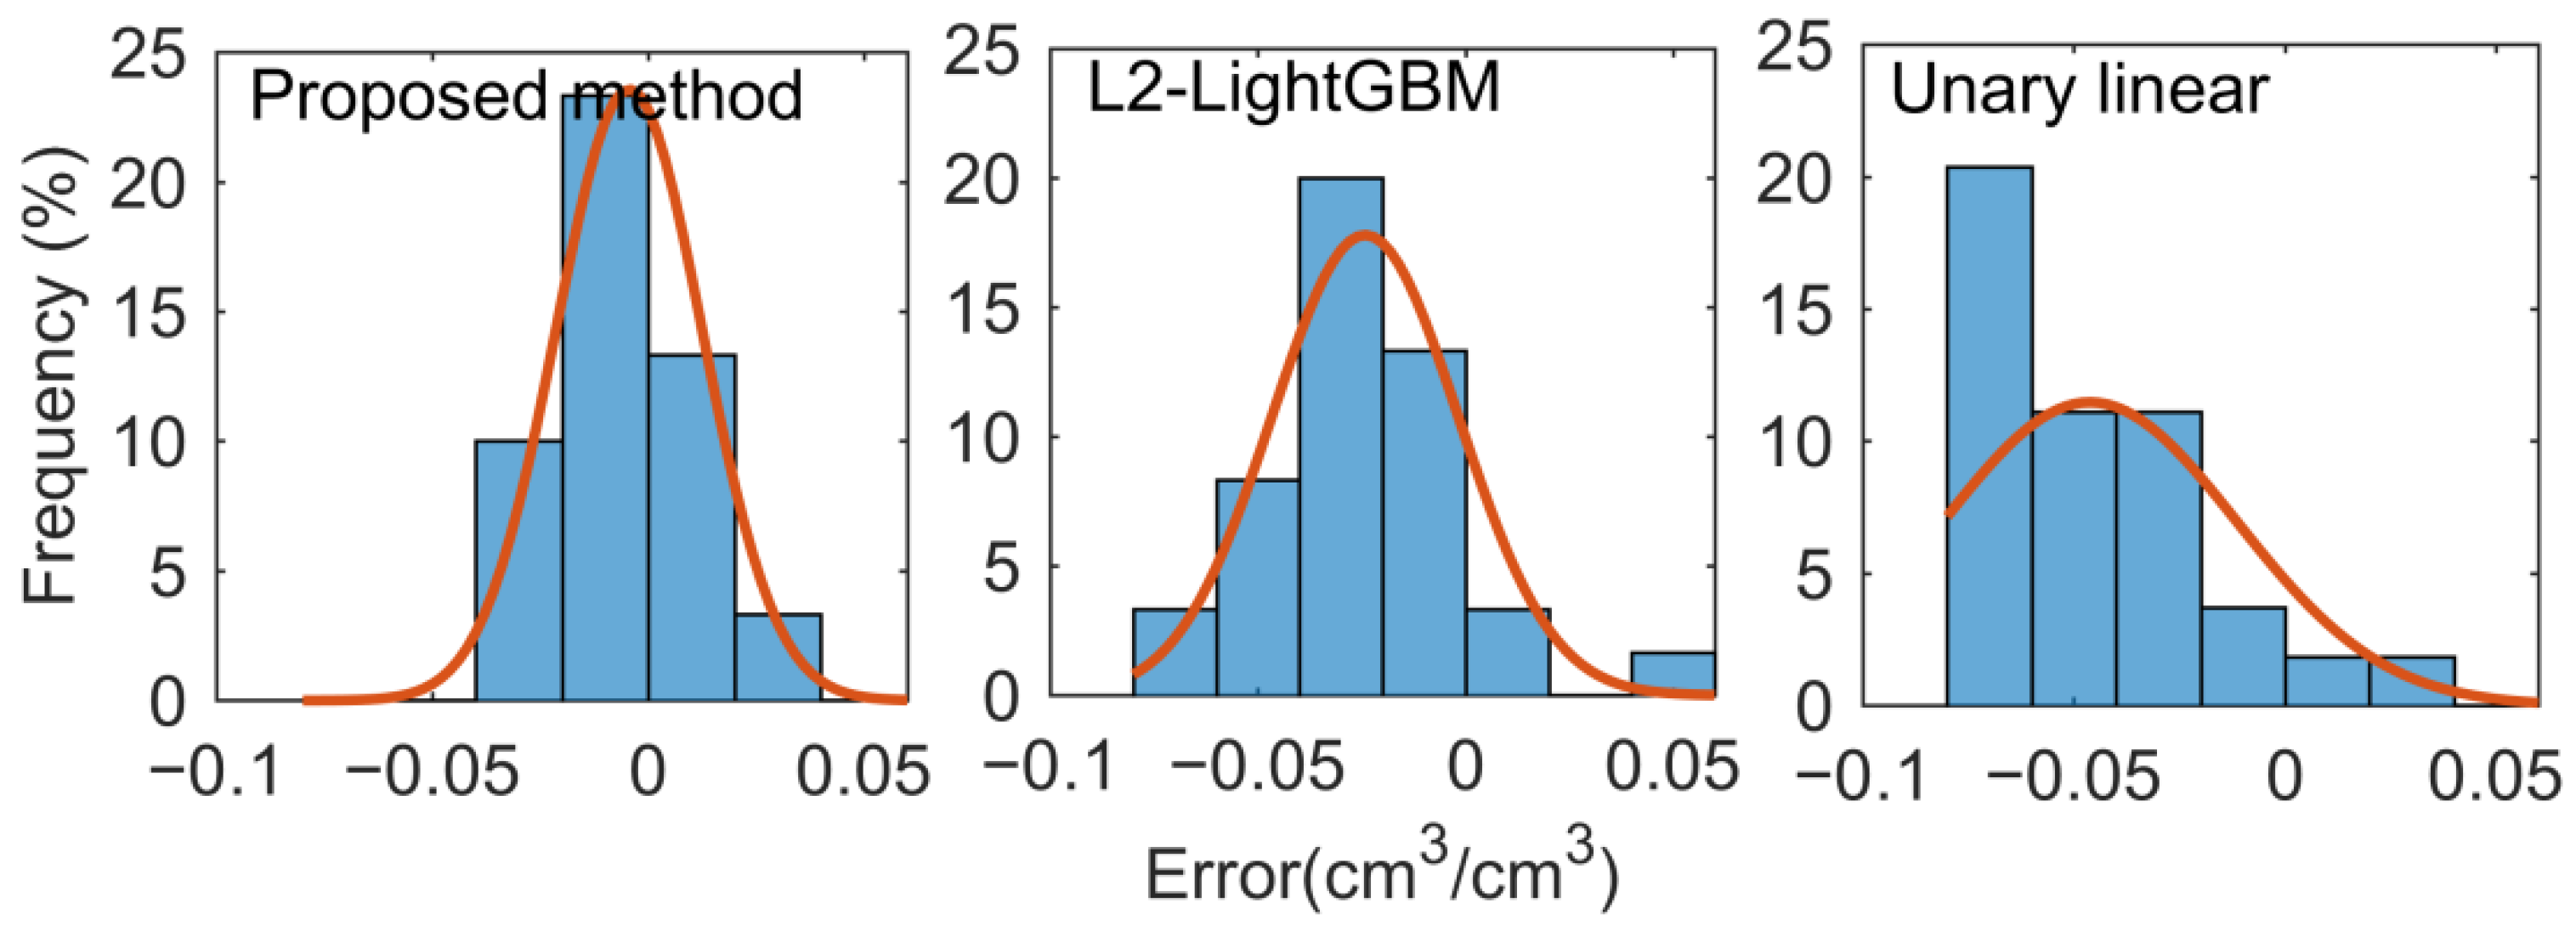
In the PBO H2O networks experiment, an example of the soil moisture retrieval errors produced by three methods with station P041 is illustrated in Figure 11. Obviously, most of the residuals based on LightGBM are concentrated within ±0.04 , while those from the traditional method are slightly larger, with a variation of ±0.06 . The errors of LightGBM, based on L2 frequency, are slightly worse than those of the proposed method, which have the highest accuracy, with stable residuals smaller than ±0.02 . A statistical histogram of the proportion of the absolute error for the soil moisture inversion obtained using three models is depicted in Figure 12. Furthermore, 83.33% retrieval residuals of the proposed method are distributed with ±0.02 . Only 16.67 and 53.33% retrieval residuals calculated by the traditional method and the L2-LightGBM method are distributed within these. By contrast, 46.67% retrieval residuals by the traditional method are larger than ±0.05 , with the proposed method being zero. Furthermore, the proposed method distributes more narrowly than the other two models and conforms to a normal distribution overall. Therefore, by fusing of multi-frequency SNR data, the problems of partial fluctuation and low retrieval accuracy can be effectively overcome.
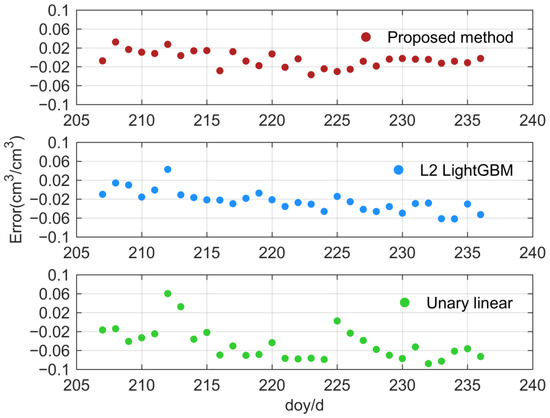
Figure 11.
Soil moisture retrieval errors of three methods with station P041.
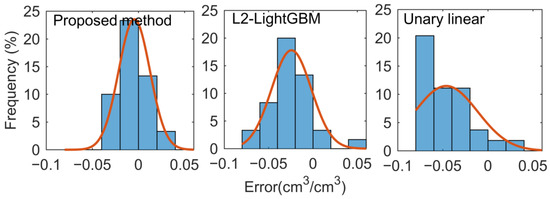
Figure 12.
Soil moisture retrieval residual distributions with station P041.
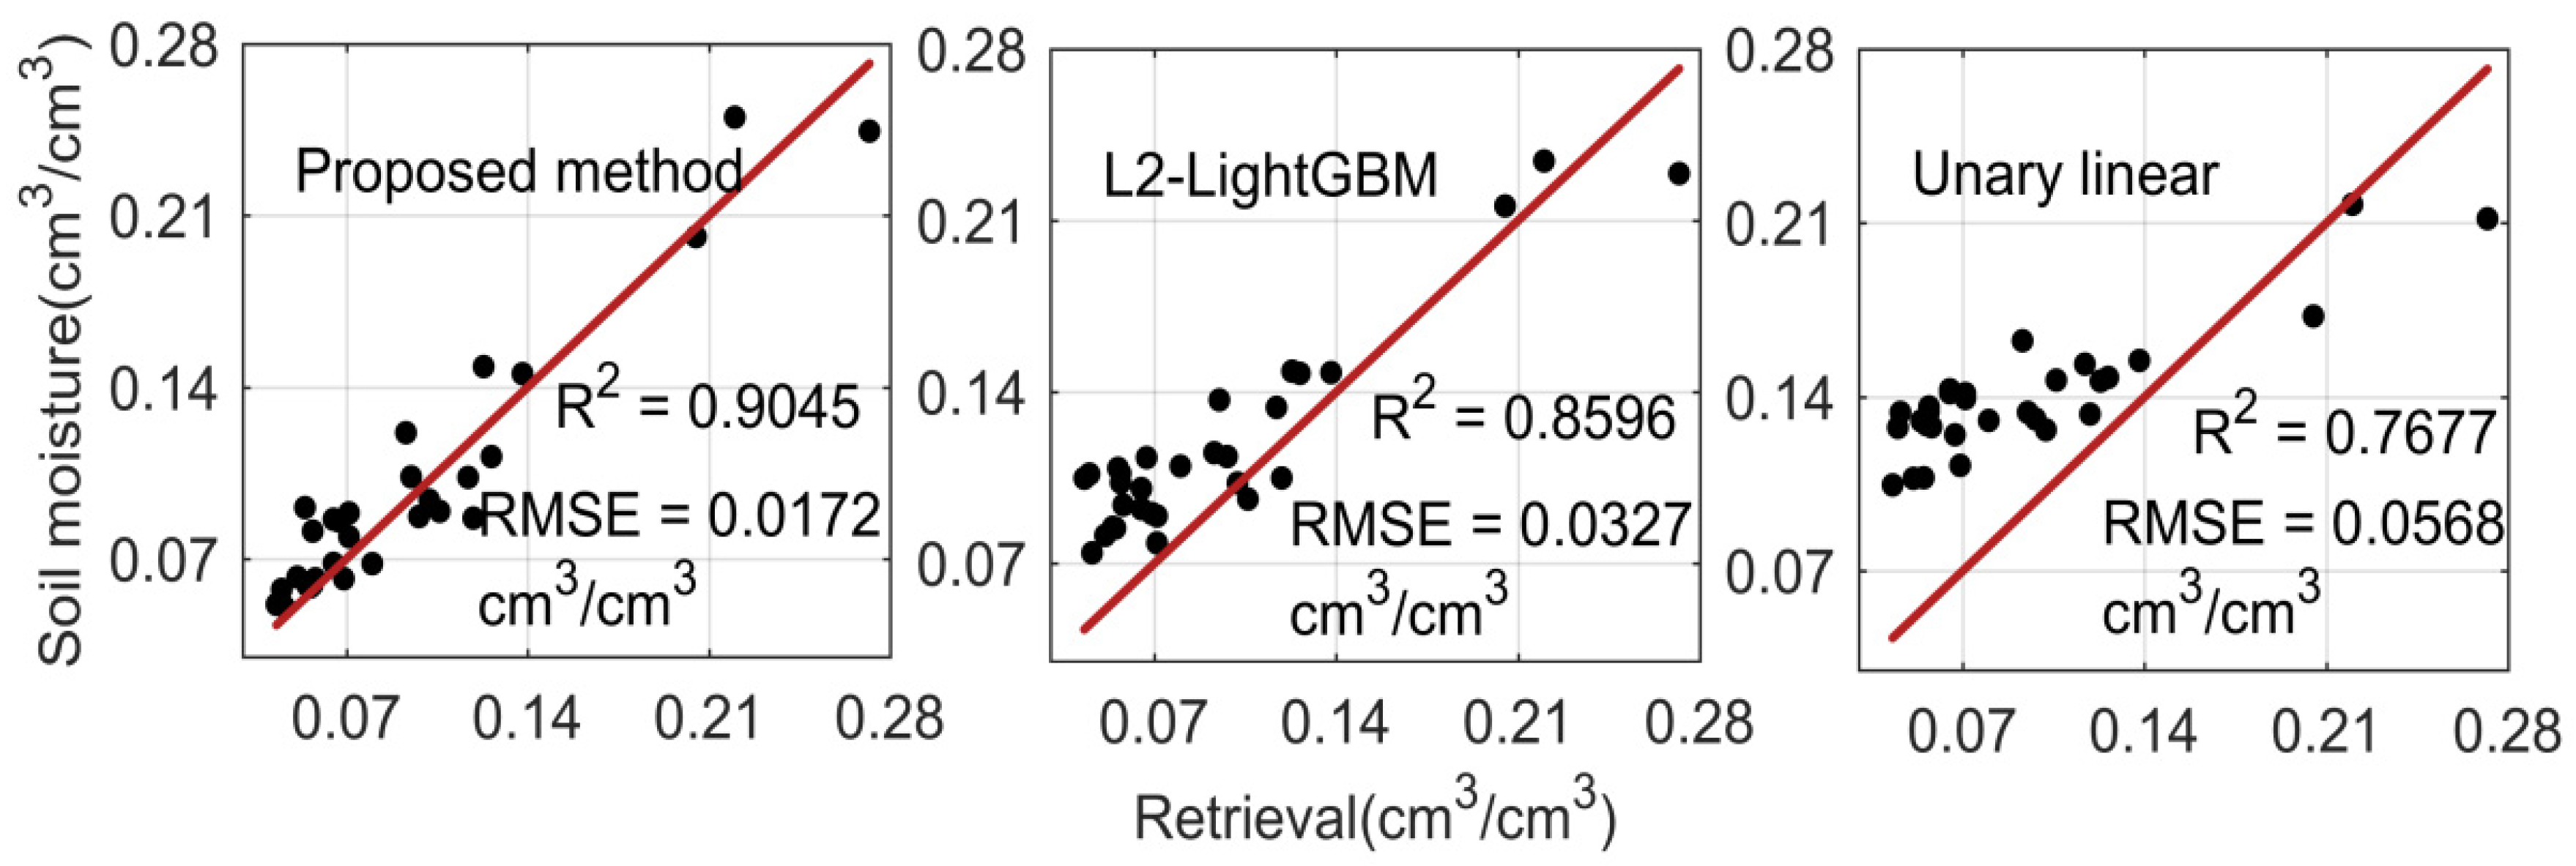
In terms of correlation, the scatterplot of soil moisture retrieval using station P041 by three methods is depicted in Figure 13. It presents that the estimation results are both consistent with the trend of true values. Compared with the other two methods, the results of the proposed method perform better, providing a good fit with the ground truth values. The correlation coefficient of the proposed method combination is the largest, reaching 0.9045, followed by single-phase offset as input with a correlation coefficient of 0.8596, while the traditional method correlation coefficient of 0.7677 is the smallest.
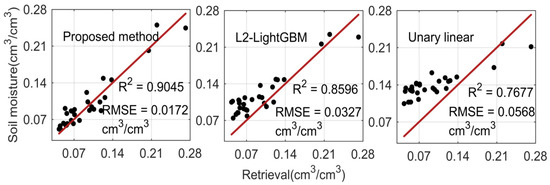
Figure 13.
Correlation between three methods and soil moisture in station P041.
Furthermore, the performance of the proposed method is compared with that of the other two methods. Table 3 gives the accuracy in terms of error statistics of three stations based on the three retrieval methods. It is noticed from Table 3 that the correlation coefficients of the three stations based on the proposed method are both above 0.9, and those based on the traditional method are below 0.8, conversely. In addition, RMSE and mean absolute error (MAE) are decreased to some extent. Specifically, compared with the other two methods, the average correlation coefficient of the proposed method is increased by 6.12 and 19.34%, the average RMSE is decreased by 28.83 and 50.93%, and the average MAE is decreased by 28.11 and 51.35%, respectively.
Table 3.
Soil moisture retrieval precision statistics.
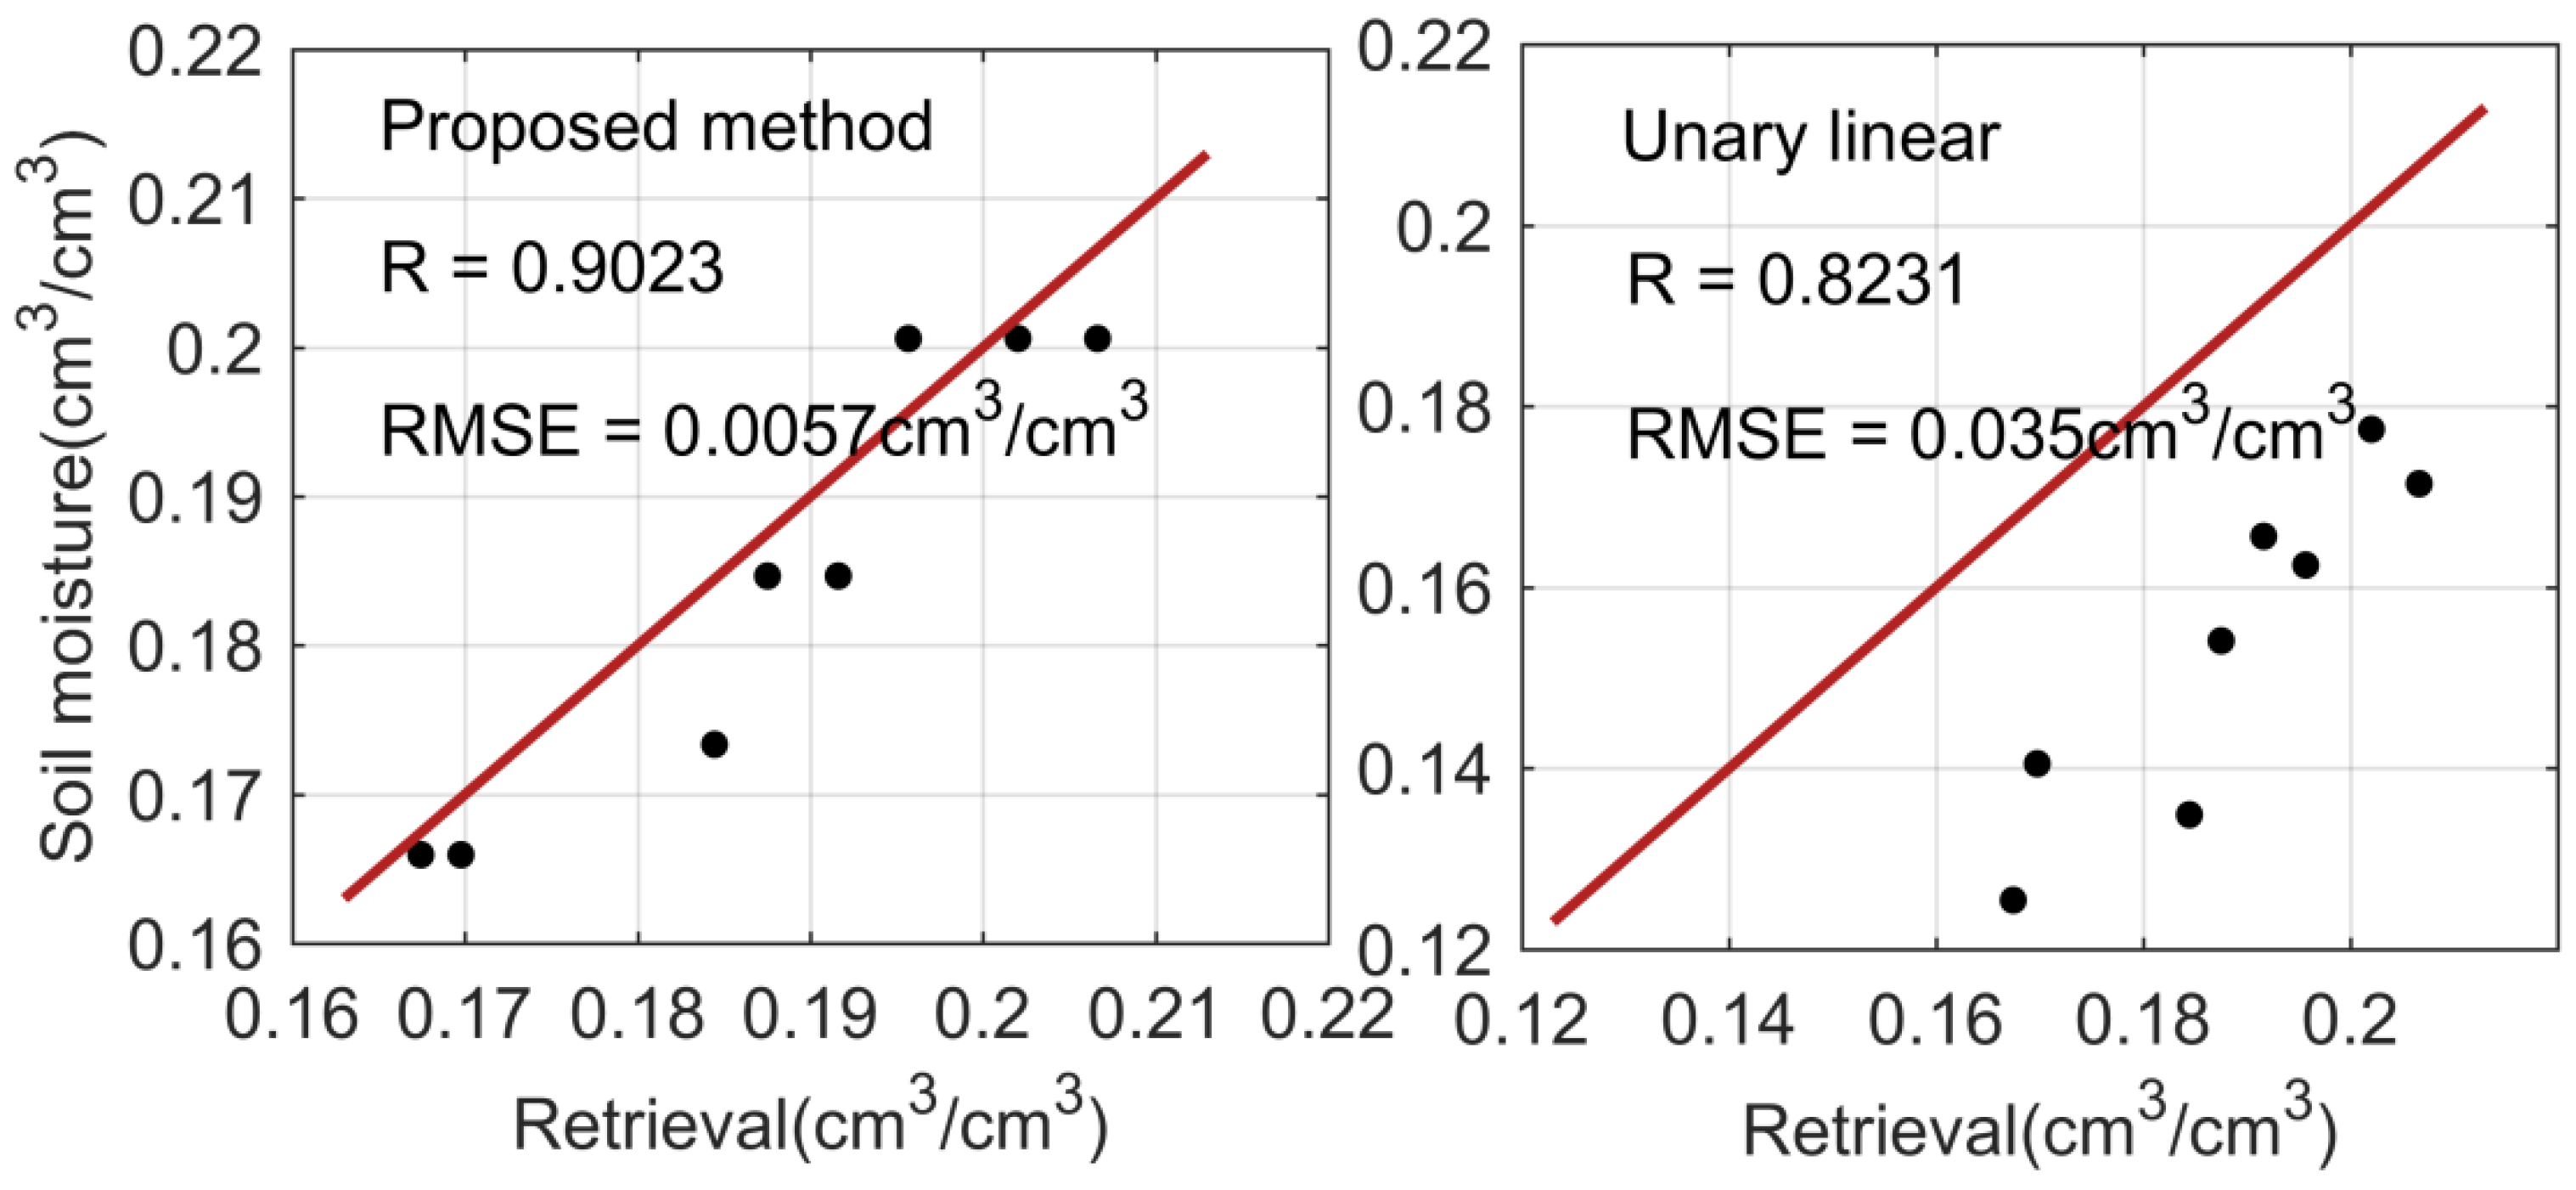
For the Henan experiment, as illustrated in Figure 14, the correlation coefficient of the proposed method and ground truth soil moisture is 0.9023, and RMSE is 0.0057 , which achieves about 9.66 and 84.12% improvement compared with the traditional linear regression model, respectively. That is, the proposed method can be applied to BDS, effectively overcomes the uncertainty discussed above, and greatly improves the stability and accuracy of soil moisture retrieval. It is worth mentioning that due to the short time series of the experiment and the single experimental site, the applicability of the proposed model for BDS needs to be further verified.
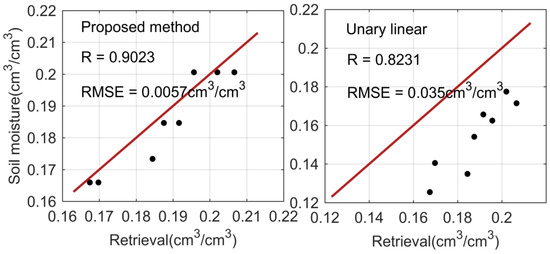
Figure 14.
Scatter diagram of the retrieval soil moisture.
5. Conclusions
The acquisition and long-term monitoring of soil moisture are of great significance to environmental science research. This contribution aims to improve the accuracy of soil moisture retrieval based on fully exploiting the advantages of multi-mode GNSS combination. An improved method is proposed to retrieve soil moisture using multi-frequency fusion data of single geodetic-quality GNSS antenna and evaluates using dual-constellation SNR data.
Observation data from PBO and Henan station, estimated by GNSS-IR based on the proposed method, were compared with in situ soil moisture and the other two methods. In terms of soil moisture retrieval accuracy, the proposed method performs better than the traditional method by experiments for GPS and BDS. The long experimental results show a great correlation between ground truth values and the retrieval values, the correlation coefficient of three PBO stations is 0.9007, 0.9045, and 0.9524, respectively. The corresponding RMSEs are 0.0217, 0.0172, and 0.012 . Another short-term experiment also proves the feasibility and accuracy of soil moisture retrieval by BDS, with 0.0057 of RMSE and 0.9023 of correlation coefficient. Moreover, it is demonstrated that the proposed approach could be extended to BDS. These improvements mainly benefit from the fusion of multi-feature parameters from multi-frequency. Simultaneously, the difference of satellite signals with different frequencies and the problem of SNR selection are alleviated by using the PCA algorithm and entropy method with prior information.
In addition, these experiments indicate that the GNSS antenna is affected by the geometrical trajectory of the satellite and the performance of the satellite itself. The phase offset and amplitude of different satellites have different response modes to the surface soil moisture, and there is a different correlation with the in situ soil moisture. The proposed method can better combine the two, and has better inversion performance in terms of accuracy and stability, which effectively suppresses the phenomenon of ‘abnormal jump’ when using a single satellite or frequency for inversion. Future research will focus on multi-constellation fusion to retrieve soil moisture and reduce the impact of vegetation coverage on soil moisture measurement.
Author Contributions
X.C. collected and carried out initial processing of the experiment data; K.C. proposed the approach and drafted the manuscript; Y.G. validated the improved method; F.S. wrote the revised version of the paper and provided supervision; and all of the authors contributed to the discussion. All authors have read and agreed to the published version of the manuscript.
Funding
This work is sponsored by the National Natural Science Foundation of China (No. 41904018, No. 42077003) and Natural Science Foundation of Jiangsu Province (No. BK20190714, BK20201374). Thanks to the Outstanding Chinese and Foreign Youth Exchange Program (2019) of China Association for Science and Technology. Thanks to the high-level innovation and entrepreneurship talent plan of Jiangsu Province.
Institutional Review Board Statement
Not applicable.
Informed Consent Statement
Not applicable.
Data Availability Statement
The GNSS site data were provided under the PBO Observation Program of the United States, and the measured soil moisture data were obtained from ftp://data-out.unavco.org/pub/products/ucb_h2o/by_site/ (accessed on 20 March 2021).
Acknowledgments
The authors gratefully acknowledge the PBO, IGS, and its analysis centers for providing GNSS data and precise products.
Conflicts of Interest
The authors declare no conflict of interest.
References
- Hall, C.D.; Cordey, R.A. Multistatic Scatterometry. In Proceedings of the International Geoscience & Remote Sensing Symposium, Edinburgh, UK, 12–16 September 1988. [Google Scholar]
- Rodriguez-Alvarez, N.; Bosch-Lluis, X.; Camps, A.; Ramos-Perez, I.; Valencia, E.; Park, H.; Vall-Llossera, M. Vegetation Water Content Estimation Using GNSS Measurements. IEEE Geosci. Remote Sens. Lett. 2012, 9, 282–286. [Google Scholar] [CrossRef]
- Jia, Y.; Jin, S.; Savi, P.; Gao, Y.; Tang, J.; Chen, Y.; Li, W. GNSS-R Soil Moisture Retrieval Based on a XGboost Machine Learning Aided Method: Performance and Validation. Remote Sens. 2019, 11, 1655. [Google Scholar] [CrossRef] [Green Version]
- Alonso-Arroyo, A.; Camps, A.; Park, H.; Pascual, D.; Onrubia, R.; Martín, F. Retrieval of Significant Wave Height and Mean Sea Surface Level Using the GNSS-R Interference Pattern Technique: Results From a Three-Month Field Campaign. IEEE Trans. Geosci. Remote Sens. 2015, 53, 3198–3209. [Google Scholar] [CrossRef] [Green Version]
- Rodriguez-Alvarez, N.; Aguasca, A.; Valencia, E.; Bosch-Lluis, X.; Ramos-Pérez, I.; Park, H.; Vall-Llossera, M. Snow monitoring using GNSS-R techniques. In Proceedings of the IEEE International Geoscience and Remote Sensing Symposium, Vancouver, BC, Canada, 24–29 July 2011; pp. 4375–4378. [Google Scholar]
- Jin, S.; Najibi, N. Sensing snow height and surface temperature variations in Greenland from GPS reflected signals. Adv. Space Res. 2014, 53, 1623–1633. [Google Scholar] [CrossRef]
- Santi, E.; Paloscia, S.; Pettinato, S.; Fontanelli, G.; Clarizia, M.P.; Comite, D.; Floury, N. Remote Sensing of Forest Biomass Using GNSS Reflectometry. IEEE J. Sel. Top. Appl. Earth Obs. Remote Sens. 2020, 13, 2351–2368. [Google Scholar] [CrossRef]
- Ferrazzoli, P.; Guerriero, L.; Pierdicca, N.; Rahmoune, R. Forest biomass monitoring with GNSS-R: Theoretical simulations. Adv. Space Res. 2011, 47, 1823–1832. [Google Scholar] [CrossRef]
- Gao, H.; Yang, D.; Zhang, B.; Wang, Q.; Wang, F. Remote Sensing of Sea Ice Thickness with GNSS Reflected Signal. J. Electron. Inf. Technol. 2017, 39, 1096–1100. [Google Scholar]
- Strandberg, J.; Hobiger, T.; Haas, R. Coastal Sea Ice Detection Using Ground-Based GNSS-R. IEEE Geosci. Remote Sens. Lett. 2017, 14, 1552–1556. [Google Scholar] [CrossRef]
- Larson, K.M.; Small, E.E.; Gutmann, E.; Bilich, A.; Axelrad, P.; Braun, J. Using GPS Multipath to Measure Soil Moisture Fluctuations: Initial Results. GPS Solut. 2008, 12, 173–177. [Google Scholar] [CrossRef]
- Larson, K.M.; Small, E.E.; Gutmann, E.D.; Bilich, A.L. Use of gps receivers as a soil moisture network for water cycle studies. Geophys. Res. Lett. 2008, 35, 851–854. [Google Scholar] [CrossRef] [Green Version]
- Ban, W.; Yu, K.; Zhang, X. GEO-Satellite-Based Reflectometry for Soil Moisture Estimation: Signal Modeling and Algorithm Development. IEEE Trans. Geosci. Remote Sens. 2017, 56, 1829–1838. [Google Scholar] [CrossRef]
- Yan, S.; Li, Z.; Yu, K.; Zhang, K. GPS-R L1 interference signal processing for soil moisture estimation: An experimental study. Eurasip J. Adv. Signal Process. 2014, 2014, 107. [Google Scholar] [CrossRef] [Green Version]
- Wan, W.; Larson, K.M.; Small, E.E.; Chew, C.C.; Braun, J.J. Using geodetic GPS receivers to measure vegetation water content. GPS Solut. 2015, 19, 237–248. [Google Scholar] [CrossRef]
- Larson, K.M.; Small, E.E. Normalized Microwave Reflection Index: A Vegetation Measurement Derived From GPS Networks. IEEE J. Sel. Top. Appl. Earth Obs. Remote Sens. 2014, 7, 1501–1511. [Google Scholar] [CrossRef]
- Yuan, Q.; Li, S.; Yue, L.; Li, T.; Shen, H.; Zhang, L. Monitoring the Variation of Vegetation Water Content with Machine Learning Methods: Point–Surface Fusion of MODIS Products and GNSS-IR Observations. Remote Sens. 2019, 11, 1440. [Google Scholar] [CrossRef] [Green Version]
- Larson, K.M.; Gutmann, E.D.; Zavorotny, V.U.; Braun, J.J.; Williams, M.W.; Nievinski, F.G. Can we measure snow depth with GPS receivers? Geophys. Res. Lett. 2009, 36, L17502. [Google Scholar] [CrossRef] [Green Version]
- Gutmann, E.D.; Larson, K.M.; Williams, M.W.; Nievinski, F.G.; Zavorotny, V.U. Snow measurement by GPS interferometric reflectometry: An evaluation at Niwot Ridge, Colorado. Hydrol. Process. 2012, 26, 2951–2961. [Google Scholar] [CrossRef]
- Tabibi, S.; Geremia-Nievinski, F.; Dam, T.V. Statistical Comparison and Combination of GPS, GLONASS, and Multi-GNSS Multipath Reflectometry Applied to Snow Depth Retrieval. IEEE Trans. Geosci. Remote Sens. 2017, 55, 3773–3785. [Google Scholar] [CrossRef]
- Larson, K.M.; Braun, J.J.; Small, E.E.; Zavorotny, V.U.; Gutmann, E.D.; Bilich, A.L. GPS Multipath and Its Relation to Near-Surface Soil Moisture Content. IEEE J. Sel. Top. Appl. Earth Obs. Remote Sens. 2010, 3, 91–99. [Google Scholar] [CrossRef]
- Chew, C.C.; Small, E.E.; Larson, K.M. Effects of Near-Surface Soil Moisture on GPS SNR Data: Development of a Retrieval Algorithm for Soil Moisture. IEEE Trans. Geosci. Remote Sens. 2013, 52, 537–543. [Google Scholar] [CrossRef]
- Vey, S.; Güntner, A.; Wickert, J.; Blume, T.; Ramatschi, M. Long-term soil moisture dynamics derived from GNSS interferometric reflectometry: A case study for Sutherland, South Africa. GPS Solut. 2016, 20, 641–654. [Google Scholar] [CrossRef]
- Zavorotny, V.U.; Larson, K.M.; Braun, J.J.; Small, E.E.; Gutmann, E.D.; Bilich, A.L. A Physical Model for GPS Multipath Caused by Land Reflections: Toward Bare Soil MoistureRetrievals. IEEE J. Sel. Top. Appl. Earth Obs. Remote Sens. 2010, 3, 100–110. [Google Scholar] [CrossRef]
- Yang, T.; Wan, W.; Chen, X.; Chu, T.; Hong, Y. Using BDS SNR Observations to Measure Near-Surface Soil Moisture Fluctuations: Results From Low Vegetated Surface. IEEE Geosci. Remote Sens. Lett. 2017, 14, 1308–1312. [Google Scholar] [CrossRef]
- Feng, Q.; Zheng, N. Retrieving Soil Moisture Using Signal-to-noise Ratio of GPS Signal by Assisted Machine Learning Algorithm. Bull. Surv. Mapp. 2018, 7, 106–111. [Google Scholar]
- Jin, L.; Yang, L.; Han, M.; Hong, X.; Sun, B.; Liang, Y. Soil moisture inversion method based on GNSS-IR dual frequency data fusion. J. Beijing Univ. Aeronaut. Astronaut. 2019, 45, 1248. [Google Scholar]
- Sun, B.; Liang, Y.; Han, M.; Yang, L.; Jin, L.; Hong, X. A method for GNSS-IR soil moisture inversion based on GPS multi-satellite and triple-frequency data fusion. J. Beijing Univ. Aeronaut. Astronaut. 2020, 46, 1089–1096. [Google Scholar]
- Chew, C.C. Soil Moisture Remote Sensing using GPS-Interferometric Reflectometry. Dissertations & Theses—Gradworks. In 2017 Forum on Cooperative Positioning and Service (CPGPS); IEEE: Piscataway, NJ, USA, 2015. [Google Scholar]
- Small, E.E.; Larson, K.M.; Chew, C.C.; Dong, J.; Ochsner, T.E. Validation of GPS-IR Soil Moisture Retrievals: Comparison of Different Algorithms to Remove Vegetation Effects. IEEE J. Sel. Top. Appl. Earth Obs. Remote Sens. 2016, 9, 4759–4770. [Google Scholar] [CrossRef]
- Zribi, M.; Gorrab, A.; Baghdadi, N.; Lili-Chabaane, Z.; Mougenot, B. Influence of Radar Frequency on the Relationship Between Bare Surface Soil Moisture Vertical Profile and Radar Backscatter. IEEE Geosci. Remote Sens. Lett. 2013, 11, 848–852. [Google Scholar] [CrossRef] [Green Version]
- Qi, X. Technology Research of Face Recognition Based on PCA; Wuhan University of Technology: Wuhan, China, 2007. [Google Scholar]
- Asante-Okyere, S.; Shen, C.; Ziggah, Y.Y.; Rulegeya, M.M.; Zhu, X. Principal Component Analysis (PCA) Based Hybrid Models for the Accurate Estimation of Reservoir Water Saturation. Comput. Geosci. 2020, 145, 104555. [Google Scholar] [CrossRef]
- Qiao, J. Application of Improved Entropy Method in Henan Sustainable Development Evaluation. Resour. Sci. 2004, 26, 113–119. [Google Scholar]
- Wang, F.; Mao, A.; Li, H.; Jia, M. Quality Measurement and Regional Difference of Urbanization in Shandong Province Based on the Entropy Method. Sci. Geogr. Sin. 2013, 33, 1323–1329. [Google Scholar]
- Ke, G.; Meng, Q.; Finley, T.; Wang, T.; Chen, W.; Ma, W.; Ye, Q.; Liu, T. LightGBM: A highly efficient gradient boosting decision tree. In Proceedings of the 31st Annual Conference on Neural Information Processing Systems (NIPS 2017), Long Beach, CA, USA, 4–9 December 2017; pp. 3147–3155. [Google Scholar]
- Zhang, Y.; Zhu, C.; Wang, Q. LightGBM-based model for metro passenger volume forecasting. IET Intelligent Transport Systems 2020, 14, 1815–1823. [Google Scholar] [CrossRef]
- Wang, F.; Cheng, H.; Dai, H.; Han, H. Freeway Short-Term Travel Time Prediction Based on LightGBM Algorithm. In IOP Conference Series: Earth Environmental Science; IOP Publishing: Bristol, UK, 2021; Volume 638, pp. 12–29. [Google Scholar]
- Gurtner, W.; Estey, L. Rinex: The Receiver Independent Exchange Format Version 3.04; Astronomical Institute, University of Bern and UNAVCO: Bolulder, CO, USA, 2007. [Google Scholar]


Publisher’s Note: MDPI stays neutral with regard to jurisdictional claims in published maps and institutional affiliations. |
© 2021 by the authors. Licensee MDPI, Basel, Switzerland. This article is an open access article distributed under the terms and conditions of the Creative Commons Attribution (CC BY) license (https://creativecommons.org/licenses/by/4.0/).