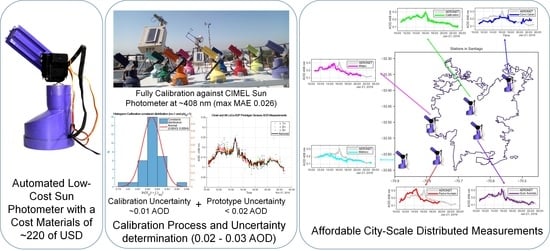
Automated Low-Cost LED-Based Sun Photometer for City Scale Distributed Measurements
Abstract
:1. Introduction
2. Materials and Methods
- To design and develop an automatic sun photometer under a low-cost constraint.
- To calibrate and compare the instruments using a ground truth instrument (Cimel Sun Photometer [36]).
- To perform measurements at an urban scale. The calibration of the instrument shall assure that all the measurements from each instrument are comparable among them, with an acceptable level of uncertainty.
2.1. Measurement Principle
2.2. Instrument Description
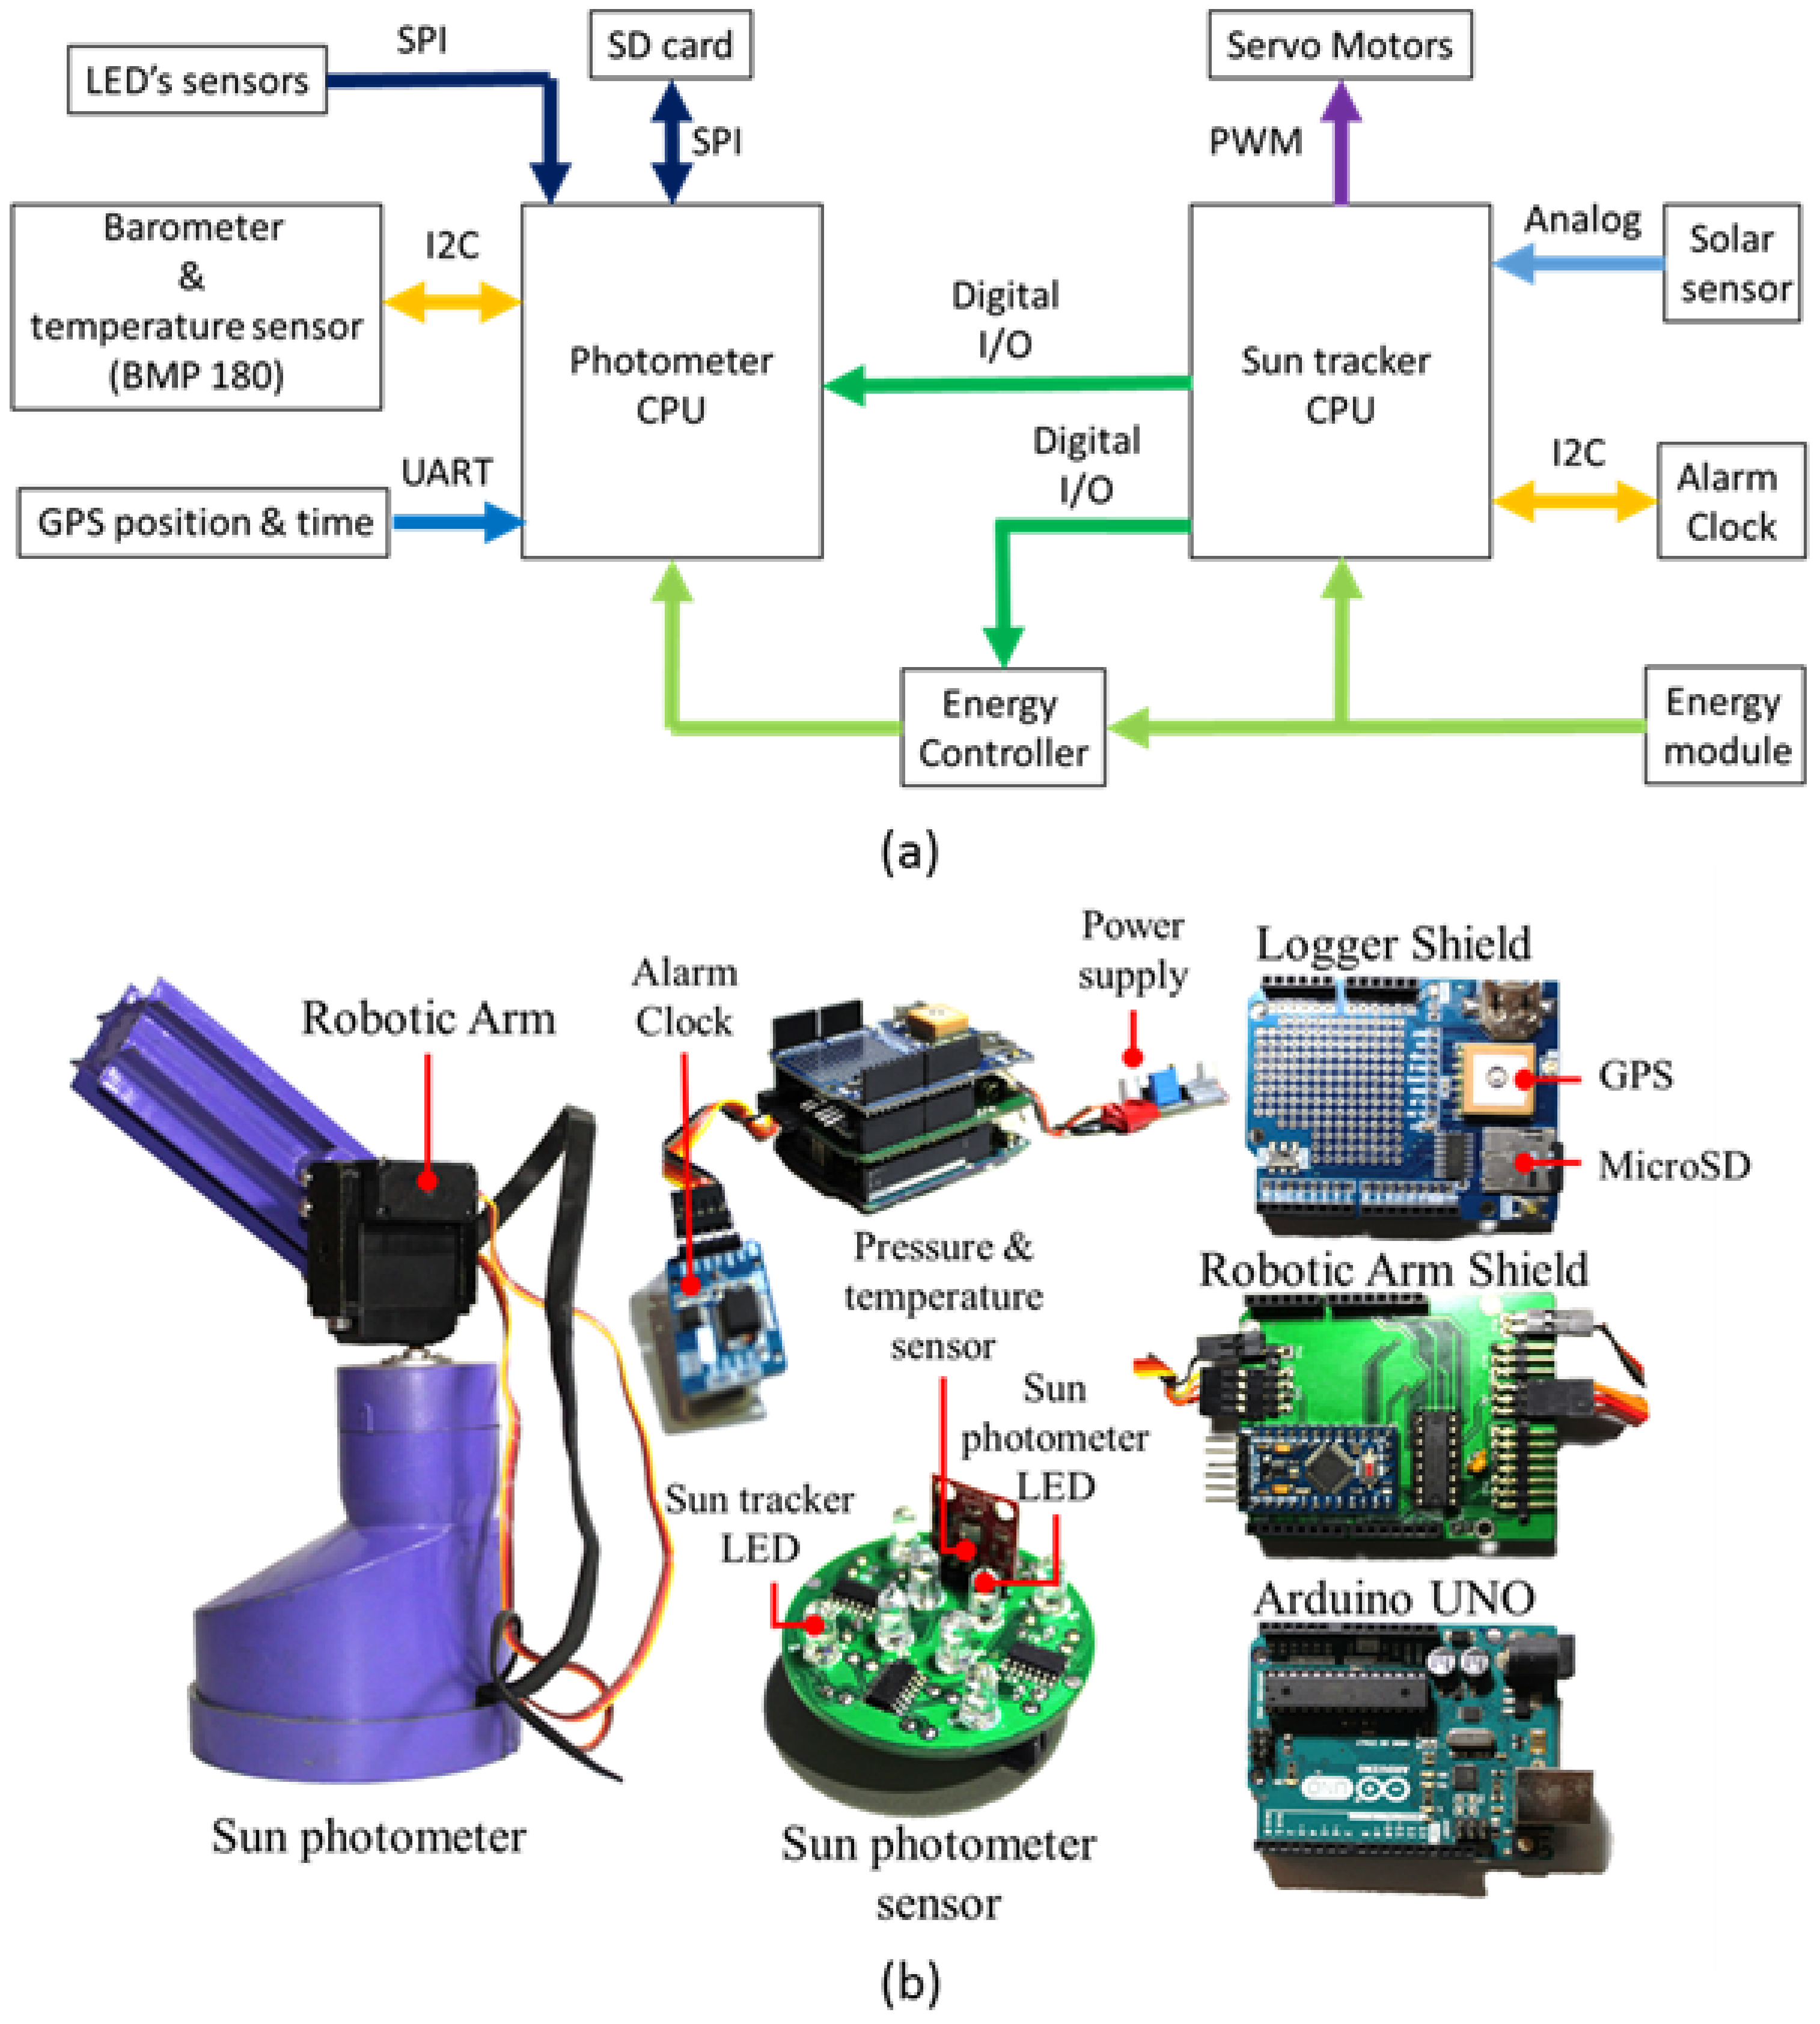
Instrument Architecture
- The alarm clock indicates the Sun tracker CPU when starting a measurement.
- The sun tracker CPU gets time from the alarm clock and sets the alarm for the measurement.
- The sun tracker CPU calculates the sun position and defines whether the sun position is too low to measure AOD (night time).
- If the internal calculation of the sun tracker CPU defines it as good to measure, the CPU turns on the servomotors and sets them to the calculated sun position.
- Due to the low precision of this estimation, the sun tracker also uses the solar sensor to improve the sun position estimation, and moves the servos around the estimated alignment position.
- The sun tracker CPU turns on the photometer CPU to start measuring. At the same time, the Sun tracker continues moving the servos around the alignment position.
- The photometer CPU takes measurements of for one and a half minutes. It only saves the highest measured values.
- After one and a half minutes, the sun tracker moves the servos to the park position and turns them off.
- The Photometer CPU gets the time and position from the GPS module, the pressure and temperature from the barometer and temperature sensors, and from the LED, saving all of them in the SD card.
- The sun tracker CPU turns off the photometer CPU and waits until the next measurement time.
2.3. Instrumental Network Calibration
3. Results
3.1. Comparison between Langley Plot Calibration and Optimization Process
3.2. Uncertainty Estimation
3.2.1. Prototypes Uncertainty
3.2.2. Calibration Uncertainty
3.3. Network Measurement Case Studies: Santiago de Chile
3.3.1. Case Study: 30 July 2018
3.3.2. 12 December 2018
3.3.3. 21 January 2019
4. Discussion
4.1. LoCo-ASP Instrument
4.2. Calibration Procedure
4.3. Case Studies
5. Conclusions
Author Contributions
Funding
Data Availability Statement
Acknowledgments
Conflicts of Interest
Appendix A
Appendix A.1. Cost of Materials of the Instrument
| Component | Cost (US) | Units | Total Cost (US) |
|---|---|---|---|
| Arduino UNO | 22 | 1 | 22 |
| Arduino pro mini | 9.95 | 1 | 9.95 |
| PCB Sun Photometer Sensor | 5 | 0.2 | 1 |
| PCB Robotic Arm Shield | 5 | 0.2 | 1 |
| LEDs | 0.5 | 8 | 4 |
| Amplifier LMC6484 | 3.88 | 2 | 7.76 |
| ADC MCP3204 | 4.06 | 1 | 4.06 |
| Electronics Components | 10 | 1 | 10 |
| Pin Headers | 10 | 1 | 10 |
| Cables | 10 | 1 | 10 |
| Case | 10 | 1 | 10 |
| Logger Shield | 49.95 | 1 | 49.95 |
| Servo Motor 270 | 14.9 | 2 | 29.8 |
| SD Card | 9.95 | 1 | 9.95 |
| Power Supply | 12 | 1 | 12 |
| BMP180 | 9.95 | 1 | 9.95 |
| DS3231 RTC Clock | 17.5 | 1 | 17.5 |
| Total | 218.92 |
Appendix A.2. Difference Comparison between Cimel Sun Photometer and LoCo-ASP
| Unit and Sensors | Number of Measures | Average Difference | RMSE | MAE |
|---|---|---|---|---|
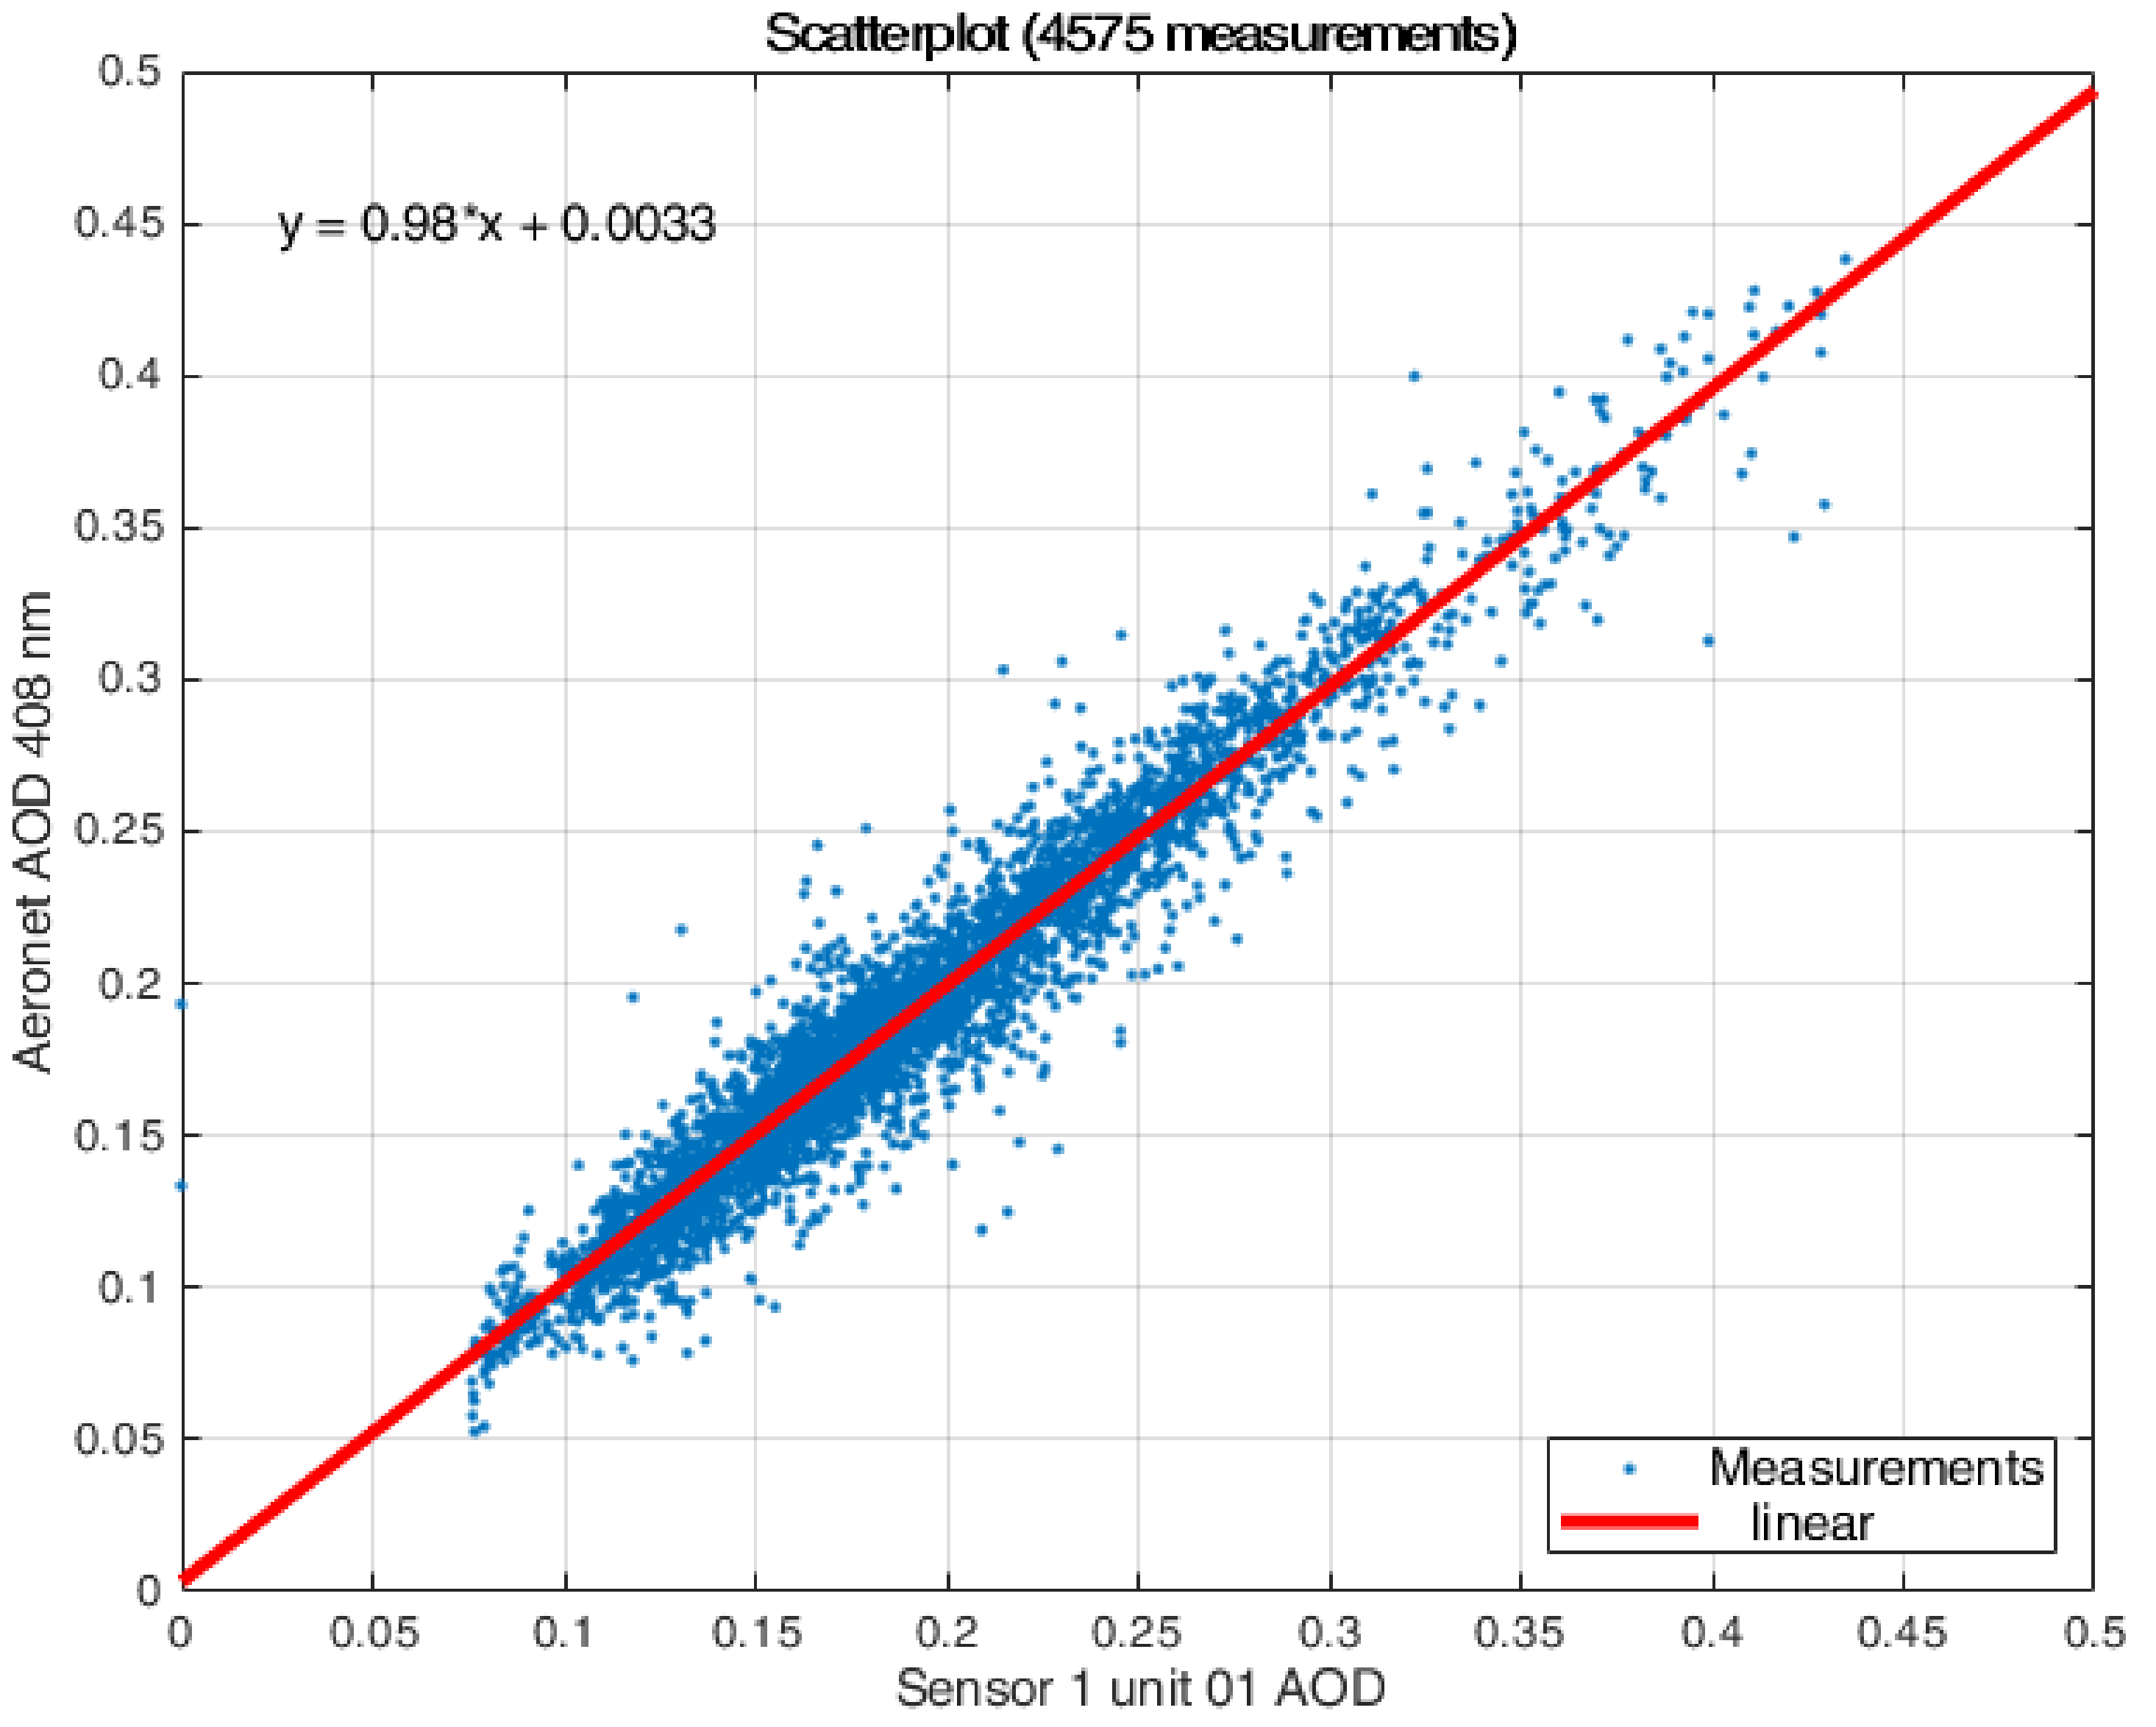
| Unit 1, Sensor 1 | 4575 | −0.0003 | 0.016 | 0.011 |
| Unit 1, Sensor 2 | 4641 | −0.0009 | 0.021 | 0.013 |
| Unit 1, Sensor 3 | 4093 | −0.0004 | 0.036 | 0.024 |
| Unit 1, Sensor 4 | 3362 | 0.0040 | 0.043 | 0.016 |
| Unit 2, Sensor 1 | 1532 | −0.0011 | 0.019 | 0.010 |
| Unit 2, Sensor 2 | 1336 | −0.0034 | 0.013 | 0.011 |
| Unit 2, Sensor 3 | 1561 | −0.0009 | 0.016 | 0.010 |
| Unit 2, Sensor 4 | 1195 | −0.0007 | 0.023 | 0.011 |
| Unit 3, Sensor 1 | - | - | - | - |
| Unit 3, Sensor 2 | 1371 | 0.0001 | 0.013 | 0.010 |
| Unit 3, Sensor 3 | 1381 | 0.0012 | 0.013 | 0.009 |
| Unit 3, Sensor 4 | 1345 | 0.0017 | 0.013 | 0.009 |
| Unit 4, Sensor 1 | 1051 | 0.0003 | 0.011 | 0.008 |
| Unit 4, Sensor 2 | 610 | −0.0015 | 0.013 | 0.009 |
| Unit 4, Sensor 3 | 541 | 0.0022 | 0.045 | 0.022 |
| Unit 4, Sensor 4 | 524 | −0.0004 | 0.010 | 0.008 |
| Unit 5, Sensor 1 | 1229 | −0.0022 | 0.068 | 0.026 |
| Unit 5, Sensor 2 | 1258 | −0.0020 | 0.026 | 0.012 |
| Unit 5, Sensor 3 | 1839 | 0.0001 | 0.039 | 0.015 |
| Unit 5, Sensor 4 | - | - | - | - |
| Unit 6, Sensor 1 | 567 | −0.0001 | 0.028 | 0.016 |
| Unit 6, Sensor 2 | 569 | −0.0003 | 0.015 | 0.010 |
| Unit 6, Sensor 3 | 902 | 0.0011 | 0.032 | 0.014 |
| Unit 6, Sensor 4 | 1217 | 0.0013 | 0.014 | 0.010 |
| Unit 7, Sensor 1 | 1087 | −0.0031 | 0.050 | 0.019 |
| Unit 7, Sensor 2 | 1240 | −0.0021 | 0.033 | 0.012 |
| Unit 7, Sensor 3 | 1365 | 0.0018 | 0.017 | 0.013 |
| Unit 7, Sensor 4 | 1309 | 0.0016 | 0.012 | 0.009 |
| Unit 8, Sensor 1 | 1367 | −0.0004 | 0.011 | 0.008 |
| Unit 8, Sensor 2 | 1410 | −0.0007 | 0.016 | 0.010 |
| Unit 8, Sensor 3 | 1352 | 0.0018 | 0.013 | 0.010 |
| Unit 8, Sensor 4 | 1340 | −0.0009 | 0.011 | 0.008 |
| Unit 9, Sensor 1 | 692 | 0.0024 | 0.013 | 0.010 |
| Unit 9, Sensor 2 | 602 | 0.0002 | 0.012 | 0.009 |
| Unit 9, Sensor 3 | 709 | 0.0032 | 0.010 | 0.008 |
| Unit 9, Sensor 4 | 599 | 0.0022 | 0.011 | 0.009 |
| Unit 10, Sensor 1 | 309 | 0.001 | 0.012 | 0.009 |
| Unit 10, Sensor 2 | 305 | −0.0026 | 0.013 | 0.010 |
| Unit 10, Sensor 3 | 214 | 0.0027 | 0.019 | 0.015 |
| Unit 10, Sensor 4 | 309 | 0.0026 | 0.015 | 0.012 |
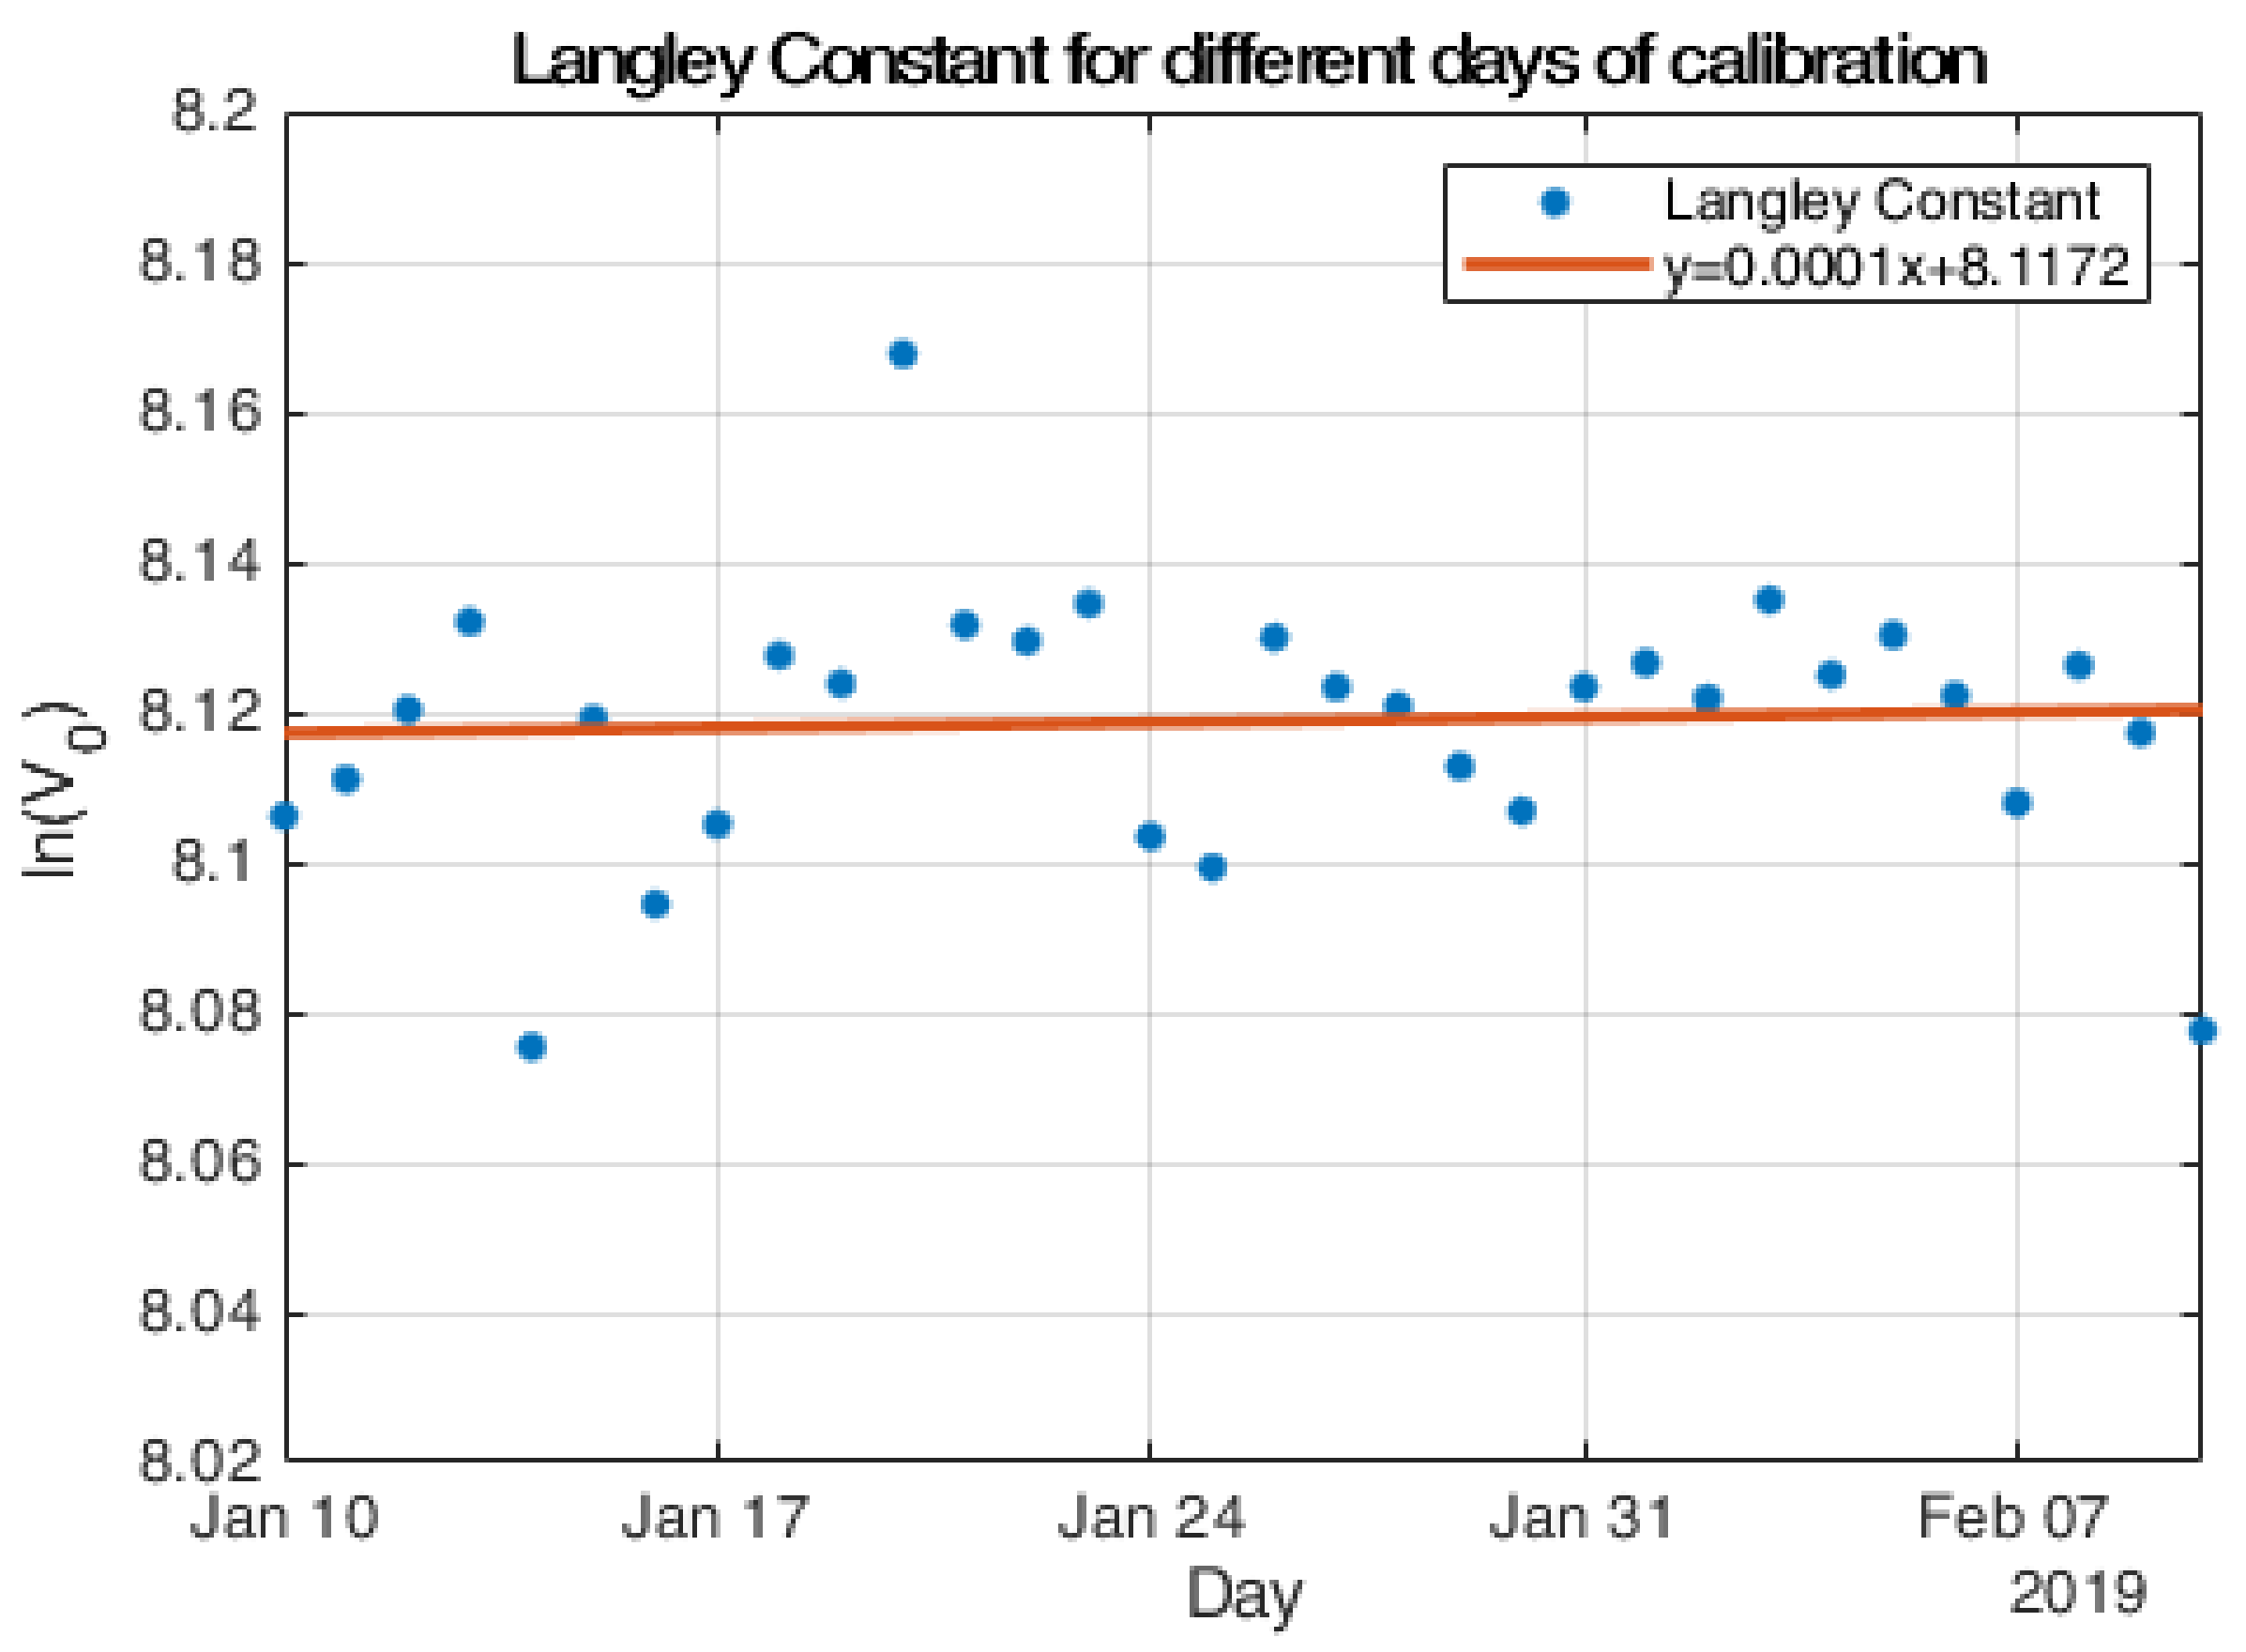
Appendix A.3. Calibration Constants Time Series

References
- Wallace, J.M.; Hobbs, P.V. Atmospheric Science: An Introductory Survey; Elsevier: Amsterdam, The Netherlands, 2006; Volume 92. [Google Scholar]
- Zhang, R.; Wang, G.; Guo, S.; Zamora, M.L.; Ying, Q.; Lin, Y.; Wang, W.; Hu, M.; Wang, Y. Formation of urban fine particulate matter. Chem. Rev. 2015, 115, 3803–3855. [Google Scholar] [CrossRef] [PubMed]
- Ghan, S.J.; Schwartz, S.E. Aerosol properties and processes: A path from field and laboratory measurements to global climate models. Bull. Am. Meteorol. Soc. 2007, 88, 1059–1084. [Google Scholar] [CrossRef] [Green Version]
- Kim, D.; Ramanathan, V. Solar radiation budget and radiative forcing due to aerosols and clouds. J. Geophys. Res. Atmos. 2008, 113. [Google Scholar] [CrossRef] [Green Version]
- Huang, J.; Fu, Q.; Su, J.; Tang, Q.; Minnis, P.; Hu, Y.; Yi, Y.; Zhao, Q. Taklimakan dust aerosol radiative heating derived from CALIPSO observations using the Fu-Liou radiation model with CERES constraints. Atmos. Chem. Phys. 2009, 9, 4011–4021. [Google Scholar] [CrossRef]
- Pope, F.D.; Braesicke, P.; Grainger, R.; Kalberer, M.; Watson, I.; Davidson, P.; Cox, R. Stratospheric aerosol particles and solar-radiation management. Nat. Clim. Chang. 2012, 2, 713–719. [Google Scholar] [CrossRef]
- Dayou, J.; Chang, J.H.W.; Sentian, J. Ground-Based Aerosol Optical Depth Measurement Using Sunphotometers; Springer: Berlin/Heidelberg, Germany, 2014. [Google Scholar]
- Cruz, C.N.; Pandis, S.N. A study of the ability of pure secondary organic aerosol to act as cloud condensation nuclei. Atmos. Environ. 1997, 31, 2205–2214. [Google Scholar] [CrossRef]
- VanReken, T.M.; Rissman, T.A.; Roberts, G.C.; Varutbangkul, V.; Jonsson, H.H.; Flagan, R.C.; Seinfeld, J.H. Toward aerosol/cloud condensation nuclei (CCN) closure during CRYSTAL-FACE. J. Geophys. Res. Atmos. 2003, 108. [Google Scholar] [CrossRef]
- Che, H.; Zhang, X.; Wang, Y.; Zhang, L.; Shen, X.; Zhang, Y.; Ma, Q.; Sun, J.; Zhang, Y.; Wang, T. Characterization and parameterization of aerosol cloud condensation nuclei activation under different pollution conditions. Sci. Rep. 2016, 6, 24497. [Google Scholar] [CrossRef]
- Li, Z.; Rosenfeld, D.; Fan, J. Aerosols and their impact on radiation, clouds, precipitation, and severe weather events. In Oxford Research Encyclopedia of Environmental Science; U.S. Department of Energy Office of Scientific and Technical Information: Richland, WA, USA, 2017. [Google Scholar]
- Brunekreef, B.; Holgate, S.T. Air pollution and health. Lancet 2002, 360, 1233–1242. [Google Scholar] [CrossRef]
- Bessagnet, B.; Hodzic, A.; Vautard, R.; Beekmann, M.; Cheinet, S.; Honoré, C.; Liousse, C.; Rouil, L. Aerosol modeling with CHIMERE—preliminary evaluation at the continental scale. Atmos. Environ. 2004, 38, 2803–2817. [Google Scholar] [CrossRef]
- Myhre, G.; Myhre, C.; Samset, B.; Storelvmo, T. Aerosols and their relation to global climate and climate sensitivity. Nat. Educ. Knowl. 2013, 4, 7. [Google Scholar]
- He, T.Y.; Stanič, S.; Gao, F.; Bergant, K.; Veberič, D.; Song, X.Q.; Dolžan, A. Tracking of urban aerosols using combined LIDAR-based remote sensing and ground-based measurements. Atmos. Meas. Tech. 2012, 5, 891–900. [Google Scholar] [CrossRef] [Green Version]
- Toledo, F.; Garrido, C.; Díaz, M.; Rondanelli, R.; Jorquera, S.; Valdivieso, P. AOT Retrieval Procedure for Distributed Measurements With Low-Cost Sun Photometers. J. Geophys. Res. Atmos. 2018, 123, 1113–1131. [Google Scholar] [CrossRef] [Green Version]
- Lapere, R.; Menut, L.; Mailler, S.; Huneeus, N. Soccer games and record-breaking PM 2.5 pollution events in Santiago, Chile. Atmos. Chem. Phys. 2020, 20, 4681–4694. [Google Scholar] [CrossRef] [Green Version]
- Lapere, R.; Mailler, S.; Menut, L. The 2017 Mega-Fires in Central Chile: Impacts on Regional Atmospheric Composition and Meteorology Assessed from Satellite Data and Chemistry-Transport Modeling. Atmosphere 2021, 12, 344. [Google Scholar] [CrossRef]
- Sasano, Y. Tropospheric aerosol extinction coefficient profiles derived from scanning lidar measurements over Tsukuba, Japan, from 1990 to 1993. Appl. Opt. 1996, 35, 4941–4952. [Google Scholar] [CrossRef] [PubMed] [Green Version]
- Holben, B.N.; Eck, T.F.; Slutsker, I.; Tanre, D.; Buis, J.; Setzer, A.; Vermote, E.; Reagan, J.A.; Kaufman, Y.; Nakajima, T.; et al. AERONET—A federated instrument network and data archive for aerosol characterization. Remote Sens. Environ. 1998, 66, 1–16. [Google Scholar] [CrossRef]
- Holben, B.N.; Kim, J.; Sano, I.; Mukai, S.; Eck, T.F.; Giles, D.M.; Schafer, J.S.; Sinyuk, A.; Slutsker, I.; Smirnov, A.; et al. An overview of mesoscale aerosol processes, comparisons, and validation studies from DRAGON networks. Atmos. Chem. Phys. 2018, 18, 655–671. [Google Scholar] [CrossRef] [Green Version]
- King, M.D.; Menzel, W.P.; Kaufman, Y.J.; Tanré, D.; Gao, B.C.; Platnick, S.; Ackerman, S.A.; Remer, L.A.; Pincus, R.; Hubanks, P.A. Cloud and aerosol properties, precipitable water, and profiles of temperature and water vapor from MODIS. IEEE Trans. Geosci. Remote Sens. 2003, 41, 442–458. [Google Scholar] [CrossRef] [Green Version]
- Lyapustin, A.; Wang, Y.; Korkin, S.; Huang, D. MODIS collection 6 MAIAC algorithm. Atmos. Meas. Tech. 2018, 11, 5741–5765. [Google Scholar] [CrossRef] [Green Version]
- Virtanen, T.H.; Kolmonen, P.; Sogacheva, L.; Rodríguez, E.; Saponaro, G.; Leeuw, G.D. Collocation mismatch uncertainties in satellite aerosol retrieval validation. Atmos. Meas. Tech. 2018, 11, 925–938. [Google Scholar] [CrossRef] [Green Version]
- Liu, B.; Ma, Y.; Gong, W.; Zhang, M.; Wang, W.; Shi, Y. Comparison of AOD from CALIPSO, MODIS, and sun photometer under different conditions over central China. Sci. Rep. 2018, 8, 10066. [Google Scholar] [CrossRef] [PubMed] [Green Version]
- Zhang, H.; Kondragunta, S.; Laszlo, I.; Zhou, M. Improving GOES Advanced Baseline Imager (ABI) aerosol optical depth (AOD) retrievals using an empirical bias correction algorithm. Atmos. Meas. Tech. 2020, 13, 5955–5975. [Google Scholar] [CrossRef]
- Wei, J.; Li, Z.; Sun, L.; Peng, Y.; Zhang, Z.; Li, Z.; Su, T.; Feng, L.; Cai, Z.; Wu, H. Evaluation and uncertainty estimate of next-generation geostationary meteorological Himawari-8/AHI aerosol products. Sci. Total Environ. 2019, 692, 879–891. [Google Scholar] [CrossRef] [PubMed]
- Escribano, J.; Gallardo, L.; Rondanelli, R.; Choi, Y.S. Satellite retrievals of aerosol optical depth over a subtropical urban area: The role of stratification and surface reflectance. Aerosol Air Qual. Res. 2014, 14, 596–607. [Google Scholar] [CrossRef] [Green Version]
- Boersma, K.; De Vroom, J. Validation of MODIS aerosol observations over the Netherlands with GLOBE student measurements. J. Geophys. Res. Atmos. 2006, 111. [Google Scholar] [CrossRef] [Green Version]
- De Almeida Castanho, A.; Prinn, R.; Martins, V.; Herold, M.; Ichoku, C.; Molina, L. Analysis of Visible/SWIR surface reflectance ratios for aerosol retrievals from satellite in Mexico City urban area. Atmos. Chem. Phys. 2007, 7, 5467–5477. [Google Scholar] [CrossRef] [Green Version]
- Del Hoyo, M.; Rondanelli, R.; Escobar, R. Significant decrease of photovoltaic power production by aerosols. The case of Santiago de Chile. Renew. Energy 2020, 148, 1137–1149. [Google Scholar] [CrossRef]
- Ostro, B.; Sanchez, J.M.; Aranda, C.; Eskeland, G.S. Air pollution and mortality: Results from a study of Santiago, Chile. J. Expo. Anal. Environ. Epidemiol. 1996, 6, 97–114. [Google Scholar]
- Nakajima, T.; Campanelli, M.; Che, H.; Estellés, V.; Irie, H.; Kim, S.W.; Kim, J.; Liu, D.; Nishizawa, T.; Pandithurai, G.; et al. An overview of and issues with sky radiometer technology and SKYNET. Atmos. Meas. Tech. 2020, 13, 4195–4218. [Google Scholar] [CrossRef]
- Morys, M.; Mims, F.M., III ; Hagerup, S.; Anderson, S.E.; Baker, A.; Kia, J.; Walkup, T. Design, calibration, and performance of MICROTOPS II handheld ozone monitor and Sun photometer. J. Geophys. Res. Atmos. 2001, 106, 14573–14582. [Google Scholar] [CrossRef] [Green Version]
- Brooks, D.R.; Mims, F.M., III. Development of an inexpensive handheld LED-based Sun photometer for the GLOBE program. J. Geophys. Res. Atmos. 2001, 106, 4733–4740. [Google Scholar] [CrossRef]
- Barreto, A.; Cuevas, E.; Granados-Muñoz, M.J.; Alados-Arboledas, L.; Romero, P.M.; Gröbner, J.; Kouremeti, N.; Almansa, A.F.; Stone, T.; Toledano, C.; et al. The new sun-sky-lunar Cimel CE318-T multiband photometer—A comprehensive performance evaluation. Atmos. Meas. Tech. 2016, 9, 631–654. [Google Scholar] [CrossRef] [Green Version]
- Brooks, D.R. Bringing the Sun Down to Earth: Designing Inexpensive Instruments for Monitoring the Atmosphere; Springer Science & Business Media: Berlin/Heidelberg, Germany, 2008. [Google Scholar]
- Seinfeld, J.H.; Pandis, S.N. Atmospheric Chemistry and Physics: From Air Pollution to Climate Change; John Wiley & Sons: Hoboken, NJ, USA, 2016. [Google Scholar]
- Young, A.T. Air mass and refraction. Appl. Opt. 1994, 33, 1108–1110. [Google Scholar] [CrossRef] [PubMed]
- Reda, I.; Andreas, A. Solar position algorithm for solar radiation applications. Sol. Energy 2004, 76, 577–589. [Google Scholar] [CrossRef]
- Bucholtz, A. Rayleigh-scattering calculations for the terrestrial atmosphere. Appl. Opt. 1995, 34, 2765–2773. [Google Scholar] [CrossRef]
- Toledano, C.; González, R.; Fuertes, D.; Cuevas, E.; Eck, T.F.; Kazadzis, S.; Kouremeti, N.; Gröbner, J.; Goloub, P.; Blarel, L.; et al. Assessment of Sun photometer Langley calibration at the high-elevation sites Mauna Loa and Izaña. Atmos. Chem. Phys. 2018, 18, 14555–14567. [Google Scholar] [CrossRef] [Green Version]
- Ångström, A. On the atmospheric transmission of sun radiation and on dust in the air. Geogr. Ann. 1929, 11, 156–166. [Google Scholar]
- Schuster, G.L.; Dubovik, O.; Holben, B.N. Angstrom exponent and bimodal aerosol size distributions. J. Geophys. Res. Atmos. 2006, 111. [Google Scholar] [CrossRef] [Green Version]
- Gersen, S.; Van Essen, M.; Visser, P.; Ahmad, M.; Mokhov, A.; Sepman, A.; Alberts, R.; Douma, A.; Levinsky, H. Detection of H2S, SO2 and NO2 in CO2 at pressures ranging from 1-40 bar by using broadband absorption spectroscopy in the UV/VIS range. Energy Procedia 2014, 63, 2570–2582. [Google Scholar] [CrossRef] [Green Version]
- Mobley, C.D.; Werdell, J.; Franz, B.; Ahmad, Z.; Bailey, S. Atmospheric Correction for sAtellite Ocean Color Radiometry. 2016. Available online: https://www.researchgate.net/publication/321536667_Atmospheric_Correction_for_Satellite_Ocean_Color_Radiometry (accessed on 20 October 2021).
- Ahmad, Z.; McClain, C.R.; Herman, J.R.; Franz, B.A.; Kwiatkowska, E.J.; Robinson, W.D.; Bucsela, E.J.; Tzortziou, M. Atmospheric correction for NO2 absorption in retrieving water-leaving reflectances from the SeaWiFS and MODIS measurements. Appl. Opt. 2007, 46, 6504–6512. [Google Scholar] [CrossRef] [PubMed] [Green Version]
- Van Geffen, J.; Eskes, H.; Boersma, K.; Maasakkers, J.; Veefkind, J. TROPOMI ATBD of the Total and Tropospheric NO2 Data Products, Report S5P-KNMI-L2-0005-RP, 21AD. Available online: https://sentinel.esa.int/documents/247904/2476257/Sentinel-5P-TROPOMI-ATBD-NO2-data-products (accessed on 20 October 2021).
- Schmitz, R. Modelling of air pollution dispersion in Santiago de Chile. Atmos. Environ. 2005, 39, 2035–2047. [Google Scholar] [CrossRef]
- Huneeus, N.; Lapere, R.; Mazzeo, A.; Ordóñez, C.; Donoso, N.; Muñoz, R.; Rutllant, J.A. Deep winter intrusions of urban black carbon into a canyon near Santiago, Chile: A pathway towards Andean glaciers. Environ. Pollut. 2021, 291, 118124. [Google Scholar] [CrossRef] [PubMed]
- Wendt, E.A.; Quinn, C.W.; Miller-Lionberg, D.D.; Tryner, J.; L’Orange, C.; Ford, B.; Yalin, A.P.; Pierce, J.R.; Jathar, S.; Volckens, J. A low-cost monitor for simultaneous measurement of fine particulate matter and aerosol optical depth–Part 1: Specifications and testing. Atmos. Meas. Tech. 2019, 12, 5431–5441. [Google Scholar] [CrossRef] [Green Version]
- Wagner, F.; Silva, A. Some considerations about Ångström exponent distributions. Atmos. Chem. Phys. Discuss. 2007, 7, 12781–12805. [Google Scholar]
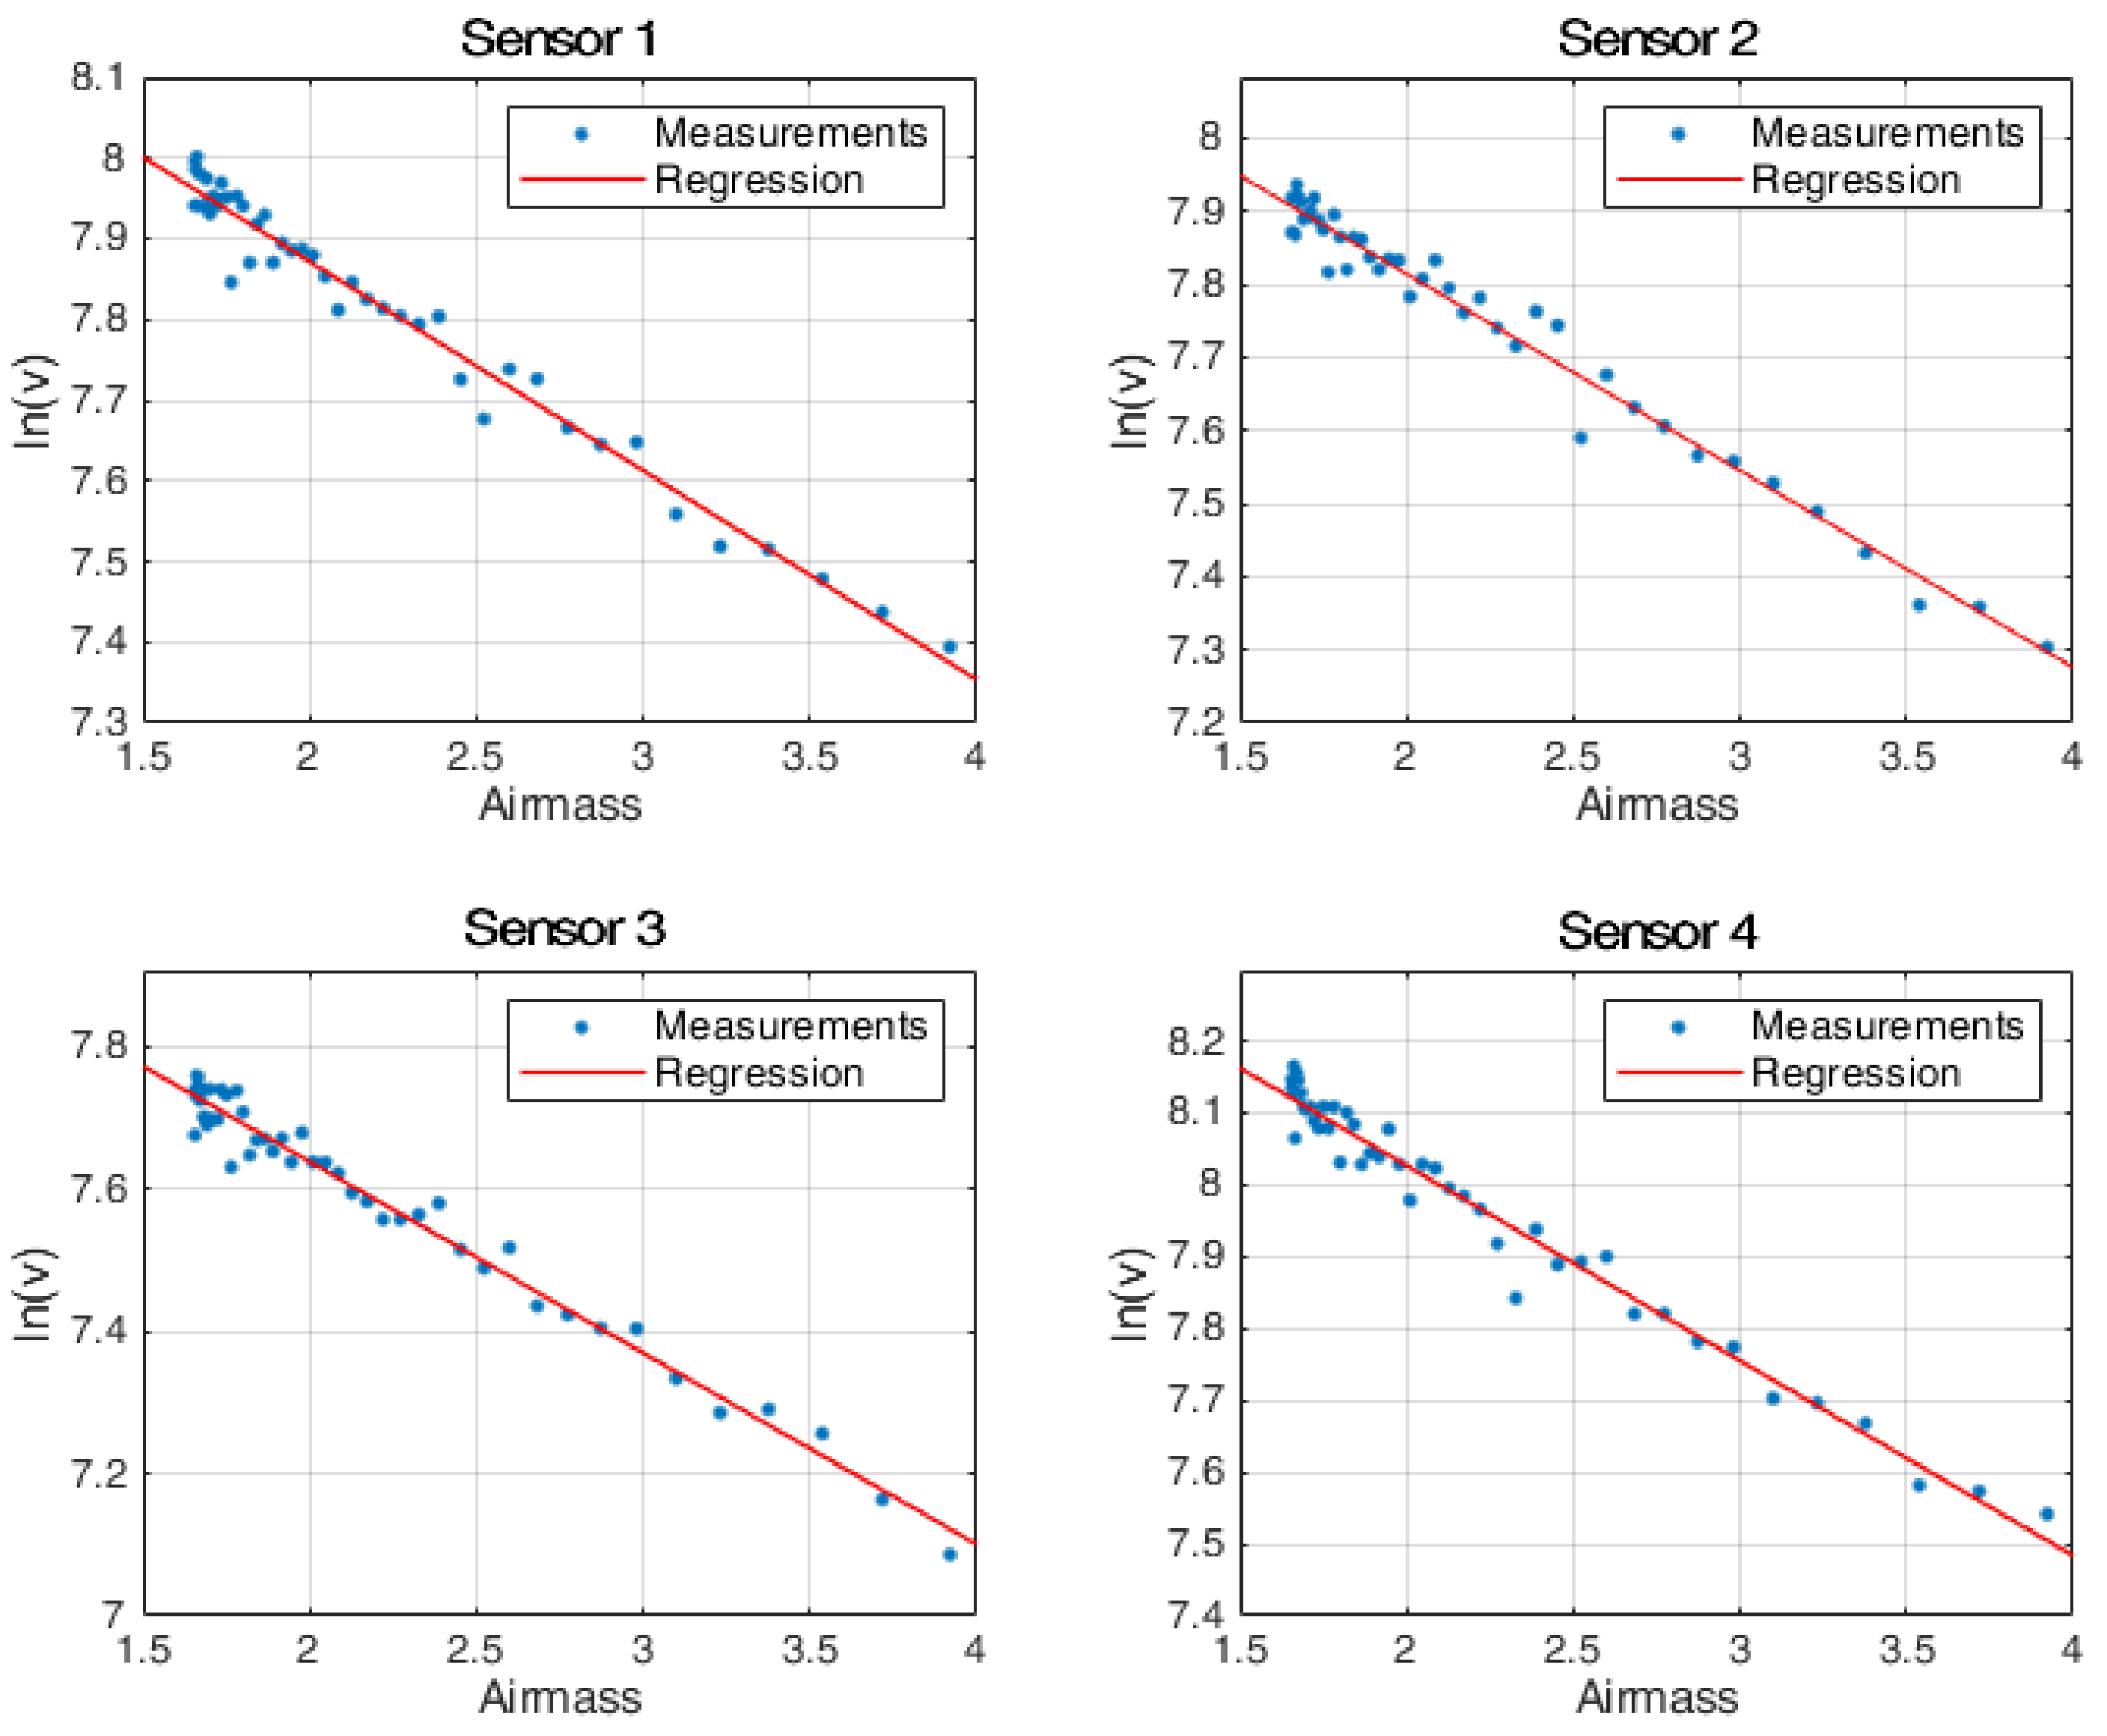
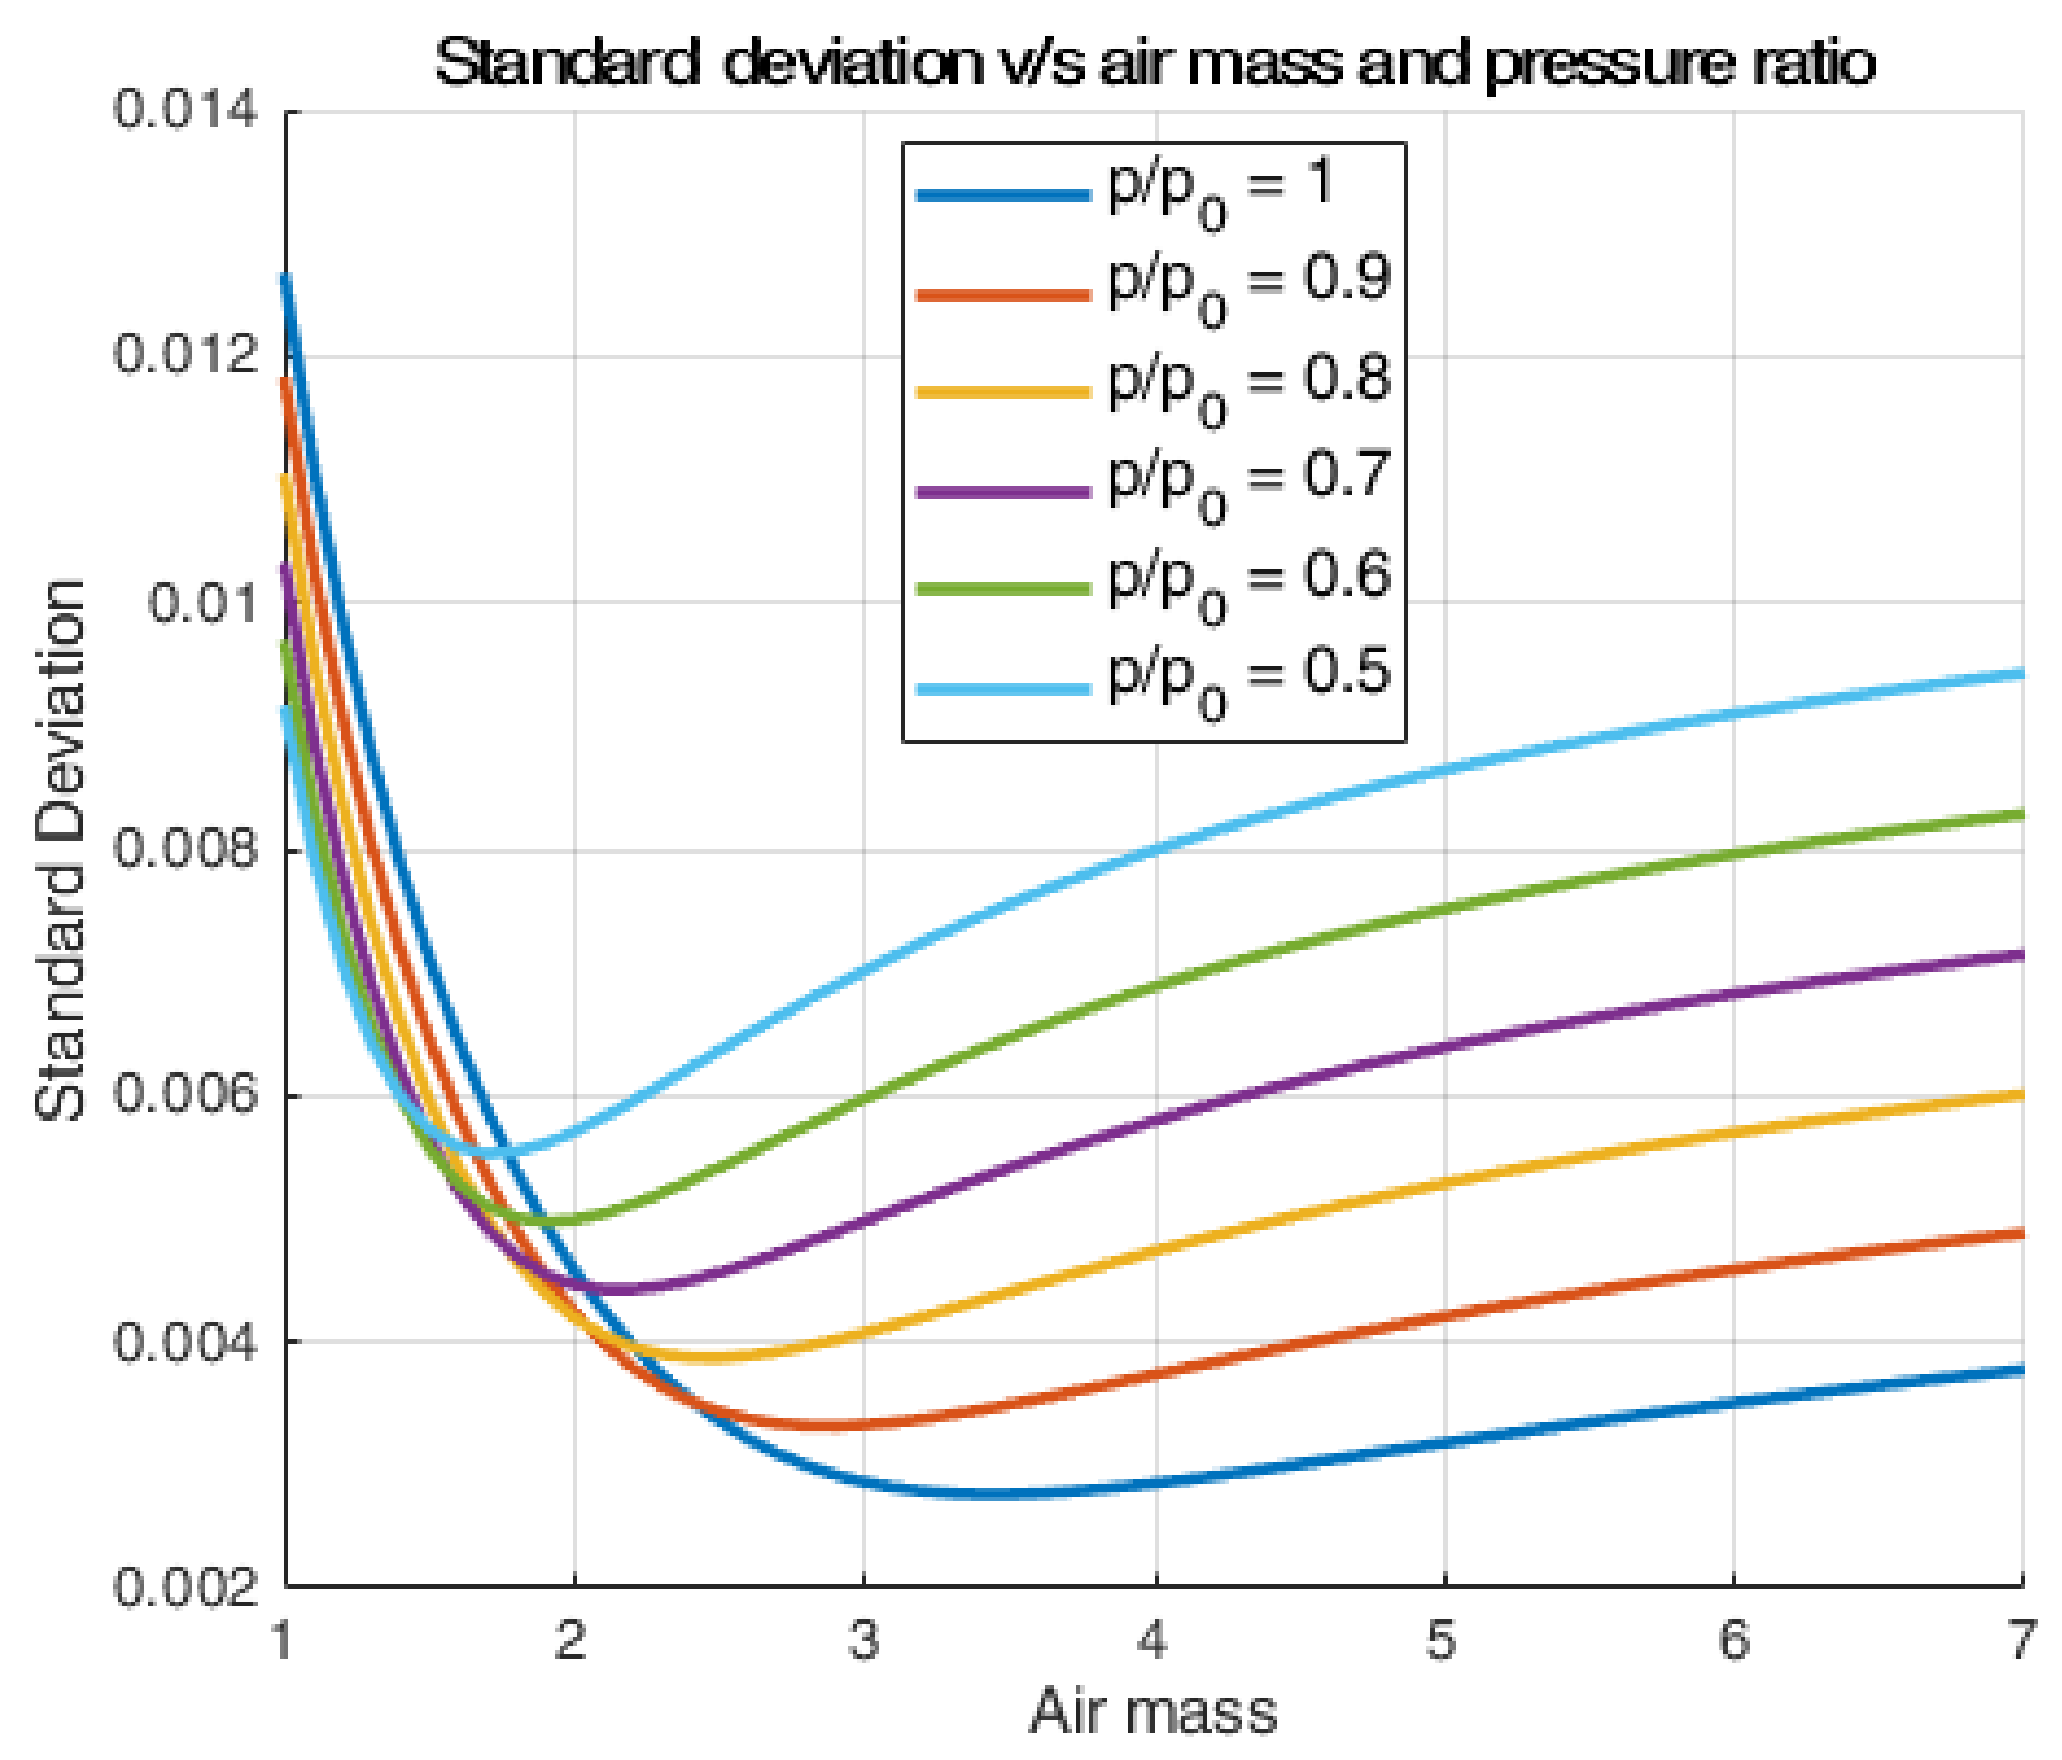

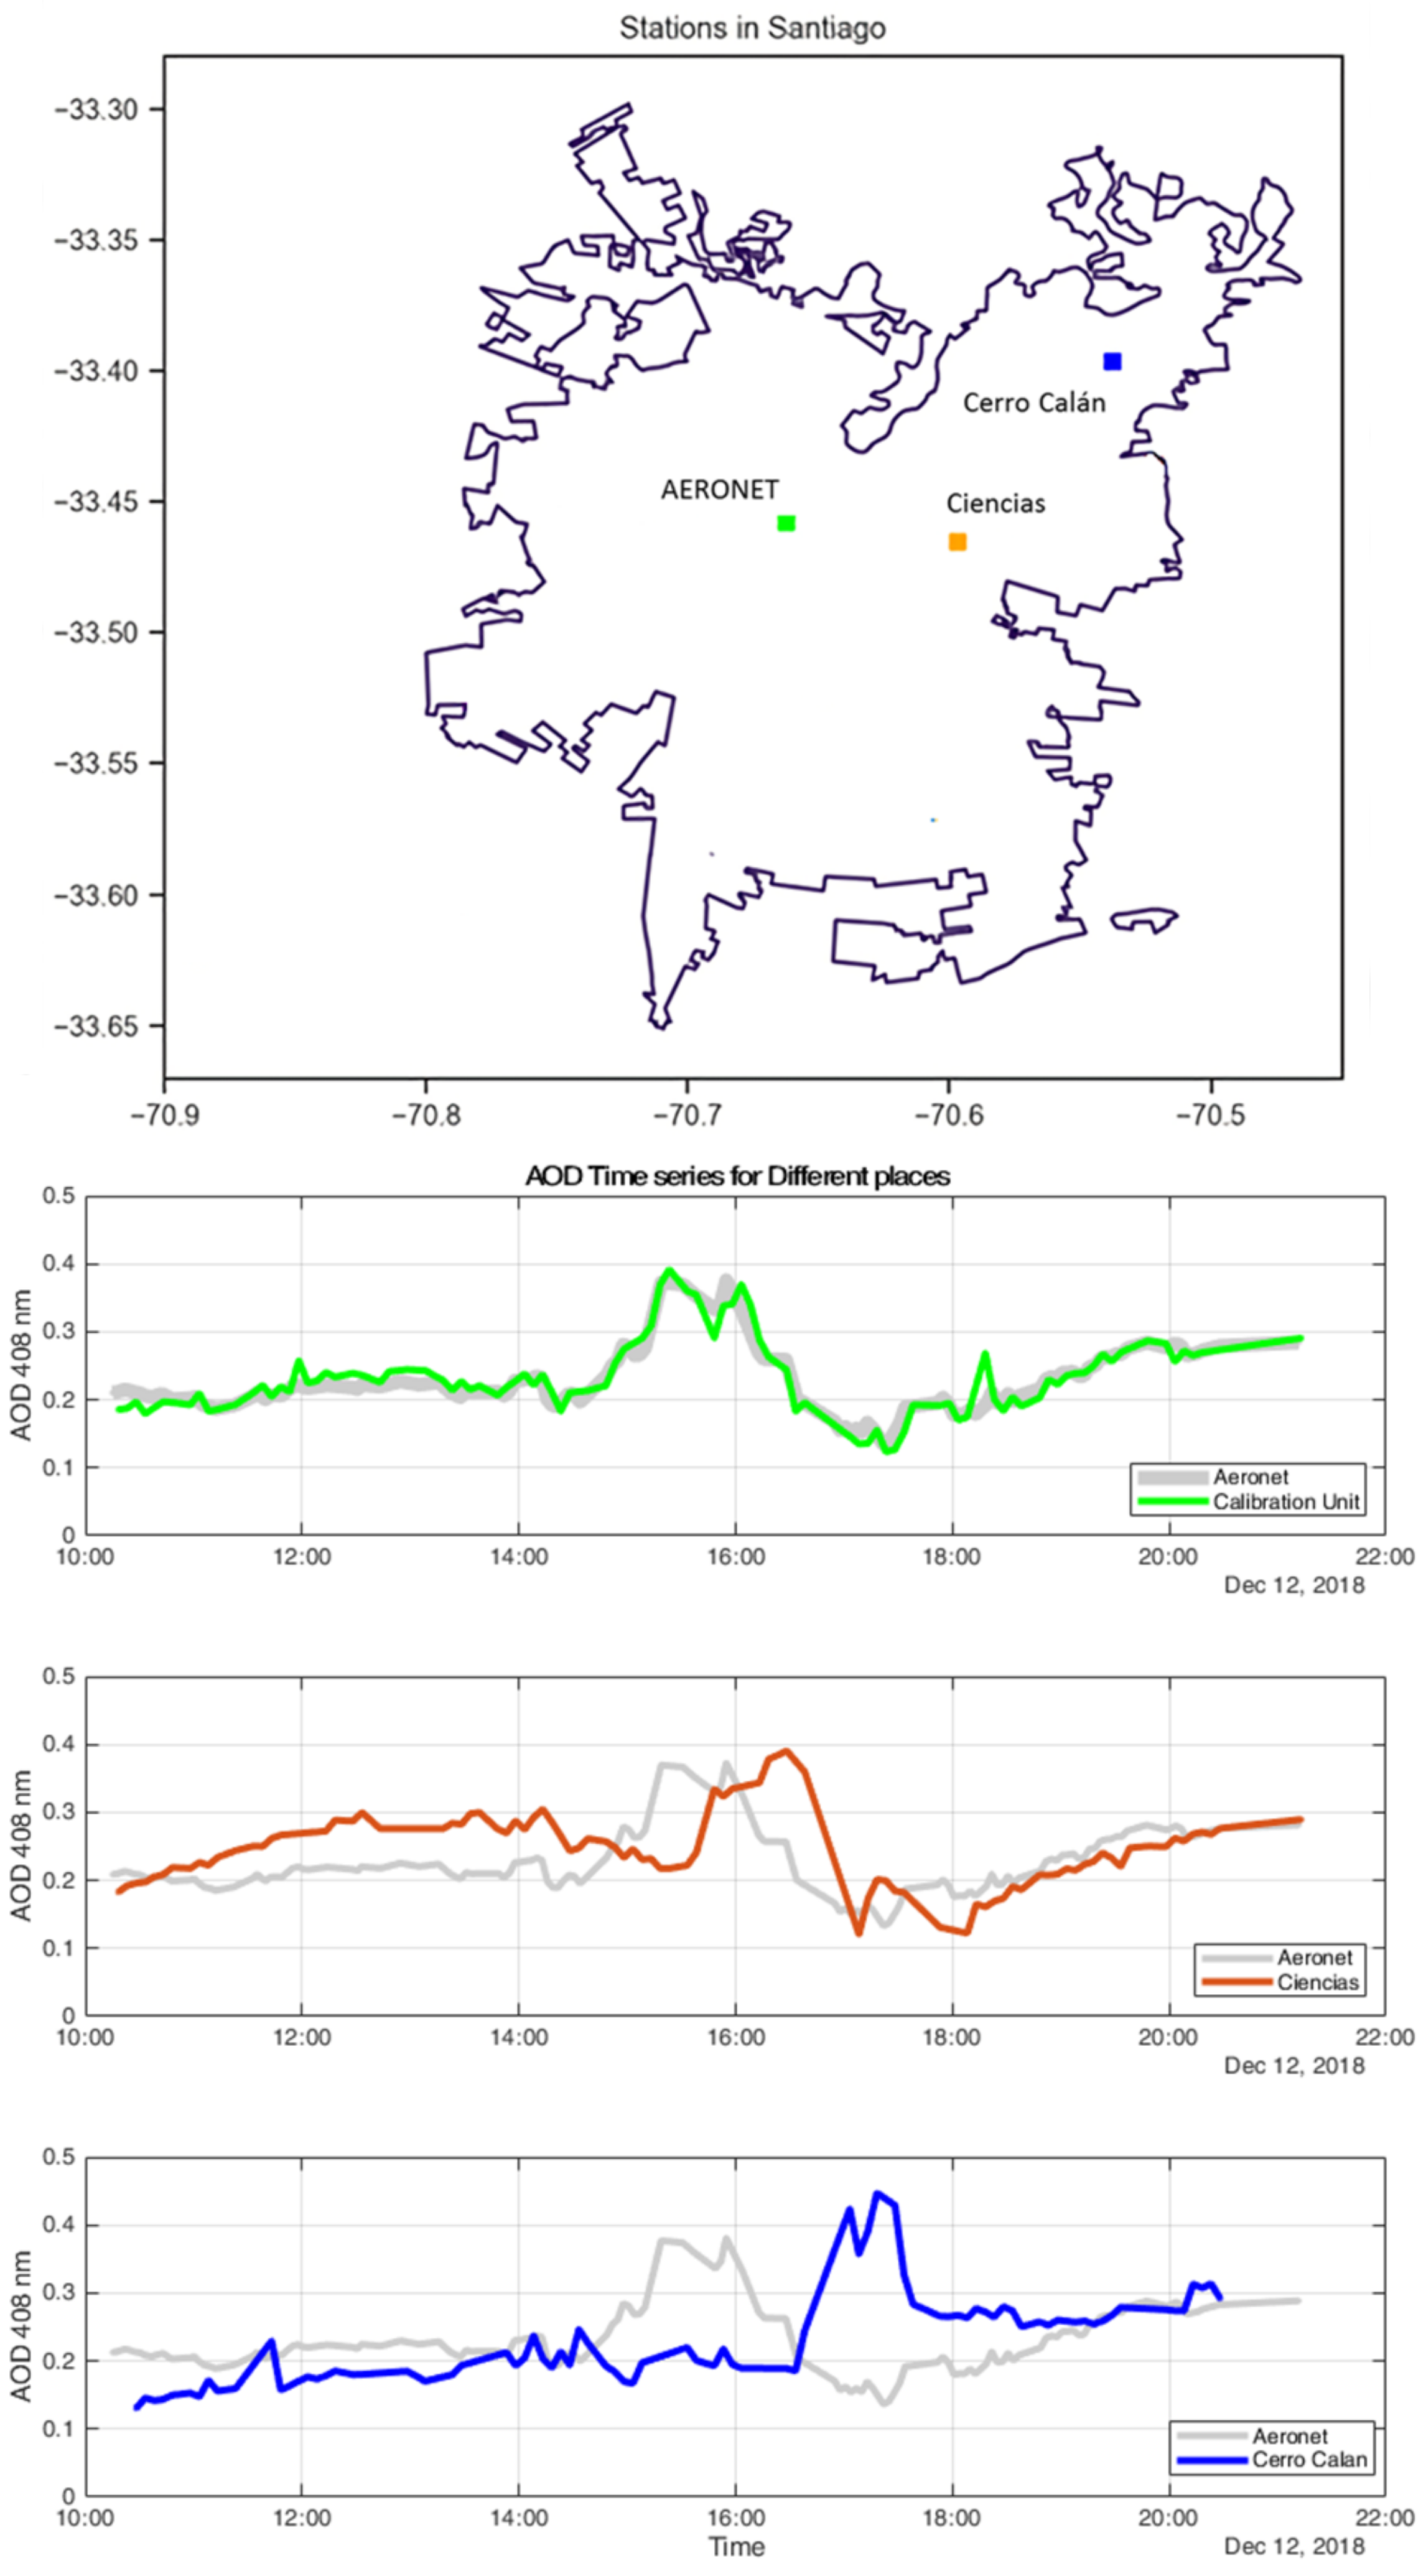
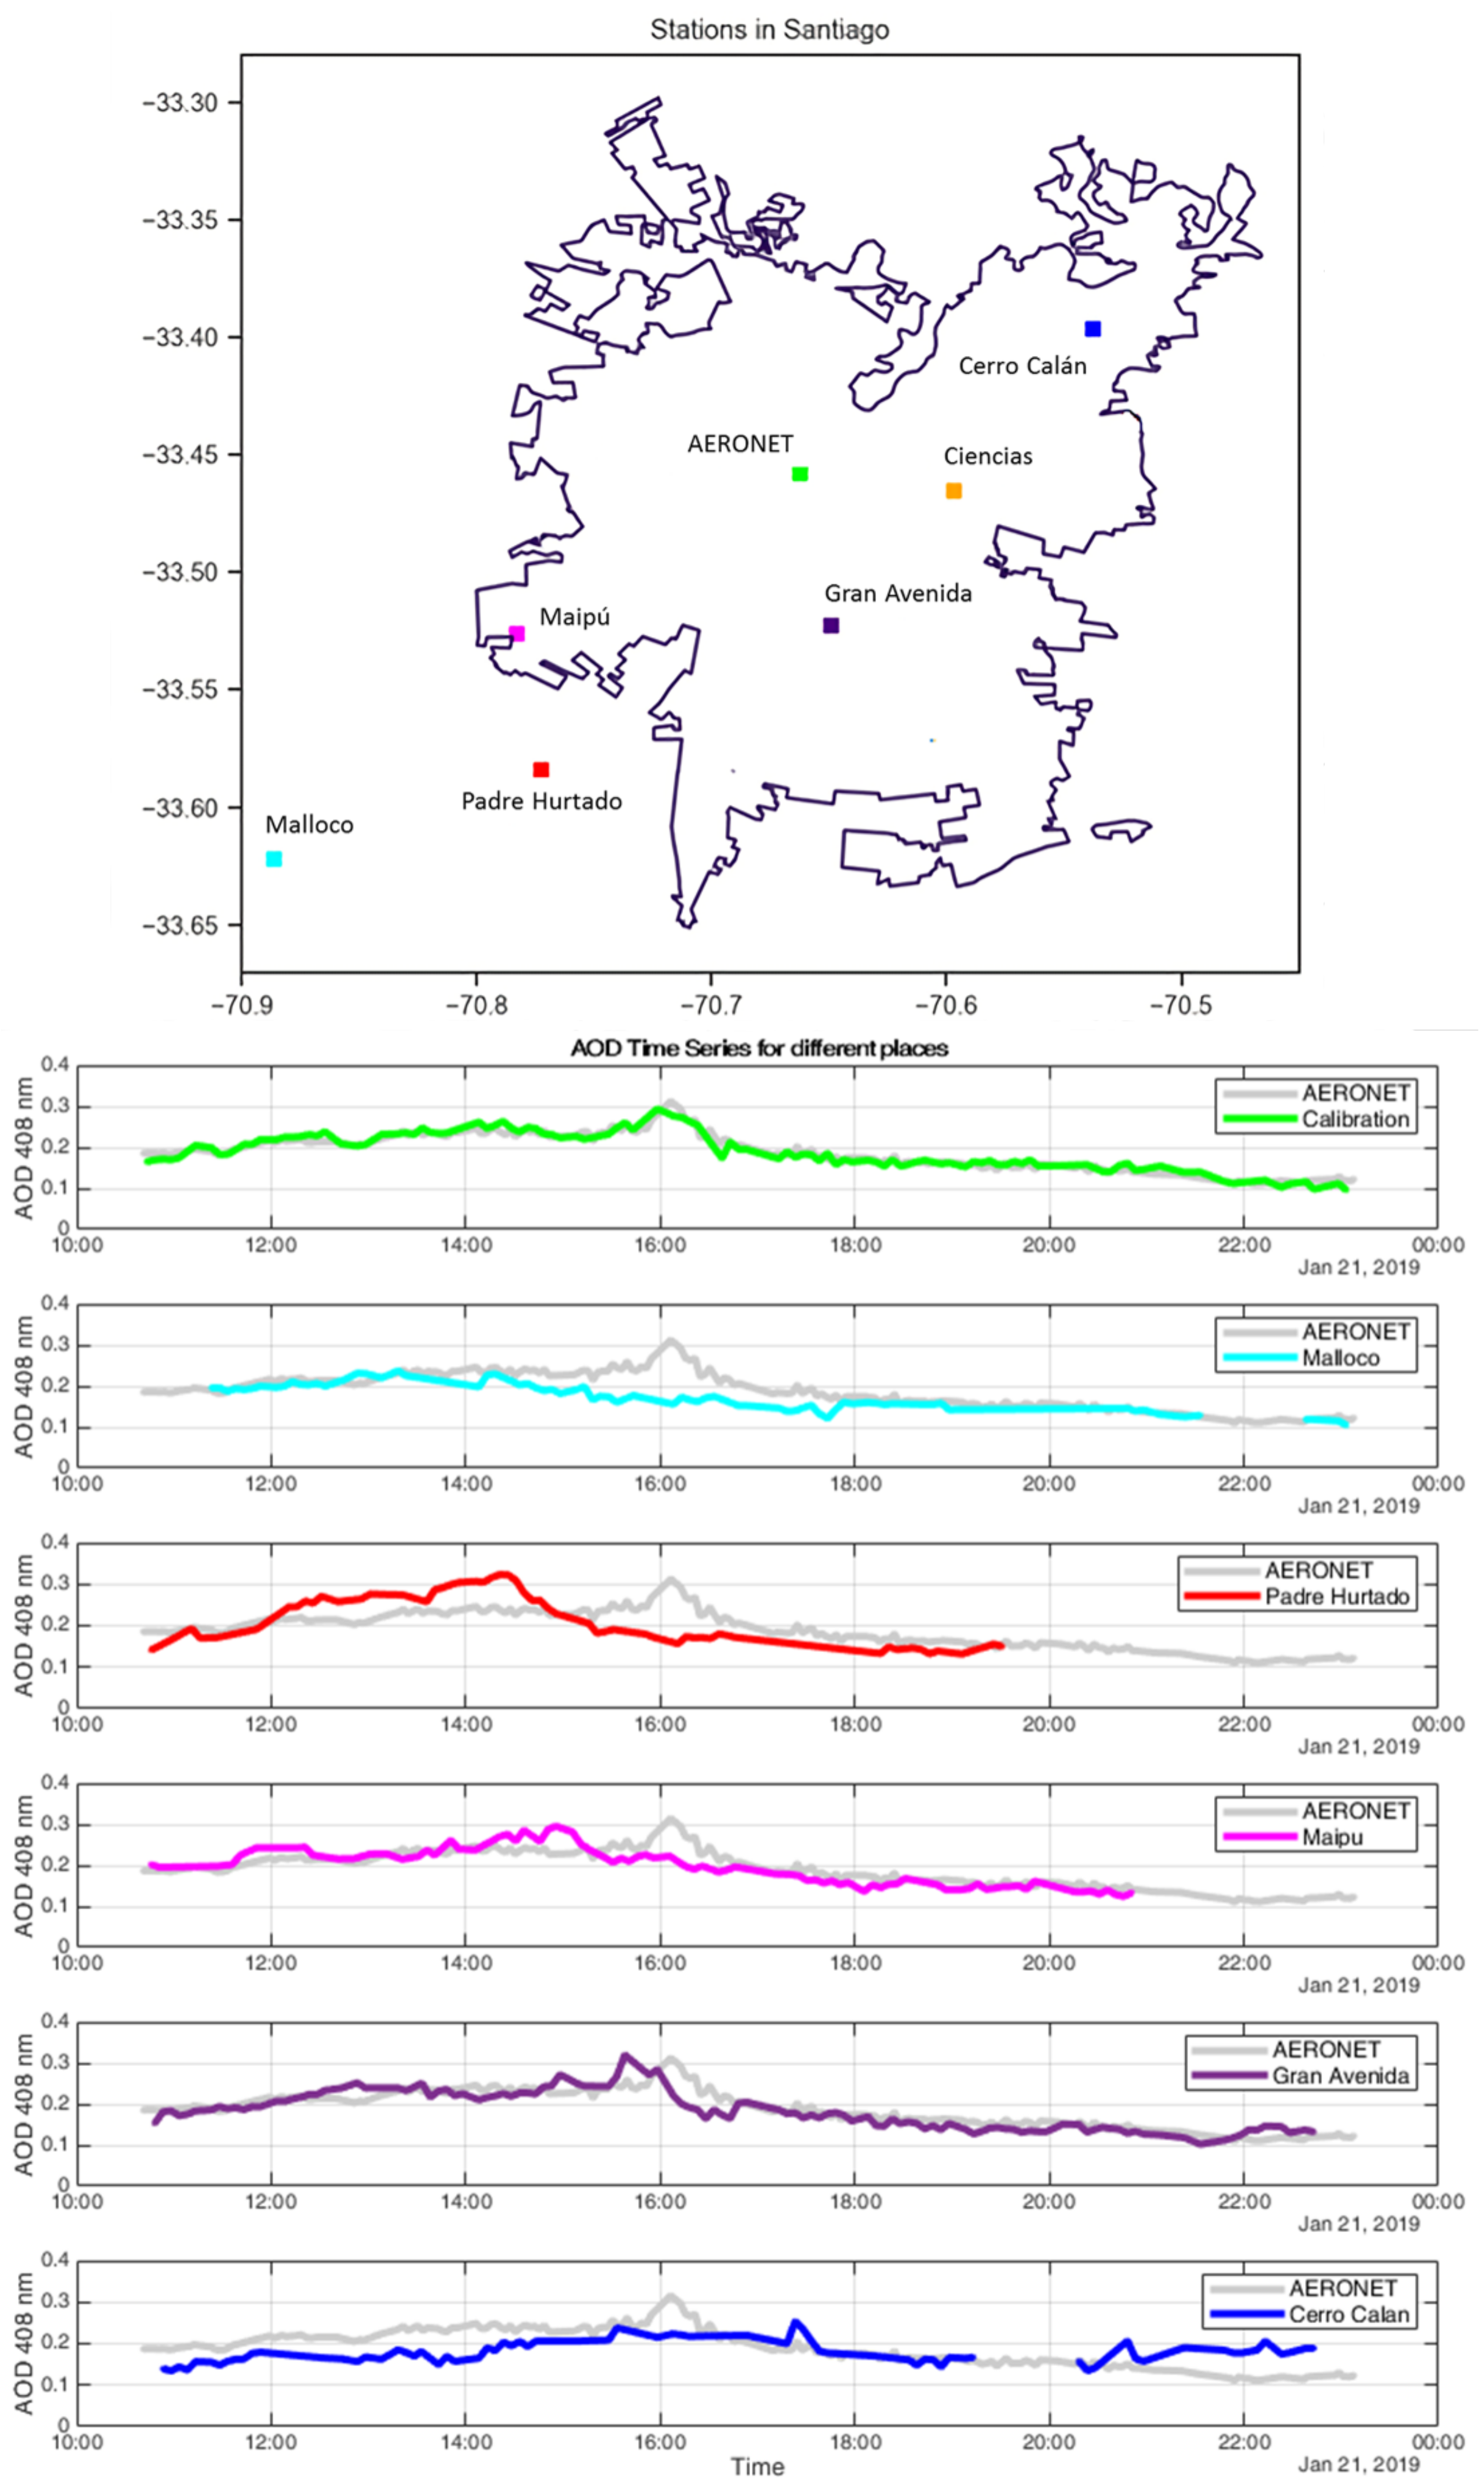
| Sensor | Langley Constant | Langley Constant | Absolute | Relative |
|---|---|---|---|---|
| Number | (Langley Method) | (Fitting Model) | Error | Error |
| Sensor 1 | 8.39 | 8.32 | −0.07 | −0.83% |
| Sensor 2 | 8.35 | 8.32 | −0.03 | −0.36% |
| Sensor 3 | 8.18 | 7.90 | −0.28 | −3.42% |
| Sensor 4 | 8.57 | 8.59 | 0.02 | 0.23% |
| Sensor | Rayleigh Constant | Rayleigh Constant | Absolute | Relative |
|---|---|---|---|---|
| Number | (408 nm) | (Fitting Model) | Error | Error |
| Sensor 1 | 0.33 | 0.30 | −0.03 | −8.86% |
| Sensor 2 | 0.33 | 0.32 | −0.01 | −2.79% |
| Sensor 3 | 0.33 | 0.34 | 0.01 | 3.29% |
| Sensor 4 | 0.33 | 0.36 | 0.03 | 9.36% |
| Bias Cimel and | Mean Standar Deviation |
|---|---|
| Mean All LoCo-ASP | for All LoCo-ASP Measurements |
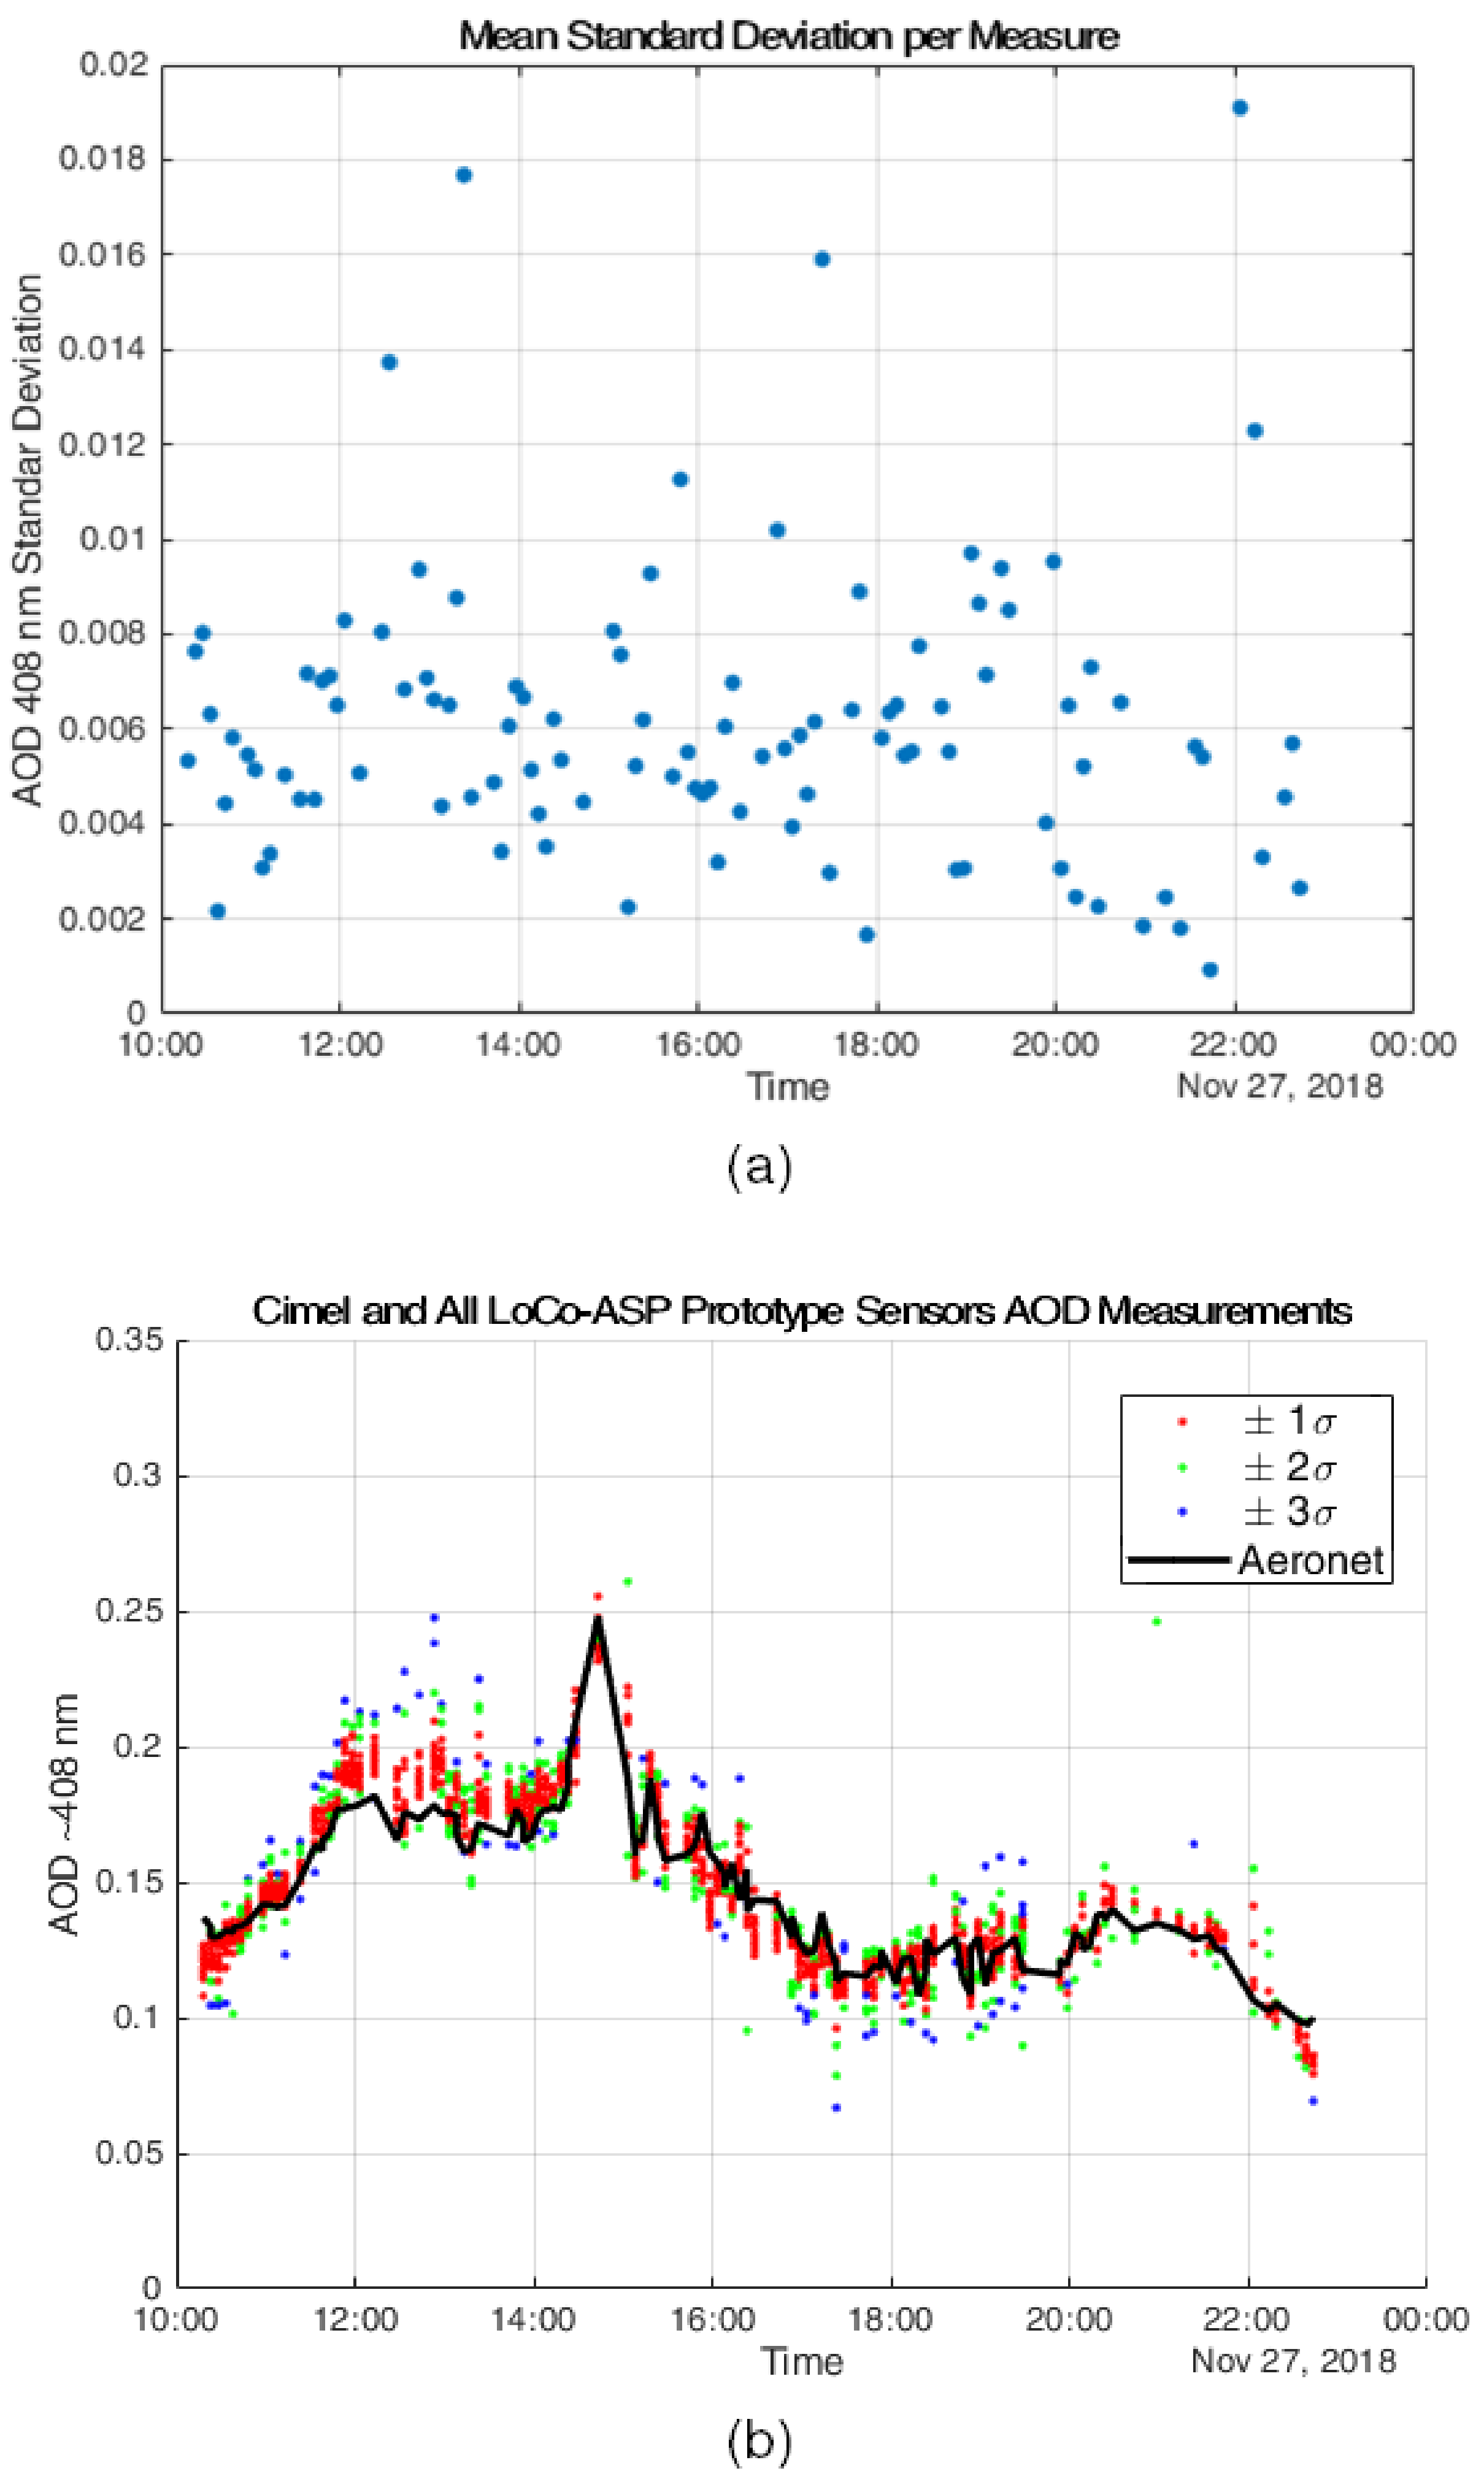
| −0.0017 | 0.0062 |
| Variable | Mean | Standard Deviation |
|---|---|---|
| 3356 | 58.42 | |
| 8.118 | 0.017 | |
| 407.2 | 3.3802 | |
| 0.3313 | 0.0116 |
Publisher’s Note: MDPI stays neutral with regard to jurisdictional claims in published maps and institutional affiliations. |
© 2021 by the authors. Licensee MDPI, Basel, Switzerland. This article is an open access article distributed under the terms and conditions of the Creative Commons Attribution (CC BY) license (https://creativecommons.org/licenses/by/4.0/).
Share and Cite
Garrido, C.; Toledo, F.; Diaz, M.; Rondanelli, R. Automated Low-Cost LED-Based Sun Photometer for City Scale Distributed Measurements. Remote Sens. 2021, 13, 4585. https://doi.org/10.3390/rs13224585
Garrido C, Toledo F, Diaz M, Rondanelli R. Automated Low-Cost LED-Based Sun Photometer for City Scale Distributed Measurements. Remote Sensing. 2021; 13(22):4585. https://doi.org/10.3390/rs13224585
Chicago/Turabian StyleGarrido, Cristobal, Felipe Toledo, Marcos Diaz, and Roberto Rondanelli. 2021. "Automated Low-Cost LED-Based Sun Photometer for City Scale Distributed Measurements" Remote Sensing 13, no. 22: 4585. https://doi.org/10.3390/rs13224585
APA StyleGarrido, C., Toledo, F., Diaz, M., & Rondanelli, R. (2021). Automated Low-Cost LED-Based Sun Photometer for City Scale Distributed Measurements. Remote Sensing, 13(22), 4585. https://doi.org/10.3390/rs13224585


