Article

Assessing Urbanization Dynamics in Turkey’s Marmara Region Using CORINE Data between 2006 and 2018

by
Özlem Altınkaya Genel
1,2 and
ChengHe Guan
3,4,*
1
Kenniscentrum NoorderRuimte, Hanze University of Applied Sciences, Groningen Zernikeplein 1, 9747 AS Groningen, The Netherlands
2
Faculty of Architecture and Design, Özyeğin University, Orman Sk.13, İstanbul 34794, Turkey
3
Arts and Sciences, New York University Shanghai, 1555 Century Avenue, Pudong New District, Shanghai 200122, China
4
Shanghai Key Laboratory of Urban Renewal and Spatial Optimization Technology, Tongji University, Shanghai 200122, China
*
Author to whom correspondence should be addressed.
Remote Sens. 2021, 13(4), 664; https://doi.org/10.3390/rs13040664
Submission received: 9 January 2021 / Revised: 4 February 2021 / Accepted: 10 February 2021 / Published: 12 February 2021

Abstract

:
This study investigated the urban growth dynamics of urban regions. The study area was the Marmara Region, one of the most densely populated and ecologically diverse areas in Turkey. Using CORINE land cover data for 2006, 2012, and 2018, the study utilized multiple correspondence analyses and cluster analyses, to analyze land cover changes. The resulting maps, visualized in GIS, revealed the rapid urban transformation of the regional structure, formerly comprised of four distinct areas, into a more complex structure, in which densification and sprawl occur simultaneously. Our findings demonstrated a dissonance between the spatial dynamics of the Marmara Region during the study period, and the capacity and scope of the simultaneously initiated regional policies and mega-projects. This uncoordinated approach has endangered the region’s sustainable development. The paper, therefore, discusses the importance of land use planning and transboundary collaboration for sustainable regional development. Beyond the local case, the results contribute to critical theories in regional planning by linking theory and practice.

Graphical Abstract

1. Introduction

Urban regions are being shaped by increasingly rapid expansion and densification, accompanied by efficient communications, transportation systems, and economic activity [1,2]. In 2018, the United Nations predicted that 68% of the world population will live in urban areas by 2050 [3]. To achieve current sustainable development goals, all stakeholders urgently need to understand the spatial and temporal transformation of contemporary urban regions. However, there is a gap between contemporary urban planning theories and practices, which hampers decision-making processes. The availability of new data analysis and mapping techniques can fill this gap, which potentially threatens urban regions’ sustainable development.
Beginning from the early 20th century onwards, urban regions’ complex urbanization dynamics have been a central debate in the urban planning and geography disciplines [1,2,4,5,6]. Studies of urban regions questioned the validity of a clear morphological separation between polycentric and monocentric models [7]. Other studies analyzed the complexity and hierarchy of cities and towns [8,9,10,11], in which regional policies, population, accessibility, social and economic indicators, and infrastructural investments shape urban development [12,13,14,15,16]. However, the sustainability challenges of urban regions, stemming from rapid spatial transformation, have demanded a greater focus on the land use/land cover (LULC) change of these areas [17,18].
Within the literature of LULC studies, urban regions’ intra-regional variations are a critical component of the analysis [13,19]. Recent studies on landscape metrics have effectively investigated the spatial–temporal transformation of urban regions by capturing the complex urbanization patterns in different geographical contexts, for sustainable land use policies [20,21,22,23]. Other LULC studies have used different analytical approaches [24,25] to demonstrate that rural areas, beyond urban fringes, are subject to more dynamic spatial transformation than urban cores under the same pressure of regional urbanization. Such findings undermined the validity of urban/rural division and administrative borders in assessing regional urbanization, and revealed the wide-felt urgency for new theoretical concepts.
Research in urban theory recently reformulated the holistic “planetary urbanization” approach [26] to comprehend territorial urbanization beyond an urban/rural division. This literature, however, avoids systemic non-theoretical descriptions. To assess “complex entities” such as regions in geography, Gray [
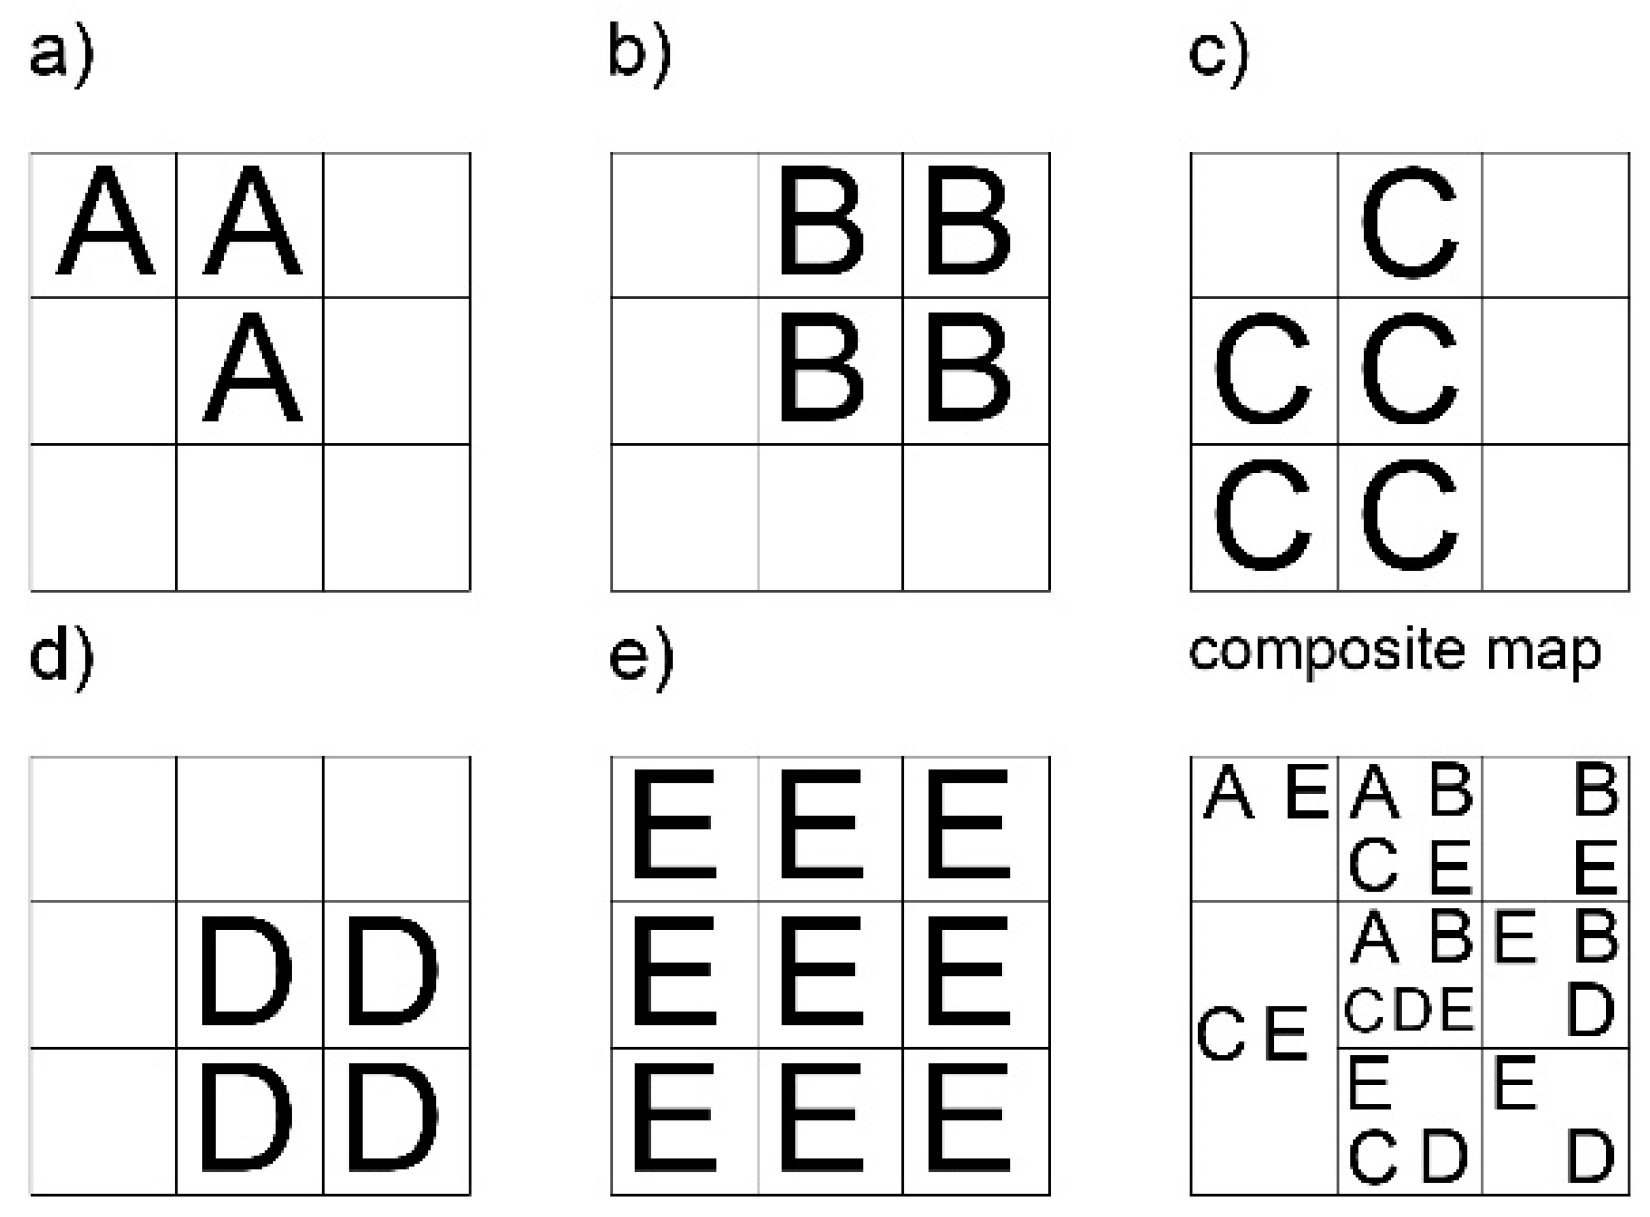
27] stresses the crucial need to create concepts via categorization. In Gray’s method, exploratory analysis and composite maps are imperative for categorization. According to Gray, these composite maps should convey the complexity of spatial data (such as land cover) beyond homogenous concepts, however, he does not define an analytical procedure to generate such maps. Recent progress in data analysis has facilitated data categorization. Lebart’s [28] method on “complementary use of correspondence and cluster analyses” is an exploratory (unsupervised) data analysis technique that can be used for data categorization. The complementary use proposed by Lebart minimizes the methodological problems of both correspondence analysis and cluster analysis, and thus enables the generation of composite land cover maps based on data categorization.
Despite these theoretical, empirical, and methodological advances; some areas in the study of urban regions demand more scrutiny. First of all, the indirectly proportional relationship between comprehensiveness and resolution in mapping is a challenge for urban regions’ cartographic representation [27]. Regional scale demands comprehensive maps, yet urban areas cover a small portion of the regional scale, meaning such maps should have adequate resolution to capture spatial intra-regional variations, and they should also be visually communicative. Furthermore, to reflect the spatial intra-regional variations, regional maps should avoid thematic uncertainty and over-generalized legends. Second, the sustainable spatial development of urban regions demands coordination between regional policies and planning interventions. Despite the recent advances in sustainable land use planning, contemporary regional policy and planning practices lack clear guidelines for connecting research and practice.
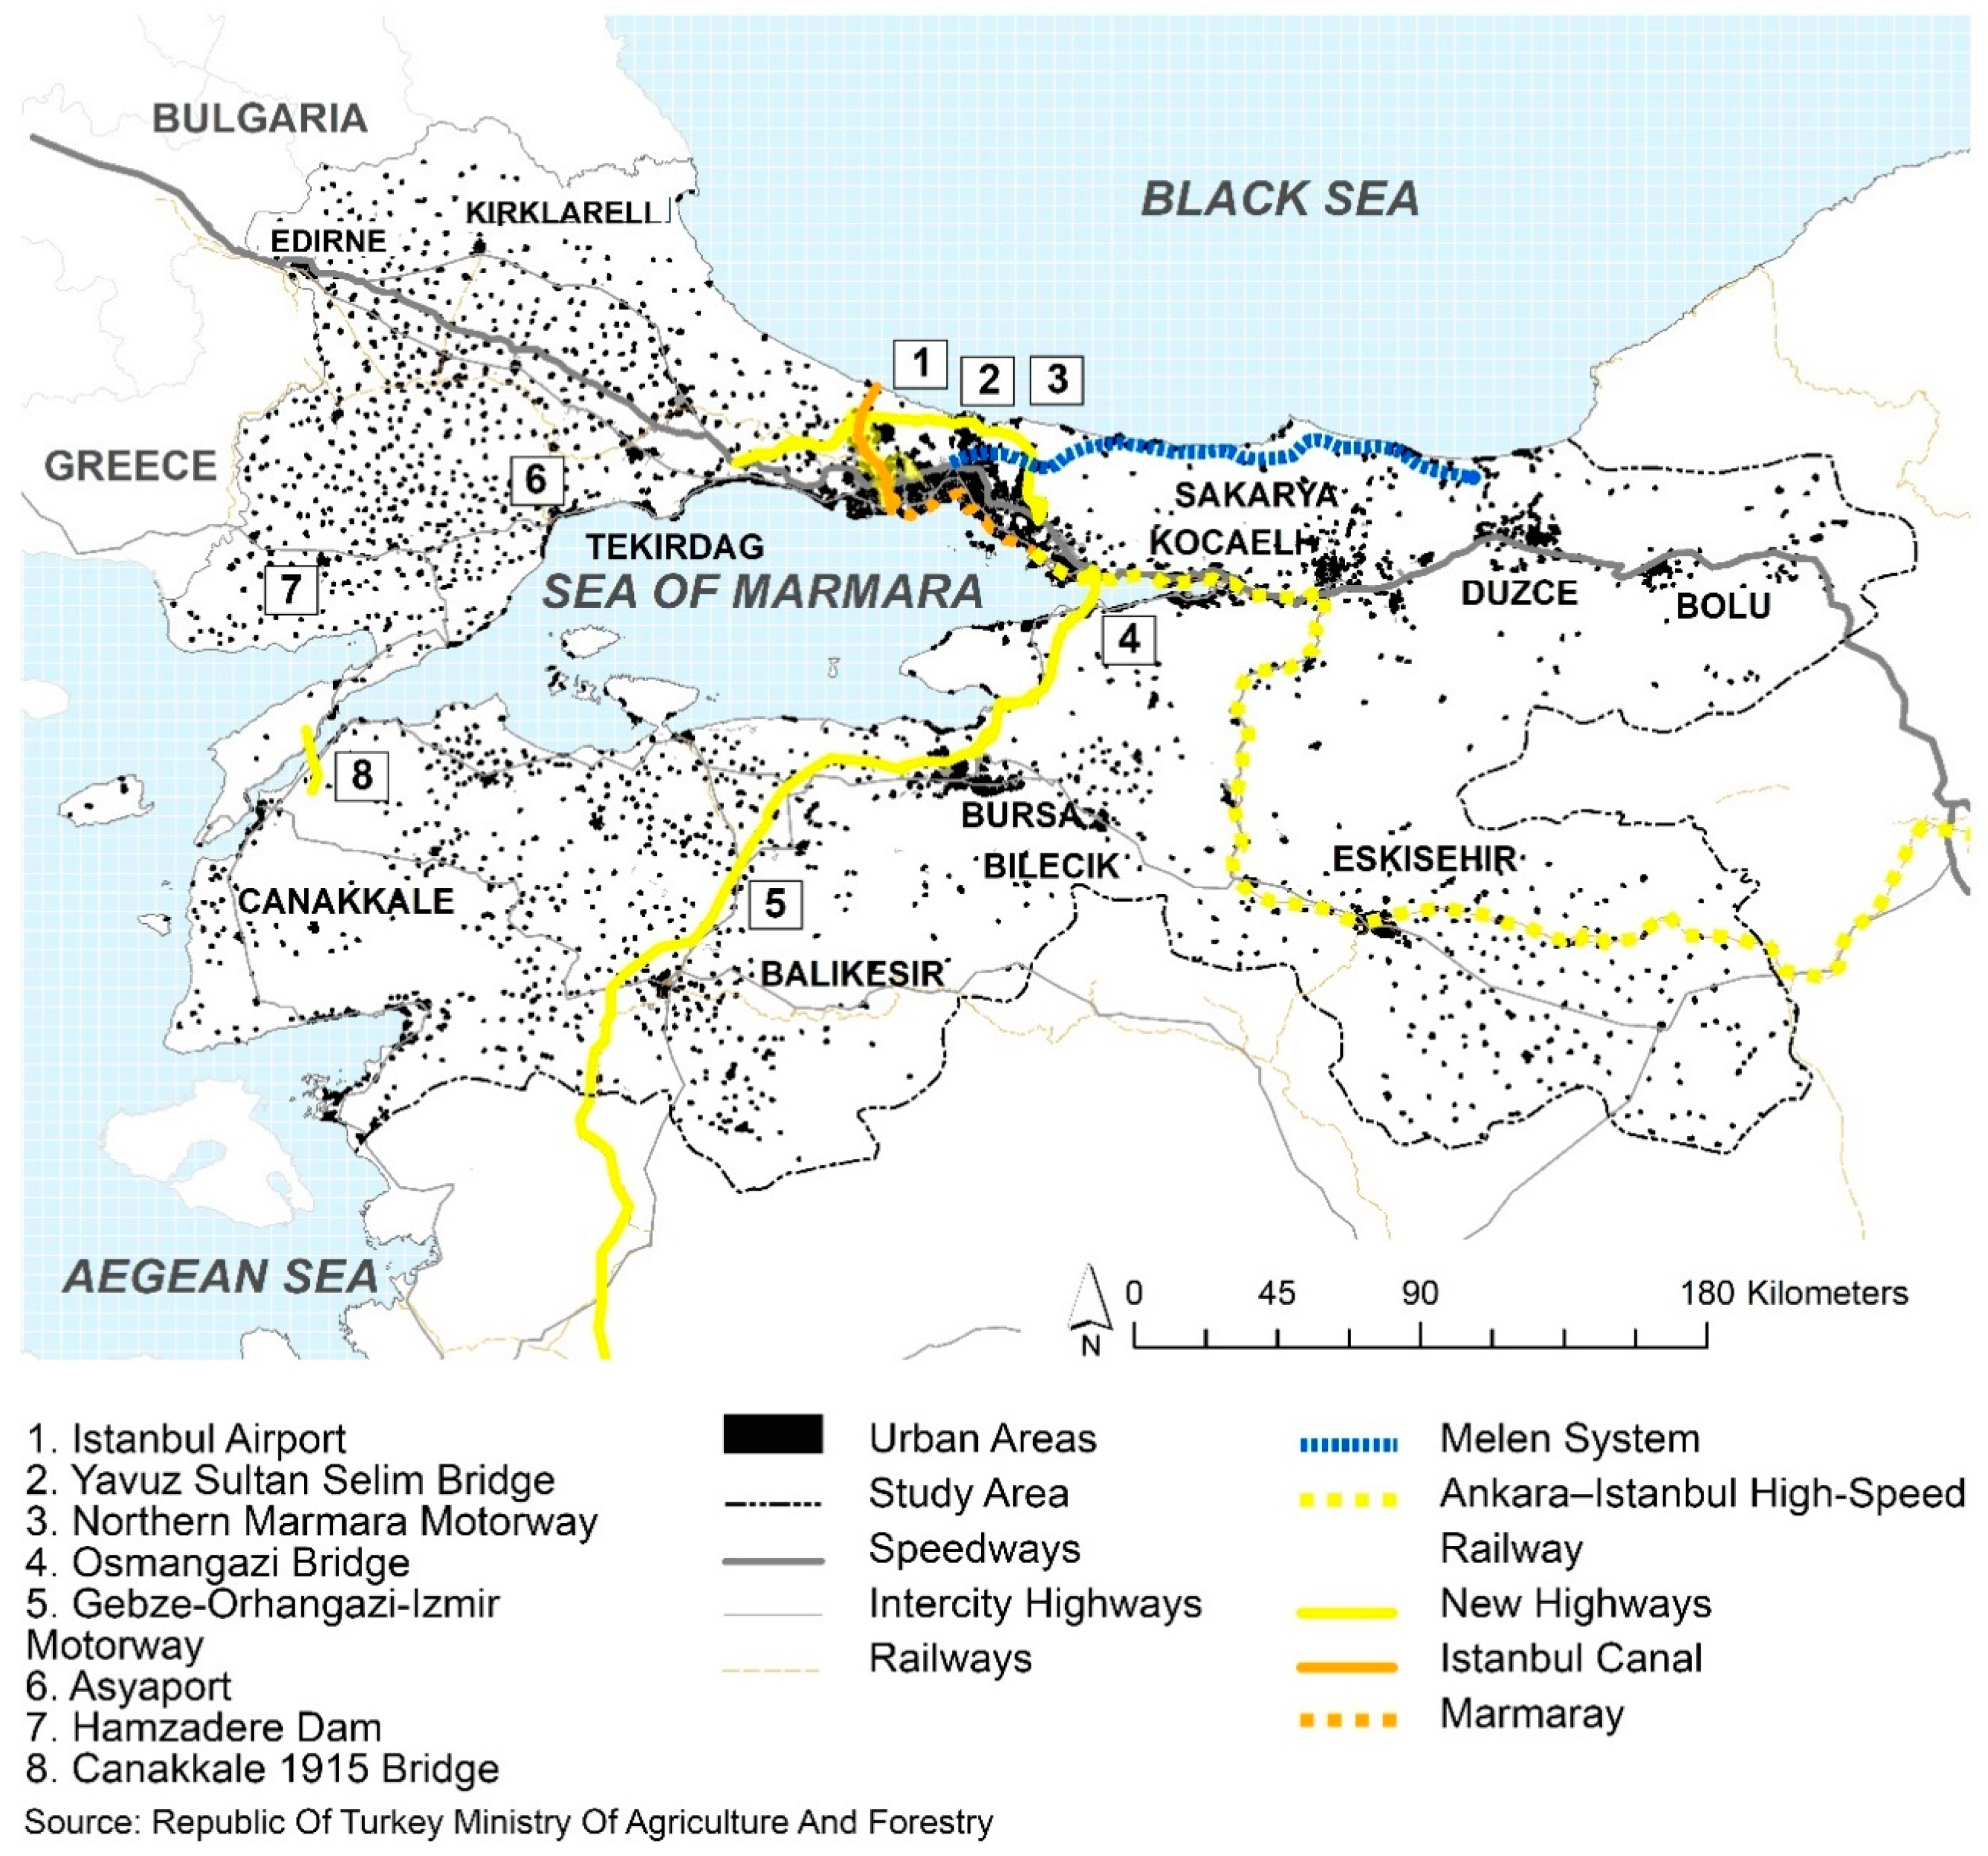
These theoretical, representational, and planning challenges for urban regions materialize in the Marmara Region, which is Turkey’s most densely populated, ecologically diverse, and economically advanced region [29]. Despite the infrastructure investments, legislative changes, and rapid urban development in the Marmara Region, and particularly in Istanbul since the 2000s (Appendix A), few studies have addressed the regional urbanization in this area [30,31,32]. While this rapid regional urbanization has raised environmental concerns [31,33], neither Istanbul’s contemporary urban sprawl at a regional scale, nor the Marmara Region’s contemporary urbanization patterns have been systematically studied.
Correspondingly, very few studies have assessed the LULC change of larger systems of urbanization in Turkey beyond the metropolitan scale [34]. The unavailability or inaccessibility of institutional digital spatial data in Turkey discourages such studies. The CORINE land cover (CLC)’s broad spatial scope, continuous geometry, land cover type diversity, and consistency [35,36] facilitates such studies. While high-resolution land cover maps can be obtained via different resources [37], in contexts with limited data access, CLC, as an institutionally open resource, provides baseline data for regional research and comparative studies. However, the scope and content of CLC data demand further processing.
This paper fills the addressed gap in the literature by deciphering the Marmara Region’s urban transformation between 2006 and 2018, during a transitory period of urban policy and infrastructural development. The research questions are: (1) To what extent can a distinct, integrated intra-regional urban network be identified in the Marmara Region between 2006 and 2018, based on urbanization patterns? (2) Have the simultaneously initiated regional policies and mega-projects effectively addressed the region’s spatial transformation? (3) In what ways can this study’s findings contribute to new approaches and concepts in regional theory for effective urban planning and policymaking?
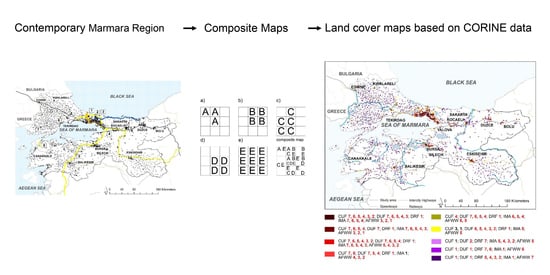
To answer these questions this study generates composite maps of the Marmara Region based on CLC data for 2006, 2012, and 2018, by utilizing Gray’s [27] exploratory approach and Lebart’s data analysis model [28]. These composite maps demonstrate the coexistence and intensity of different urban land cover types, and reveal the complex regional urbanization patterns, providing the much-need spatial framework ignored by the contemporary regional policies and planning interventions. Hence such maps can be utilized as guidelines for sustainable regional policy and planning frameworks. The findings of this study contribute to the theoretical, empirical, and methodological discussions about urban regions by revealing the idiosyncratic patterns and sustainability challenges of one of the world’s fastest-evolving examples.

2. Materials and Methods

2.1. Data Collection

Although urban areas compose a tiny share of land, both regionally and globally, they are incredibly dense, hosting the vast bulk of human activity, and are in constant flux. They, therefore, have tremendous economic and environmental impacts [38,39]. An important way of understanding these dynamics is to monitor change in the land cover [13,38,40,41]. In the case of Turkey, and the Marmara Region in particular, despite recent progress in land use and land cover studies [42,43,44], little attention has been paid to understanding the dynamics of the urban fabric as an indicator of regional urbanization. Drawing on land cover data and adopting the exploratory method detailed below, our study takes an innovative approach to understanding the spatial dynamics of urban transformation in the Marmara Region. It applies multiple correspondence analyses (MCA) and cluster analyses using the CLC classification system to offer an overview of the urban fabric land cover change between 2006 and 2018; a period of substantial changes in regional urban policy and mega-infrastructure investments.
The principal source of data for the present study is the CLC data generated by the European Environment Agency [45]. CLC data, which provide a standardized system to evaluate regional urbanization beyond administrative boundaries within Europe, have been used in several influential land cover studies across different contexts to assess different scales of urbanization [34,37,46,47,48]. CLC utilizes “a minimum mapping unit (MMU) of 25 hectares (ha) for areal phenomena and a minimum width of 100 m for linear phenomena” [45]. Level-4 CLC data for 2006, 2012, and 2018 for Turkey were obtained from the Republic of Turkey Ministry of Agriculture and Forestry. To assess the urbanization patterns and dynamics in the Marmara Region, all CLC land cover classes were used under five groups. The first three were the three level-4 classes: (a) 1.1.1 continuous urban fabric (CUF); (b) 1.1.2.1 discontinuous urban fabric (DUF); and (c) 1.1.2.2 discontinuous rural fabric (DRF), classified under the level-1 artificial surfaces class and level-2 urban fabric class. These were evaluated individually to identify the region’s urban land cover transformation. The fourth group comprised the other land cover classes under artificial surfaces: 1.2 industrial, commercial and transport units; 1.3 mine, dump and construction sites; and 1.4 artificial, non-agricultural vegetated areas (collectively, IMA). The fifth group comprised the other level-1 classes: 2 agricultural areas; 3 forest and semi-natural areas; 4 wetlands; and 5 water bodies (collectively, AFWW).

2.2. Grid-Cell Analysis

Among others, Guan and Rowe [38] have argued that an appropriate scale is essential to the modeling processes. Both under- and over-aggregated spatial units can potentially cause the modifiable areal unit problem bias that can significantly impact the results of spatial measures. After assessing different grid-cell sizes through an iterative process to tackle this problem a 1 km grid-cell with an overlay across the Marmara Region was determined for several reasons. First, the 1-km grid applied on CLC data, which embodies an MMU of 25 ha, provided the variety that was essential to assess multiple land cover types simultaneously, and to demonstrate the complexity of urbanization dynamics. Second, while the 1-km grid was adequate for both computational operations it also enabled the visualization of the fundamental patterns at the regional scale, which is imperative to answer the research questions posed for this study.
For the pre-processing phase, the WGS 1984 UTM Zone 35 was applied as the coordinate system for the Marmara Region land cover data. The land cover data and the 1-km grid were merged in ArcGIS to monitor and statistically analyze the spatiotemporal transformation of the new shapefiles for 2006, 2012, and 2018. Each grid-cell within the new shapefile, embodying the land cover information within the cell’s borders, was coded with a unique cell ID, consistent across different years. This table was imported into a spreadsheet to create a matrix of the unique cell IDs with the areas of each land cover category within each 1-km grid. To decrease the differences in the deployment of urban land cover, grid-cells without urban fabric land cover classes (CUF, DUF, and DRF) were excluded from the analysis. Hence, the study relates exclusively to urban fabric land cover classes extracted from CORINE system developments aggregated into 1-km grid-cell units. Each unit is described through areal shares.

2.3. Modeling Structure

Brenner and Katsikis used night light maps to depict urban agglomerations as settlement footprints [49]. Yet, if one wishes to go beyond such exploratory visualizations, the empirical analysis of spatial formations at the regional level poses challenging ontological and methodological problems. In her seminal contribution to the study of spatial formations at regional and supra-regional scales, Coucelis showed that object-based models are not suitable for representation, and she stresses the relevancy of field-based ontology [50]. Gray suggests that the reliable and valid representation of complex spatial entities (like urbanized areas) at regional-scale accuracy unavoidably requires a disaggregated approach [27]. Gray’s exploratory approach does not intend to detect the “ultimate” truth, but aims to generate useful composite maps depicting complex spatial entities, such as regions or forests (Figure 1 and Figure 2).
Gray’s conceptual model, however, does not specify any particular analytical procedure for data reduction and/or pattern recognition. Interestingly, conventional tools for data analysis are not particularly suitable for disaggregated spatial data. For instance, simple correspondence analysis and MCA, being over-sensitive to outliers, are rather inefficient in processing disaggregated spatial data. Outliers with unique profiles may significantly affect the position of all other observations in the first dimension, and lead to rating misleading projections on subsequent ones. The same holds true for most cluster analyses, which may not necessarily generate groups with “congruent attribute profiles” [51,52] and are not particularly sensitive to outliers. Unfortunately, their pattern detection capability is generally indirectly proportional to the number of features taken into account. The “complementary use of correspondence and cluster analyses” proposed by Lebart [28] is an exploratory (unsupervised) data analysis technique that alleviates significantly these methodological problems. Combining MCA with a cluster analysis that further compresses the number of attributes, therefore, increases the accuracy of the operation, and enhances the interpretability of the results [28].
In the modeling phase, the combinatory use of MCA and cluster analysis is achieved via two main steps (Step 2 and Step 3, Figure 3), MCA is used for data reduction and pattern recognition (defining coordinates of row points). The clustering of cases proceeds in two steps. The preliminary clustering (Step 2.2, Figure 3) aims to keep the misleading effects of outliers under control, and to reduce the number of cases down to a level suitable for hierarchical clustering (Step 3.2, Figure 3). The preliminary clustering is carried out through genetic algorithms like Kmeans [28] that do not require dissimilarity matrices. The clusters generated in the first phase (Step 2, Figure 3), constitute the inputs to the MCA in the second step (Step 3.1, Figure 3), where each cluster is represented by the profile of its “weighted central object”. In the third step, clustering is done through hierarchical algorithms (like Ward’s procedure) (Step 3.2, Figure 3). In this step, clusters are selected with respect to their marginal contributions to “within-group variance” (i.e., the “elbow” method and labeled referring to over-represented modalities [53] that are identified through signed Chi square indices).
The last step (Step 4, Figure 3) comprises the labelling and visualization of results. The concentration of land cover types for each map is depicted through contingency tables (Appendix C) in which the over-represented land cover types are identified through signed Chi indices [53]. This differentiation is reflected in the legends by color-coding. Distinctively overrepresented land cover types are written in red; significantly overrepresented land cover types are written in bold. Subsequent to logarithmic normalization, the intensity of each land cover type was expressed with an index between 1 (lowest) and 7 (highest) (Appendix D). These intensities are also demonstrated in the legends. Map areas where CUF is predominant are shaded in tones of red while areas where DUF is predominant are colored orange and yellow, and DRF and AFWW values are colored in purple (Figure 4).
The analysis of this data set with Lebart’s model enabled us to detect and map units with distinctive urban land cover profiles. Analyses on the study area suggested that the complementary use of correspondence and cluster analyses: (1) Keeps the misleading effects of outliers under control; (2) Minimizes the risk of spatial and classification errors; (3) Generates clusters with congruent attribute profiles; (4) Minimizes thematic uncertainty; and (5) Last but not the least, produces legible maps and interpretable clusters. The empirical analysis of land cover transformations in the Marmara Region illustrates the relevancy of this approach.

3. Case Study

3.1. Novel Changes in Regional Urban Policy

Turkey’s urban structure is based on a two-level administrative system, with 81 provinces directly connected to the central state without any intermediary regional authorities [54,55]. Since 2000, policy shifts triggered by Turkey’s EU accession and a significant increase in urban infrastructure investment triggered a new era of regional urbanization under globalization. Turkey’s EU accession efforts prompted a novel set of regional policies [54,56]. The first was Law No. 2002/4720, enacted in 2002, which adopted the EU’s three-level NUTS (nomenclature of territorial units for statistics) model (Appendix A, Appendix E). This established Turkey’s first legal definition of regions, which had been hitherto defined as geographical units. The second important law was the establishment of regional development agencies (RDAs) via Law No. 5449, enacted in 2006, based on the twenty-six NUTS 2-level regions [57].
The objective of establishing RDAs was to reduce inter-and intra-regional inequality and foster economic development and competitiveness. It was thus a landmark shift from Turkey’s traditional top-down approach to a more decentralized model [58,59]. The RDA’s units, which are only functional (i.e., non-administrative) [60], have been heavily criticized for several reasons. First, critics contend that the State Planning Organization developed them without consulting the local authorities most affected [55,61]. Second, at the NUTS 2-level, the units lack decision-making power, which limits the capacity of the RDAs [30,62,63] and undermines effective regional planning [64]. Additionally, critics highlighted the continued influence of central government, with control over much decision-making within RDAs retained by the Ministry of Development in Ankara and centrally-appointed provincial governors [55,58,63,64].
In 2012 two crucial urban development laws were published in the official gazette: Law No. 6360 (the Metropolitan Municipality Law) and Law No. 6306 (the Regeneration of Areas under Disaster Law). Contrasting the regionalization efforts of the previous policies, these new laws opted for centralization, which affected urban fringes and rural areas. Law No. 6360, implemented in 2014, transformed villages situated within metropolitan municipalities into districts and deprived them of their rights to village commons by connecting them to metropolitan municipalities. Law No. 6306 increased central government authority over urban planning decisions by designating “risky” and “reserve” areas [65]. Finally, Turkey’s transition to an authoritarian presidential system in 2018 nullified its previous EU accession efforts in the early 2000s, diminishing the development of democratic urban governance.

3.2. Urban Development in the Marmara Region

3.2.1. A Brief Historical Development of the Marmara Region

The Marmara Region, as Turkey’s most urbanized, industrialized, and globally connected region, has been a core focus of these policy developments. This preeminence is due to the dominance of Istanbul (the primate city), which is separate from the rest of the urban hierarchy, including Izmit and Bursa [29]. An influential body of scholarship has focused on the Marmara Region’s urban regional qualities [29,66,67], and consequently on the regional urbanization dynamics in Turkey [34].
The boundaries of Turkey’s geographic regions, declared at the First Turkish Geography Congress in June 1941, are based on a diverse set of parameters, including physical morphology, climate, vegetation, agricultural, and demographic properties [68]. With a total area of 67,000 square kilometers, the geographic Marmara Region comprises 11 out of Turkey’s 81 provinces (Istanbul, Edirne, Kirklareli, Tekirdag, Kocaeli, Sakarya, Yalova, Bilecik, Bursa, Canakkale, and Balikesir) and 153 districts. Its geography hosts a transitory ecology between the Mediterranean and Black Seas that includes two straits, the Dardanelles and the Bosporus, and an inland sea, the Sea of Marmara.
The Marmara Region’s urban network intensified through infrastructural and industrial investments from the mid-19th century to the late-20th century [56,66,69]. Over the course of the second half of the 20th century, the region became the subject of a diverse set of policies and plans. These plans include the ring road proposed by Luigi Piccinato and the northeastern industrial corridor suggested by Tuğrul Akçura that shaped the region’s infrastructural development and land use patterns [70].
The August 1999 Eastern Marmara earthquake, in which around 18,000 people died, revealed the vulnerabilities of regional policies and building stock, and had a heavy economic cost regionally and nationally [71,72]. Nevertheless, from around 2000, Istanbul gained prominence as a logistics and finance hub, while continuing to dominate regional development, with Bursa and Kocaeli as close seconds [57]. Many of Istanbul’s small but globally integrated ports have thrived, transforming the Sea of Marmara into a regional port system, well integrated into the global port network [57,73]. The urban expansion of Istanbul continued into the 2000s, while the government invested in multi-nodal regional transportation to increase inter- and intra-regional connectivity [57]. Government investments comprised a series of mega-projects initiated between 1998 and 2017: the Marmaray, the Gebze-Orhangazi-Izmir Motorway, the Ankara–Istanbul High-Speed Railway, the Osmangazi Bridge, the Yavuz Sultan Selim Bridge, Istanbul Airport, the Northern Marmara Motorway, the Istanbul Canal, and the Canakkale 1915 Bridge (Figure 5 and Appendix A). These projects were steadily announced by the government without any comprehensive regional planning vision and public engagement. Specifically, the mega-projects in Istanbul’s northern territory and the Istanbul Canal project (Figure 5) generated controversy and criticism from various professional groups for breaching the 2009 Istanbul Environmental Plan, which intended to protect Istanbul’s freshwater and forest systems [74]. Despite a series of reports on the shortcomings of these projects from professional groups [75], the mega-projects were fully embraced by the real estate sector. They were perceived as opportunities for massive regional land speculation, specifically around natural reserve areas [76,77,78]. The top-down structure of these projects also hindered collaboration for regional decision-making.
Besides these rail and road mega-projects, which changed accessibility patterns within the Marmara Region, there were other infrastructural investments. These included port projects like Asyaport, implemented in 2015 [31], and dam projects (the Greater Istanbul Water Supply Project, Melen System to provide drinking water for Istanbul from the Melen Stream, and the Hamzadere Dam project and surrounding agro-industrial zone in Thrace) [31]. Other interventions included train-ferry services to further enhance integrity within the Marmara Region, and international infrastructural investment through the TurkStream natural gas pipeline [31,79].

3.2.2. The Restructuring of Regional Boundaries via Novel Policies

The implementation of Law No. 2002/4720 had divergent impacts on the Marmara Region. The law created three new NUTS 1-level regions: West Marmara Region, Istanbul Region, and East Marmara Region. Subsequently, five RDA’s were established under Law No. 5449. On the one hand, these new administrative units established a legal definition for the region; on the other hand, they drastically changed regional boundaries (Figure 6), and dismantled the geographic Marmara Region [30].
Despite the common macro-economic approach to the Marmara Region, as the most developed region in Turkey, many studies have revealed that it is subject to different internal dynamics [31,80]. The RDAs representing the Marmara Region developed a series of “2010–2013 plans” and “2014–2023 plans” with invaluable information about these internal dynamics and the future goals of each RDA [79,81,82,83,84,85,86,87,88,89]. The 2014–2023 plans provide considerable fine-grain information concerning land use plans, sustainability goals, transportation networks, and the like [79,82]. However, due to the NUTS 2-level limitations, the plans lacked a holistic approach to address dynamics at larger urbanization scales. This has led to a set of disconnected policies. For instance, although the 2014–2023 plan for Istanbul includes logistics regions and a connections plan for the Sea of Marmara, Eastern Marmara and Thrace present themselves as logistic centers in the 2014–2023 plans without an integrated approach [79,89]. The mega-projects and the utilization of these projects to benefit each NUTS 2 region also became an integral part of the RDA plans, and are often discussed in relation to Istanbul’s impact on neighboring RDAs [79].
Law No. 6360 (Appendix A) increased the Metropolitan Municipalities to seven (Tekirdag, Istanbul, Kocaeli, Sakarya, Bursa, Balikesir, and Eskisehir) in the study area, while the transformed villages in these municipalities lost their legal status and autonomy regarding village commons. Law No. 6306’s (Appendix A) regional scope is more closely associated with land use development of natural areas, specifically around Istanbul. Via this law, significant parts of the province’s natural reserves were declared “reserve areas” and allocated for mega-projects [65]. All these policies have generated different administrative bodies and changed the boundaries of the region’s administrative units, creating confusion regarding the degree of legal authority and collaboration among regional decision-making bodies. In turn, this has led to a fragmented collection of administrative units, based on a city–region level.
While we acknowledge the historical importance of the geographic Marmara Region within the region’s planning history, the three NUTS 1 regions, West Marmara Region, Istanbul Region, and East Marmara Region, were designated as the study area to discuss the post-2000 policies and plans (Figure 6). This area of 96,000 sq. km is home to 27.24 million people (approximately 32.7% of Turkey’s population) [90].
The present study focuses on changes in the urban fabric, rather than economic indicators and population statistics, to investigate if the aforementioned regional policies and mega infrastructure projects effectively addressed the Marmara Region’s urbanization dynamics between 2006 and 2018. The results help in understanding the region’s urban development qualities during the study period in relation to these changes. Thereby, this study’s findings make a significant contribution to critical theories in regional planning and effective regional policymaking at a broader scale.

4. Results

4.1. Urban Fabric Land Cover Composition in 2006

While the land cover maps demonstrated in this section reveal a diverse set of relationships between urbanization patterns and dynamics, we focused on the fundamental patterns at the regional scale. The 2006 map (Figure 7) shows regional urbanization at the beginning of the study period (Appendix A). Nine morphological clusters are mapped, ranging from densely urbanized areas to rural clusters with diverse mixtures of land cover groups. Out of the 99,936 cells in the overall land cover data set, the processed set comprises 9064 1-km grid-cells that include at least one artificial land cover type. According to the MCA factorial map (Appendix B), the first two axes explain two-thirds (64.3%) of the total inertia (dimension 1 accounts for 43.2%, and dimension 2 accounts for 21.1%).
In the 2006 data set, CUF, DUF, and DRF respectively accounted for 5.94%, 6.81%, and 11.37%; IMA accounted for 5.94%, and AFWW for the rest (69.93%) of the total land cover.
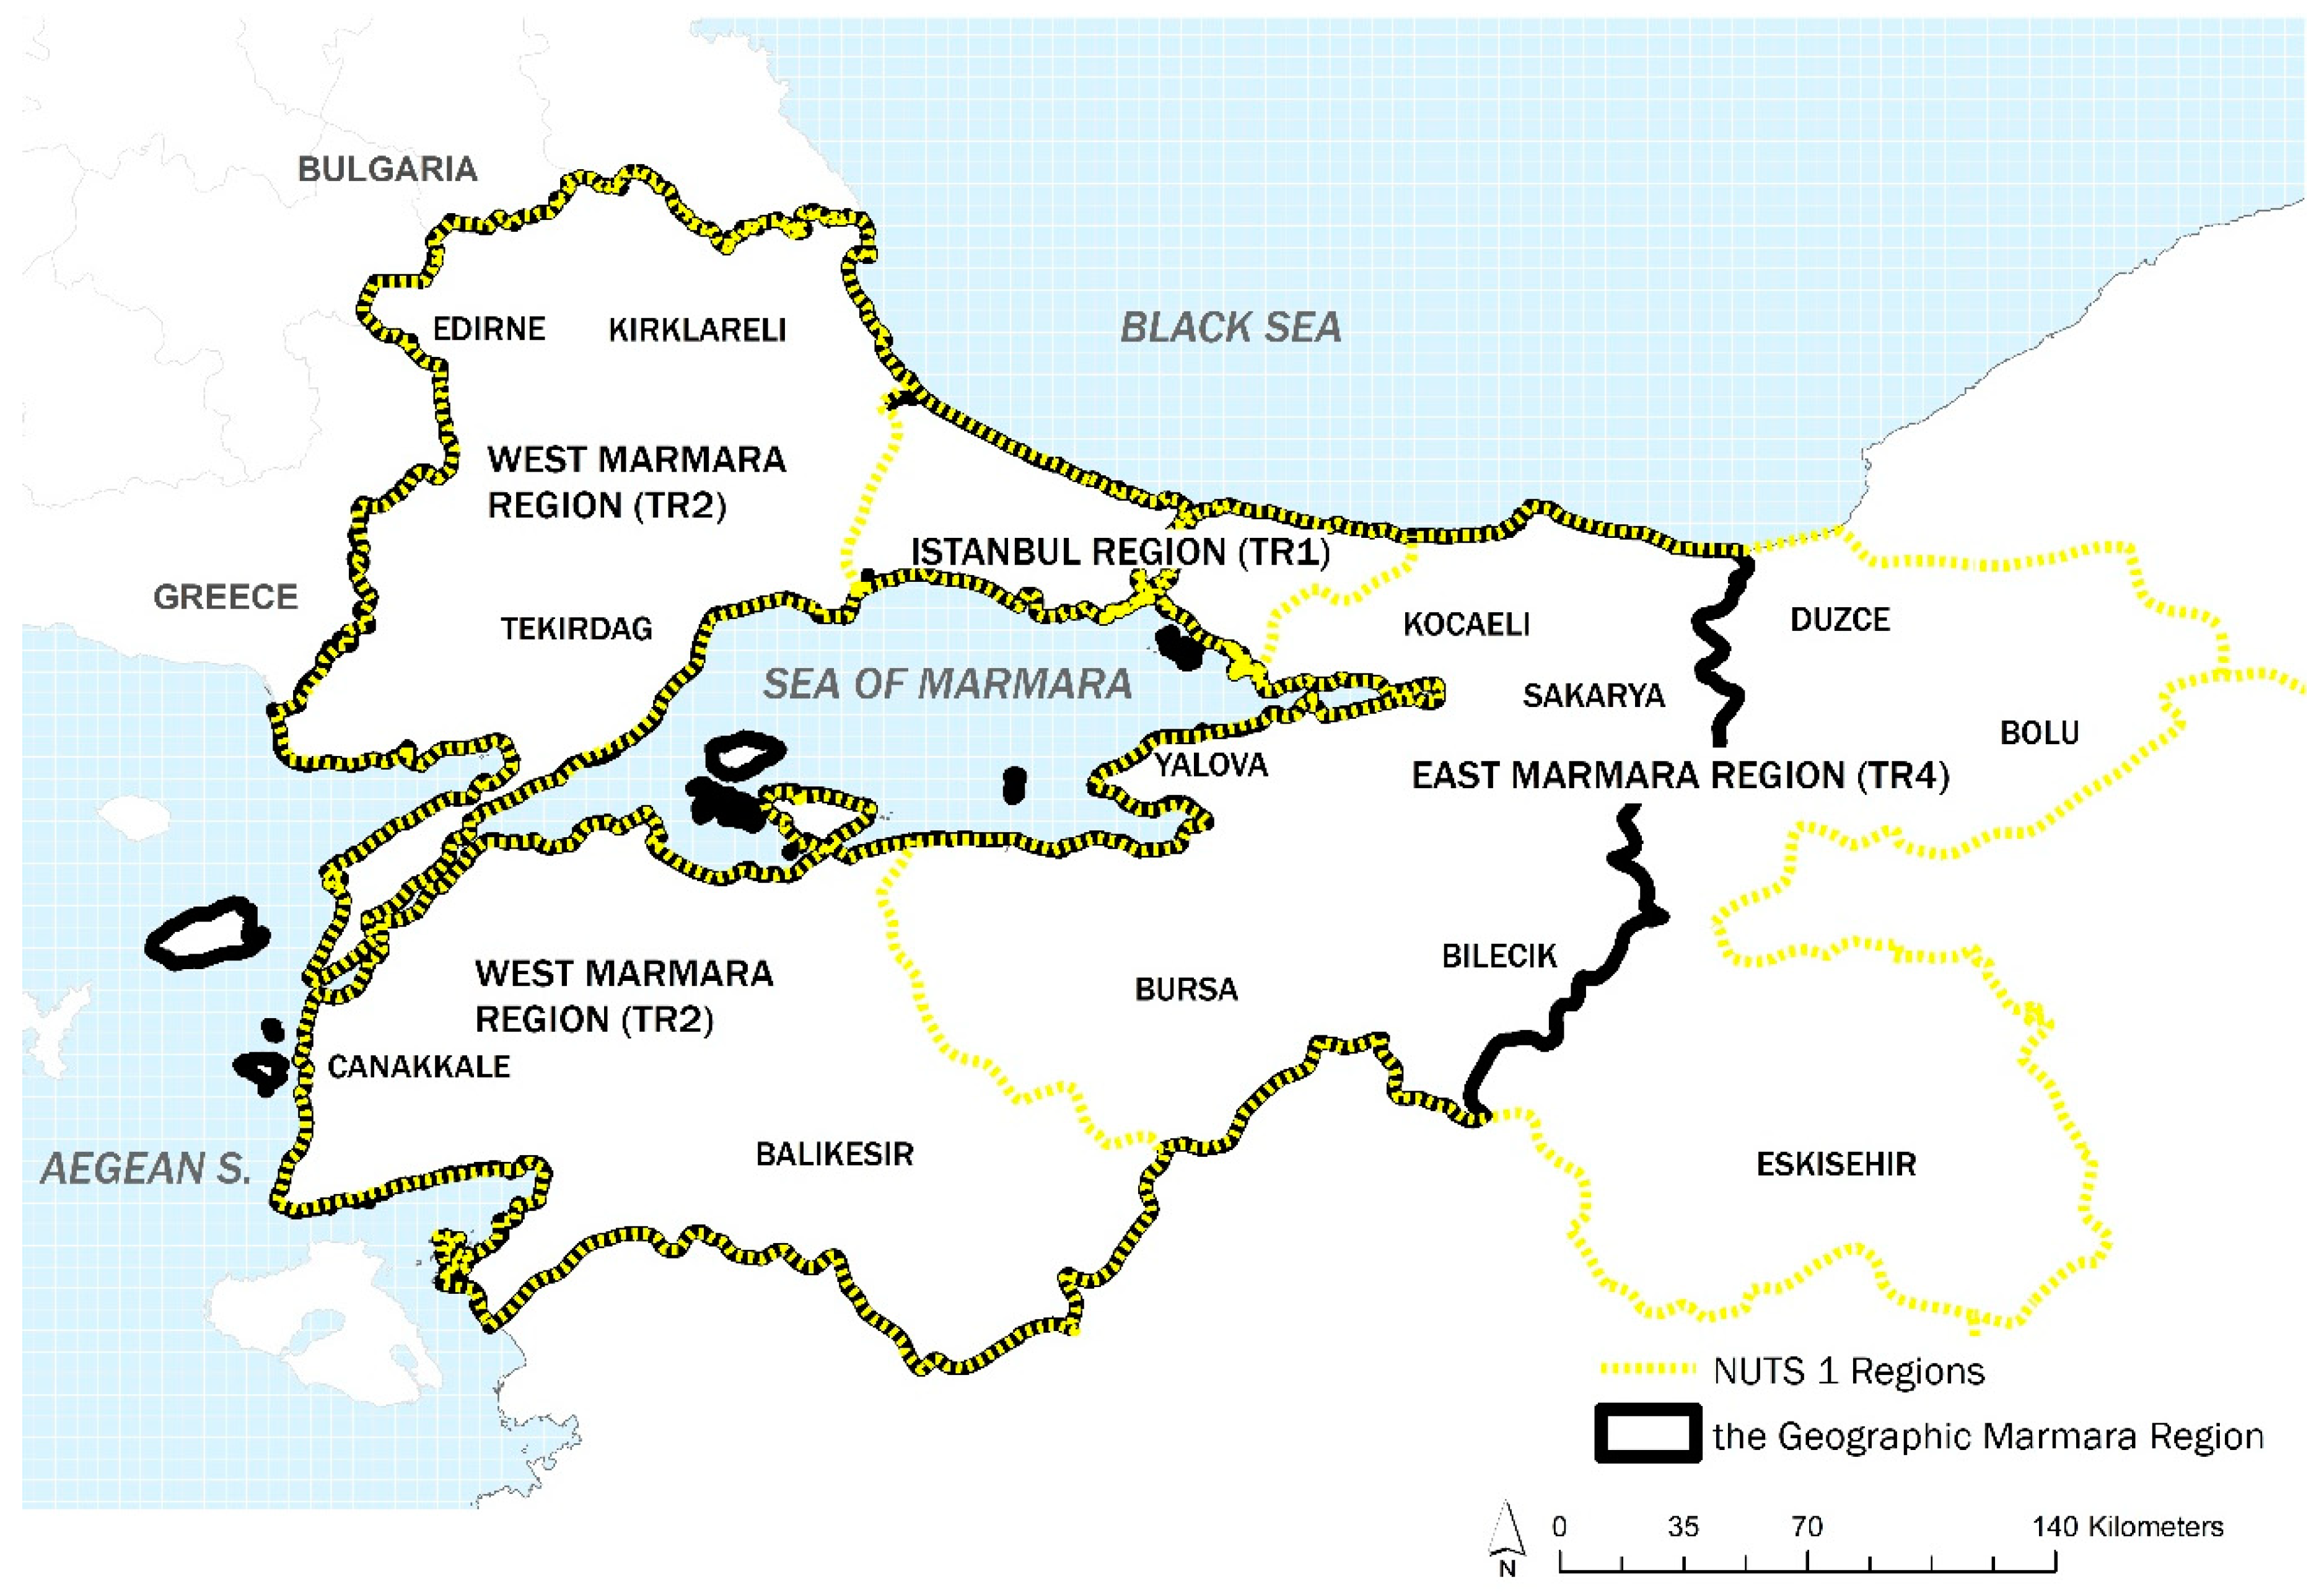
Land cover clusters generated from the 2006 data suggest the following four distinctive regional sectors: (1) Istanbul metropolitan area; (2) Poly-centric urban centers in the eastern Marmara Region, comprising Kocaeli (Izmit), Sakarya, Duzce, Bolu, Yalova, Bursa, and Eskisehir; (3) Thrace region in the northwestern Marmara Region; and (4) Southwestern Marmara Region. As opposed to Istanbul and the eastern Marmara Region, Thrace and the southwestern Marmara Region are both predominantly rural. The urban fabric land cover composition in the 2006 map demonstrates that while the first two sectors are composed of land cover categories in which CUF, DUF, and IMA are distinctively over-represented, Thrace and southwestern Marmara are composed of land cover categories in which DRF and AFWW are distinctively over-represented. These four major clusters, illustrated in the 2006 map, demonstrate a fragmented administrative city–region structure. The 2006 map also demonstrates that metropolitan centers and poly-centric urban formations already coexisted in 2006.

4.2. Urban Fabric Land Cover Composition in 2012

The data set for artificial land cover types comprised eleven legends covering 9240 1-km grid-cells. Figure 8 summarizes the characteristics of this distribution. The first two axes of the factorial map explain 54.81% of the overall inertia. The first dimension accounts for 31.73%, and the second 23.08% (Appendix B).
In the 2012 data set, CUF, DUF, and DRF respectively accounted for 5.89%, 7.56%, and 11.42%, while IMA and AFWW covered 6.05%, and 69.09% of the total land cover, respectively. When the land cover percentages of the 2006 and 2012 data sets are compared, the most significant change is observed in the share of DUF values, with an increase of 10.87% (0.74 percentage points). Within the overall framework, the significant increase in DUF indicates rapid urbanization and changing urban dynamics at the regional scale. In the 2012 map, four sectors, differentiated by distinctive land cover profiles, can still be detected. However, they were subject to substantial changes within a span of six years, increasing the complexity and hybridity of the regional urbanization. Three primary tendencies can be identified in Figure 8: increased urban density, urban expansion, and leapfrog urban sprawl. The increases in urban density and urban expansion were primarily observed in metropolitan areas, provincial centers, and districts, while leapfrog sprawl was observed in satellite towns.
Land cover categories in which CUF, DUF, and IMA are distinctively over-represented increased in the provincial centers of Tekirdag, Kirklareli, Edirne, Sakarya, Bursa, Eskisehir, Canakkale, and Balikesir, as was also the case in district centers in Thrace and southwestern Marmara (namely Luleburgaz, Babeski, Corlu, Cerkezkoy, Marmaraereglisi, Kesan, Bandirma, Biga, Can, Edremit, Karacabey, and Mustafakemalpasa) and around the Gulf of Izmit. Due to this transformation that was mainly observed along the major highways, there were significant changes, crystallized in the disrupted rural structure in Thrace (Figure 9) and the southwestern Marmara Region as distinctive urban nodes. Interestingly, this change was noticed by the policymakers. Therefore, Thrace, Luleburgaz, Corlu, and Cerkezkoy were designated as an industrial axis and primary development area in the 2014–2023 Thrace plan [79].
The first three legends with the highest CUF, DUF, and IMA values (Figure 8) also show the dramatic urban expansion in Bursa, the region’s second-largest city, and in and around Istanbul (Figure 9). Due to significant increases of the same legend categories, leapfrog urban sprawl, the third land cover development typology, was observed within the satellite towns surrounding Bursa and Istanbul.
A substantial part of the land cover transformation between 2006 and 2012 occurred in Istanbul’s northern fringes, the province of Bursa, and southwestern Marmara; all situated near mega-infrastructure projects, either recently announced or under construction. Further environmental degradation can be expected in these areas once these projects are fully operationalized. For instance, a recent World Wide Fund for Nature report estimated that 83 sq. km of land will be opened for development, while 134 sq. km of agricultural land and forest land will be destroyed [33] if the Istanbul Canal project is carried out.

4.3. Urban Fabric Land Cover Composition in 2018

The 2018 land cover map comprises eleven legends covering 9748 1-km grid-cells (Figure 10). The first two dimensions of the factorial map explain 45.25% of the overall inertia (Appendix B). The first dimension accounts for 30.25%, while the second for 15.00%. In the 2018 data set, CUF, DUF, and DRF respectively accounted for 5.46%, 8.21%, and 10.75%, while IMA and AFWW covered 6.17% and 69.40% of the total land cover, respectively. Between 2012 and 2018, DUF increased again by 8.73% (0.66 percentage points), while the shares of CUF and DRF decreased. Istanbul expanded less towards its northern periphery between 2012 and 2018 than it did between 2006 and 2012, demonstrating that land speculation had already started before the construction began on the mega-projects. In contrast to Istanbul, urban sectors adjacent to the city centers of Bursa and Eskisehir expanded significantly. The most striking part of the 2018 maps, however, is massive rural sprawl at the regional scale (represented by the last three legends, in which DRF and AFWW are distinctively over-represented). This pattern increase is observed around two main axes: first, the eastern Marmara axis (including Kocaeli, Sakarya, Duzce, and Bolu) that overlaps with an earthquake fault line (Figure 11); second, along the Gebze-Orhangazi-Izmir Motorway, and especially around western Bursa (including Karacabey and Mustafakemalpasa).
The land cover transformation between 2006 and 2018 demonstrates that certain patterns of regional urbanization paralleled ongoing mega-infrastructure projects. This development included urban sprawl toward the north of Istanbul, encroaching on the forest lands and water basins, and densification and expansion of linear urban development in southeastern Marmara along the Gebze-Orhangazi-Izmir Motorway, encroaching on wetlands, agricultural land, and forest areas (CORINE, 2018). Between 2006 and 2018, DUF had the most significant change in the overall share of land cover. The changes between 2006 and 2012, and 2012 and 2018 displayed great variance: densification, expansion, and leapfrog sprawl dominated the former, whereas the latter was dominated by rural sprawl. These changes transformed the four distinctive regional sectors into a more hybrid structure, in which dense metropolitan areas, emerging urban centers, and nascent sprawl areas coexist.

5. Discussion

5.1. Key Findings

This study aimed to shed light on the intra-regional variations and transformation dynamics of the Marmara Region’s urbanization patterns. Therefore, the study investigated the region’s urban land cover change between 2006 and 2018, a transition period for urban policy and infrastructural development in the region. The major findings demonstrate four major clusters within the Marmara Region, and Istanbul, the primate city with an oversaturated core, displayed a gapless pattern of expansion toward ex-urban areas that threatens the province’s freshwater systems and forest areas. The second cluster is the urbanized eastern Marmara Region of financially stable and rapidly urbanizing cities, including Kocaeli, Bursa, Sakarya, Duzce, Bolu, and Eskisehir, and which is subject to rural sprawl. The third cluster, Thrace, with its robust rural network, became diluted by the urban development that has expanded inland along the highways. The fourth settlement group, the rural southwestern Marmara Region, witnessed urban densification and rural sprawl along the Gebze-Orhangazi-Izmir Motorway axes.
The land cover analyses between 2006 and 2018 reveal rapid urbanization of the region, formerly comprised of four distinct areas, into a more complex and hybrid structure in which “densification and sprawl” take place simultaneously. These findings are essential to discussing whether simultaneously initiated regional policies and mega-infrastructure projects have effectively addressed these changes. That is, did these policies and projects provide an adequate framework to respond to the emerging spatial dynamics of the region?

5.2. Urban Transformation Dynamics Versus Policy Changes and Mega-Projects

The dramatic changes between 2006 and 2018, particularly the densified district centers in the rural structures of Thrace and the southwestern Marmara Region, and the sprawl along the Gebze-Orhangazi-Izmir Motorway, reveal that former structural differences have rapidly diminished. Thus, the novel, medium-scale, city–region-like governmental units generated by Law No. 2002/4720, Law No. 5449, and Law No. 6360 have failed to adequately capture the degree of convergence on the ground. Likewise, Law No. 6360 cannot be justified on the grounds of the Marmara Region’s rapid urbanization, because, despite the massive change, the rural network within the new metropolitan municipalities, such as Balikesir and Tekirdag, did not immediately gain “urban characteristics”. Meanwhile, Law No. 6306 and the mega-projects have encouraged land speculation and sprawl, specifically in Istanbul’s northern territory, thereby invalidating the Istanbul Environmental Plan.
Moreover, the findings reveal that regional resources in rapidly transforming rural areas are even more endangered by rapid urbanization. Urban sprawl to the north of Istanbul (encroaching on the city’s forests and freshwater systems), the densification and expansion of linear urban development in the southeastern Marmara Region towards the southwestern Marmara Region (along the axis of the Gebze-Orhangazi-Izmir Motorway), occupying wetlands, agricultural land, and forest areas [45], and the urban sprawl in the eastern Marmara Region along the earthquake fault line pose fundamental sustainability problems. This approach essentially demonstrates that regional resources and sustainability concerns were neglected during decision-making processes, and points to further dissonance between the spatial dynamics of the Marmara Region during the study period and the capacity and scope of the simultaneously initiated interventions. These results verify the findings of recent studies that have criticized the top-down, uncoordinated, and fragmented nature of the aforementioned regional policies and mega-projects [30,55,58,61,62,63,64,75]. The coexistence of different urbanization patterns corresponds to the findings of the other studies [20,21,22,23,24] that focused on the land use land cover change of urban agglomerations, and providing policy frameworks for sustainable land use development. The coexistence of persistence and dynamic change in the Marmara Region’s rural areas essentially coincide with Salata’s findings on Milan’s urban region [24].

5.3. Theoretical Contribution and Planning Implications

The study’s empirical findings make a crucial contribution to theoretical debates by demonstrating a hybrid urbanization pattern at the regional scale that is neither polycentric nor dominated by the primate city [7]. The speed and scope of urbanization in the Marmara Region between 2006 and 2018 also verify the critiques of administrative boundaries’ relevancy as the main unit of spatial analysis to assess contemporary urbanization [49]. This raises the critical question of how contemporary urban planning and policymaking tools can transform this self-organizing structure to ensure sustainable regional development. More specifically, the findings provide an essential framework for determining how simultaneous densification and sprawl can be used to create a balanced and integrated urban region that does not threaten regional resources.
Here, this study has two key implications. First, land use change is an important signifier of urbanization dynamics and environmental sustainability [24]. Therefore, effective land use planning should be incorporated into regional policymaking [91] to avoid fait accompli urban planning applications. Beyond polycentric or centralist models, innovative land use analysis and planning methods must be used [92] to comprehend the spatial complexity of urban regions.
Second, in developing sustainable regional urban and ecologic development strategies to enhance the development of a balanced and integrated network of cities, policy-makers should urgently invest in actions that facilitate more intensive engagement and dialog between governmental and institutional bodies, such as RDAs and the Marmara Region Metropolitan Municipalities. Furthermore, the region’s urban transformation has transcended its administrative boundaries, thereby endangering regional resources. This perfectly exemplifies the complexities of resource management at the territorial level, demanding transboundary collaboration between regional decision-making bodies [24].

5.4. Methodological and Modeling Limitations

In this study, we used Gray’s [27] exploratory approach and Lebart’s [28] exploratory (unsupervised) data analysis model. We specifically focused on the distribution of urban land in the Marmara Region to understand the region’s urbanization patterns. By adopting these approaches we aimed to obtain visually-communicative and comprehensive composite maps that convey both the regional scale and the detailed intra-regional variations of urbanization patterns. The 1-km grid applied on CLC data (after the test of different grid sizes) enabled an adequate variety for generating morphological clusters that demonstrated the complexity of urbanization dynamics. Hence the 1-km grid facilitated the visualization of the fundamental urbanization patterns at the regional scale to answer the research questions. In the grid-cell analyses, however, the selected spatial unit affected the results. Moreover, the CLC data embodies the MMU (25 ha) and minimum width (100 m) limitations [35]. For future studies, we recommend the use of higher resolutions, the utilization of alternative spatial data resources, and different spatial scales (essential for areas subject to more dynamic change) [36,37].
On the other hand, the scope and consistency of the CLC data sets, and the variety of the included land cover types not only enabled us to track temporal changes precisely but also provided the flexibility to transcend administrative boundaries and the limits of population-based studies to reveal the spatial dimension of the regional urbanization. The diversity of the urban fabric land cover types included in the Level-4 classification of CLC data that differentiates highly urbanized areas, sprawl areas, and low-density rural areas is an advantage in discussing urbanization patterns. However, it should be acknowledged that the variety of land cover types in the CLC data is an obstacle, as it prevents researchers from seeing the hidden structures of distinctive spatial associations. In this regard, more comprehensive studies are needed on spatial pattern recognition techniques and in-depth analysis of international case studies, particularly to elaborate on hybrid regional development patterns and adequately address the sustainable development challenges of these rapidly developing areas.
At this point we need to acknowledge one of the main limitations of this study, that these maps, based on the complementary use of correspondence and cluster analyses, reveal one of the many possible representations of the Marmara Region as a complex entity. This limitation can be overcome by applying different pattern recognition techniques and conducting thorough analyses of other land cover types, such as agricultural areas and forests. Long-term scenario-based models are needed to explore the causal inferences of the policies enacted in 2012.
Finally, it should also be acknowledged that while our study was limited to understanding the spatial transformation of urban regions, another important body of knowledge highlights the relationship of urban networks with infrastructural [93] and societal networks in urban agglomerations.

6. Conclusions

By utilizing Gray’s [27] exploratory approach and Lebart’s [28] exploratory (unsupervised) data analysis model, this study analyzed urban fabric land cover change in the Marmara Region between 2006 and 2018 to explore the relationship between urban regions, mega-projects, and regional policy, and highlighting the critical importance of land use planning for sustainable regional development. The complementary use of MCA and cluster analysis enabled the investigation of the patterns and extent of urban land cover distribution regionally by projecting the Marmara Region’s distinctive urbanization dynamics. From the above discussion, we can conclude that, by utilizing this model, the study identified a unique urbanization pattern at the regional scale, which contributes to critiques of solely polycentric or centralist models [7] in regional planning. We found that simultaneous densification and sprawl within Turkey’s Marmara region indicates the complexity and hybridity of contemporary regional formations. Our findings demonstrate a dissonance between the spatial dynamics of the Marmara Region during the study period, and the capacity and scope of the simultaneously initiated regional policies and mega-projects. This uncoordinated approach has further endangered the region’s sustainable development. This unique urbanization pattern at the regional scale also revealed the speed and scope of “planetary urbanization” [26,49]. All these findings demonstrate that it is imperative to utilize remote sensing data to monitor and prevent sprawl and to achieve the sustainable spatial development of the Marmara Region.
This study addressed the dissonance between the regional spatial dynamics of the Marmara Region and the scope of the simultaneously initiated interventions between 2006 and 2018. Beyond the local case, this study’s results link theory and practice to contribute to critiques of solely polycentric or centralist models in regional planning. Looking ahead to future inter- and intra-regional integration, specifically the transformation of the Sea of Marmara into the port of Istanbul, the impact of the new presidential system in 2018, and the new local governance in Istanbul warrant more research attention to ensure ongoing monitoring of regional urbanization in the region. Finally, to make Turkey’s urban regional planning more effective in the long-term, more research is needed into the dynamics of the urban–rural structure, along with comparative studies of regional development patterns, and urban growth simulation models.

Author Contributions

Conceptualization, Ö.A.G. and C.G.; methodology, Ö.A.G.; software, Ö.A.G.; data curation, Ö.A.G.; writing—original draft preparation, Ö.A.G.; writing—review and editing, Ö.A.G., and C.G.; visualization, Ö.A.G.; supervision, C.G.; project administration, C.G.; funding acquisition, C.G. All authors have read and agreed to the published version of the manuscript.

Funding

This article was sponsored by the PEAK Urban programme, supported by UKRI’s Global Challenge Research Fund, Grant Ref: ES/P011055/1; the Shanghai Pujiang Program, Grant Ref. 2019PJC076; Supported by Open Projects Fund of Shanghai Key Laboratory of Urban Renewal and Spatial Optimization Technology, Grant Ref. 2020030201; and the Zaanheh Project, an interdisciplinary project led by a team at and funded by NYU Shanghai, China. The corresponding author is the recipient of the funding streams.

Data Availability Statement

Level-4 CLC data for 2006, 2012, and 2018 for Turkey were obtained from the Republic of Turkey Ministry of Agriculture and Forestry.

Acknowledgments

We are grateful to Murat Güvenç for his contribution to data analysis and the method section and we thank him for his supervision. We would like to thank Peter Rowe for his comments and supervision. We thank the anonymous reviewers for their constructive comments.

Conflicts of Interest

The authors declare no conflict of interest. The funders had no role in the design of the study, collection, analyses, or data interpretation, writing of the manuscript, or decision to publish the results.

Appendix A

Figure A1. Timeline.
Remotesensing 13 00664 g0a1

Appendix B

Figure A2. Factorial maps.
Remotesensing 13 00664 g0a2aRemotesensing 13 00664 g0a2b

Appendix C

Contingency Tables

Table A1. Theoretical frequencies CUF 2018 (C1\C111). Land cover categories with distinctive concentrations are shaded blue, those with significant concentrations are shaded yellow, and those with minor concentrations are shaded pink.
C1\C1112345679
11.112.58−0.61−0.25−2.34−4.761.22
2−3.67−5.15−6.95−8.71−9.90−10.767.50
3−3.46−5.60−7.35−8.87−9.99−10.967.68
4−0.19−1.48−2.04−2.81−4.12−4.472.69
51.007.5116.4715.084.99−2.96−6.18
60.903.994.09−0.92−1.773.82−1.39
77.352.034.654.777.6412.79−6.41
85.2410.5910.8914.6712.60−3.27−7.37
90.17−1.420.33−1.301.890.96−0.25
104.569.9114.5523.2923.203.95−12.82
11−0.592.762.907.6522.1054.08−17.68
Total431031732493203778483
Table A2. Theoretical frequencies DUF 2018 (C1\c1121).
C1\c11212345679
11.1122.5724.8723.73−2.1410.31−19.82
2−5.92−8.09−10.09−11.19−12.75−14.3115.45
3−5.03−7.90−9.89−12.61−14.42−14.3016.13
4−2.03−1.46−1.27−2.59−4.98−5.784.71
51.49−1.43−0.573.1414.0321.98−11.50
66.619.9113.935.73−2.50−1.38−5.91
72.042.792.776.7738.916.71−16.76
8−0.66−2.15−1.066.3111.9223.01−11.54
90.541.201.434.321.2524.58−9.57
10−1.47−0.68−0.537.2018.8615.57−11.86
116.646.6510.436.50−2.66−0.91−4.89
Total1122283265216426687251
Table A3. Theoretical frequencies DRF 2018 (C1\c1122).
C1\c11222345679Total
1−4.70−6.30−8.59−10.06−10.24−9.3932.01868.00
2−7.43−9.20−12.74−15.2144.8426.99−29.973047.00
318.7724.1732.5538.21−25.00−20.73−30.513158.00
4−4.44−5.78−7.58−8.847.8231.08−12.35517.00
5−2.59−3.82−5.01−5.84−6.79−5.1819.16226.00
6−1.90−1.67−2.32−2.73−4.18−3.5910.7795.00
7−5.43−6.94−9.17−10.54−12.26−9.1034.76775.00
8−3.24−4.23−5.53−6.15−6.98−6.1320.91276.00
9−2.33−3.23−4.17−5.00−5.61−4.9016.48191.00
10−2.68−3.50−4.58−5.34−6.21−5.0717.85189.00
11−3.68−5.13−6.71−7.83−9.11−7.4326.08406.00
Total371631108214731991132628749748
Table A4. Theoretical frequencies IMA 2018 (C1\c121142).
C1\c1211422345679Total
10.80−0.651.78−3.70−0.841.290.56868.00
2−4.40−5.29−7.50−0.58−7.11−9.927.823047.00
3−1.64−4.06−4.29−13.11−14.23−12.4512.843158.00
42.664.795.356.096.14−5.20−4.33517.00
5−0.947.528.2917.176.740.64−9.67226.00
61.925.321.633.31−2.160.92−1.9195.00
74.280.033.287.9210.9612.97−10.05775.00
80.569.874.305.9514.9712.27−11.86276.00
9−0.07−0.870.29−2.37−2.510.011.48191.00
104.114.406.345.9314.1812.14−11.57189.00
113.102.584.294.0014.0628.63−14.49406.00
Total10718732054966850974089748
Table A5. Theoretical frequencies AFWW 2018 (C1\c2133222).
C1\c21332222345679Total
1−2.951.161.0010.00−5.792.84−6.42868.00
2−6.08−6.22−7.86−12.3542.18−17.25−14.593047.00
3−9.47−9.58−12.14−13.95−29.4445.92−15.123158.00
4−3.570.004.4735.430.39−14.96−6.12517.00
5−0.960.177.6525.62−3.50−9.89−3.80226.00
614.187.974.90−1.67−5.29−1.74−1.1095.00
712.5710.227.530.655.49−18.2112.26775.00
815.0517.3124.966.42−8.90−10.93−3.35276.00
912.6914.2120.453.50−6.56−9.10−2.11191.00
109.332.35−0.68−3.76−7.46−9.0534.68189.00
110.43−1.69−3.73−6.20−10.93−13.2665.39406.00
Total277283467924286942227069748
Table A6. Theoretical frequencies CUF 2012 (C1/Class111).
1234567
19.328−4.274−6.894−8.807−10.075−11.367−12.204
23.381−1.151−2.145−3.055−3.145−4.704−4.736
3−1.4872.6499.5372.6643.699−2.238−2.416
46.238−2.627−3.446−6.186−7.056−7.939−8.110
53.330−1.553−2.165−3.240−3.425−4.224−4.434
60.259−1.106−1.2710.2930.7882.312−3.157
7−2.0882.1581.9324.7653.5600.7170.699
8−17.3586.3866.3078.42013.73512.57045.197
9−5.7634.5496.51210.0734.6275.8134.673
10−0.3681.5965.9961.758−1.457−1.801−0.662
11−19.1564.7906.87717.56425.07840.12211.399
Total792245122196255333367
Table A7. Theoretical frequencies DUF 2012 (C1/Class1121).
1234567
117.173−5.989−9.994−11.920−14.361−15.035−14.059
2−6.43011.16319.66721.909−2.628−4.769−5.689
3−5.972−1.585−2.537−3.01833.666−3.780−2.968
411.204−3.460−6.572−7.965−9.559−9.757−9.033
55.039−0.982−0.667−3.673−4.319−5.096−5.108
6−10.858−1.632−1.845−1.1739.57835.187−3.362
7−15.8643.1572.0587.32511.55413.24024.810
8−7.5381.3623.4704.8731.5755.49613.762
9−13.4851.4391.8792.7439.38214.21221.819
10−8.04210.27117.02315.3594.694−2.905−1.244
11−14.2462.5635.6827.28910.61717.75812.515
Table A8. Theoretical frequencies DRF 2012 (C1/Class1122).
1234567
1−33.200−10.93220.71426.05628.585−5.346−17.838
27.706−2.879−3.292−4.085−4.252−5.1599.823
313.819−1.274−1.867−2.804−3.673−6.525−4.484
4−22.854−6.825−10.951−13.679−15.12239.68837.984
5−12.06265.807−1.025−1.228−1.222−8.506−4.012
616.325−2.720−4.653−5.587−6.229−4.831−0.714
727.636−3.950−6.574−8.326−8.806−8.615−6.218
830.132−4.251−6.831−8.697−9.490−10.085−6.775
927.291−3.621−6.272−7.860−8.808−9.043−6.059
1011.512−1.837−2.324−2.842−2.831−4.545−3.447
1126.942−3.980−6.076−7.736−8.533−8.970−6.026
Table A9. Theoretical frequencies IMA 2012 (C1/Class_121142).
1234567
115.796−5.797−9.027−12.581−14.391−14.188−12.369
2−1.269−1.524−1.661−0.57313.225−2.083−5.005
30.783−1.649−2.042−3.163−3.125−3.56710.075
44.387−1.472−2.617−2.767−4.494−0.187−7.880
5−2.5105.59010.86414.025−4.549−4.961−3.826
62.432−1.697−1.728−2.026−2.717−0.946−1.950
7−3.651−0.0052.1224.4415.7235.255−3.110
8−13.0062.7275.2146.52210.68914.09515.522
9−13.8246.0206.9017.46613.57415.06310.524
10−6.2387.41311.9259.0882.853−2.0123.468
11−17.4895.0053.0867.27811.29117.53030.041
Table A10. Theoretical frequencies AFWW 2012 (C1/Class2133322).
1234567
1−16.437−6.340−10.603−13.409−14.997−28.02139.701
2−6.796−3.055−1.02714.4803.906−6.8622.020
3−3.748−1.350−1.9151.0792.037−7.3955.998
4−11.649−5.701−6.130−8.2251.95257.678−30.153
5−4.955−2.0065.493−3.640−4.919−10.03210.986
6−4.345−1.874−0.556−1.163−1.42721.299−11.247
7−4.2079.5647.13810.35015.7016.193−16.128
841.1208.71514.3489.830−0.311−11.173−16.513
90.4616.8577.66216.71128.041−8.113−15.028
100.4533.4990.8803.1990.357−5.6841.600
1149.8449.2678.7021.651−5.596−9.938−14.687
Table A11. Theoretical frequencies CUF 2006 (C1/Class_111).
1234567
110.0−4.6−7.3−9.6−10.7−12.2−12.7
22.40.42.7−0.4−1.6−5.3−6.0
32.4−0.90.8−1.0−3.5−3.8−3.8
45.8−2.7−3.1−5.7−6.4−7.3−7.7
5−1.12.62.76.23.0−0.9−3.4
6−3.5−0.42.11.83.25.95.4
7−17.94.24.78.814.421.739.5
8−9.86.96.811.311.610.411.1
9−16.16.07.514.820.329.112.5
Total775446120200249331364
Table A12. Theoretical frequencies DUF 2006 (C1/Class1121).
1234567
117.0−6.2−10.4−12.5−14.5−14.7−14.8
2−11.06.012.313.412.611.7−5.1
3−0.17.13.44.0−0.8−4.4−3.1
49.5−3.1−4.0−6.7−8.3−9.0−8.9
5−13.70.43.85.58.915.819.6
6−8.52.44.47.212.9−1.310.8
7−5.41.01.84.31.84.49.0
8−13.81.63.65.08.113.623.0
9−15.33.95.66.714.519.013.1
Total694492241342457503485
Table A13. Theoretical frequencies DRF 2006 (C1/Class_1122).
1234567
1−34.712.318.324.126.8−8.7−18.1
217.8−3.0−3.4−4.8−6.5−7.9−0.3
3−3.0−3.4−5.1−6.9−7.42.628.1
4−20.7−6.9−10.2−13.7−14.641.229.4
522.8−3.5−5.3−6.8−7.4−7.0−4.8
618.8−2.7−4.4−5.4−6.1−6.0−4.0
728.6−3.9−6.4−8.2−8.9−9.5−6.4
831.9−4.4−7.1−9.1−10.1−10.6−7.0
923.0−3.3−5.1−6.5−7.2−7.6−5.1
Total2632332774126915541721782
Table A14. Theoretical frequencies IMA 2006 (C1/Class_121142).
1234567
112.8−4.2−5.3−7.3−14.9−10.7−12.8
2−0.4−2.7−2.5−2.87.3−0.70.1
3−7.611.214.614.76.8−4.5−1.9
49.7−4.0−6.0−8.0−9.0−8.1−7.7
5−6.31.33.56.310.18.5−3.6
61.8−0.1−0.8−2.4−2.0−2.70.7
7−15.03.96.06.511.212.525.3
8−14.23.45.18.212.915.415.2
9−15.34.82.07.712.820.916.4
Total701699222390496481360
Table A15. Theoretical frequencies AFWW 2006 (C1/Class2133322).
1234567
1−17.0−8.9−7.0−11.2−19.2−28.740.9
2−8.21.6−3.2−0.912.1−1.7−0.2
3−2.4−2.8−2.3−1.323.22.6−9.1
4−10.1−5.5−6.6−3.6−11.658.0−26.8
5−4.6−2.60.4−1.816.412.8−12.9
6−1.415.812.416.12.8−1.0−11.2
752.08.06.90.60.0−10.5−15.5
81.58.713.925.922.7−9.0−17.2
941.710.68.61.9−5.1−8.4−12.4
Total63018926944282421134597

Appendix D

Table A16. Intensity Ratios.
IntensityYear
200620122018
CUF
10%0%0%
20–0.4%0–0.4%0–0.09%
30.4–3.5%0.4–3.5%0.09–6.6%
43.6–13.1%3.6–12.0%6.6–23.5%
513.2–30.9%13.0–30.8%23.5–52.4%
631–59.4%31.0–59.5%52.6–84. 4%
759.5–100%59.8–100%84.4–100.0%
DUF
10%0%0%
20–0.3%0–0.3%0–0.03%
30.3–2.7%0.3–2.9%0.03–2.3%
42.8–9.7%2.9–10.2%2.3–8.1%
59.8–23.7%10.3–25.2%8.2–21.0%
623.8–47.5%25.3–51.2%21.0–46.4%
747.8–100%51.3–100%47.0–100.0%
DRF
10%0%0%
20–0.2%0–0.2%0–0.02%
30.2–1.6%0.2–1.7%0.02–1.1%
41.6–6.1%1.7–6.3%1.1–4.0%
56.1–15.5%6.3–15.7%4.0–11.0%
615.5–32.6%15.7–33.1%11.1–25.6%
732.7–100%33.1–100%26.6–100.0%
IMA
10%0%0%
20–0.4%0–0.4%0–0.02%
30.4–3%0.4–2.9%0.02–1.5%
43–10.4%3.0–10.1%1.9–6.3%
510.4–23.9%10.1–23.1%6.6–17.0%
623.9–43.1%23.2–47.2%17.2–37.7%
743.2–100%47.2–100%4.4–100.0%
AFWW
10%0%0%
20–0.5%0–0.4%0–0.09%
30.5–4.7%0.4–4.3%0.09–6.6%
44.8–22.1%4.4–21.1%6.6–23.4%
522.1–50.4%21.1–49.1%23.5–52.4%
650.4–79.5%49.7–79.2%52.5–84.4%
779.5–100%79.2–100%84.4–100.0%

Appendix E

Table A17. List of the indicated plans and policies.
NameInstitution YearPurpose/Impact
Istanbul Environmental Plan Istanbul Metropolitan Municipality2009Prevent urban sprawl towards the north of Istanbul.
2010–2013 development plansThrace Development Agency, Istanbul Development Agency, Southern Marmara Development Agency, Bursa Eskişehir Bilecik Development Agency, Eastern Marmara Development Agency2010Fine-grain information concerning land use plans, sustainability goals, transportation networks, and the future goals of each RDA.
2014–2023 development plans2014
Law No. 2002/4720 2002Adopted the EU’s three-level NUTS (Nomenclature of Territorial Units for Statistics) model.
Law No. 54492006The establishment of Regional Development Agencies (RDAs).
Law No. 6360 (the Metropolitan Municipality Law)2012Transformed villages in metropolitan municipalities into districts.
Law No. 6306 (the Regeneration of Areas under Disaster Law)2012Government authority over urban planning decisions by designating “risky” and “reserve” areas.

References

  1. Gottmann, J. Megalopolis: The Urbanized Northeastern Seaboard of the United States; The Twentieth century fund: New York, NY, USA, 1961; ISBN 978-0-262-57003-9. [Google Scholar]
  2. Soja, E.W. Regional Urbanization and the End of the Metropolis Era. In The New Blackwell Companion to the City; John Wiley & Sons: Hoboken, NJ, USA, 2012; pp. 679–689. ISBN 978-1-4443-9510-5. [Google Scholar]
  3. World Urbanization Prospects-Population Division-United Nations. Available online: https://population.un.org/wup/ (accessed on 21 December 2020).
  4. Fang, C.; Yu, D. Urban Agglomeration: An Evolving Concept of an Emerging Phenomenon. Landsc. Urban Plan. 2017, 162, 126–136. [Google Scholar] [CrossRef]
  5. Geddes, P. Cities in Evolution; an Introduction to the Town Planning Movement and to the Study of Civics; Williams & Norgate: London, UK, 1915. [Google Scholar]
  6. Forman, R.T.T. Urban Regions; Cambridge University Press: Cambridge, UK, 2008; ISBN 978-0-521-67076-0. [Google Scholar]
  7. Hall, P.; Pain, K. The Polycentric Metropolis: Learning from Mega-City Regions in Europe, 1st ed.; Routledge: London, UK, 2009. [Google Scholar]
  8. Glaeser, E.L.; Kallal, H.D.; Scheinkman, J.A.; Shleifer, A. Growth in Cities. J. Polit. Econ. 1992, 100, 1126–1152. [Google Scholar] [CrossRef]
  9. Fujita, M.; Krugman, P.R.; Venables, A. The Spatial Economy: Cities, Regions, and International Trade; MIT Press: Cambridge, MA, USA, 1999; ISBN 978-0-262-56147-1. [Google Scholar]
  10. Batty, M. The New Science of Cities; The MIT Press: Cambridge, MA, USA, 2013. [Google Scholar]
  11. Han, M.; Zhang, B.; Zhang, Y.; Guan, C. Agricultural CH4 and N2O Emissions of Major Economies: Consumption-vs. Production-Based Perspectives. J. Clean. Prod. 2019, 210, 276–286. [Google Scholar] [CrossRef]
  12. Wu, F. China’s Emergent City-Region Governance: A New Form of State Spatial Selectivity through State-Orchestrated Rescaling. Int. J. Urban Reg. Res. 2016, 40, 1134–1151. [Google Scholar] [CrossRef]
  13. Guan, C.; Rowe, P.G. The Concept of Urban Intensity and China’s Townization Policy: Cases from Zhejiang Province. Cities 2016, 55, 22–41. [Google Scholar] [CrossRef] [Green Version]
  14. Suzuki, S.; Nijkamp, P. Winners in the Urban Champions League-A Performance Assessment of Japanese Cities by Means of Dynamic and Super-Efficient DEA. J. Urban Manag. 2018, 7, 6–20. [Google Scholar] [CrossRef]
  15. Krehl, A.; Siedentop, S. Towards a Typology of Urban Centers and Subcenters—Evidence from German City Regions. Urban Geogr. 2019, 40, 58–82. [Google Scholar] [CrossRef] [Green Version]
  16. Hernández-Moreno, S. International Experiences on the Implementation of Public Policies for Urban Planning To Face Climate Change. Theor. Empir. Res. Urban Manag. 2019, 14, 72–88. [Google Scholar]
  17. Urban Environment—European Environment Agency. Available online: https://www.eea.europa.eu/themes/urban/intro (accessed on 31 January 2021).
  18. Monitoring Land Cover Change; OECD: Paris, France, 2018.
  19. Hagenauer, J.; Helbich, M. Local Modelling of Land Consumption in Germany with RegioClust. Int. J. Appl. Earth Obs. Geoinf. 2018, 65, 46–56. [Google Scholar] [CrossRef]
  20. Liu, X.; Li, X.; Chen, Y.; Tan, Z.; Li, S.; Ai, B. A New Landscape Index for Quantifying Urban Expansion Using Multi-Temporal Remotely Sensed Data. Landsc. Ecol. 2010, 25, 671–682. [Google Scholar] [CrossRef]
  21. Bosch, M.; Jaligot, R.; Chenal, J. Spatiotemporal Patterns of Urbanization in Three Swiss Urban Agglomerations: Insights from Landscape Metrics, Growth Modes and Fractal Analysis. Landsc. Ecol. 2020, 35, 879–891. [Google Scholar] [CrossRef]
  22. Wu, W.; Zhao, S.; Zhu, C.; Jiang, J. A Comparative Study of Urban Expansion in Beijing, Tianjin and Shijiazhuang over the Past Three Decades. Landsc. Urban Plan. 2015, 134, 93–106. [Google Scholar] [CrossRef]
  23. Robinson, L.; Newell, J.P.; Marzluff, J.M. Twenty-Five Years of Sprawl in the Seattle Region: Growth Management Responses and Implications for Conservation. Landsc. Urban Plan. 2005, 71, 51–72. [Google Scholar] [CrossRef]
  24. Salata, S. Land Use Change Analysis in the Urban Region of Milan. Manag. Environ. Qual. Int. J. 2017, 28, 879–901. [Google Scholar] [CrossRef]
  25. Salvati, L.; Sabbi, A. Exploring Long-Term Land Cover Changes in an Urban Region of Southern Europe. Int. J. Sustain. Dev. World Ecol. 2011, 18, 273–282. [Google Scholar] [CrossRef]
  26. Brenner, N.; Katsikis, N. Operational Landscapes: Hinterlands of the Capitalocene. Archit. Des. 2020, 90, 22–31. [Google Scholar] [CrossRef]
  27. Gray, M.V. Classification as an Impediment to the Reliable and Valid Use of Spatial Information: A Disaggregate Approach. In Proceedings of the Spatial Information Theory A Theoretical Basis for GIS, Semmering, Austria, 21–23 September 1995; Hirtle, S.C., Frank, A.U., Eds.; Springer: Berlin/Heidelberg, Germany, 1997; pp. 137–149. [Google Scholar]
  28. Lebart, L. Complementary use of correspondence analysis and cluster analysis. In Correspondence Analysis in the Social Sciences; Greenacre, M., Blasius, J., Eds.; Academic Press: San Diego, CA, USA, 1994; pp. 162–178. [Google Scholar]
  29. Kaya, H.; Dökmeci, V. Development of Urban Hierarchies at the Country and Regional Levels in Turkey. AZ ITU J. Fac. Archit. 2017, 14, 131–149. [Google Scholar] [CrossRef]
  30. Pérouse, J.-F. Is the Turkey’s Marmara Region Really Developed? Geogr. Rundsch. Int. Ed. 2009, 3, 40–46. [Google Scholar]
  31. Pérouse, J.-F. Region versus Metropolis. Thrace and Sprawling Istanbul. In The Heritage of Edirne in Ottoman and Turkish Times: Continuities, Disruptions and Reconnections; Krawietz, B., Riedler, F., Eds.; Freie Universität Berlin: Berlin, Germany, 2019; pp. 436–469. [Google Scholar]
  32. Eraydin, A. Changing Istanbul City Region Dynamics: Re-Regulations to Challenge the Consequences of Uneven Development and Inequality. Eur. Plan. Stud. 2011, 19, 813–837. [Google Scholar] [CrossRef]
  33. WWF-Turkey. Ya Kanal Ya İstanbul: Kanal İstanbul Projesinin Ekolojik, Sosyal ve Ekonomik Değerlendirmesi. 2018. Available online: https://d2hawiim0tjbd8.cloudfront.net/downloads/kanalistanbul_1.pdf (accessed on 11 February 2021).
  34. Ustaoglu, E.; Aydınoglu, A.C. Regional Variations of Land-Use Development and Land-Use/Cover Change Dynamics: A Case Study of Turkey. Remote Sens. 2019, 11, 885. [Google Scholar] [CrossRef] [Green Version]
  35. Cieślak, I.; Biłozor, A.; Szuniewicz, K. The Use of the CORINE Land Cover (CLC) Database for Analyzing Urban Sprawl. Remote Sens. 2020, 12, 282. [Google Scholar] [CrossRef] [Green Version]
  36. Rusu, A.; Ursu, A.; Stoleriu, C.C.; Groza, O.; Niacșu, L.; Sfîcă, L.; Minea, I.; Stoleriu, O.M. Structural Changes in the Romanian Economy Reflected through Corine Land Cover Datasets. Remote Sens. 2020, 12, 1323. [Google Scholar] [CrossRef] [Green Version]
  37. Petrişor, A.-I.; Sirodoev, I.; Ianoş, I. Trends in the National and Regional Transitional Dynamics of Land Cover and Use Changes in Romania. Remote Sens. 2020, 12, 230. [Google Scholar] [CrossRef] [Green Version]
  38. Guan, C.; Rowe, P.G. In Pursuit of a Well-Balanced Network of Cities and Towns: A Case Study of the Changjiang Delta Region in China. Environ. Plan. B Urban Anal. City Sci. 2018, 45, 548–566. [Google Scholar] [CrossRef]
  39. Bagan, H.; Yamagata, Y. Land-Cover Change Analysis in 50 Global Cities by Using a Combination of Landsat Data and Analysis of Grid Cells. Environ. Res. Lett. 2014, 9, 064015. [Google Scholar] [CrossRef]
  40. Kristensen, S.P. Multivariate Analysis of Landscape Changes and Farm Characteristics in a Study Area in Central Jutland, Denmark. Ecol. Model. 2003, 168, 303–318. [Google Scholar] [CrossRef]
  41. Almeida, M.; Loupa-Ramos, I.; Menezes, H.; Carvalho-Ribeiro, S.; Guiomar, N.; Pinto-Correia, T. Urban Population Looking for Rural Landscapes: Different Appreciation Patterns Identified in Southern Europe. Land Use Policy 2016, 53, 44–55. [Google Scholar] [CrossRef] [Green Version]
  42. Yilmaz, R. Monitoring Land Use/Land Cover Changes Using CORINE Land Cover Data: A Case Study of Silivri Coastal Zone in Metropolitan Istanbul. Environ. Monit. Assess. 2010, 165, 603–615. [Google Scholar] [CrossRef]
  43. Sarİ, H.; Ozsahİn, E. Spatiotemporal Change in the LULC (Landuse/Landcover) Characteristics of Tekirdag Province Based on the CORINE (Thrace, Turkey). Fresenius Environ. Bull. 2016, 25, 4694–4707. [Google Scholar]
  44. Terzi, F.; Bolen, F. Urban Sprawl Measurement of Istanbul. Eur. Plan. Stud. 2009, 17, 1559–1570. [Google Scholar] [CrossRef]
  45. Corine Land Cover General Description. Available online: https://land.copernicus.eu/user-corner/technical-library/corine-land-cover-general-descriptione (accessed on 12 February 2021).
  46. Leśniewska-Napierała, K.; Nalej, M.; Napierała, T. The Impact of EU Grants Absorption on Land Cover Changes—The Case of Poland. Remote Sens. 2019, 11, 2359. [Google Scholar] [CrossRef] [Green Version]
  47. Guérois, M.; Pumain, D. Built-Up Encroachment and the Urban Field: A Comparison of Forty European Cities. Environ. Plan. A 2008, 40, 2186–2203. [Google Scholar] [CrossRef]
  48. Kovács, Z.; Farkas, Z.J.; Egedy, T.; Kondor, A.C.; Szabó, B.; Lennert, J.; Baka, D.; Kohán, B. Urban Sprawl and Land Conversion in Post-Socialist Cities: The Case of Metropolitan Budapest. Cities 2019, 92, 71–81. [Google Scholar] [CrossRef]
  49. Katsikis, N.; Brenner, N. Is the Mediterranean urban? In Implosions/Explosions: Towards a Study of Planetary Urbanization; Brenner, N., Ed.; JOVIS: Berlin, Germany, 2013; pp. 428–459. [Google Scholar]
  50. Couclelis, H. People Manipulate Objects (but Cultivate Fields): Beyond the Raster-Vector Debate in GIS. In Proceedings of the Theories and Methods of Spatio-Temporal Reasoning in Geographic Space; Frank, A.U., Campari, I., Formentini, U., Eds.; Springer: Berlin/Heidelberg, Germany, 1992; pp. 65–77. [Google Scholar]
  51. Han, J.; Kamber, M.; Pei, J. Advanced Cluster Analysis. In Data Mining Concepts and Techniques (The Morgan Kaufmann Series in Data Management Systems); Morgan Kaufmann: Waltham, MA, USA, 2012; pp. 497–541. ISBN 978-0-12-381479-1. [Google Scholar]
  52. David, G.; Stork Richard, O.; Duda, P.E.H. Pattern Classification, 2nd ed.; John Wiley and Sons: Hoboken, NJ, USA, 2003; ISBN 978-981-4126-02-1. [Google Scholar]
  53. Gatrell, A. Any Space for Spatial Analysis. In The Future of Geography; Johnston, R.J., Ed.; Taylor & Francis: London, UK, 1985. [Google Scholar]
  54. Dulupçu, M.A. Regionalization for Turkey: An Illusion or a Cure? Eur. Urban Reg. Stud. 2005, 12, 99–115. [Google Scholar] [CrossRef]
  55. Özçelik, A. Changing Dynamics of Regional Policy in Turkey: Resistance for Multi-Level Governance. Altern. Turk. J. Int. Relat. 2014, 13. [Google Scholar] [CrossRef] [Green Version]
  56. Tekeli, İ. Bridging histories. In Living in the Endless City; Burdett, R., Deyan, S., Eds.; Phaidon: London, UK, 2011; pp. 210–217. [Google Scholar]
  57. Territorial Reviews: Istanbul, Turkey-OECD. Available online: https://www.oecd.org/gov/oecdterritorialreviewsistanbulturkey.htm (accessed on 21 December 2020).
  58. Gül, H. Local, metropolitan and regional administration reforms in. In New Public Management in Turkey; Demirkaya, Y., Ed.; Routledge: Oxfordshire, UK, 2016; pp. 332–363. ISBN 978-1-315-64128-7. [Google Scholar]
  59. Özışık, U. Küreselleşme-Yerelleşme Sürecinde Kentsel Yönetişim: Kalkınma Ajansları ve İzmir Örneği. Kent Akad. 2012, 5, 129–145. [Google Scholar]
  60. Özışık, U. Kent-Bölge Kavramı Işığında Türkiye’de Büyükşehir Belediye Sisteminde Değişim ve Kalkınma Ajansları: Yerel Ölçekte Mekânın ve Yönetişimin Yeniden Tanımlanması. Akad. İncelemeler Derg. 2015, 10. [Google Scholar] [CrossRef] [Green Version]
  61. Sungur, O.; Keskin, H.; Dulupçu, M.A. Adaptation of Turkey’s Regional Policies to the EU Acquis: An Evaluation through Progress Reports (1998–2012). Marmara Üniversitesi Avrupa Topluluğu Enstitüsü Avrupa Araştırmaları Derg. 2015, 21, 165–193. [Google Scholar]
  62. Bilen, G. Novel Regional Policy of Turkey in Line with EU Standards. SSRN Electron. J. 2005. [Google Scholar] [CrossRef] [Green Version]
  63. Turan, H.T. Reconstruction of Regional Development Policies in Turkey through Development Agencies. In New Public Management in Turkey; Demirkaya, Y., Ed.; Routledge: Oxfordshire, UK, 2016; pp. 128–154. [Google Scholar]
  64. Sezgin, E. New Regionalism in Turkey: Questioning the ‘New’ and the ‘Regional’. Eur. Plan. Stud. 2018, 26, 653–669. [Google Scholar] [CrossRef]
  65. Eren, M.; Özçevik, Ö. Institutionalization of Disaster Risk Discourse in Reproducing Urban Space in Istanbul. AZ ITU J. Fac. Archit. 2015, 12, 221–241. [Google Scholar]
  66. Erder, T.L. The Making of Industrial Bursa: Economic Activity and Population in a Turkish City 1835–1975; University Microfilms International: Ann Arbor, MI, USA, 1976. [Google Scholar]
  67. Mutlu, S. The Spatial Urban Hierarchy in Turkey: Its Structure and Some of Its Determinants. Growth Chang. 1998, 19, 53–74. [Google Scholar] [CrossRef]
  68. T.C Maarif Vekilligi. Birinci Coğrafya Kongresi: 6-21 Haziran 1941; Raporlar, Müzakereler, Kararlar; Maarif Basımevi: Istanbul, Turkey, 1941. [Google Scholar]
  69. Kentel, K.M. Assembling ‘Cosmopolitan’ Pera: An Infrastructural History of Late Ottoman Istanbul. Ph.D. Thesis, University of Washington, Seattle, WA, USA, 2018. [Google Scholar]
  70. Tekeli, İ. The Development of the Istanbul Metropolitan Area: Urban Administration and Planning; IULA: İstanbul, Turkey, 1994. [Google Scholar]
  71. Akinci, F. The Aftermath of Disaster in Urban Areas: An Evaluation of the 1999 Earthquake in Turkey. Cities 2004, 21, 527–536. [Google Scholar] [CrossRef]
  72. Bibbee, A.; Gönenç, R.; Jacobs, S.; Konvitz, J.; Price, R. Economic Effects of the 1999 Turkish Earthquakes: An Interim Report. OECD Econ. Dep. Work. Pap. 2000. [Google Scholar] [CrossRef]
  73. Güvenç, M. Port of Istanbul: A short history. In Port City Talks: Istanbul-Antwerp; Tabanlıoğlu, M., Ed.; Mas Books: İstanbul, Turkey, 2015; pp. 122–127. ISBN 978-90-8586-714-2. [Google Scholar]
  74. IBB. 1/100.000 Ölçekli İstanbul Çevre Düzeni Plani Raporu; İstanbul Büyükşehir Belediyesi İmar ve Şehircilik Daire Başkanlığı Şehir Planlama Müdürlüğü: Istanbul, Turkey, 2009. [Google Scholar]
  75. Dogan, E.; Stupar, A. The Limits of Growth: A Case Study of Three Mega-Projects in Istanbul. Cities 2017, 60, 281–288. [Google Scholar] [CrossRef]
  76. Ahaber Bu Ilçede Arsa Fiyatları Günlük Yüzde 15 Artıyor. Available online: https://www.ahaber.com.tr/ekonomi/2013/05/26/bu-ilcede-arsa-fiyatlari-gunluk-yuzde-15-artiyor (accessed on 21 December 2020).
  77. Marketing Turkiye Kanal İstanbul’la 5 Yılda Hangi Bölgeler Değerlendi?-Emlakjet Haberleri. Available online: https://www.emlakjet.com/haber/haber/kanal-istanbulla-5-yilda-hangi-bolgeler-degerlendi-1 (accessed on 21 December 2020).
  78. Milliyet Otoyol Projesinde Spekülasyon Uyarısı. Available online: https://www.milliyet.com.tr/ege/otoyol-projesinde-spekulasyon-uyarisi-1213346 (accessed on 21 December 2020).
  79. Trakya Kalkınma Ajansı. Tr21 Trakya Bölgesi 2014—2023 Bölge Planı. 2017. Available online: https://www.trakyaka.org.tr/upload/Node/35208/xfiles/trakya_bolge_plani_2014-2023.pdf (accessed on 11 February 2021).
  80. Turkey; İmar ve İskân Bakanlığı. Doğu Marmara Bölgesi ön plânı; İmar ve Iskân Bakanliği: İstanbul, Turkey, 1963. [Google Scholar]
  81. İstanbul Kalkınma Ajansı. 2010–2013 İstanbul Bölge Plani. 2011. Available online: https://www.istka.org.tr/media/1068/2010-2013-%C4%B0stanbul-b%C3%B6lge-plan%C4%B1.pdf (accessed on 11 February 2021).
  82. İstanbul Kalkınma Ajansı. 2014–2023 İstanbul Bölge Planı. 2015. Available online: https://www.istka.org.tr/media/1063/2014-2023-%C4%B0stanbul-b%C3%B6lge-plan%C4%B1.pdf (accessed on 11 February 2021).
  83. Trakya Kalkınma Ajansı. Tr21 Trakya Bölge Planı Tekirdağ, Edirne, Kırklareli 2010. 2010. Available online: https://www.trakyaka.org.tr/upload/Node/33265/xfiles/tr21_trakya_2010-2013.pdf (accessed on 11 February 2021).
  84. Güney Marmara Kalkınma Ajansı. Tr22 Güney Marmara Bölge Plani (2010–2013). 2010. Available online: https://www.gmka.gov.tr/dokumanlar/yayinlar/TR22-Guney-Marmara-Bolgesi-2010-2013-Bolge-Plani.pdf (accessed on 11 February 2021).
  85. Güney Marmara Kalkınma Ajansı. Güney Marmara Bölge Plani 2014–2023. 2014. Available online: https://www.gmka.gov.tr/dokumanlar/yayinlar/TR22-Guney-Marmara-Bolgesi-2014-2023-Bolge-Plani.pdf (accessed on 11 February 2021).
  86. Bursa Eskişehir Bilecik Kalkınma Ajansı. Bursa Eskişehir Bilecik Bölge Planı (2010–2013). 2010. Available online: https://www.bebka.org.tr/planlama/bursa-eskisehir-bilecik-bolge-plani-2010-2013-19 (accessed on 11 February 2021).
  87. Bursa Eskişehir Bilecik Kalkınma Ajansı. Bursa Eskişehir Bilecik Bölge Planı 2014–2023. 2014. Available online: https://www.bebka.org.tr/admin/datas/yayins/bolgeplani2014_2023web.pdf (accessed on 11 February 2021).
  88. Doğu Marmara Kalkınma Ajansı. Tr42 Doğu Marmara Bölge Plani 2010–2013. 2010. Available online: http://www.marka.org.tr/uploads/files/plan.pdf (accessed on 11 February 2021).
  89. Doğu Marmara Kalkınma Ajansı. Doğu Marmara Bölge Planı 2014–2023. 2014. Available online: http://www.marka.org.tr/sayfa/571/584/dogu-marmara-bolge-plani-2014-%E2%80%93-2023 (accessed on 11 February 2021).
  90. TUIK Türkiye İstatistik Kurumu. Available online: https://tuikweb.tuik.gov.tr/UstMenu.do?metod=temelist (accessed on 22 December 2020).
  91. Kavaliauskas, P. A Concept of Sustainable Development for Regional Land Use Planning: Lithuanian Experience. Regioninio Teritorijų Planavimo Tvaraus Vystymo Koncepcija: Lietuvos Patirtis. Technol. Econ. Dev. Econ. 2008, 14, 51–63. [Google Scholar] [CrossRef]
  92. Zeković, S.; Vujošević, M.; Bolay, J.-C.; Cvetinović, M.; Miljković, J.Ž.; Maričić, T. Planning and Land Policy Tools for Limiting Urban Sprawl: The Example of Belgrade. Spatium 2015, 69–75. [Google Scholar] [CrossRef]
  93. Graham, S.; Marvin, S. Splintering Urbanism: Networked Infrastructures, Technological Mobilities and the Urban Condition; Routledge: London, UK, 2001; ISBN 978-0-415-18965-1. [Google Scholar]
Figure 1. Gray’s exploratory approach [27].
Remotesensing 13 00664 g001
Figure 2. Gray’s conceptual model for making a composite map [27]. Figures (ae) demonstrate “atom fields in concept” [27] p. 146.
Remotesensing 13 00664 g002
Figure 3. Research flowchart: A summary of the analytical procedure, adopted from Lebart’s model [28].
Remotesensing 13 00664 g003
Figure 4. Grid-cells demonstrating different legend categories based on the predominance of land cover types (Source: ArcGIS).
Remotesensing 13 00664 g004
Figure 5. The study area of the Marmara Region and associated mega-projects.
Remotesensing 13 00664 g005
Figure 6. NUTS 1 regions (marked in yellow) overlaid onto the geographic Marmara Region (marked in black).
Remotesensing 13 00664 g006
Figure 7. Urban fabric land cover composition in 2006.
Remotesensing 13 00664 g007
Figure 8. Urban fabric land cover composition in 2012.
Remotesensing 13 00664 g008
Figure 9. Urban fabric land cover comparison of Thrace and Istanbul for 2006 and 2012.
Remotesensing 13 00664 g009
Figure 10. Urban fabric land cover composition in 2018.
Remotesensing 13 00664 g010
Figure 11. Urban fabric land cover comparison of the eastern Marmara axis for 2012 and 2018.
Remotesensing 13 00664 g011
Publisher’s Note: MDPI stays neutral with regard to jurisdictional claims in published maps and institutional affiliations.

