
Comparison of the Hydrological Dynamics of Poyang Lake in the Wet and Dry Seasons


Abstract
:1. Introduction
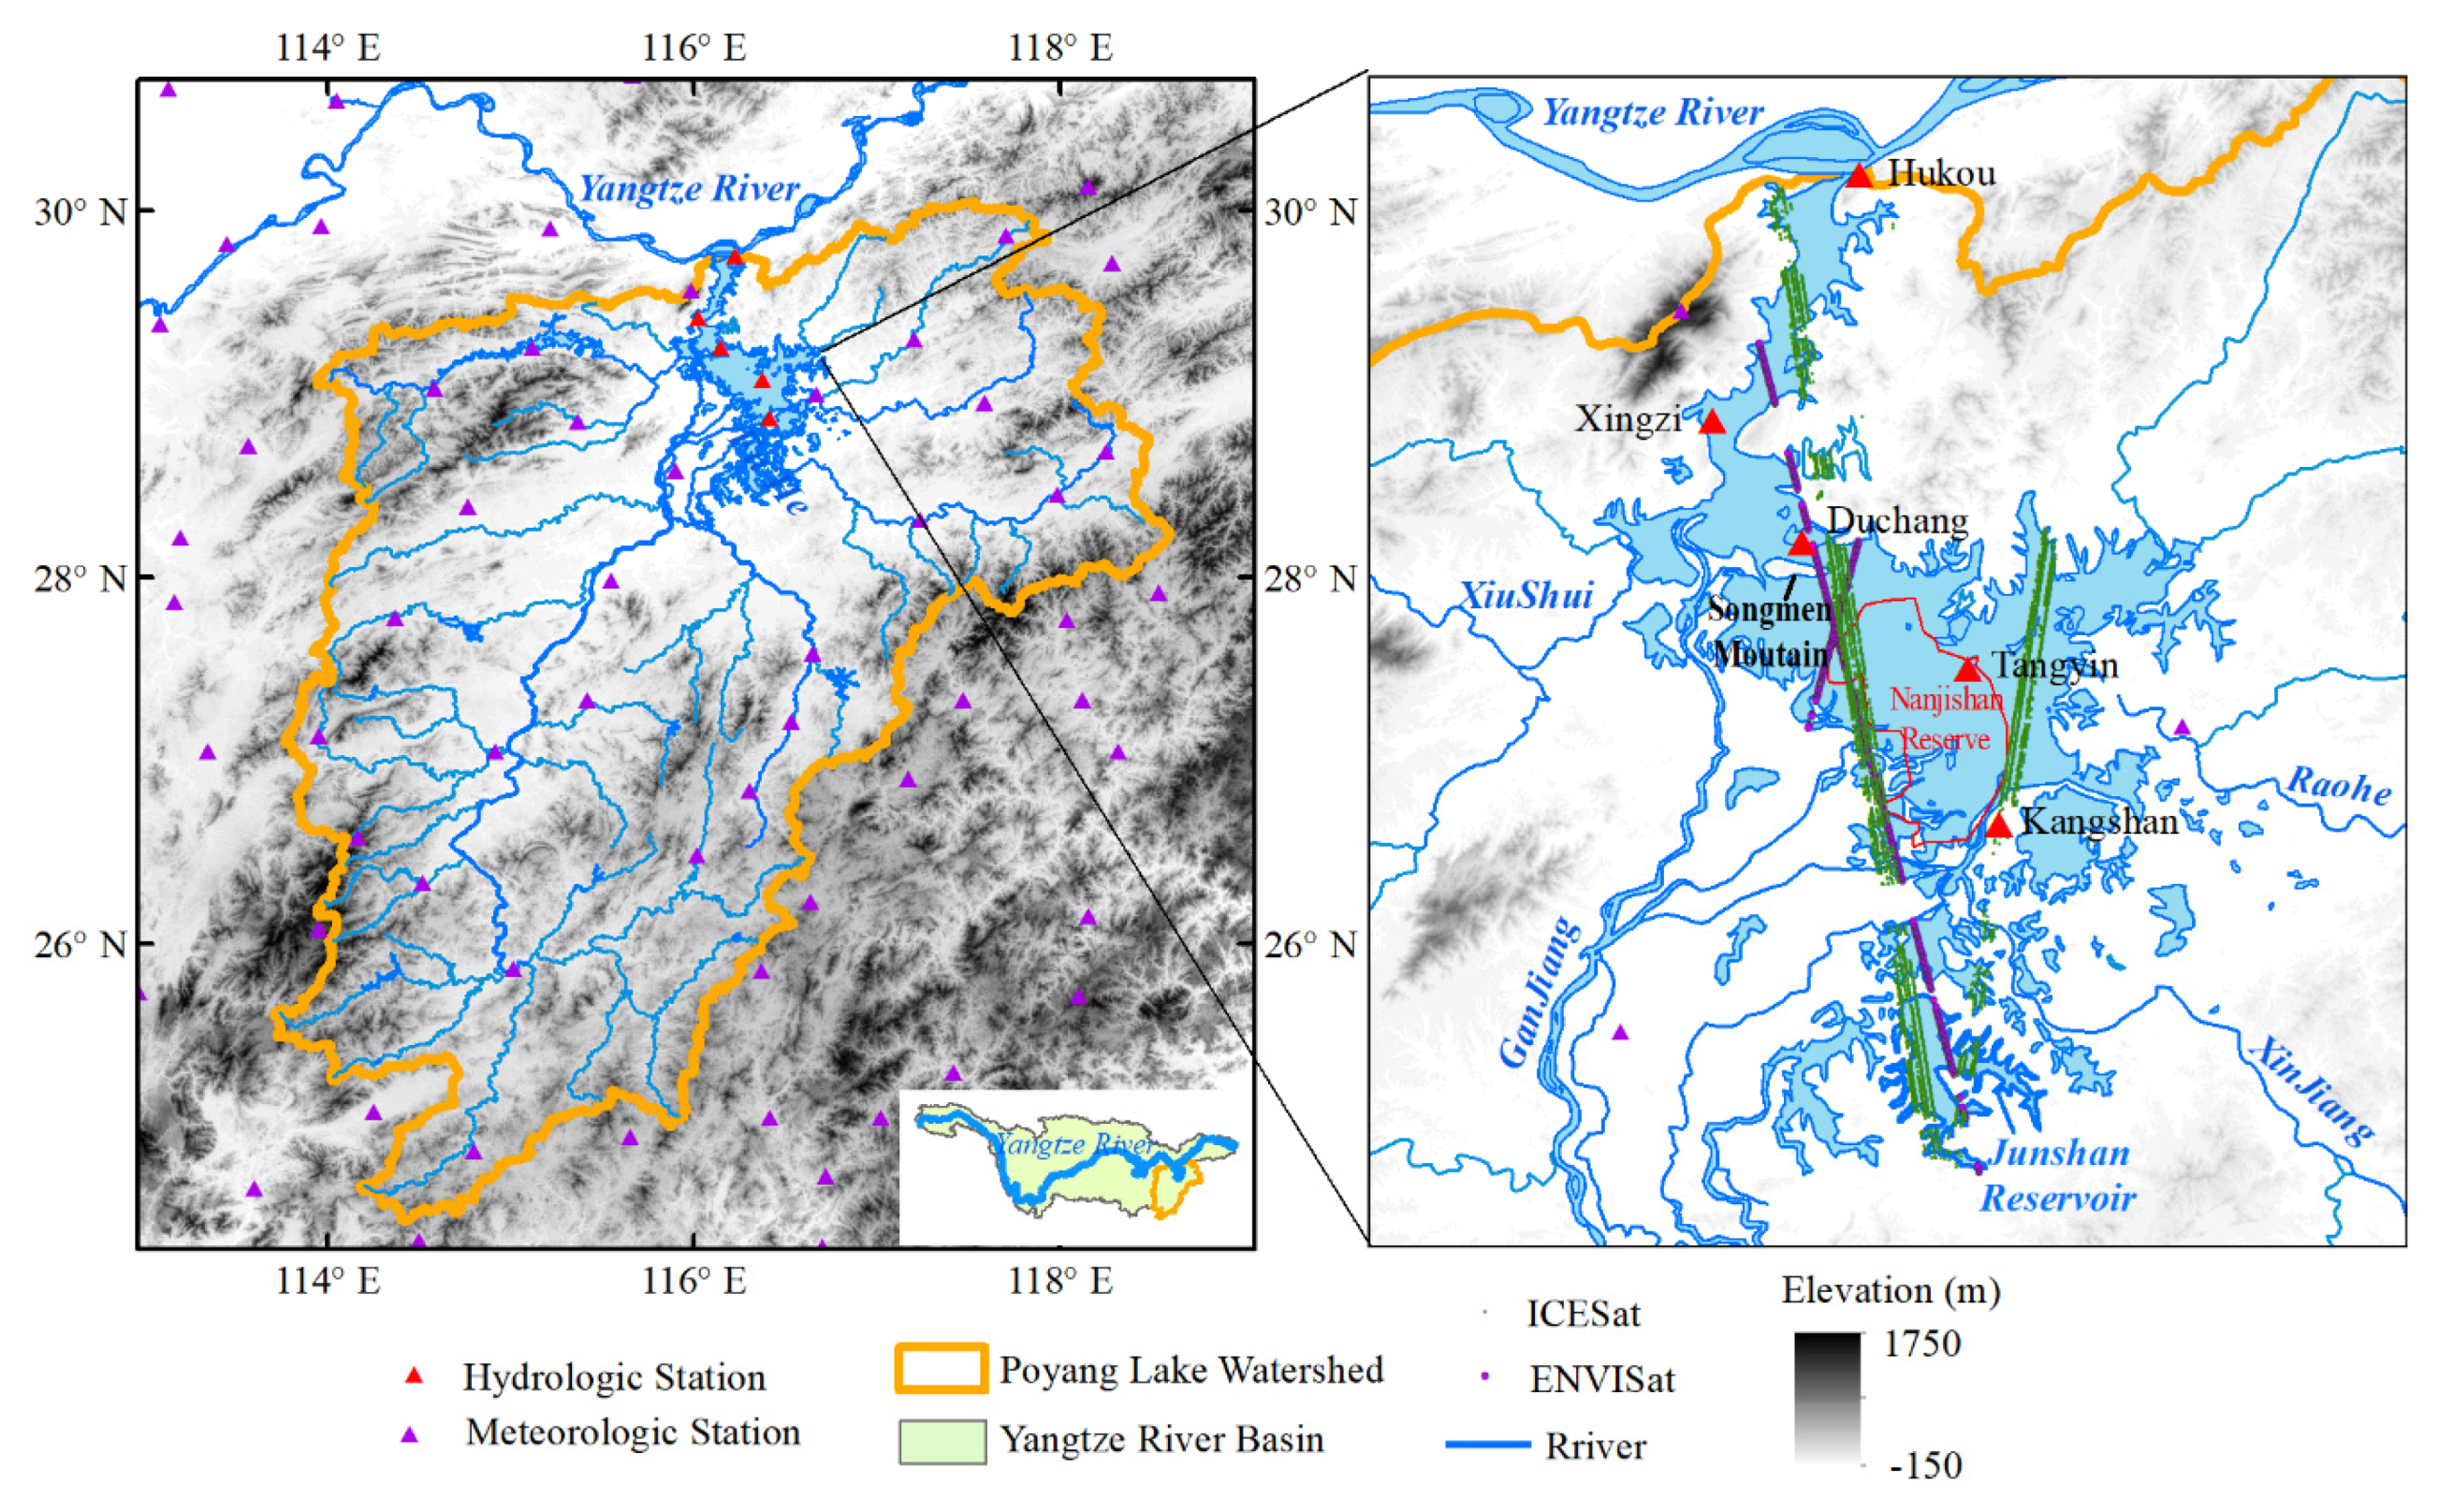
2. Study Area
3. Data and Methods
3.1. Data
3.1.1. Hydrological Data
3.1.2. DAHITI
3.1.3. MODIS Images
3.1.4. Meteorological Data
3.2. Method
3.2.1. Inundation Extraction
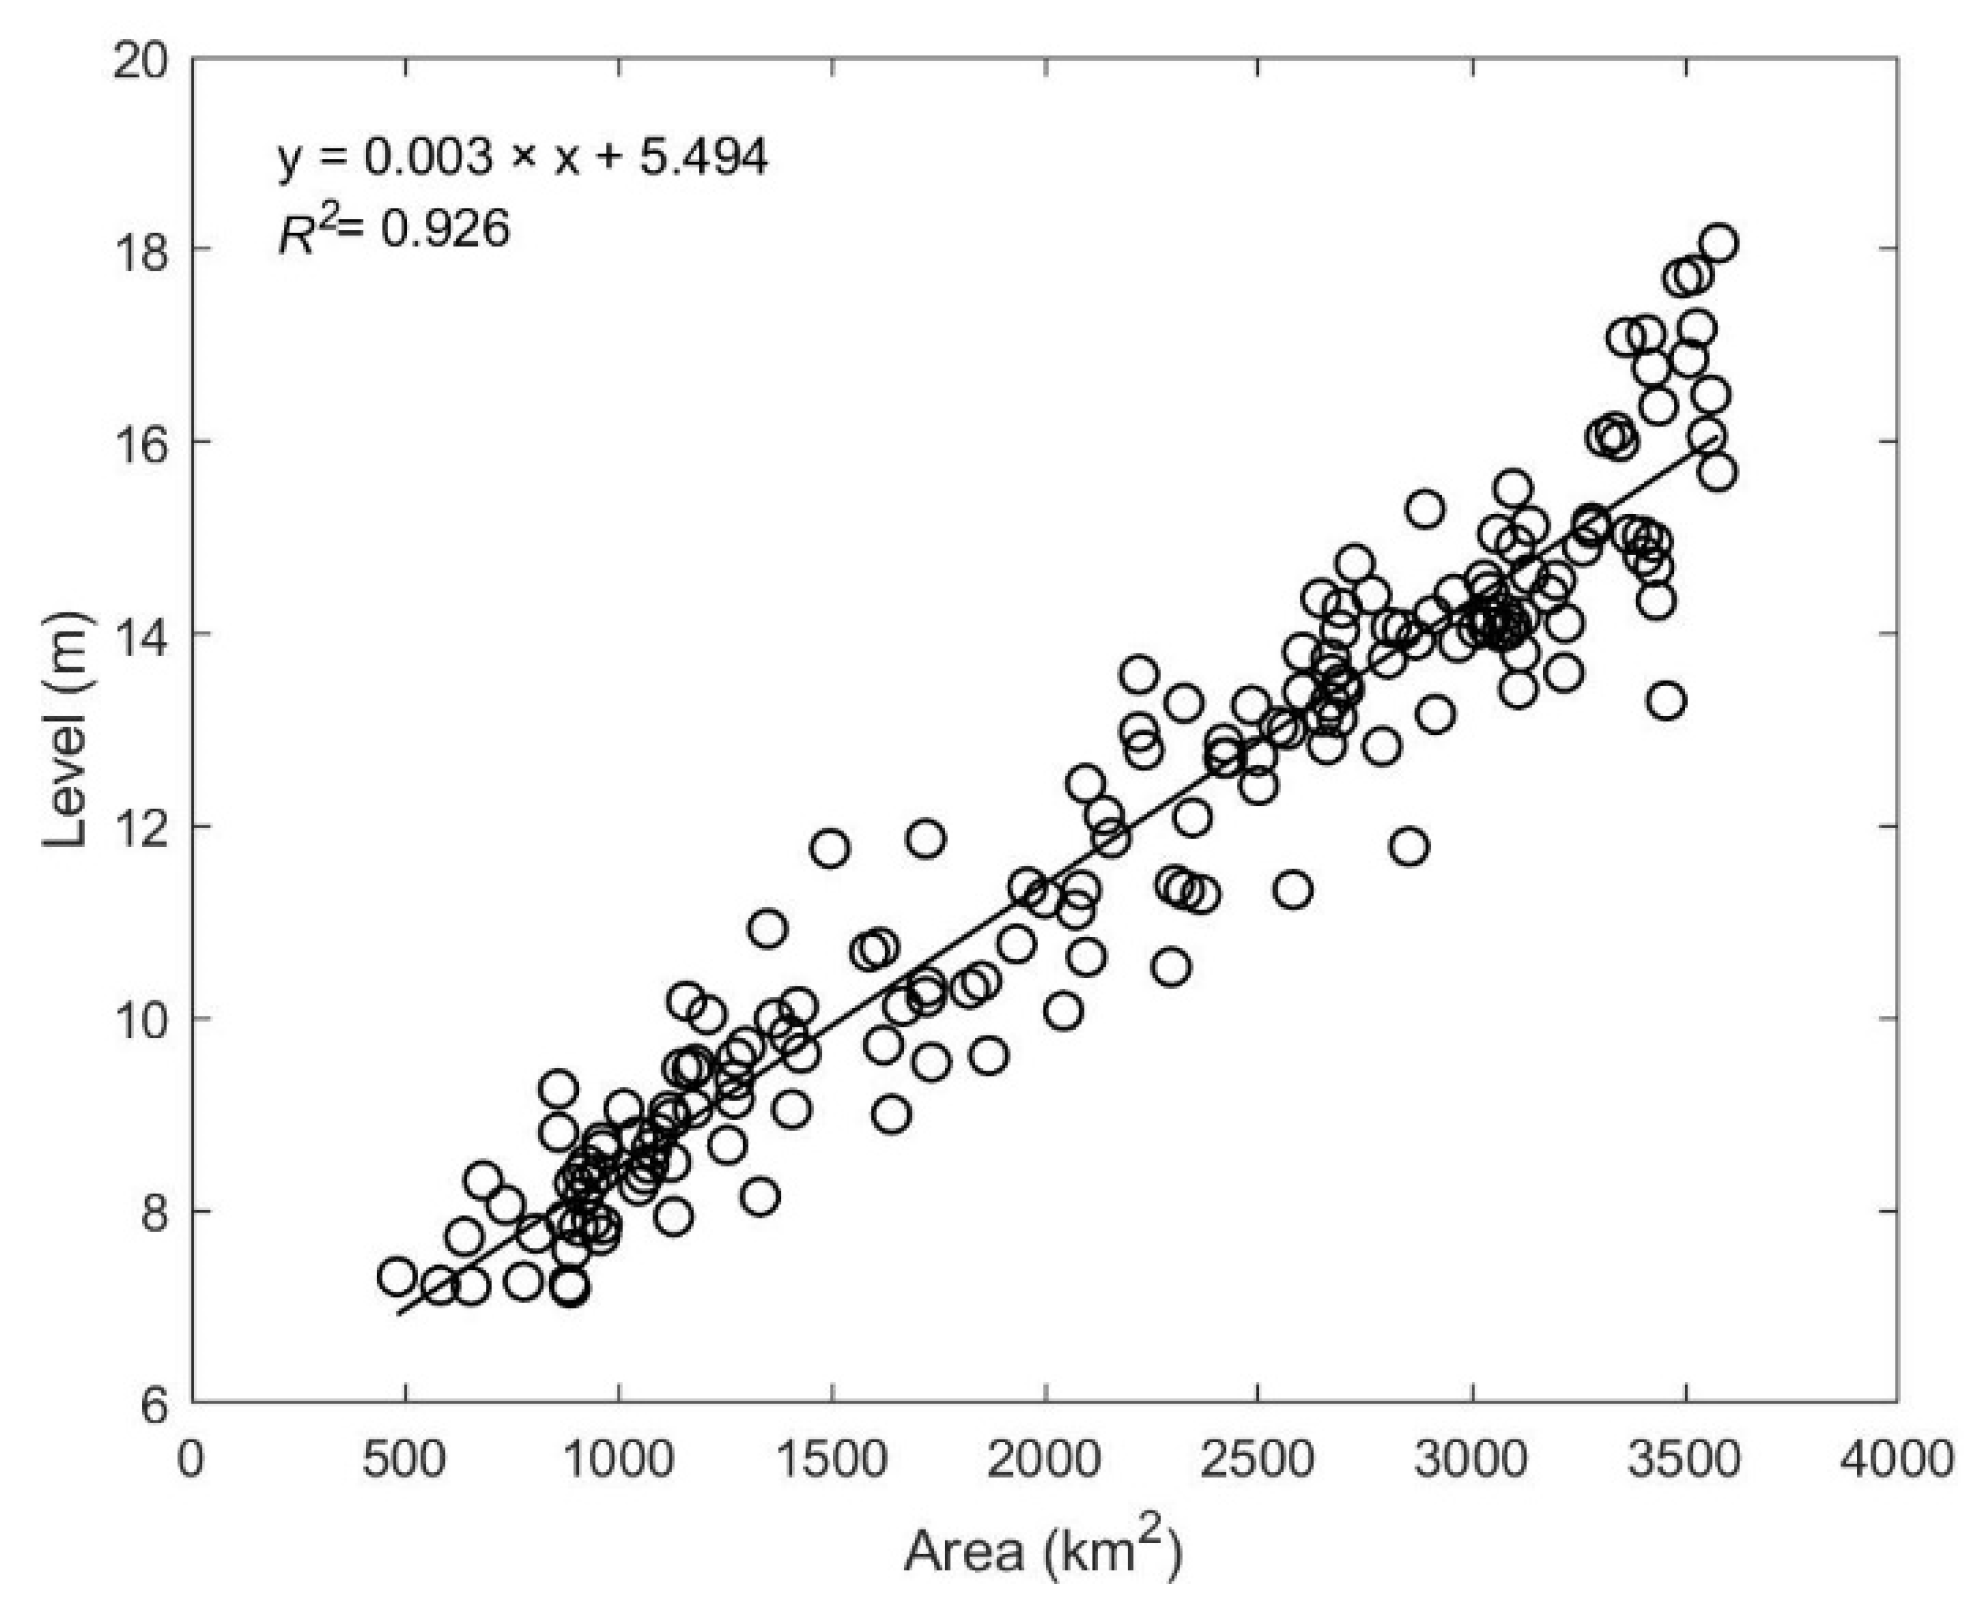
3.2.2. Water Level
3.2.3. Lake Storage Changes
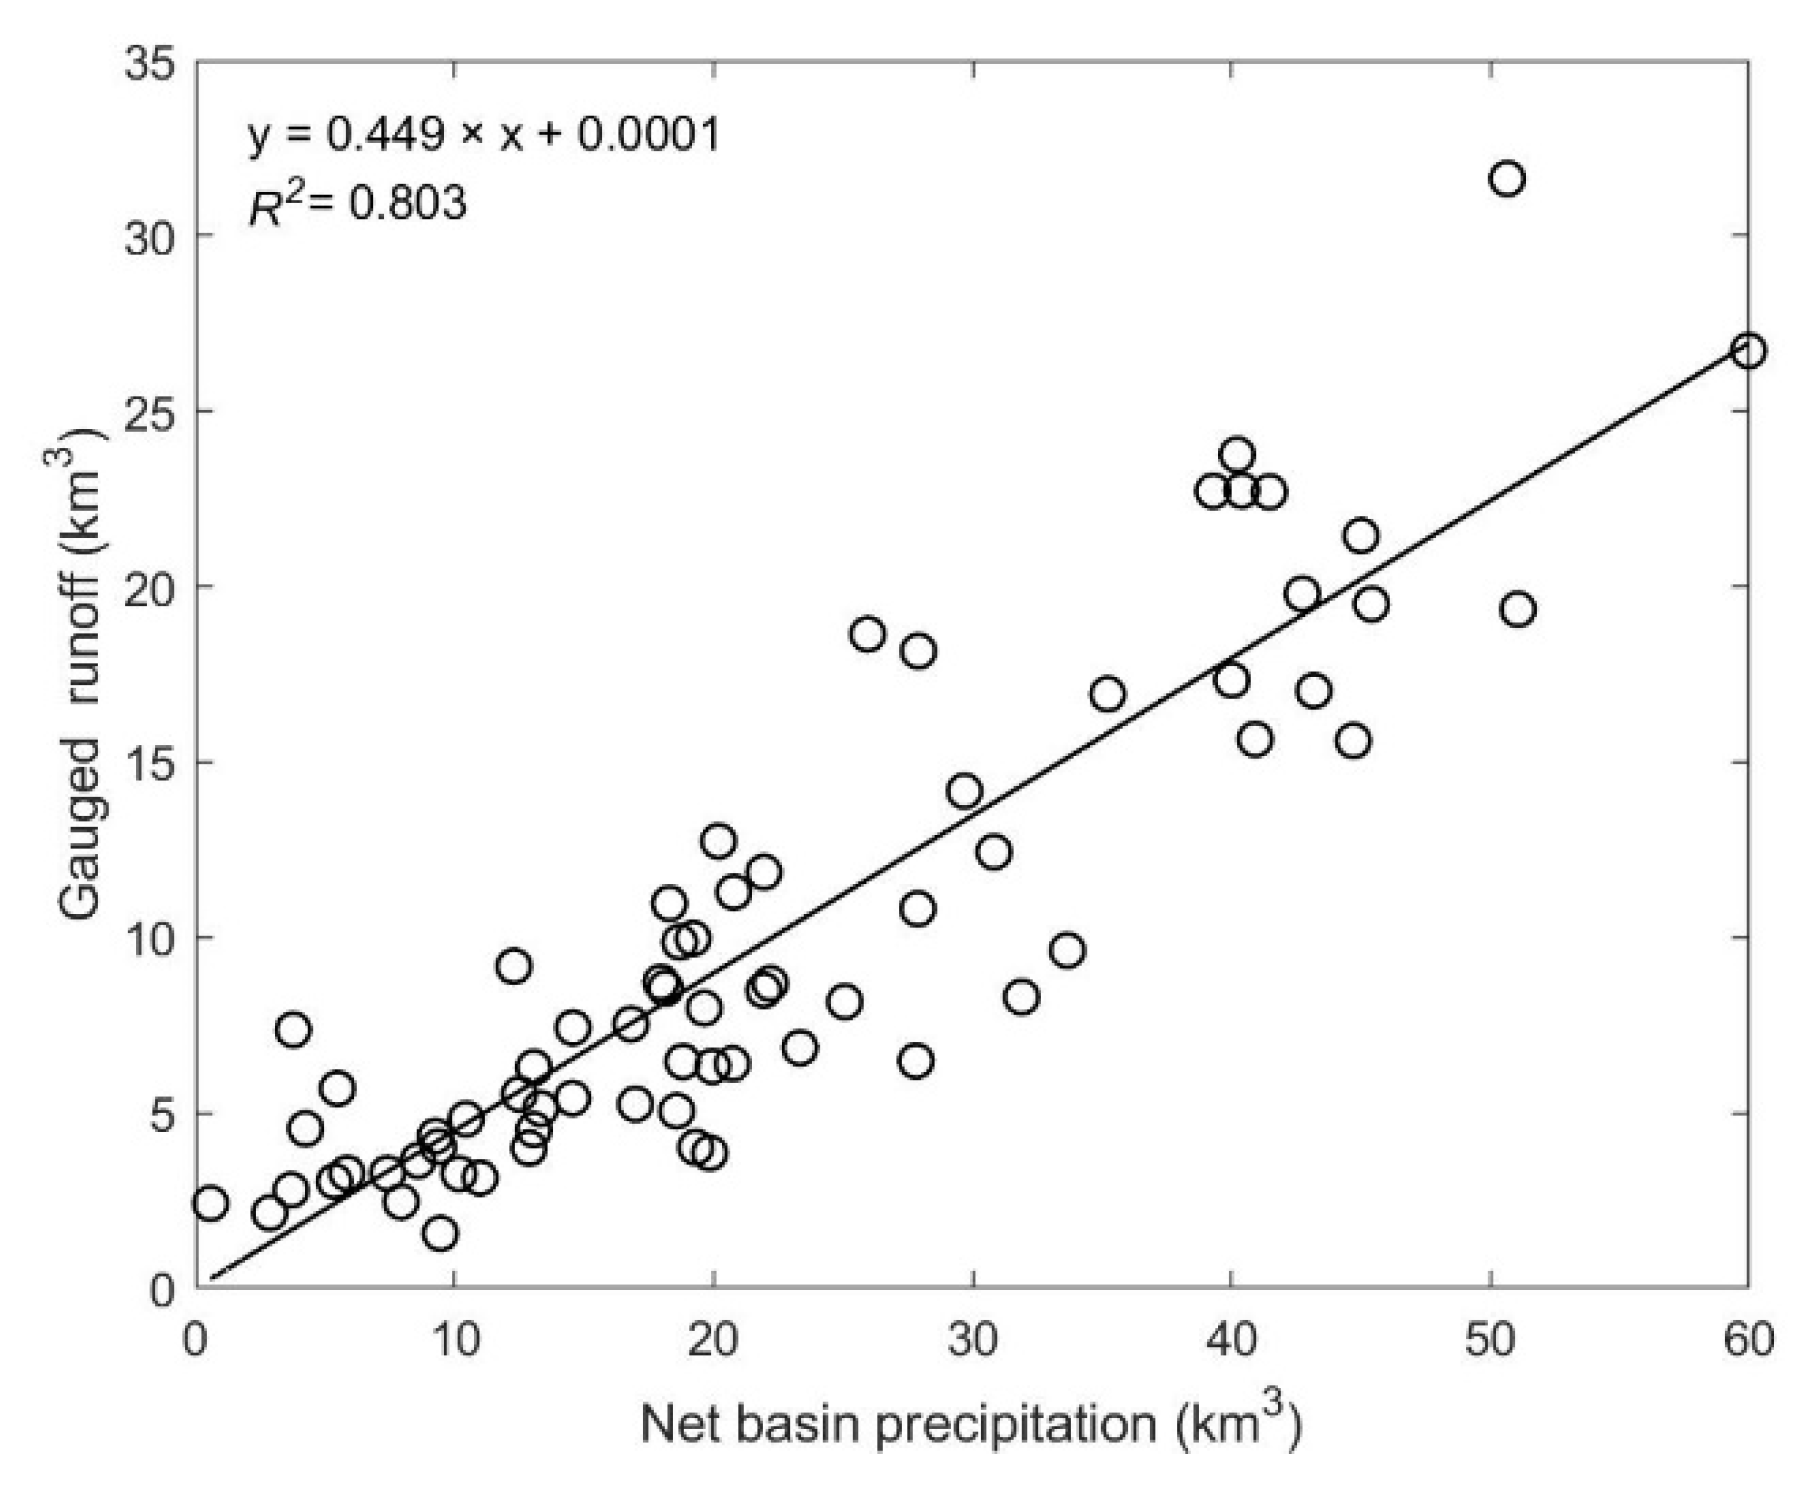
3.2.4. Water Balance of the Watershed
4. Results
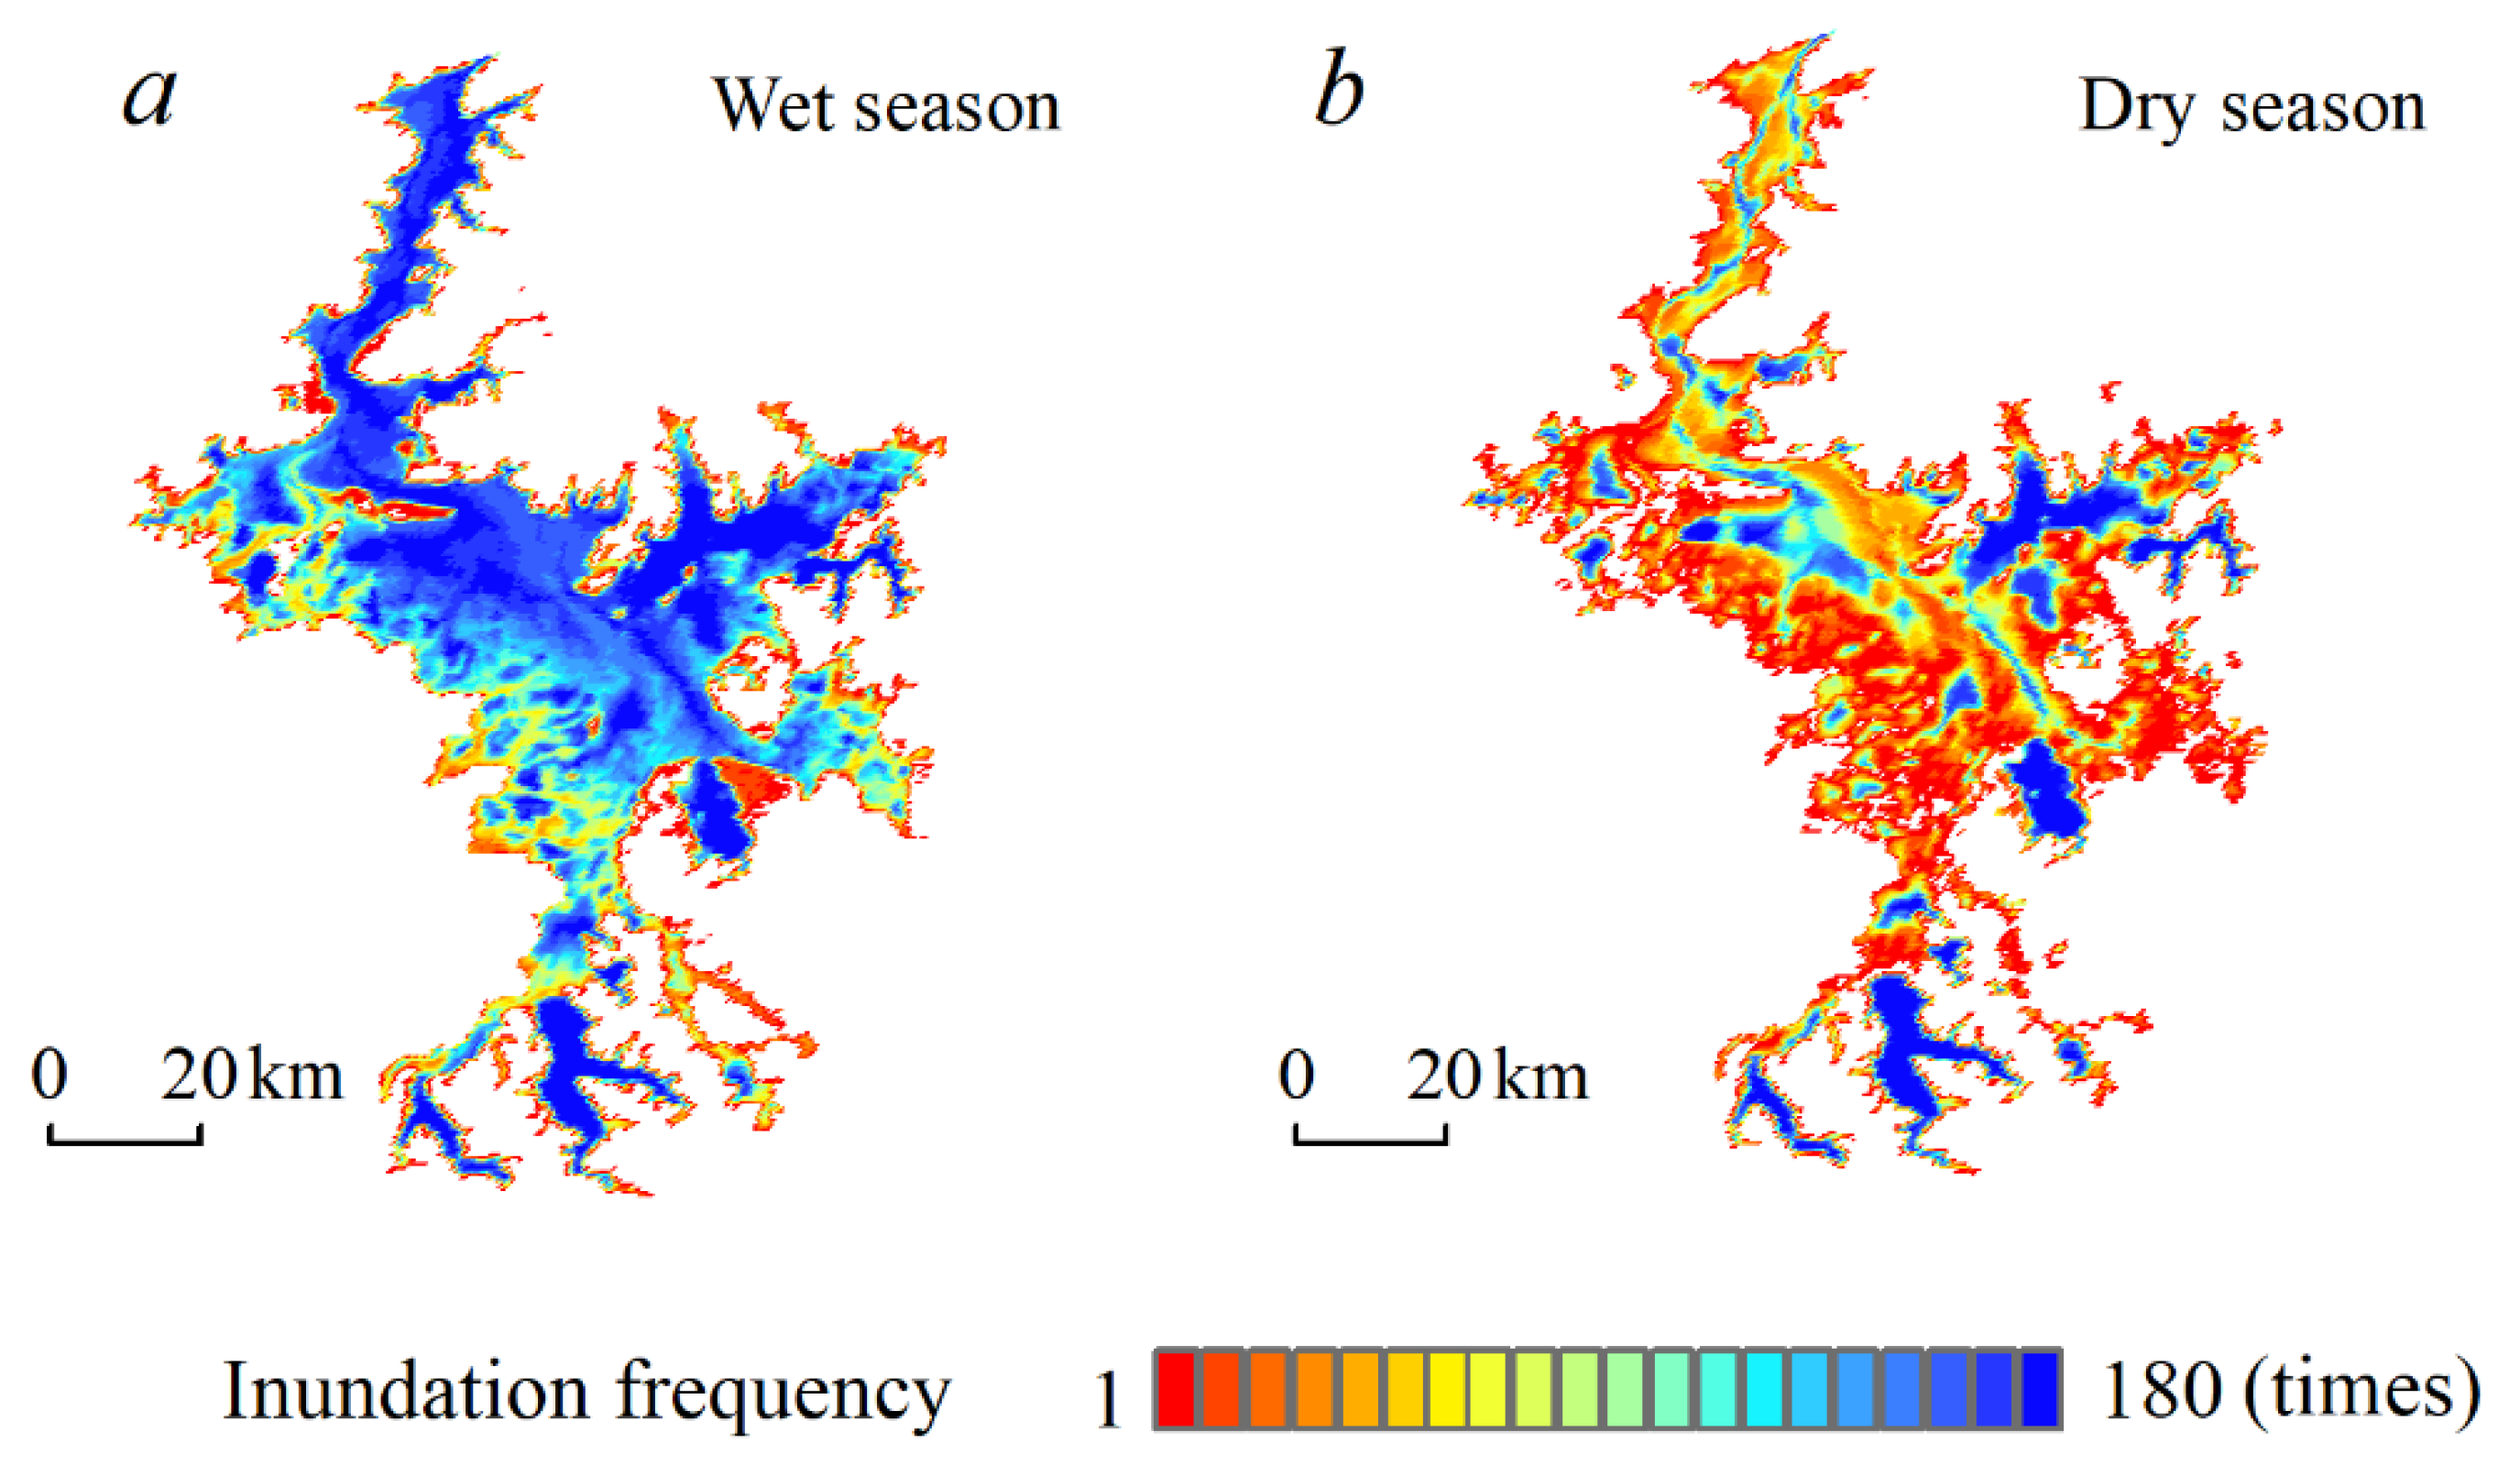
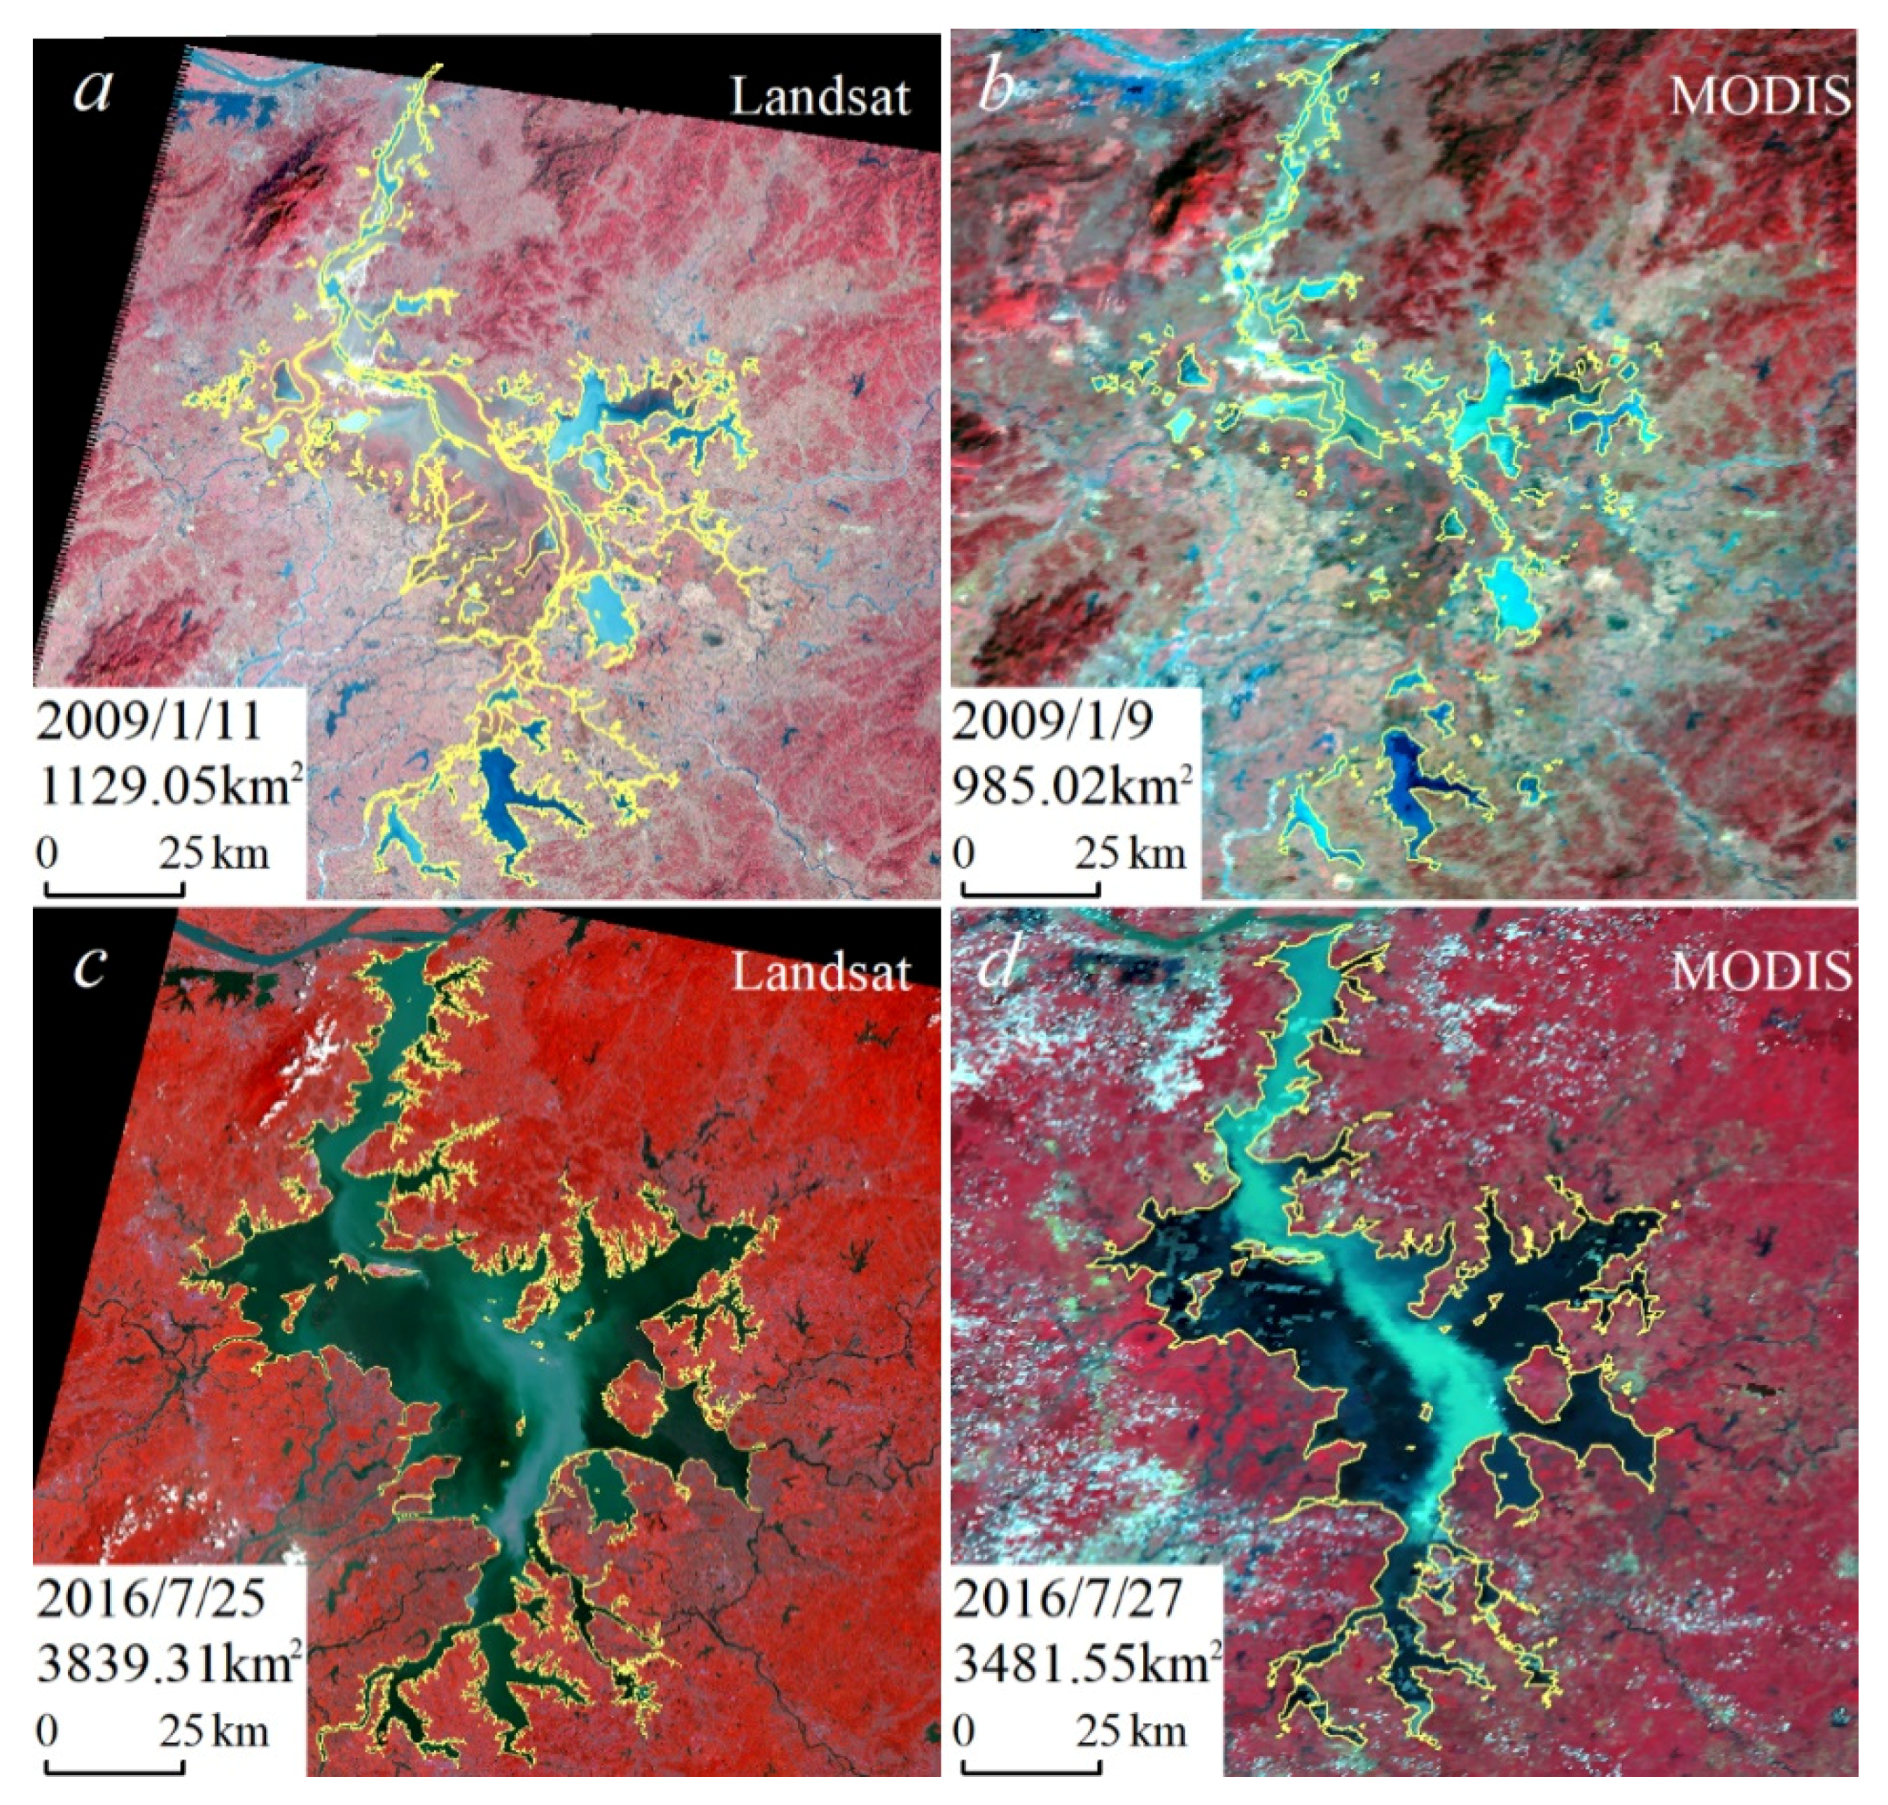
4.1. Comparison of the Water Surface in the Wet and Dry Seasons
4.2. The Inclination of the Lake Surface
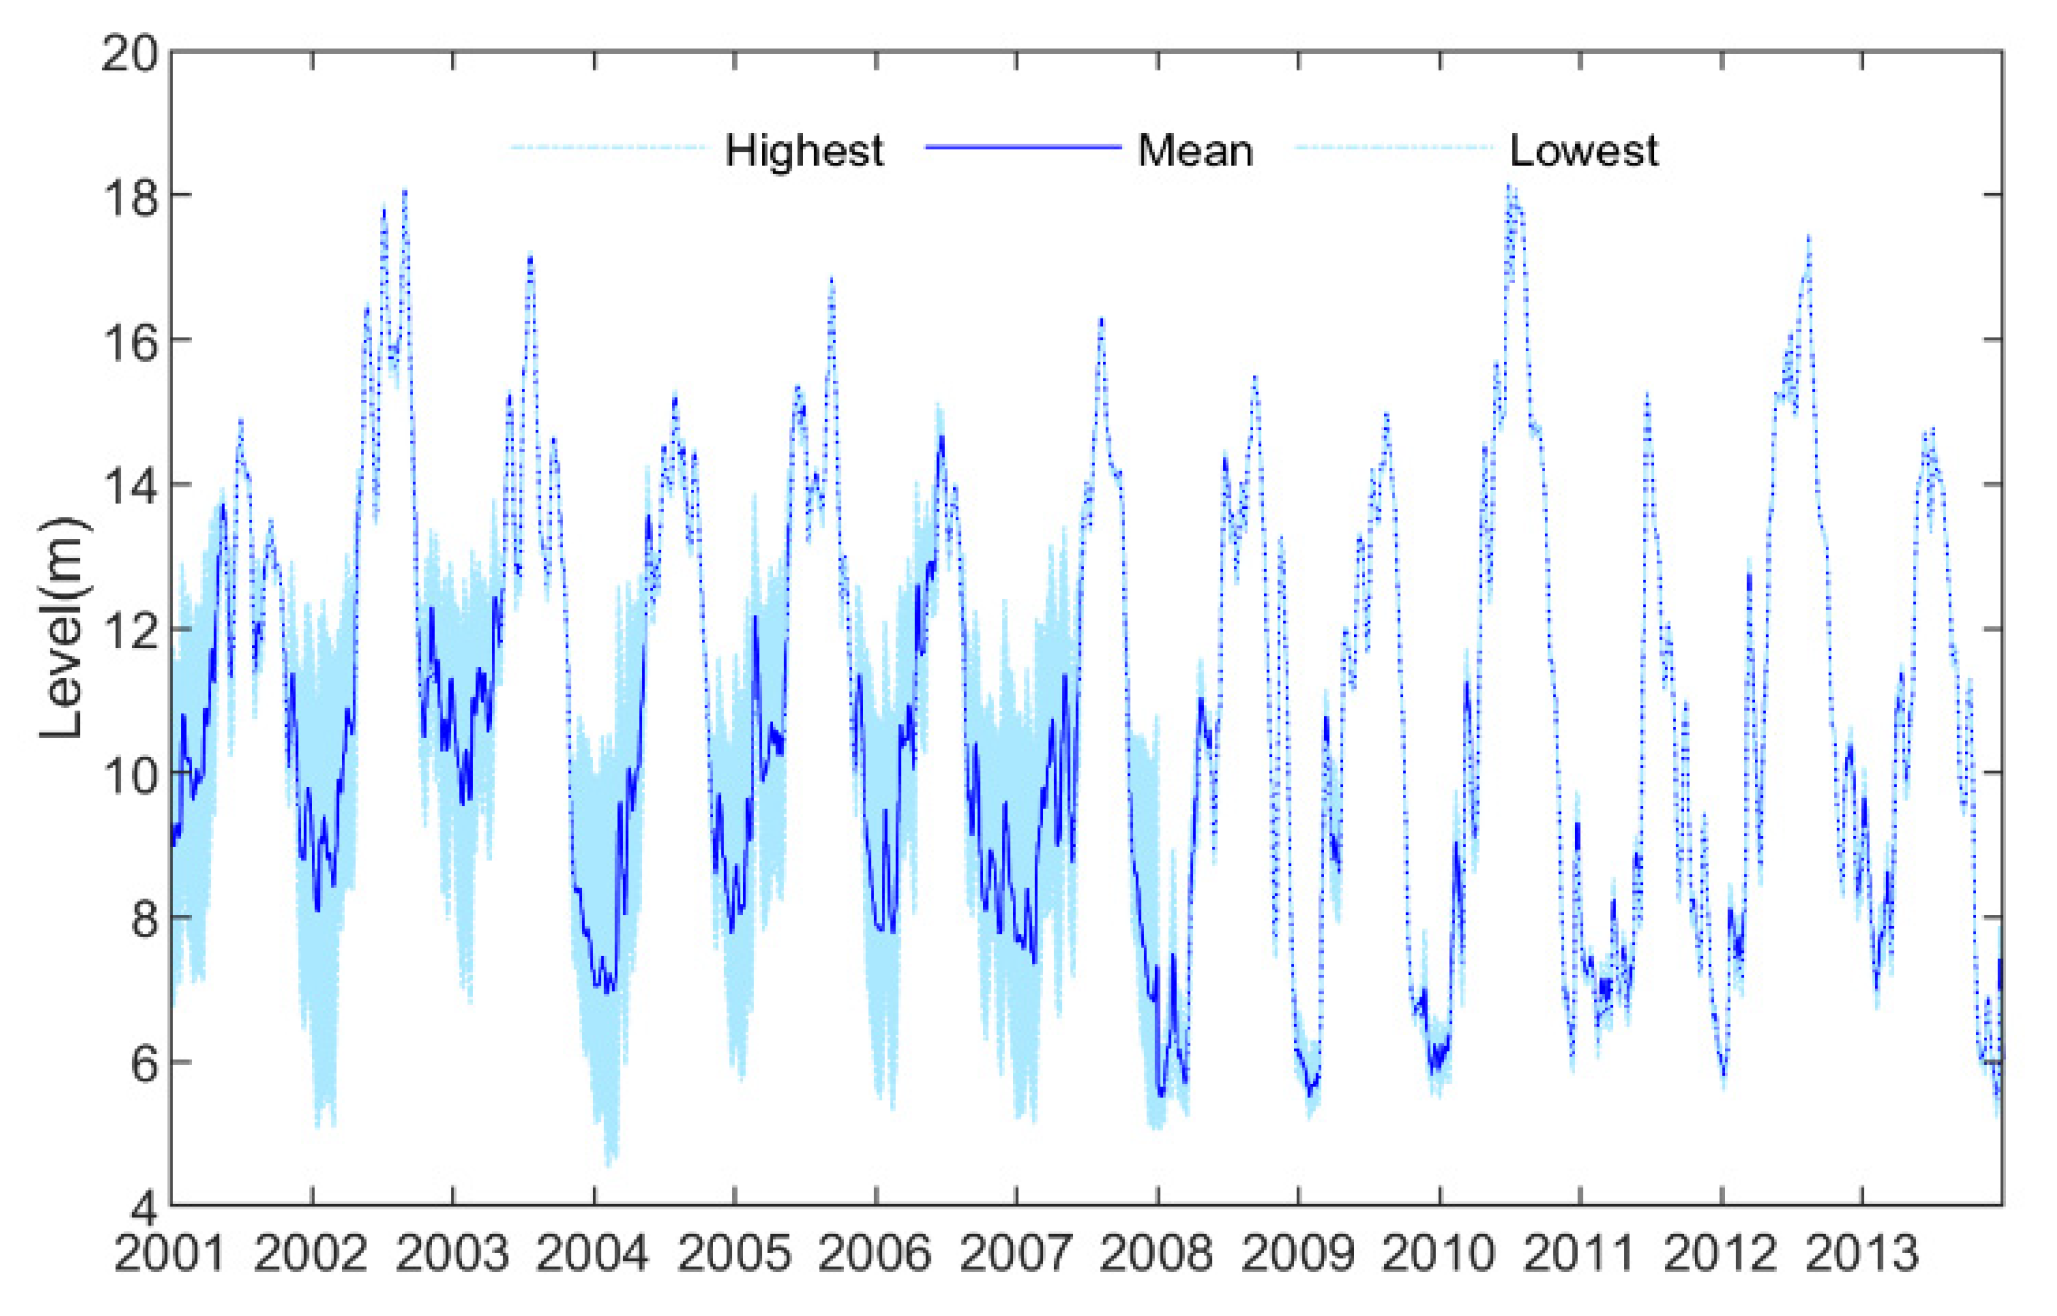
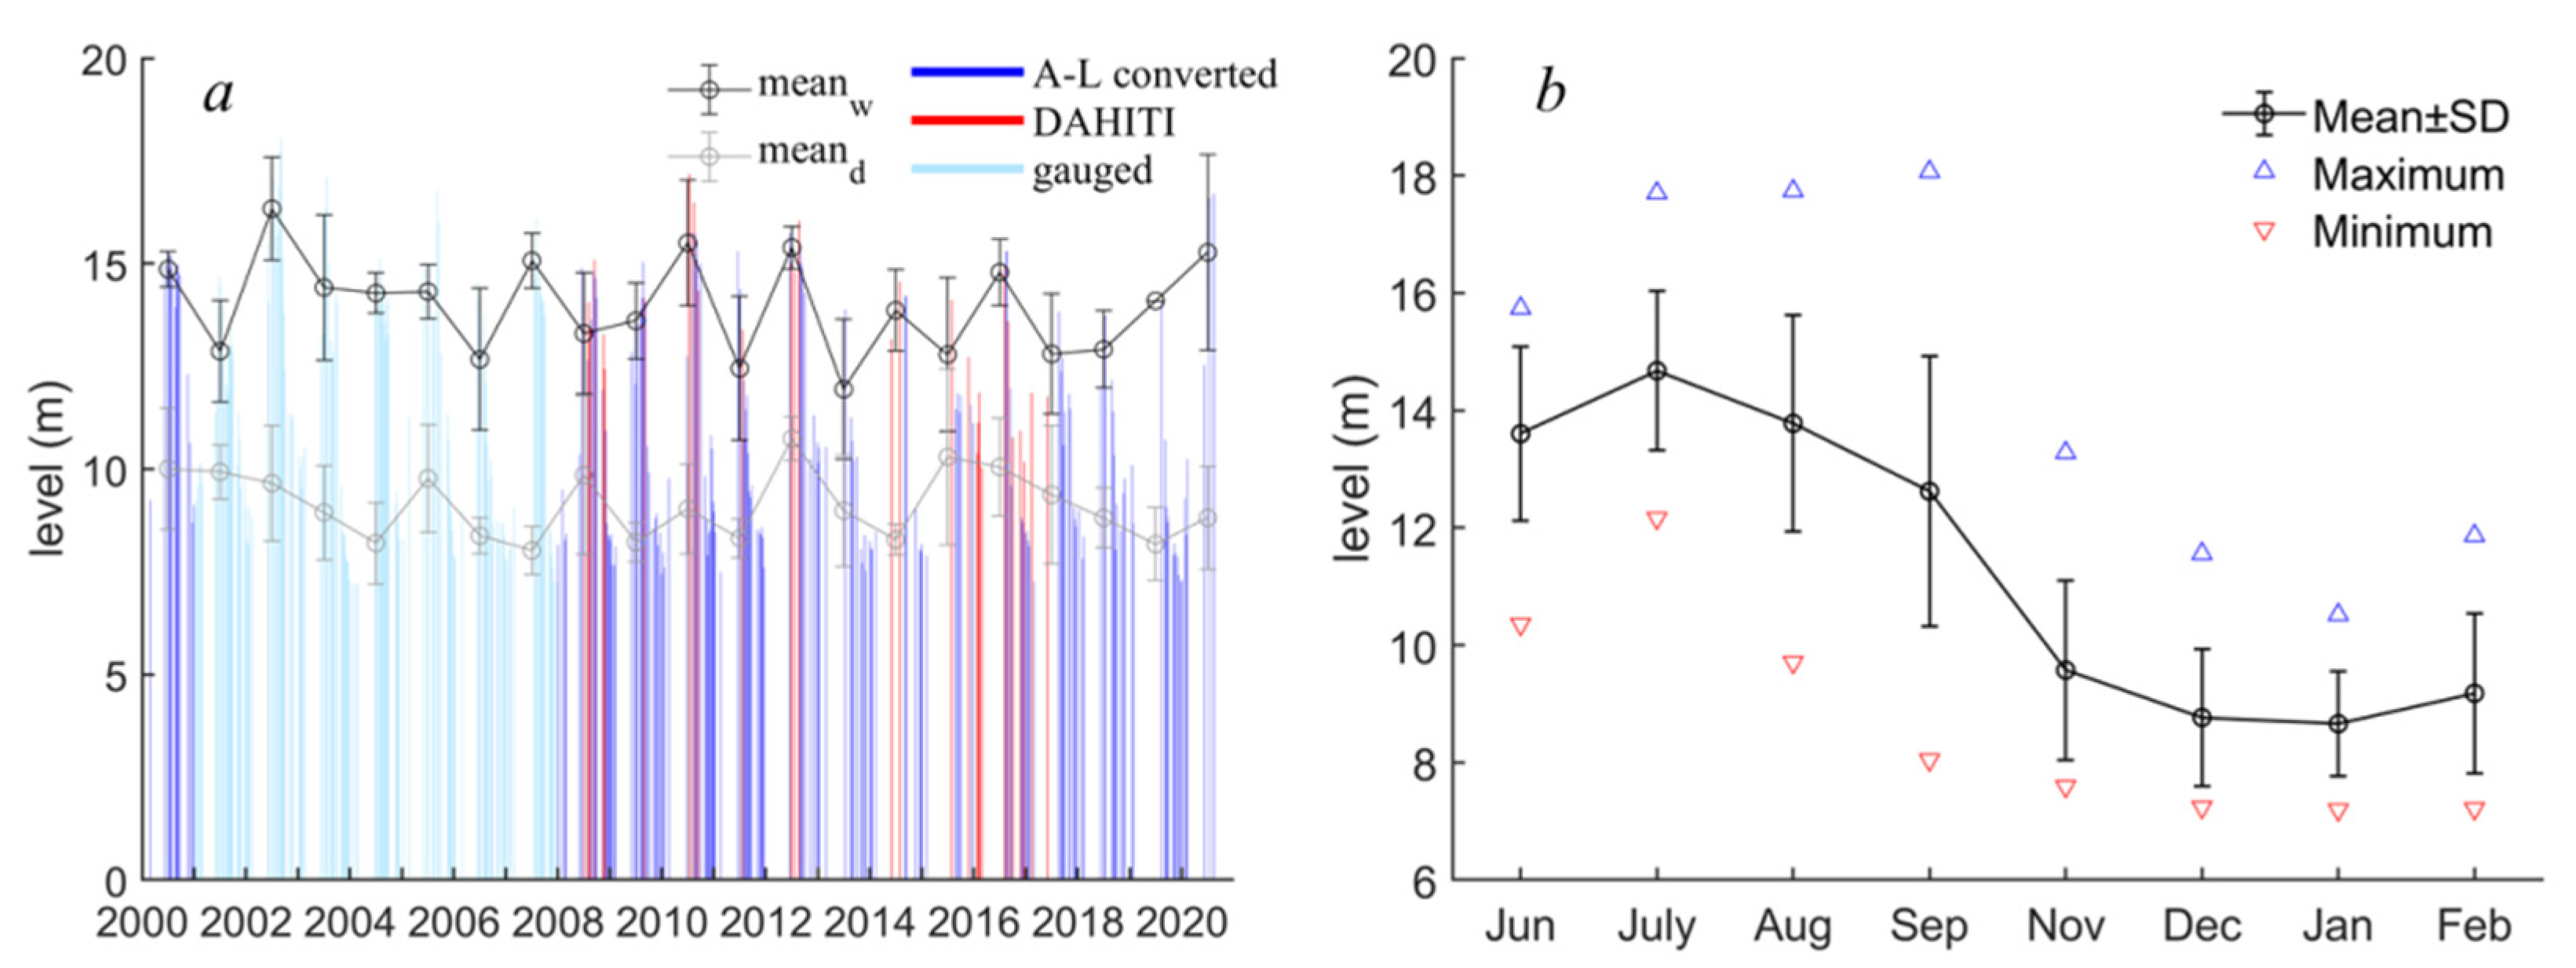
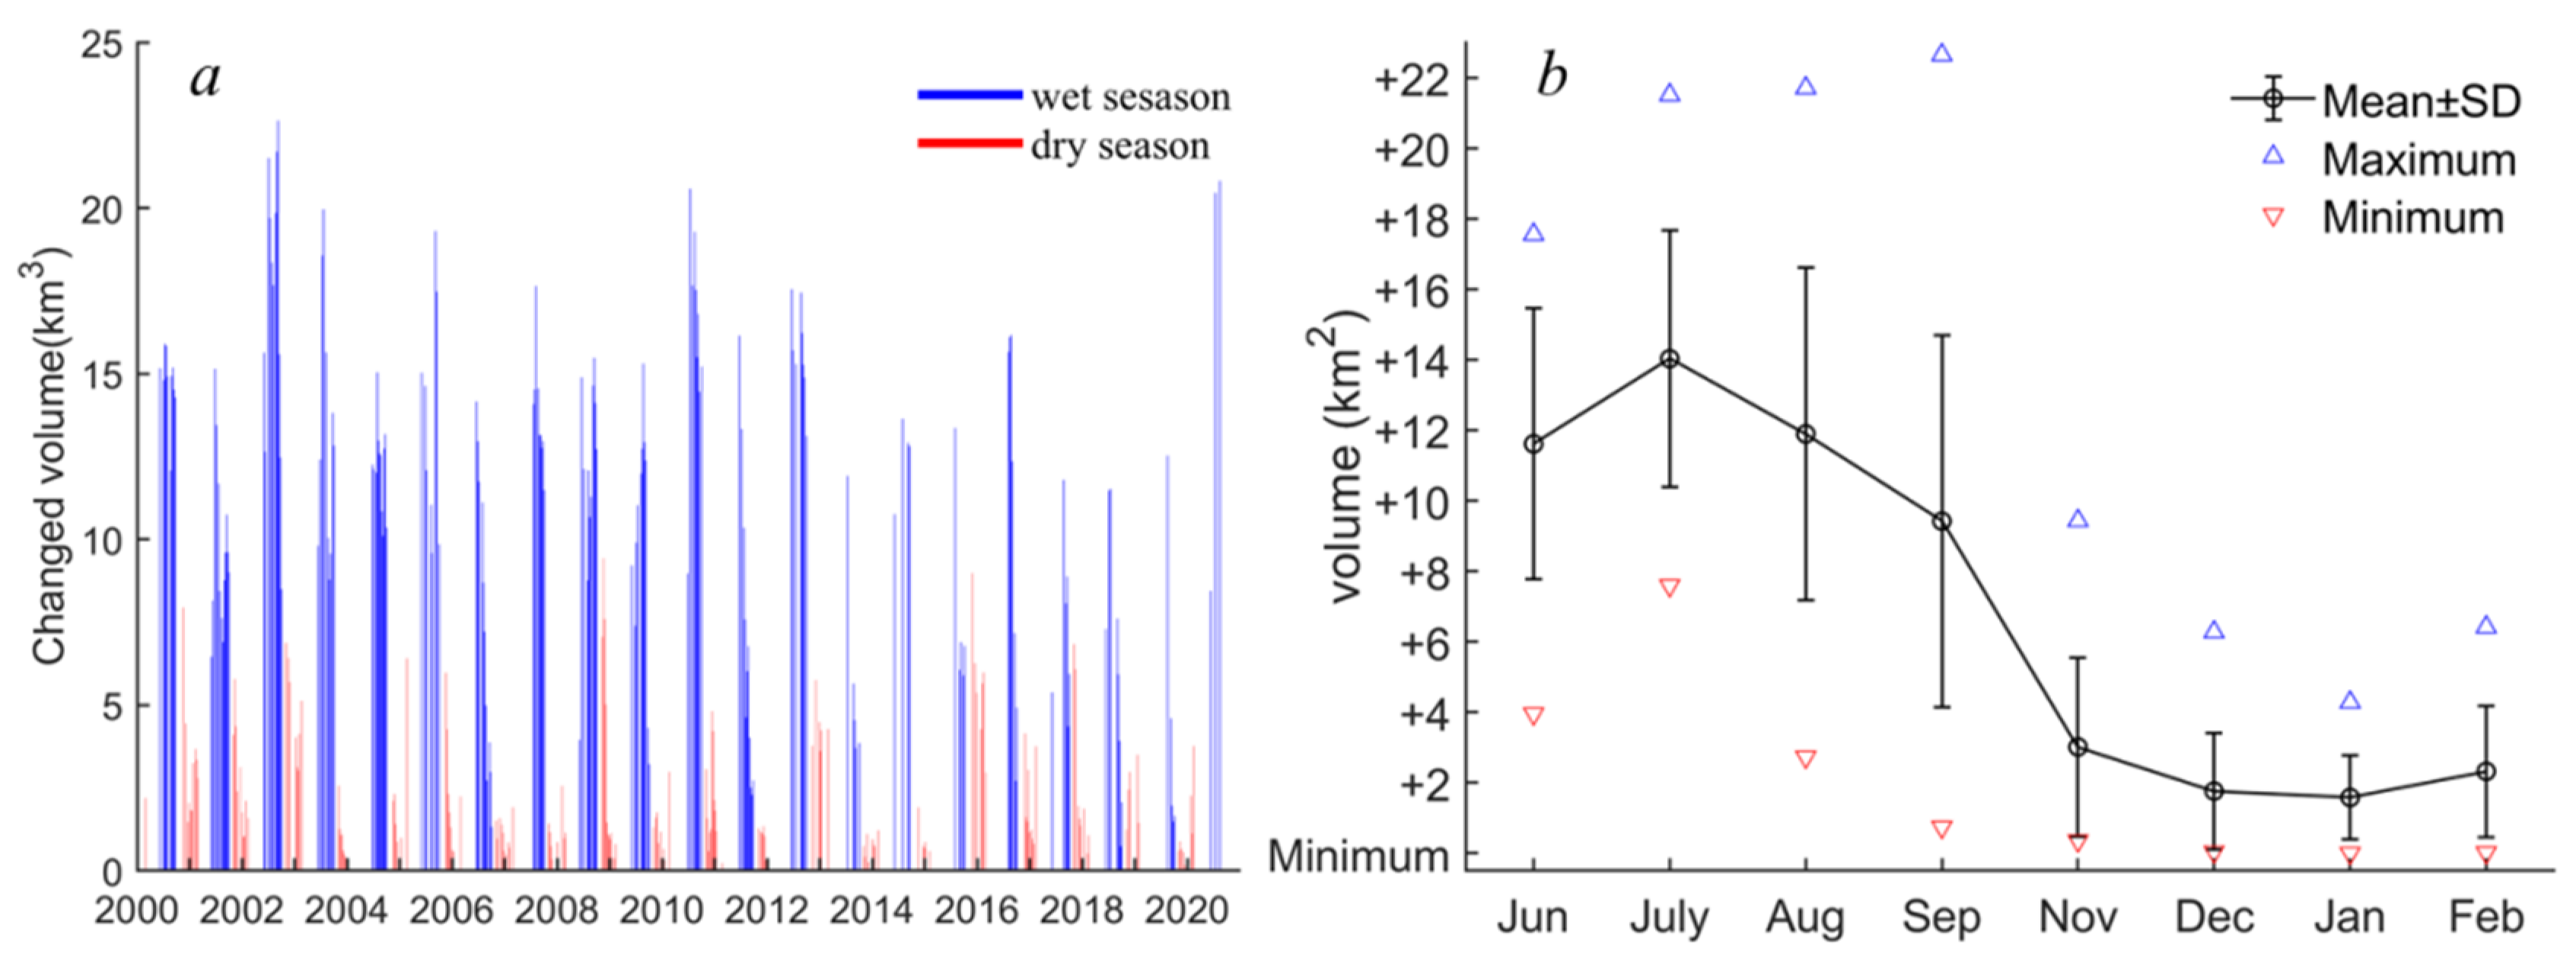
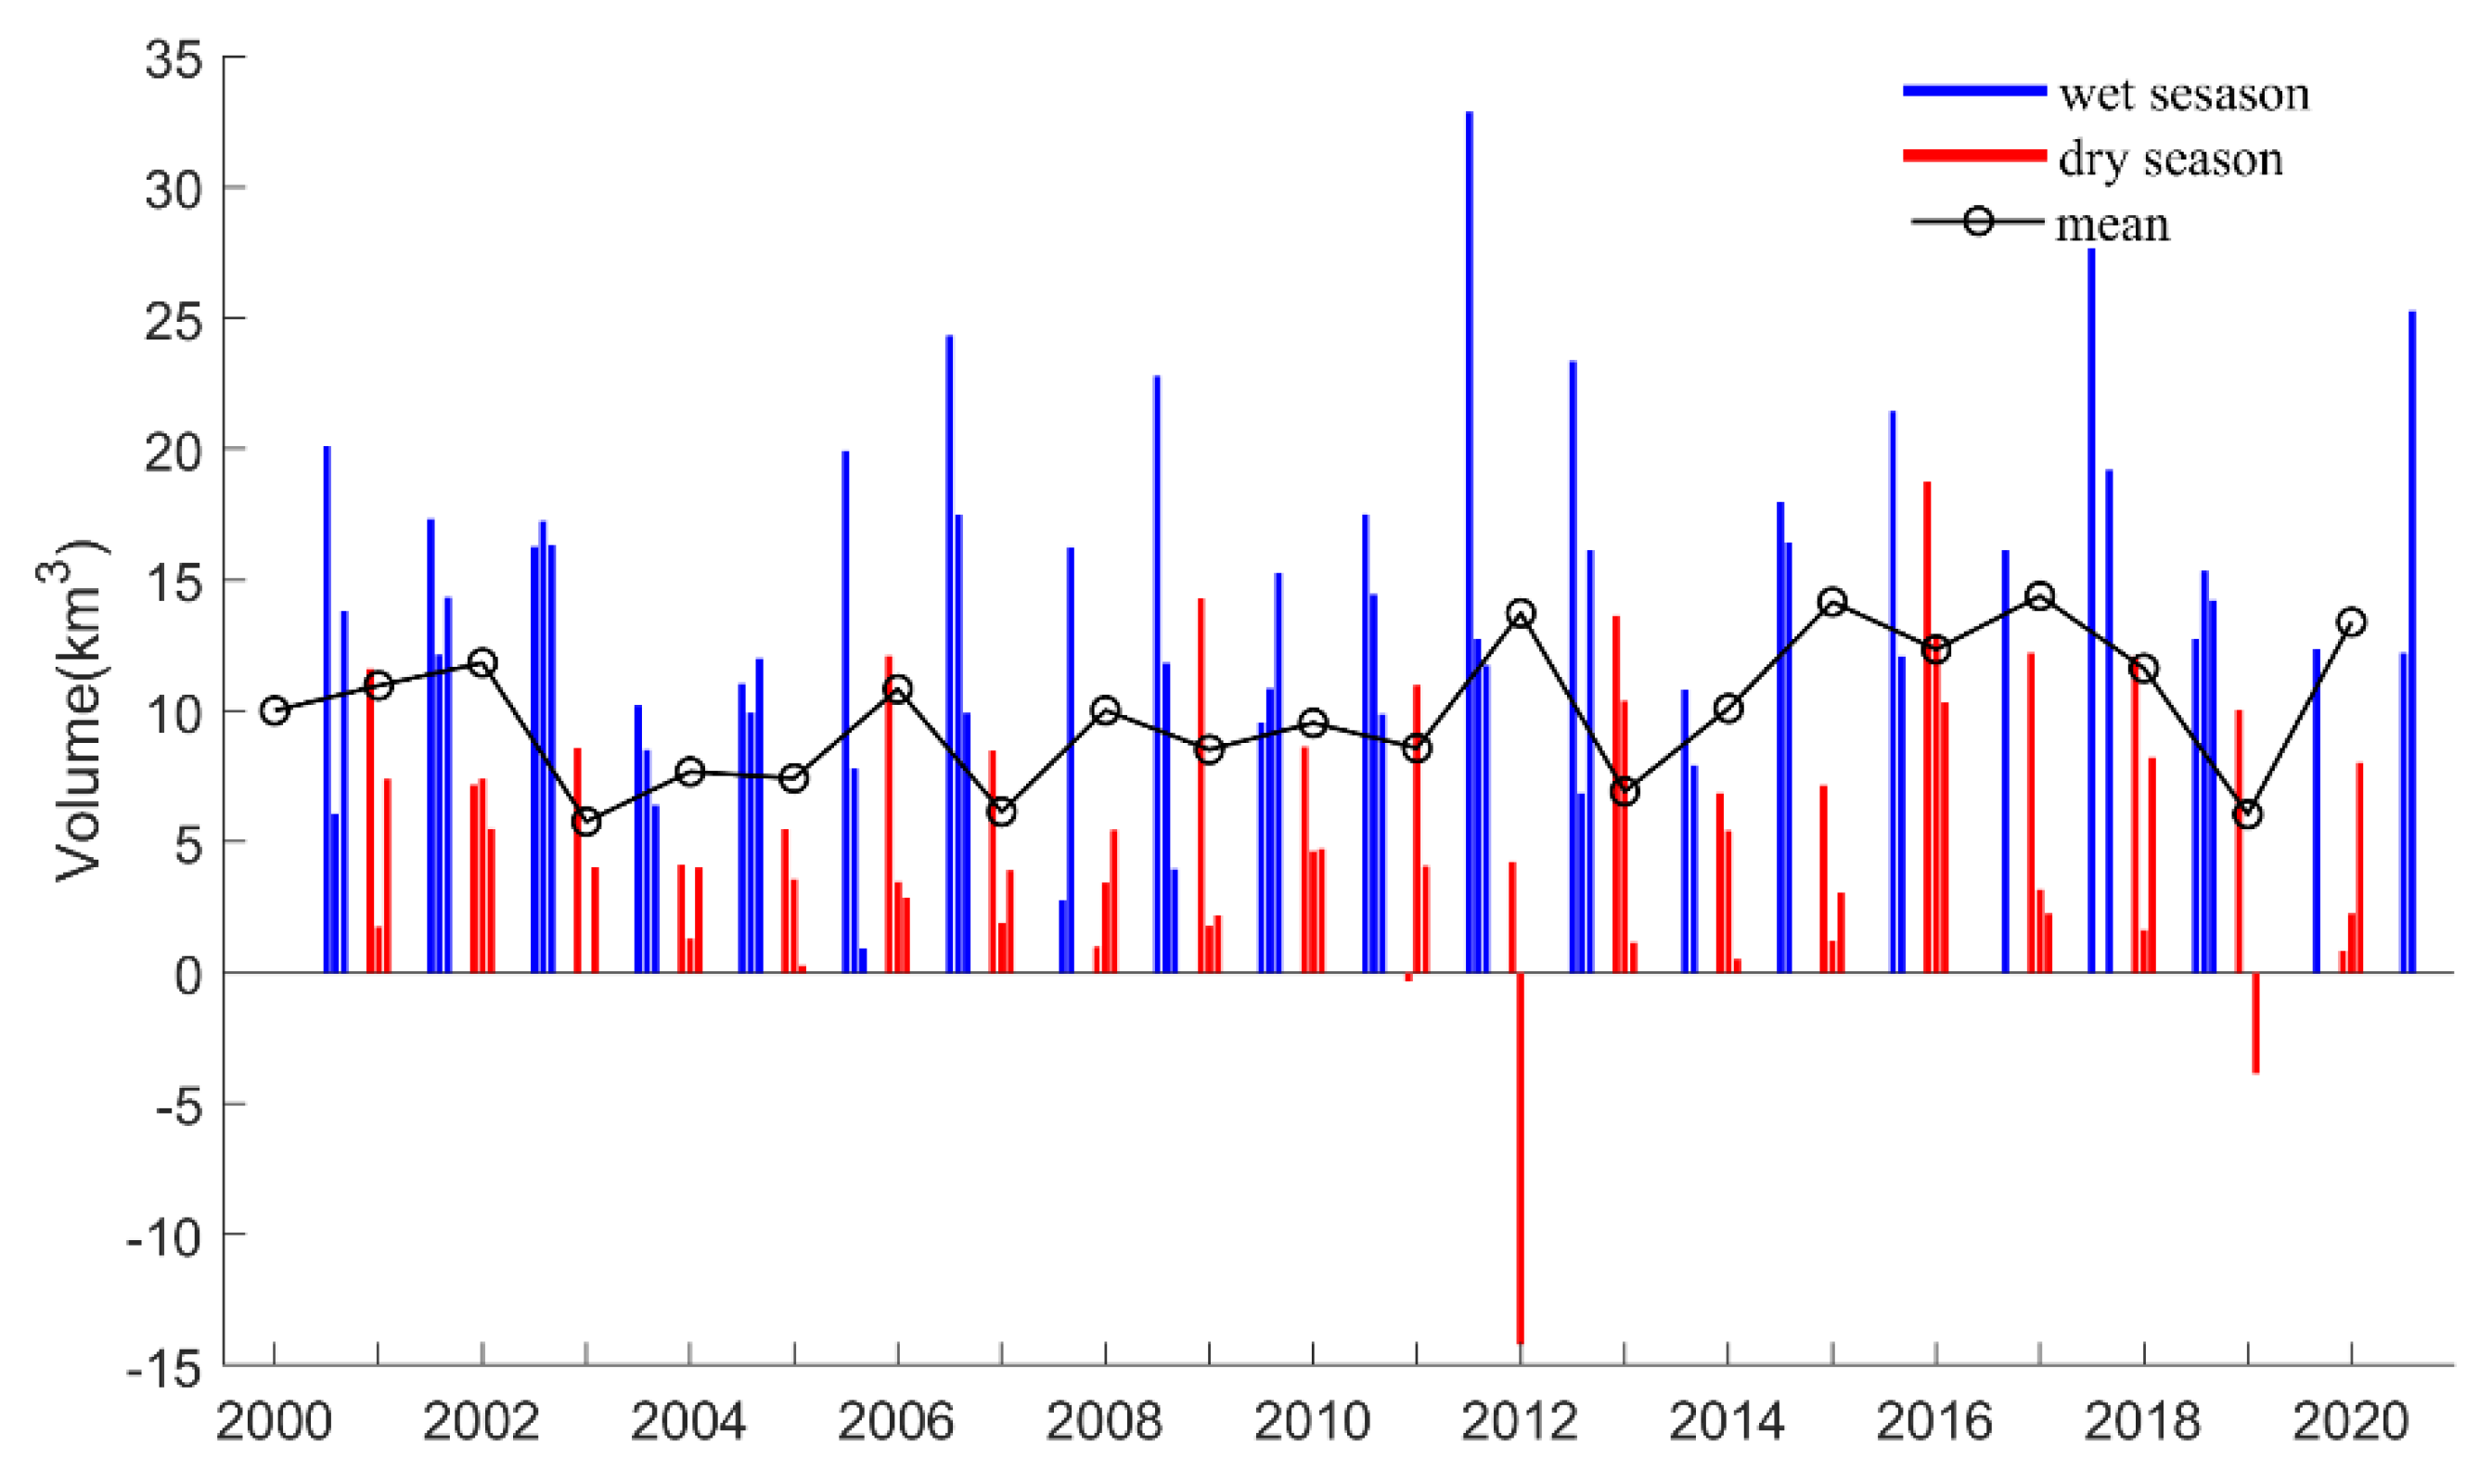
4.3. Variations of the Lake Level and Volume
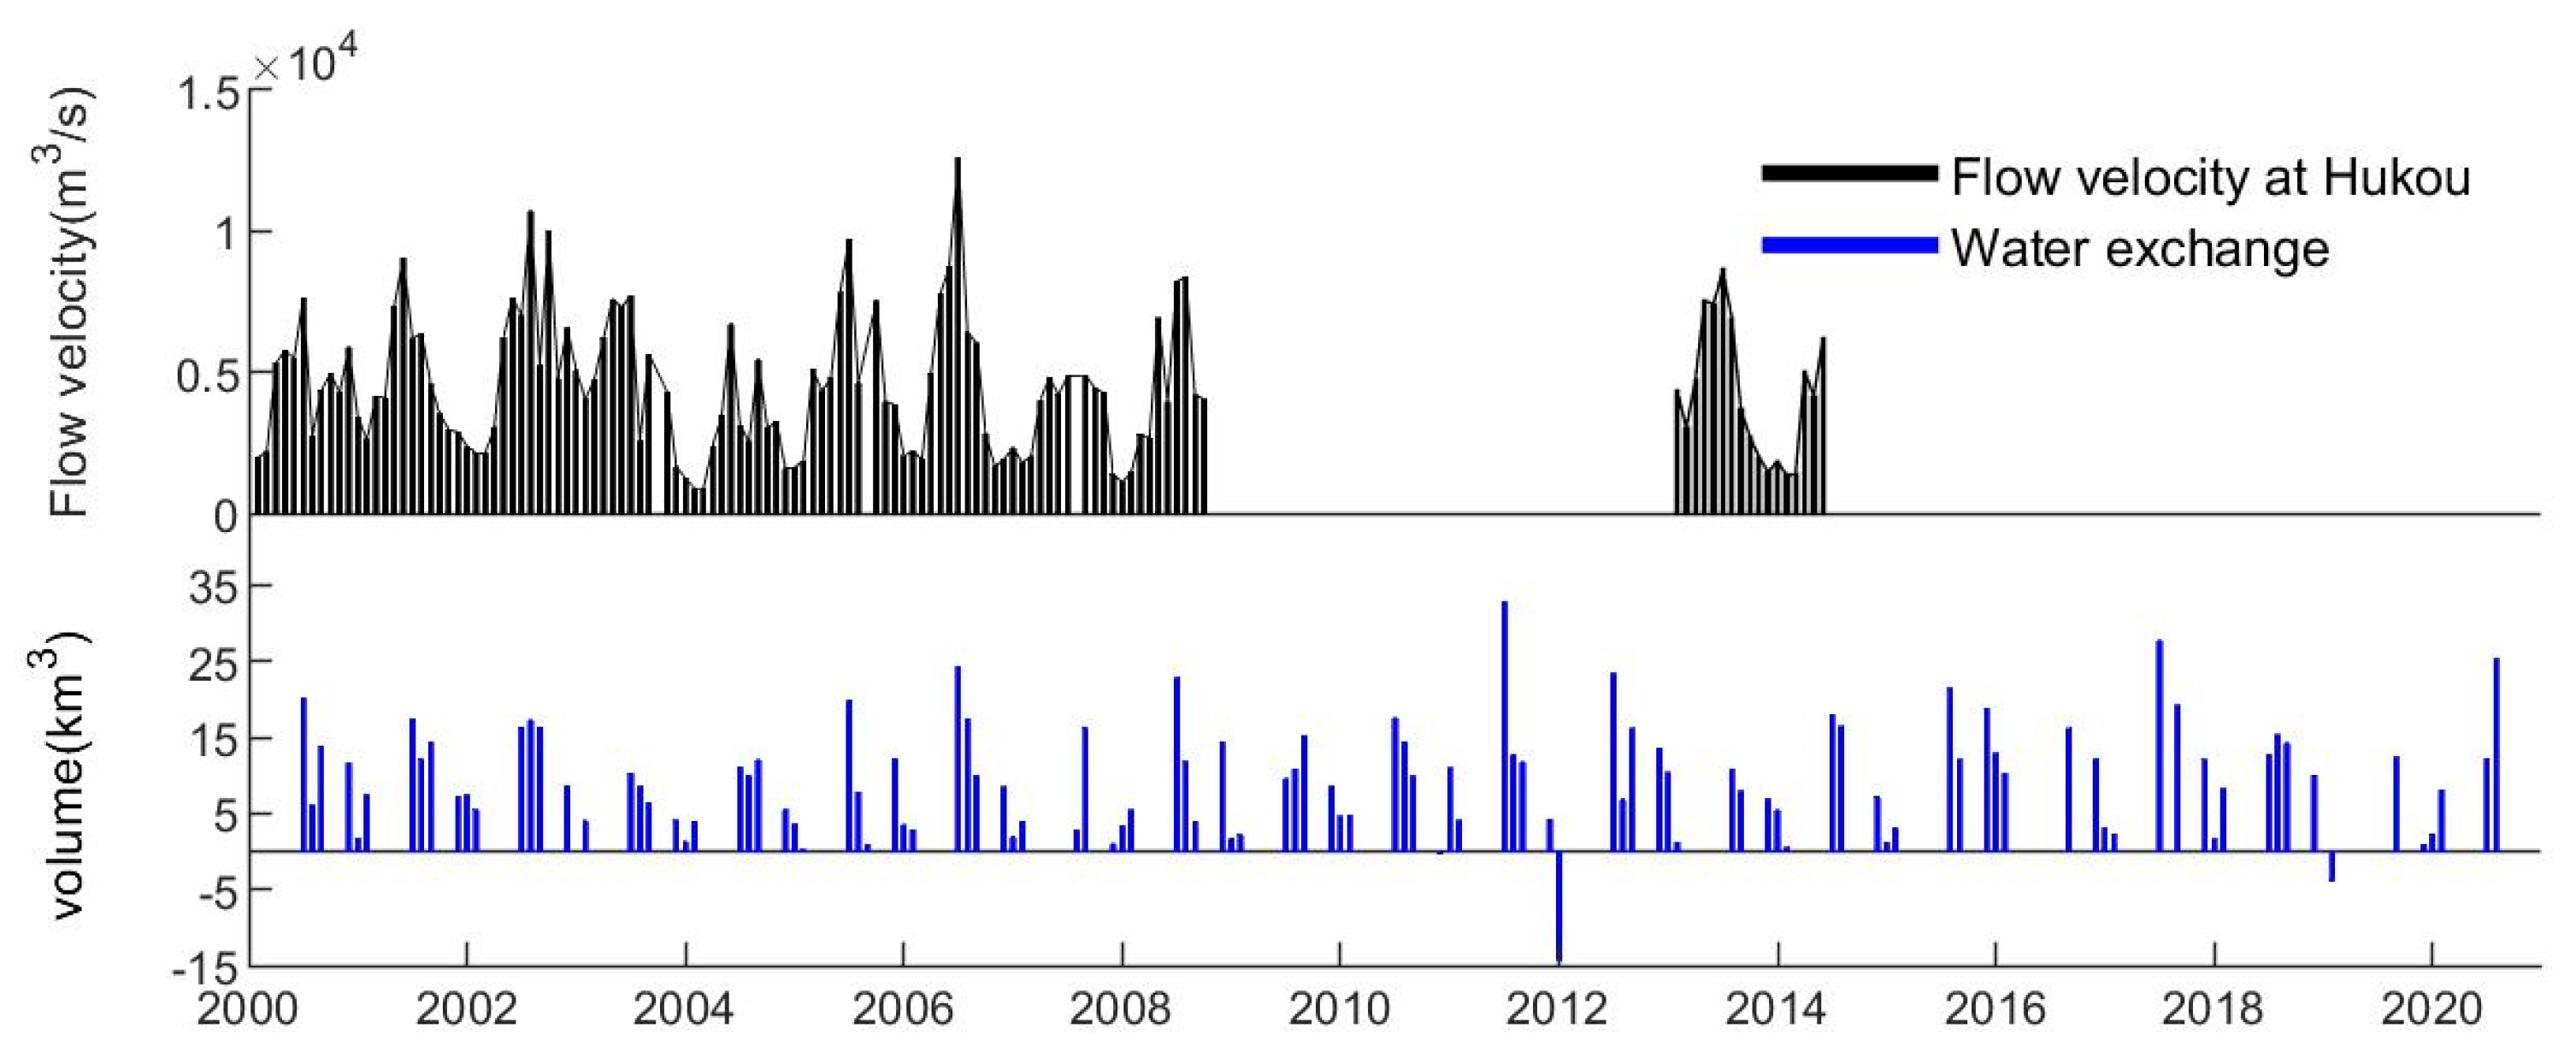
4.4. Water Flowing into Yangtze River
5. Discussion
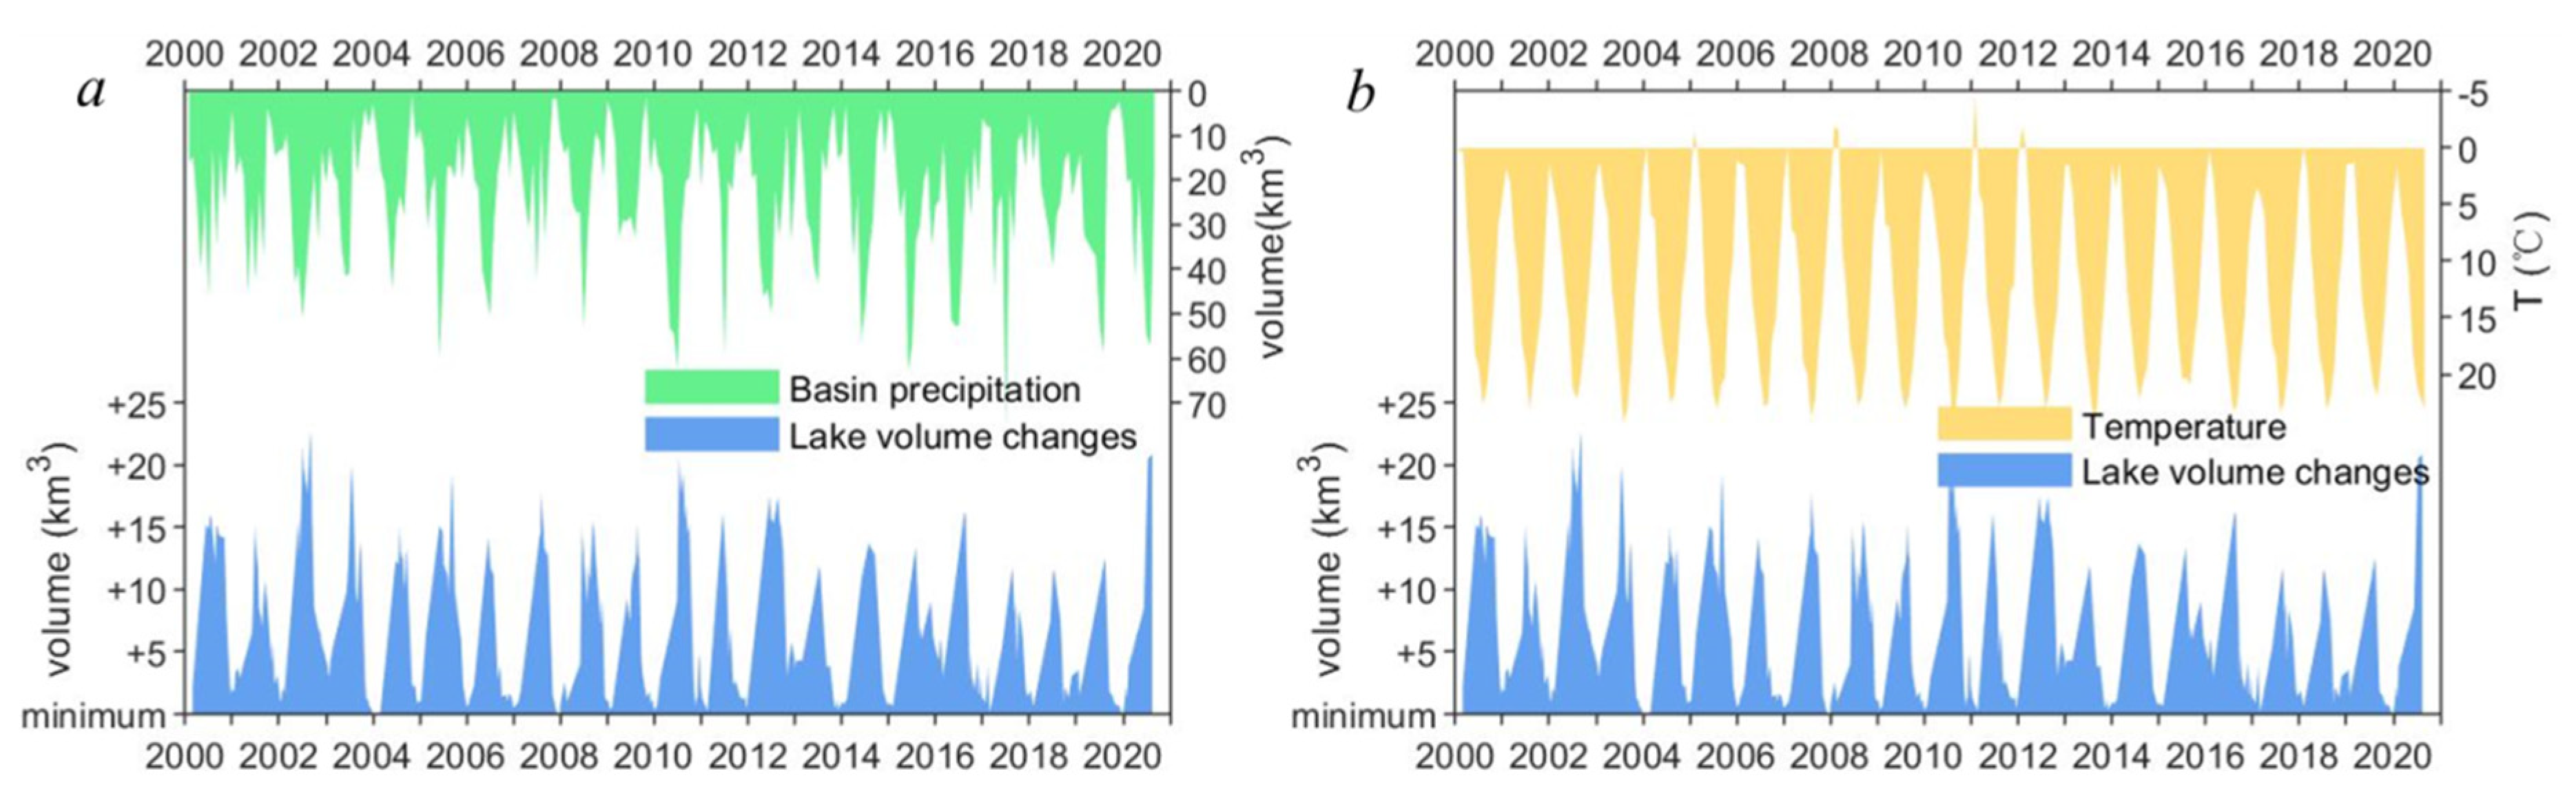
5.1. Driving Forces
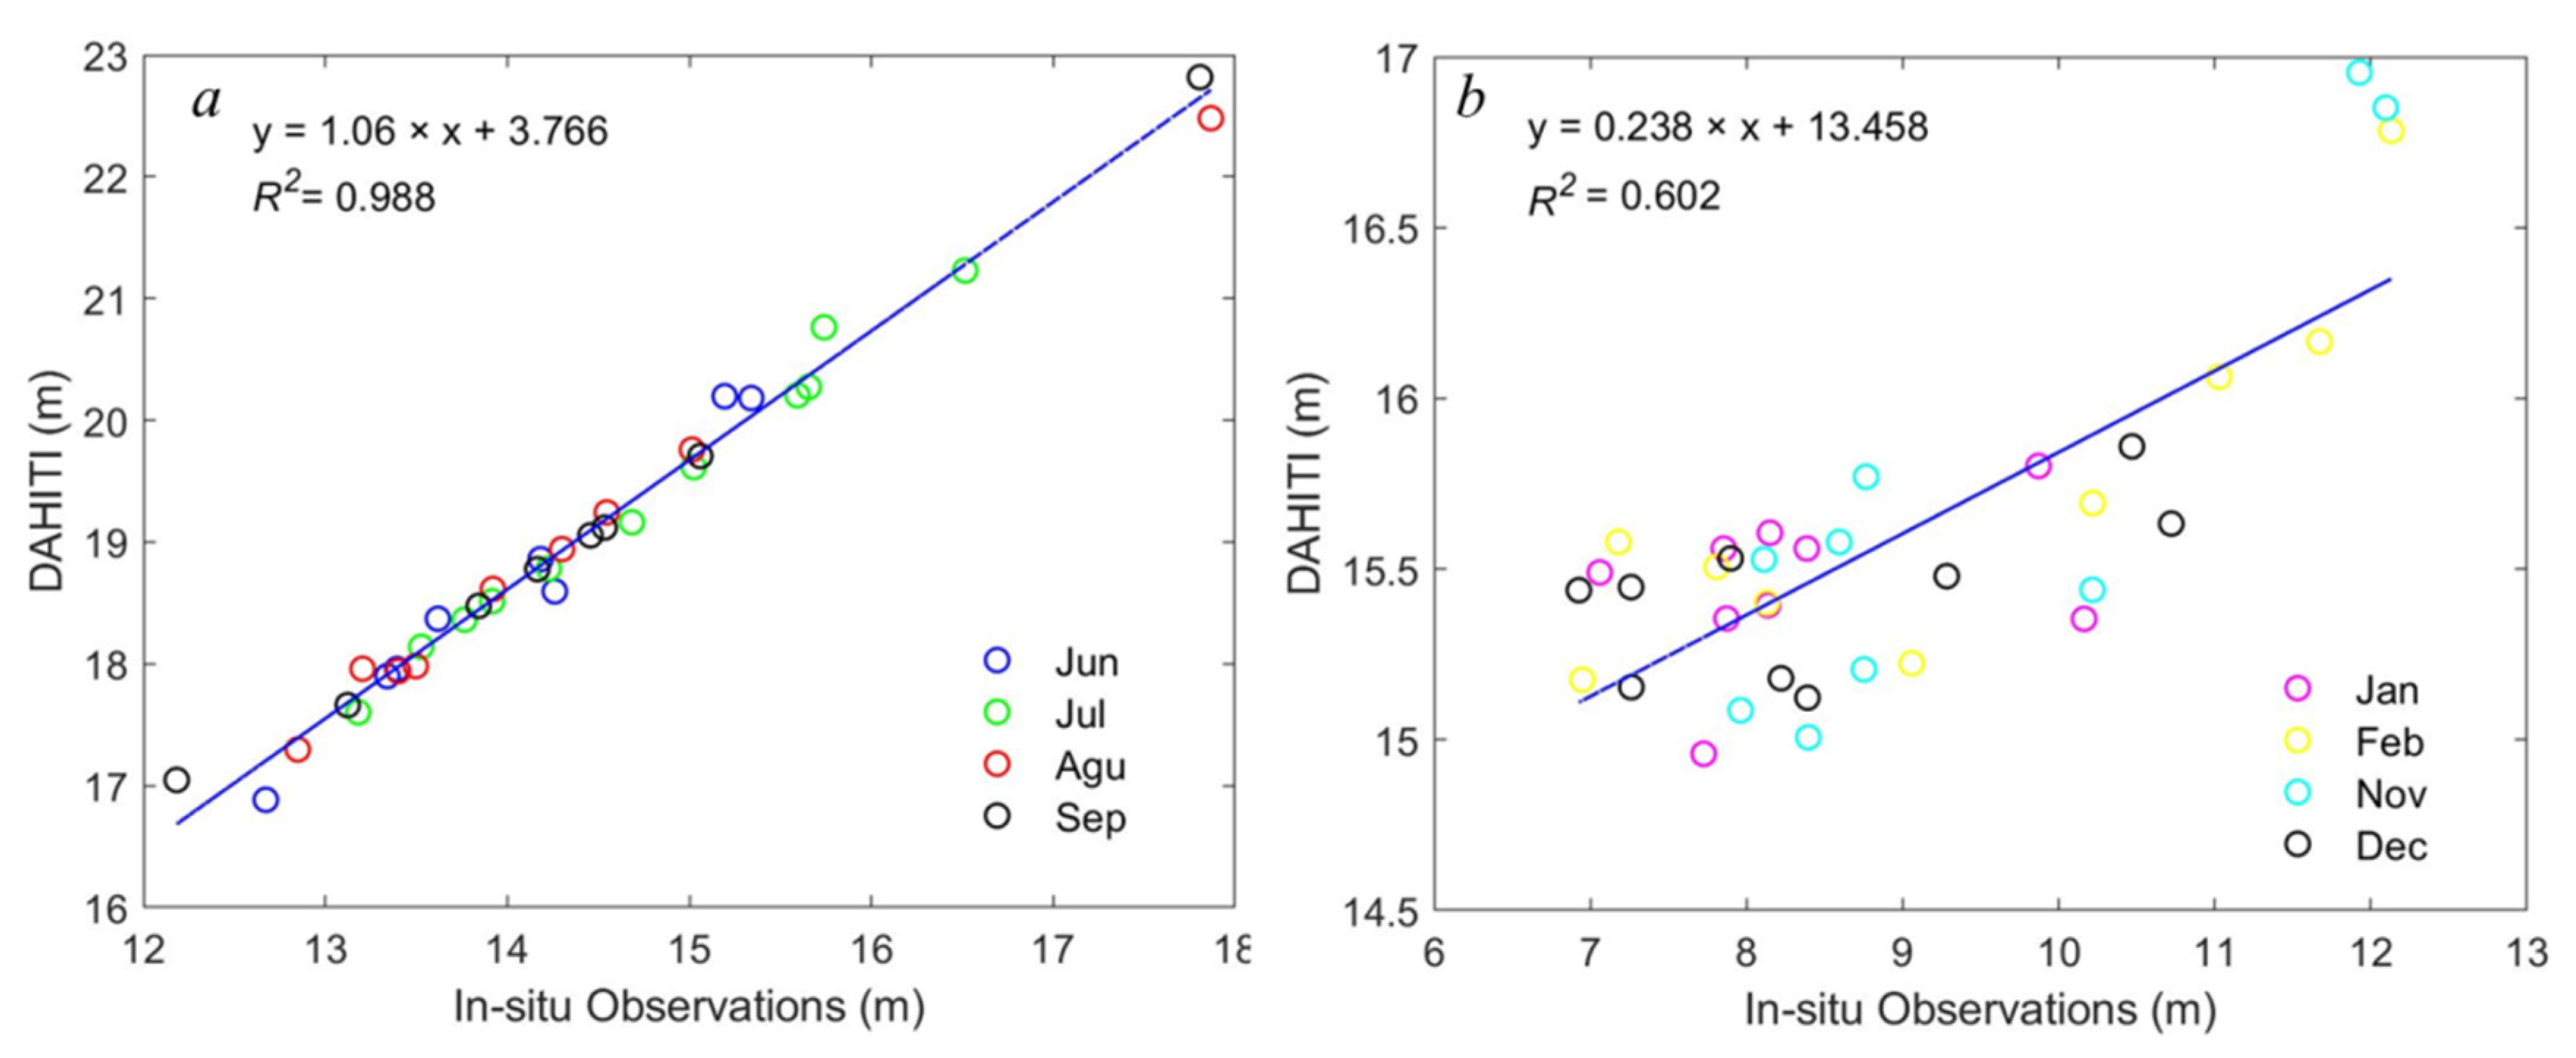
5.2. Accuracy Assessment
6. Conclusions
Author Contributions
Funding
Institutional Review Board Statement
Informed Consent Statement
Data Availability Statement
Acknowledgments
Conflicts of Interest
References
- Wang, S.; Dou, H. China Lake Catalogue; Science Press: Beijing, China, 1998. [Google Scholar]
- Gao, J.H.; Jia, J.; Kettner, A.J.; Xing, F.; Wang, Y.P.; Xu, X.N.; Yang, Y.; Zou, X.Q.; Gao, S.; Qi, S.; et al. Changes in water and sediment exchange between the Changjiang River and Poyang Lake under natural and anthropogenic conditions. China Sci. Total Environ. 2014, 481, 542–553. [Google Scholar] [CrossRef]
- Ye, X.; Li, Y.; Li, X.; Zhang, Q. Factors influencing water level changes in China’s largest freshwater lake, Poyang Lake, in the past 50 years. Water Int. 2014, 39, 983–999. [Google Scholar] [CrossRef]
- Zhang, D.; Liao, Q.; Zhang, L.; Wang, D.; Luo, L.; Chen, Y.; Zhong, J.; Liu, J. Occurrence and spatial distributions of microcystins in Poyang Lake, the largest freshwater lake in China. Ecotoxicology 2014, 24, 19–28. [Google Scholar] [CrossRef]
- Guo, H.; Hu, Q.; Zhang, Q.; Feng, S. Effects of the Three Gorges Dam on Yangtze River flow and river interaction with Poyang Lake, China: 2003–2008. J. Hydrol. 2012, 416–417, 19–27. [Google Scholar] [CrossRef]
- Dai, Z.; Liu, J.T. Impacts of large dams on downstream fluvial sedimentation: An example of the Three Gorges Dam (TGD) on the Changjiang (Yangtze River). J. Hydrol. 2013, 480, 10–18. [Google Scholar] [CrossRef]
- Feng, L.; Hu, C.; Chen, X.; Zhao, X. Dramatic Inundation Changes of China’s Two Largest Freshwater Lakes Linked to the Three Gorges Dam. Env. Sci. Technol. 2013, 47, 9628–9634. [Google Scholar] [CrossRef]
- Dai, Z.; Liu, J.T.; Chen, J. Detection of the Three Gorges Dam influence on the Changjiang (Yangtze River) submerged delta. Sci. Rep. 2014, 4, 6600. [Google Scholar] [CrossRef] [PubMed]
- Feng, L.; Hu, C.; Chen, X.; Cai, X.; Tian, L.; Gan, W. Assessment of inundation changes of Poyang Lake using MODIS observations between 2000 and 2010. Remote Sens. Environ. 2012, 121, 80–92. [Google Scholar] [CrossRef]
- Cai, X.; Feng, L.; Hou, X.; Chen, X. Remote Sensing of the Water Storage Dynamics of Large Lakes and Reservoirs in the Yangtze River Basin from 2000 to 2014. Sci. Rep. 2016, 6, 36405. [Google Scholar] [CrossRef] [PubMed] [Green Version]
- Han, X.; Chen, X.; Feng, L. Four decades of winter wetland changes in Poyang Lake based on Landsat observations between 1973 and 2013. Remote Sens. Environ. 2015, 156, 426–437. [Google Scholar] [CrossRef]
- Smith, L.C. Satellite remote sensing of river inundation area, stage and processes: A review. Hydrol. Process. 1997, 11, 1427–1439. [Google Scholar] [CrossRef]
- Cazenave, A.; Milly, P.C.D.; Douville, H.; Benveniste, J.; Kosuth, P.; Lettenmaier, D.P. Space techniques used to measure change in terrestrial waters. Eos Trans. Am. Geophys. Union 2004, 85, 59–60. [Google Scholar]
- Alsdorf, D.E.; Rodríguez, E.; Lettenmaier, D.P. Measuring surface water from space. Rev. Geophys. 2007, 45, RG2002. [Google Scholar] [CrossRef]
- Birkett, C.M. The contribution of TOPEX/POSEIDON to the global monitoring of climatically sensitive lakes. J. Geophys. Res. Ocean. 1995, 100, 25179–25204. [Google Scholar] [CrossRef]
- Birkett, C.M.; Mertes, L.A.K.; Dunne, T.; Costa, M.H.; Jasinski, M.J. Surface water dynamics in the Amazon Basin: Application of satellite radar altimetry. J. Geophys. Res. 2002, 107, D20. [Google Scholar] [CrossRef]
- Schwatke, C.; Dettmering, D.; Bosch, W.; Seitz, F. DAHITI-an innovative approach for estimating water level time series over inland waters using multi-mission satellite altimetry. Hydrol. Earth Syst. Sci. 2015, 19, 4345–4364. [Google Scholar] [CrossRef] [Green Version]
- Birkett, C.M.; Reynolds, C.; Beckley, B.; Doorn, B. From research to operations: The USDA global reservoir and lake monitor. In Coastal Altimetry; Vignudelli, S., Kostianoy, A., Cipollini, P., Benveniste, J., Eds.; Springer: Berlin/Heidelberg, Germany, 2011; pp. 19–50. [Google Scholar]
- Berry, P.A.M.; Wheeler, J.L. JASON2-ENVISAT Exploitation—Development of Algorithms for the Exploitation of JASON2-ENVISAT Altimetry for the Generation of a River and Lake Product. In Product Handbook v3.5; De Montfort University: Leicester, UK, 2009. [Google Scholar]
- Crétaux, J.F.; Jelinski, W.; Calmant, S.; Kouraev, A.; Vuglinski, V.; Berge-Nguyen, M.; Gennero, M.-C.; Nino, F.; Abarca Del Rio, R.; Cazenave, A.; et al. A lake database to monitor in the Near Real Time water level and storage variations from remote sensing data. Adv. Space Res. 2011, 4, 1497–1507. [Google Scholar]
- Hwang, C.; Peng, M.; Ning, J.; Luo, J.; Sui, C. Lake level variations in China from TOPEX/Poseidon altimetry: Data quality assessment and links to precipitation and ENSO. Geophys. J. Int. 2005, 161, 1–11. [Google Scholar] [CrossRef] [Green Version]
- Zheng, J.; Ke, C.; Shao, Z.; Li, F. Monitoring changes in the water volume of Hulun Lake by integrating satellite altimetry data and Landsat images between 1992 and 2010. J. Appl. Remote Sens. 2016, 10, 16029. [Google Scholar] [CrossRef]
- Wang, X.; Gong, P.; Zhao, Y.; Xu, Y.; Cheng, X.; Niu, Z.; Luo, Z.; Huang, H.; Sun, F.; Li, X. Water-level changes in China’s large lakes determined from ICESat/GLAS data. Remote Sens. Environ. 2013, 132, 131–144. [Google Scholar] [CrossRef]
- Chipman, J.W.; Lillesand, T.M. Satellite-based assessment of the dynamics of new lakes in southern Egypt. Int. J. Remote Sens. 2007, 28, 4365–4379. [Google Scholar] [CrossRef]
- Sun, F.D.; Zhao, Y.Y.; Gong, P.; Ma, R.H.; Dai, Y.J. Monitoring dynamic changes of global land cover types: Fluctuations of major lakes in China every 8 days 2000–2010. Chin. Sci. Bull. 2014, 59, 171–189. [Google Scholar] [CrossRef]
- Prigent, C.; Papa, F.; Aires, F.; Rossow, W.B.; Matthews, E. Global inundation dynamics inferred from multiple satellite observations, 1993–2000. J. Geophys. Res. 2007, 112, D12107. [Google Scholar] [CrossRef]
- Papa, F.; Prigent, C.; Aires, F.; Jimenez, C.; Rossow, W.B.; Matthews, E. Interannual variability of surface water extent at the global scale, 1993–2004. J. Geophys. Res. 2010, 115. [Google Scholar] [CrossRef]
- Peng, D.Z.; Guo, S.L.; Liu, P.; Liu, T. Reservoir storage curve estimation based on remote sensing data. J. Hydrol. Eng. 2006, 11, 165–172. [Google Scholar] [CrossRef]
- Davis, P.A. Review of Results and Recommendations from the GCMRC 2000–2003 Remote-Sensing Initiative for Monitoring Environmental Resources Within the Colorado River Ecosystem; U.S. Geological Survey: Reston, VA, USA, 2004; p. 1206.
- Frappart, F.; Seylerb, F.; Martinezc, J.M.; Leónb, J.G.; Cazenavea, A. Floodplain water storage in the Negro River basin estimated from microwave remote sensing of inundation area and water levels. Remote Sens. Environ. 2005, 99, 387–399. [Google Scholar] [CrossRef] [Green Version]
- Song, C.; Huang, B.; Ke, L. Modeling and analysis of lake water storage changes on the Tibetan Plateau using multi-mission satellite data. Remote Sens. Environ. 2013, 135, 25–35. [Google Scholar] [CrossRef]
- Crétaux, J.F.; Kouraev, A.K.; Papa, F.; Bergé-Nguyen, M.; Cazenave, A.; Aladin, N.V.; Plotnikov, I.S. Water balance of the Big Aral Sea from satellite remote sensing and in situ observations. Great Lakes Res. 2005, 31, 520–534. [Google Scholar] [CrossRef] [Green Version]
- Mei, X.; Dai, Z.; Du, J.; Chen, J. Linkage between Three Gorges Dam impacts and the dramatic recessions in China’s largest freshwater lake, Poyang Lake. Sci. Rep. 2015, 5, 18197. [Google Scholar] [CrossRef] [Green Version]
- Zheng, Y. Prediction of the Distribution of C3 and C4 Plant Species from a GIS-Based Model: A Case Study in Poyang Lake, China. Master’s Thesis, ITC, Enschede, The Netherlands, 2009. [Google Scholar]
- Harris, J.; Zhuang, H. An Ecosystem Approach to Resolving Conflicts among Ecological and Economic Priorities for Poyang Lake Wetlands; International Crane Foundation/IUCN: Gland, Switzerland, 2010. [Google Scholar]
- Fan, Y.J.; Yu, X.X.; Zhang, H.X.; Song, M.H. Comparison between Kriging interpolation and Inverse Weighting Tension for precipitation data analysis: Taking Lijing river basin as a study case. J. China Hydrol. 2014, 34, 61–66. (In Chinese) [Google Scholar]
- Allen, R.G.; Pereira, L.S.; Raes, D.; Smith, M. Crop Evapotranspiration: Guidelines for Computing Crop Water Requirements-FAO Irrigation and Drainage Paper; FAO: Rome, Italy, 1998. [Google Scholar]
- Gao, Y.Q.; Wang, Y.W.; Hu, C.; Wang, W.; Liu, S. Variability of evaporation from Lake Taihu in 2012 and evaluation of a range of evaporation models. Clim. Environ. Res. 2016, 21, 393–404. (In Chinese) [Google Scholar]
- Sun, F.D.; Ma, R. Hydrologic changes of Poyang Lake based on radar altimeter and optical sensor. J. Geogr. Sci. 2020, 75, 544–557. [Google Scholar]
- Sun, F.D.; Ma, R. Hydrologic changes of Aral Sea: A reveal by the combination of radar altimeter data and optical images. Ann. Gis 2019, 25, 247–261. [Google Scholar] [CrossRef] [Green Version]
- Sun, F.D.; Ma, R.; He, B.; Zhao, X.; Zeng, Y.; Zhang, S.; Tang, S. Changing Patterns of Lakes on The Southern Tibetan Plateau Based on Multi-Source Satellite Data. Remote Sens. 2020, 12, 3450. [Google Scholar] [CrossRef]
- Liu, Y.; Yue, H. Estimating the fluctuation of Lake Hulun, China, during 1975–2015 from satellite altimetry data. Environ. Monit. Assess. 2017, 189, 630. [Google Scholar] [CrossRef] [PubMed]
- Zhang, G.; Chen, W.; Xie, H. Tibetan Plateau’s lake level and volume changes from NASA’s ICESat/ICESat-2 and Landsat Missions. Geophys. Res. Lett. 2019, 46, 13107–13118. [Google Scholar] [CrossRef]
- Wan, X.; Xu, X. Analysis of supply and demand balance o of water resources around Poyang Lake. Yangtze River 2010, 41, 43–47. [Google Scholar]
- Feng, L.; Hu, C.; Chen, X.; Li, R. Satellite observations make it possible to estimate Poyang lake’s water budget. Environ. Res. Lett. 2011, 6, 44023. [Google Scholar] [CrossRef]
- Liu, Y.; Wu, G.; Zhao, X. Recent declines in China’s largest freshwater lake: Trend or regime shift? Env. Res. Lett. 2013, 8, 14010. [Google Scholar] [CrossRef]
- Lai, X.; Shankman, D.; Huber, C.; Yesou, H.; Huang, Q.; Jiang, J. Sand mining and increasing Poyang Lake’s discharge ability: A reassessment of causes for lake decline in China. J. Hydrol. 2014, 519, 1698–1706. [Google Scholar] [CrossRef]
- Zhang, Q.; Ye, X.-C.; Werner, A.D.; Li, Y.-L.; Yao, J.; Li, X.-H.; Xu, C.-Y. An investigation of enhanced recessions in Poyang Lake: Comparison of Yangtze River and local catchment impacts. J. Hydrol. 2014, 517, 425–434. [Google Scholar] [CrossRef] [Green Version]
- Xinhua Net. China’s Largest Freshwater Lake Sees Record Water Rise. 12 July 2020. Available online: http://www.xinhuanet.com/english/2020-07/12/c_139207311.htm (accessed on 16 July 2020).
- Liu, J.; Zhang, Q.; Xu, C.; Zhang, Z. Characteristics of run off variation of Poyang Lake watershed in the past 50 years. Trop Geogr. 2009, 29, 213–218. [Google Scholar]
- Zhang, Z.; Huang, Y.; Xu, C.Y.; Chen, X.; Moss, E.M.; Jin, Q.; Bailey, A.M. Analysis of Poyang Lake water balance and its indication of river–lake interaction. SpringerPlus 2016, 5, 1555. [Google Scholar] [CrossRef] [PubMed] [Green Version]
- de Leeuw, J.; Shankman, D.; Wu, G.; de Boer, W.F.; Burnham, J.; He, Q.; Yesou, H.; Xiao, J. Strategic assessment of the magnitude and impacts of sand mining in Poyang Lake, China. Reg. Environ. Chang. 2010, 10, 95–102. [Google Scholar] [CrossRef]


| Month | R (km3) | P (km3) | E (km3) | W (km3) | ΔV (km3) |
|---|---|---|---|---|---|
| June | 21.03 | 1.40 | 1.25 | 18.49 | 2.69 |
| July | 11.21 | 0.91 | 1.70 | 12.66 | −2.25 |
| August | 10.60 | 0.72 | 1.59 | 12.04 | −2.30 |
| September | 5.98 | 0.39 | 1.29 | 10.63 | −5.56 |
| Wet season | 48.82 | 3.43 | 5.84 | 53.83 | −7.42 |
| November | 6.94 | 0.44 | 0.65 | 8.35 | −1.61 |
| December | 4.12 | 0.26 | 0.47 | 3.50 | 0.42 |
| January | 5.19 | 0.38 | 0.41 | 3.90 | 1.26 |
| February | 6.68 | 0.49 | 0.47 | −2.63 | 9.33 |
| Dry season | 22.93 | 1.57 | 2.00 | 13.11 | 9.39 |
Publisher’s Note: MDPI stays neutral with regard to jurisdictional claims in published maps and institutional affiliations. |
© 2021 by the authors. Licensee MDPI, Basel, Switzerland. This article is an open access article distributed under the terms and conditions of the Creative Commons Attribution (CC BY) license (http://creativecommons.org/licenses/by/4.0/).
Share and Cite
Sun, F.; Ma, R.; Liu, C.; He, B. Comparison of the Hydrological Dynamics of Poyang Lake in the Wet and Dry Seasons. Remote Sens. 2021, 13, 985. https://doi.org/10.3390/rs13050985
Sun F, Ma R, Liu C, He B. Comparison of the Hydrological Dynamics of Poyang Lake in the Wet and Dry Seasons. Remote Sensing. 2021; 13(5):985. https://doi.org/10.3390/rs13050985
Chicago/Turabian StyleSun, Fangdi, Ronghua Ma, Caixia Liu, and Bin He. 2021. "Comparison of the Hydrological Dynamics of Poyang Lake in the Wet and Dry Seasons" Remote Sensing 13, no. 5: 985. https://doi.org/10.3390/rs13050985
APA StyleSun, F., Ma, R., Liu, C., & He, B. (2021). Comparison of the Hydrological Dynamics of Poyang Lake in the Wet and Dry Seasons. Remote Sensing, 13(5), 985. https://doi.org/10.3390/rs13050985