Article

Quantification of the Mechanized Ballast Cleaning Process Efficiency Using GPR Technology

by
Anna Borkovcová
1,
Vladislav Borecký
1,
Salih Serkan Artagan
1,2,* and
Filip Ševčík
1
1
Department of Transport Structures, Faculty of Transport Engineering, University of Pardubice, Studentska 95, 532 10 Pardubice, Czech Republic
2
Vocational School of Transportation, Eskişehir Technical University, Basın Şehitleri Cad. No:152, Eskişehir 26470, Turkey
*
Author to whom correspondence should be addressed.
Remote Sens. 2021, 13(8), 1510; https://doi.org/10.3390/rs13081510
Submission received: 6 March 2021 / Revised: 1 April 2021 / Accepted: 8 April 2021 / Published: 14 April 2021
(This article belongs to the Special Issue Trends in GPR and Other NDTs for Transport Infrastructure Assessment)

Abstract

:
Ground Penetrating Radar (GPR) has been used recently for diagnostics of the railway infrastructure, particularly the ballast layer. To overcome ballast fouling, mechanized ballast cleaning process, which increases track occupancy time and cost, is usually used. Hence it is of crucial significance to identify at which stage of track ballast life cycle, and level of fouling, ballast cleaning should be initiated. In the present study, a series of in situ GPR surveys on selected railway track sections in Czechia was performed to obtain railway granite ballast relative dielectric permittivity (RDP) values in several phases of railway track lifecycle. GPR data were collected in the form of B-scan, and time-domain analysis was used for post-processing. The results indicate (i) change of railway ballast RDP in time (long term); (ii) a dependency of ballast fouling level on RDP; and (iii) the RDP change during the ballast cleaning process, thus its efficiency. This research aimed to provide new perspectives into the decision-making process in initiating the mechanized ballast cleaning intervention based on the GPR-measured data.

Graphical Abstract

1. Introduction

Increasing service frequencies for railway freight and passenger along with the high safety, sustainability, and reliability requirements, railways necessitate optimized strategic planning and decision-making for the maintenance activities, which should be figured out based on extensive and reliable fault detection methodologies. Conventional diagnostic methods are destructive, economically inefficient, and cause traffic constraints increasing the track occupation time. In contrast, railway infrastructure administrators target the task of optimizing the diagnostic inspection intervals and following maintenance works, to diminish the financial costs and track occupation time. Therefore, non-destructive testing (NDT) techniques have been increasingly used lately.
Qian et al. [1] developed a non-intrusive technique, as a fundamental element of Railroad Infrastructure 4.0, to determine the distribution of ballast pressure under the sleeper using the bending moment profile across the concrete sleeper, and the estimated rail seat loads as inputs, to compute the state of ballast support employing an optimization algorithm. Tamrakar et al. [2] used spectral analysis of surface wave technique (SASW) to estimate the mechanical properties of ballast and evaluated the complications in the implementation of the SASW method for characterization of ballast and foundation soil or subgrade. Mvelase et al. [3] employed laser technology to examine the influence of railway ballast roundness on shear strength resulting in improved in situ quality evaluations in regards to ballast layer maintenance or replacement. Schmidt et al. [4] stated that the outcomes of the constant head permeability experiments in combination with a novel imaging technology for ballast will give insights to decision-makers in the determination of the time as to when ballast should be cleaned. Calibration [5] and application [6] of Time Domain Reflectometry (TDR) test probes were performed for determination of moisture variation in the railway infrastructure layers.
Ground Penetrating Radar (GPR), as another NDT technique, has steadily been in use in diagnostics of the railway infrastructure recently [7,8]. This method is still not the most routine tool implemented to evaluate the status of the railway infrastructure, however, it is being utilized to a greater extent due to its numerous benefits such as time efficiency, reduced costs, rapid fulfilling of surveys, continuous data acquisition of long sections, and the non-destructive principle [9]. Moreover, competent use of GPR brings forward the advantages of prioritizing the sections requiring urgent interventions, insights on the rates of ballast layer deformation, and enhanced strategical planning for mechanized operations (e.g., tamping and undercutter/ballast cleaning machines) [10]. GPR applications on railway infrastructure comprise detecting the thickness of the layers [11,12,13], moisture trapped areas [14], congested pipes, utility networks, culverts, other buried objects, and the required diagnosis of the railway infrastructure status.
The basic tasks of the ballast layer are to bear the railway axle loads from the superstructure, transmit those to the infrastructure, and facilitate water draining [15]. Railway ballast progressively degrades because of cyclic loading and weathering impacts. So-called ballast fouling (contamination of ballast) develops as the air voids between the ballast stones are replaced by finer-sized fouling materials. Ballast fouling takes place when ballast stones break down and/or ingress of other materials occurs either from the surface of ballast or from the ballast layer bottom [16]. To discharge the substandard finer materials from the ballast layer, mechanized ballast cleaning is commonly used with the machinery called ballast-cleaners and/or undercutters, which undertake screening of existing ballast and removing of the spent material with the capability of the addition of new standard clean ballast to maintain the required ballast quantity and profile. However, this vital intervention, which is generally performed before tamping, is time-consuming and expensive. Thus, it is of crucial significance to identify at which step of track ballast life cycle, level of fouling, and mechanized ballast cleaning should be initiated and is most favorable costwise. In order to attain this critical knowledge, long-term and recurring investigations of the status of railway ballast are required.

1.1. Mechanized Ballast Cleaning Activity on Railways

The ballast layer is anticipated to address several requirements for safe, secure, and sustainable railway operations, such as homogeneous load-bearing capability, high resilience to loads from each direction (vertical, transversal, and longitudinal), to keep track in place, enabling elementary fixing and flexibility of track geometry, and immediate draining of water. The pollution of the ballast layer (i.e., ballast fouling) occurs when fine particles (up to 22.5 mm) within the ballast layer fill the air voids. Among reasons for ballast fouling, there exist, mechanical breakdown of the ballast aggregates caused by dynamic forces, dirt, and dust from the surface and sublayers, railway traffic contamination, and interventions such as tamping and packing of sleepers. All these mechanisms lead to water drainage disability, reduction in the internal friction, differential settlements, stress increment in the ballast layer, and the formation of clogged portions in the ballast layer. The aim of mechanized ballast layer cleaning is to screen and eliminate finer material from the ballast layer and to reestablish the required characteristics of the ballast layer. When ballast fouling level reaches over 30% of the ballast aggregates’ total weight, the ballast layer cleaning process should be initiated [17].
Ballast cleaning intervention can be regarded as one of the physically most challenging activities in maintaining and reconstructing the railway infrastructure [17]. The efficiency of the mechanized cleaning process has an explicit impact on the overall standard of maintenance and reconstruction works. Therefore, considering the ballast cleaning activity as a complex intervention rather than the cleaning activity itself might enable analyzing it better. This complicated process involves ballast excavation, ballast screening and removing the fine grains and spent ballast, putting the reusable, good performing ballast stones back in track, and clearing of obstructed areas with fine grains along with adjustment of track alignment [18]. Recently, noticeable consideration is focused on the efficiency and capacity of the ballast cleaning and undercutter machinery. The ever-increasing output requirements resulted in an enhancement in the machinery design (particularly the ballast screening capability has been enhanced and dimensions and speed of the ballast excavation chains have been increased) with respect to ergonomic and environmental parameters [17]. Schilling [18] presented the track possession optimization program for track reconstruction with a comparative analysis of three different ballast cleaning technologies, whereas Korolev et al. [19] discussed the technologies of ballast cleaning and analyzed the impact of miscellaneous parameters on the implementation of the ballast cleaning technology for reducing the operating costs for Russian railways.
According to Tzanakakis [20], ballast cleaning process is implemented in a range varying from 12 to 15 years on a common railway mainline under intensive operation and is performed along with other large-scale railway maintenance and reconstruction interventions. However, the necessity of ballast cleaning process is usually decided subjectively by the chief district maintenance officer in real cases.

1.2. Ground Penetrating Radar

The term RADAR, dating back to the 1930s, is generated as an acronym for Radio Detection and Ranging. GPR, which is a particular sort of radar system, has been employed for over 50 years in probing, detecting, and visualizing underground and construction materials [21]. Through the combination of Maxwell’s formulation of electromagnetic (EM) theory and constitutive equations, one can attain the quantitative characterization of GPR signals [22]. From the physical point of view, the prospects of employing the GPR method are affected by the EM characteristics of the material under survey, which are basically Relative Dielectric Permittivity (RDP) (alias dielectric constant, εr), magnetic permeability μ, and electrical conductivity σ.
RDP portrays the capacity of the material to store and emit the electric charge generated by the EM field. RDP of a material can be characterized as the measure of electrostatic energy reserved per volume. It is a figure demonstrating the speed of radar energy as it goes through the medium. RDP values of particular materials might be found in the literature, however, the composition of the in situ material in the lossy environment has to be considered [23]. Electromagnetic Wave Velocity (EMWV), i.e., υr (m/s), is computed from the two-way travel time (twt) of the EM signal (to and from the target). As per the construction materials, it might be assumed that the GPR signal interacts negligibly with the magnetic field in general. Based on this assumption, EMWV can be calculated from Equation (1),
νr = c / √εr [m/s],
where υr is relative EMWV, c is the speed of light, and εr is RDP [24]. Once the EMWV of the material is known, the thickness/depth of the material of interest can be obtained via Equation (2),
d = νr * twt/2 [m],
where d is the thickness/depth of the object/interface and twt is the two-way travel time of EM signal to and from the object/interface of interest [24].
Figure 1 illustrates a radargram (both A-scan and B-scan) where twt differences between the maximum reflection amplitudes of air/ballast interface and the ballast bottom can be observed. (In Figure 1, a metal plate interface was used to collect a distinctive reflection from the ballast base). Those time intervals are used in Equation (2) in order to obtain EMWV in the case of known depth. Then using Equation (1), one can back-calculate the RDP value.

1.3. Railway Ballast Assessment by GPR

According to Selig and Waters [26] ballast layer might be grouped in four zones as follows:
  • Crib—the portion of ballast between the sleepers;
  • Shoulder—the ballast aggregates between the edge of the sleeper and down to the top of the sub-ballast layer;
  • Top ballast—the upper portion of the ballast aggregates where tamping intervention is often performed.
  • Bottom ballast—the lower portion of the ballast aggregates supporting the whole structure.
Ballast fouling can display variations along the track, introducing changes in both RDP values and layer thicknesses. Clean ballast possesses a lower value of the average RDP since it has a higher volume of air voids (RDP value of air equals 1). Ballast fouling can be caused by five mechanisms as follows (the percentage of occurrences are given for each mechanism in parenthesis): ballast breakdown (76%), ingress of granular layers beneath the ballast layer (13%), ingress of fines from ballast surface (7%), penetration of materials from subgrade (3%), and degradation in sleepers (1%) [26].
Although there exist many fouling indicators, the fouling index proposed by Selig and Waters [26] is the most commonly applied one. Percentage passing values of certain sieves are summed up to find out the fouling index using Equation (3).
FI = P0.075 + P4.75,
where FI is the fouling index, P0.075 and P4.75 symbolizes the percentage of materials, respectively, passing the sieve sizes of 0.075 and 4.75 mm.
Foun [27] used another fouling index called percentage void contamination (PVC) obtained from laboratory GPR testing to develop a method for detailed ballast cleaning plans. Moreover, other fouling indexes, such as the effective degree of fouling, D-bar method, relative ballast fouling, the percentage of fouling, and PVC were comparatively referred to by Anbazhagan [28].
The information on RDP values addresses a significant part of determining ballast thickness and status. RDP value is hugely reliant on the water amount as well as the fouling level of the ballast layer. However, a precise examination of these phenomena still represents an arduous task for GPR railways investigations [29]. Lalagüe [30] gave an overview of the published RDP values of granite ballast under several varying cases (clean ballast in dry and moist conditions as well as fouled ballast in dry and moist conditions) in the studies of various researchers. In Table 1, an extended version of published RDP values of granite ballast under several different conditions can be seen.
As indicated by Maturana et al. [35], the presence of reflectors within the ballast layer, the attenuation, indistinguishable ballast bottom interface, and decline in the EMWV owing to various reasons influence the GPR signal in the ballast layer. GPR surveys repeated in regular time intervals facilitate the estimation of the status and degradation pace of the ballast layer, which might assist to optimize the overall maintenance action plan through effective scheduling of required short, medium, and long-term maintenance activities with remarkable savings associated with cost and time [35]. As also mentioned in a recent article by Artagan and Borecky [34], numerous scientists, partially or wholly, handled the evaluation of railway ballast fouling and thickness using several attributes of GPR signal in their researches [7,28,33,34,35,36,37,38,39,40,41,42,43,44,45,46,47,48,49]. GPR tests were performed on a model rail line track of various ballast states utilizing antennas with different frequencies in the work by Su et al. [39]. In view of the investigation of the handled data, the impact of antenna frequency, water amount in the ballast layer, the influence of geotextile discernible by radar, and the distinction in RDP values were examined and assessed.
In their case study, Keogh et al. [50] created and executed a complex framework for the aim of non-destructive investigation of railway ballast and sleeper conditions, where they modeled the effective in situ RDP of railway ballast according to the volumetric weighted sum of the RDP values of the railway ballast components. This model anticipated a decline in EMWV values (10–30%) in the ballast layer during its fouling interaction.
Jack and Jackson [11] monitored variations in the status of the ballast layer to organize the collected GPR data into the stretches associated with the corresponding variations in the ballast layer status. In another study by Gallagher et al. [12], the GPR method was utilized to determine the interface between ballast and subgrade along with the level of ballast fouling. Hugenschmidt [13] expressed that the use of GPR had an edge over the conventional methods for ballast condition evaluation, leading to a minimized quantity of test-pits required, and also identified the railway segments where material from underlying layers infiltrated into the ballast layer. In a recent experimental research by Tosti et al. [8], RDP values of clean ballast were compared between different types and frequencies of the antennas in order to identify critical elements most applicable for the railway ballast GPR surveys. To assess the degree of ballast fouling utilized in Portuguese railway lines, laboratory experiments were undertaken on various materials utilizing different antennas [29,44]. The consolidated effect of varying fouling levels and diverse water contents was examined. Sussmann et al. [51] carried out both laboratory and field tests in order to estimate RDP values of railway track ballast through a mixing model.
Several studies employed the EMWV values in converting the time axis to the depth axis in GPR data for the ballast layer. Hugenschmidt [13] suggested an average EMWV value of 14 cm/ns for the ballast layer after comparison of ground truth data with the GPR data, whereas 13 cm/ns for the ballast layer was calculated in the research by Jack and Jackson [11]. Intervals of EMVW values changing from 12 to 21 cm/ns and from 0.8 to 1.2 cm/ns were used, respectively, for clean and fouled ballast in the research by Göbel et al. [52].
Artagan et al. [53] determined the effect of water content within the granite ballast layer for the clean and fouled conditions by collecting GPR data in the laboratory. Clean granite ballast in saturated conditions was reported to have an RDP value of 25.5, while the mean RDP value of clean drained granite ballast was discovered to reflect almost identical values (3.09) with the clean dry ballast. As the fouling levels increased, so did the RDP values.
Besides, other aspects of GPR analysis of railway ballast have come to the interest of the researchers such as the use of frequency-domain analyses [7,38,40], analytical modeling [54] and numerical simulations [46,55,56]. Moreover, considerable efforts are directed into coupling GPR with other NDT techniques in railway ballast evaluation. Fontul et al. [57] expressed seismic waves, GPR, electric resistivity, and gravimetry as the fundamental NDT geophysical methods for railway infrastructure assessment. Comprehensive overviews on the GPR-based applications for condition monitoring of railway ballast can be found in a couple of works [10,58,59].
It might very well be perceived from the mentioned literature above that GPR is a favorable instrument to evaluate the status of railway ballast and the associated degree of fouling utilizing determined RDP/EMWV values. It is worth mentioning that test pits are required for calibrating the RDP/EMWV values as recommended in the literature above.
Although extensive research has been carried out on GPR-based determination of the state of the railway ballast recently, these studies are mostly limited to the then-current condition of the ballast layer. To the best of authors’ knowledge, no study exists monitoring the condition change of ballast layer by GPR just before and after mechanized cleaning process. Moreover, there are a few studies [60,61] monitoring long-term change of ballast layer.
Therefore, the presented article focused on identifying the status of the railway granite ballast layer and finding out the variation in fouling levels before and after the mechanized ballast cleaning intervention by means of the GPR-measured RDP values of the ballast layer. In situ RDP values of the granite ballast layer obtained in this study provide additional literature data for that particular type of ballast material. The partial goals were to determine the long-term variation of RDP and EMWV particularly before and after the mechanized ballast cleaning activities and to describe the dependency between the collected GPR data and the fouling levels. To accomplish the set goals, repeated surveys (long-term monitoring over a total period of 4 years) at various stages of the track lifecycle in several sections of a real railway track were performed with miscellaneous GPR antenna configurations. Ground truth data were collected and analyzed in the laboratory. Time-domain analysis was used to process the data and compute the RDP values at different stages of railway ballast economic life. Then, quantification of the influence of the mechanized ballast cleaning on the condition of the railway ballast layer was obtained using GPR.

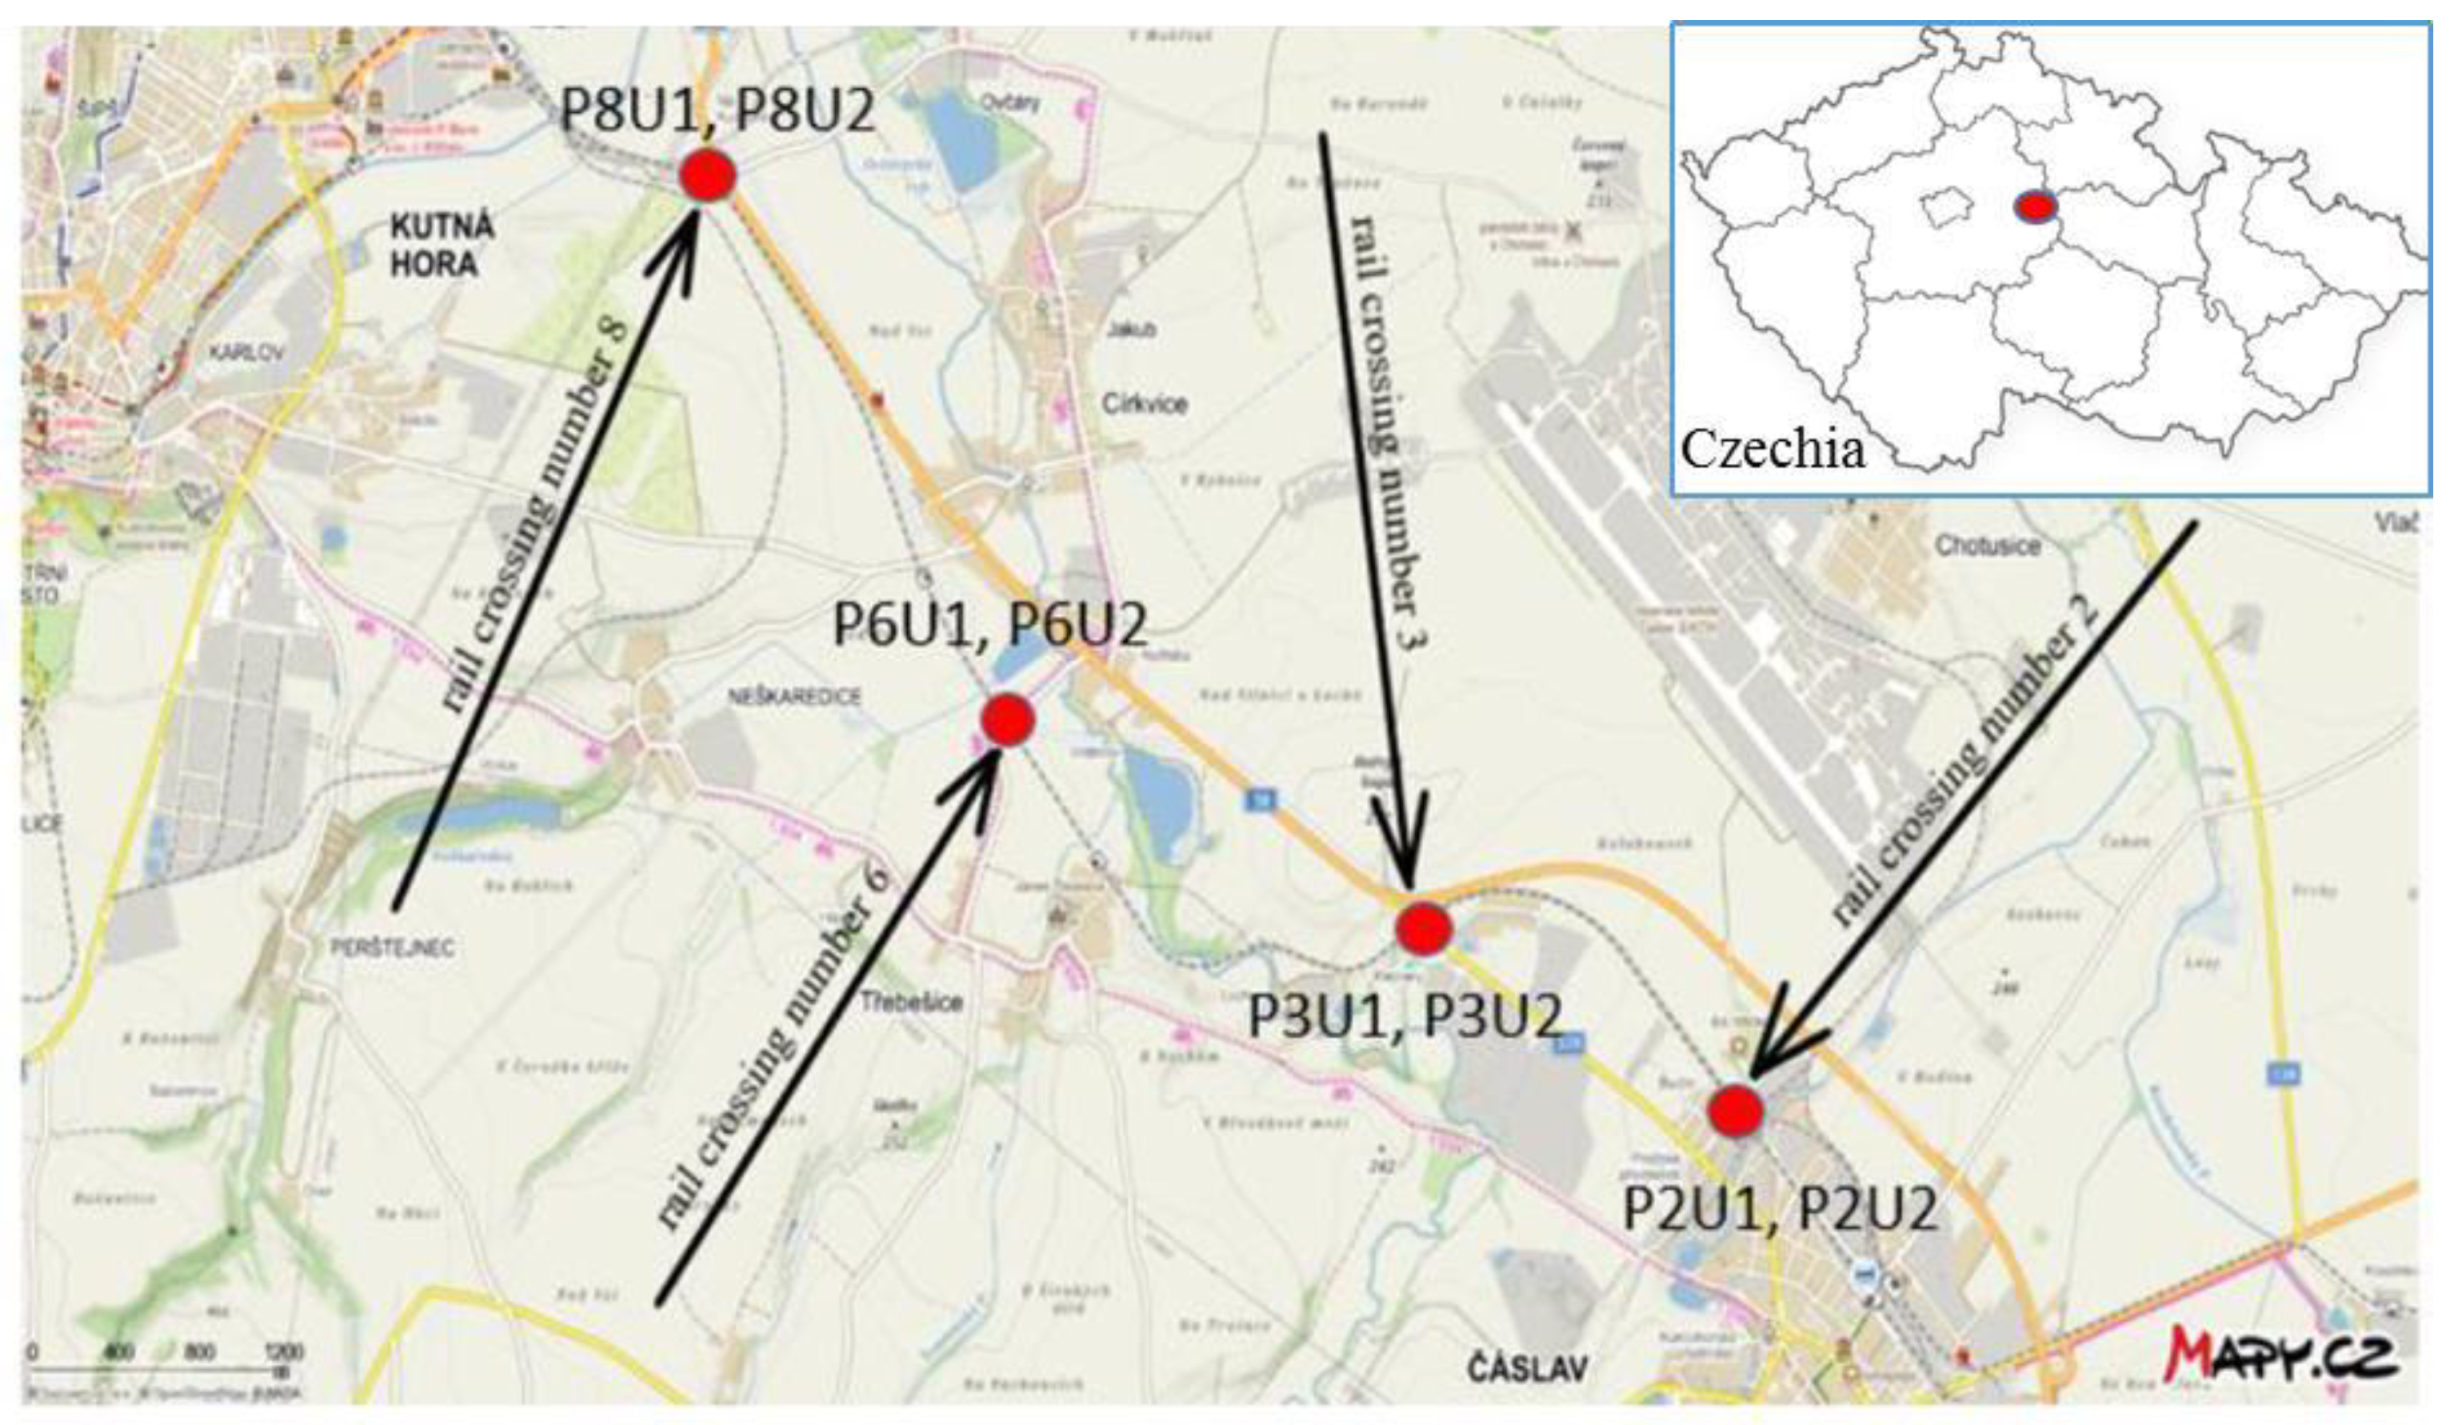
2. Survey Site and Equipment Used

Due to the particular interest in the utilization of two types of ballast cleaners, the site of Čáslav to Kutná Hora railway section in Czechia, where the maintenance and reconstruction activities were planned, was selected in this study. The picked railway section is under operation for both passenger and freight trains with a double-track railway line with ballast aggregates made of granite. The mentioned railway section constitutes a portion of a cross-country track, which additionally serves for the European TEN-T (Trans-European Transport Networks) railway line within the global passenger and freight network with a design maximum track speed of 120 km/h. At the beginning of the reconstruction activities, R 65 and S 45 rails, which were encountered partially in the sections, were all altered with 60 E2 type rails. Existing SB8 and SB8P sleepers, which were laid 60 cm apart from one another, were controlled and retained. The fastening system of type K was observed, checked, and maintained in track. Although the design thickness of the ballast layer was 350 mm under the sleepers, 300 mm ballast layer thickness was observed in some of the portions of the surveyed railway track after opening test pits. However, as a result of the reconstruction activities, the ballast layer was adjusted to be constantly 350 mm thick beneath the sleepers. Eight railway track sections, each 50 m long, were surveyed close to the four level crossings set out in the railway line direction from Čáslav to Kutná Hora, numbered as P2 (km 279,223), P3 (km 281,182), P6 (km 283,747), and P8 (km 286,468). All of these eight sections under investigation were situated in proximity and on both sides of the mentioned level crossings, as depicted in Figure 2. Table 2 provides the mileage of these sections.
The RM 79 ballast cleaner/undercutter unit covered reconstruction and maintenance interventions at P2 and P3 sections, whereas the RM 900 unit was utilized in the reconstruction activities at P6 and P8 sections.
In 2014 and 2017, GPR data were obtained with GSSI systems. For all 2018 GPR surveys described in this study, the RIS Hi-Pave GPR system developed by IDS GeoRadar company was used. A manual GPR survey trolley, with polyamide wheels and the skeleton made of glass-fiber reinforced plastic square profiles, was employed. Two types of GPR antennas were used in the surveys; (i) 2 GHz Horn air-coupled antenna (HN-2000) and (ii) 400/900 MHz dual-frequency ground-coupled antenna (TR DUAL-F 400/900). As per data acquisition, K2 Fast Wave software from IDS was operated, whereas ReflexW software was exploited for GPR signal processing and data interpretation. Figure 3 displays the GPR assembly along with the antennas and the auxiliary equipment used in the surveys.

3. Track Surveys, Laboratory Tests, and GPR Data Processing

The present study covered both field and laboratory tests. The GPR field surveys were adjusted according to the timetable of the rehabilitation activities in the construction site. The start and end points of the abovementioned sections (Figure 2 and Table 2) were determined by spraying a dye of recognizable color either on the rails or the sleepers. A digital measuring wheel was used to measure distances. Moreover, in order to distinguish the start and end points of the sections in the GPR data, aluminum foil pieces were placed in these positions. All laboratory tests were performed in the Educational and Research Centre in Transport (University of Pardubice).

3.1. In Situ GPR Surveys

GPR data for the first two stages were obtained in 2014 and 2017 by the state railway administrator Správa železniční dopravní cesty (SŽDC) and they were processed and interpreted to reveal the conditions of the railway track sections. Following GPR surveys undertaken in 2018 represent three more stages to compare the ballast layer status before and after the maintenance intervention works. At first, GPR data were collected from all the sections before any reconstruction activities were initiated. Then, the surveys were performed just after the ballast cleaning process, prior to the tamping and fixing of other geometric parameters. Finally, the ultimate conditions of all sections were surveyed when all the reconstruction activities were completed in all of the sections. During the GPR surveys (in 2018) and over 14 days prior to them, no precipitation was recorded in the site, and the temperature was changing from 20 to 25 °C. All these stages were numbered from 1 to 5 below:
  • Surveys undertaken by SŽDC in 2014
  • Surveys undertaken by SŽDC in 2017
  • Surveys carried out before any reconstruction activities began (12 October 2018)
  • Surveys carried out just after the ballast cleaning process (17 October 2018)
  • Surveys carried out in the final state after all the reconstruction activities were completed (19 October 2018)
Particular phases of the surveyed track sections are depicted in Figure 4.
Data collection and configuration parameters were set in K2 Fast Wave software. Calibration of the odometer was also performed to precisely record the length of the surveyed track and to control the trace-interval distance, which was undertaken by going through a reference line of a known distance.
As per the GPR data from the SŽDC surveys (Stage 1 in 2014 and Stage 2 in 2017), profiles (B-scans) were extracted for all the eight sections from the continuous radargrams collected then. In all three stages of measurements performed in 2018 (i.e., stages 3, 4, and 5), for each one of the eight survey sections, one profile (B-scan) through the center of the track axis was collected. GPR antenna configurations and survey advancing directions were decided with respect to the selected coordinate system. Then, for each frequency of antennas, time windows, i.e., time axis ranges were picked. The estimated EMWV (cm/ns) value in the surveyed material was then entered as an initial input. Dependent on this value, the maximum thickness of the ballast layer, from where the reflected pulse could be recorded, was computed preliminarily using Equation (2). The number of samples per trace was set to 512 and 1024. Time window values were selected as 20 and 60 ns, respectively, for 2 GHz air-coupled antenna and for ground-coupled dual frequency antenna (400/900 MHz). Horizontal spacing of 0.02 m was selected for the surveys. In the SŽDC surveys, the step between traces was set to 0.25 and 1 m, respectively, in 2014 and 2017.
As an essential calibration base for GPR data processing, the existing thickness of the ballast layer under the sleepers was measured to compute the RDP values and hence the EMWV values. In this respect, two test pit locations were selected where the ballast condition was expected to be most representative for the track sections under investigation. The first in the P6U1 section was opened by an excavator, whereas the second trench was dug conventionally in the P2U2 section. Both of the test-pits are shown in Figure 5. The extracted material from the trenches has been properly marked and taken to the laboratories for relevant tests.
For the sake of clarity, the survey profiles in all of the sections were always executed in the advancing stationing direction. For each section, GPR data were collected using two different configurations of the air-coupled antenna. First, the longitudinal configuration (long axis of the antenna parallel to track axis) was used to practically determine the sleepers, which partially mask the reflections from the bottom of the ballast layer. Then, the air-coupled antenna was positioned diagonally to diminish the impact of the reinforced concrete sleepers on the GPR signal and to enhance the perceivability of the reflected signals from the ballast bottom interface. For the ground-coupled antenna, orientation was the same for all surveys.

3.2. Laboratory Tests

Two sets of tests were conducted on the collected field ballast aggregates: i) percentage of fouling and ii) gradation test of fouling material.
Sample #1
The first sample was extracted from section P6U1, where it was supposed to be most representative for the ballast condition in the second half of the reconstructed railway track sections. For this, 92.140 kg of material was taken from this test-pit, where Table 3 presents the weight of coarse material and finer fouling material, which were distinguished using a caliper.
By proportioning the weight of fouling material (grain size less than 31.5 mm) with the total material weight, the percentage of fouling according to Equation (4) was found as 14%.
Percentage of fouling = wfine /wtotal,
where wfine and wtotal, stand, respectively, for the weight of fine fouling material and the total weight of material.
Gradation test was carried out for fine material (finer than 31.5 mm) and quotients of 19.67 % and 1.21% were obtained, respectively, for the sieve sizes of 4.75 and 0.075 mm. Hence the fouling index was computed as 20.88% according to Equation (3), matching the fouled ballast category according to Selig and Waters [26].
Sample #2
The second sample was extracted from the opened trench in the P2U2 section, where water drain ditches were not observed, which brought forward the question of whether this area is anomalously contaminated owing to the inadequate draining of water from the sections. From this test-pit, 47,331 kg of material was collected, where the weights of coarse and finer fouling material are displayed in Table 4.
As a result of the calculation of the proportion of the weight of fouling material (grain size less than 31.5 mm) and the total weight of the material, the percentage of fouling (from Equation (4)) was obtained as 33.34%. This figure verifies the assumption with regard to the visual inspection that ballast cleaning is significantly required for this section because of the lacking water drain ditches.
Gradation tests were undertaken for fine material (size finer than 31.5 mm). Proportions of 39.92% and 2.57% were attained respectively, for the sieve sizes of 4.75 mm and 0.075 mm, yielding a fouling index of 42.49% (Equation (3)) which falls into the highly fouled ballast category according to Selig and Waters [26].
The gradation tests for fine materials were carried out thrice for sample #1 and sample #2. Average gradation curves can be seen in Figure 6 for both samples. Sieve opening sizes are marked in Figure 6 together with the input values (0.075 and 4.75 mm) for calculating the fouling index value by Selig and Waters [26].

3.3. GPR Data Processing

Raw data are monitored and interpreted according to the in situ visual observations and the ground truth data. An example of a preliminary interpretation is given in Figure 7.
In comparison with the air-coupled antennas, ground-coupled antennas, particularly, with low frequencies provide lower resolutions to determine surface and interface positions very precisely in twt axis, especially in the case of the fouled ballast layer which corresponds to Stage 3 (measurements on 12 October 2018).
RDP and thus EMWV computations were based on the known thickness values of the ballast layer where Equations (1) and (2) were used. In the present study, used data processing functions included low frequency removal (dewow), time-zero and antenna bumping corrections, gain function, band-pass filtering, background removal, and running average filters. Dewow function was used to remove masking impacts of intrinsic lower frequency content in each antenna [62]. Move start time and correct max phase functions in ReflexW were employed for air-coupled antenna, respectively, to provide a static correction in time direction and compensate antenna bumping to bring the surface reflection in a horizontal position. Additionally, the gain function (with varying parameters) frequency was employed depending on the attenuation features of the material under survey to magnify the reflections in order to compensate for possible damping or geometric spreading losses. A band-pass filtering (band pass Butterworth in ReflexW software) was utilized within 1.5 times of the central frequency [63] for each antenna in order to enhance the signal to noise ratio by cutting off the side bands to avoid noise resulting from encompassing environment and hereditary loss of the GPR signal [7]. Background removal tool was utilized to discharge background noise with the aim of raising the signal-to-noise ratio. In this regard, the aim was to eliminate temporarily consistent noise from the whole B-scan and enable the signals visible, which were previously covered by this noise. Running average tool was then used to visualize horizontal interfaces in a more emphasized manner removing the trace-based clutter. An example of the abovementioned data processing scheme is given in Figure 8 for section P8U1 at stage 3 (before cleaning) in diagonal orientation of 2 GHz antenna.
Table 5 present the post-processing parameters used for each nominal frequency of the antenna used in the surveys.
Near-field zone effect should be noted here in the case of ground-coupled antennas. This case happens owing to the powerful EM field within the vicinity of the antenna covering a radius of approximately 1.5 times the wavelength of the central frequency developed by EM energy transmitted from the surface of the antenna. This zone is larger in the case of ground-coupled antennas (since they usually operate with lower frequencies) than in the case of air-coupled antennas often operating with higher central frequencies. Therefore, surface reflection determination is more challenging in the case of ground-coupled antennas than the air-coupled one in this study and the differences in RDP values might stem from the near zone effect in the case of ground-coupled antennas.
A devoted data processing flow was used taking into account the intervals and the width of the sleepers to ensure that RDP computations would be made in the picked traces positioned precisely within the cribs, which would avoid the obstructive impacts of the reinforced concrete sleepers in the GPR signals. For this purpose, a text file was formed including the computed trace spacings corresponding to the start and the end points of each crib. Those trace spacings were identified in compliance with the monitored sleepers from the GPR radargrams, intervals, and the width of the sleepers. Then, this text file was incorporated into the abovementioned processing flow, which enabled to obtain RDP values only in the crib regions. Moreover, 228 traces were assessed in each phase, and RDP values were calculated.

4. Results

According to the preliminary visual inspection in section P2, substandard outcomes were anticipated because of the lacking water drainage utilities particularly in P2U2, hence the substandard status of the ballast layer was assumed. The computed values for the EMWV values were unexpectedly and relatively high, even in the stage before ballast cleaning. At this point, it might be presumed that, although there is a significant rate of finer size material (33.34%) obtained through the laboratory experiments (sample #2), there was not any moisture observed in the trackbed. It is obvious that as a result of the reconstruction/maintenance activities, the overall state of the railway substructure was enhanced, which is supported by the RDP/EMVW values in Figure 9. Particularly between phases 3 and 5, EMWV values raised by 19.3% and 34.4% in the P2U1 and P2U2 sections, respectively.
A generally decent state of the ballast layer was foreseen in the P3 section, which was affirmed both by the SŽDC surveys (phases 1 and 2) and all 2018 surveys (phases 3, 4, and 5). The drainage utilities were working properly. Obviously, as a result of the intervention activities, enhancement can be observed in the substructure also displayed in Figure 10. Specifically, between phases 3 and 5, the EMWV values increased by 24.1% and 21.6% in the P3U1 and P3U2 sections, respectively.
The P6 section was identified by the existence of bothersome vegetation (particularly in P6U1), revealing a high trapped moisture ratio in the railway infrastructure. This situation might stem from a handful of reasons such as substandard draining of the railway substructure, the existence of swampy spots, and/or the water existing beneath the substructure. Despite the percentage of fines obtained by laboratory experiments in this section (14%) is lower than the one found in section P2 (33.34%), water existed in the trackbed apparently, as also verified by the EMWV/RDP values collected by GPR before the ballast cleaning process. This situation was also affirmed by the distinctive reflections at deeper points at P6U1, which may result from the existing aquifer areas. It is evident that as a result of the mechanized ballast cleaning action coupled with other reconstruction/maintenance activities, the ballast layer state is upgraded, which might also be seen in Figure 11. EMWV values raised by 34.4% and 20.3% in the P6U1 and P6U2 sections, respectively, in comparison of the phases between 3 and 5. It is also worth mentioning the abnormal pattern from phases 3 to 5. More explicitly, in phase 4, a higher EMWV value was found than the one in phase 5. It is probable that the combined utilization of the RM 900 VB ballast cleaner/undercutter and Unimat 08-275/3S tamping machine contributed to a hoed ballast layer (thus the bulk density was decreased). It is also significant to consider the precise timing of GPR data collection (as to the point that if the survey occurred just after ballast cleaning or during tamping operation cycles).
There was also unwanted vegetation in section P8, similar to section P6 (yet, to a lower extent). Obviously, mechanized ballast cleaning and reconstruction activities led to an improvement in the trackbed condition as can be also followed in Figure 12. EMWV values raised by 11.6% and 39.6% in the P8U1 and P8U2 sections, respectively, between survey stages of 3 and 5. Such high improvement in the case of P8U2 section might be associated with the drainage of water achieved by cleaning process.
There were no meaningful variations at P2 and P3 between the survey phases of 1, 2, and 3, however, more obvious changes at P6 and P8 were observed. This may occur because of the presumed higher moisture content at P6 and P8—where the different GPR signal attenuation based on the antenna frequency should be considered. Variations noticed between the GPR survey phases 3 (prior to ballast cleaning) and 5 (final state) match with and even surpass the values in the literature, which might occur due to GPR data collection in the final phase immediately after the completion of the mechanized ballast cleaning operation. Data from the survey stage 4 provide complementary values to characterize the ballast cleaning process since all reconstruction activities at this stage include an enormous number of non-measurable cycles in the track infrastructure (recurring vertical alignment variation and supply of new ballast material while tamping process was being undertaken). Due to the ongoing reconstruction/maintenance activities, no entrance was allowed into the P8 section during phase 4.
The condition of the ballast layer was upgraded in all of the sections. The most noteworthy enhancement was found in the P8U2 section, whereas the least improvement was observed in the P8U1 section. This might be because of the existing water before ballast cleaning process in both sections of P8. However, in addition to the standard new ballast material, the leftover/residual material (finer and broken-down material from the bottom of the wagon) was also spilled into the track after cleaning in section P8U1 particularly. This resulted in an unmanageable fraction fill and a higher extent of dust particles, which was clearly monitored visually in situ. Significant improvements were also observed in the P2U2 section, where higher preliminary ballast fouling was visually detected, compared to P2U1. An analogy can be recognized between P6U1 and P6U2 sections, where the existence of water in these sections was recorded (greater in P6U1 than in P6U2).
Differences between the values measured by SŽDC (phase #1 in 2014 and #2 in 2017) and 2018 surveys (from #3 to #5) occurred potentially by dissimilar antenna criteria from variant GPR providers. Any information regarding ballast layer interventions and reconstruction activities was not found between 2014 and 2018 in the surveyed tracks. Obviously, in phases 4 and 5, the EMWV values are significantly different from phase #3, which endorses the eligibility of the mechanized ballast layer cleaning process. In general, the aggregate features of the ballast layer were homogenized and enhanced in the maintained section. The percentage improvement values in EMWV values between phases 3 and 5 for each section are indicated in Table 6 (EMWV values are rounded up to three decimal places in Table 6). An average value of 25.7 % improvement in EMWV values has been achieved using the conventional intervention methods of mechanized ballast cleaning (Table 6).
Changes in EMWV values in each section corresponding to GPR survey phases 1, 3, 5 are displayed in Figure 13.

5. Discussion

Based on in situ observations and laboratory tests of the materials taken from the site, and the values published for that particular type of ballast (granite) in various studies [31,32,33,34,51,52], authors suggest fouling categories based on RDP/EMWV intervals in Table 7. It should be noted that the suggested values apply solely to the local conditions of railway track sections surveyed in the present study and the parameters (frequency and orientation) of used GPR equipment.
There did not exist any critical variations or patterns between the RDP/EMWV values of the longitudinal and the diagonal arrangement of the air-coupled antenna during GPR surveys. However, GPR data obtained from both orientations were utilized for confirming one another and analyzing the locations of the identified interfaces and sleepers, which was the preliminary intention for using various orientations. The comparison and evaluation of the variations in the evaluated indicators were first undertaken in each section independently for each survey stage, and then, all of the sections were analyzed in comparison with one another.
During the GPR surveys, three central frequencies were used (400 MHz, 900 MHz, and 2 GHz) for comparison of collected data. All computed RDP values are tabulated in Table 8 for every section and survey stage, where the variations according to frequencies and antennas can be clearly observed. Even though the RDP values calculated with the GPR data collected with various antennas and frequencies were different, no direct reliance of RDP/EMWV values on central frequency was found. Therefore, the figures (Figure 9, Figure 10, Figure 11, Figure 12, and Figure 13) display the mean values of RDP and EMWV for the frequencies used in the survey stages 3, 4, and 5.
A synopsis might be formulated with regards to the article's aim, i.e., what is required to be figured out consecutively in the evaluation of the railway ballast layer states using time-domain GPR analysis.
  • Determination of GPR survey conditions, equipment criteria, and settings,
  • Determination of a data processing flow on the basis of step 1, (time-domain),
  • Computation of RDP/EMWV values on the basis of steps 1 and 2, (time-domain),
  • Selecting the standard fouling indicator(s) for ballast material(s) and setting its threshold
  • Comparison/correlation of RDP/EMWV values from step 3 and standard fouling indicator from step 4,
  • Decision-making as to when/whether the mechanized ballast cleaning intervention should be initiated.
It should be examined whether the existence of water or fouling material is the reason for the increasing RDP values. When the cause of the rising RDP values is water content, then it is better to investigate that if it is a temporary case (e.g., due to a recent rain) or a permanent one caused by draining incapability, etc. As a rule of thumb, GPR surveys are not suggested to be undertaken in moist circumstances.

6. Conclusions

This paper presented the condition monitoring of the railway granite ballast layer and identifying the variation of the degree of fouling by Ground Penetrating Radar (GPR) technique prior to and following the mechanical ballast cleaning process in a real railway line portion.
GPR surveys were undertaken in eight track sections with a total length of 400 m (each 50 m) within the Čáslav-Kutná Hora railway track, using two types of antennas with three dissimilar central frequencies and two different antenna orientations. GPR surveys were performed thrice for each section at different stages of the lifecycle of the railway track, specifically, prior to and following the mechanized cleaning activity of the ballast layer. The time-domain analyses for recorded data in 2018 (phases #3, #4, and #5) and data obtained from Správa železniční dopravní cesty (phase #1 in 2014, and phase #2 in 2017) were performed. For the calibration, ground truth data were used.
Changes in relative dielectric permittivity (RDP) values between GPR investigation phases 3 (prior to mechanized ballast cleaning) and 5 (final state), which are similar or even greater than the ones in the literature (10–30%), were observed. This occurrence might stem from the fact that the GPR survey was carried out in the final phase immediately after the ballast cleaning process. An average value of 25.7% improvement in EMWV values, which has been measured by GPR surveys, has been achieved using the conventional intervention methods of mechanized ballast cleaning. In the laboratory, percentage of fouling and the gradation tests for fine material distribution were conducted, and the fouling index was calculated. In view of the comparison between laboratory experiments and GPR field surveys, it can be confirmed that the existence of trapped water within the ballast layer has a considerably greater effect in the rise of RDP values (and in the decrease in electromagnetic wave velocity (EMWV) values) compared to the case of ballast fouling by infiltration of fine particles only. However, it should be noted that those two phenomena are closely connected to each other.
On the basis of the GPR track surveys, laboratory experiments, and comparisons with published values of RDP/EMWV for that particular type of ballast (granite), the cleaning process could be, in the authors’ opinion, recommended launching approximately at the time when relevant indicators lie in the interval of highly fouled category suggested by authors in Table 7. It should be noted that the suggested values apply solely to the parameters of railway track sections surveyed and the parameters of used GPR equipment in the present study.
As a result, quantification of the influence of the mechanized ballast cleaning process on the condition of the railway ballast layer using GPR technology has been achieved for surveyed track sections. Improvement in the ballast layer status has been observed in all sections after the mechanized ballast cleaning process. Moreover, in situ RDP values of the granite ballast layer obtained in this study provide additional literature data for that particular type of ballast material.
Integration of several NDT methods (e.g., GPR and TDR) for assessment of railway infrastructure layers could task itself as a future work for a better understanding of the ballast fouling and moisture retention mechanisms through data fusion.
This research provides new perspectives into the decision-making process in initiating the mechanized ballast cleaning intervention based on the GPR-measured RDP/EMWV values obtained in different life cycles of a real track segment. The results from this study suggest that quantification of the efficiency of the mechanized ballast cleaning process can be non-destructively obtained through GPR measurements.

Author Contributions

Conceptualization, S.S.A. and V.B.; investigation, A.B., V.B., and F.Š.; data curation, S.S.A. and V.B.; writing—original draft preparation, A.B.; writing—review and editing, S.S.A. All authors have read and agreed to the published version of the manuscript.

Funding

The APC was funded by the project “International mobility of employees of the University of Pardubice II” with project number CZ.02.2.69/0.0/0.0/18_053/0016969.

Institutional Review Board Statement

Not applicable.

Informed Consent Statement

Not applicable.

Data Availability Statement

The data presented in this study are available on request from the corresponding author. The data are not publicly available due to the ongoing processing and examination for further interpretations and results with different analyzing methods.

Acknowledgments

All GPR surveys were conducted using the equipment of the Faculty of Transport Engineering, University of Pardubice. This paper is of interest to COST Action TU1208 Civil Engineering Applications of Ground Penetrating Radar. SŽDC has kindly provided GPR data from surveys held in 2014 and 2017 for the same track sections.

Conflicts of Interest

The authors declare no conflict of interest.

References

  1. Qian, Y.; Dersch, M.S.; Gao, Z.; Edwards, J.R. Railroad infrastructure 4.0: Development and application of an automatic ballast support condition assessment system. Transp. Geotech. 2019, 19, 19–34. [Google Scholar] [CrossRef]
  2. Tamrakar, P.; Azari, H.; Yuan, D.; Nazarian, S. Implementation of spectral analysis of surface waves approach for characterization of railway track substructures. Transp. Geotech. 2017, 12, 101–111. [Google Scholar] [CrossRef]
  3. Mvelase, G.M.; Gräbe, P.J.; Anochie-Boateng, J.K. The use of laser technology to investigate the effect of railway ballast roundness on shear strength. Transp. Geotech. 2017, 11, 97–106. [Google Scholar] [CrossRef]
  4. Schmidt, S.; Shah, S.; Moaveni, M.; Landry, B.J.; Tutumluer, E.; Basye, C.; Li, D. Railway Ballast Permeability and Cleaning Considerations. Transp. Res. Rec. 2017, 2607, 24–32. [Google Scholar] [CrossRef]
  5. Ižvolt, L.; Dobeš, P.; Mečár, M. Calibration of TDR Test Probes for Measuring Moisture Changes in the Construction Layers of the Railway Line. Procedia Eng. 2016, 161, 1057–1063. [Google Scholar] [CrossRef] [Green Version]
  6. Pieš, J.; Môcová, L. Application of TDR Test Probe for Determination of Moisture Changes of Railway Substructure Materials. Transp. Res. Proc. 2019, 40, 74–81. [Google Scholar] [CrossRef]
  7. Bianchini Ciampoli, L.; Calvi, A.; D’Amico, F. Railway ballast monitoring by GPR: A test site investigation. Rem Sens. 2019, 11, 2381. [Google Scholar] [CrossRef] [Green Version]
  8. Tosti, F.; Bianchini Ciampoli, L.; Calvi, A.; Alani, A.M.; Benedetto, A. An investigation into the railway ballast dielectric properties using different GPR antennas and frequency systems. NDT E Int. 2018, 93, 131–140. [Google Scholar] [CrossRef]
  9. Benedetto, A.; Pajewski, L. Civil Engineering Applications of Ground Penetrating Radar; Springer International Publishing: Cham, Germany, 2015. [Google Scholar] [CrossRef]
  10. Artagan, S.S.; Bianchini Ciampoli, L.; D’Amico, F.; Calvi, A.; Tosti, F. Non-destructive Assessment and Health Monitoring of Railway Infrastructures. Surv. Geophys. 2020, 41, 447–483. [Google Scholar] [CrossRef]
  11. Jack, R.; Jackson, P. Imaging attributes of railway track formation and ballast using ground probing radar. NDT E Int. 1999, 32, 457–462. [Google Scholar] [CrossRef]
  12. Gallagher, G.P.; Leiper, Q.; Williamson, R.; Clark, M.R.; Forde, M.C. The application of time domain ground penetrating radar to evaluate railway track ballast. NDT E Int. 1999, 32, 463–468. [Google Scholar] [CrossRef]
  13. Hugenschmidt, J. Railway track inspection using GPR. J. Appl. Geophys. 2000, 43, 147–155. [Google Scholar] [CrossRef]
  14. Hyslip, J.P.; Smith, S.S.; Olhoeft, G.R.; Selig, E.T. Assessment of railway track substructure condition using ground penetrating radar. In Proceedings of the 2003 annual conference of AREMA, Chicago, IL, USA, 5–8 October 2003. [Google Scholar]
  15. Alemu, A.Y. Survey of Railway Ballast Selection and Aspects of Modelling Techniques. Master’s Thesis, Royal Institute of Technology, Stockholm, Sweden, 2011. [Google Scholar]
  16. Anbazhagan, P.; Dixit, P.S.N.; Bharatha, T.P. Identification of Type and Degree of Railway Ballast Fouling Using Ground Coupled GPR Antennas. J. Appl. Geophys. 2016, 126, 183–190. [Google Scholar] [CrossRef]
  17. Misar, H. Criteria for cost-effective ballast cleaning: Machine design considerations. Rail. Eng. Int. 2005, 4. [Google Scholar]
  18. Schilling, R. Ballast cleaning of single-track railway lines: A strategic analysis. Rail. Eng. Int. 2005, 1, 8–12. [Google Scholar]
  19. Korolev, V.; Loktev, A.; Shishkina, I.; Zapolnova, E.; Kuskov, V.; Basovsky, D.; Aktisova, O. Technology of crushed stone ballast cleaning. IOP Conf. Ser. Earth Environ. Sci. 2019, 403, 012194. [Google Scholar] [CrossRef]
  20. Tzanakakis, K. The Railway Track and Its Long Term Behavior: A Handbook for a Railway Track of High Quality. Springer Tracts on Transportation and Traffic; Springer: Berlin/Heidelberg, Germany, 2013. [Google Scholar]
  21. Annan, A.P.; Davis, J.L. Ground penetrating radar—Coming of age at last‼. In Geophysics and Geochemistry at the Millennium; GEO F/X: Johnsburg, IL, USA, 1997; pp. 515–522. [Google Scholar]
  22. Jol, H. Ground Penetrating Radar Theory and Applications, 1st ed.; Elsevier: Amsterdam, The Netherlands, 2018. [Google Scholar]
  23. Grote, K.; Hubbard, S.; Harvey, J.; Rubin, Y. Evaluation of infiltration in layered pavements using surface GPR reflection techniques. J. Appl. Geophys. 2005, 57, 125–129. [Google Scholar] [CrossRef]
  24. Daniels, D.J. Ground penetrating Radar, 2nd ed.; The Institution of Electrical Engineers: London, UK, 2004. [Google Scholar]
  25. Artagan, S.S. Use of Ground Penetrating Radar in Condition Assessment of Railway Ballast. Ph.D. Thesis, Univesity of Pardubice, Pardubice, Czechia, 2018. [Google Scholar]
  26. Selig, E.T.; Waters, J.M. Track Geotechnology and Substructure Management; Thomas Telford Publications: London, UK, 1994. [Google Scholar]
  27. Foun, D. Planning ballast cleaning using ballast fouling levels determined with ground-penetrating radar online. In Proceedings of the CORE 2012: Global Perspectives; Conference on railway engineering, Brisbane, Australia, 10–12 September 2012; pp. 697–705. [Google Scholar]
  28. Anbazhagan, P. Characterization of Rail Track Ballast Fouling Using Ground Penetration Radar and Field Sampling. Project Report; Indian Institute of Science: Bangalore, India, 2013. [Google Scholar]
  29. Fontul, S.; Fortunato, E.; Chiara, F.D. Evaluation of ballast fouling using GPR. In Proceedings of the 15th International Conference on Ground Penetrating Radar, Brussels, Belgium, 30 June–4 July 2014; ISBN 978-14-799-6789-6. [Google Scholar] [CrossRef]
  30. Lalagüe, A. Use of Ground Penetrating Radar for Transportation Infrastructure Maintenance. Ph.D. Thesis, Norwegian University of Science and Technology, Trondheim, Norway, 2015. [Google Scholar]
  31. Clark, M.R. Electromagnetic properties of railway ballast. NDT E Int. 2001, 34, 305–311. [Google Scholar] [CrossRef]
  32. Sussmann, T.R. Application of Ground Penetrating Radar to Railway Track Substructure Maintenance Management. Ph.D. Thesis, University of Massachusett–Amherst, Amherts, MA, USA, 1999. [Google Scholar]
  33. Leng, Z.; Al-Qadi, I. Railroad Ballast Evaluation Using Ground-Penetrating Radar: Laboratory Investigation and Field Validation. Transp. Res. Rec. J. Transp. Res. Board. 2010. [CrossRef] [Green Version]
  34. Artagan, S.S.; Borecký, V. Advances in the nondestructive condition assessment of railway ballast: A focus on GPR. NDT E Int. 2020, 115, 102290. [Google Scholar] [CrossRef]
  35. Maturana, R.M.; Bautista, B.D.; Aguacil, Á.A.; Plaza, M.R.; Castaño, S.S. Preventive Maintenance of Railway Infrastructures using GPR–Ground Penetrating Radar. In Proceedings of the 9th World Congress on Railway Research, Lille, France, 22–26 May 2011. [Google Scholar]
  36. Roberts, R.; Al-Qadi, I.L.; Tutumluer, E.; Kathage, A. Ballast fouling assessment using 2 GHz horn antennas-GPR and ground truth comparison from 238 km of track. In Proceedings of the 9th International Railway Engineering Conference, London, UK, 1 June 2007. [Google Scholar]
  37. Roberts, R.; Rudy, J.; GSSI, S. Railroad ballast fouling detection using ground penetrating radar. A new approach based on scattering from voids. In Proceedings of the 9th European Conference on NDT, Berlin, Germany, 25–29 September 2006. ECNDT 2006–Th. 4.5 1.. [Google Scholar]
  38. Al-Qadi, I.L.; Xie, W.; Roberts, R. Scattering analysis of ground-penetrating radar data to quantify railroad ballast contamination. NDT E Int. 2008, 41, 441–447. [Google Scholar] [CrossRef]
  39. Su, L.-J.; Rujikiatkamjorn, C.; Indraratna, B. An Evaluation of Fouled Ballast in a Laboratory Model Track Using Ground Penetrating Radar. Geotech. Test. J. 2010, 33, 103045. [Google Scholar] [CrossRef]
  40. Al-Qadi, I.L.; Xie, W.; Roberts, R.; Leng, Z. Data analysis techniques for GPR used for assessing railroad ballast in high radio-frequency environment. J. Transp. Eng. 2010, 136, 392–399. [Google Scholar] [CrossRef]
  41. De Bold, R.P. Non-Destructive Evaluation of Railway Trackbed Ballast. Ph.D. Thesis, University of Edinburgh, School of Engineering, Glasgow, Scotland, 2011. [Google Scholar]
  42. Zhang, Q.; Gascoyne, J.; Eriksen, A. Characterisation of ballast materials in trackbed using ground penetrating radar: Part 1. In Proceedings of the Railway Condition Monitoring and Non-Destructive Testing, 2011, (RCM 2011), 5th IET Conference On. IET, Kuala Lumpur, Malaysia, 5–6 September 2018; pp. 1–8. [Google Scholar]
  43. Anbazhagan, P.; Lijun, S.; Buddhima, I.; Cholachat, R. Model track studies on fouled ballast using ground penetrating radar and multichannel analysis of surface wave. J. Appl. Geophys. 2011, 74, 175–184. [Google Scholar] [CrossRef]
  44. De Chiara, F.; Fontul, S.; Fortunato, E. GPR Laboratory Tests for Railways Materials Dielectric Properties Assessment. Remote Sens. 2014, 6, 9712–9728. [Google Scholar] [CrossRef] [Green Version]
  45. Kashani, H.; Ho, C.L.; Oden, C.P.; Smith, S.S. Model Track Studies by Ground Penetrating Radar (GPR) on Ballast with Different Fouling and Geotechnical Properties. In Proceedings of the Joint Rail Conference ASME, San Jose, CA, USA, 23–26 March 2015. [Google Scholar] [CrossRef]
  46. Benedetto, A.; Tosti, F.; Bianchini Ciampoli, L.; Calvi, A.; Brancadoro, M.G. Alani, A.M. Railway ballast condition assessment using ground-penetrating radar—An experimental, numerical simulation and modelling development. Constr. Build. Mater. 2017, 140, 508–520. [Google Scholar] [CrossRef]
  47. Kashani, H. Evaluating the Influence of Breakdown Fouling and Moisture Content on Mechanical and Electromagnetic Properties of Ballasted Railroad Track. Ph.D. Thesis, University of Massachusett–Amherst, Amherst, MA, USA, 2017. [Google Scholar]
  48. Fontul, S.; Paixão, A.; Solla, M.; Pajewski, L. Railway Track Condition Assessment at Network Level by Frequency Domain Analysis of GPR Data. Remote Sens. 2018, 10, 599. [Google Scholar] [CrossRef] [Green Version]
  49. Barrett, B.E.; Day, H.; Gascoyne, J.; Eriksen, A. Understanding the capabilities of GPR for the measurement of ballast fouling conditions. J. Appl. Geophys. 2019, 169, 183–198. [Google Scholar] [CrossRef]
  50. Keogh, T.; Mesher, D.E.; Keegan, T.R. An Integrated System for Accurate Tie and Ballast Condition Assessment; Rail Radar ™ Inc; Canadian National Railway: Alberta, Canada, 2006. [Google Scholar]
  51. Sussmann, T.R.; O’Hara, K.R.; Selig, E.T. Development of material properties for railway application of ground-penetrating radar. In Proceedings of the Resented at the Ninth International Conference on Ground Penetrating Radar (GPR2002), Santa Barbara, CA, USA, 29 April–2 May 2002; pp. 42–47. [Google Scholar] [CrossRef]
  52. Göbel, C.; Hellmann, R.; Petzold, H. Georadar-model and in-situ investigations for inspection of railway tracks. In Proceedings of the Fifth International Conferention on Ground Penetrating Radar, Kitchener, Canada, 12–16 June 1994. [Google Scholar]
  53. Artagan, S.S.; Borecký, V.; Bartoš, J.; Kurel, R. Moisture Influence on the GPR-Measured RDP Values of Granite Ballast under Clean and Fouled Conditions. In Proceedings of the 7th International Scientific Conference of the Faculty of Transport Engineering, Pardubice, Czech Republic, 6–7 September 2018. [Google Scholar]
  54. Benedetto, F.; Tosti, F.; Alani, A.M. An entropy-based analysis of GPR data for the assessment of railway ballast conditions. IEEE Trans. Geosci. Rem. Sens. 2017, 55, 3900–3908. [Google Scholar] [CrossRef]
  55. Bianchini Ciampoli, L.; Tosti, F.; Brancadoro, M.G.; D’Amico, F.; Alani, A.M.; Benedetto, A. A spectral analysis of ground-penetrating radar data for the assessment of the railway ballast geometric properties. NDT E Int. 2017, 90, 39–47. [Google Scholar] [CrossRef]
  56. Benedetto, A.; Bianchini Ciampoli, L.; Brancadoro, M.G.; Alani, A.M.; Tosti, F. A computer-aided model for the simulation of railway ballast by random sequential adsorption process. Comput. Aided. Civ. Infrastruct. Eng. 2018, 33, 243–257. [Google Scholar] [CrossRef]
  57. Fontul, S.; Mínguez, R.; Solla, M.; Santos-Assunção, S. The use of geophysics for the condition assessment of railway infrastructure. In Non-Destructive Techniques for the Evaluation of Structures and Infrastructure; Riveiro, B., Solla, M., Eds.; CRC Press: Boca Raton, FL, USA, 2016. [Google Scholar]
  58. Solla, M.; Pérez-Gracia, V.; Fontul, S. A Review of GPR Application on Transport Infrastructures: Troubleshooting and Best Practices. Remote Sens. 2021, 13, 672. [Google Scholar] [CrossRef]
  59. Ferrante, C.; Bianchini Ciampoli, L.; Benedetto, A.; Alani, A.M.; Tosti, F. Non-destructive Technologies for a Sustainable Assessment and Monitoring of Railway Infrastructures: A Focus on GPR and InSAR Methods. 2021. Available online: https://assets.researchsquare.com/files/rs-216510/v1_stamped.pdf (accessed on 1 March 2021).
  60. Khakiev, Z.; Shapovalov, V.; Kruglikov, A.; Yavna, V. GPR determination of physical parameters of railway structural layers. J. Appl. Geophys. 2014, 106, 139–145. [Google Scholar] [CrossRef]
  61. Khakiev, Z.; Shapovalov, V.; Kruglikov, A.; Morozov, A.; Yavna, V. Investigation of long term moisture changes in trackbeds using GPR. J. Appl. Geophys. 2014, 110, 1–4. [Google Scholar] [CrossRef]
  62. Bianchini Ciampoli, L.; Tosti, F.; Economou, N.; Benedetto, F. Signal Processing of GPR Data for Road Surveys. Geoscience 2019, 9, 96. [Google Scholar] [CrossRef] [Green Version]
  63. Bianchini Ciampoli, L.; Artagan, S.S.; Tosti, F.; Gagliardi, V.; Alani, A.M.; Benedetto, A. A comparative investigation of the effects of concrete sleepers on the GPR signal for the assessment of railway ballast. In Proceedings of the 17th international conference on ground penetrating radar (GPR2018), Rapperswil, Switzerland, 18–21 June 2018. [Google Scholar] [CrossRef]
Figure 1. Schematic presentation of air/ballast interface and ballast/bottom interface (from 2 GHz air-coupled antenna) (adapted from [25]).
Remotesensing 13 01510 g001
Figure 2. Surveyed railway level-crossings displayed on the map (mapy.cz overlay).
Remotesensing 13 01510 g002
Figure 3. Ground Penetrating Radar (GPR) trolley designed for the surveys (air-coupled antenna in diagonal orientation).
Remotesensing 13 01510 g003
Figure 4. Track condition (a) before (phase 3), (b) during, and (c) after construction activities (phase 5).
Remotesensing 13 01510 g004
Figure 5. Ground truth data (in sections P2U2 & P6U1).
Remotesensing 13 01510 g005
Figure 6. Gradation curves for the finer material extracted from the sections (a) P6U1 and (b) P2U2.
Remotesensing 13 01510 g006
Figure 7. Preliminary interpretation of raw data from 2 GHz air-coupled antenna for section P2U1 at stage 4 with longitudinal orientation (a) raw data (only dewow filter is applied) (b) initial interface picking based on in situ visual observations and the ground truth data.
Remotesensing 13 01510 g007
Figure 8. Data processing scheme for section P8U1 at stage 3 (before cleaning) in diagonal orientation of 2 GHz antenna: (a) raw GPR data, (b) dewow filter applied, (c) after move start time filter and after correct max phase applied, and (d) after band pass filter (Butterworth), background removal, gain, and running average processing steps.
Remotesensing 13 01510 g008
Figure 9. The change of Electromagnetic Wave Velocity (EMWV) and RDP values during the lifecycle of the railway track in section P2.
Remotesensing 13 01510 g009
Figure 10. The change of EMWV and RDP values during the lifecycle of the railway track in section P3.
Remotesensing 13 01510 g010
Figure 11. The change of EMWV and RDP values during the lifecycle of the railway track in section P6.
Remotesensing 13 01510 g011
Figure 12. The change of EMWV and RDP values during the lifecycle of the railway track in section P8.
Remotesensing 13 01510 g012
Figure 13. Comparison of each section for phases 1, 3, and 5.
Remotesensing 13 01510 g013
Table 1. Relative dielectric permittivity (RDP) values of granite railway ballast under several different conditions in published literature.
Ballast
Condition
References
Clark et al.
[31]
Sussmann
[32]
Leng and Al-Qadi
[33]
Artagan and Borecky
[34]
CleanDry clean3.003.603.253.09
Moist clean3.504.00 4.59
Saturated clean26.9026.40 25.50
FouledDry fouled4.303.703.773.85
Moist fouled7.805.10 5.21
Saturated fouled38.50
Table 2. Survey sections stationing and length.
Level CrossingSectionStart Mileage (km)End Mileage
(km)
Length (m)
P2U1279.150279.20050
U2279.250279.30050
P3U1281.100281.15050
U2281.200281.25050
P6U1283.675283,72550
U2283.775283.82550
P8U1286.400286.45050
U2286.500286.55050
Table 3. Total weight of ballast material categorized as fine and coarse material for sample #1.
Material FractionWeightPercentage
Coarse fraction 31.5–63 mm79.240 kg86%
Fine fraction < 31.5 mm12.900 kg14%
Total material92.140 kg100%
Table 4. Total weight of ballast material categorized as fine and coarse material for sample #2.
Material FractionWeightPercentage
Coarse fraction 31.5–63 mm31.551 kg66.66%
Fine fraction <31.5 mm15.780 kg33,34%
Total material47.331 kg100%
Table 5. Post-processing parameters used for different frequencies.
Post-processing Step Parameters According to the Nominal Frequency400 MHz900 MHz2000 MHz
Time-zero correctionAccording to the surface reflection twt
De-wow (ns)2.51.10.5
Correct max phase toolSurface reflection twt frame
Band-pass filtering
(Low pass–high pass in MHz)
100–700225–1575500–3500
Background removalWhole line/distance range
Running average (# of traces)333
Table 6. Percentual increase in Electromagnetic Wave Velocity (EMWV) values during the maintenance works between phase 3 and phase 5.
Track
Sections
EMWV before Ballast Cleaning
Phase #3 (cm/ns)
EMWV in the Final State
Phase #5 (cm/ns)
Percentage
Improvement
P2U10.1530.18219.3
P2U20.1420.19034.4
P3U10.1420.17724.1
P3U20.1480.18021.6
P6U10.1400.18834.4
P6U20.1500.18020.3
P8U10.1560.17511.6
P8U20.1520.21339.6
Average Improvement in all surveyed track sections25.7
Table 7. Suggested fouling intervals for granite railway ballast.
Fouling
Category
Interval for
EMWV (cm/ns)
Interval for
RDP
Clean 1≥16≤3.52
Slightly fouled 113–163.52–5.33
Highly fouled 19–135.33–11.11
Unrecommended for traffic 1<9>11
1 Colors represent the fouling categories based on RDP/EMWV values as they are also used in Table 8.
Table 8. RDP values of granite ballast layers for each section and survey phase (colors correspond to Table 7).
SECTIONS#1#2#3#4#5
SZDCSZDCRDP before
Cleaning Process
RDP after
Cleaning Process
RDP after Handing Over the Construction Site
23 September 201429 August 201712 October 201817 October 201819 October 2018
400 MHz GSSI400 MHz GSSI400 MHz IDS900 MHz IDS2 GHz IDS400 MHz IDS900 MHz IDS2 GHz IDS400 MHz IDS900 MHz IDS2 GHz IDS
P2U14.314.393.653.654.313.093.424.132.202.683.44
U24.314.394.924.344.263.093.794.421.802.883.10
P3U14.434.724.704.344.292.882.723.452.752.523.50
U24.434.723.854.264.292.933.362.962.722.573.11
P6U15.686.194.854.684.353.734.293.412.332.572.80
U26.685.633.314.434.432.562.822.232.273.372.82
P8U15.105.243.353.843.893.632.662.72
U25.245.563.733.983.911.992.041.94
Publisher’s Note: MDPI stays neutral with regard to jurisdictional claims in published maps and institutional affiliations.

