1. Introduction
In light of the increase in the global population, food security will be a significant concern in the next decades [
1]. This security can be enhanced by good decision support in crop management, and for that purpose, non-destructive imaging technologies are of key importance, especially when it comes to diagnosing in-season site-specific crop status [
2,
3,
4]. In this context, the most promising research area is precision agriculture that utilizes proximal and remote sensing technologies [
5]. In the last decade, remote sensing of crops changed significantly in two ways: (i) open access satellite data enabled the analysis of large multi-temporal data sets in spatial resolutions of at least 10 to 20 m [
6,
7] and (ii) progress in new data acquisition and analysis approaches were facilitated by the fast development of Unmanned Aerial Vehicles (UAVs) as sensor carrying platforms for RGB, multi- and hyperspectral, LiDAR, or thermal sensing systems [
8,
9,
10,
11,
12]. Studies on UAV-based sensing of crops have demonstrated the potential of such non-destructive approaches in determining crop traits [
13,
14,
15]. As shown in many studies since 2013, robust crop height data, which have a strong link to biomass, can be derived from stereo-photogrammetric and GIS analyses [
16,
17,
18].
A general problem is that estimation of nitrogen concentration (N
C) from spectral data over different plant constituents is only indirectly possible since N
C has no unique spectral features in the VNIR-SWIR range. According to Berger et al. [
19], most studies only use the VNIR (400 to 1000 nm) to determine crop traits, especially nitrogen, in relation to chlorophyll. However, this approach neglects the foliar biochemical contents, such as plant proteins, which have faint spectral components in the short-wave infrared (SWIR) and whose link to different crop traits has hardly been studied so far, leading Berger et al. [
19] to recommend including this domain explicitly. Likewise, Stroppiana et al. [
20] state that this wavelength range has the potential to reveal new approaches or indices for vegetation monitoring. Herrmann et al. [
21] attribute the under-exploration of this domain to traditional and to technical aspects. Those aspects have meant that expensive and heavyweight equipment, such as portable field-spectroradiometers or hyperspectral scanner systems on various airborne platforms, have been used so far. As a result of technological advances in recent years, however, these former shortcomings are increasingly being overcome, enabling new application scenarios. Exemplary in this context, Kandylakis et al. [
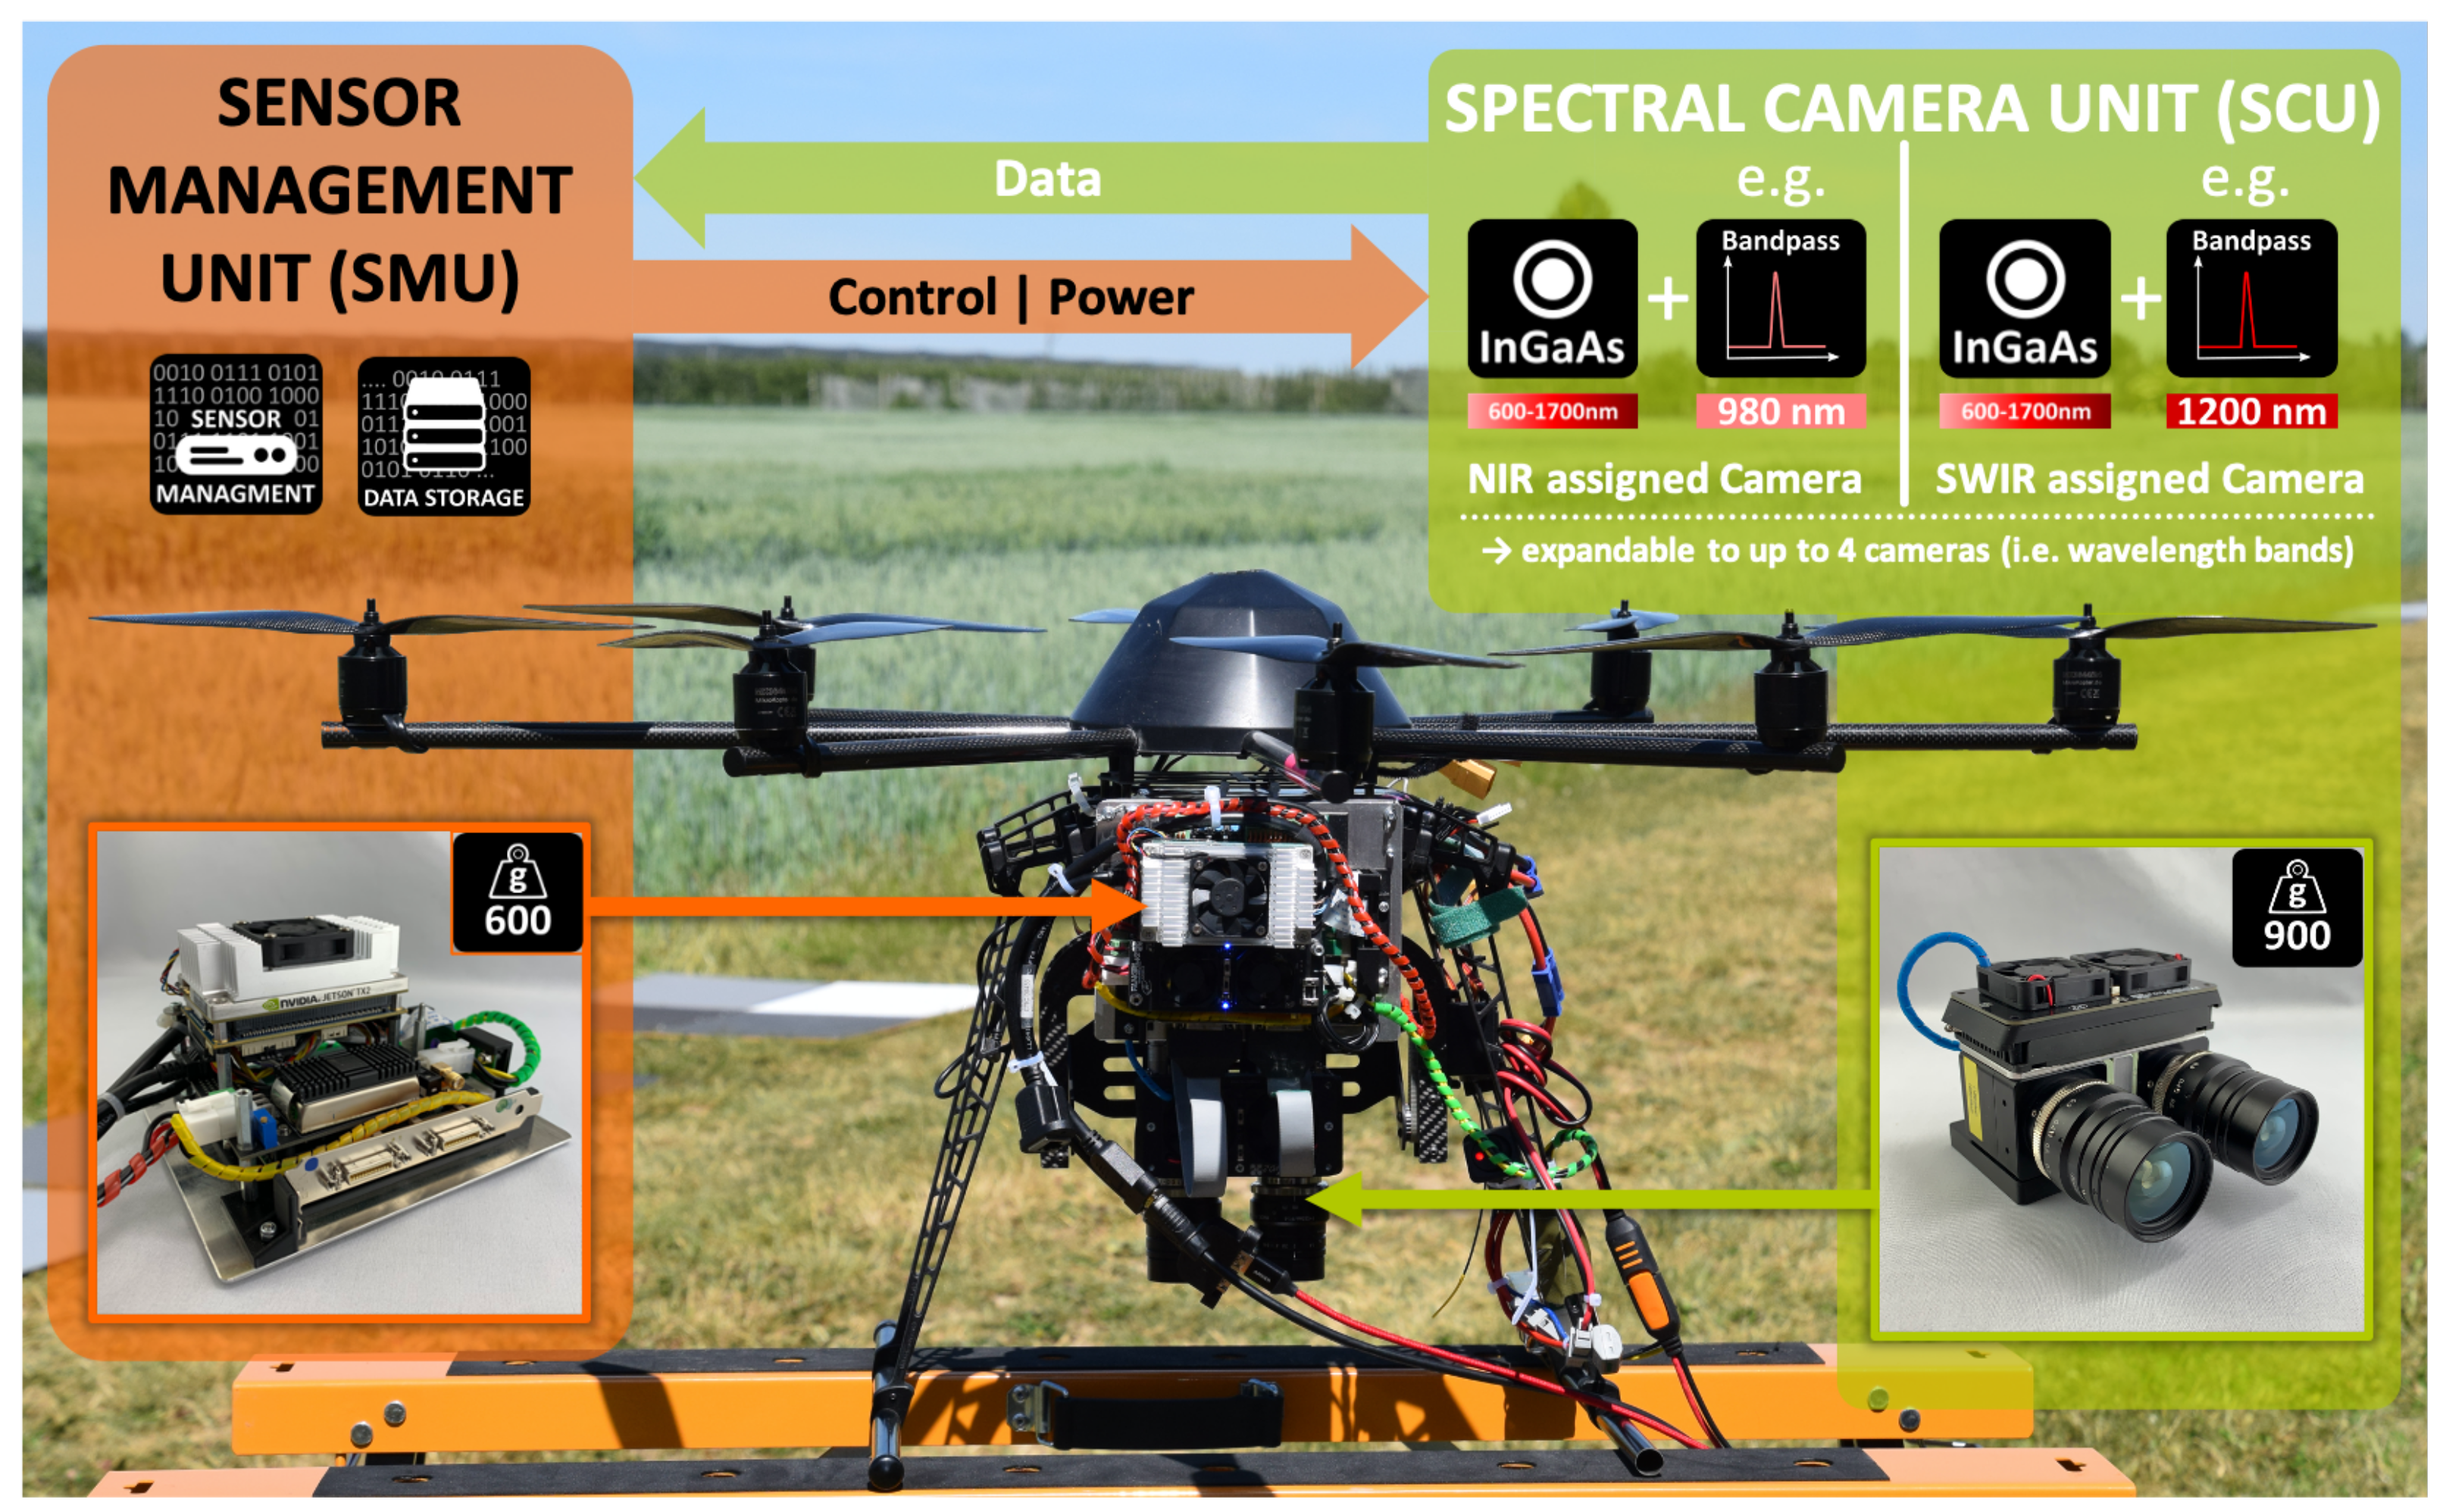
22] developed a methodology for estimating water stress in vineyards using the unfiltered spectral response (900 to 1700 nm) of a SWIR imager combined with a VNIR multispectral multi-camera system (Parrot Sequoia; Parrot Drone SAS, Paris, France) using a UAV. However, no multi-camera system based on VIS-enhanced InGaAs (600 to 1700 nm) cameras with application-specific applicable narrow-band bandpass filters appear to have been used.
Within the latest research activities on UAV-based monitoring of crops, Jenal et al. [
23] presented a new and unique sensing system for UAVs, a VNIR/SWIR imaging system that enables the acquisition of two filter-selectable wavelengths in the range of 600 to 1700 nm. This research’s primary motivation is driven by several publications indicating two- or four-band NIR/SWIR vegetation indices (VIs) as robust estimators for crop traits. To predict winter wheat biomass, Koppe et al. [
24] fitted the Normalized Ratio Index (NRI) to the best-performing wavelengths, 874 and 1225 nm, from hyperspectral satellite data. Gnyp et al. [
25] also investigated winter wheat introducing a four-band vegetation index (VI), the GnyLi. Bendig et al. [
9] and Tilly et al. [
26] evaluated the GnyLi on barley biomass data sets showing high R
2 and outperforming VNIR VIs. Camino et al. [
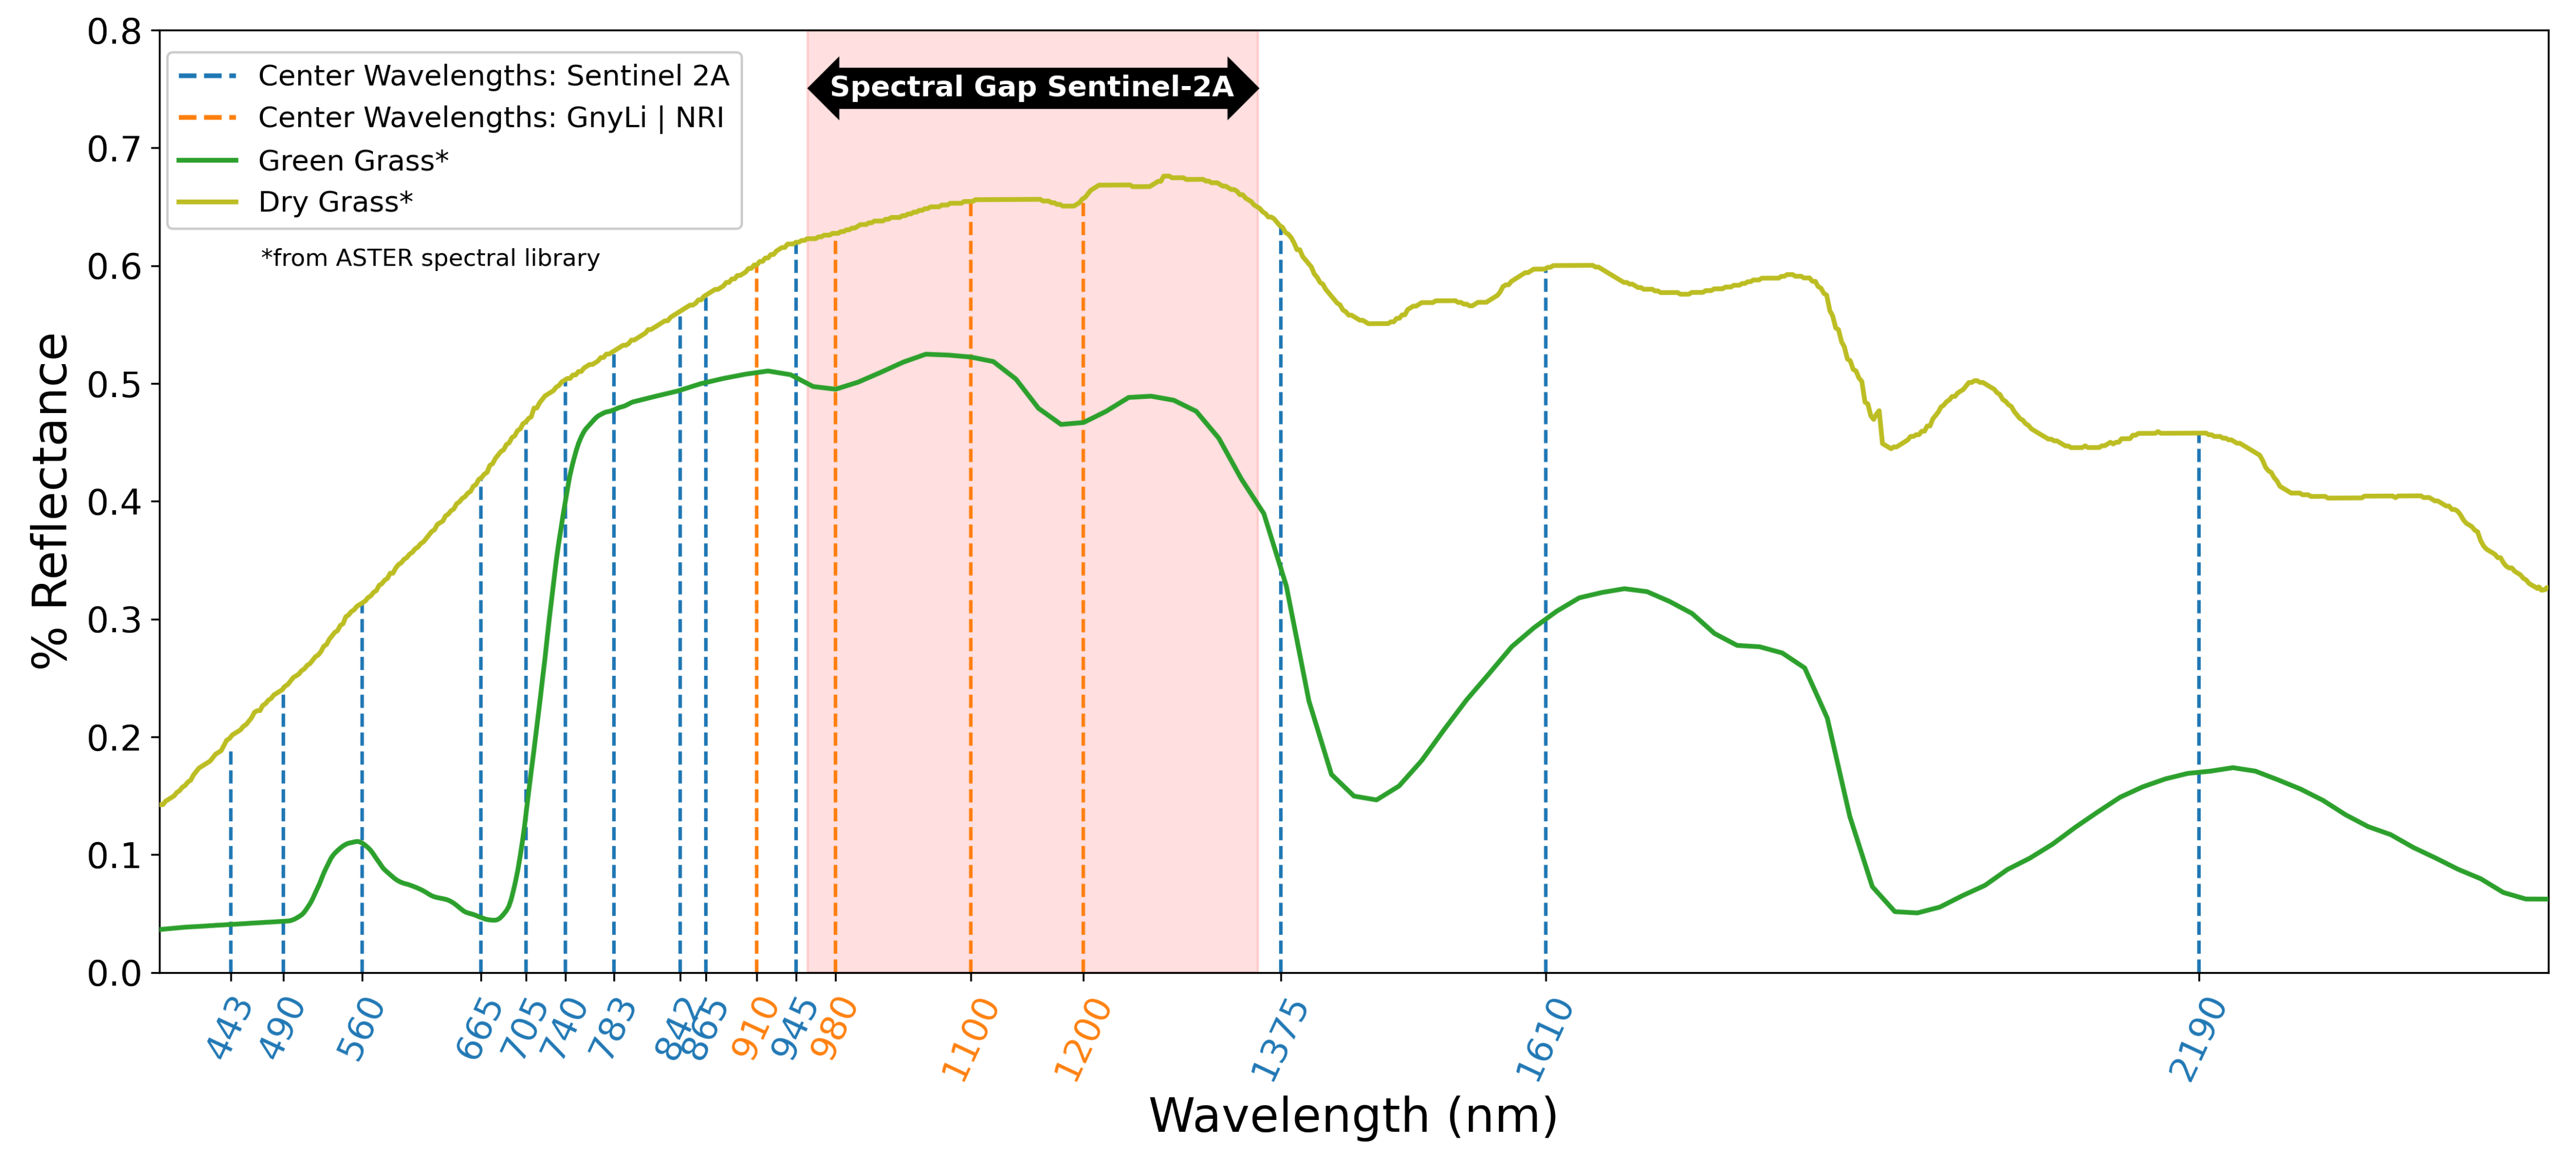
27] investigated VNIR/SWIR imaging for N retrieval in wheat and concluded that VIs centered at 1510 nm outperform chlorophyll and structural indices. While these wavelength bands have been successfully applied in field studies, they are not covered by comparable multispectral earth observation (EO) missions, such as Sentinel-2 (see
Figure 1). Three of the four selected wavebands in this study are located in the “spectral gap” from 955 and 1355 nm indicated in
Figure 1. This gap in the Sentinel spectral sensitivity might contribute to the low number of studies investigating the use of these wavelengths for precision agriculture.
According to Kumar et al. [
28], the vegetation compounds’ spectral characteristics are present in this segment and are of interest for further investigations. Absorption minima caused by canopy moisture, cellulose, starch, and lignin can be found at around 970 and 1200 nm [
28,
29,
30]. Reflectance maxima lie roughly at 910 and 1100 nm and are caused by components of protein content, lignin, and intercellular plant structures [
28,
29]. Roberts et al. [
30] provide a detailed review on VIs for retrieving data on vegetation structure, canopy biochemistry, e.g., pigments or moisture, or plant physiology.
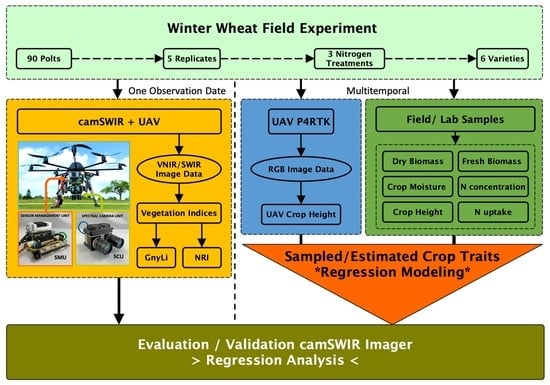
This study aims to evaluate and validate a novel VNIR/SWIR multi-camera system’s performance and potential to assess crop traits using a winter wheat field trial at the Campus Klein-Altendorf (North Rhine-Westphalia, Germany) as a case study. More specifically, the objectives are to (i) regress UAV-based and manually measured crop heights against ground truth data, (ii) apply resulting regression models to estimate crop traits (fresh and dry) biomass, crop moisture, NC, and N uptake, and (iii) evaluate and validate the relationship between NIR/SWIR-based vegetation indices and crop traits.
4. Discussion
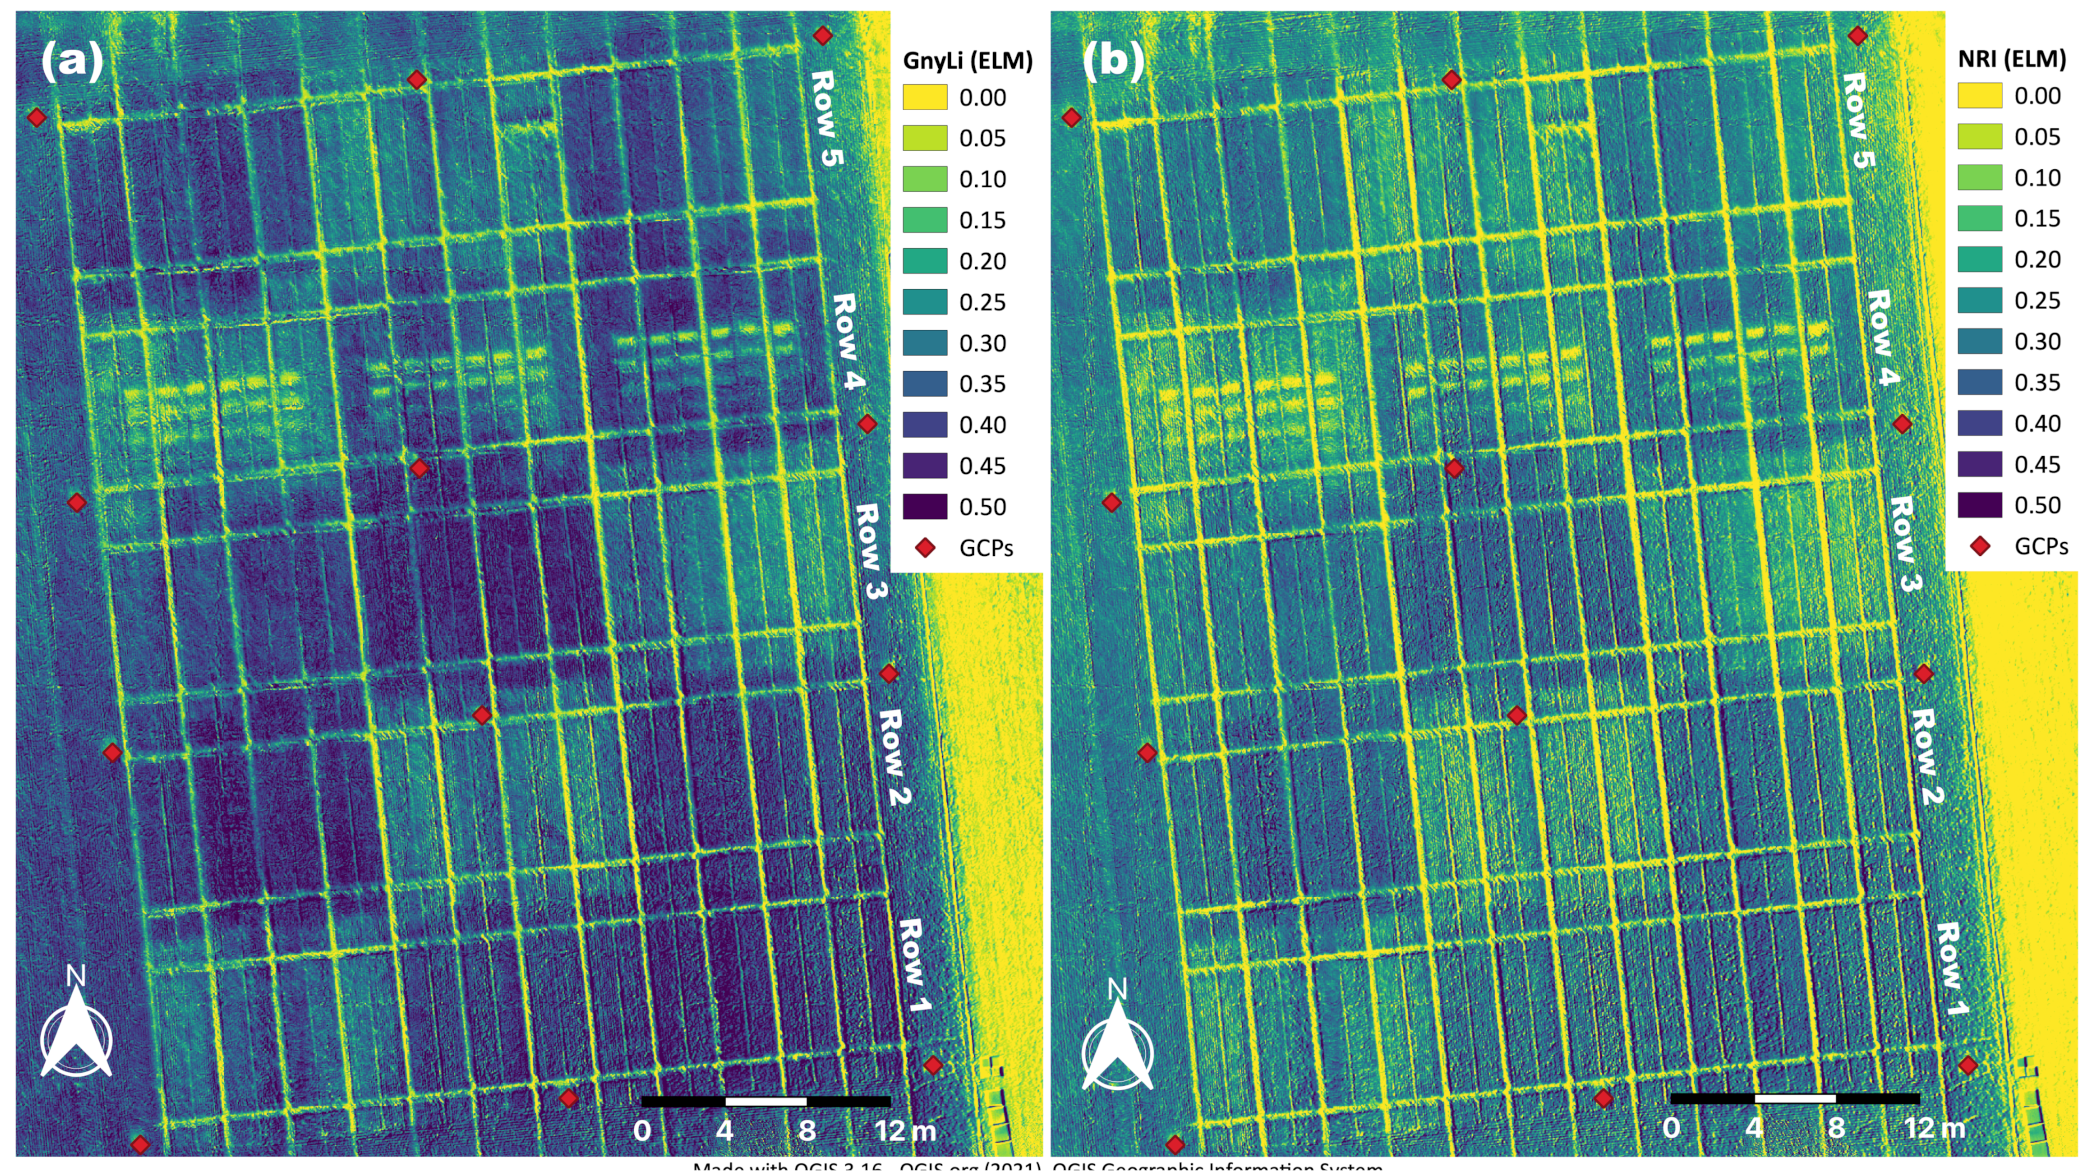
In this study, a newly developed VNIR/SWIR imaging system for UAVs, the camSWIR, is evaluated for crop trait monitoring of winter wheat. The focus is on two vegetation indices (VIs), the NRI [
24] and the GnyLi [
25], which used near and short-wave infrared (NIR/SWIR) wavelengths (see
Table 2). Previous studies showed that these indices outperformed VIs using bands from the visible and near-infrared (VIS/NIR) domain [
9,
24,
25,
26,
38,
56,
60]. Moreover, several authors indicate the SWIR domain’s potential for crop trait monitoring [
15,
19,
30,
61,
62,
63,
64].
The presented results in this case study for winter wheat demonstrate this new sensor’s potential to derive crop traits such as biomass, N
C, N uptake, and crop moisture. Although not typically used, these wavelengths’ potential for monitoring agricultural systems has also been shown in other studies. For example, Ceccato et al. [
65] indicate the SWIR domain’s potential to derive leaf water content. Honkavaara et al. [
66] indicate the same for monitoring surface moisture of a peat production area. Camino et al. [
27] demonstrated the advantage of the SWIR domain for retrieval of crop nitrogen. Finally, Psomas et al. [
67] and Koppe et al. [
24] proved the NIR/SWIR bands’ suitability for biomass monitoring in grasslands and winter wheat. The selection of the applied bandpass filters in this study represents a compromise due to availability and cost compared to the original studies by Koppe et al. [
24] and Gnyp et al. [
25], which used field spectroradiometer and hyperspectral satellite data. If available in future studies, narrower (< 10 nm), more wavelength-specific, bandpass filters should be used to investigate an effect on the estimation performance of the VIs with the wavelengths applied in [
24,
25]. In particular, when it comes to spectral features involving leaf chemicals such as proteins that also have an indirect link to N
C, using narrow-band filters with the appropriate center wavelengths [
29,
68] is crucial. Otherwise, when broader bandwidths are applied, this information about the fine spectral features is lost in the superimposed spectrum [
69]. Furthermore, water absorption has to be considered as it overlays all other features to a large extent in the SWIR domain [
64].
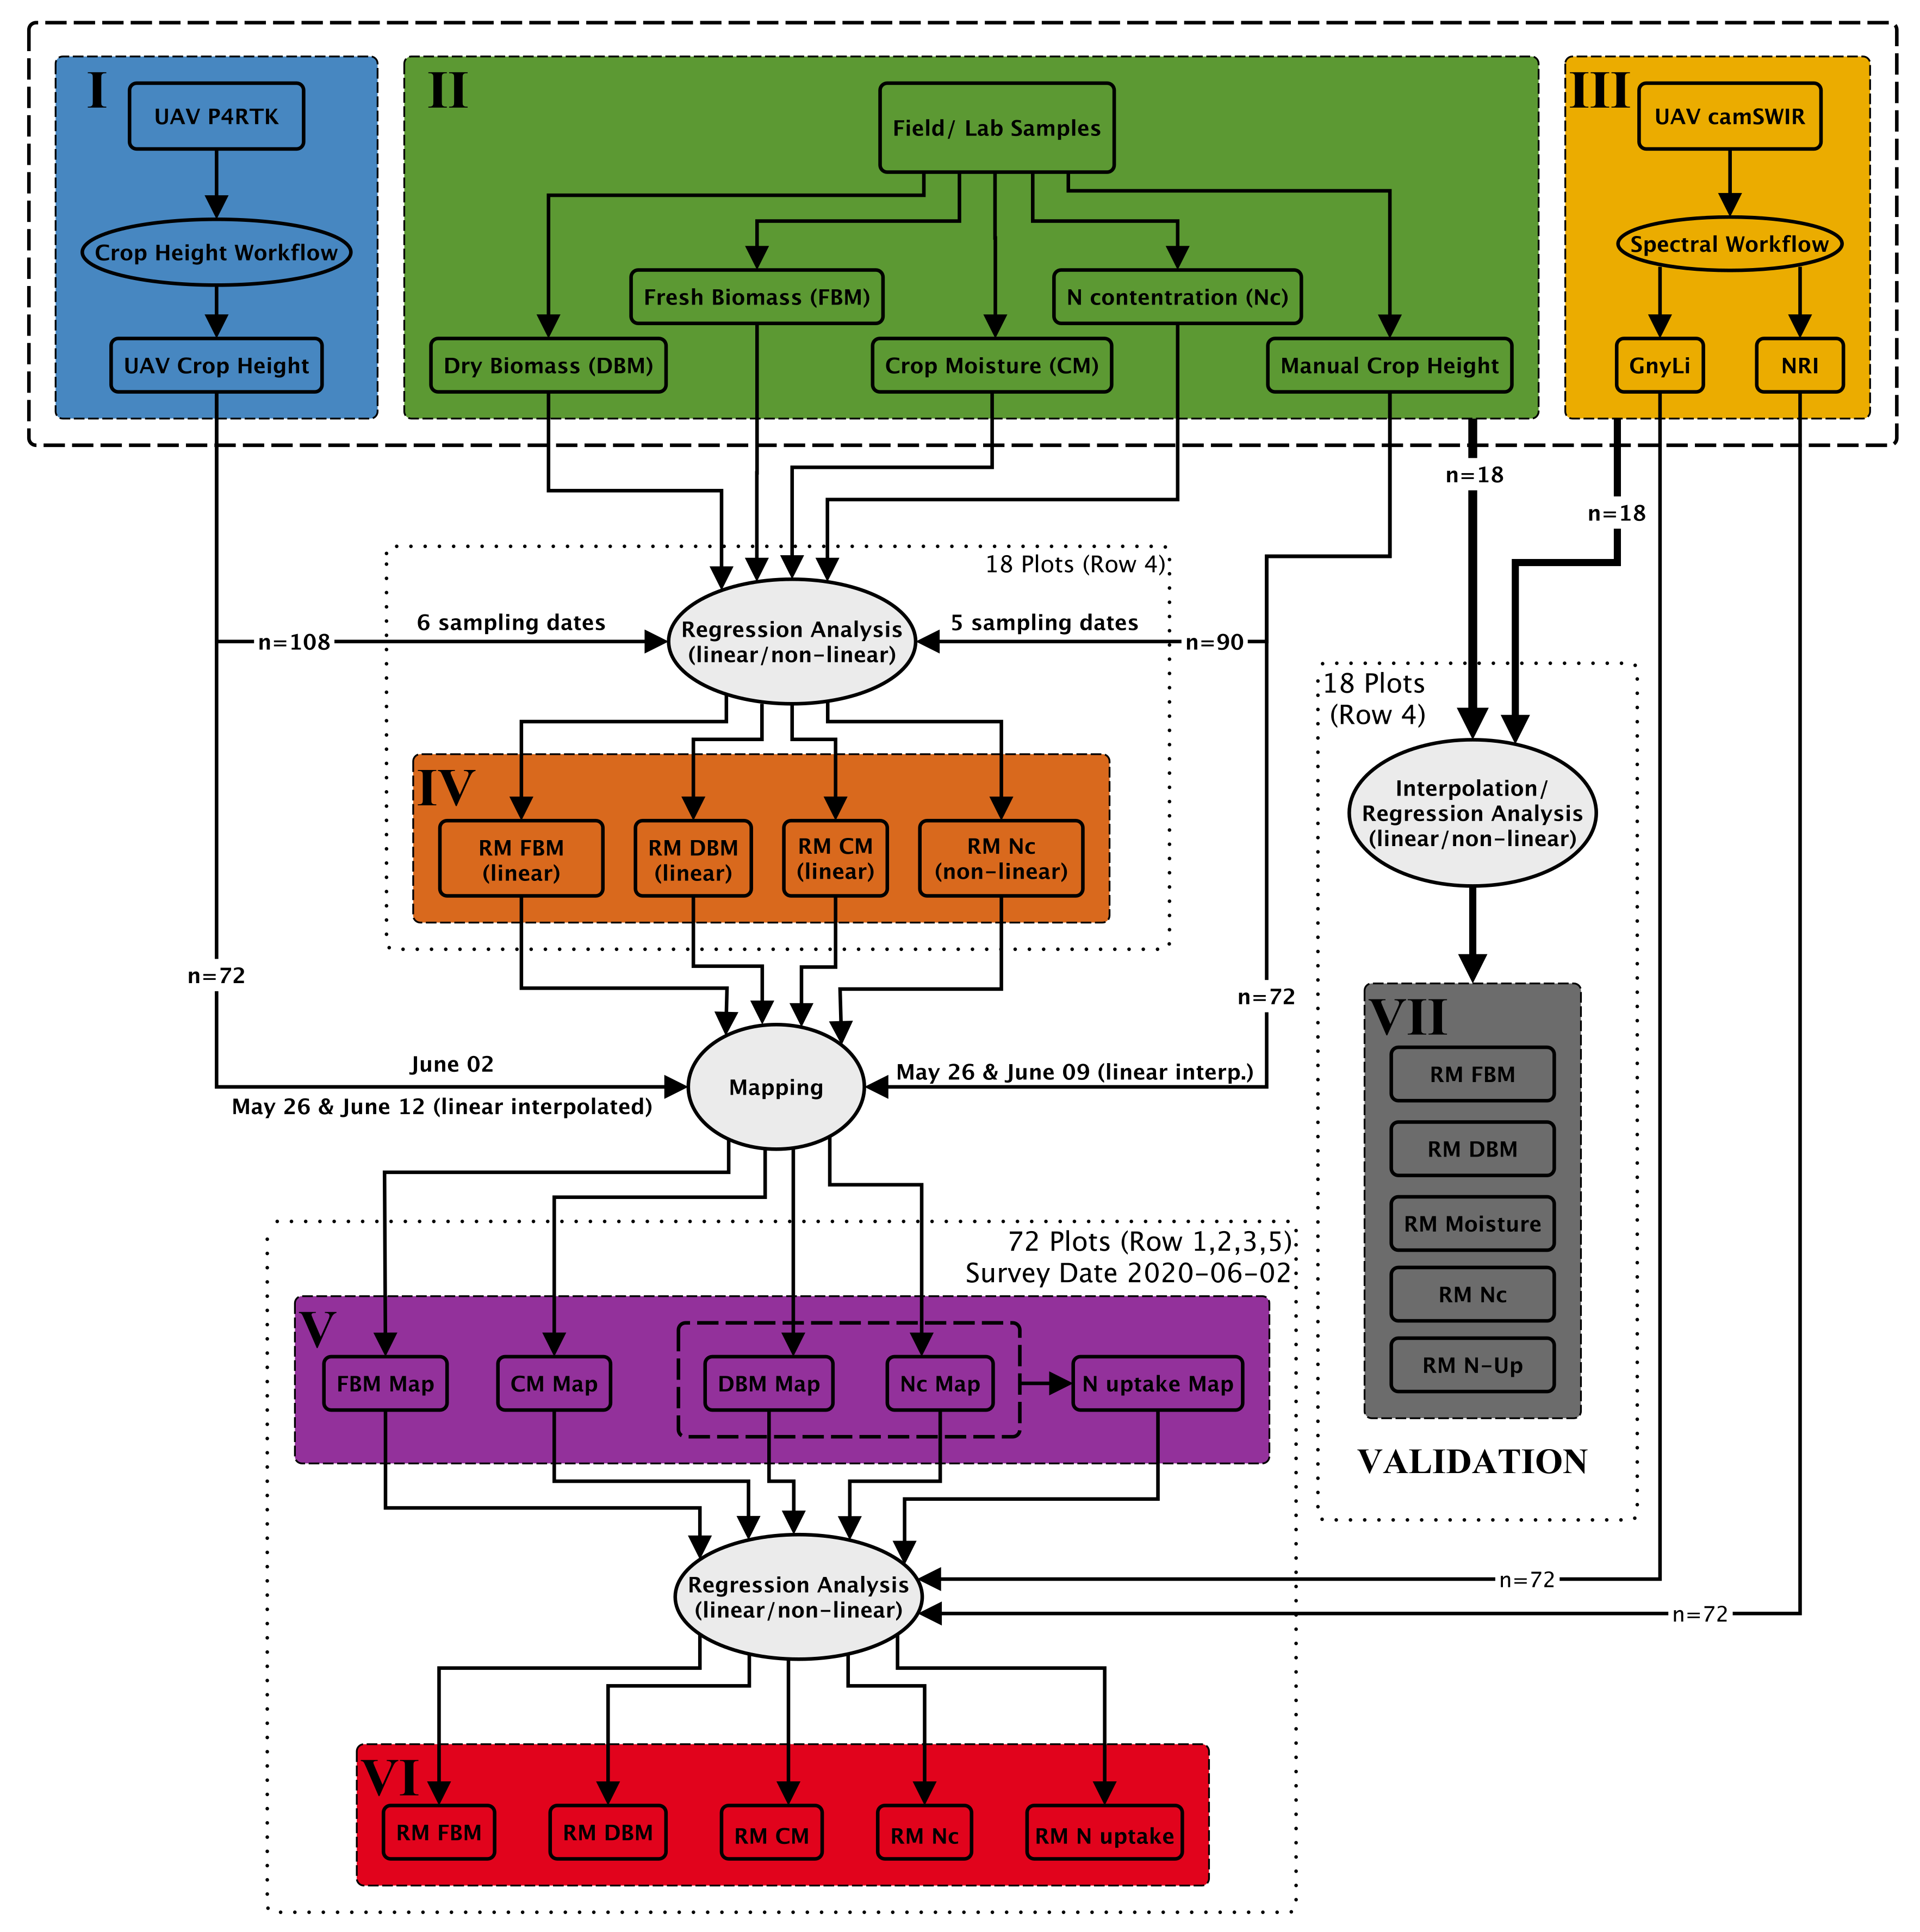
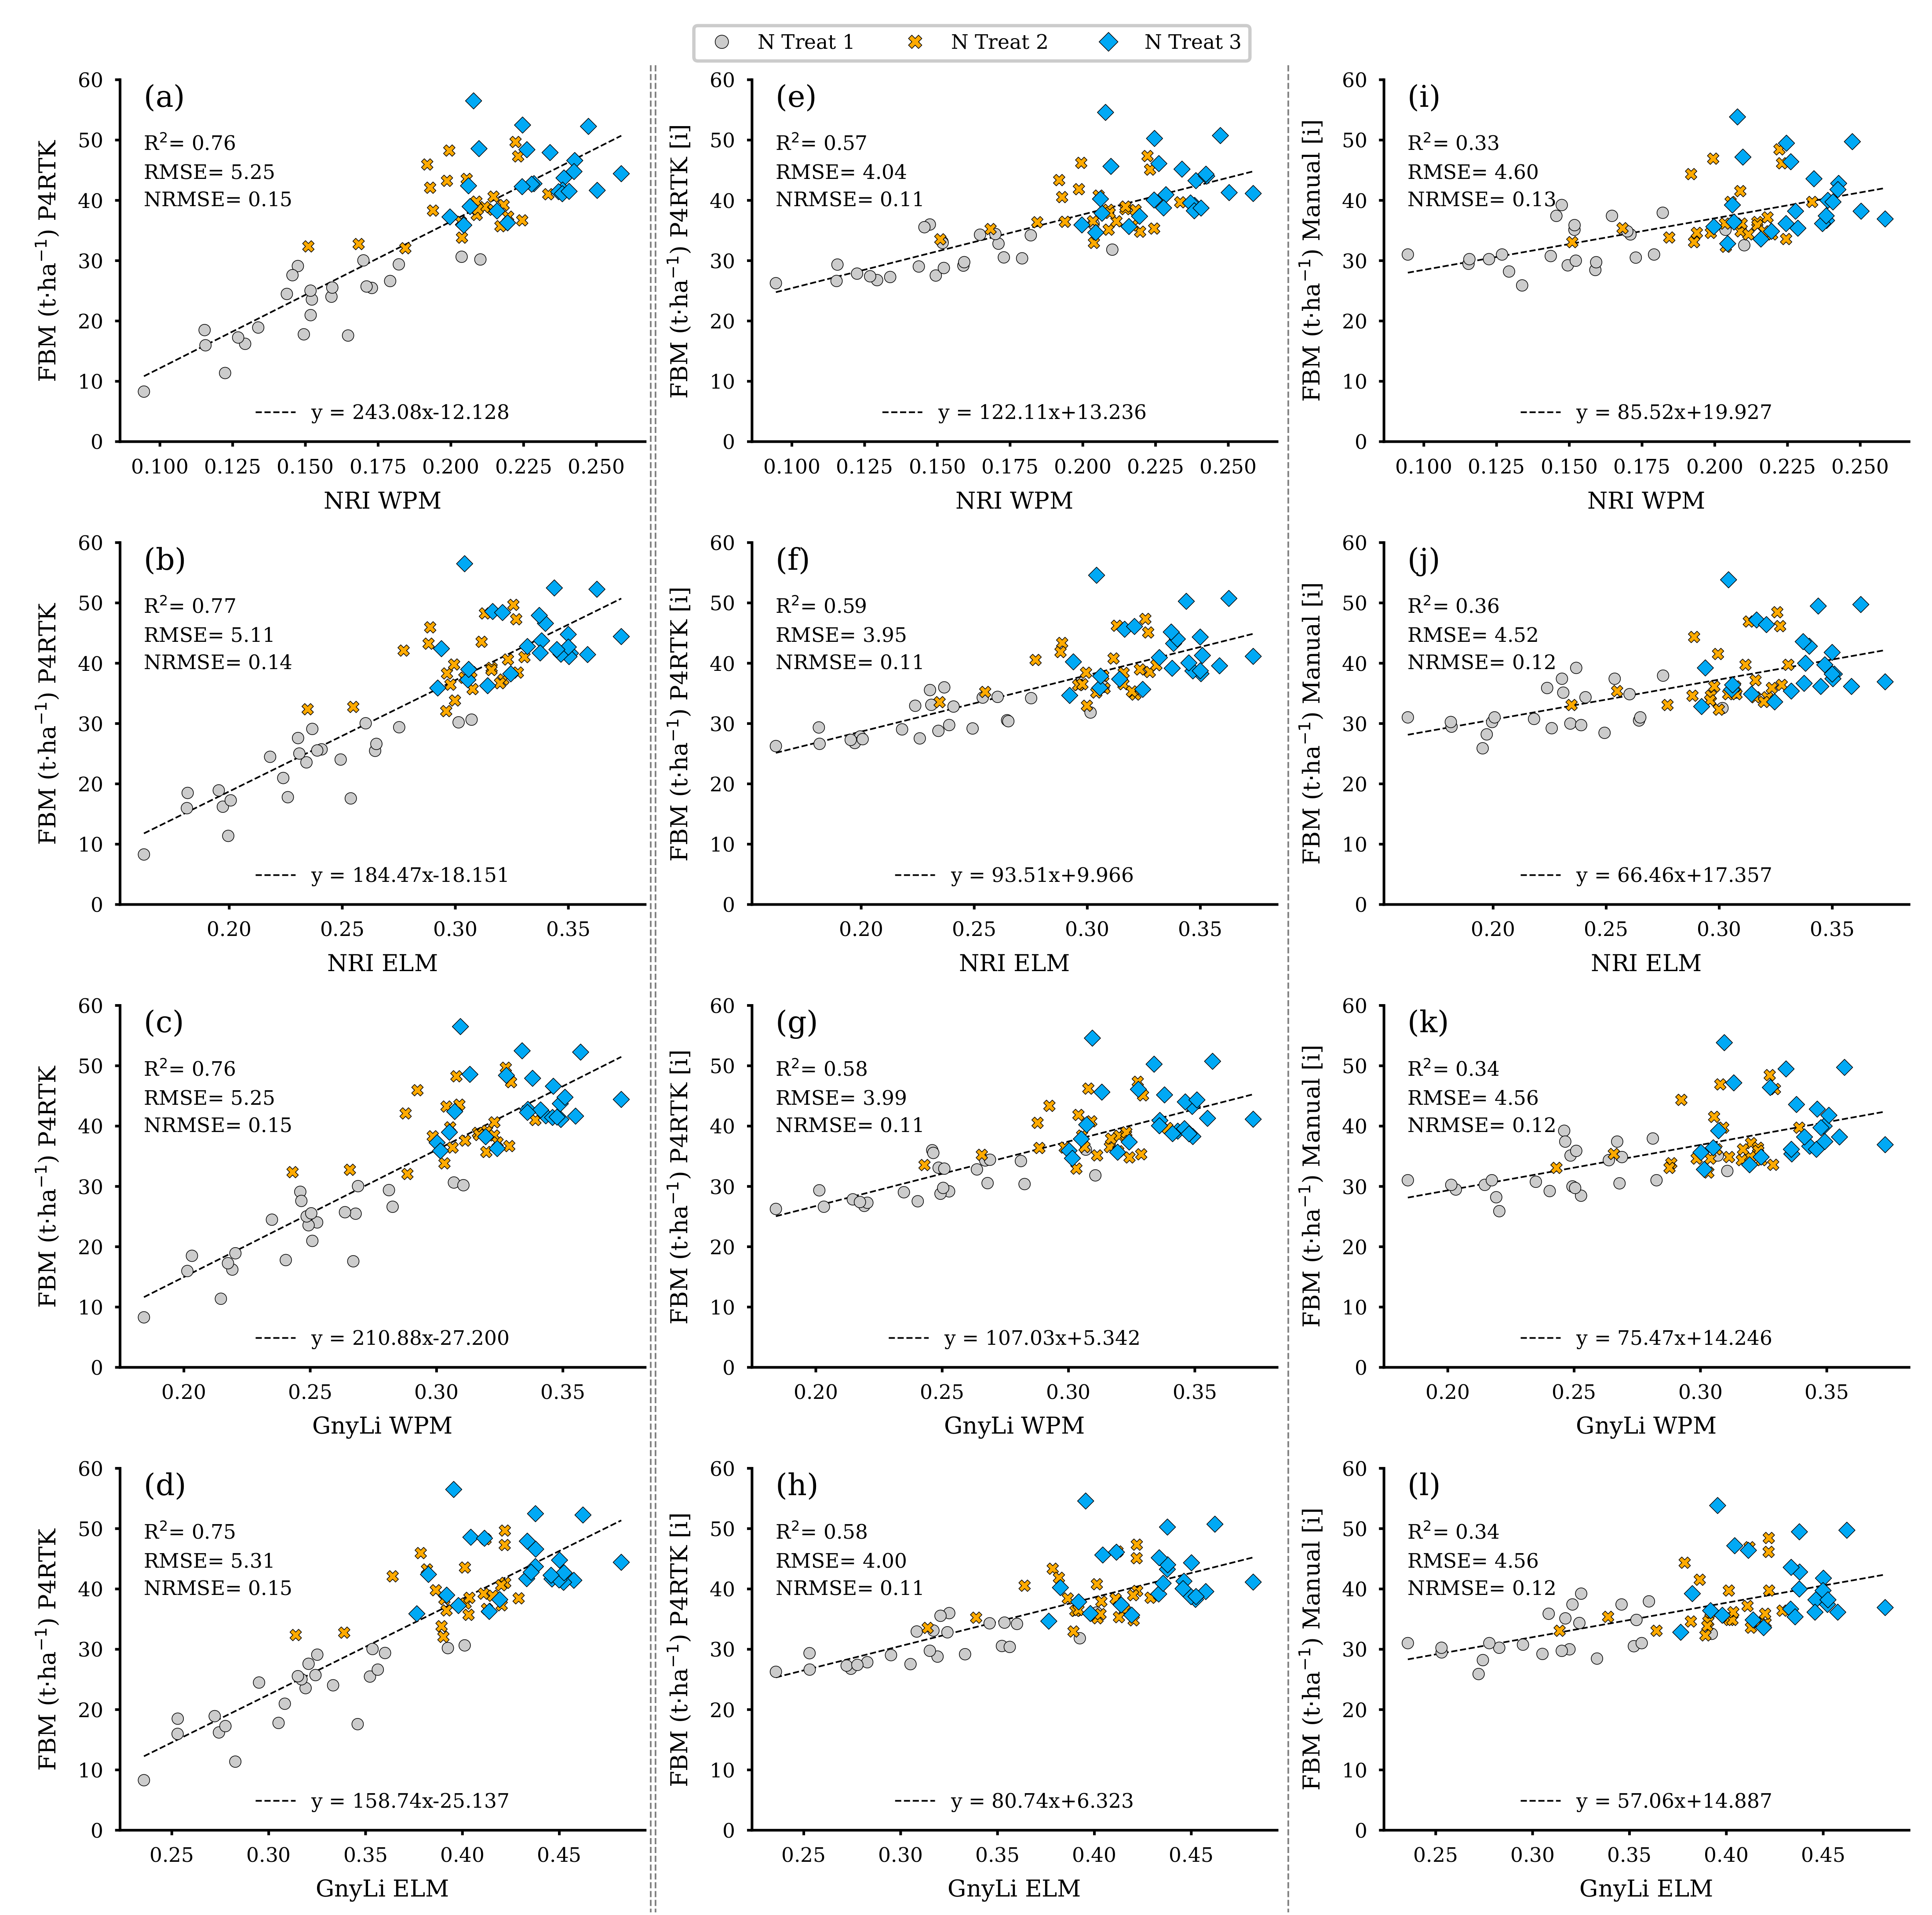
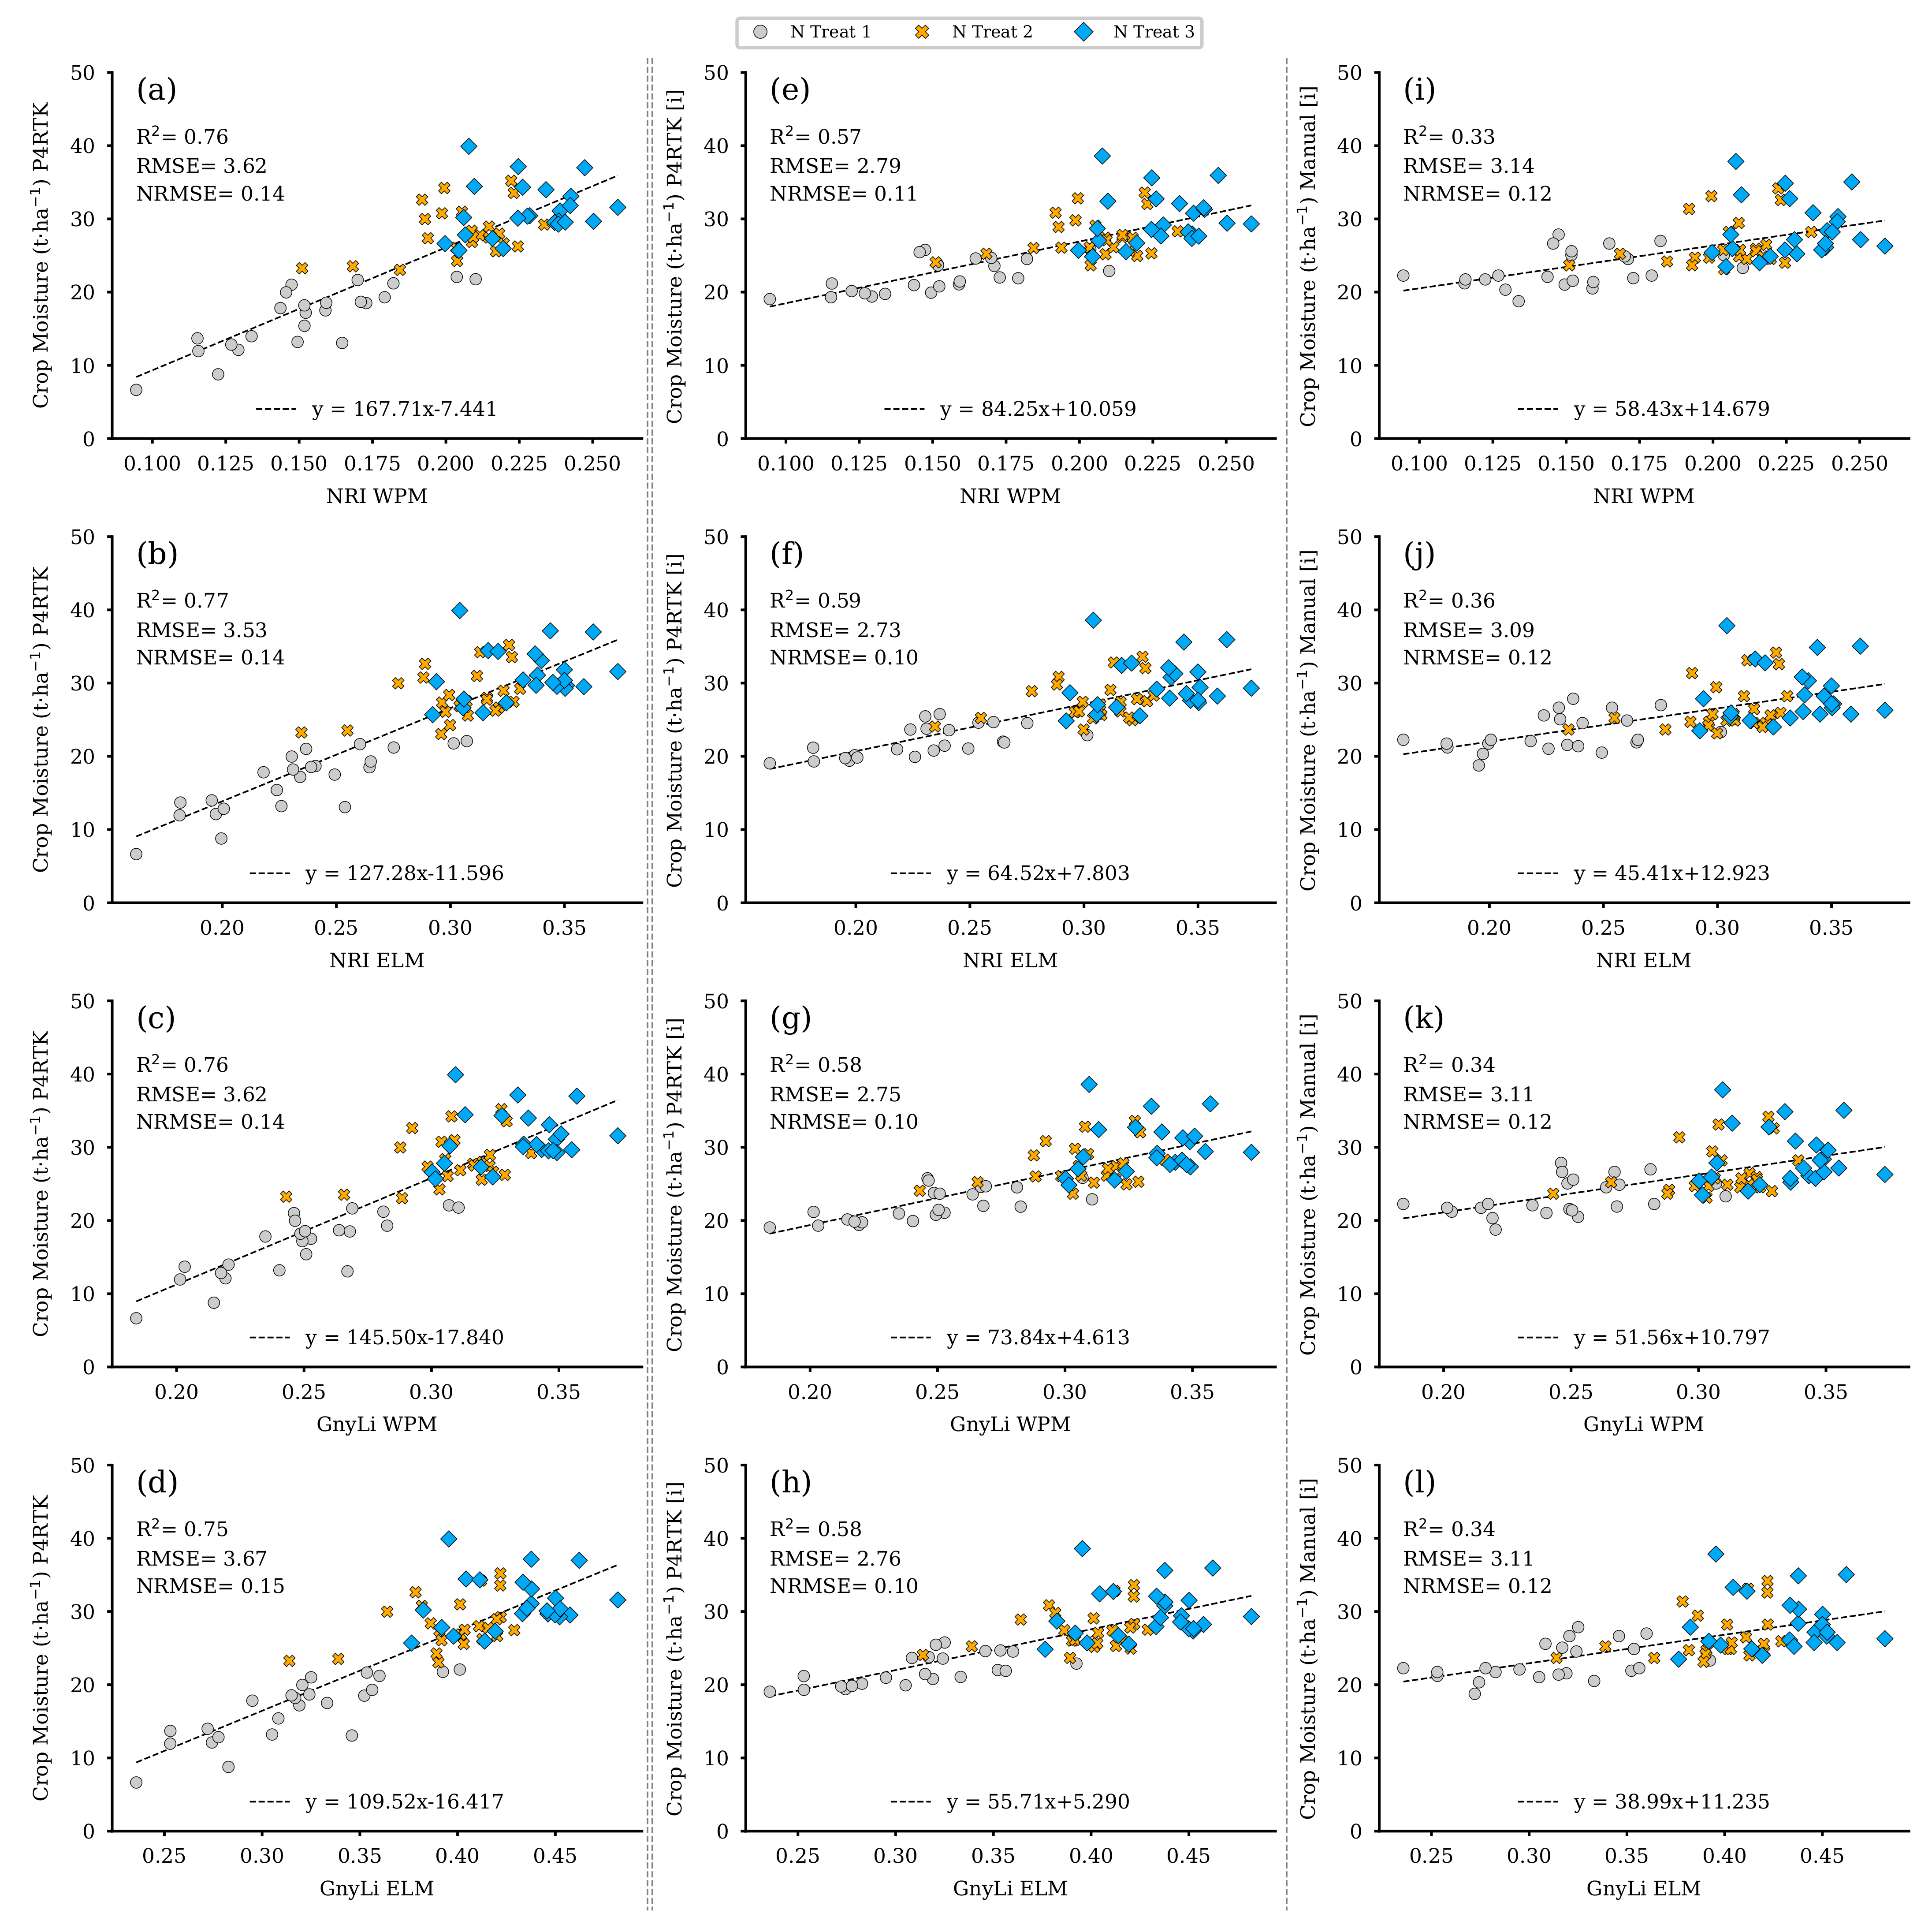
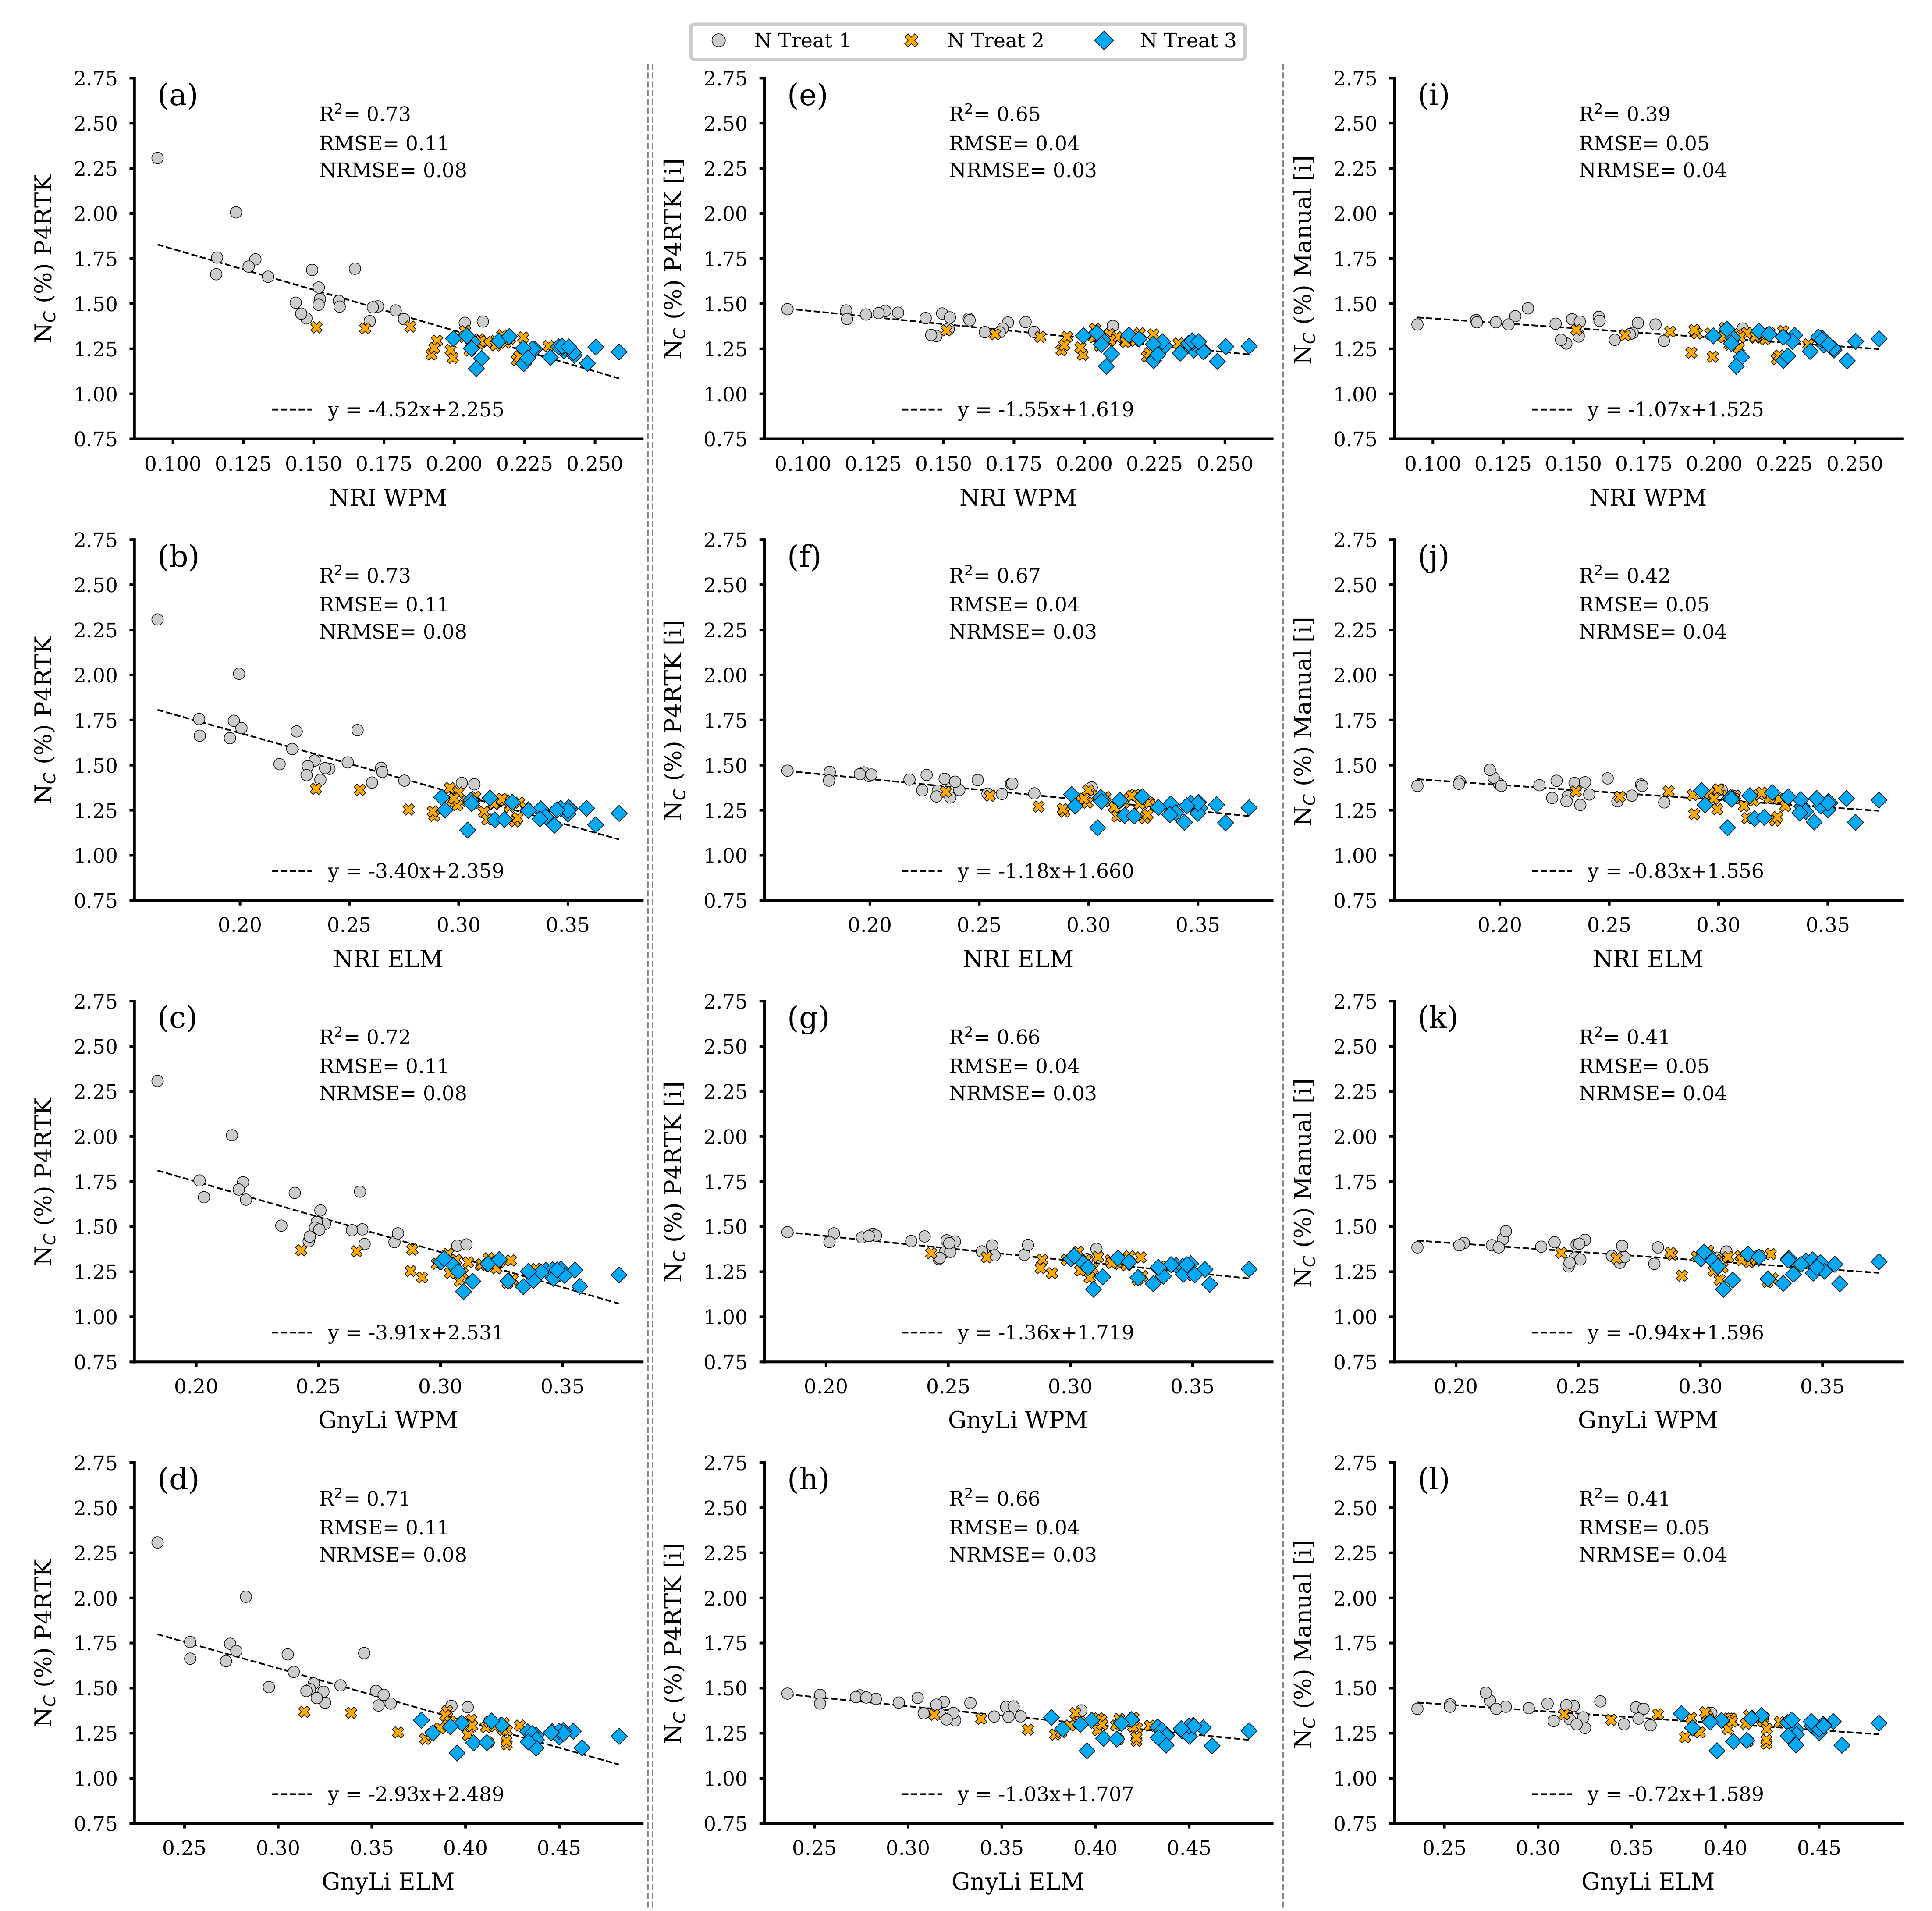
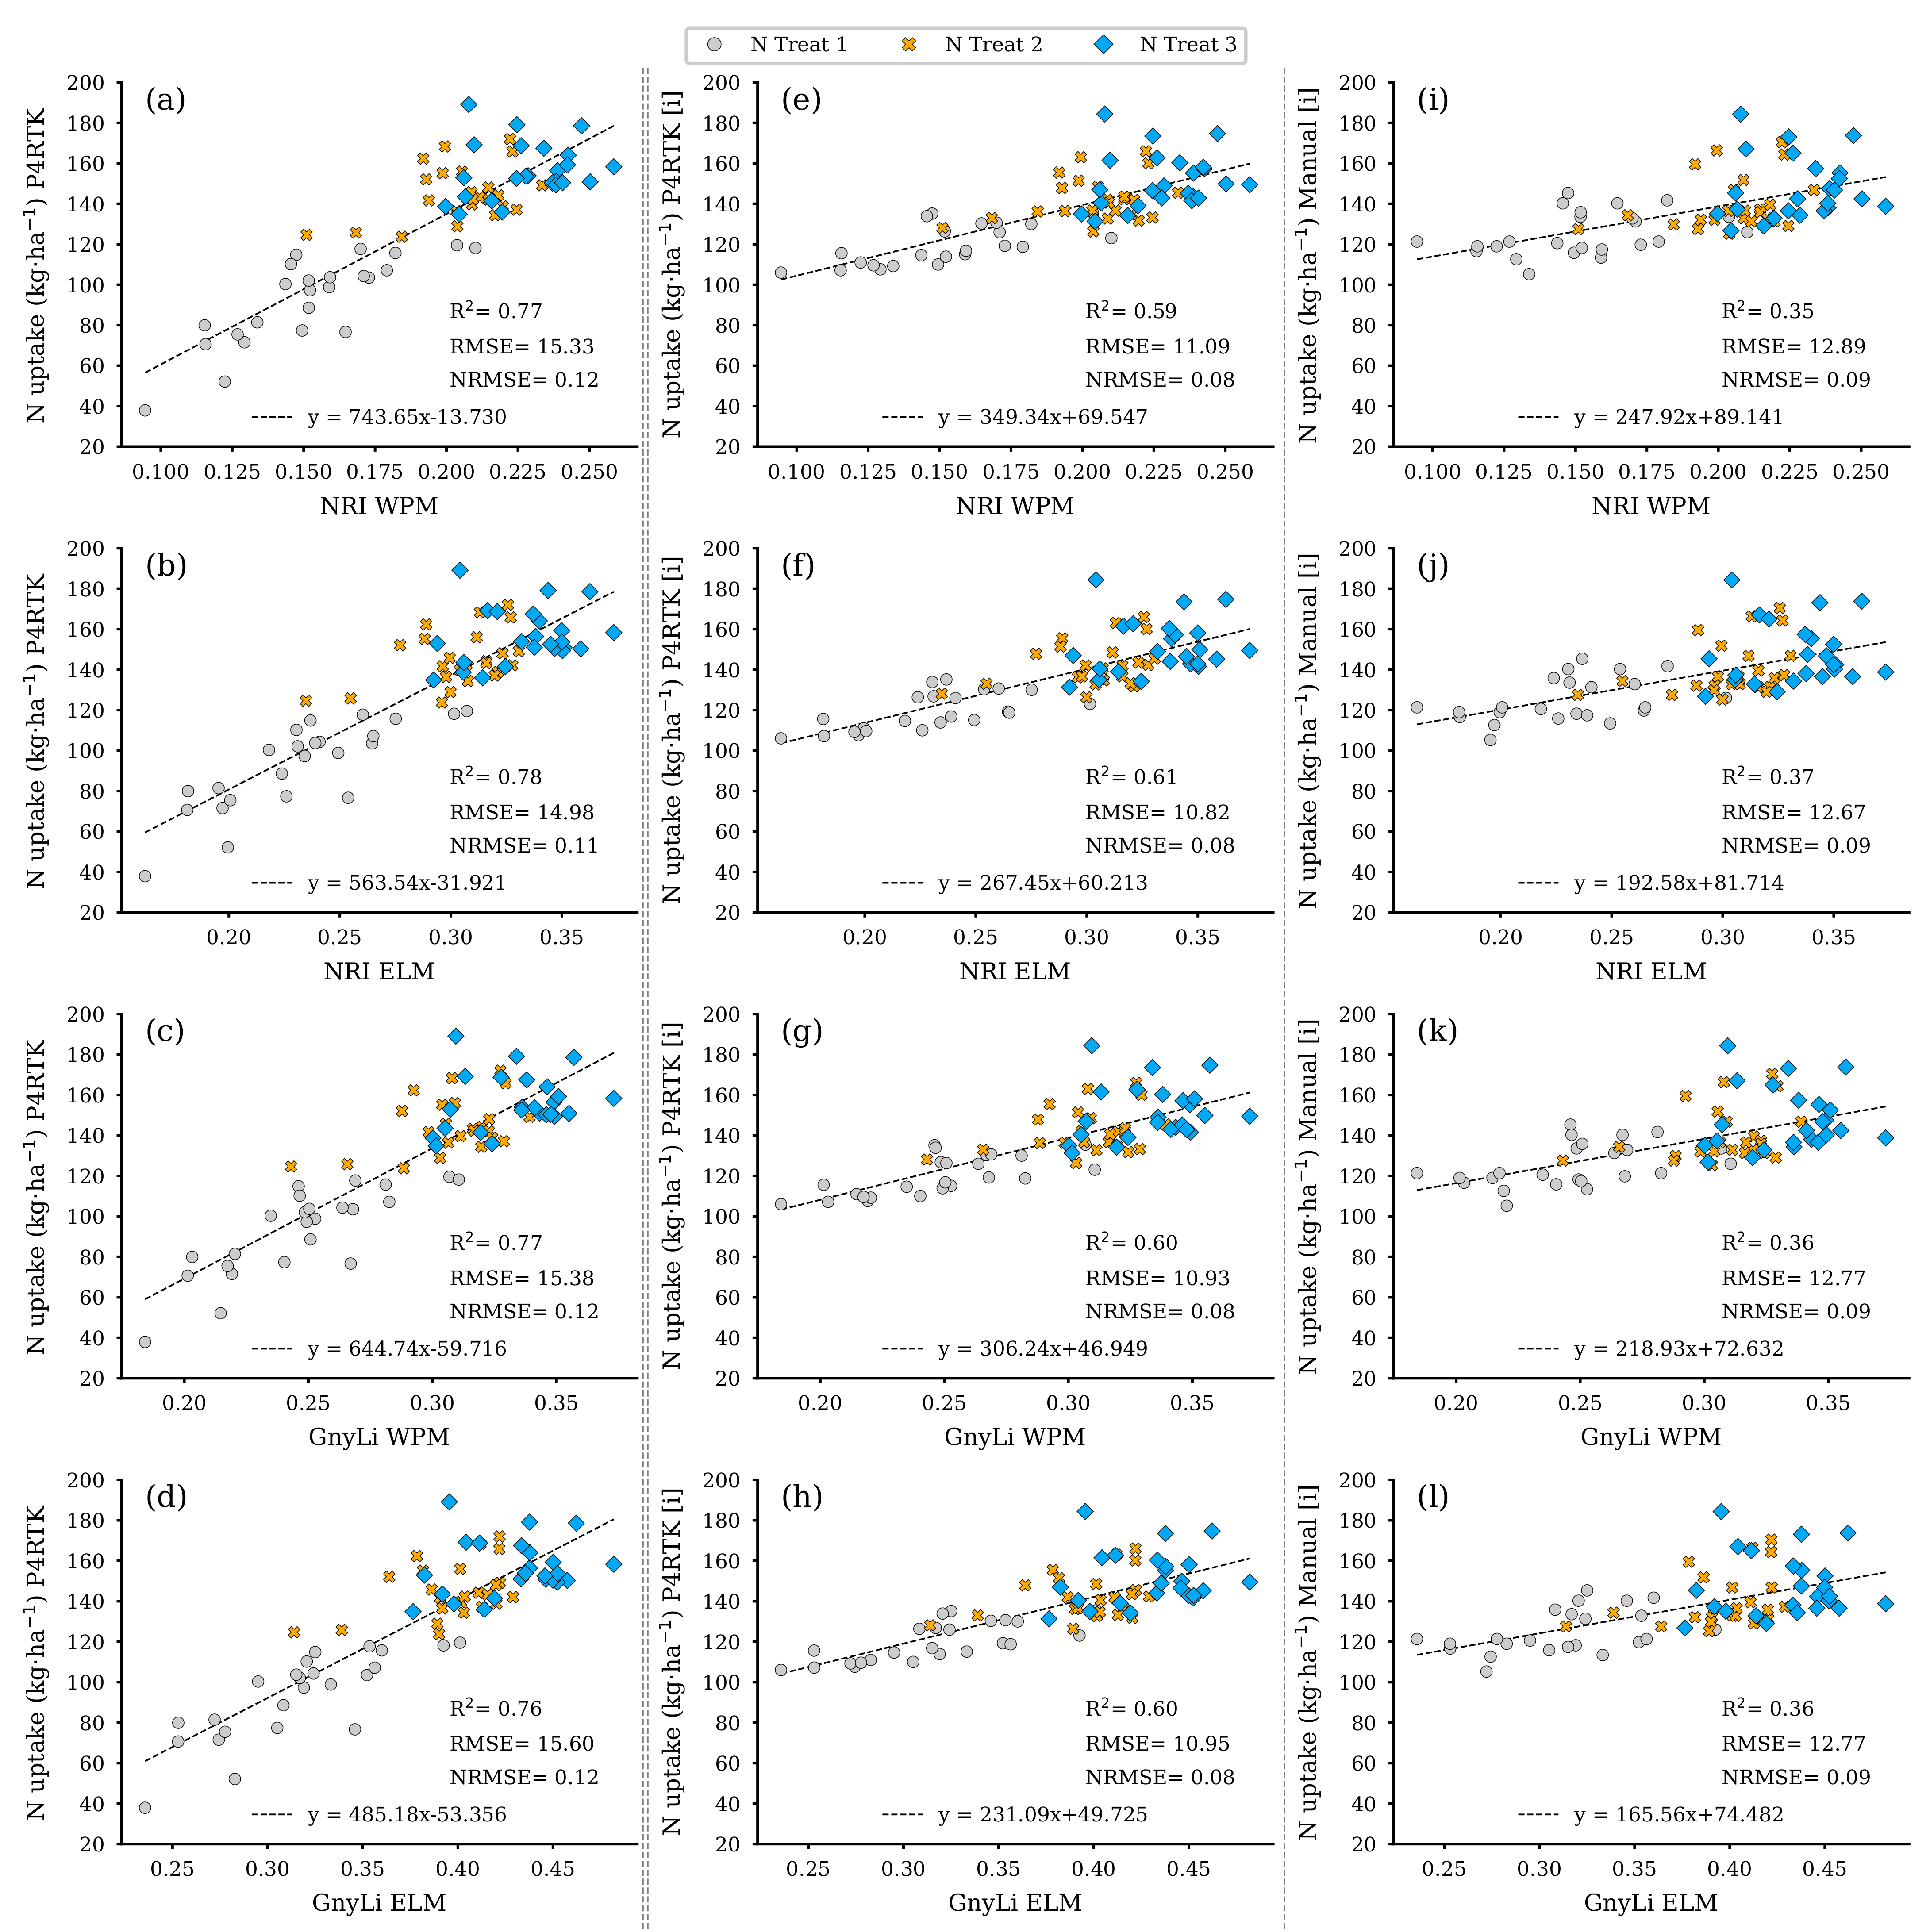
The NRI and GnyLi performed well as an estimator for different crop traits for the 72 test plots (
Figure 7, step V and VI) in our study. In a first approach, we calculated comparatively high R
2 values (NRI, GynLi) for FBM (R
2: 0.77, 0.75), DBM (R
2: 0.77, 0.75), N
C (R
2: 0.73, 0.71), N uptake (R
2: 0.78, 0.76), and crop moisture (R
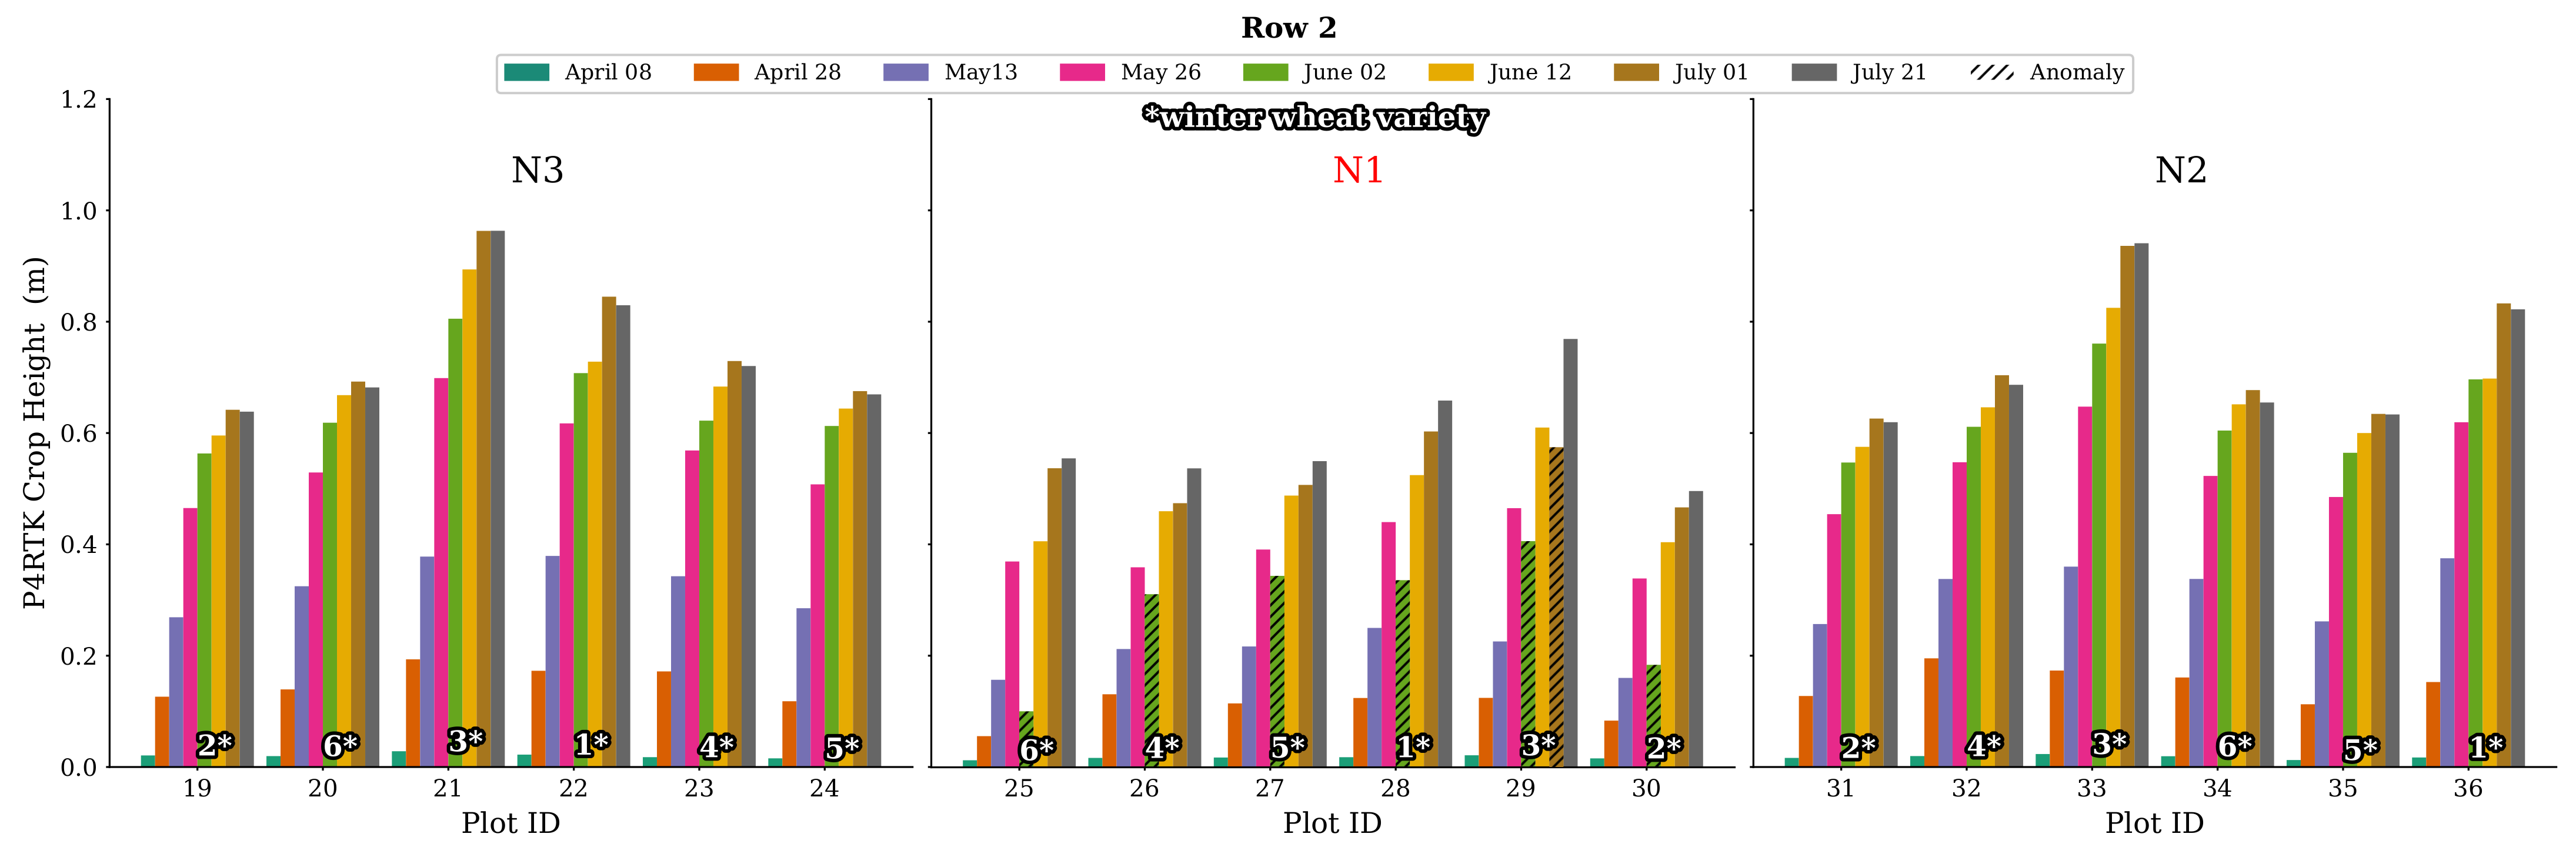
2: 0.77, 0.75) with low NRMSEs ranging from 8 to 16%. However, these good results for one date (2 June) result from a supposed spurious effect in the P4RTK RGB image data processed in the crop height workflow described in
Section 2.3. The low vegetation cover in the N1-treatment where nitrogen supply was omitted caused a significant CH error in the SfM/MVS analysis. This effect is most likely due to the strong reflectance of the high soil coverage and should be further investigated in the future. However, for all other observation dates, the P4RTK image data tracks crop growth with high accuracy (R
2: 0.95 for the 18 destructive sampling plots and R
2: 0.95 for the remaining 72 test plots) compared to the crop heights measured by hand with a folding ruler. The RMSE of
is within the expected resolution for stereo-photogrammetric height measurement from image data for both regression models (see
Figure 9).
To avoid the negative effect in the CH data, a second validation data set was produced by linearly interpolating the CH for 2 June to provide more reliable CH data. The regression models based on this interpolated data set resulted in moderately lower R
2 values for FBM (R
2: 0.59, 0.58), dry DBM (R
2: 0.59, 0.58), N
C (R
2: 0.67, 0.66), N uptake (R
2: 0.61, 0.60), and crop moisture (R
2: 0.59, 0.58). A reduction in RMSE (more than 20%) and NRMSE (4 percentage points) was also observed in the regression models of the interpolated data sets. Thus, while the variability in crop traits explained by the model was lower, absolute and mean-normalized prediction errors decreased. This decrease was mainly due to lower errors for predicting crop traits in the N1 treatment (see
Figure 14,
Figure 15,
Figure 16,
Figure 17 and
Figure 18).
Compared to these findings, the regression analysis results used to validate both VIs using the ground-truth-based crop traits data from the 18 destructively sampled plots (see
Figure 2 and
Figure 7 step VII) consistently showed an even higher accuracy, ranging from R
2: 0.73 to R
2: 0.87, and lower RMSE values. This difference originates from a weaker correlation between UAV-derived CH data, which are the base for estimating the crop traits of the 72 test plots for 2 June. Therefore, this slightly weaker correlation affects the estimation accuracy of the final step of the crop trait estimation workflow (
Figure 7 step VI), in which the UAV-derived crop traits are estimated using the VIs in regression models. In contrast, the base regression models of the destructively derived crop traits for all sampling dates performed better (see
Figure 13) with the UAV-derived CH (R
2: 0.54 to 0.94). Based on these CH, crop traits were estimated in turn for regression analyses with the VIs for the remaining 72 test plots. This slightly weaker relationship affects the last analysis step’s estimation accuracy (
Figure 7 step VI).
The same relationship can be observed in the regression analyses based on the manually measured CH. The comparison of the two CH data sets’ performance revealed significant differences in estimation accuracy related to the VIs, whereby the crop traits’ regression models based on the manually measured CH performs worse (R
2: 0.33 to 0.42) than the P4RTK-based crop traits (R
2: 0.57 to 0.67). This difference is described by Bareth et al. [
70]. It occurs because UAV-derived CH data, unlike point-wise manually measured ones, represent a mean plant height value of an entire plot accounting for the plant density resulting from zonal statistics. Another solution to provide CH data for reliably estimating crop traits might be utilizing UAV-LiDAR data [
71,
72,
73] and should be investigated in future research.
Li et al. [
45] investigated the performance of established VIs and tested for optimal wavelength combinations in the VIS/NIR domain to retrieve N
C for certain growing stages. In their study on winter wheat, the authors found that all of the 77 published VIs and the best waveband combinations performed poorly (R
2 < 0.29). Similar results are described by Mistele et al. [
74] for maize. Gnyp et al. [
75] investigated field spectra in rice and found similar moderate to poor R
2 when applying VIs across all growing stages (R
2 < 0.5). Reaching a higher R
2 of up to 0.8 was only possible by using step-wise multiple linear regression (MLR) or narrow NIR/SWIR bands for the complete data set summarizing all growing stages. Stroppiana et al. [
20] present similar results from several studies, showing moderate to low R
2 for N retrieval for distinct growing stages. In general, most studies report only moderate to poor R
2 for a single survey date. Thus, the ability of VIs in the VIS/NIR domain to estimate crop N
C is limited. In particular, this applies to studies based on single survey dates. Considering the results from this study, we, therefore, suggest evaluating in more detail the performance of systems operating in the SWIR domain in future studies on date-specific crop trait estimation.
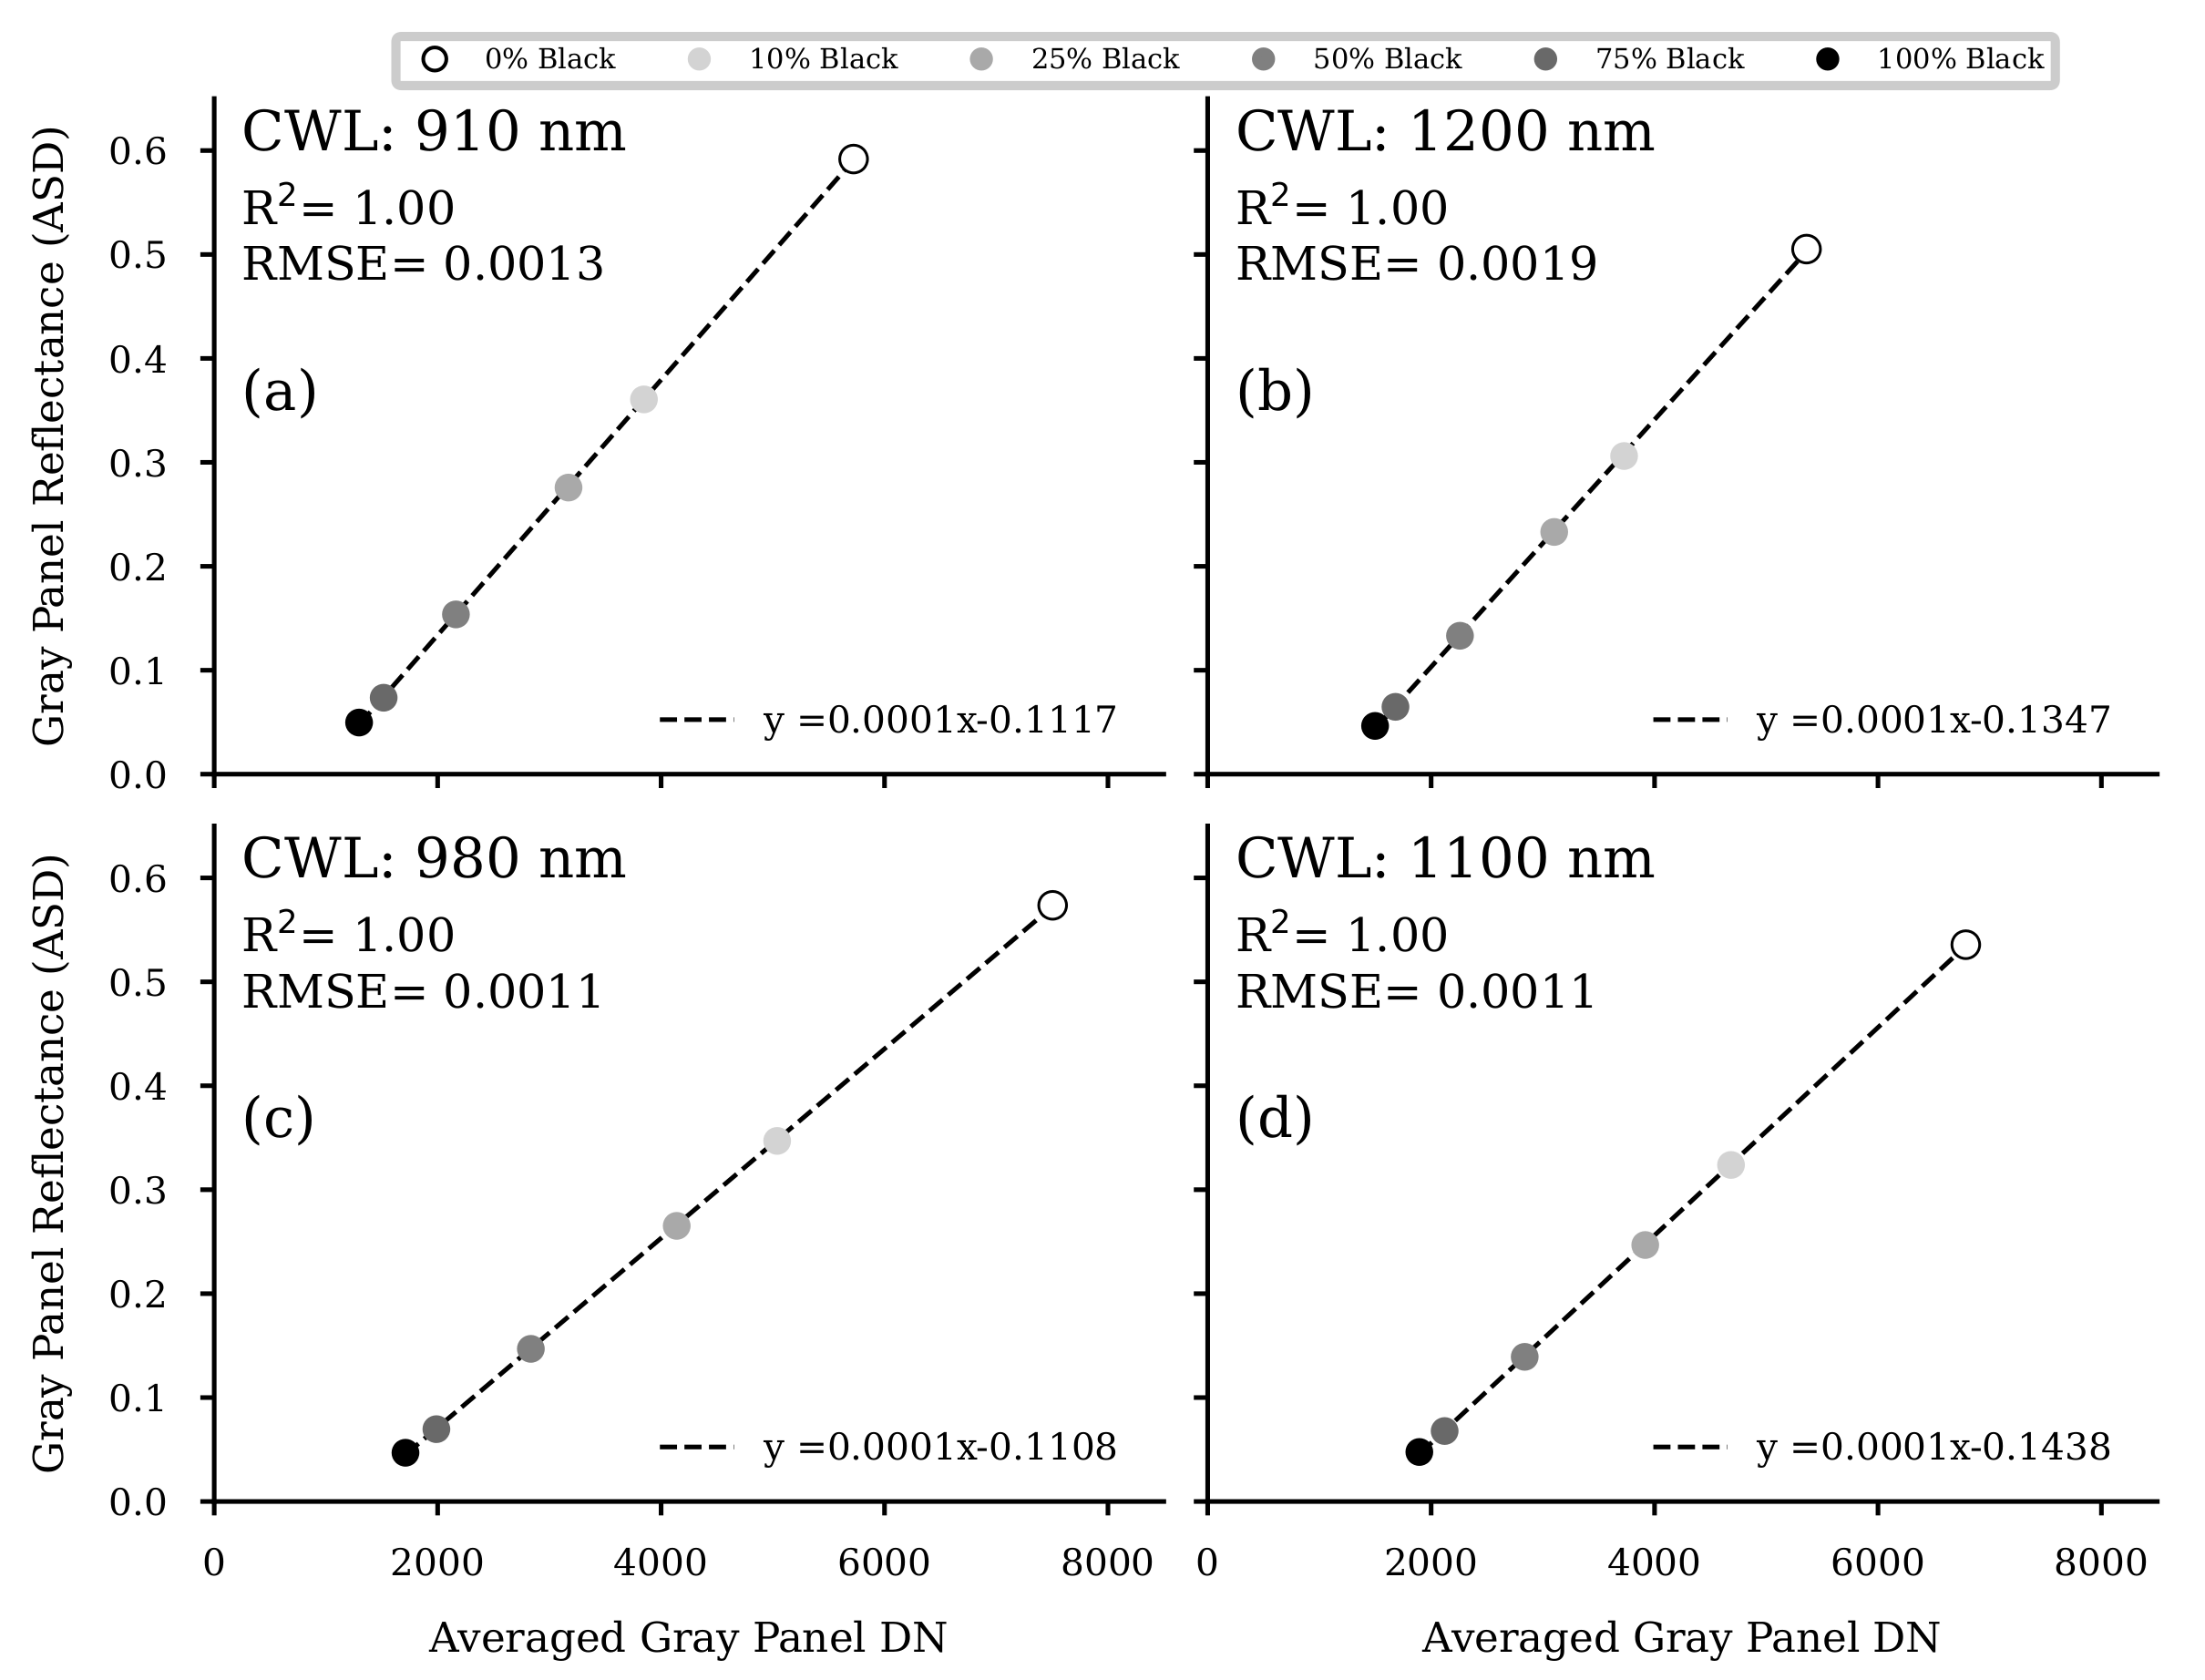
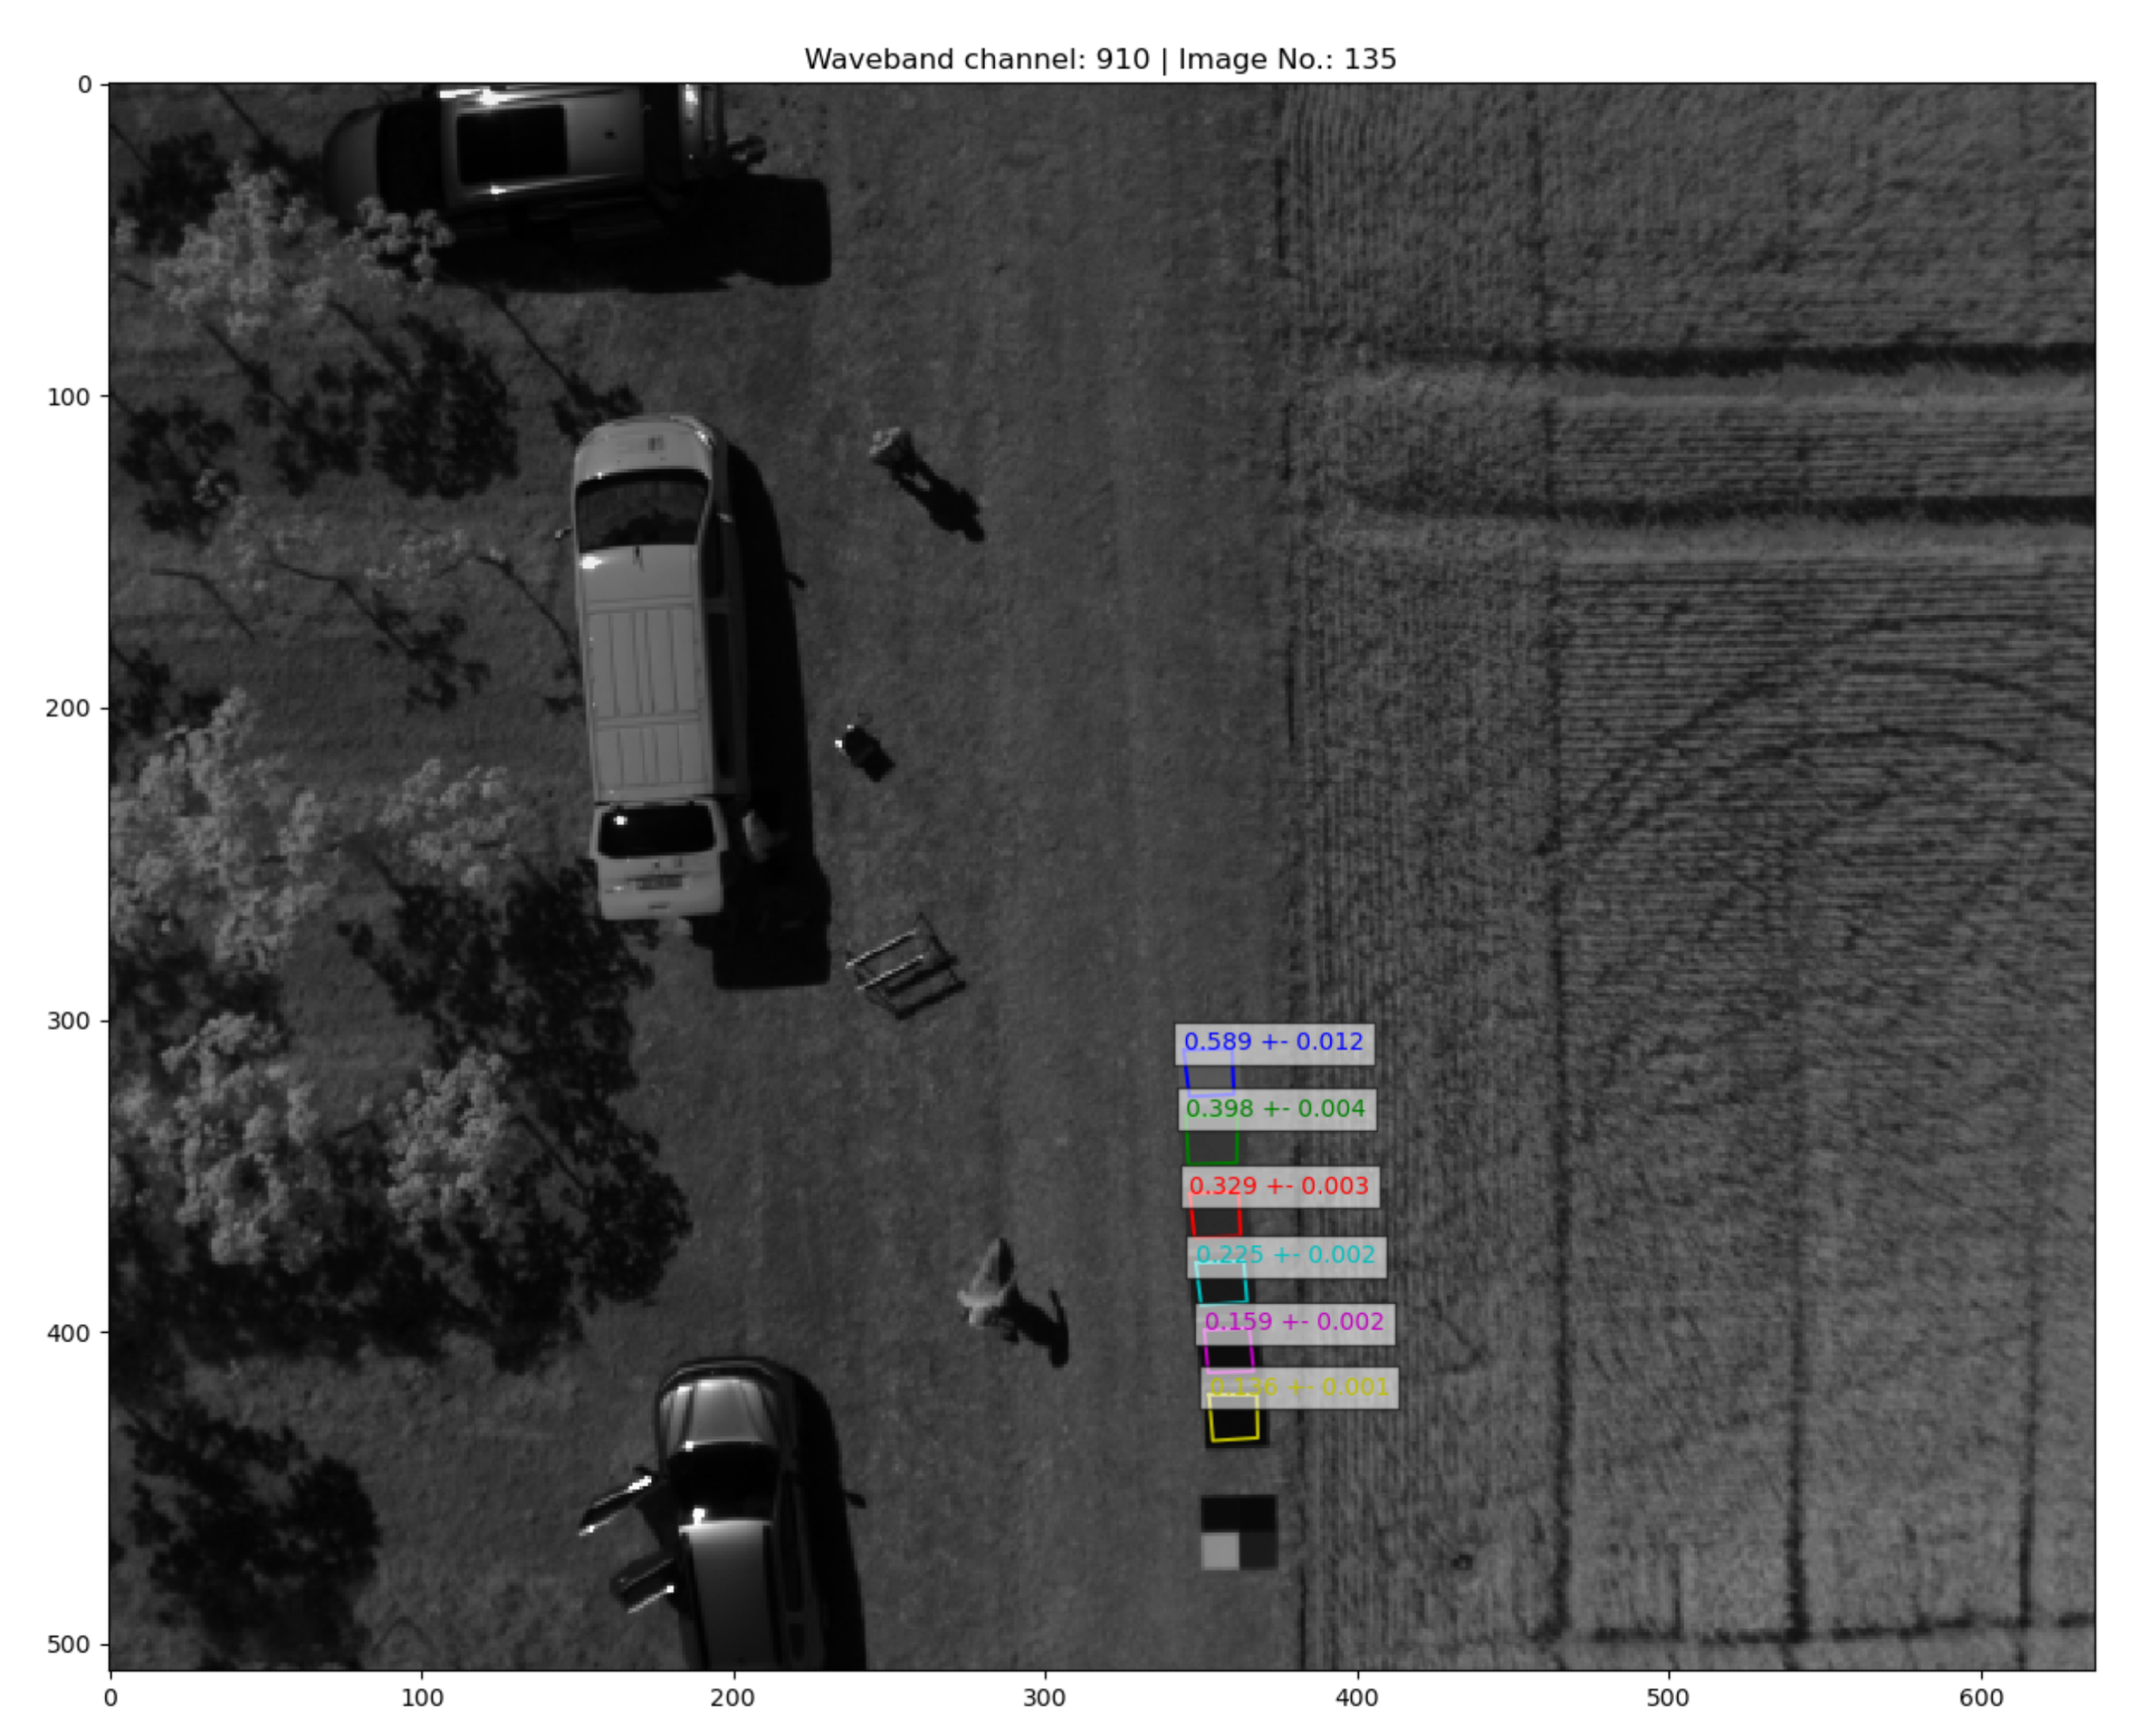
The results show that the recently introduced imaging system produces reliable VNIR/SWIR image data for the four selected wavebands. While only grayscale panels, destructively sampled crop data and estimated crop traits based on CH data could be used in this study, Jenal et al. [
38] additionally used field-spectroradiometer measurements (350 to 2500 nm) of grassland canopies. In the latter study, very high correlations between both independent reflectance data sets have already been demonstrated. In this study, the spectral quality of the image data was shown again, and similar excellent results were produced for the grayscale panel calibration (ELM) method (
Figure A2) as described in [
38]. In determining the panel reflectances in the WPM-calibrated images (
Figure A3) and regressing them with the panel reflectances, the quality of the WPM calibration method was successfully tested (
Figure A4). The easy-to-use calibrated VNIR/SWIR spectral image data sets could be processed to derive plot-specific vegetation index reflectance values. An appropriate methodology was elaborated in previous studies [
23,
38]. The high sensitivity over almost the entire NIR/SWIR range of the InGaAs sensors used provides a high signal-to-noise ratio, which is crucial according to Stroppiana et al. [
20], and such sensors are a missing technology for crop trait monitoring. NIR-enhanced silicon-based VIS imagers are mainly affected by this issue due to a drop in sensitivity at their spectral detection limits. However, non-enhanced InGaAs sensors (900 to 1700 nm) also reach their spectral limits in the NIR, with steep sensitivity drops at both spectral ends. For this reason, VIS-NIR-enhanced InGaAs sensors (600 to 1700 nm) have advantages as they partially overcome these problems, especially in the NIR/SWIR domain.
Comparing the tested image reflectance calibration techniques (ELM and WPM, see
Section 2.5), both performed similarly (
Table 4,
Table 5 and
Table 6), with slight differences in R
2 values dependent on the data set but not systematic. Thus, distinct recommendations on specific index-calibration method combinations could not be identified. This observation is again consistent with the findings of Jenal et al. [
38].
5. Conclusions and Outlook
The results presented in this study indicate that the VNIR/SWIR multi-camera system camSWIR is suitable for acquiring spectral image data in the NIR/SWIR. The derived vegetation indices were demonstrated to be capable of estimating agronomic relevant crop traits in winter wheat. In comparison with destructively measured crop trait data, both tested VIs (GnyLi and NRI) reached high estimation accuracies (R2: 0.73 to 0.87) in the regression models for validation.
The findings of this study further imply that by applying the proposed multilevel crop trait estimation workflow, biomass-related crop traits can be estimated in regression models using SfM/MVS-derived CH data from UAV RGB imagery. Such applications are beneficial for a reliable assessment of crop traits using UAV data since the availability of ground truth data is most often the limiting factor. In this study, this workflow’s implementation led to bivariate regression models based on both NIR/SWIR VIs and the estimated crop traits, based on UAV-derived crop heights, which reached high accuracies (R2: 0.57 to 0.67).
The CH data for 2 June, which were considered unrealistic since they suggested a drop in the seasonal crop height development, raise the intriguing research question of this method’s limitations. Therefore, this phenomenon requires further investigation and methodological improvements in order to avoid compromising effects. Alternatively, CH derived from UAV LiDAR data should also be investigated.
The results presented here are based on data from a single observation data. Thus they are noteworthy but not yet representative and need to be confirmed by further studies. Future evaluations of the camSWIR imaging system using multi-temporal and multi-year data acquisition campaigns on a winter wheat field trial are planned. To allow for a comparison with established methods, such evaluations optimally also include data from airborne VNIR imaging systems and spectral ground truth using a portable spectroradiometer in the field.
Given that future evaluations confirm the results of this study, spectral data collected by the VNIR/SWIR multi-camera system can provide additional information for more accurate yield estimation or efficient fertilizer management in precision agriculture.


 ,
, 


