Article

Evaluation of Network RTK Positioning Performance Based on BDS-3 New Signal System

1
GNSS Research Center, Wuhan University, Wuhan 430079, China
2
College of Geological Engineering and Geomatics, Chang’an University, Xi’an 710054, China
*
Author to whom correspondence should be addressed.
Remote Sens. 2022, 14(1), 2; https://doi.org/10.3390/rs14010002
Submission received: 24 November 2021 / Revised: 17 December 2021 / Accepted: 18 December 2021 / Published: 21 December 2021

Abstract

:
The BeiDou navigation satellite system (BDS-3) has been deployed and provides positioning, navigation, and timing (PNT) services for users all over the world. On the basis of BDS-2 system signals, BDS-3 adds B1C, B2a, B2b, and other signals to realize compatibility and interoperability with other global navigation satellite systems (GNSS). Network real-time kinematic (RTK) technology is an important real-time regional high-precision GNSS positioning technology. Combined with the network RTK high-precision service platform software developed by the author’s research group and the measured data of a provincial continuously operating reference station (CORS) in Hubei, this paper preliminarily evaluates the network RTK service performance under the new signal system of BDS-3. The results show that single BDS-3 adopts the new signal combination (B1C+B2a) and transition signal combination (B1I+B3I) when providing virtual reference station (VRS) services, the RTK fixation rate of the terminal is above 95%, and the horizontal and elevation accuracies are within 1cm and 2 cm, respectively, which meets the requirements of providing high-precision network RTK services by a single BDS-3 system. In addition, the positioning accuracy of BDS-2 is relatively poor, while the accuracy of BDS-3 is better than global positioning systems (GPS) and BDS-2. The combined processing effect of the B1I+B3I transition signal of BDS-2/3 is optimal, the accuracy of E and N directions is better than 0.5 cm, and the accuracy of U direction is better than 1.5 cm. It can be seen from the atmosphere correction accuracy, regional error modeling accuracy, and network RTK terminal positioning accuracy that the service effect of the B1C+B2a combination is slightly better than that of the B1I+B3I combination. When a single BDS-3 constellation provides network RTK services, it is recommended to use the B1C+B2a combination as the main frequency solution, and when the BDS-2/3 constellation provides service, it is recommended to use the B1I+B3I combination as the main frequency solution.

1. Introduction

As a part of the GNSS, the BDS is a satellite positioning system built in China. Its purpose is to provide PNT services for global users [1,2]. According to the three-step development strategy, the first phase (BDS-1) is composed of 2 GEO satellites, with the purpose of experimental demonstration. It was completed in 2000 and has now ended its service. The second phase (BDS-2) is composed of 5 GEO + 5 IGSO + 4 MEO satellites. The purpose is to provide PNT services for users in the Asia-Pacific region. It was completed at the end of 2012. The satellites currently in orbit are composed of 5 GEO + 7 IGSO + 3 MEO, which can provide PNT service accuracies on the level of 10 m, 0.2 ms, and 50 ns, respectively. In addition, the full constellation of BDS-2 can broadcast triple-frequency signals, namely B1I (1561.098 MHz) + B2I (1207.140 MHz) + B3I (1268.520 MHz). The third phase (BDS-3) is composed of 3 GEO + 3 IGSO + 24 MEO satellites. The purpose is to provide PNT services for global users; it will start full constellation operation in June 2020. The satellites currently in orbit and providing normal services are composed of 2 GEO + 3 IGSO + 24 MEO. BDS-3 inherits the B1I and B3I frequency of BDS-2, which can realize the transition between the two generation systems. In addition, BDS-3 also broadcasts another three frequency signals to achieve compatibility and interoperability with other GNSS systems, namely B1C (1575.42 MHz) + B2a (1176.45 MHz) + B2b (1207.14 MHz). The frequency signals of BDS-ICD publicly provided services [1,3] are shown in Table 1. In addition, information about BDS satellite PRN, satellite SVN, satellite type, space signal accuracy, system operation status, and other information can be viewed on the website (TARC): http://www.csno-tarc.cn/system/constellation (accessed on 18 August 2021). The footprints of BDS satellites are shown in Figure 1. It can be seen from Figure 1 that the BDS has basically covered most of the world’s middle and low latitudes after the accession of BDS-3 satellites. Furthermore, in the Asia-Pacific region, due to the presence of GEO+IGSO (BDS-2) satellites, the average number of visible satellites is better.
Since the end of 2018, the BDS-3 system has provided global service. A large number of scholars have studied the PNT service performance of BDS-3, and literature [4,5,6] has evaluated the signal quality of BDS-3. In the literature [7,8], the precise orbital determination of the BDS-3 satellite was studied. The precise point positioning (PPP) performance of BDS-3 was studied in the literature [9,10,11]. Reference [12] made a preliminary evaluation of the RTK service performance under the new signal system of BDS-3 and pointed out that the positioning performance of BDS-3 was better than that of BDS-2. Reference [13] made a similar study, and pointed out that the positioning accuracy of the B1C+B2a combination of BDS-3 was better than that of B1I+B3I. Literature [14] initially evaluated the positioning performance of single-frequency and dual-frequency BDS-3 RTK based on an ultra-short baseline, pointing out that the poor signal quality of B2a frequency of BDS-3 would lead to poor positioning results, and reasonable weighting processing should be carried out in practical use. Literature [15] suggests using B1C+B2a or B1I+B3I for BDS-3 dual-frequency processing. Literature [16] initially evaluates the network RTK service effect under the combination of B1C+B2a using three reference stations with an average baseline length of 30 km. The rover stations measured in the network combined with the VRS achieved a static three-dimensional (3D) positioning accuracy better than 3 cm.
The above studies about the BDS-3 system mainly focus on the aspects of signal quality, orbit, clock error, PPP positioning performance, and RTK service performance. Network RTK technology is an important real-time regional high-precision GNSS positioning technology, but there are few related studies based on the BDS-3 new signal system. In the practical network RTK application scenario, the performance comparison of the BDS-3 new signal combination (B1C+B2a) and transition signal combination (B1I+B3I), the positioning performance evaluation of the single BDS-3 constellation for network RTK service, the positioning performance comparison of BDS-3, BDS-2, and GPS, and the positioning performance of BDS-2/3 constellation joint combination should be further studied. In this paper, five actual reference stations and one test station of a provincial CORS network in central China were verified. Firstly, the service effects of two conventional BDS-3 signal combinations (B1C+B2a) and (B1I+B3I) were compared from two aspects of atmospheric correction accuracy and regional modeling accuracy. Then, taking the GPS system as reference, five experimental schemes of GPS, BDS-2, BDS-3 [B1I+B3I], BDS-3 [B1C+B2a], BDS-2/3 are designed to evaluate the positioning performance of BDS-3 network RTK and compare its service capability with other systems. In addition, different from the conventional plane atmospheric modeling methods, algorithms of this paper partially referenced Flächenkorrekturparameter (FKP) horizontal gradient factor solution strategy, which is described in the positioning algorithm section. The above work is expected to provide some reference for the processing of a new constellation and new signal system of BDS-3 in the practical application scenarios of network RTK. It should be pointed out that VRS of Trimble is a branch of network RTK technology, and its main advantage is that the server does not need to send the physical coordinates of the reference station, so it has good confidentiality. In addition, this technology is compatible with conventional RTK algorithms and is convenient for market promotion. Therefore, it is also the most widely used technology [17,18]. The research of this paper is mainly based on this technology model.

2. Network RTK Positioning Algorithm

2.1. Ambiguity Resolution of Reference Stations

The fixed baseline ambiguity between reference stations is the premise for network RTK to realize atmospheric modeling and generate high precision VRS observations. For the baseline between network RTK long-distance stations, the commonly used solution model is the ionosphere-free combined model, which combines the observation domain and the ambiguity domain [16,17,19,20]. When using this model, the wide lane ambiguity should be fixed after the moving serial average based on the Hatch-Melbourne-Wübbena (HMW) combination, and then the ionosphere-free combination ambiguity can be combined to determine the narrow lane ambiguity. Since the solution of MW combination is highly dependent on pseudo-range observations, it takes a long time for smoothing to achieve the fixed ambiguity of wide lane [21]. The non-combined model can assist the rapid convergence of long-distance baseline ambiguity parameters by adding ionospheric and tropospheric variance constraints, and the algorithm is relatively flexible with low noise of observation [21,22]. In this paper, the non-combined model is used to process the baseline data between network RTK reference stations. After correcting the errors of antenna phase center, phase winding, and tropospheric dry component delay, the non-combined double-difference pseudo-range, and phase observation equations are as follows:
P r b , k p q = ρ r b p q + μ k I r b , 1 p q + m r p q w r m b p q w b + ε P , k
L r b , k p q = ρ r b p q μ k I r b , 1 p q + m r p q w r m b p q w b + λ k N r b , k p q + ε L , k
where P r b p q and L r b p q are the pseudo-range and phase observation by distance; ρ r b p q represents the double-difference geometric distance between satellite and receiver; k is the frequency signal; I r b , 1 p q represents the oblique path ionospheric delay at f 1 ; μ k represents the frequency-dependent ionospheric delay coefficient;   μ k = f 1 2 / f k 2 ; m and w represent the wet delay mapping function of the single-difference between the satellites and zenith tropospheric wet delay of the corresponding stations respectively; N is double-difference ambiguity for the corresponding frequency; λ is the wavelength for the corresponding frequency; b and r represent the reference station and the rover station, respectively; p and q refer to the reference satellite and the non-reference satellite, respectively; ε P and ε L represent the observed noise of pseudo-range and phase, respectively. It should be pointed out that single-difference and double-difference are mathematical solution methods. It is essentially the Gaussian elimination method in linear algebra. The main purpose is to eliminate or weaken the various error terms in the observation equation so as to facilitate the solution of the equation system [17]. As the coordinates of the reference station in network RTK mode are accurately known, ρ r b p q is the known value, and the observation equation of the baseline calculation error is as follows:
E [ δ P δ L ] = [ μ k μ k     m r m r     m b m b     0 λ k ] [ I 1 w r w b N k ]
where E [ · ]   is expected value, δ P and δ L are the residual vectors of the double-difference pseudo-range and phase observations. I 1 , w r , w b and N k represent the double-difference oblique path ionospheric delay, zenith troposphere wet delay of rover station, zenith troposphere wet delay of the base station, and double-difference ambiguity, respectively. μ k , m r , m b , and λ k refer to the corresponding coefficient matrix. According to Equation (3), the parameters can be solved by the Kalman filter. The high precision double-difference atmospheric delay can be extracted only when the ambiguity is fixed. In order to improve the fixed rate of ambiguity, the original ambiguity is first converted to the ambiguity of wide lane and narrow lane [23,24], and then the LAMBDA method is used to fix the ambiguity of wide lane and narrow lane, respectively, in the ambiguity domain. When the ambiguity of wide lane is fixed, the following Equation is used to update the ambiguity of narrow lane:
{   C 2 ˜ = C 2 ^ Q C 2 ^ C 1 ^ Q C 1 ^ C 1 ^ 1 ( C 1 ^ C 1 ˘ ) Q C 2 ˜ C 2 ˜ = Q C 2 ^ C 2 ^ Q C 2 ^ C 1 ^ Q C 1 ^ C 1 ^ 1 Q C 1 ^ C 2 ^
where C 1 = N 1 N 2 represents the ambiguity of wide lane (WL), C 2 = N 1 is the ambiguity of narrow lane (NL), and Q refers to the corresponding covariance matrix. Compared with directly solving the narrow lane float ambiguity C 2 ^ , the narrow lane float ambiguity C 2 ˜ updated by using the wide lane fixed ambiguity C 1 ˘ has higher accuracy and is easier to fix. In the third part of this paper, the specific processing strategy of each parameter is given.
After the narrow lane ambiguity parameters of L1 and L2 frequency signals are fixed, the high-precision double-difference tropospheric delay and double-difference ionospheric delay on the oblique path of each fixed satellite can be directly extracted according to Equations (5) and (6) [25], where φ represents phase observations expressed by weeks:
T r b p q = f 1 2 f 1 2 f 2 2 ( λ 1 φ r b , 1 p q λ 1 N r b , 1 p q ) f 2 2 f 1 2 f 2 2 ( λ 2 φ r b , 2 p q λ 2 N r b , 2 p q ) ρ r b p q
I r b p q = f 2 2 f 1 2 f 2 2 [ ( λ 1 φ r b , 1 p q λ 2 φ r b , 2 p q ) ( λ 1 N r b , 1 p q λ 2 N r b , 2 p q ) ]

2.2. Classification Modeling of Ionospheric and Tropospheric Delay

Regional atmospheric modeling is a key factor affecting the accuracy of network RTK service [26]. Literature [27] compares the commonly used atmospheric delay modeling methods and points out that the modeling accuracy of all methods is similar, and the interpolation accuracy of 2–3 cm can be obtained for medium and short baseline networks within 100 km. After a comprehensive comparison of various atmospheric modeling strategies, this paper draws on the solution strategy of the horizontal gradient factor of FKP. Namely, FKP broadcasts correct information for the geometric level gradient factor and the ionosphere horizontal gradient factor. The geometric horizontal gradient factor is used to correct non-dispersion errors such as the tropospheric residual, and it should be pointed out that the tropospheric delay has a strong correlation with the height of the station [17,27]. This paper adopts the strategy of combining prior tropospheric model correction with atmospheric modeling. Firstly, the tropospheric delay extracted from the baseline of each reference station is compensated with an a priori high-precision tropospheric model (such as GPT2 [28]), which is related to altitude difference. In other words, the tropospheric delay of each baseline involved in modeling is normalized to a unified elevation plane before modeling. There is no need to consider elevation normalization before ionospheric horizontal gradient factor modeling, but different from conventional planar modeling strategy methods, this method will determine the weight according to the elevation angle of the satellite under each modeling baseline before ionospheric interpolation [29]. In addition, before modeling, the weights of modeling baselines should be determined according to the distance between each baseline and the rover station, which is inversely proportional to the weight. If p is a reference satellite, the regional double-difference atmospheric modeling method of q , which is a non-reference satellite, is shown in Equations (7) and (8):
[ T H , 1 p q T H , n p q I 1 p q I n p q ] = 6.37 [ w 1 w n w 1 w n ] · [ d B 1 d L 1 · cos ( B 1 , r e f ) 0 0 d B n d L n · cos ( B n , r e f ) 0 0 0 0 H 1 q · d B 1 H 1 q · d L 1 · cos ( B 1 , r e f ) 0 0 H n q · d B n H n q · d L n · cos ( B n , r e f ) ] [ t r o p b H p q t r o p l H p q i o n b p q i o n l p q ]
H n q = 1 + 16 · [ 0.53 e l n q π ] 3
where, T H , n p q is the double-difference tropospheric delay of the nth modeling baseline of satellite q , which has been naturalized to the standard elevation H; I n p q is the double-difference ionospheric delay at the L 1 frequency signal of the nth satellite q participating in the modeling baseline; w n is the weight of the nth baseline involved in modeling for satellite q ; d B n and d L n are the latitude and longitude span of the nth baseline involved in modeling for satellite q ; B n , r e f is the latitude of the nth baseline reference station. e l n q is the elevation angle of the rover terminal of satellite q at the nth baseline. All the angle information in the Equation is in radians. t r o p b H p q and t r o p l H p q are the north-south and east-west gradients of the geometric horizontal gradient factor of satellite q . i o n b p q and i o n l p q are the north-south and east-west gradients of the ionospheric gradient factor of satellite q .
Equations (7) and (8) are involved in modeling double-difference observation atmospheric delay information; thus, the gradient factor is based on the double-difference observation. According to the general position of the rover station, the main reference station can be selected from the reference station list, and then the atmospheric errors near the rover station can be interpolated by using the obtained geometric horizontal gradient factor and ionospheric horizontal gradient factor. The calculation process is shown in Equations (9) and (10):
T H , M V p q = 6.37 · ( t r o p b H p q · d B M V + t r o p l H p q · d L M V · cos ( B M V , r e f ) )
I M V p q = 6.37 · H q ( i o n b p q · d B M V + i o n l p q · d L M V · cos ( B M V , r e f ) )
where M and V represent the main reference station and the VRS, respectively. T H , M V p q and I M V p q respectively represent the double-difference tropospheric delay and the double-difference ionospheric delay interpolated by satellite q near the VRS. It should be noted that T H , M V p q interpolated according to the general position is the double-difference tropospheric delay naturalized to standard elevation H, and the geometric horizontal gradient factor should be naturalized to the elevation plane of the rover station before using it to generate virtual observations.

2.3. Generation of Virtual Observations (VRS)

The virtual observations are obtained from the observations of the main reference station and various error corrections [26,30]. The satellite signal transmission time and atmospheric delay of the observation between the virtual reference station and physical reference station are different, and the observation of the main reference station needs to be corrected by geometric correlation terms and atmospheric delay. The steps to generate virtual observations based on the observations of the main reference station are as follows:
{   P V , k p = P M , k p + ρ M V p φ V , k p = φ M , k p + ρ M V p / λ k P V , k q = P M , k p q + P V , k p + ρ M V p q + γ k · I M V , 1 p q + T M V p q φ V , k q = φ M , k p q + φ V , k p + ( ρ M V p q γ k · I M V , 1 p q + T M V p q ) / λ k
where, P V , k p and φ V , k p represent the pseudo-range and phase virtual observation of reference satellite, while P V , k q and φ V , k q represent the pseudo-range and phase observation of the non-reference satellite. The derivation of the above Equation is based on the following three assumptions:
  • The ambiguity of all satellite observations of the VRS is the same as that of the main reference station.
  • The clock error between the virtual reference station and the main reference station is the same; that is, the capture time of the observation of the two stations is the same.
  • The ionospheric and tropospheric delays of the reference satellite of the VRS are the same as those of the main reference station.
In addition, the generation of VRS is completely based on the observation values of the main reference station. Besides ionospheric and tropospheric errors, there is also geometric error correction. The generation of ρ V p and ρ V q related to geometric correction is an iterative process. The condition at the end of the iteration is that the satellite position is used to generate the geometric distance and the satellite position at the launch time based on the inverse calculation of P V p and P V p are less than a certain threshold (e.g., 0.01mm). Theoretically, there will be a deviation in the observation of the generated reference satellite. However, since the deviation of all satellites is consistent, the user will eliminate the influence of this deviation in the combination of double-difference positioning, so the positioning accuracy of the terminal will not be affected [30].

3. Datasets and Processing Strategy

3.1. Datasets

The experimental data in this paper were collected from several sites of a provincial CORS network in central China. The site distribution is shown in Figure 2, among which WH02, WH04, XN01, HG02, and HG05 are five actual CORS reference stations. According to Delaunay triangle rules, five reference stations can form seven baselines, and the average distance between stations is 92 km. SC17 is a rover station set up in the network to verify the network RTK service effect. In practical application, WH04, which is closest to SC17, is selected as the main reference station with a distance of 47 km. It should be pointed out that all site coordinates are uniformly calibrated by unified high-precision solution software before data processing, including actual reference stations and rover stations. All sites can receive BDS-3 satellites (up to PRN46) and frequency signals (B1I, B1C, B2a, B2b, B3I). The data collection time was 2021/09/21/00:00:00 to 24:00:00 (GPS), and the sampling interval was 1 s. Figure 3 shows the skyplot map of BDS-2 and BDS-3 satellites of the WH04 station during the data acquisition period. In Section 4.1, the WH04-HG02 baseline is selected as the representative to make a detailed comparative analysis of the double-difference atmospheric correction accuracy under the combination of B1C+B2a and B1I+B3I. In Section 4.2, the WH04-SC17 baseline was selected to compare and analyze the interpolation precision of regional atmospheric modeling under the two signal combinations. Section 4.3 takes the GPS system as a reference to compare and analyze the network RTK terminal positioning performance of the SC17 station under different system and frequency signal combinations. It should be pointed out that the B1I+B3I frequency signal combination is used in both BDS-2 and BDS-2/3 schemes.

3.2. Processing Strategy

Table 2 shows the algorithm processing strategy of network RTK server and terminal RTK. It can be seen that compared with terminal RTK processing, the main difference of network RTK processing is that there is no need to estimate coordinate parameters, but the observation equation needs to add tropospheric wet delay and ionospheric delay as the parameters to be estimated. In addition, the non-combined model used in the algorithm processing in this paper can assist the rapid convergence of long-distance baseline ambiguity parameters by adding reasonable variance constraints of ionospheric and tropospheric parameters to the equation (virtual observation equation).

4. Experiment and Analysis

4.1. Analysis of DD Atmospheric Correction at Reference Stations

The double-difference atmospheric delay, extracted after the reference station network baseline is fixed, is the premise of regional atmospheric modeling interpolation. Therefore, this section takes the WH04-HG02 baseline as an example to analyze the accuracy of the extracted double-difference atmospheric delay. The analysis period is selected from 13:30:00 to 15:30:00 (GPS time), and the reference satellite in this period is B40. A total of 10 non-reference satellites participated in the calculation during this period. Figure 4 shows the double-difference ionospheric and tropospheric delay time series solved by using the combination of two kinds of frequency signal combinations. In Figure 5, residual time series corresponding to two kinds of frequency signal combinations with fixed ambiguity are given according to pseudo-range and phase, respectively. Table 3 shows the root mean square (RMS) values of the corresponding index time series for each satellite of the two types of frequency signal combinations. The mean value of the RMS of each satellite under each index is calculated as the final statistical value of the corresponding index of this frequency signal combination and listed in the last line of Table 3. Figure 6 shows the mean histogram of the double-difference ionospheric and tropospheric RMS values of all satellites under the two kinds of frequency signal combinations of the WH04-HG02 baseline based on the last line of Table 3.
As can be seen from Figure 4, both ionospheric delay and tropospheric delay change slowly, and the atmospheric change of each satellite shows a trend related to elevation angle; that is, the atmospheric fluctuation is larger under low elevation. In addition, the overall variation trend of atmospheric delay extracted from the combination of the two types of frequency points is basically similar. It can be seen from Figure 5 that the pseudo-range residual after the ambiguity is fixed within 2 m in most periods, and the phase residual is within 2 cm. Table 3 summarizes the RMS statistics of each indicator. It can be seen that the atmospheric solution accuracy of the B1C+B2a combination is slightly better than that of the B1I+B3I combination, and the statistical results of each indicator are basically consistent. The final RMS values of the six indicators of ionosphere, troposphere, and pseudo-range/phase post-test residuals were: B1C+B2a (0.016 m, 0.032 m, 0.704 m, 0.586 m, 0.0053 m, 0.0026 m); B1I+B3I (0.019 m, 0.037 m, 0.871 m, 0.699 m, 0.0049 m, 0.0028 m). The above rules are also consistent in the other baselines, which is not shown in this paper due to space. In addition, Table 4 also shows the fixed rate of each baseline in the network. It can be seen that the B1C+B2a combination of most baselines is also slightly better than the B1I+B3I combination. It should be noted that in order to ensure the accuracy of the baseline calculation, the judgment conditions for fixed baseline setting here are as follows: the minimum number of satellites with fixed NL ambiguity is not less than 5, or the number of fixed satellites accounts for more than 60% of the number of satellites participating in the calculation, at least one of the two conditions should be met.

4.2. Accuracy Analysis of Regional Atmosphere Modeling and Interpolation

The modeling accuracy of the regional double-difference atmospheric delay is a key factor affecting the accuracy of the network RTK service. Therefore, based on the analysis period in Section 4.1, the SC17 site is selected as the rover test station in this section. The atmospheric correction of this site is interpolated according to the modeling strategy mentioned above. At the same time, the WH04-SC17 baseline was calculated, and the double-difference atmospheric information was directly extracted as the reference value (JX), and the modeling value (CZ) was compared with its accuracy. Figure 7 takes the B33 satellite as an example to show the time series of atmospheric modeling values and reference values under the two frequency signal combinations. Table 5 shows the RMS values of corresponding indexes for all satellites in the test period under the combination of two types of frequency signals. The mean value of RMS of each satellite under each index is taken as the final statistical value of the corresponding index of this frequency signal combination and listed in the last column of Table 5. Figure 8 draws the histogram of the mean RMS of atmospheric modeling values and reference values of station SC17 under different frequency signal combinations given in the last column of Table 5.
According to the RMS of each satellite modeling deviation value (DIFF) in Table 5, it can be seen that the interpolation accuracy of atmospheric modeling is about 1 cm. The following two conclusions can be drawn from Figure 7: Firstly, the time series of atmospheric modeling value and the reference value of the B33 satellite under the combination of two frequency signals are basically consistent, but the modeling deviation shows a trend of increasing with the decrease of elevation angle. This is consistent with the law of atmospheric correction accuracy and elevation angle presented in Section 4.1, which also confirms the reasonability of baseline weighting based on elevation angle in the modeling interpolation strategy in Section 2.2 of this paper. In addition, the modeling deviation of the B1I+B3I combination is obviously greater than that of the B1C+B2a combination, which is consistent with the statistical comparison results of atmospheric correction accuracy between the two combinations in Section 4.1. The rest of the satellites show the same pattern, not shown in this article for reasons of space. The following two conclusions can be drawn from the mean RMS of each indicator shown in Figure 8: Firstly, the atmospheric modeling value (CZ) is smoother than the baseline reference value (JX). This is because the regional atmospheric modeling is based on the weighted comprehensive results of multiple baselines around the main reference station, which is essentially equivalent to smoothing the atmospheric information of each baseline, from the time series of the B33 satellite given in Figure 7, it can also be seen that the modeling value should be smoother. Secondly, the statistical results of all indicators in the B1C+B2a combination are better than those in the B1I+B3I combination, which is consistent with the analysis results of atmospheric correction in Section 4.1. The final RMS values of model value (CZ), reference value (JX), and mutual difference of two values (DIFF) of ionosphere and troposphere were B1C+B2a (0.007 m, 0.011 m, 0.007 m, 0.016 m, 0.018 m, 0.01 m), B1I+B3I (0.009 m, 0.016 m, 0.01 m, 0.016 m, 0.022 m, 0.013 m).

4.3. Analysis of Positioning Performance of Network RTK Terminal

The service performance of network RTK is finally reflected in the positioning effect of the terminal. Therefore, this section takes the GPS system as reference to analyze the positioning effect of network RTK of SC17 station under GPS, BDS-2, BDS-3 [B1I+B3I], BDS-3 [B1C+B2a], and BDS-2/3. Figure 9 shows the number of satellites and the distribution of position dilution of the precision (PDOP) value of Station SC17. It can be seen that the number of satellites and the distribution of PDOP value of BDS-3 are better than that of BDS-2 in most periods of time because BDS-3 is currently operating in full constellation and MEO constellation configuration is better. In addition, the visible satellite number and PDOP value distribution of the BDS-3 system are also better than that of the GPS system most of the time. Figure 10 shows the positioning results of fixed solutions under five design schemes of Site SC17. Table 6 shows the baseline fixation rate and RMS statistics of fixed solutions based on the schemes in Figure 10.
It should be noted that the single GPS is used as a performance reference, and the network RTK algorithm processing is completely consistent with other solutions. It uses L1+L2 as the main frequency signals for the reference station baseline calculation. In order to ensure the accuracy of the baseline calculation. The judgment conditions for the fixed baseline setting of the reference station are also: the minimum number of satellites with fixed ambiguity in narrow lanes is not less than five, or the number of fixed satellites accounts for more than 60% of the number of satellites involved in the solution. At least one of the two conditions is met. The specific parameter processing strategy of the server and terminal is shown in Table 2.
As can be seen from Figure 10, the horizontal and elevation error of any combination of GPS, BDS-2, BDS-3 [B1I+B3I], BDS-3 [B1C+B2a], and BDS-2/3 fixed solutions are basically within 3 cm and 5 cm, respectively. According to the RMS statistics given in Table 6, the horizontal accuracy is basically within 1 cm, the elevation accuracy is basically within 2 cm, and the fixed rate is above 95%. According to the statistical results of the fixed rate and RMS for each scheme given in Table 6, the following rules can be obtained: the positioning accuracy of BDS-2 is relatively poor; GPS is superior to the BDS-2; any frequency signal combination of BDS-3 is better than GPS and BDS-2. The BDS-3 new signal combination (B1C+B2a) was slightly better than the transition signal combination (B1I+B3I). Due to the large number of satellites involved in the calculation, the positioning accuracy and fixed rate of the BDS-2/3 scheme in all directions are generally superior to other combinations. Relevant laws can also be reflected in the positioning time series of each scheme plotted in Figure 10.

5. Discussion

Since the BDS-3 system began to initially provide global service at the end of 2018, a large number of scholars have studied the PNT service performance of BDS-3, mainly focusing on the aspects of signal quality, orbit, clock error, PPP positioning performance, and conventional RTK service performance. Network RTK technology is an important real-time regional high-precision GNSS positioning technology, but there are few related studies based on the new BDS-3 signal system. In this paper, the algorithm model of network RTK is firstly derived in detail, and then the positioning performance of BDS-3 is evaluated based on the measured data of a provincial CORS network in central China, and a better positioning effect is obtained. The experimental analysis also points out the direction for further research:
  • Firstly, in the long-distance baseline calculation between reference stations, tropospheric wet delay and ionospheric delay were estimated as parameters to assist the fixation of ambiguity. Although random walk was used to estimate parameters and a variance constraint was applied to accelerate the convergence of the baseline, the initial parameter values were set to zero. Theoretically, adding an external correction model to provide relatively accurate initial values would further shorten the baseline convergence time.
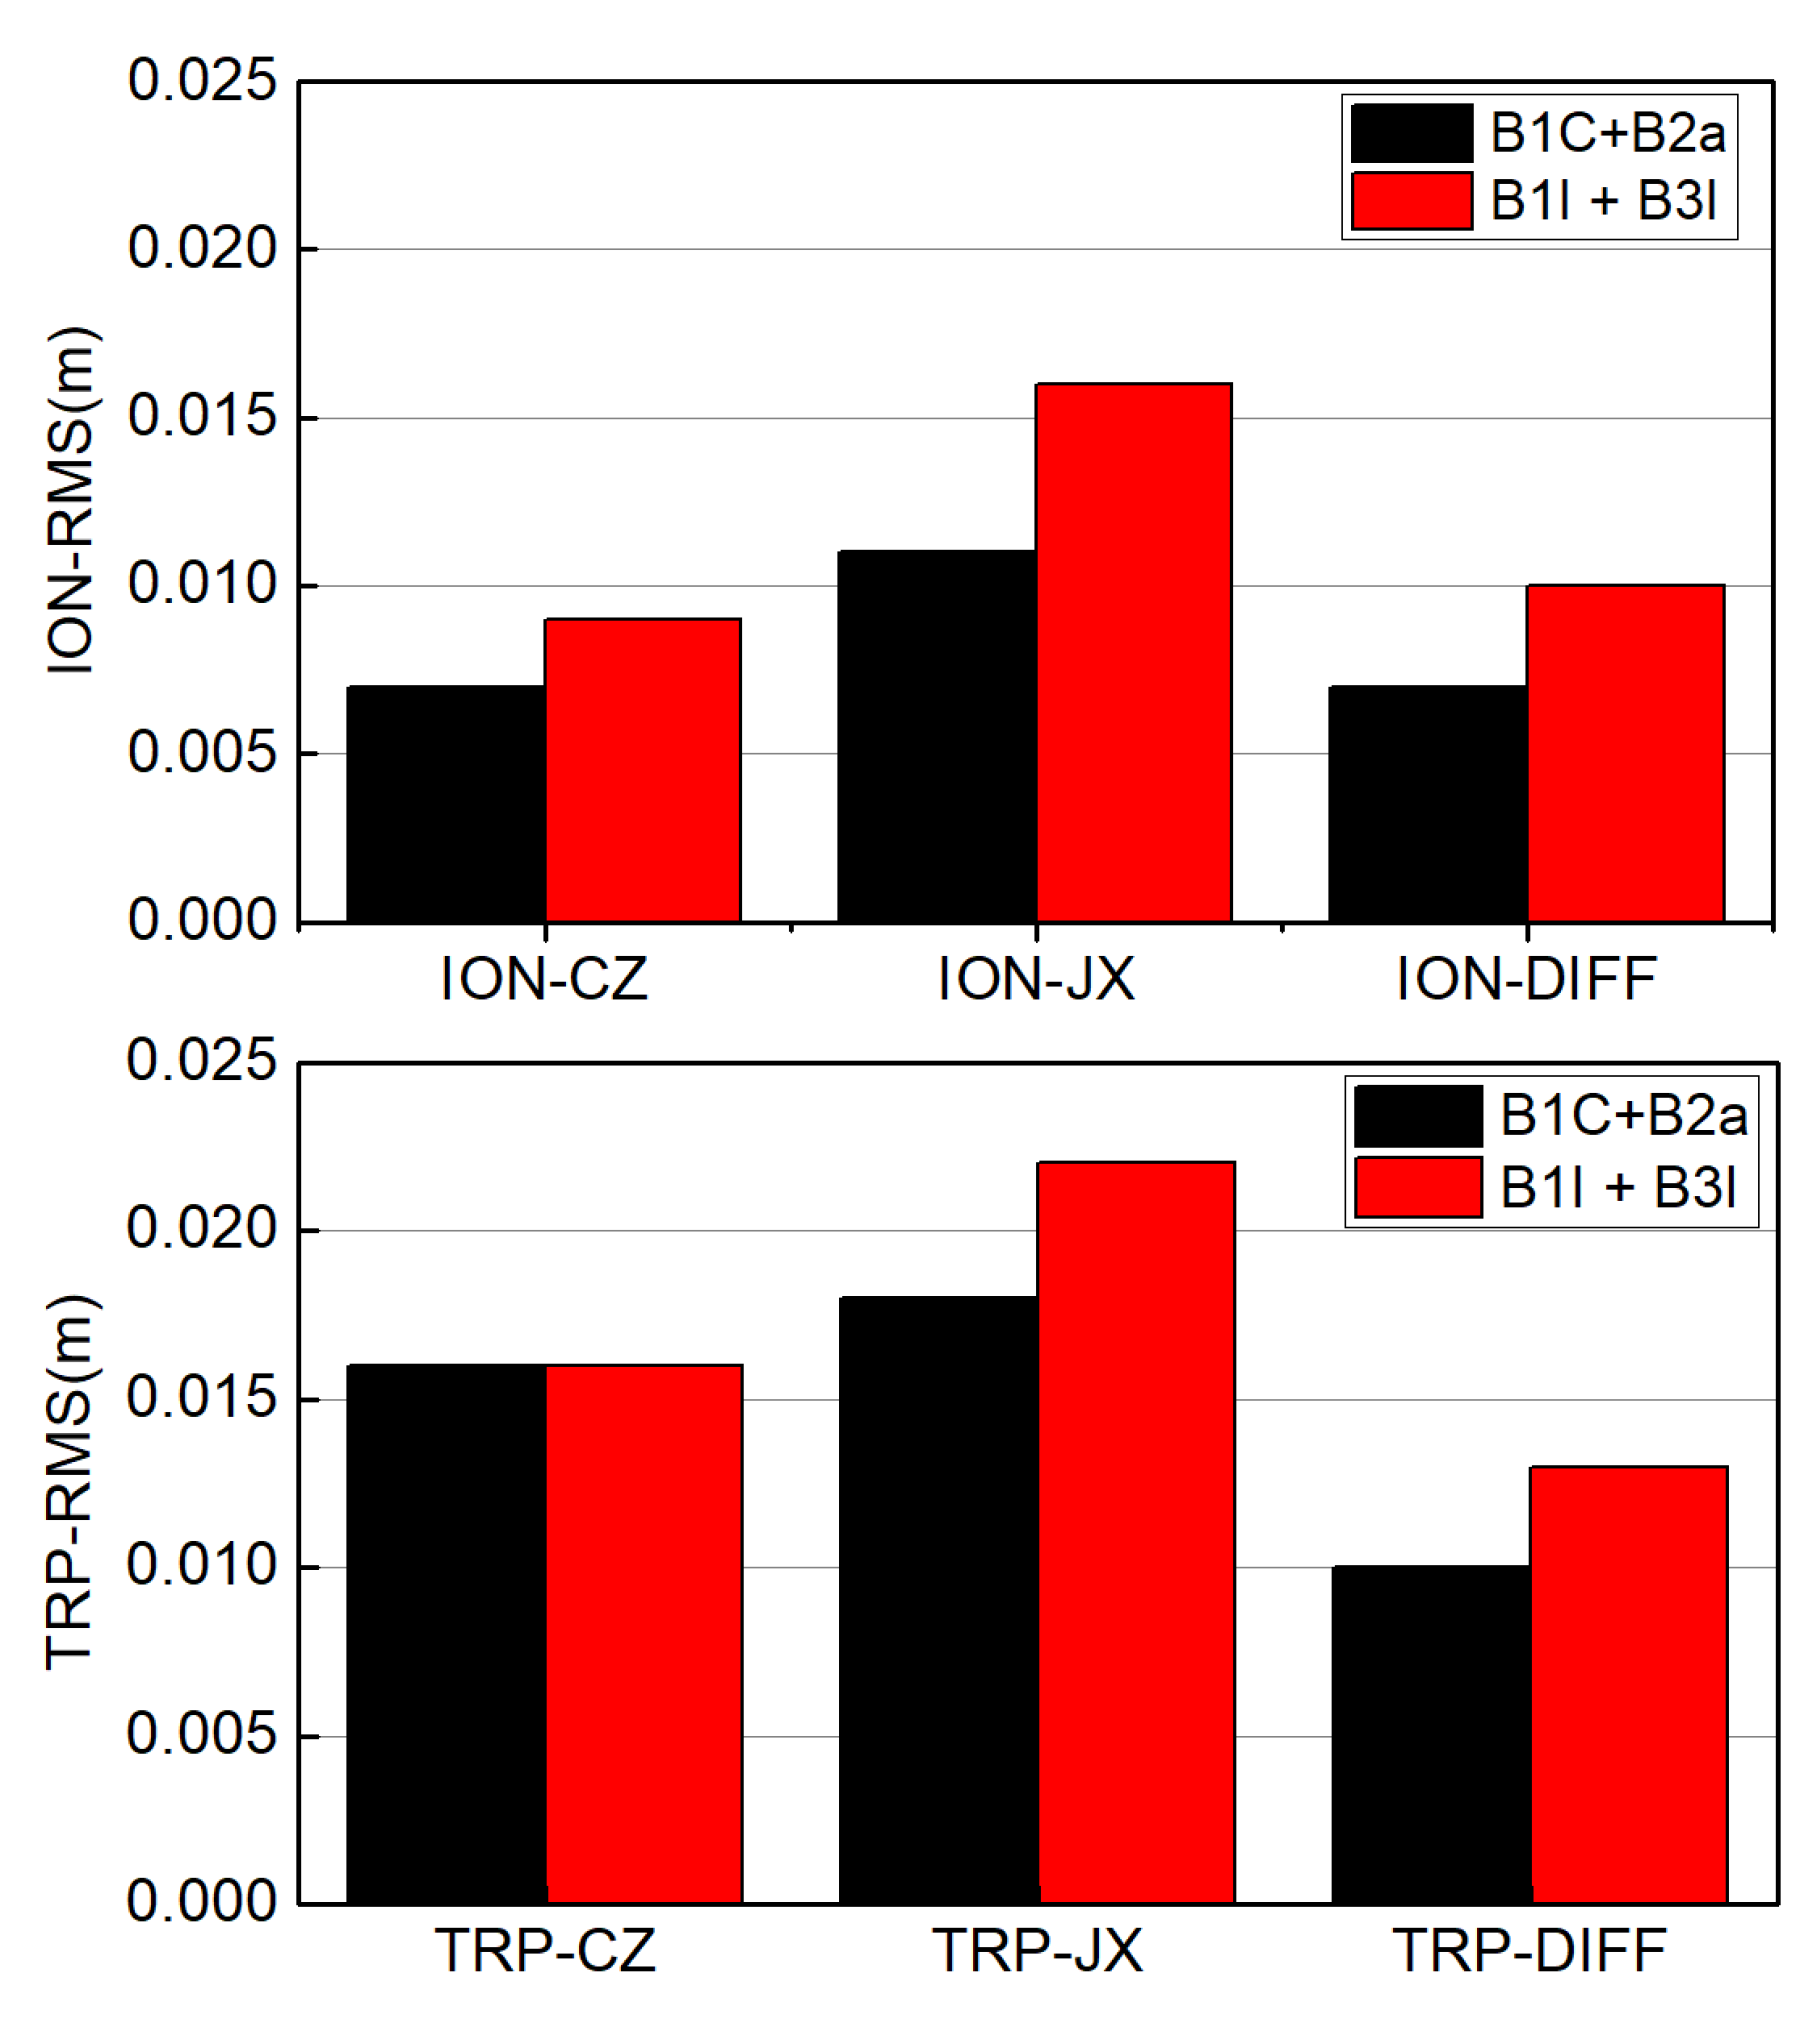
  • Secondly, the experimental analysis results in Section 4.1 and Section 4.2 show that the ionospheric and troposphere atmospheric modeling and interpolation accuracy are negatively correlated with the satellite elevation angle. In Section 2.2 of atmospheric modeling strategy, this paper gives a preliminary method of ionospheric weighting based on elevation angle, but a more refined modeling weighting method considering the influence of elevation angle needs to be further studied.
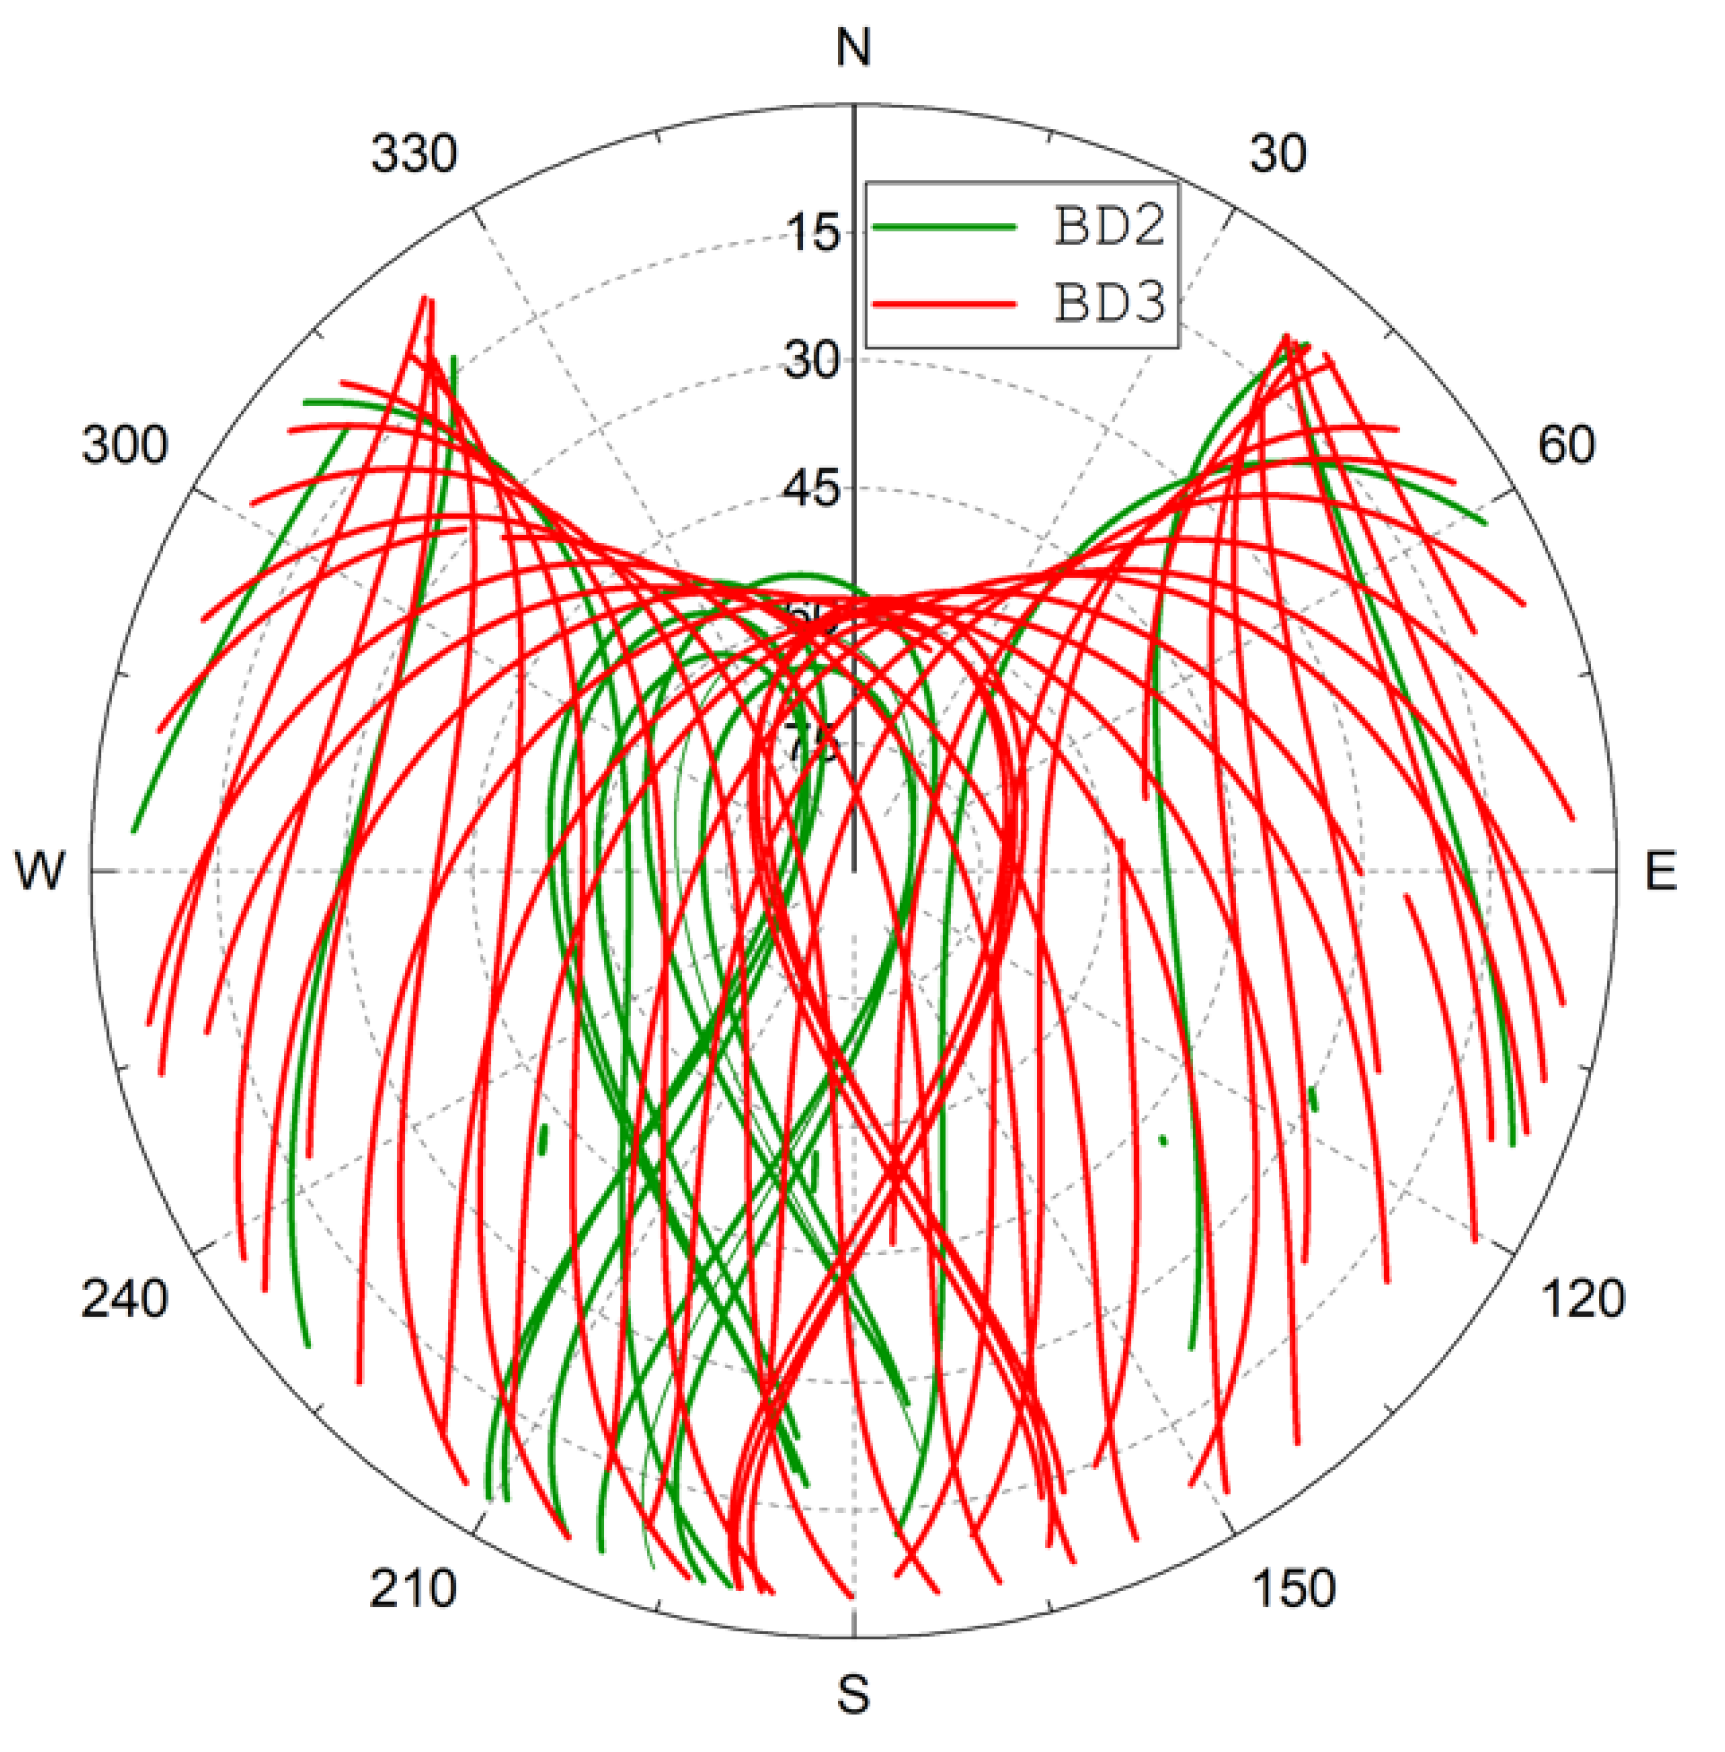
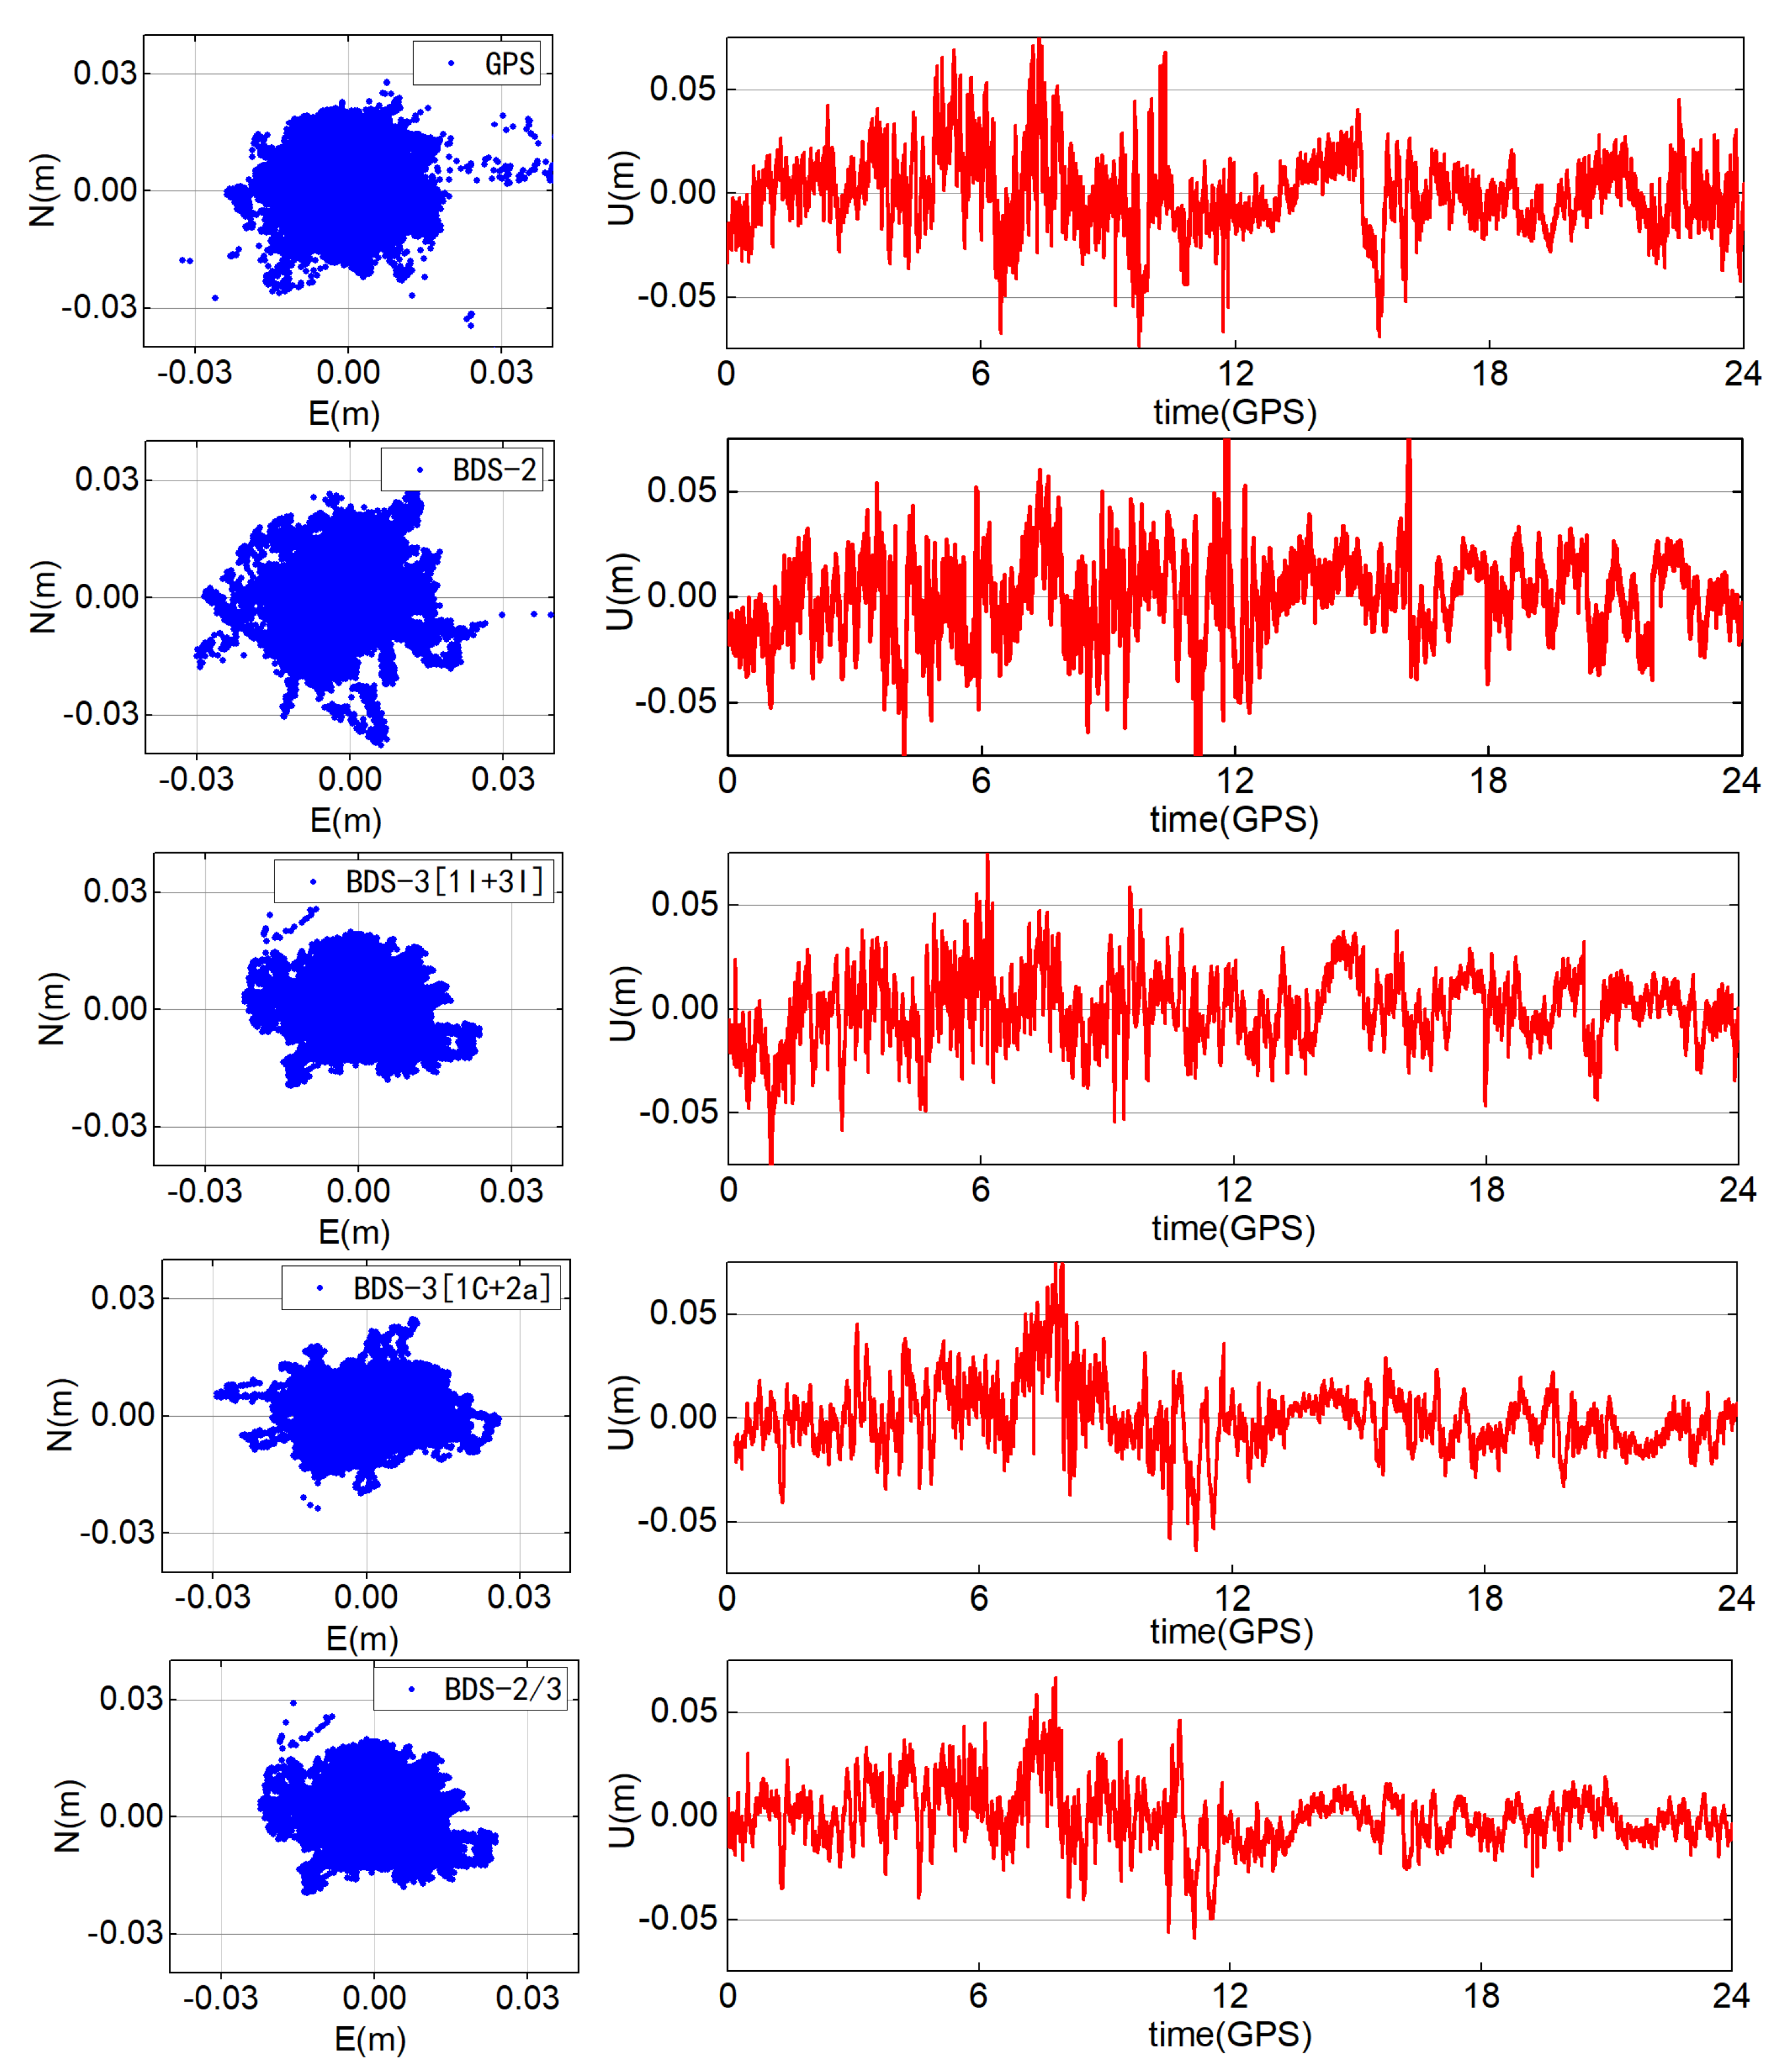
  • Finally, Section 4.3 of this paper takes the GPS system as reference and designs five schemes to preliminarily evaluate the positioning performance of network RTK of BDS-3. The horizontal error of each scheme is basically within 3 cm, and the elevation error is within 5 cm, which can meet the requirements of providing network RTK high-precision service independently. In addition, the terminal positioning effect statistics show that the positioning accuracy of BDS-2 is relatively poor, the positioning accuracy of BDS-3 is only slightly better than that of GPS, and the combined processing effect of BDS-2/3 using B1I+B3I transition signal is the best. The reason why the positioning performance of BDS-3 is slightly better than that of GPS may be attributed to the fact that the experimental data in this paper were collected in central China. Compared with GPS, the number of BDS-3 satellites and the distribution of DOP values in the Asia-Pacific region are obviously more advantageous. The number of satellites and the distribution of PDOP values of Station SC17, shown in Figure 9, can also be seen as related laws. Further comparative analysis requires further data collection of more regions for experimental demonstration.
In addition, the theoretical basis of network RTK in this paper is based on the double-difference mode. In the aspect of algorithm practice, the double-difference model theory is relatively simple and does not need the support of precise products. However, when there are too many reference stations, the double-difference model has a large amount of computation. With the development of PPP-RTK technology [30], the non-difference model is used to fix the non-difference ambiguity of reference stations, and then the independent non-difference atmospheric delay of each station is extracted. It can be compatible with the traditional double-difference network RTK technology, and the product generation strategy under different modes needs to be further studied.

6. Conclusions

This paper first describes the current research status of the BDS-3 system and then gives the algorithm processing model of network RTK. Finally, the experimental verification is carried out based on five actual reference stations and one test station of a provincial CORS network in central China. The service effects of BDS-3 new signal combination (B1C+B2a) and transition signal combination (B1I+B3I) were compared from the aspects of atmospheric correction accuracy and regional modeling accuracy. Finally, taking the GPS system as reference, five schemes were designed to evaluate the positioning performance of network RTK in the BDS-3 system. The following conclusions are drawn:
  • When the combination of B1C+B2a and B1I+B3I of a single BDS-3 constellation provides VRS service, the fixed rate of terminal RTK is above 95%, and the horizontal and elevation accuracy are within 1 cm and 2 cm, respectively. The single BDS-3 system is sufficient to meet the needs of providing network RTK high-precision positioning service in surveying and mapping operations. In addition, the terminal positioning effect statistics show that the positioning accuracy of BDS-2 is relatively poor, GPS is superior to BDS-2, the positioning accuracy of BDS-3 is better than that of GPS and BDS-2, BDS-2/3 combined processing of B1I+B3I transition signal has the best effect, and its accuracy in the E and N directions is better than 0.5 cm, and that in the U direction is better than 1.5 cm.
  • Based on the analysis of atmospheric correction, regional atmospheric modeling, and network RTK terminal positioning accuracy, it can be seen that the new signal combination (B1C+B2a) of the BDS-3 system is slightly better than the transition signal combination (B1I+B3I). In addition, the double-difference atmospheric correction of the reference station and the accuracy of regional atmospheric modeling both show a positive correlation with elevation angle, so it is necessary to carry out reasonable weighting processing for the satellite according to elevation angle in regional atmospheric modeling.
  • According to the above analysis, when a single BDS-3 constellation provides network RTK service, the combination of B1C+B2a is suggested to be adopted as the main frequency signals for calculation. When the BDS-2/3 combined solution provides network RTK service, it is recommended to adopt the B1I+B3I combination as the main frequency signals for the solution.
It should be noted that the above analysis of BDS-3 is based on two conventional BDS-3 signal combinations, namely the new signal combination (B1C+B2a) and the transition signal combination (B1I+B3I). It is also a signal combination recommended in the literature [15], and the effects of other signal combinations need to be further studied. The slight superiority of the new BDS-3 signal combination (B1C+B2a) over the transition signal combination (B1I+B3I) may be attributed to the advanced signal structure and modulation technology. In the next step, more relevant experiments and analyses will be designed to find deeper reasons.

Author Contributions

Conceptualization, P.W. and H.L.; software, P.W. and Z.Y.; formal analysis, B.S.; data curation, X.X.; writing—original draft preparation, P.W.; writing—review and editing, G.N., B.S. and X.X. All authors have read and agreed to the published version of the manuscript.

Funding

This research was funded by the project “Key Research and Development Project of Hubei Province” (No. 2020BAB095), the project “Pre-funded Project of Hubei Industrial Innovation Consortium” (No. 2020DEB018), the project “The National Key Research and Development Scheme Strategic International Cooperation in Science and Technology Innovation Program” (No.2018YFE0206500).

Data Availability Statement

Not Applicable.

Conflicts of Interest

The authors declare no conflict of interest.

References

  1. CSNO. Development of the BeiDou Navigation Satellite System (Version 4.0); China Satellite Navigation Office Technical Report; China Satellite Navigation Office: Beijing, China, 2019. Available online: http://en.beidou.gov.cn/SYSTEMS/Officialdocument/index_1.html (accessed on 18 August 2021).
  2. Yang, Y.; Xu, Y.; Li, J.; Yang, C. Progress and performance evaluation of BeiDou global navigation satellite system: Data analysis based on BDS-3 demonstration system. Sci. China Earth Sci. 2018, 61, 614–624. [Google Scholar] [CrossRef]
  3. Yang, Y.; Gao, W.; Guo, S.; Mao, Y.; Yang, Y. Introduction to BeiDou-3 navigation satellite system. Navig.-J. Inst. Navig. 2019, 66, 7–18. [Google Scholar] [CrossRef] [Green Version]
  4. Jia, X.; Zeng, T.; Ruan, R.; Mao, Y.; Xiao, G. Atomic Clock Performance Assessment of BeiDou-3 Basic System with the Noise Analysis of Orbit Determination and Time Synchronization. Remote Sens. 2019, 11, 17. [Google Scholar] [CrossRef] [Green Version]
  5. Zhang, B.; Jia, X.; Sun, F.; Xiao, K.; Dai, H. Performance of BeiDou-3 Satellites: Signal Quality Analysis and Precise Orbit Determination. Adv. Space Res. 2019, 64, 687–695. [Google Scholar] [CrossRef]
  6. Huang, C.; Song, S.; Chen, Q.; Zhou, W. Preliminary Analysis of BDS-3 Data Based on iGMAS. Chin. Astron. Astrophys. 2019, 43, 390–404. [Google Scholar] [CrossRef]
  7. Wang, C.; Zhao, Q.; Guo, J.; Liu, J.; Chen, G. The contribution of intersatellite links to BDS-3 orbit determination: Model refinement and comparisons. J. Inst. Navig. 2019, 66, 71–82. [Google Scholar] [CrossRef] [Green Version]
  8. Xie, X.; Geng, T.; Zhao, Q.; Cai, H.; Zhang, F.; Wang, X.; Meng, Y. Precise orbit determination for BDS-3 satellites using satellite-ground and inter-satellite link observations. GPS Solut. 2019, 23, 12. [Google Scholar] [CrossRef]
  9. Jiao, G.; Song, S.; Ge, Y.; Su, K.; Liu, Y. Assessment of BeiDou-3 and Multi-GNSS Precise Point Positioning Performance. Sensors 2019, 19, 20. [Google Scholar] [CrossRef] [Green Version]
  10. Zhang, X.; Hu, J.; Ren, X. New progress of PPP/PPP-RTK and positioning performance comparison of BDS/GNSS PPP. Acta Geod. Et Cartogr. Sin. 2020, 49, 1084–1100. [Google Scholar] [CrossRef]
  11. Jin, S.; Su, K. PPP models and performances from single- to quad-frequency BDS observations. Satell. Navig. 2020, 1, 16. [Google Scholar] [CrossRef]
  12. Zhang, Z.; Li, B.; Nie, L.; Wei, C.; Jia, S.; Jiang, S. Initial assessment of BeiDou-3 global navigation satellite system: Signal quality, RTK and PPP. GPS Solut. 2019, 23, 111. [Google Scholar] [CrossRef]
  13. Hou, P.; Zhang, B.; Yuan, Y.; Zhang, X.; Zha, J. Stochastic modeling of BDS2/3 observations with application to RTD/RTK positioning. Meas. Sci. Technol. 2019, 30, 095002. [Google Scholar] [CrossRef]
  14. Yuan, Y.; Mi, X.; Zhang, B. Initial assessment of single- and dual-frequency BDS-3 RTK positioning. Satell. Navig. 2020, 1, 31. [Google Scholar] [CrossRef]
  15. CSNO. BeiDou Navigation Satellite System Open Service Performance Standard (Version 2.0); China Satellite Navigation Office Technical Report; China Satellite Navigation Office: Beijing, China, 2018. Available online: http://en.beidou.gov.cn/SYSTEMS/Officialdocument/index.html (accessed on 18 August 2021).
  16. Liu, J.; Tu, R.; Han, J.; Zhang, R.; Fan, L.; Zhang, P.; Hong, J.; Lu, X. Initial evaluation and analysis of NRTK positioning performance with new BDS-3 signals. Meas. Sci. Technol. 2020, 32, 014002. [Google Scholar] [CrossRef]
  17. Li, C. Generation and Distribut Iontechn Ique of Precise Differential Corrections for GPS/VRS Network; Southwest Jiaotong University: Chengdu, China, 2007. [Google Scholar]
  18. Zhang, M. Research on the Key Technologies of GPS/BDS Long-Range Network RTK; Wuhan University: Wuhan, China, 2016. [Google Scholar]
  19. Zhu, H.; Lu, Y.; Xu, A.; Li, J. A Network Real-Time Kinematic Method for GPS and BDS Double Systems between Long Range. Geomat. Inf. Sci. Wuhan Univ. 2021, 46, 252–261. [Google Scholar] [CrossRef]
  20. Yao, Y.; Hu, M.; Xu, C. Positioning Accuracy Analysis of GPS/BDS/GLONASS Network RTK Based on DREAMNET. Acta Geod. Et Cartogr. Sin. 2016, 45, 1009–1018. [Google Scholar] [CrossRef]
  21. Xu, L.; Liu, H.; Shu, B.; Zheng, F.; Zhang, M.; Qian, C.; Duan, Y. GLONASS real-time wide-lane ambiguity resolution with an enhanced geometry-based model for medium-range baselines. Adv. Space Res. 2018, 62, 2467–2479. [Google Scholar] [CrossRef]
  22. Odijk, D. Stochastic modelling of the ionosphere for fast GPS ambiguity resolution. In Geodesy Beyond 2000. International Association of Geodesy Symposia; Springer: Berlin/Heidelberg, Germany, 2000; pp. 387–392. [Google Scholar] [CrossRef]
  23. Li, J.; Yang, Y.; Xu, J.; He, H.; Guo, H. GNSS multi-carrier fast partial ambiguity resolution strategy tested with real BDS/GPS dual- and triple-frequency observations. GPS Solut. 2015, 19, 5–13. [Google Scholar] [CrossRef]
  24. Yan, Z.; Ding, L.; Hang, E.; Yu, X. A New Method of Ambiguity Resolution in Network RTK between Reference Stations. Geomat. Inf. Sci. Wuhan Univ. 2013, 38, 295–298. [Google Scholar]
  25. Zhang, J. Algorithm of Generating VRS Data for Compass Navigation System; Chinese Academy of Surveying and Mapping: Beijing, China, 2014. [Google Scholar]
  26. Zhang, S. The GPS/GLONASS Integrated CORS Network Atmosphere Modeling and RTK Algorithm Implementation; Wuhan University: Wuhan, China, 2010. [Google Scholar]
  27. Dai, L.; Han, S.; Wang, J.; Rizos, C. Comparison of interpolation algorithms in network-based GPS techniques. Navigation 2003, 50, 277–293. [Google Scholar] [CrossRef]
  28. Lagler, K.; Schindelegger, M.; Bohm, J.; Krasna, H.; Nilsson, T. GPT2: Empirical slant delay model for radio space geodetic techniques. Geophys. Res. Lett. 2013, 40, 1069–1073. [Google Scholar] [CrossRef] [PubMed] [Green Version]
  29. RTCM. Differential GNSS (Global Navigation Satellite Systems) Services-Version 3. Available online: https://rtcm.myshopify.com/collections/differential-global-navigation-satellite-dgnss-standards (accessed on 28 April 2020).
  30. Shu, B. Research on the Key Technologies of GNSSRT-PPP & RTK and Their Integrated Service Method; Wuhan University: Wuhan, China, 2019. [Google Scholar]
  31. Böhm, J.; Niell, A.; Tregoning, P.; Schuh, H. Global Mapping Function (GMF): A new empirical mapping function based on numerical weather model data. Geophys. Res. Lett. 2006, 33. [Google Scholar] [CrossRef] [Green Version]
  32. Brack, A. Reliable GPS+BDS RTK positioning with partial ambiguity resolution. GPS Solut. 2016, 21, 1083–1092. [Google Scholar] [CrossRef]
Figure 1. Footprints of BDS-2 and BDS-3 satellites (18 August 2021).
Remotesensing 14 00002 g001
Figure 2. Distribution of the reference stations (red triangles) and rover stations (blue triangles).
Remotesensing 14 00002 g002
Figure 3. Skyplot map of BDS-2 (green) and BDS-3 (red) satellites at station WH04.
Remotesensing 14 00002 g003
Figure 4. (a) Double-difference atmospheric correction for B1C+B2a combination of BDS-3 in WH04-HG02. (b) Double-difference atmospheric correction for B1I+B3I combination of BDS-3 in WH04-HG02.
Remotesensing 14 00002 g004
Figure 5. (a) The residuals of pseudo-range and phase observations for B1C+B2a combination of BDS-3 in WH04-HG02. (b) The residuals of pseudo-range and phase observations for B1I+B3I combination of BDS-3 in WH04-HG02.
Remotesensing 14 00002 g005
Figure 6. Comparison of average RMS of the DD solutions from different combinations of BDS-3 in WH04-HG02.
Remotesensing 14 00002 g006
Figure 7. Comparison of atmospheric modeling value and reference value of B33 satellite at SC17. Station (CZ modeling value/JX reference value/DIFF mutual difference of two values).
Remotesensing 14 00002 g007
Figure 8. Comparison of mean RMS between atmospheric modeling values and reference values under different frequency signal combinations at Station SC17.
Remotesensing 14 00002 g008
Figure 9. Number of tracked satellites (top) and their PDOP values (bottom) for Station SC17.
Remotesensing 14 00002 g009
Figure 10. The coordinate error of NRTK fixed solution from different schemes for Station SC17.
Remotesensing 14 00002 g010
Table 1. Frequency signals of BDS-2 and BDS-3 satellites.
SignalsFrequency (MHz)Wavelength (cm)System
B1I1561.09819.20BDS-2/3
B1C1575.42019.03BDS-3
B2a1176.45025.48BDS-3
B2b1207.14024.83BDS-3
B3I1268.52023.63BDS-2/3
Table 2. Data processing strategy of network RTK and terminal RTK.
SchemesItemsDescription
ObservationsDouble-difference non-combined model
Sampling interval1 s
Elevation mask10°
WeightingPriori precision 0.003 m for phase and 0.3 m for code; Elevation-dependent weight: P/sin(el)
Relativistic effectIERS Conventions 2010
Satellite phase centerPCO and PCV for GPS and only PCO corrected for BDS using igs14.atx
Receiver phase centerPCO and PCV corrected for GPS and BDS using igs14.atx
Network RTKTropospheric dry delaySaastamoinen model and GMF mapping function [31]
Tropospheric wet delayRandom-walk process: zenith wet delay + GMF mapping functionVariance constraint: initial noise (0.0/m) + process noise (0.001*BL 1 m)
Ionospheric delayRandom-walk process: double-difference ionospheric delay on oblique pathVariance constraint: initial noise (0.0 m) + process noise (0.04*0.1*BL/sin(el) m)
AmbiguitiesWL/NL joint estimation + partial ambiguity fixing strategy [32] + LAMBDA
EstimatorKalman filtering
ObservationsDouble-difference non-combined model
Sampling interval1 s
Elevation mask10°
WeightingPriori precision 0.003 m for phase and 0.3 m for code; Elevation-dependent weight: P/sin(el)
Relativistic effectIERS Conventions 2010
Terminal RTKSatellite phase centerPCO and PCV for GPS and only PCO corrected for BDS using igs14.atx
Receiver phase centerPCO and PCV corrected for GPS and BDS using igs14.atx
Tropospheric dry delaySaastamoinen model and GMF mapping function
Coordinate (x/y/z)Dynamic estimation + white noise
AmbiguitiesOriginal frequency ambiguity + partial ambiguity fixing strategy + LAMBDA
EstimatorKalman filtering
1 BL represents the length of the baseline, unit: km.
Table 3. The RMS of double-difference solutions from different combinations of BDS-3 in WH04-HG02 (m).
B1C+B2aB1I+B3I
PRNIONTRPP-B1CP-B2aL-B1CL-B2aIONTRPP-B1IP-B3IL-B1IL-B3I
B240.0120.0160.5260.5410.0060.0030.0190.0150.7030.6430.0040.002
B250.0110.0340.5510.3940.0060.0030.0160.0370.7110.4920.0050.003
B260.0240.0390.8310.7080.0060.0030.0190.0510.9940.8330.0060.003
B330.0130.0740.6060.3890.0040.0020.0150.0730.7380.5590.0040.002
B340.0170.0240.7960.6920.0040.0020.0190.041.1180.8440.0050.003
B350.0120.0230.6690.8940.0060.0030.0180.0290.7620.9270.0060.003
B390.010.010.7520.5680.0030.0010.0120.0150.860.5210.0030.002
B410.0290.0160.7870.3550.0080.0040.0330.0240.6770.6170.0070.004
B420.0170.0780.9580.6710.0070.0030.0210.0681.3550.7610.0060.004
B440.0110.0090.5660.6490.0030.0020.0170.0140.790.7970.0030.002
AVG0.0160.0320.7040.5860.00530.00260.0190.0370.8710.6990.00490.0028
Note: B40 is the reference satellite of this period; AVG represents the mean value of the corresponding index RMS of each satellite; P: pseudo-range; L: phase.
Table 4. The fixed success rate of the baselines in reference networks.
BaselineB1C+B2aB1I+B3I
WH04-HG0299.9%99.7%
WH04-HG0599.9%99.2%
WH04-WH0299.6%96.3%
WH04-XN0198.4%97.3%
HG02-HG0599.9%98.6%
HG02-XN0197.9%98.2%
WH02-XN0199.3%98.9%
Table 5. RMS Statistics of atmospheric modeling values and reference values at Station SC17 under different frequency signal combinations (m).
B1C+B2a (ION)B1C+B2a (TRP)B1I+B3I (ION)B1I+B3I (TRP)
PRNCZJXDIFFCZJXDIFFCZJXDIFFCZJXDIFF
B240.0060.0080.0050.0050.0110.0070.010.020.010.0060.0170.012
B250.0060.010.0060.0110.0110.0090.0070.0130.0080.0140.0250.012
B260.0080.0120.0060.0160.0220.010.0060.0130.010.0220.0340.015
B330.0070.010.0050.0290.0220.0110.0090.0160.0090.0280.020.017
B340.0090.010.0070.010.0090.0060.0120.0140.0060.0170.0220.011
B350.0060.0140.010.0280.0270.0120.0080.0150.0120.0140.0190.016
B390.0040.0060.0030.0040.0070.0040.0050.010.0060.0050.0120.008
B410.010.0180.0110.0150.0160.0130.0130.0220.0150.0170.0240.013
B420.0080.0130.0080.0370.0350.010.0120.0210.0110.0330.0320.014
B440.0050.0110.0080.0050.0150.0130.0070.0150.010.0060.0180.014
AVG0.0070.0110.0070.0160.0180.0100.0090.0160.0100.0160.0220.013
Note: B40 is the reference satellite of this period; AVG represents the mean value of the corresponding index RMS of each satellite; CZ modeling value/JX reference value/DIFF mutual difference of two values.
Table 6. The fixed rate of baseline and positioning RMS of fixed solution from different schemes for Station SC17.
SchemesFix RateE (m)N (m)U (m)
GPS98.6%0.00540.00620.0173
BDS-297.5%0.00630.00720.0202
BDS-3 [1I+3I]99.4%0.00550.00570.0170
BDS-3 [1C+2a]99.8%0.00490.00470.0162
BDS-2/3100%0.00470.00400.0139
Publisher’s Note: MDPI stays neutral with regard to jurisdictional claims in published maps and institutional affiliations.

