Article

Comparing Coarse-Resolution Land Surface Temperature Products over Western Australia

1
School of Earth and Planetary Sciences, Curtin University, Kent St, Bentley, WA 6102, Australia
2
School of the Environment, Yale University, New Haven, CT 06511, USA
3
Pacific Northwest National Laboratory, Richland, WA 99354, USA
*
Author to whom correspondence should be addressed.
Remote Sens. 2022, 14(10), 2296; https://doi.org/10.3390/rs14102296
Submission received: 25 March 2022 / Revised: 2 May 2022 / Accepted: 6 May 2022 / Published: 10 May 2022
(This article belongs to the Section Urban Remote Sensing)

Abstract

:
Satellite-derived land surface temperature (LST) has commonly been used to monitor global temperature changes. The MODIS MYD11A2 product is the most common coarse-resolution product used for this purpose. An updated MODIS product (MYD21A2) and new VIIRS (VNP21A2) product have also recently become available. This study analyses eight-day, quality-controlled, LST imagery over Western Australia (WA) for the three products for an urban and a non-urban area for the years 2013, 2016, and 2019. An analysis of the data indicates that (i) the averaged daytime LST difference between the three products for Perth city over the three years was 1.32 °C, while at night it was 0.89 °C; (ii) the averaged daytime difference over the Kimberley region was 7.02 °C with a night average difference of 2.39 °C; and (iii) both the MYD21A2 and VNP21A2 products still appear to record anomalous monthly LST values, particularly in the humid Kimberley monsoonal months. The overall objective of the National Aeronautics and Space Administration (NASA) is to ensure that the LST values of the two satellite system products are comparable, so evidence of LST value differences will require further investigation, especially if the older product is to be replaced by the newer systems.

1. Introduction

Land surface temperature (LST) imagery obtained by orbiting infrared satellites has been widely used to monitor global temperature changes, particularly in areas where air temperature measurements are scarce [1,2]. Most LST research to date has used various iterations of the Moderate Resolution Imaging Spectroradiometer (MODIS) MxD11 day/night data from the Aqua and Terra satellites. The term MxD is used to denote either the MYD (Aqua) or MOD (Terra) product. Other studies have compared the heritage data with the recent MxD21 product developed to address issues in the heritage split-window products (https://modis-land.gsfc.nasa.gov/temp21.html accessed on 24 February 2022). Few studies have compared the above with the VNP21 LST data from the very similar Visible Infrared Imaging Radiometer Suite (VIIRS) recorded by the Suomi Polar-orbiting Partnership (S-NPP) satellite operated by the United States National Oceanic and Atmospheric Administration.
The three current LST products are generated using two different algorithms. The older MxD11A2 processing uses a generalised split-window (GSW) algorithm consisting of a radiative transfer (static) equation and emissivity values based on a static landcover classification [3]. Both the newer VIIRS VNP21 LST and the reprocessed MxD11 product (MxD21A2), which became available in 2018, utilise a temperature emissivity separation (TES) algorithm and a water vapour scaling (WVS) model [4]. This dynamically retrieves both LST and emissivity [5]. An explanation of the generation, quality assurance/control, processing levels, and validation of the LST data is provided in the Algorithm Theoretical Basis Document (ATBD) relevant to the specific product [3,4,6,7] as well as the associated user guides [5,8,9]. A general explanation of MODIS products is provided in Masuoka et al. [10].
Various studies comparing the MODIS and VIIRS systems have been undertaken over the years [11,12,13,14,15]. Studies on the calibration consistency between the two systems include that by Uprety et al. [16], who found that VIIRS radiometric bias over desert areas agreed with MODIS measurements within 2–3%. Guillevic et al. [17] noted that both VIIRS and MODIS products underestimated LST and that the VIIRS algorithm could produce large retrieved LST errors over areas of high atmospheric water vapour (with differences up to 15 K). This issue led to a refinement of the estimation algorithms, reprocessing of older C5 data, and development of the newer C6 product used in the current study. An assessment of the improvement over bare areas in North Africa showed a mean LST error in the order of ±0.6 K [18]. An analysis of C6 results have shown corrected temperature differences between the MODIS and VIIRS system in the order of ±0.2 K [11]. A cross-satellite comparison of the C6 product over bare soil surfaces under various atmospheric and surface conditions, using the ASTER LST product as a reference, indicated absolute biases in the order of 0.2–1.5 K [19]. A radiance-based method was also tested and indicated that absolute bias and RMSE values showed a reduction between the C5 and C6 products [20]. Hulley et al. [21] provided details on accuracy and consistency issues with the original MODIS and VIIRS LST split-window-based products and development of the new TES products (MYD21A2 and VNP21A2). Duan et al. [22] noted that the use of daytime in situ measurements to validate satellite-derived LST product was problematic due to high spatial heterogeneity and that the largest uncertainty in the MODIS GSW algorithm was the determination of emissivity.
Quality assurance/quality control (QA/QC) data are included with both the MODIS and VIIRS downloads [9]. Pixels obscured by cloud are not produced although factors other than cloud may impact the quality of any remaining pixels. Image quality information is encoded in binary format and allows specific bit flags (quality values) to be selected for post-processing, with the selection depending on the objectives of the researcher. A mandatory QC bit flag named MODLAND is generated for all products as well as LST/emissivity error and data quality. A study of the literature shows that some studies have not used the flags at all, instead using clear-sky LST averages [23]; some have used “good quality” pixels defined by the relevant quality assurance flag [24]; some have used LST errors ≤ 1 K [1], ≤2 K [25], and ≤3 K [2]; or some have alternatively used a bit flag of ≤1 K for cropland and ≤2 K for urban built-up pixels in SUHI intensity studies [26]. Others have used aggregated LST data assuming an accuracy of within 1°C between products [27].
Gawuc and Struzewska [28] analysed the impact of both QC and view angle on urban surface temperatures and SUHI intensity. They noted that the use (or conversely non-use) of the flags could cause issues, especially when comparing values between different cities. Much of the older research used the MODIS C5 product, with the C6 data becoming available (including retrospectively through C5 reprocessing) from early 2016. A 2018 study using the older MODIS MxD11A1 daily data and conducted on eighty-six major cities across mainland China also found that results could be significantly impacted by the MODIS quality flags and urged extreme caution when using this in LST product-based UHI work [29].
Yao et al. [30], in work focusing on China, noted that MYD21 LST values were greater than those for the MYD11 product. Outlier values were present in the TES product, and the authors also commented that the use of MYD11A2 could have possible negative impacts on research work due to the outdated landcover imagery used to calculate emissivity. The work examined the differences and percentage of missing values between the daily and eight-day products, extreme outlier values, and details on SUHII effects in major Chinese cities. No LST field data were used in the assessment process to determine the accuracy of the satellite values, and no detailed analysis or additional outlier removal was attempted on the product datasets.
The overpass times and spatial resolution of the imagery used are nominally similar although it should be noted that the S-NPP satellite actually orbits at a height of 824 kilometres (km) and has an initial spatial resolution of 750 metres (m), while MODIS orbits at 705 km and has a spatial resolution of 1000 m. Due to the differing orbits, the selection of pixels that have similar angular separation and observation times is normally recommended. Yao et al. [30] also observed that the use of eight-day composites ensured a higher proportion of valid pixel values in the imagery.
In July 2021, NASA provided information to users regarding the occurrence of extreme high temperature outliers in both the MxD21 and VNP21 products—Detailed Information for Case PM_MOD21_21200 (nasa.gov) (https://landweb.modaps.eosdis.nasa.gov/cgi-bin/QA_WWW/displayCase.cgi?esdt=MOD21&caseNum=PM_MOD21_21200&caseLocation=cases_data&type=C6, accessed on 10 February 2022). Suggested reasons for the difference when comparing the products to the MxD11 LST products were: (i) tighter filtering for clouds employed in the MxD11 code and (ii) the original MxD11 code using some unidentified dust removal filtering technique. Further details regarding the focus on high aerosol optical depth (AOD) contamination (dust), QC, and error analysis are included on the website. It was recommended to use a combination of the existing QC bits, emissivity values, and estimated product errors in the MxD21 and VNP21 products to remove bad pixels from any analytical work.
The majority of existing research work has focused on MODIS products, with little work conducted using the VIIRS imagery. The MODIS satellites, Aqua (https://lpdaac.usgs.gov/news/aqua-modis-acquisition-plan-through-august-2026/, accessed on 10 February 2022) and Terra (https://lpdaac.usgs.gov/news/terra-modis-acquisition-plan-through-december-2025/, accessed on 10 February 2022), are coming to the end of their operational lives. Given the proposed decommissioning date of the MODIS satellites, VIIRS sensors in the newer generation of Joint Polar Satellite System (JPSS) satellites, using the newer TES processing, will produce products that are planned to replace the MODIS products in the longer term [21].
In the present study, we compared the MYD11A2, MYD21A2, and VNP21A2 products over western Australia and comprehensively examined the outlier issue in more detail.
Research Question: Do the newer TES products developed by NASA provide data of sufficient quality for use in future research work (including climate change studies) given that the intention is to eventually replace the GSW product with the TES product?
Research Gaps: Numerous validation studies have been conducted on LST products over the years to derive an estimated final LST accuracy of around 1 K. Recent work by Yao et al. [30] indicated that there may be issues with the values in the MYD21A2 product (the MYD11A2 data reprocessed using the TES algorithm). NASA has highlighted the presence of anomalous values in both the MxD21 and VNP21 products, noted that these may be dust-related, and suggested methods to overcome bad pixel problems. This issue is of particular relevance given the proposed future replacement of the heritage imagery with the TES imagery.
Hypothesis: The processed MODIS and VIIRS product LST values are within the NASA-specified tolerances in all climatic zones, and the newer products are suitable for inclusion in the current LST database going forward as well as for future replacement of the heritage (GSW) MxD11 data collection.
Scope: The study uses three years of eight-day data (composited to monthly) from the MODIS and VIIRS satellites recorded over two contrasting climatic zones within western Australia (three products from two differing algorithms, nominally of the same image resolution, area and overpass time) and looks at the general relationships between the products. The data were processed using the quality-control MODLAND = 00 bit flag. No field data were available. The scope was informed by issues observed in previous work over China [30].
Objectives:
  • Process the two generations of MODIS LST products (MYD11A2 and MYD21A2) for WA using the strictest quality control flag, MODLAND = 00;
  • Process the VIIRS TES product VNP21A2 to provide additional data;
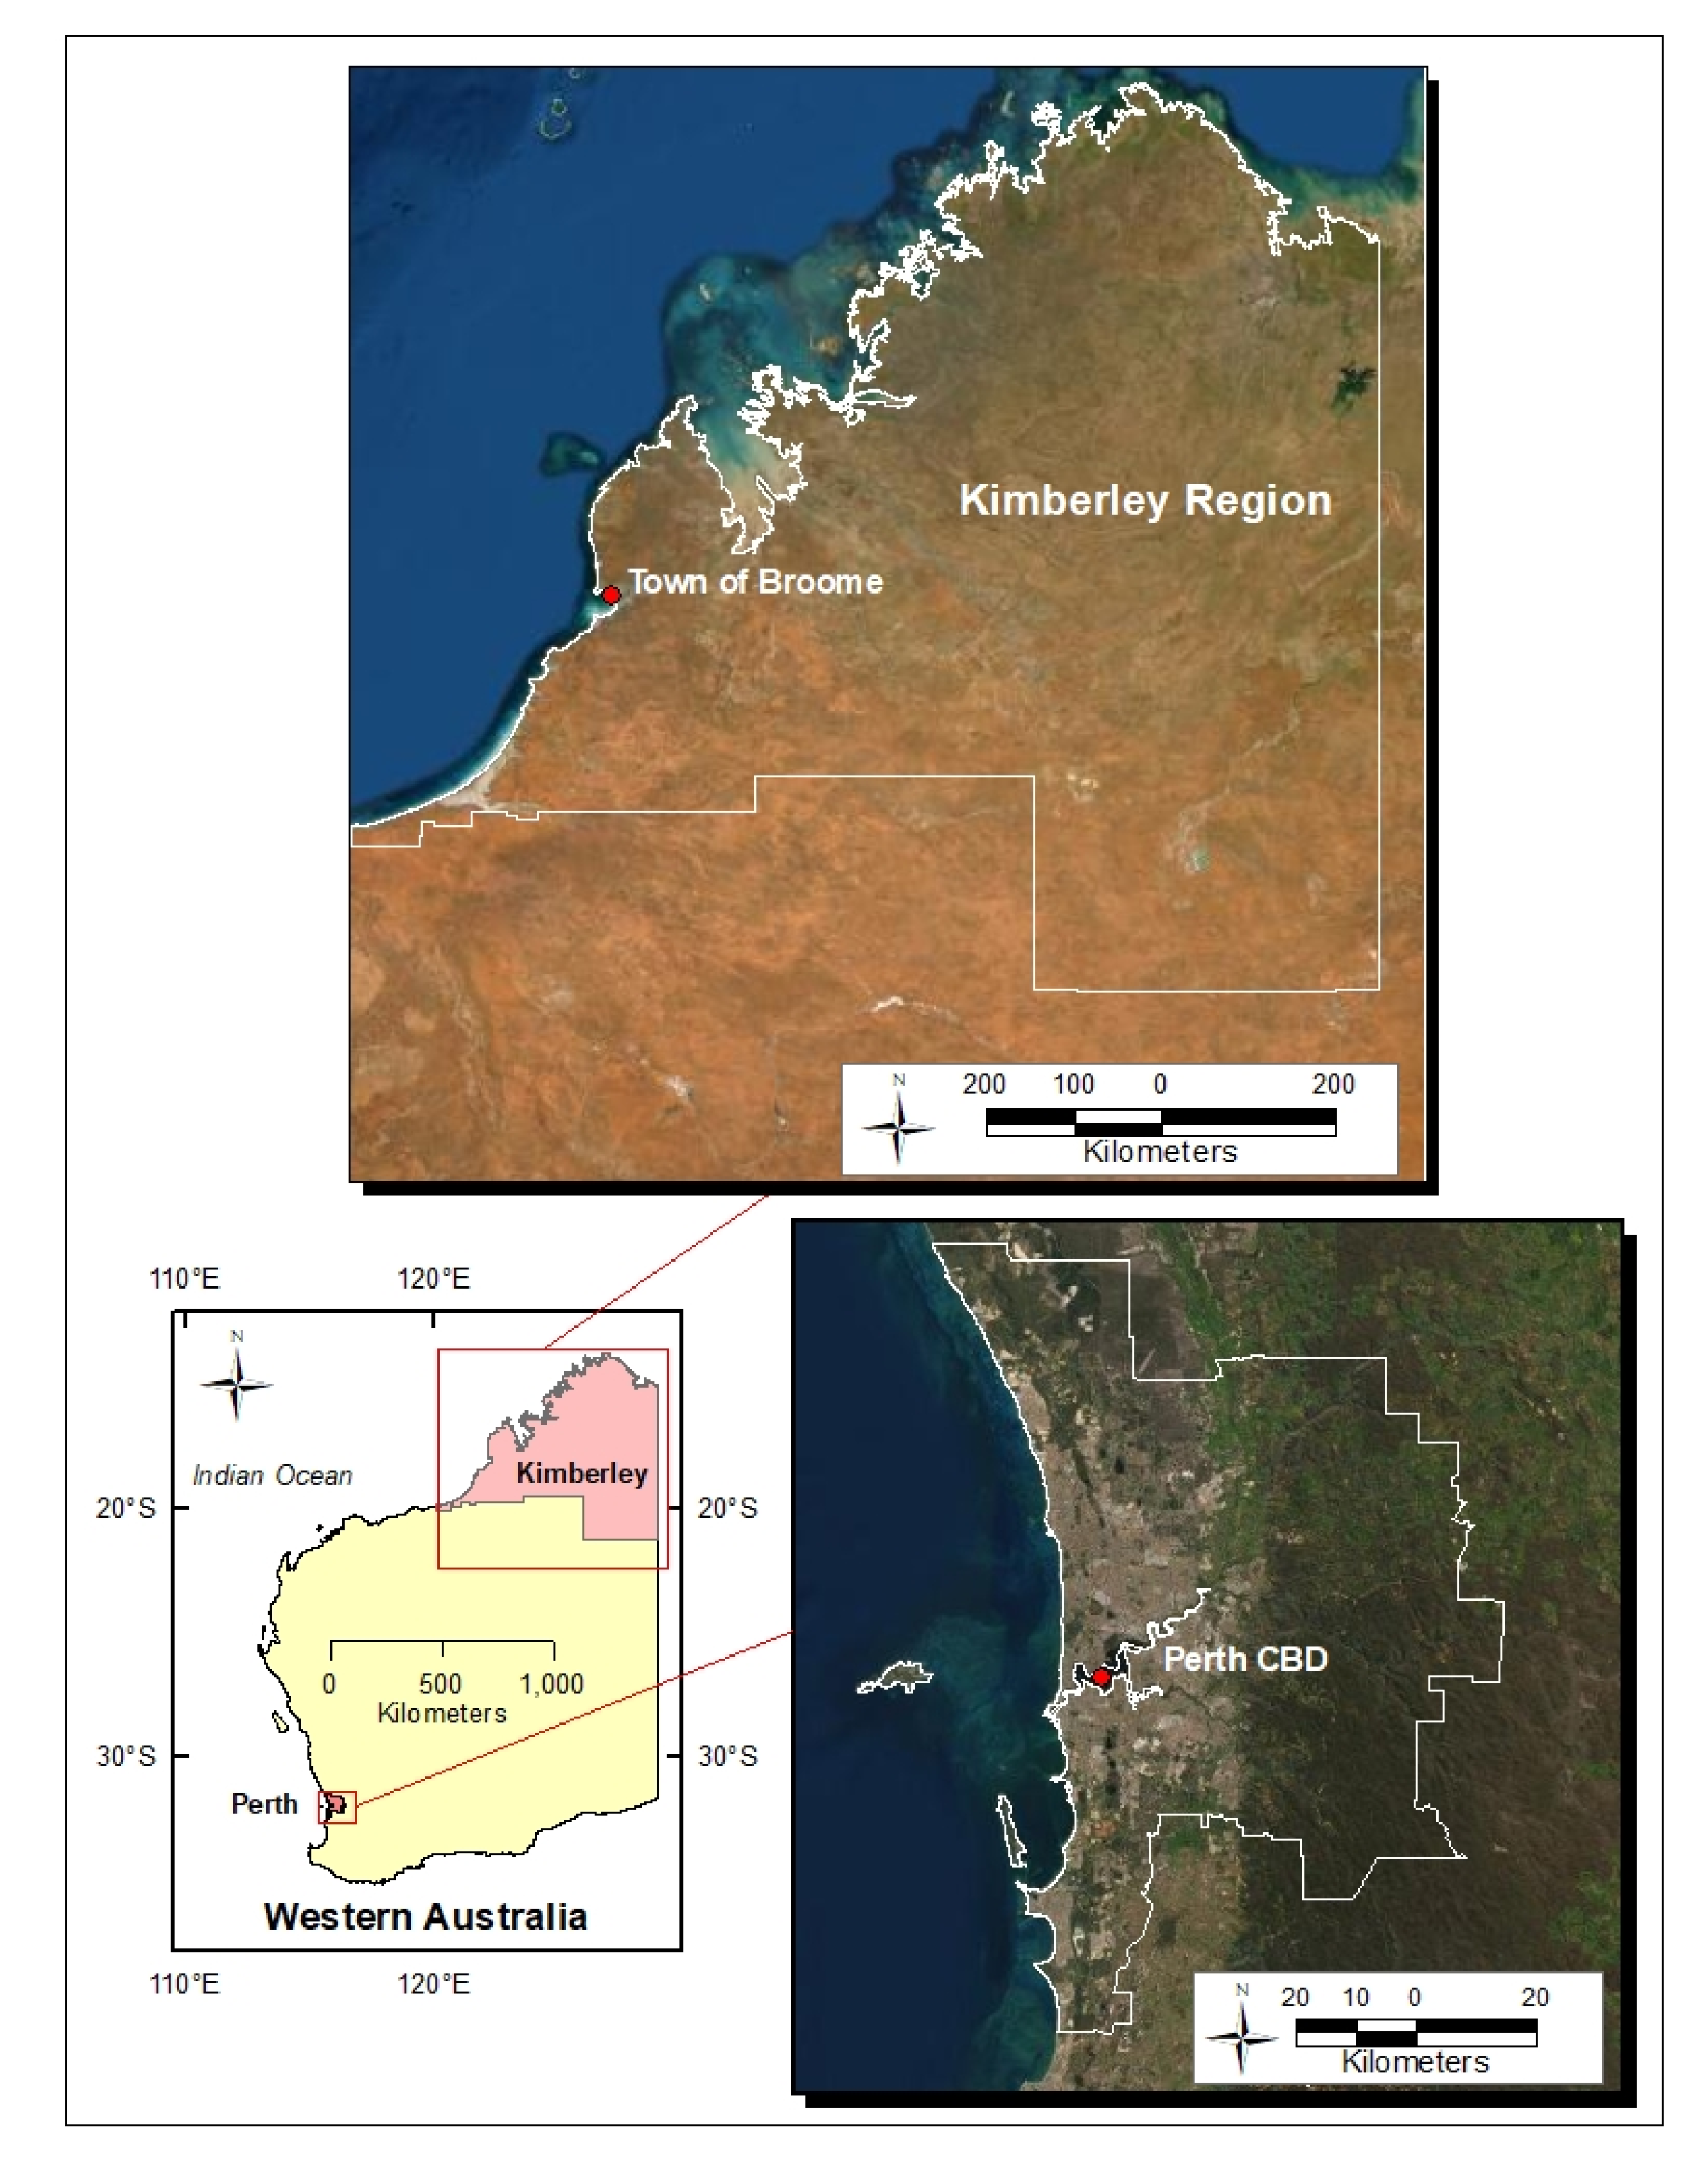
  • Compare and contrast the monthly patterns of the three LST products for the years 2013, 2016, and 2019 over Perth city (a Mediterranean climate) as well as the vegetated, undeveloped Kimberley region (a tropical climate);
  • Analyse the spatial patterns of LST and emissivity error for MYD11A2 and MYD21A2.

2. Materials and Methods

2.1. Region of Interest

Western Australia (WA) occupies approximately one-third of mainland Australia with the Indian Ocean to the north and west, the Southern Ocean to the south, and the Northern Territory and state of South Australia to the east (Figure 1). Average annual rainfall for most of the state is around 300 mm although the north is tropical and some parts of the southwest can receive up to 1400 mm. The seasons are summer (December to February), autumn (March to May), winter (June to August), and spring (September to November) (http://www.bom.gov.au/climate, accessed on 14 February 2022)
Perth is the capital city of WA, with the metropolitan area containing 2.12 million people (of the 2.76 million total population of WA) within an area of approximately 6400 km2 (https://profile.id.com.au/perth/about?WebID=230, accessed on 16 September 2021). Perth has a Mediterranean climate of hot and dry summers and mild, wet winters. Mean rainfall is around 760 mm per year. Rainfall amounts have been reducing over the years due to a changing climate. Maximum (max) temperatures range between 25 and 36 °C with minimum (min) temperatures between 14 and 22 °C. February is generally the hottest month, and July is the coldest. Humidity during summer is usually low.
The Kimberley region (an area of approximately 423,000 km2) is essentially undeveloped, containing large, pastoral stations and very few townsites, of which Broome is the largest (population < 20,000). It is located in the tropical northern part of WA and experiences a monsoonal summer. Annual rainfall is between 500 to 1500 mm. The average annual temperature is around 27 °C. The winters are long and dry, commencing in April and extending until the commencement of the “Wet Season” around November. This also tends to be the hottest part of the year.
The Köppen–Geiger climate classification scheme classifies Perth as predominantly CSa (warm Mediterranean, temperate climate, hot summers), while the Kimberley is predominantly Aw (tropical savanna climate) (Australian Climate Averages—Climate classifications (bom.gov.au)).

2.2. Data

MODIS data (available from 2002) and VIIRS data (available from 2012) were downloaded from the Application for Extracting and Exploring Analysis Ready Samples (AppEEARS) site at NASA’s Land Process Distributed Active Archive Centre (LP DAAC) [31]. The available day/night data include 1 km LST with QA/QC, clear sky, view angles/times, and selected emissivity bands. The download comes with selectable metadata, a granule list (tile number/HDF descriptor), and json request files. Other information includes lookups of the initial decoded binary numbers with their associated MODLAND, LST/emissivity error and data Quality information, and lookup and statistics .csv files providing an individual file breakdown of data/pixels associated with each of the decode numbers. Checksums and a download list (API/bundle path) are also available. The site automatically converts the original HDF/sinusoidal-formatted data into the WGS 84 (EPSG4326) co-ordinate reference system (CRS) as part of the download process. The imagery consists of eight-day composites. Compositing the eight-day to monthly composites provides smoothing and minimises possible issues with invalid values [30]. The Aqua (MYD) satellite was chosen to align with the overpass time of the VIIRS satellite (0130 and 1330). These times are closer to the times of normal daily morning minimum (min) and afternoon maximum (max) temperature and provide a better representation of the diurnal range of LST than do the data from the companion Terra (MOD data) satellite, which has overpass times of 1030 and 2230. Table 1 provides a summary of the data.
All relevant QA/QC data were downloaded and then decoded using NASA’s MODIS ArcGIS Python Toolbox (https://git.earthdata.nasa.gov/projects/LPDUR/repos/arcgis-modis-viirs-python-toolbox/browse, accessed on 20 February 2022). Quality processing using the mandatory bit flag MODLAND = 00 (also designated 0) was undertaken to provide the strictest quality control on the original clear-sky pixels.
The eight-day data were composited to year–month, year–season, year, month, and season. The processing also rescaled the individual base pixel data where required (LST pixels were multiplied by 0.02), and the LST was converted from K to °C (0 K = –273.15 °C). All data were converted from WGS 84 to UTM, Zone 50S. The imagery was clipped to the metropolitan Perth city and Kimberley boundaries, and a single, monthly mean value was produced for each area. Figure 2 provides a flowchart of the LST processing.
One thing noted when conducting the processing is the apparent reversal in some of the bit flag quality definitions for VNP21A2 and MxD21A2 in the applicable User Guides and ATBD as compared to the original bit flags for MxD11A2. Both the mandatory quality (MODLAND) and the data quality bit flags are consistent; however, the emissivity Accuracy and the LST accuracy were reversed, with the original “00”(0) for MxD11A2 (the highest quality) being replaced by “11” as highest quality/excellent performance for both VNP21A2 and MxD21A2) [4,5,8]. For this study, MODLAND = 00 (which is consistent between all the products) was used for the final processing.
The 2013, 2016, and 2019 imagery was selected for analysis. The rationale for the selection of these dates was due to the fact that VIIRS data are only available from 2012 and that the study was not focused on assessing LST change over time. The objective was only to assess LST correlation between the three products. The years selected provide an even temporal spread.

3. Results

The monthly diurnal data show MYD11A2 (blue bars), VNP21A2 (orange bars) and MYD21A2 (green bars) for the years 2013, 2016, and 2019. The LST data details for all the analysis can be found in the Supplementary Tables. Due to the fact that no field data were available, the accuracy of the individual products is not able to be assessed. The term precision is used to refer to the level of LST agreement between the products.

3.1. Perth

3.1.1. Monthly Diurnal LST

The average monthly diurnal LST (with associated min/max LST values) for Perth are shown in Figure 3, Figure 4 and Figure 5 (see Table S1 for details).
The data for MYD11A2 show that values are well-distributed around the mean for day and night although some skewness into the higher temperatures is indicated at night (Figure 3b). The data for both VNP21A2 and MYD21A2 show more variability in the monthly high/low values than do the data for MYD11A2. VNP21A2 day recorded a low of −0.69 °C in August 2013 (Figure 4a). MYD21A2 recorded a high of 386.6 °C and low of −74.8 °C in February 2019. Some anomalous high values were also recorded in March and in February of 2013 (see Figure 5b and refer to Table S2).
Intermittent, very high/low MYD21A2 pixel values were noted for Perth in February 2019. These were examined in detail, as the MODLAND = 00 quality control should have removed any spurious values. Data for this date could not be examined directly, as the processing had composited the eight-day into monthly data, but an examination of the original eight-day data provided a base data file which could be checked to determine the relationship between the LST values recorded and the associated, decoded MODLAND QC obtained from the NASA servers. The following two files were examined: (a) the original data file MYD21A2.006_LST_Night_1KM_doy2019057_aid0001.tif and (b) the decoded QC file MYD21A2.006_QC_Night_doy2019057_aid0001_MODLAND.tif. Note that this is the original unprocessed data, so the LST values are in the original, unscaled K as shown in Figure 6a. The original data file has the Julian date of 2019057 and was compared with the 2019057 MODLAND decoded quality file. The classified high K values (in red), when converted to °C, range from 226.85 to 466.85 °C. The low K values (in dark green) range from −111.15 to −33.15 °C. These high/low LST values were overlain by the MODLAND bit flag file in ArcGIS, with the 00 (pixel produced, good quality) section of the layer being made transparent, so the underlying LST data could be examined (Figure 6b). Both the green and red LST values can be seen, which indicated that these anomalous values were to be carried through in the MODLAND = 00 masking and recognised as good-quality pixels, confirming the validity of the processing.
A boxplot of the Perth yearly diurnal LST values calculated from the monthly data is shown in Figure 7. MYD21A2 has the highest median value over the three years.

3.1.2. Product Correlation

Pearson’s correlation coefficients used to depict the product relationships are shown in Table 2. The three products recorded over Perth appear well-correlated both during the day and at night. Nighttime MYD21A2 and MYD11A2 correlation is lowest at 99.03%.

3.2. Kimberley Region

3.2.1. Monthly Diurnal LST

The average monthly 2013, 2016, and 2019 day and night LST (with min/max bars) for the Kimberley region is shown in Figure 8, Figure 9 and Figure 10 (refer to Tables S3 and S4). The Kimberley day and night MYD11A2 values shown in Figure 8a,b appear relatively normally distributed and are consistently within ±25 °C of the mean. In contrast, both Figure 9 and Figure 10 show anomalous high and low day and night pixel values. For example, VNP21A2 records a January 2019 monthly daytime max pixel value of 311.97 °C and a min of −30.47 °C as well as a nighttime max of 221.23 °C and min of −56.13 °C. MYD21A2 records a max 2013 February daytime value of 435.37 °C.
A boxplot of the yearly diurnal LST values calculated from the monthly data is shown in Figure 11.
MYD11A2 consistently records the lowest median (as well as lowest min/max values) during both day and night. MYD21A2 records the highest median in all three years during daytime although it is comparable to VNP21A2 during the night.

3.2.2. LST Correlation

The correlation between the three products for each of the three years for the Kimberley data is shown in Table 3. The day and night correlation between MYD21A2 and VNP21A2 is above 98.9%. The nighttime correlation between the three products is in the order of 99%; however, the daytime correlation between MYD11A2 and the other two products is between 83.29 and 92.27%, with the correlation between MYD11A2 and MYD21A2 (the reprocessed MYD11A2 product) consistently the weakest in all three years.

3.3. Yearly LST Comparison

The monthly min and max temperature range for the three products for each year were calculated and a mean difference (Δ) determined. A summary of the comparisons is shown in Table 4. The annual mean shows the spread of the values recorded for each year for all three products. The RMSE shows the errors for VNP21A2 and MYD21A2 when using MYD11A2 as a predictor.
Calculation of the root mean square error was conducted using MYD11A2 as the predictor and the other two products as the observed values. MYD11A2 was chosen as the predictor due to: (a) long-term, widespread use in research and (b) the study evidence indicating that MYD11A2 is potentially more accurate in reflecting true LST values, particularly in tropical areas (refer to Tables S5–S8 for details). The overall Perth RMSE values are almost all below 1.5 °C (0.713 °C to 1.44 °C), indicating that the day and night VNP21A2 and MYD21A2 values closely match the LST calculated for MYD11A2. Overall MYD21A2 appears the least precise. The Kimberley values range between 2.345 °C and 8.557 °C. Interestingly, while VNP21A2 has a high day RMSE value, it also has a relatively consistent night value of around 2.4 °C. Again, MYD21A2 records a large variation for both day and night. This suggests that the Perth LST values are near or within the specifications originally set out for the MODIS and VIIRS data. The Kimberley data, however, appear to have a significantly lower precision. No field data were available, so true product accuracy was not assessed.

3.4. Spatial Patterns

The respective spatial pattern of pixels generated by the MODLAND bit flag for MYD11A2 and MYD21A2 is shown in Figure 12 and Figure 13. These use a summer eight-day image example for Perth (a dry summer day) and the Kimberley area (a wet summer day).
For Perth, there are no apparent issues with the MYD21A2 imagery (Figure 12a); however, there appear to be quality issues with the MYD11A2 city/suburb areas (Figure 12b), with the original LST pixels for these areas being removed during the MODLAND = 00 processing and designated “other” quality.
For Kimberley, MYD21A2 results indicate scattered, good-quality pixels for a large part of the area (Figure 13a). In contrast, the majority of the MYD11A2 pixels are deemed “other” quality and removed, with the good-quality values found only in scattered areas such as those near the coast (Figure 13b). The MYD11A2 product uses static land cover emissivity values, whereas MYD21A2 uses retrieved values. In an attempt to determine a reason for the observed patterns, both the LST error and emissivity error for the Kimberley images were examined in more detail (see Figure 14 and Figure 15). Error values for MYD21A2 (Figure 14a) indicate that the emissivity for essentially the whole of the Kimberley area is ≤0.01, i.e., excellent performance. The emissivity pattern for MYD11A2 (Figure 14b) conforms, to a large extent, to the “00” pixel pattern seen in the MODLAND flag imagery (Figure 13b) with emissivity errors of ≤0.01 mainly near the coast and ≤0.02 inland. The MYD21A2 image has no areas flagged as excellent performance (LST accuracy of <1 K), with most of the error flagged as >1.5 K (Figure 15a). The LST error estimates for MYD11A2 show that the majority of the Kimberley region has errors ≤2 K, with scattered areas of <1 K and minor areas of ≤3 K in the inland areas (Figure 15b).

3.5. LST Data Distribution by Percentile

The work has indicated that despite using the strictest quality control (which should remove all incorrect values), there still appear to be outliers in the MYD21A2 and VNP21A2 data (see Figure 4, Figure 5, Figure 9 and Figure 10). There appear to be no issues with outliers in the MYD11A2 data (see Figure 3 and Figure 8). Table 5 provides a breakdown of the 2019 LST distribution by percentiles to provide an indication of LST at the various percentile levels and indicates the temperature difference between the percentiles. This graphically illustrates the elevated median temperatures recorded by MYD21A2 and VNP21A2 when compared to MYD11A2.

4. Discussion

The use of Terra/Aqua satellite MODIS MxD11 LST data in research over the last 20 years or so has been common. Various changes and improvements have been made to the versions since flight commencement in 2000/2002, with Collection 6 being the latest in this line. MxD11 processing has always used the GSW method, while the S-NPP VIIRS data (using the TES algorithm) are more recent, as they have been available since 2012. The TES algorithm is also used in the reprocessed MxD11 MODIS product (designated MxD21). The results of selected research using MODIS data [30,32,33] as well as apparent variability in the use of quality control in research work were drivers for the current research. Eight-day imagery was used for this study due to the advantage of temporal aggregation reducing spurious values [34]. A bit flag filtering of MODLAND = 00 (pixel produced, good quality) was used, effectively bypassing all the MODLAND = 01 (pixel produced, recommend examination of more detailed QA).
The general results tabulated in Table 4 indicate that, for Perth, MYD11A2 records the lowest day average LST over the three years analysed, while MYD21A2 generally records the highest. Nightly values are comparable. For the Kimberley, there is a notable difference in both day and night values between MYD11A2 and the other two products. Overall, there is a yearly difference in the order of 7 °C for day and 2 °C for night between the GSW product and the TES products.
In a previous study, Yao et al. [30] noted that MYD21A1 recorded LST values consistently above MYD11A2. This was seen over all land cover types. For MYD21A2, extremely high LST values up to and over 100°C were observed on certain days, with these high LST values being attributed to incorrect retrieval of emissivity. The researchers noted that MYD11 processing removes outliers using temporal constraints, whereas MYD21 processing does not, and commented that this may constrain the practical application of MYD21 results. The MxD11 LST Product Generation Executive code (PGE16) Level 2/3 code [6] appears to use a more rigorous validation method than that employed by MxD21 and VNP21. The MxD11 process uses temporal variation constraints on bands 31 and 32 for clear-sky LSTs as well as land type cover information. The MxD21 product retrieval is constrained to pixels that have nominal Level 1B radiance data in bands 29, 31, and 32 and are collected in clear-sky conditions (defined by the cloud mask product VNP35) at a confidence of ≥95% over land [9]. The VNP21 product is similarly constrained apart from using bands 14, 15, and 16 [5]. It was noted that the accuracy of the emissivity values used in calculations could strongly affect the accuracy of LST retrieval. The MxD11 product assigns emissivity based on land cover type; however, land cover products used have been found to be outdated, especially urban and rural interfaces [2,35,36,37], and, as such, may lead to errors in heritage LST retrieval.
High and low anomalous values are noted in the current study in not only the MYD21A2 data but also in the VNP21A2 data. Detailed analysis of the MYD21A2 data indicated that the very high and very low LST values seen in the base data file were carried over in the QC masking as good-quality pixels (Figure 6a,b). No anomalous values/outliers were observed within the MYD11A2 data. The temperature elevation is particularly pronounced during the monsoon season in the Kimberley where monthly mean LST values in the order of 15 °C higher than MYD11A2 are observed for both TES products. The overall day/night range for the MYD11A2 was in the order of 8.0 °C to 60.0 °C, which appears reasonable. Incorrect retrieval of emissivity has been proposed as a reason for very high LST values, while very low LSTs may be due to undetected cloud [30].
Validation studies previously undertaken in 2014 on the MODIS and VIIRS data noted that both satellite products significantly underestimated LST in arid and semi-arid areas and that the VIIRS algorithm could have issues over areas of high atmospheric water vapour [17]. The 2016 VIIRS LST ATBD flagged that performance was further degraded under conditions of high atmospheric water vapour content where differences of up to 15 K had been observed when compared with the MYD11 products [3]. These studies flagged the issue of elevated LST values in areas of high atmospheric water content. The VIIRS user guide mentions that current differences between the MxD21 and the VNP21 algorithms originate only from the physical differences between the MODIS and VIIRS instruments, such as spatial resolution, band locations, and instrument noise [5]. The general similarity in values (a result of the algorithm used) between MYD21 and VNP21 is noted in the current study.
For the drier Perth area, the analysis indicated that all products were well-correlated (see Table 2). For the tropical Kimberley, MYD21A2 and VNP21A2 were well-correlated with each other during both day and night and with MYD11A2 at night, but both were not very well correlated with MYD11A2 during the day (see Table 3). The least correlated were daytime MYD11A2 and MYD21A2 (the reprocessed MYD11A2) at 0.8329. Our study indicates the need for further validation and calibration of the newer MYD21A2 and VNP21A2 products over tropical regions, where cloud contamination is also highly probable.
An analysis of the recorded temperature differences between the products within each year show that the mean yearly Perth day average difference for the three years is 1.32 °C, while at night, it is 0.89 °C (Table 4). The Kimberley data, however, show averaged daytime differences of 7.02 °C and at night 2.39 °C. The Perth results for all three products are within or close to the specified accuracy of 1 K as originally defined for the MxD11A2 product by Wan [6] and the similar MxD21A2 and VNP21A2 accuracy [5,9]. In contrast, the Kimberley day and night values for all years are substantially greater than this. To determine the spread of the values within the three products, root mean square errors (RMSE) were calculated. MYD11A2 was used as the “predictor” and RMSE statistics were calculated using the other two “interpolated” products (see Table 4 and Tables S5–S8). MYD11A2 was chosen as the predictor due to its long term, widespread use in research over the last 20 years or so.
NASA has officially noted the anomalous high temperature value issues in MxD21 and VNP21 and suggested one reason is increased dust presence in some high AOD regions, leading to lower emissivity and an overestimated LST for those areas. NASA normally flags suspect pixels (using band 31 and 32) as <0.95 to account for volcanic rock emissivity (band 32 normally uses >0.96 to flag acceptable emissivity), a compromise that does not always remove dust and other contamination, and suggests using an LST error >2.5 K to flag bad pixels. MYD11A2 uses only bands 31 and 32 for retrieval, whereas MxD21 uses these as well as an extra band 29. VNP21 uses bands 14, 15, and 16.
The results of the current study indicate that there are no real issues with extreme LST outliers in the Mediterranean climate of Perth (apart from occasional MYD21A2 nighttime values) despite the pixel loss in the final processed MYD11A2 data. In fact, the mean LST values over the three years of study are all within 1.5 °C, with nighttime values within 1.0 °C (see Table 4), which is very much in line with NASA-accepted specifications [5,6,9]. It is recognised that cloud cover can be an issue during the monsoon season in tropical areas in regards the percentage of clear pixels retrieved [38]; however, it is assumed that all three satellite sensors should be similarly affected by this issue given the specified overpass times. In the Kimberley, the question of very elevated temperatures is noted for both the MYD21 and VNP21 products. The effect of dust does not appear significant in the dry season when disturbed topsoil/dust from degraded pastoral properties could be expected in the air column. There is also no cloud present during this time of the year. The outlier issue appears significant in the high-cloud/high-humidity/high-precipitation months. It is possible that dust could be an issue over these areas during the monsoon season, however it is unlikely, as raindrops would attract aerosol particles and remove these from the air [39].
The spatial patterns of the products were also analysed. It should be noted that the bit flag value ranges between the GSW and TES products are slightly different, with the GSW data having LST errors of ≤1, ≤2, and ≤3 K, while the comparable values for the TES are <1, 1–1.5 K, 1.5–2 K, and >2 K. Similarly with the emissivity values. MODLAND values are the same. For the Perth urban area, the MYD11A2 MODLAND = 00 bit flag consistently recognises the city and suburban areas as “other” and removes the LST pixels (Figure 12b). Both the LST and emissivity error bit flags mirror this. This phenomenon at the eight-day scale is seen in the monthly, seasonal, and yearly imagery. This is in contrast to MYD21A2, where no discernible pattern can be recognised (see Figure 12a). This visible pattern is likely related to the static nature of the emissivity used for the MYD11A2 product (retrieved from the landcover product MCD12).
In the more detailed analysis of the data for the Kimberley area, the processing of MYD11A2 removes the majority of inland pixels (see Figure 13b). This is reflected in the emissivity error (Figure 14b) and LST error (Figure 15b) values. For MYD21A2, however, although the emissivity error records essentially the whole of the Kimberley area as being <0.01, i.e., excellent performance, the LST error shows all values >1.5 K, i.e., marginal performance. The MODLAND = 00 flag for MYD21A2 shows a large part of the Kimberley area as consisting of good-quality pixels (Figure 13a).
In summary, the Perth data for the two MODIS products, although showing some differences in patterns of pixel removal, appear to provide an acceptable degree of LST error/precision. The Kimberley MYD21A2 data show excellent emissivity accuracy (<0.01) for essentially the whole region (Figure 14a); however, the LST accuracy is predominantly all >1.5 K (marginal—see Figure 15a). The MODLAND = 00 good-quality flag used in the processing indicates good-quality pixels for a large part of the Kimberley area (Figure 13a). This is contradicted by issues with the outliers still occurring in the quality-controlled imagery.
It is recognised that there are some shortcomings in the assumptions made, which may affect the analysis and conclusions, including the impacts of cloud cover and dust. NASA has suggested using only good-quality QC pixels as well as band 32 information to remove dust contamination (while admitting some undetected cloud artifacts could remain). The current work used only the MODLAND = 00 (good-quality QC) information to ensure that only acceptable pixels are used in the analysis and commented on the resulting values and spatial patterns.

5. Conclusions and Recommendations

The study hypothesis that all the processed MODIS and VIIRS product LST values are within the NASA-specified tolerances in all climatic zones and that the newer products are suitable for replacing the current LST monitoring framework going forward does not appear to be supported by the research results.
Results show inconsistencies in the LST values recorded between the products as well as a high number of anomalous values in some of the TES data, particularly in the Kimberley area. The apparent carry-over of obvious outliers from the MYD21A2 and VNP21A2 imagery into data that has been processed using the strictest bit flag information (MODLAND = 00) requires further study. The results for Perth (located in a dry climatic zone) do show good agreement between the three products. The results for the Kimberley area (located in a region with a monsoonal influence) indicate that heritage MYD11A2 imagery consistently records LST values well below both MYD21A and VNP21A2 during the day, particularly during the monsoon season.
The possibility of dust being a significant contributor to the outlier issues seen in the TES data, as flagged by NASA, does not appear to be borne out by an analysis of the imagery from the two regions. Perth city, though showing some anomalous values in the TES data, records a mean yearly LST for all satellites of <1.5 °C, which is in close agreement to the NASA-specified accuracy. The tropical Kimberley data, with a mean day difference of 7.0 °C and night difference of 2.4 °C, exhibits extreme LST values during the wet monsoonal season when it is that assumed dust issues, including particulates from bushfires, would be minimal.
It is recommended that further processing of the data using the MODLAND = 00 flag, LST error, and band 32 settings be conducted. Emissivity data for the three products should be processed in a similar manner to that conducted for this study to extract quality pixel values for the following: Emis 31 and 32 for MYD11A2; Emis 29, 31, and 32 for MYD21A2; and Emis 14, 15, and 16 for VNP21A2. This will ensure that pixels with cloud adjacency issues and angular separation/observation time differences will not be included. The potential value of further work regarding dust impacts on LST values using AOD imagery also needs to be assessed and compared to the thermal regimes in the two areas. This will assist in determining whether other factors impacting on LST accuracy need to be examined. The current study region has no field data for LST. Climatologically suitable Baseline Surface Radiation Network (BSRN) or FluxNet sites should be used for accuracy assessment in future studies.

Supplementary Materials

The following supporting information can be downloaded at: https://www.mdpi.com/article/10.3390/rs14102296/s1, Table S1: Perth—Mean yearly LST difference between the three products for 2013, 2016, and 2019; Table S2: Perth—Maximum and minimum LST for three products for 2013, 2016, and 2019; Table S3: Kimberley—Mean yearly LST difference between the three products for 2013, 2016, and 2019; Table S4: Kimberley—Maximum and minimum LST for three products for 2013, 2016, and 2019; Table S5: Perth—RMSE details for VNP21A2 (Day and Night); Table S6: Perth—RMSE details for MYD21A2 (Day and Night); Table S7: Kimberley—RMSE details for VNP21A2 (Day and Night); Table S8: Kimberley—RMSE details for MYD21A2 (Day and Night).

Author Contributions

Conceptualization, methodology, and validation, D.B. and A.D.; formal analysis and data curation, D.B.; writing—original draft preparation, D.B.; writing—review and editing, D.B., A.D. and T.C.; supervision, A.D. All authors have read and agreed to the published version of the manuscript.

Funding

This research has received no external funding.

Data Availability Statement

The NASA satellite data are publicly available at https://appeears.earthdatacloud.nasa.gov/ (accessed on 20 March 2022).

Acknowledgments

The Pacific Northwest National Laboratory (PNNL) is operated for DOE by Battelle Memorial Institute under contract DE-AC05-76RLO1830. NASA personnel provided valuable advice and information. D.B receives an Australian Government Research Training Program scholarship.

Conflicts of Interest

The authors declare no conflict of interest.

Abbreviations

AODAerosol Optical Depth
AppEEARSApplication for Extracting and Exploring Analysis Ready Samples
AquaSatellite carrying MODIS sensor
ATBDAlgorithm Theoretical Basis Document
BoMBureau of Meteorology
BSRNBaseline Surface Radiation Network
C6/V6Collection or Version 6 of MODIS heritage data
CRSCo-ordinate Reference System
GSWGeneralised Split Window
HDFHierarchical Data Format files
JPSSJoint Polar Satellite System
LPDAACLand Process Distributed Active Archive Centre
LSTLand Surface Temperature
MODISModerate Resolution Imaging Spectroradiometer
MODLANDMODIS Land
MYD11A2MODIS LST/Emissivity GSW product
MYD21A2MODIS LST/Emissivity TES product
MxDMODIS LST (MYD or MOD)
NASANational Aeronautics and Space Administration
PGE16Product Generation Executive code 16
QA/QCQuality Assurance/Quality Control
RMSERoot Mean Square Error
S-NPPSolar Polar-orbiting Partnership satellite carrying VIIRS sensor
SUHISurface Urban Heat Island
SUHIISurface Urban Heat Island Intensity
TairAir Temperature
TESTemperature Emissivity Separation
VIIRSVisible Infrared Imaging Radiometer Suite
VNP21A2VIIRS LST/Emissivity TES product
WAWestern Australia
WGS84World Geodetic System 1984
WVSWater Vapour Scaling

References

  1. Clinton, N.; Gong, P. MODIS detected surface urban heat islands and sinks: Global locations and controls. Remote Sens. Environ. 2013, 134, 294–304. [Google Scholar] [CrossRef]
  2. Chakraborty, T.; Lee, X. A simplified urban-extent algorithm to characterize surface urban heat islands on a global scale and examine vegetation control on their spatiotemporal variability. Int. J. Appl. Earth Obs. Geoinf. ITC J. 2018, 74, 269–280. [Google Scholar] [CrossRef]
  3. Hulley, G.; Islam, T.; Freepartner, R.; Malakar, N. Visible Infrared Imaging Radiometer Suite (VIIRS) Land Surface Temperature and Emissivity Product Collection 1 (ATBD); Jet Propulsion Laboratory, California: Pasadena, CA, USA, 2016. Available online: https://viirsland.gsfc.nasa.gov/PDF/VNP21_LSTE_ATBD_v2.1.pdf (accessed on 4 June 2020).
  4. Hulley, G.; Malakar, N.; Hughes, T.; Islam, T.; Hook, S. Moderate Resolution Imaging Spectroradiometer (MODIS) MOD21 Land Surface Temperature and Emissivity Algorithm Theoretical Basis Document; National Aeronautics and Space Administration Jet Propulsion Laboratory, California Institute of Technology: Pasadena, CA, USA, 2016.
  5. Hulley, G.; Freepartner, R.; Islam, T. Visible Infrared Imaging Radiometer Suite (VIIRS) Land Surface Temperature and Emissivity Product (VNP21) User Guide. Collection 1; NASA Jet Propulsion Laboratory, California: Pasadena, CA, USA, 2018. Available online: https://viirsland.gsfc.nasa.gov/PDF/VNP21_LSTE_user_guide.pdf (accessed on 3 March 2020).
  6. Wan, Z. MODIS Land-Surface Temperature Algorithm Theoretical Basis Document (LST ATBD) Version 3.3; Institute for Computational Earth System Science, University of California: Santa Barbara, CA, USA, 1999. [Google Scholar]
  7. Vermote, E.F.; Franch, B.; Roger, J.C. Suomi-NPP VIIRS Surface Reflectance Algorithm Theoretical Basis Document (ATBD); V1 Re-processing (NASA Land SIPS). Ver 2.0.; Goddard Space Flight Center: Greenbelt, MA, USA, 2016.
  8. Wan, Z. Collection-6 MODIS Land Surface Temperature Products Users’ Guide; ERI, University of California: Santa Barbara, CA, USA, 2013. [Google Scholar]
  9. Hulley, G.; Freepartner, R.; Malakar, N.; Sarkar, S. Moderate Resolution Imaging Spectroradiometer (MODIS) Land Surface Temperature and Emissivity Product (MxD21) Users’ Guide Collection-6; Jet Propulsion Laboratory California Institute of Technology Pasadena, California: Pasadena, CA, USA, 2016. Available online: https://emissivity.jpl.nasa.gov/downloads/examples/documents/MOD21_LSTE_User_Guide_C6.pdf (accessed on 19 May 2020).
  10. Masuoka, E.; Roy, D.; Wolfe, R.; Morisette, J.; Sinno, S.; Teague, M.; Saleous, N.; Devadiga, S.; Justice, C.O.; Nickeson, J. MODIS Land Data Products: Generation, Quality Assurance and Validation. Land Remote Sens. Glob. Environ. Chang. 2010, 509–531. [Google Scholar] [CrossRef] [Green Version]
  11. Li, H.; Sun, D.; Yu, Y.; Wang, H.; Liu, Y.; Liu, Q.; Du, Y.; Wang, H.; Cao, B. Evaluation of the VIIRS and MODIS LST products in an arid area of Northwest China. Remote Sens. Environ. 2014, 142, 111–121. [Google Scholar] [CrossRef] [Green Version]
  12. Liu, Y.; Yu, Y.; Kongoli, C.; Wang, Z.; Yu, P. Evaluation of the Suomi NPP VIIRS Land Surface Temperature Product; Cooperative Institute for Climate and Satellites, University of Maryland: College Park, MA, USA, 2012; STAR/NESDIS/NOAA. Information Poster. [Google Scholar]
  13. Liu, Y.; Yu, Y.; Wang, Z.; Tarpley, D.; Guillevic, P.; Privette, J.L.; Csiszar, I. Assessment of the Suomi NPP VIIRS Land Surface Temperature Product-Beta to Provisional Maturity; CICS, University of Maryland: College Park, MA, USA; NOAA/NESDIS Center for Satellite Applications and Research: Washington, DC, USA; IMSG: Rockville, MD, USA; Short & Associates, CICS, NC State University: Raleigh, NC, USA; NCDC: Asheville, NC, USA, 2013.
  14. Liu, Y.; Yu, Y.; Yu, P.; Göttsche, F.M.; Trigo, I.F. Quality Assessment of S-NPP VIIRS Land Surface Temperature Product. Remote Sens. 2015, 7, 12215–12241. [Google Scholar] [CrossRef] [Green Version]
  15. Malakar, N.K.; Hulley, G.C. A water vapor scaling model for improved land surface temperature and emissivity separation of MODIS thermal infrared data. Remote Sens. Environ. 2016, 182, 252–264. [Google Scholar] [CrossRef]
  16. Uprety, S.; Cao, C.; Xiong, X.; Blonski, S.; Wu, A.; Shao, X. Radiometric Intercomparison between Suomi-NPP VIIRS and Aqua MODIS Reflective Solar Bands Using Simultaneous Nadir Overpass in the Low Latitudes. J. Atmospheric Ocean. Technol. 2013, 30, 2720–2736. [Google Scholar] [CrossRef]
  17. Guillevic, P.C.; Biard, J.C.; Hulley, G.C.; Privette, J.L.; Hook, S.J.; Olioso, A.; Gottsche, F.M.; Radocinski, R.; Roman, M.O.; Yunyue, Y.; et al. Validation of Land Surface Temperature products derived from the Visible Infrared Imaging Radiometer Suite (VIIRS) using ground-based and heritage satellite measurements. Remote Sens. Environ. 2014, 154, 19–37. [Google Scholar] [CrossRef]
  18. Wan, Z. New refinements and validation of the collection-6 MODIS land-surface temperature/emissivity product. Remote Sens. Environ. 2014, 140, 36–45. [Google Scholar] [CrossRef]
  19. Duan, S.-B.; Li, Z.-L.; Cheng, J.; Leng, P. Cross-satellite comparison of operational land surface temperature products derived from MODIS and ASTER data over bare soil surfaces. ISPRS J. Photogramm. Remote Sens. 2017, 126, 1–10. [Google Scholar] [CrossRef]
  20. Duan, S.-B.; Li, Z.-L.; Wu, H.; Leng, P.; Gao, M.; Wang, C. Radiance-based validation of land surface temperature products derived from Collection 6 MODIS thermal infrared data. Int. J. Appl. Earth Obs. Geoinform: ITC J. 2018, 70, 84–92. [Google Scholar] [CrossRef]
  21. Hulley, G.C.; Malakar, N.K.; Islam, T.; Freepartner, R.J. NASA’s MODIS and VIIRS Land Surface Temperature and Emissivity Products: A Long-Term and Consistent Earth System Data Record. IEEE J. Sel. Top. Appl. Earth Obs. Remote Sens. 2017, 11, 522–535. [Google Scholar] [CrossRef]
  22. Duan, S.-B.; Li, Z.-L.; Li, H.; Göttsche, F.-M.; Wu, H.; Zhao, W.; Leng, P.; Zhang, X.; Coll, C. Validation of Collection 6 MODIS land surface temperature product using in situ measurements. Remote Sens. Environ. 2019, 225, 16–29. [Google Scholar] [CrossRef] [Green Version]
  23. Zhou, D.; Zhao, S.; Liu, S.; Zhang, L.; Zhu, C. Surface urban heat island in China’s 32 major cities: Spatial patterns and drivers. Remote Sens. Environ. 2014, 152, 51–61. [Google Scholar] [CrossRef]
  24. Bechtel, B. A New Global Climatology of Annual Land Surface Temperature. Remote Sens. 2015, 7, 2850–2870. [Google Scholar] [CrossRef] [Green Version]
  25. Zhao, L.; Lee, X.; Smith, R.B.; Oleson, K. Strong contributions of local background climate to urban heat islands. Nature 2014, 511, 216–219. [Google Scholar] [CrossRef] [PubMed]
  26. Zhao, G.; Dong, J.; Liu, J.; Zhai, J.; Cui, Y.; He, T.; Xiao, X. Different Patterns in Daytime and Nighttime Thermal Effects of Urbanization in Beijing-Tianjin-Hebei Urban Agglomeration. Remote Sens. 2017, 9, 121. [Google Scholar] [CrossRef] [Green Version]
  27. Zhou, B.; Rybski, D.; Kropp, J.P. On the statistics of urban heat island intensity. Geophys. Res. Lett. 2013, 40, 5486–5491. [Google Scholar] [CrossRef]
  28. Gawuc, L.; Struzewska, J. Impact of MODIS Quality Control on Temporally Aggregated Urban Surface Temperature and Long-Term Surface Urban Heat Island Intensity. Remote Sens. 2016, 8, 374. [Google Scholar] [CrossRef] [Green Version]
  29. Lai, J.; Zhan, W.; Huang, F.; Quan, J.; Hu, L.; Gao, L.; Ju, W. Does quality control matter? Surface urban heat island intensity variations estimated by satellite-derived land surface temperature products. ISPRS J. Photogramm. Remote Sens. 2018, 139, 212–227. [Google Scholar] [CrossRef]
  30. Yao, R.; Wang, L.; Wang, S.; Wang, L.; Wei, J.; Li, J.; Yu, D. A detailed comparison of MYD11 and MYD21 land surface temperature products in mainland China. Int. J. Digit. Earth 2020, 13, 1391–1407. [Google Scholar] [CrossRef]
  31. LP DAAC. AppEEARS Team Application for Extracting and Exploring Analysis Ready Samples (AppEEARS). Ver. 2.40. NASA EOSDIS Land Processes Distributed Active Archive Center (LP DAAC), USGS/Earth Resources Observation and Science (EROS) Center: Sioux Falls, SD, USA, 2020. Available online: https://lpdaacsvc.cr.usgs.gov/appeears (accessed on 29 April 2020).
  32. Dewan, A.; Kiselev, G.; Botje, D. Diurnal and seasonal trends and associated determinants of surface urban heat islands in large Bangladesh cities. Appl. Geogr. 2021, 135, 102533. [Google Scholar] [CrossRef]
  33. Dewan, A.; Kiselev, G.; Botje, D.; Mahmud, G.I.; Bhuian, H.; Hassan, Q.K. Surface urban heat island intensity in five major cities of Bangladesh: Patterns, drivers and trends. Sustain. Cities Soc. 2021, 17, 102926. [Google Scholar] [CrossRef]
  34. Hu, L.; Brunsell, N. The impact of temporal aggregation of land surface temperature data for surface urban heat island (SUHI) monitoring. Remote Sens. Environ. 2013, 134, 162–174. [Google Scholar] [CrossRef]
  35. Li, X.; Messina, J.; Moore, N.J.; Fan, P.; Shortridge, A.M. MODIS land cover uncertainty in regional climate simulations. Clim. Dyn. 2017, 49, 4047–4059. [Google Scholar] [CrossRef] [Green Version]
  36. Yao, R.; Wang, L.; Gui, X.; Zheng, Y.; Zhang, H.; Huang, X. Urbanization Effects on Vegetation and Surface Urban Heat Islands in China’s Yangtze River Basin. Remote Sens. 2017, 9, 540. [Google Scholar] [CrossRef] [Green Version]
  37. Chakraborty, T.; Lee, X.; Ermida, S.; Zhan, W. On the land emissivity assumption and Landsat-derived surface urban heat islands: A global analysis. Remote Sens. Environ. 2021, 265, 112682. [Google Scholar] [CrossRef]
  38. Chakraborty, T.; Hsu, A.; Manya, D.; Sheriff, G. A spatially explicit surface urban heat island database for the United States: Characterization, uncertainties, and possible applications. ISPRS J. Photogramm. Remote Sens. 2020, 168, 74–88. [Google Scholar] [CrossRef]
  39. Ardon-Dryer, K.; Huang, Y.-W.; Cziczo, D.J. Laboratory studies of collection efficiency of sub-micrometer aerosol particles by cloud droplets on a single-droplet basis. Atmospheric Chem. Phys. 2015, 15, 9159–9171. [Google Scholar] [CrossRef] [Green Version]
Figure 1. Location of Perth and the Kimberley within western Australia. (Image source: ESRI, Maxar, EarthStar Geographics and the GIS User Community).
Remotesensing 14 02296 g001
Figure 2. Flowchart of the LST processing.
Remotesensing 14 02296 g002
Figure 3. Perth MYD11A2 mean and min/max LST: (a) day and (b) night.
Remotesensing 14 02296 g003
Figure 4. Perth VNP21A2 mean and min/max LST: (a) day and (b) night.
Remotesensing 14 02296 g004
Figure 5. Perth MYD21A2 mean and min/max LST: (a) day and (b) night.
Remotesensing 14 02296 g005
Figure 6. Perth MYD21A2 image date 2019057: (a) LST with the original, unscaled K values shown and (b) the processed MODLAND = 00 bit flag results for the same image. The red/green pixels are the applicable high/low LST values in the image to be retained.
Remotesensing 14 02296 g006
Figure 7. Boxplot showing the yearly diurnal ranges for the three LST products for Perth. This consists of 25th percentile (1st quartile), median (2nd quartile), 75th percentile (3rd quartile), and min (10th percentile)/max (90th percentile) values.
Remotesensing 14 02296 g007
Figure 8. Kimberley MYD11A2 mean and min/max LST: (a) day and (b) night.
Remotesensing 14 02296 g008
Figure 9. Kimberley VNP21A2 mean and min/max LST: (a) day and (b) night.
Remotesensing 14 02296 g009
Figure 10. Kimberley MYD21A2 mean and min/max LST: (a) day and (b) night.
Remotesensing 14 02296 g010
Figure 11. Boxplot showing the yearly diurnal ranges for the three LST products for Kimberley. This consists of 25th percentile (1st quartile), median (2nd quartile), 75th percentile (3rd quartile), and min (10th percentile)/max (90th percentile) values.
Remotesensing 14 02296 g011
Figure 12. Image date 2019009, Perth summer, day MODLAND quality comparison: (a) MYD21A2 and (b) MYD11A2.
Remotesensing 14 02296 g012
Figure 13. Image date 2019009, Kimberley summer, day MODLAND quality comparison: (a) MYD21A2 and (b) MYD11A2.
Remotesensing 14 02296 g013
Figure 14. Image 2019009, Kimberley emissivity error comparison: (a) MYD21A2 and (b) MYD11A2.
Remotesensing 14 02296 g014
Figure 15. Image 2019009, Kimberley emissivity error comparison: (a) MYD21A2 and (b) MYD11A2.
Remotesensing 14 02296 g015
Table 1. Summary of all data obtained for this study.
DataSourceTypeNominal ResolutionDatePeriodProcessingReference
MODIS
MYD11A2
AQUALST: C/V6,
Level 3
1 km2002–20208-dayGSW, classified
emissivity
https://lpdaac.usgs.gov/products/myd11a2v006 (accessed on 12 December 2021)
MYD21A2
(reprocessed)
LST: C/V6, Level 31 km2002–20208-dayTES, dynamic retrieval of emissivityhttps://lpdaac.usgs.gov/products/myd21a2v006 (accessed on 12 December 2021)
VIIRS
VNP21A2
S-NPPLST: C/V1, Level 31 km2012–20208-daySame as MYD21A2https://lpdaac.usgs.gov/products/vnp21a2v001 (accessed on 12 December 2021)
Table 2. Correlation between the three Perth LST products for the three years.
YearDiurnalMYD11A2-DayMYD21A2-DayMYDA2- NightVNP21A2-Night
2013VNP21A2-day0.9979
MYD21A2-day0.99910.9971
VNP21A2-night 0.9990
MYD21A2-night 0.99890.9988
2016VNP21A2-day0.9977
MYD21A2-day0.99710.9968
VNP21A2-night 0.9947
MYD21A2-night 0.99850.9957
2019VNP21A2-day0.9977
MYD21A2-day0.99800.9974
VNP21A2-night 0.9960
MYD21A2-night 0.99830.9963
Table 3. Correlation between the three Kimberley LST products (day and night).
YearDiurnalMYD11A2-DayMYD21A2-DayMYD21A2-NightVNP21A2-Night
2013VNP21A2-day0.8895
MYD21A2-day0.88160.9991
VNP21A2-night 0.9982
MYD21A2-night 0.99830.9893
2016VNP21A2-day0.9227
MYD21A2-day0.91430.9991
VNP21A2-night 0.9890
MYD21A2-night 0.99220.9964
2019VNP21A2-day0.8669
MYD21A2-day0.83290.9899
VNP21A2-night 0.9898
MYD21A2-night 0.99130.9984
Table 4. Comparison of the yearly temperature differences for 2013, 2016, and 2019.
RMSE
Annual Mean (Δ °C) VNP21A2 (Δ °C)MYD21A2 (Δ °C)
AreaYearDay LST Mean (Δ °C)Night LST Mean (Δ °C)DayNightDayNight
Perth20131.290.810.7460.8341.2190.863
20161.470.860.8880.9311.4450.713
20191.210.990.7860.9621.1921.177
Kimberley20137.772.598.2452.4808.5577.796
20166.452.316.9662.3497.3766.675
20196.852.257.2752.3627.8827.219
Table 5. Kimberley 2019 monthly data by percentile. The 97.7th percentile is commonly used as an indicator of the level at which “outlier” values should be removed from the calculations.
YearMYD11A2-DayMYD11A2-NightVNP21A2-DayVNP21A2-NightMYD21A2-DayMYD21A2-Night
25th Percentile40.3918.1844.5019.0544.4318.94
10th Percentile39.0915.4541.2816.3441.3915.57
1st Percentile37.6815.0039.6715.5339.8815.39
Median42.8923.3551.2525.3952.9925.69
97.7th Percentile50.8926.4359.1330.1359.6830.56
90th Percentile50.4425.6657.4129.8657.5330.09
75th Percentile47.2424.9455.5327.5155.7228.37
Maximum51.0026.6759.6730.2060.3630.71
Minimum37.5214.9539.5115.4439.7215.37
Mean43.8321.6150.2023.5950.6523.74
Publisher’s Note: MDPI stays neutral with regard to jurisdictional claims in published maps and institutional affiliations.

