Article

Detection of Aquatic Alligator Weed (Alternanthera philoxeroides) from Aerial Imagery Using Random Forest Classification

by
Kathryn J. Sheffield
1,*,
Daniel Clements
2,
Darryl J. Clune
3,
Angela Constantine
4 and
Tony M. Dugdale
1
1
Agriculture Victoria Research, Department of Jobs, Precincts and Regions, AgriBio, 5 Ring Road, Bundoora, VIC 3083, Australia
2
National Institute of Water and Atmospheric Research, Gate 10 Silverdale Road, Hillcrest, Hamilton 3216, New Zealand
3
Agriculture Victoria, Department of Jobs, Precincts and Regions, 10 Staunton Street, Lakes Entrance, VIC 3909, Australia
4
Agriculture Victoria, Department of Jobs, Precincts and Regions, 475 Mickleham Road, Attwood, VIC 3049, Australia
*
Author to whom correspondence should be addressed.
Remote Sens. 2022, 14(11), 2674; https://doi.org/10.3390/rs14112674
Submission received: 14 April 2022 / Revised: 27 May 2022 / Accepted: 30 May 2022 / Published: 2 June 2022
(This article belongs to the Section Ecological Remote Sensing)

Abstract

:
Alligator weed (Alternanthera philoxeroides (Mart.) Griseb) forms dense infestations in aquatic environments and is the focus of intensive management programs in many jurisdictions within Australia, including Victoria. A critical component of weed biosecurity programs is surveillance to find the location and extent of the target weed so that control strategies can be implemented. Current approaches within Victoria rely heavily on ground surveys and community reporting. However, these methods do not provide a systematic approach to surveillance across landscapes, resulting in undiscovered infestations. The aim of this study was to detect alligator weed from aerial photography and demonstrate the potential use of remote sensing data to support existing ground surveys and monitoring programs. Two random forest algorithms were trained based on data from 2010 and 2016. Both classifiers had high levels of accuracy, with an overall pixel-based classification accuracy of 96.8% in 2010 and 98.2% in 2016. The trained classifiers were then applied to imagery acquired annually between 2010 and 2016. The classification outputs were combined with class probability and water proximity data to produce a weighted, normalised alligator weed likelihood data layer. These datasets were evaluated by assessing alligator weed patch detection rates, using manually delineated areas of weed for each year. The patch detection rates for each year ranged from 76.5% to 100%. The results also demonstrate the use of this approach for monitoring alligator weed infestations at a site over time. The key outcome of the study is an approach to support existing biosecurity monitoring and surveillance efforts at a landscape scale and at known infested localised sites.

1. Introduction

Invasive weeds have a large impact on natural ecosystems, as well as urban, peri-urban and agricultural environments. In natural ecosystems, they are responsible for substantial biodiversity loss [1], while in productive systems they substantially reduce agricultural productivity [2]. Weed management, through biosecurity programs that facilitate detection, monitoring and eradication, play a critical role in minimising these impacts. Weed detection and mapping is critical for management and eradication programs. Increasingly, remote sensing (RS) is being utilised in these applications, providing a cost-effective and efficient means of mapping weed distributions at multiple spatial and temporal scales.

1.1. Alligator Weed

Alligator weed (Alternanthera philoxeroides (Mart.) Griseb.) has invaded over 30 countries across Asia, Europe, North America, South America and Oceania [3]. It is native to South America and was first detected in Australia in the 1940s. Alligator weed is an aquatic plant that forms dense, monotypic stands throughout wetlands and open waterbodies. It also grows in terrestrial habitats. In Australia, the growing season is typically between November and May, with leaf area and biomass peaking during January (mid-summer) [4]. Alligator weed reproduces and disperses vegetatively through stem fragments [5]. It has not been observed to produce viable seeds in Australia [4]. Alligator weed can grow very rapidly [6], and can double in biomass in 41 days [4]. It is identified by hollow stems, small white flowers and bright green leaves growing in opposite pairs [6,7,8]. Alligator weed flowers over summer (December–February in Australia) [4].
Weeds are often managed in a biosecurity context, which aims to protect the environment, economy and community from the impacts of weeds [9]. Measures are enacted to control weeds based on a strategic approach where priority weeds are selected (often through government legislated noxious weed lists). Control programs are enacted with clear aims to either eradicate, contain or suppress the target weed, depending on the stage of weed invasion and the perceived potential impacts [10,11,12,13]. Alligator weed is declared a weed of national significance in Australia. It is declared a prohibited weed in Victoria, where it is subject of an ongoing weed biosecurity eradication program implemented by the State Government.
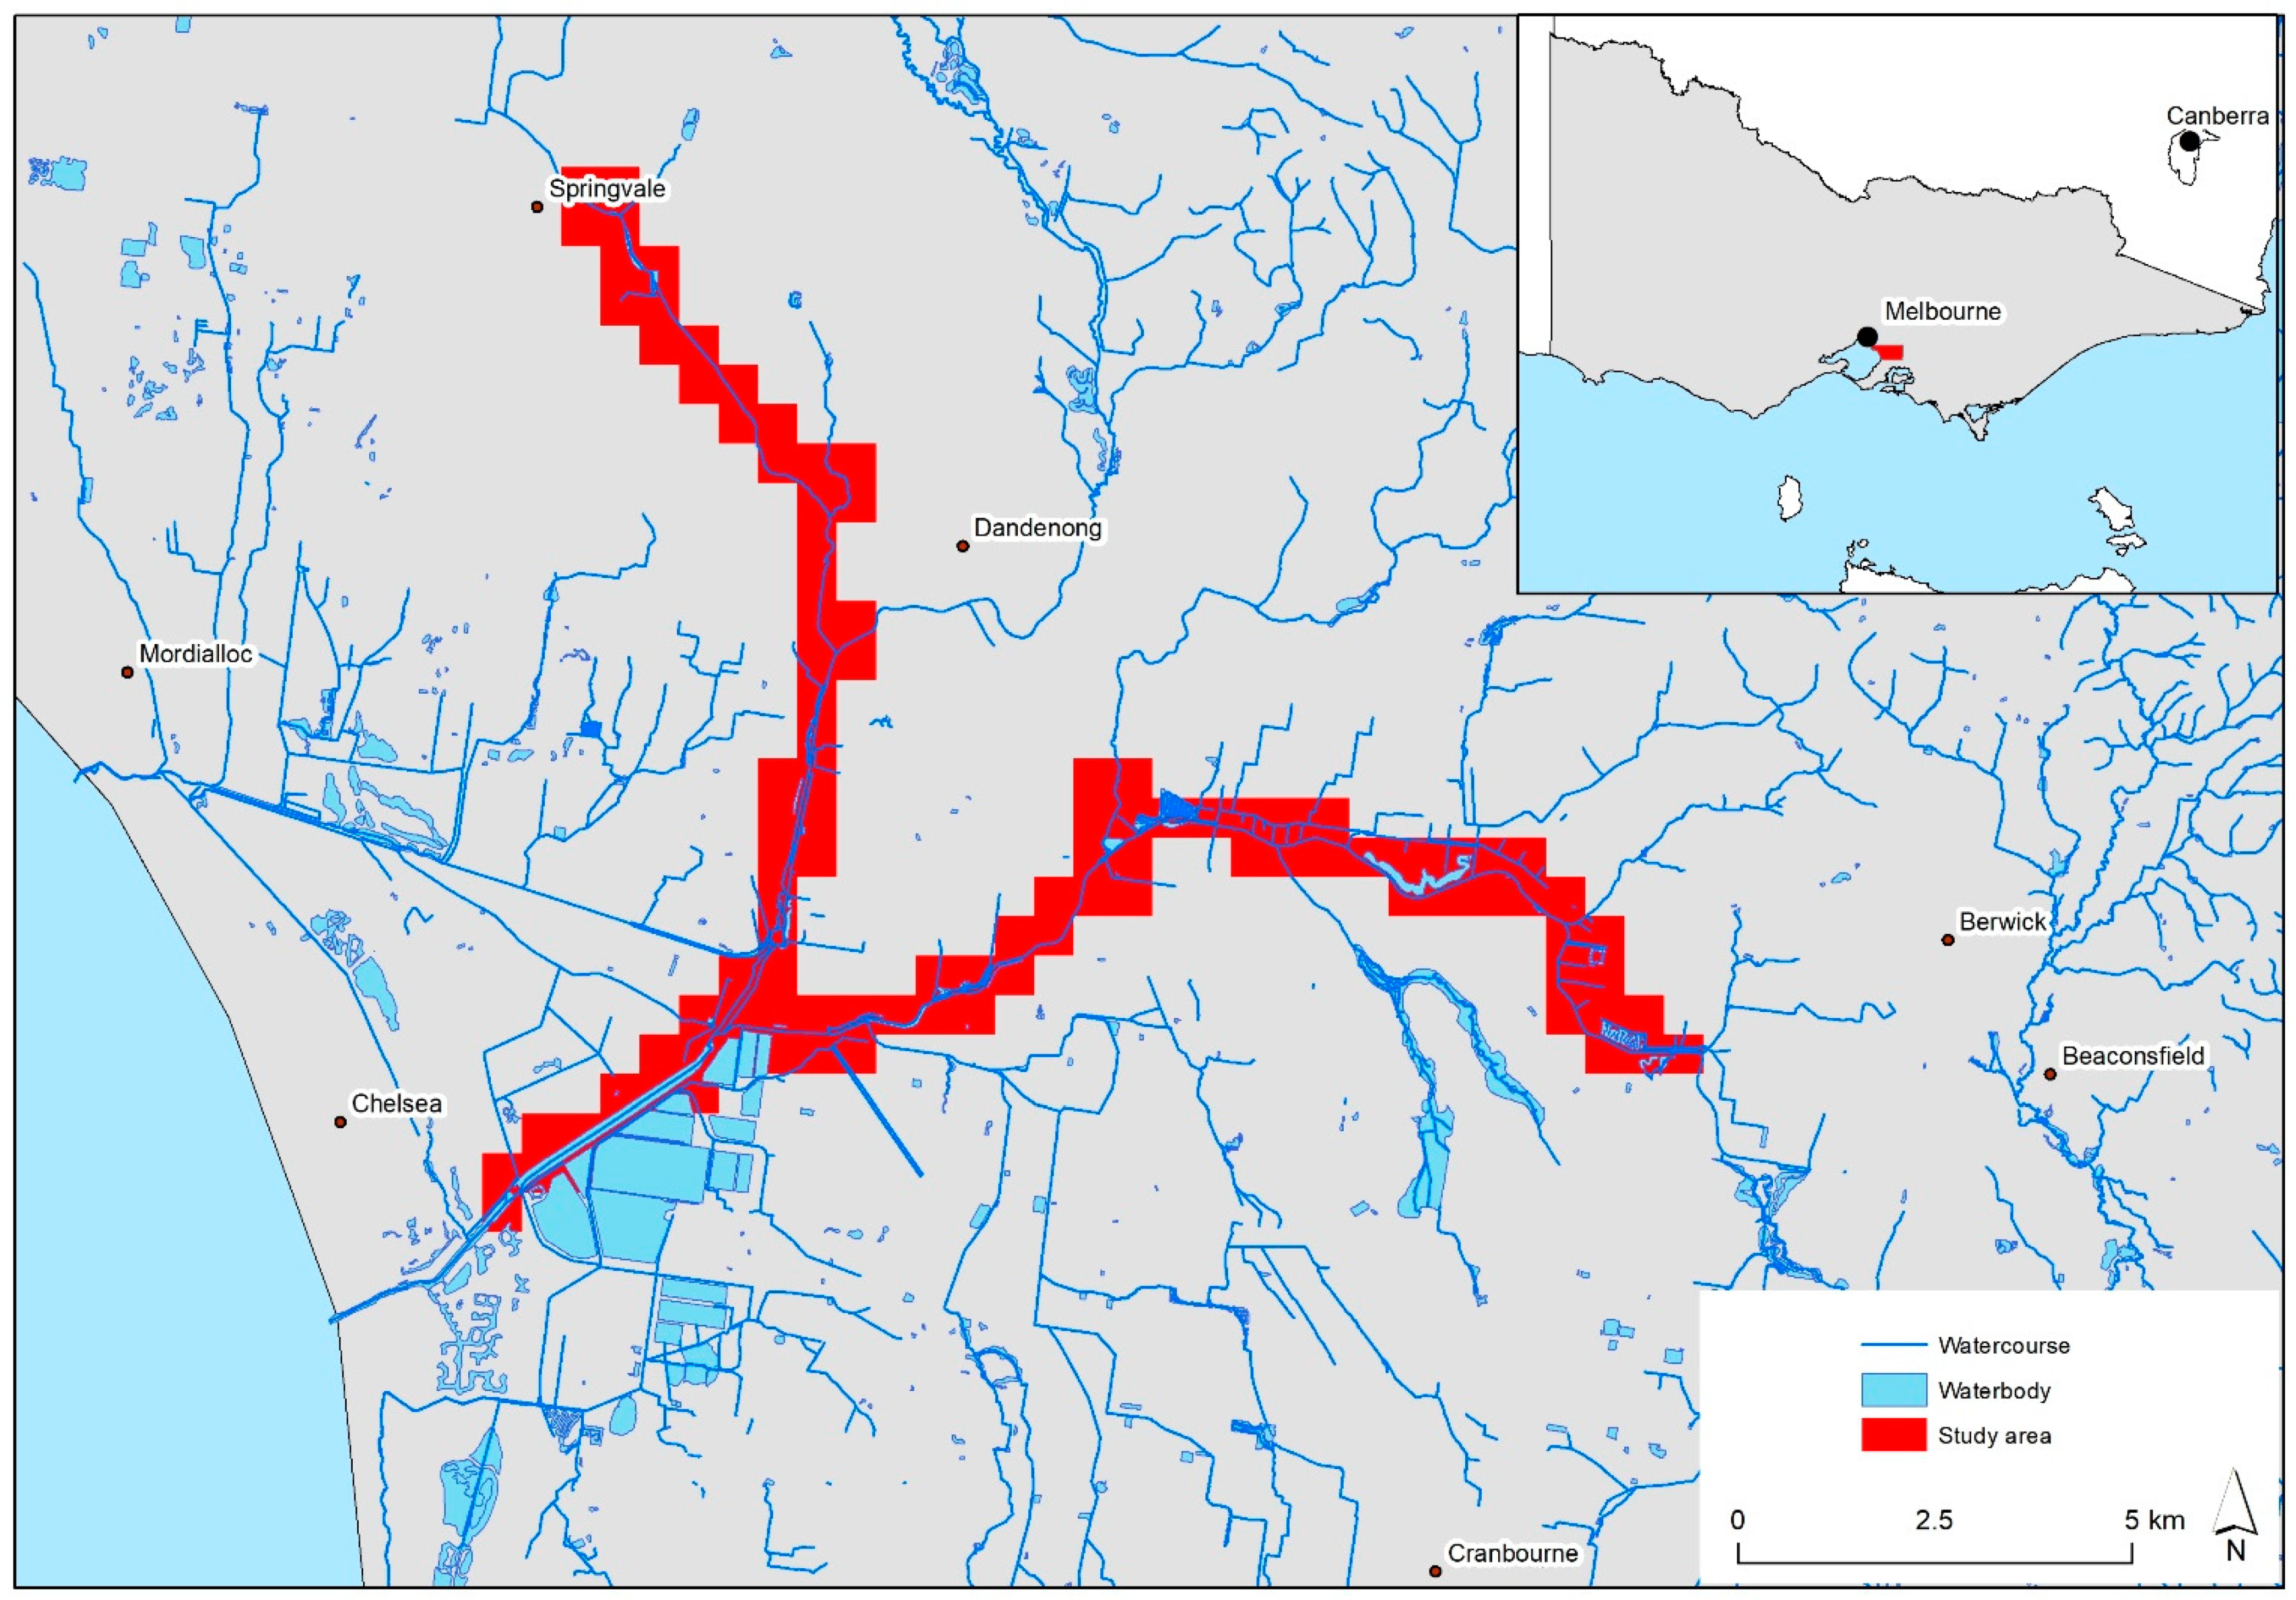
A critical component of any weed biosecurity program are surveillance activities to find the location and extent of the weed, particularly during the early stages of colonisation. The probability of eradication is highest, and eradication is achievable at lowest cost, when a weed invasion is detected at a stage when the species is neither abundant nor widely distributed [14,15,16]. Current approaches within Victoria rely heavily on ground surveys and community reporting. While ground surveys are effective, they do not provide a systematic approach to surveillance across landscapes or regions. Therefore, infestations may go undetected for years since being introduced to a site, compromising eradication programs. For example, in Springvale, Melbourne, Victoria, alligator weed was first reported in 2009; a subsequent study utilising historical aerial photography (AP) showed alligator weed was present at this site for at least five years before being reported [6]. During this time, the infestation had become much larger (>6000 m2) and would have produced many propagules capable of downstream dispersal. This example highlights the need for new, innovative approaches for weed detection and surveillance.

1.2. Weed Detection Utilising Remote Sensing

A wide range of RS data and analytical techniques are used to detect weed species, including data from unmanned aerial vehicles (UAVs), aircraft and satellites. Many applications have focused on agricultural weeds, with weed detection from RS being used to improve crop management activities such as herbicide spraying [17,18,19]. In aquatic and riparian environments, RS has been utilised in a range of applications, including mapping vegetation communities [20], weed abundance [21,22] or target species such as Phragmites [23,24,25], water hyacinth (Eichhornia crassipes (Mart.) Solms) [26,27,28,29] or giant salvinia (Salvinia molesta D.S.Mitchell) [30].
RS offers a range of spectral features which can be used to identify weed species [17,31,32]. In some studies, image texture features are used to enhance discrimination [31,33]. Image classification approaches adopted are often specific to the particular study area. Examples used to detect aquatic weeds include random forests (RF) [28], support vector machines (SVM) [24], classification and regression tree (CART) [21], and neural networks (NN) [25]. Some studies, such as Singh et al. [29] use multiple classification approaches as part of a multistep process. The choice, and performance, of different classification approaches is largely study-specific. Mukarugwiro et al. [28] found that, compared with an SVM approach, an RF classification provided better discrimination of water hyacinth, an aquatic weed, from other vegetation. There is an increasing use of machine learning and deep learning in RS weed detection applications [34]. RF is one such example. Reviews considering the use of RF for RS applications have been published by Pal [35] and Belgiu and Drăguţ [36].
RF [37] is an ensemble classification approach based on a large cohort of decision trees. These trees are formed using random samples of training data, generated by bagging. Each tree provides an independent class vote, with the aggregated results used to determine probabilities for each class per unit (e.g., pixel). The final class is assigned based on the highest probability. The large number of trees generated in this approach improves the classification accuracy [37]. The use of a large number of trees, and use of randomly selected subsets of training data and input variables to split nodes within these trees, mean the RF approach is considered less sensitive to overfitting than other machine learning classifiers [36,37]. Training data is a crucial consideration for RS classification applications, including RF. It has been noted that RF tend to be more robust against data noise and data quality issues such as mislabelling [36,37,38]. Pal [35] found RFs are also able to deal with unbalanced training data. Colditz [39] also compared the impact of different class training data allocations, and found the use of proportional training data based on area produced the best results. This is supported by [40]. However, these findings have not been consistent in the literature, with a different study finding a balanced training data set performed better [38].
Whilst RS has been used in a range of applications to detect aquatic weeds, there have been limited studies published utilising RS technologies to specifically identify alligator weed.
Göktoǧan et al. [41] used an SVM algorithm to detect alligator weed from UAV imagery. Clements et al. [
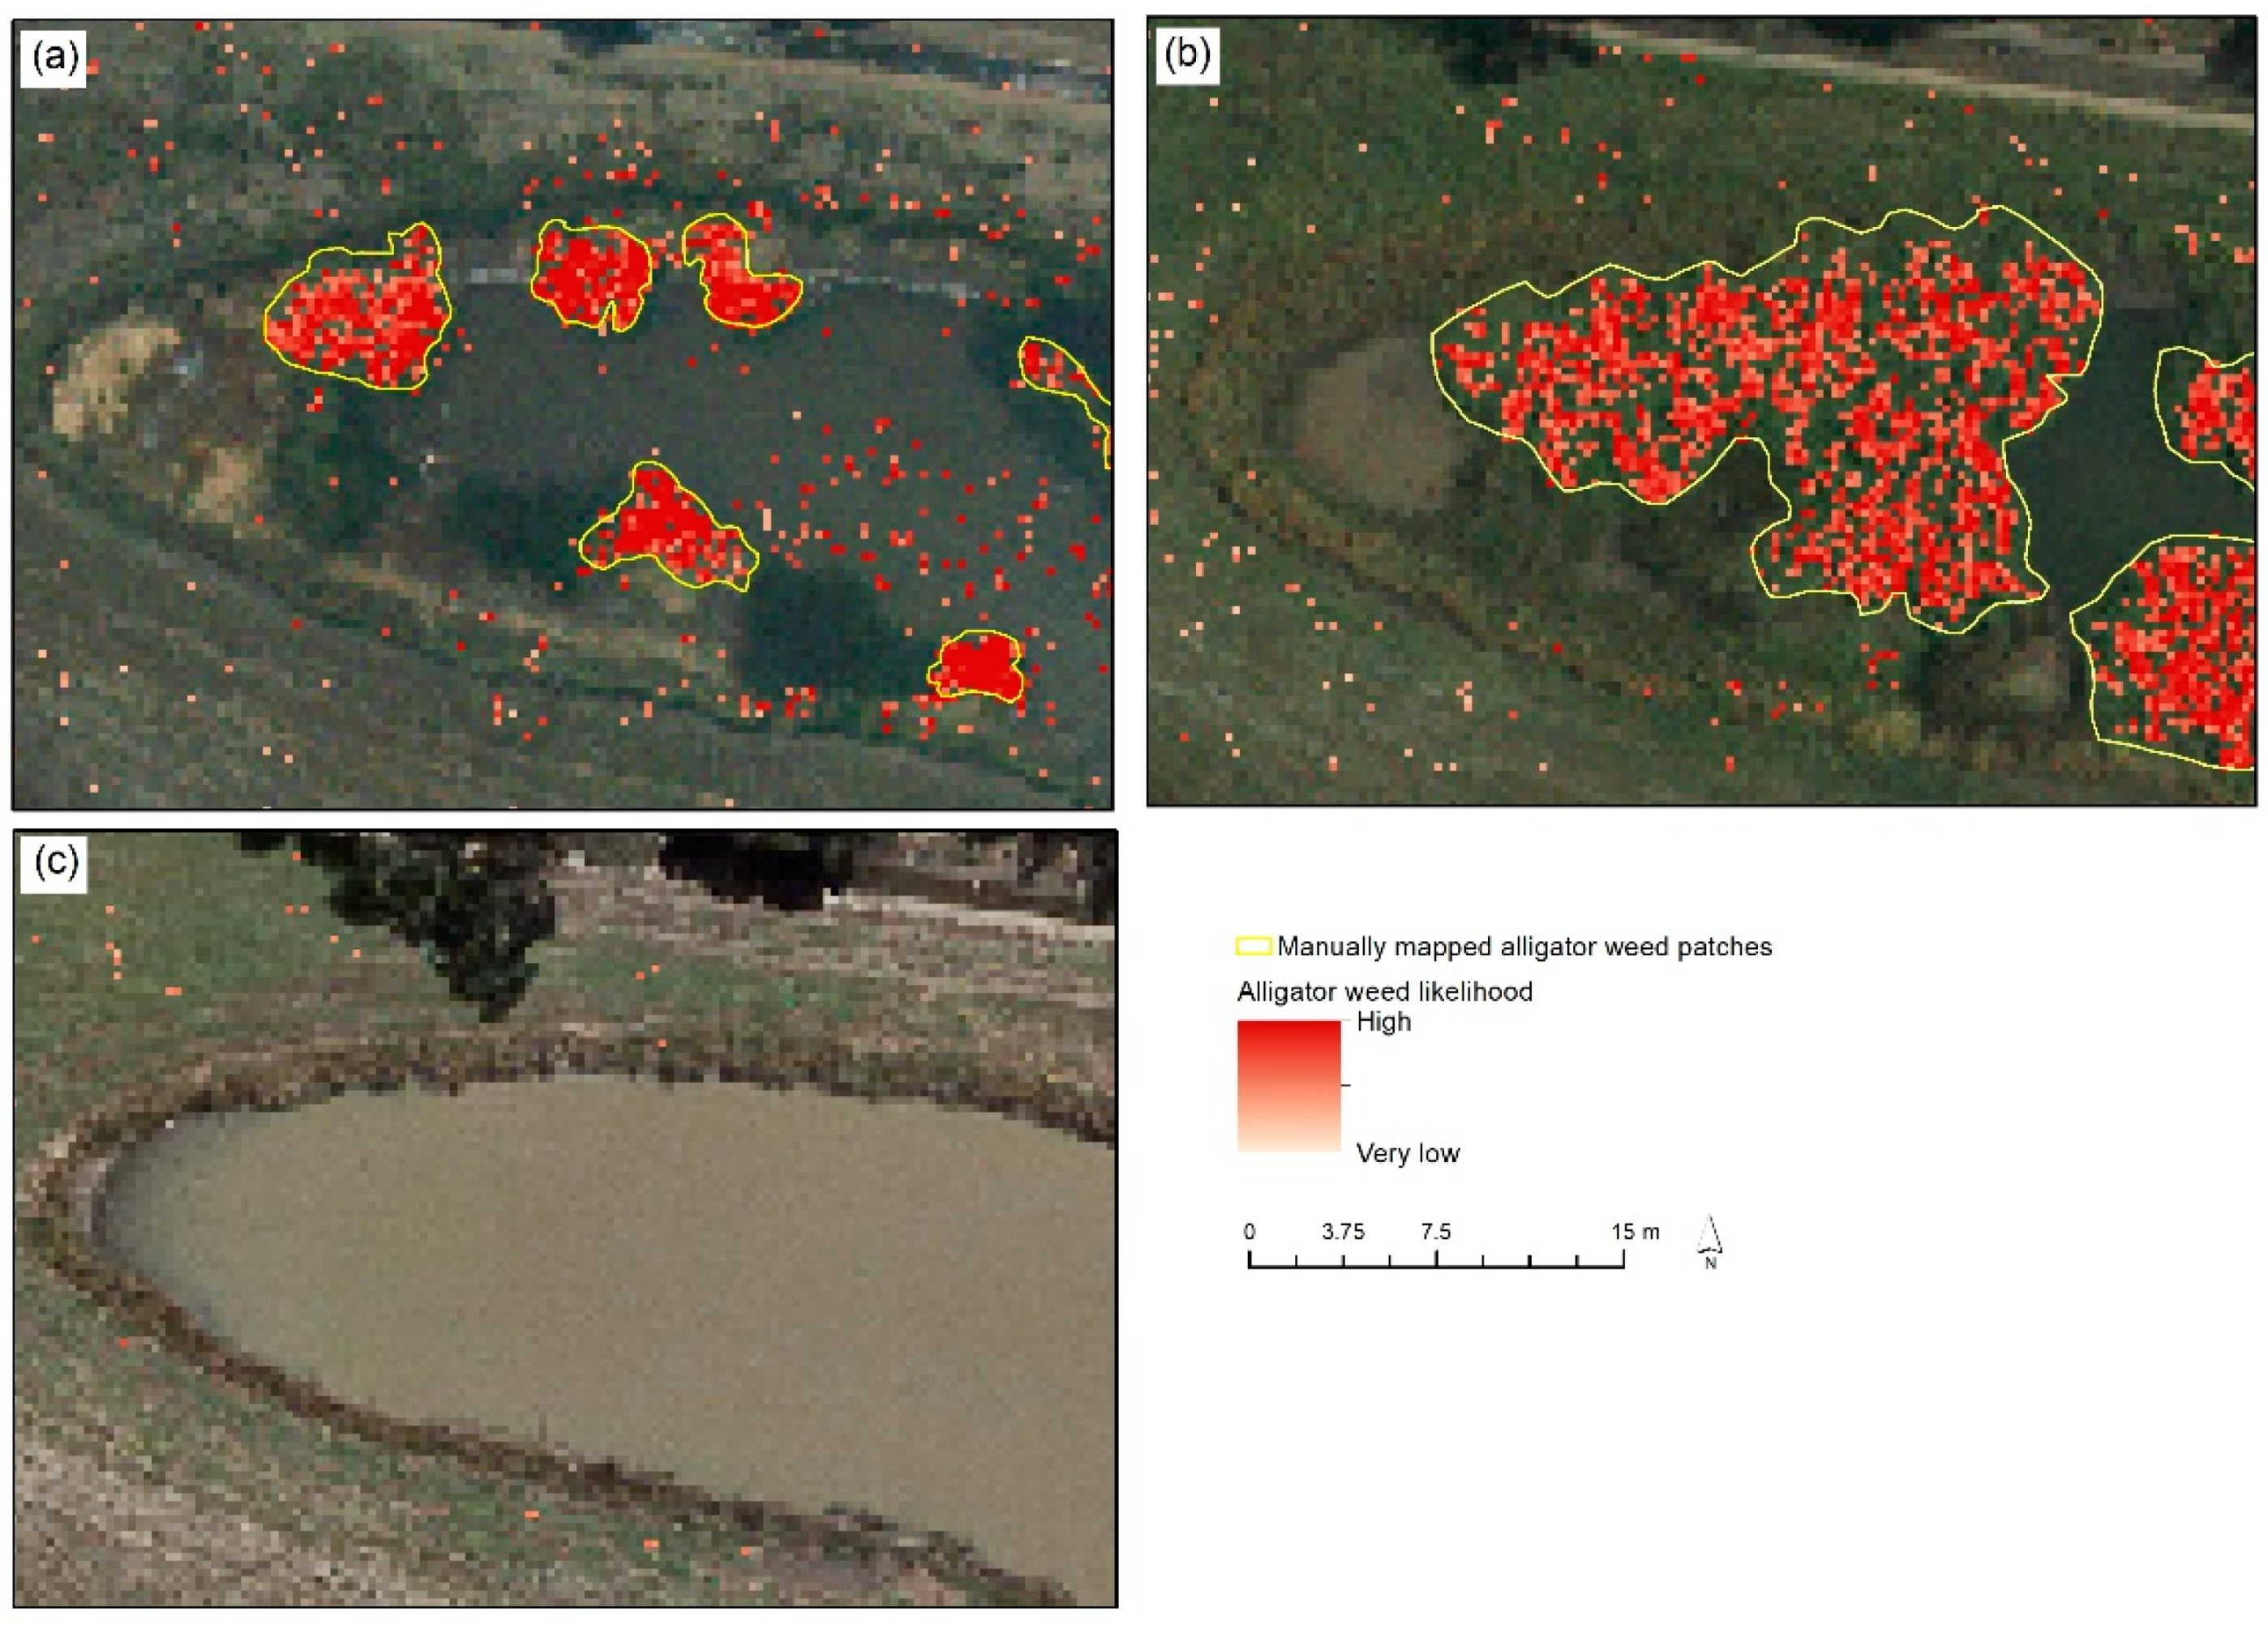
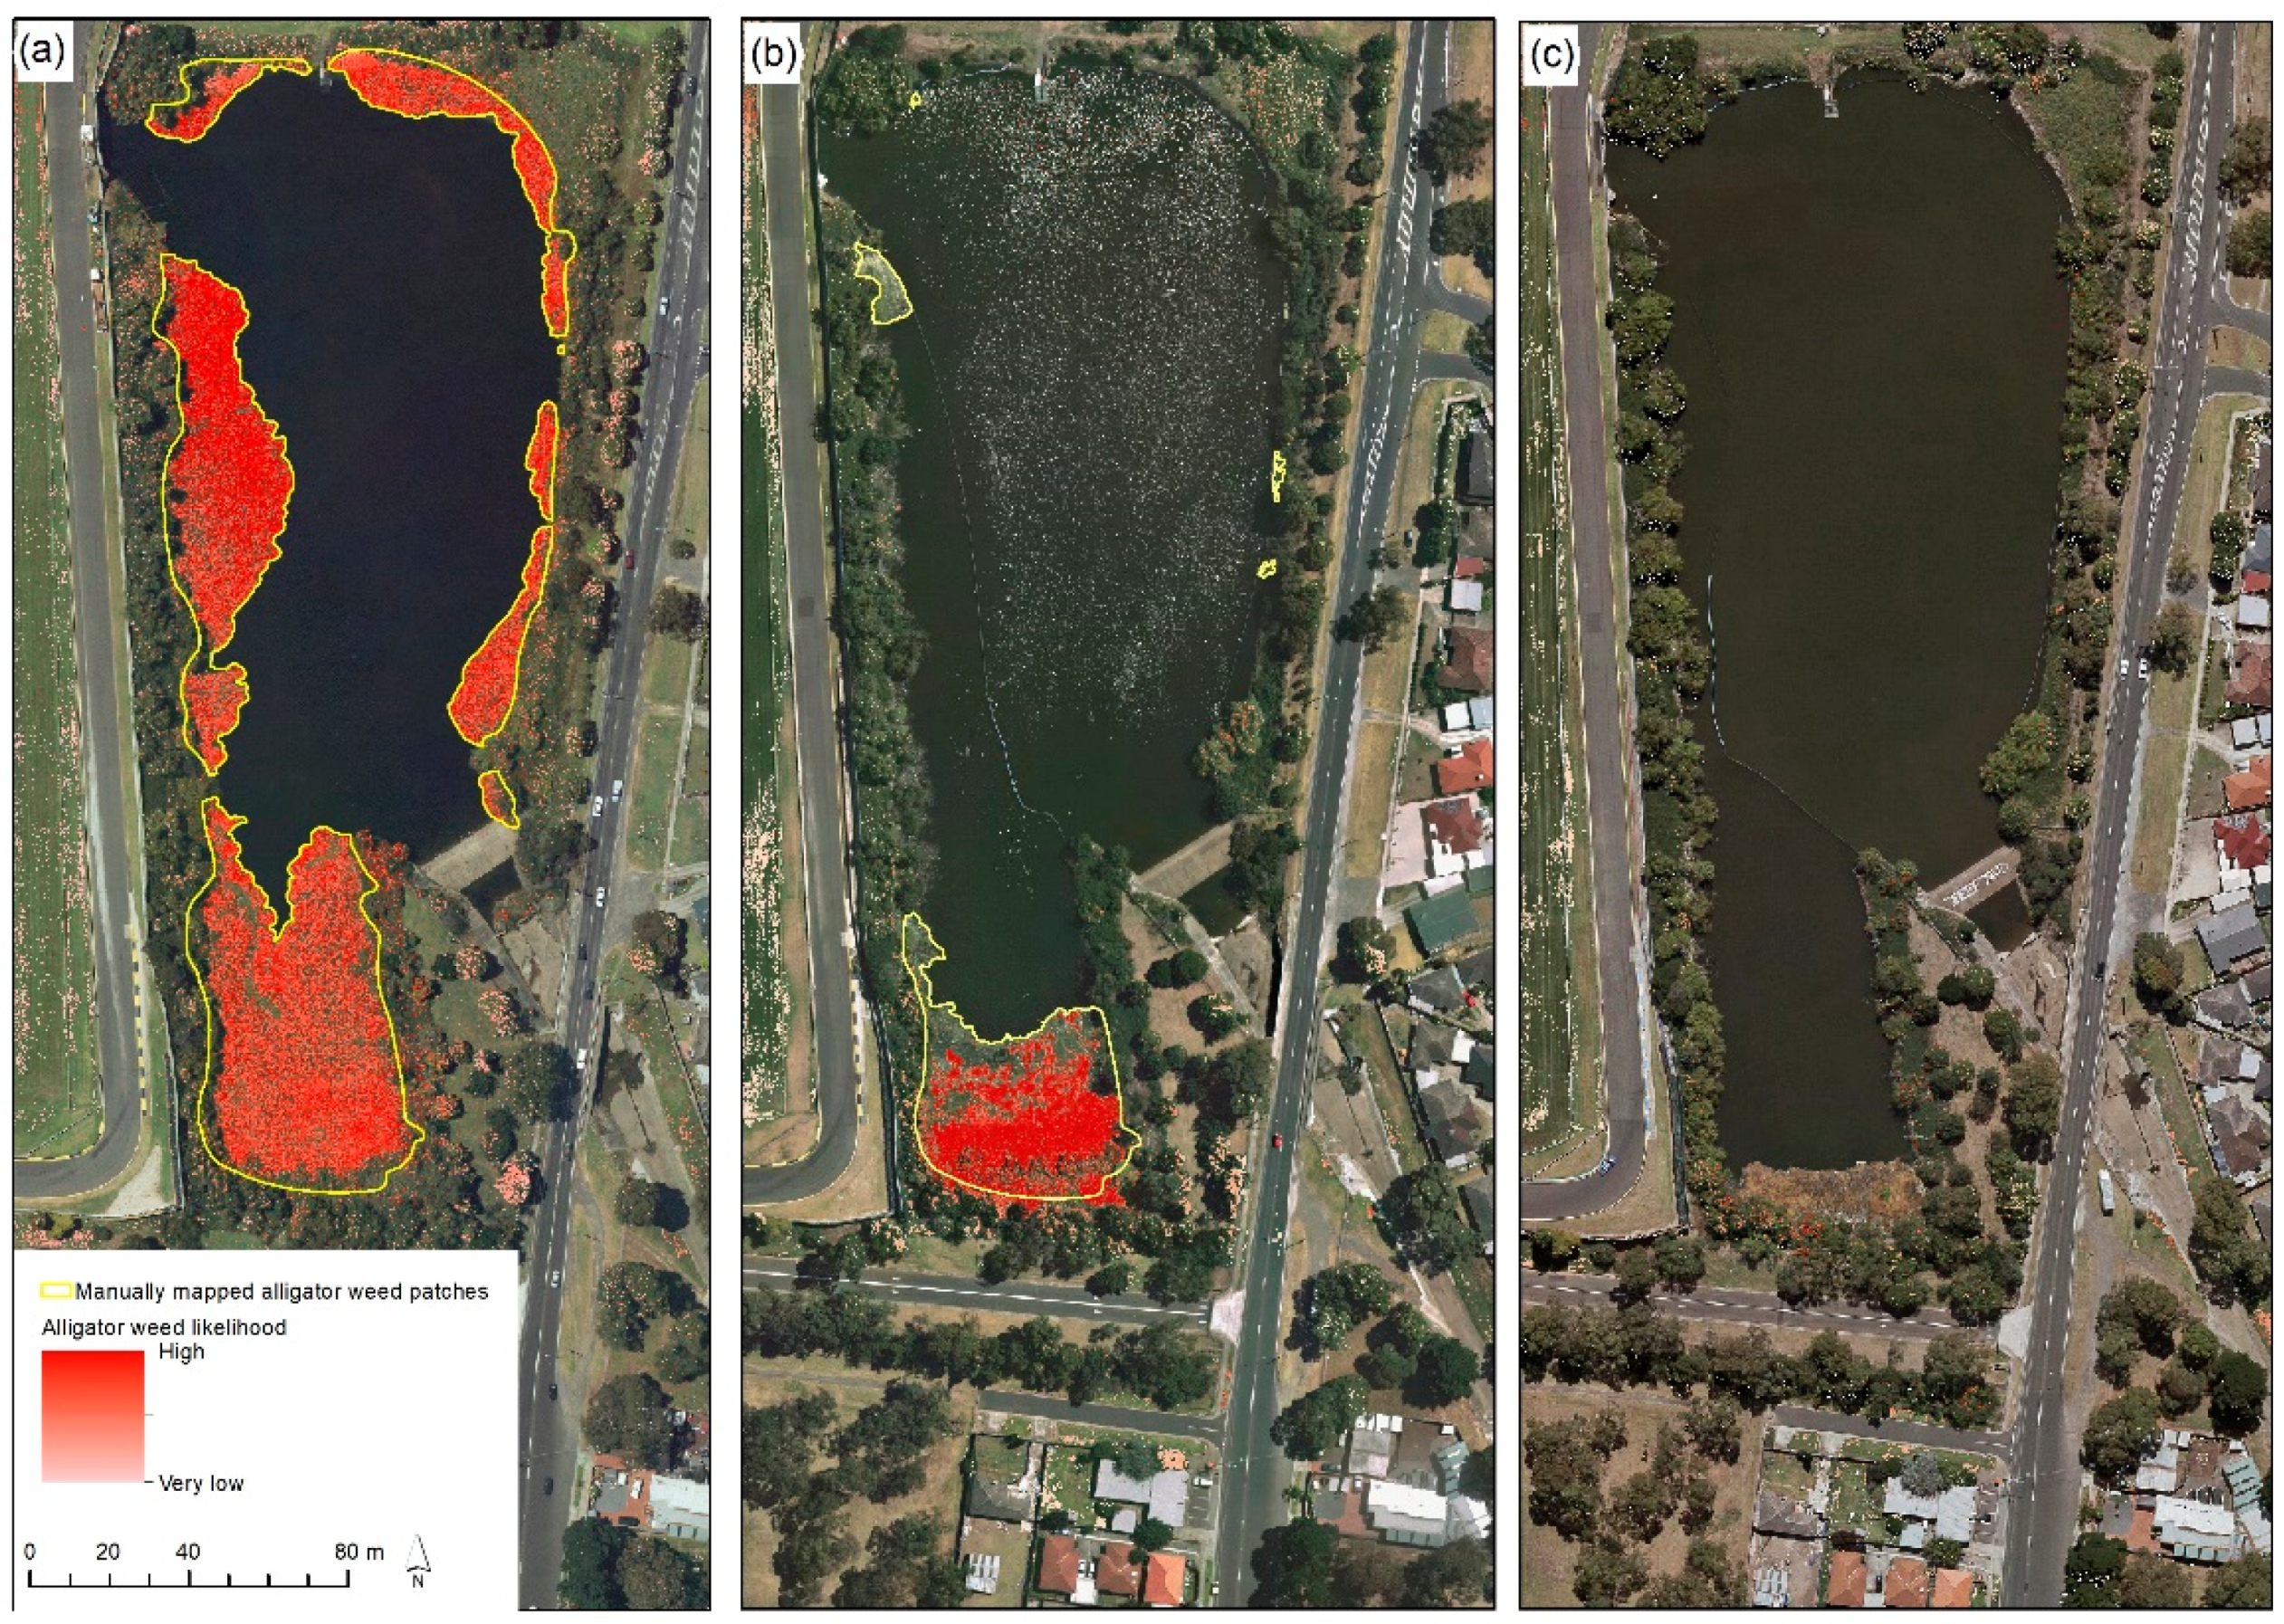
6] published a study documenting the change in alligator weed patches (size and number) within a lake using AP. The extent of alligator weed patches was manually delineated on each of the photos. A study published by Clements et al. [42] compared three approaches to identifying alligator weed along waterways in Victoria, Australia: (1) physically measuring patches of alligator weed in the field and recording the location of these patches with a high-spatial accuracy GPS, (2) manually inspecting UAV imagery and mapping patches of alligator weed in a desktop visual image interpretation exercise and (3) a supervised classification of UAV imagery using a machine learning approach. The training data used for the machine learning was assembled by manually annotating subsets of the UAV imagery. The on-ground surveys were deemed to detect 100% of alligator weed present. The authors found the visual image interpretation exercise to manually map patches of alligator weed identified more patches and smaller areas of alligator weed compared with the machine learning classification approach.
RS can provide valuable data for monitoring changes in vegetation and weeds associated with waterways [21,26,33] and landscapes more generally [31,43,44]. Brinkhoff et al. [21] used RS to characterise weed growth in irrigation channels and subsequently monitor changes in weed abundance. Khanna et al. [26] used image classifications from multiple years to asses changes in weed abundance, and then used those outputs to quantify changes in area and the direction of change (increase or decrease) of target species. Vegetation phenology is an important consideration for monitoring applications. While it can impact the accuracy of RS classifications, knowledge of vegetation growth patterns can also be used to aid discrimination and the interpretation of results [31].
The integration of RS technologies with existing biosecurity weed programs presents opportunities to:
  • Increase weed detection capacity,
  • Improve the timeliness of data availability, and
  • Increase the cost effectiveness of surveillance and management efforts.
This potential has been recognised in a number of studies [32,45,46,47]. Spring et al. [48] demonstrated the benefit of complementing existing on-ground survey and management work with AP surveillance in a fire ant (Solenopsis invicta) eradication program. Brinkhoff et al. [21] suggested use of their weed monitoring approach to instigate weed removal in irrigation channel maintenance programs. Mukarugwiro et al. [28] also noted the potential utility of their results to support water hyacinth management.
While the use of RS for weed detection and monitoring is widely accepted, there is a large diversity in both the imagery and approaches taken. In recognition of this, Sheffield and Dugdale [32] proposed the Weed Aerial Surveillance Program (WASP) as a conceptual framework to guide the development of RS approaches and outputs at multiple spatial scales to complement existing biosecurity programs.

1.3. Aims and Objectives

The studies highlighted above demonstrate the potential for utilising RS imagery to support detection and surveillance programs for alligator weed in waterways. This study aimed to develop an approach utilising regularly acquired AP to support existing weed biosecurity programs to:
  • Detect alligator weed within urban aquatic landscapes, with a known level of accuracy,
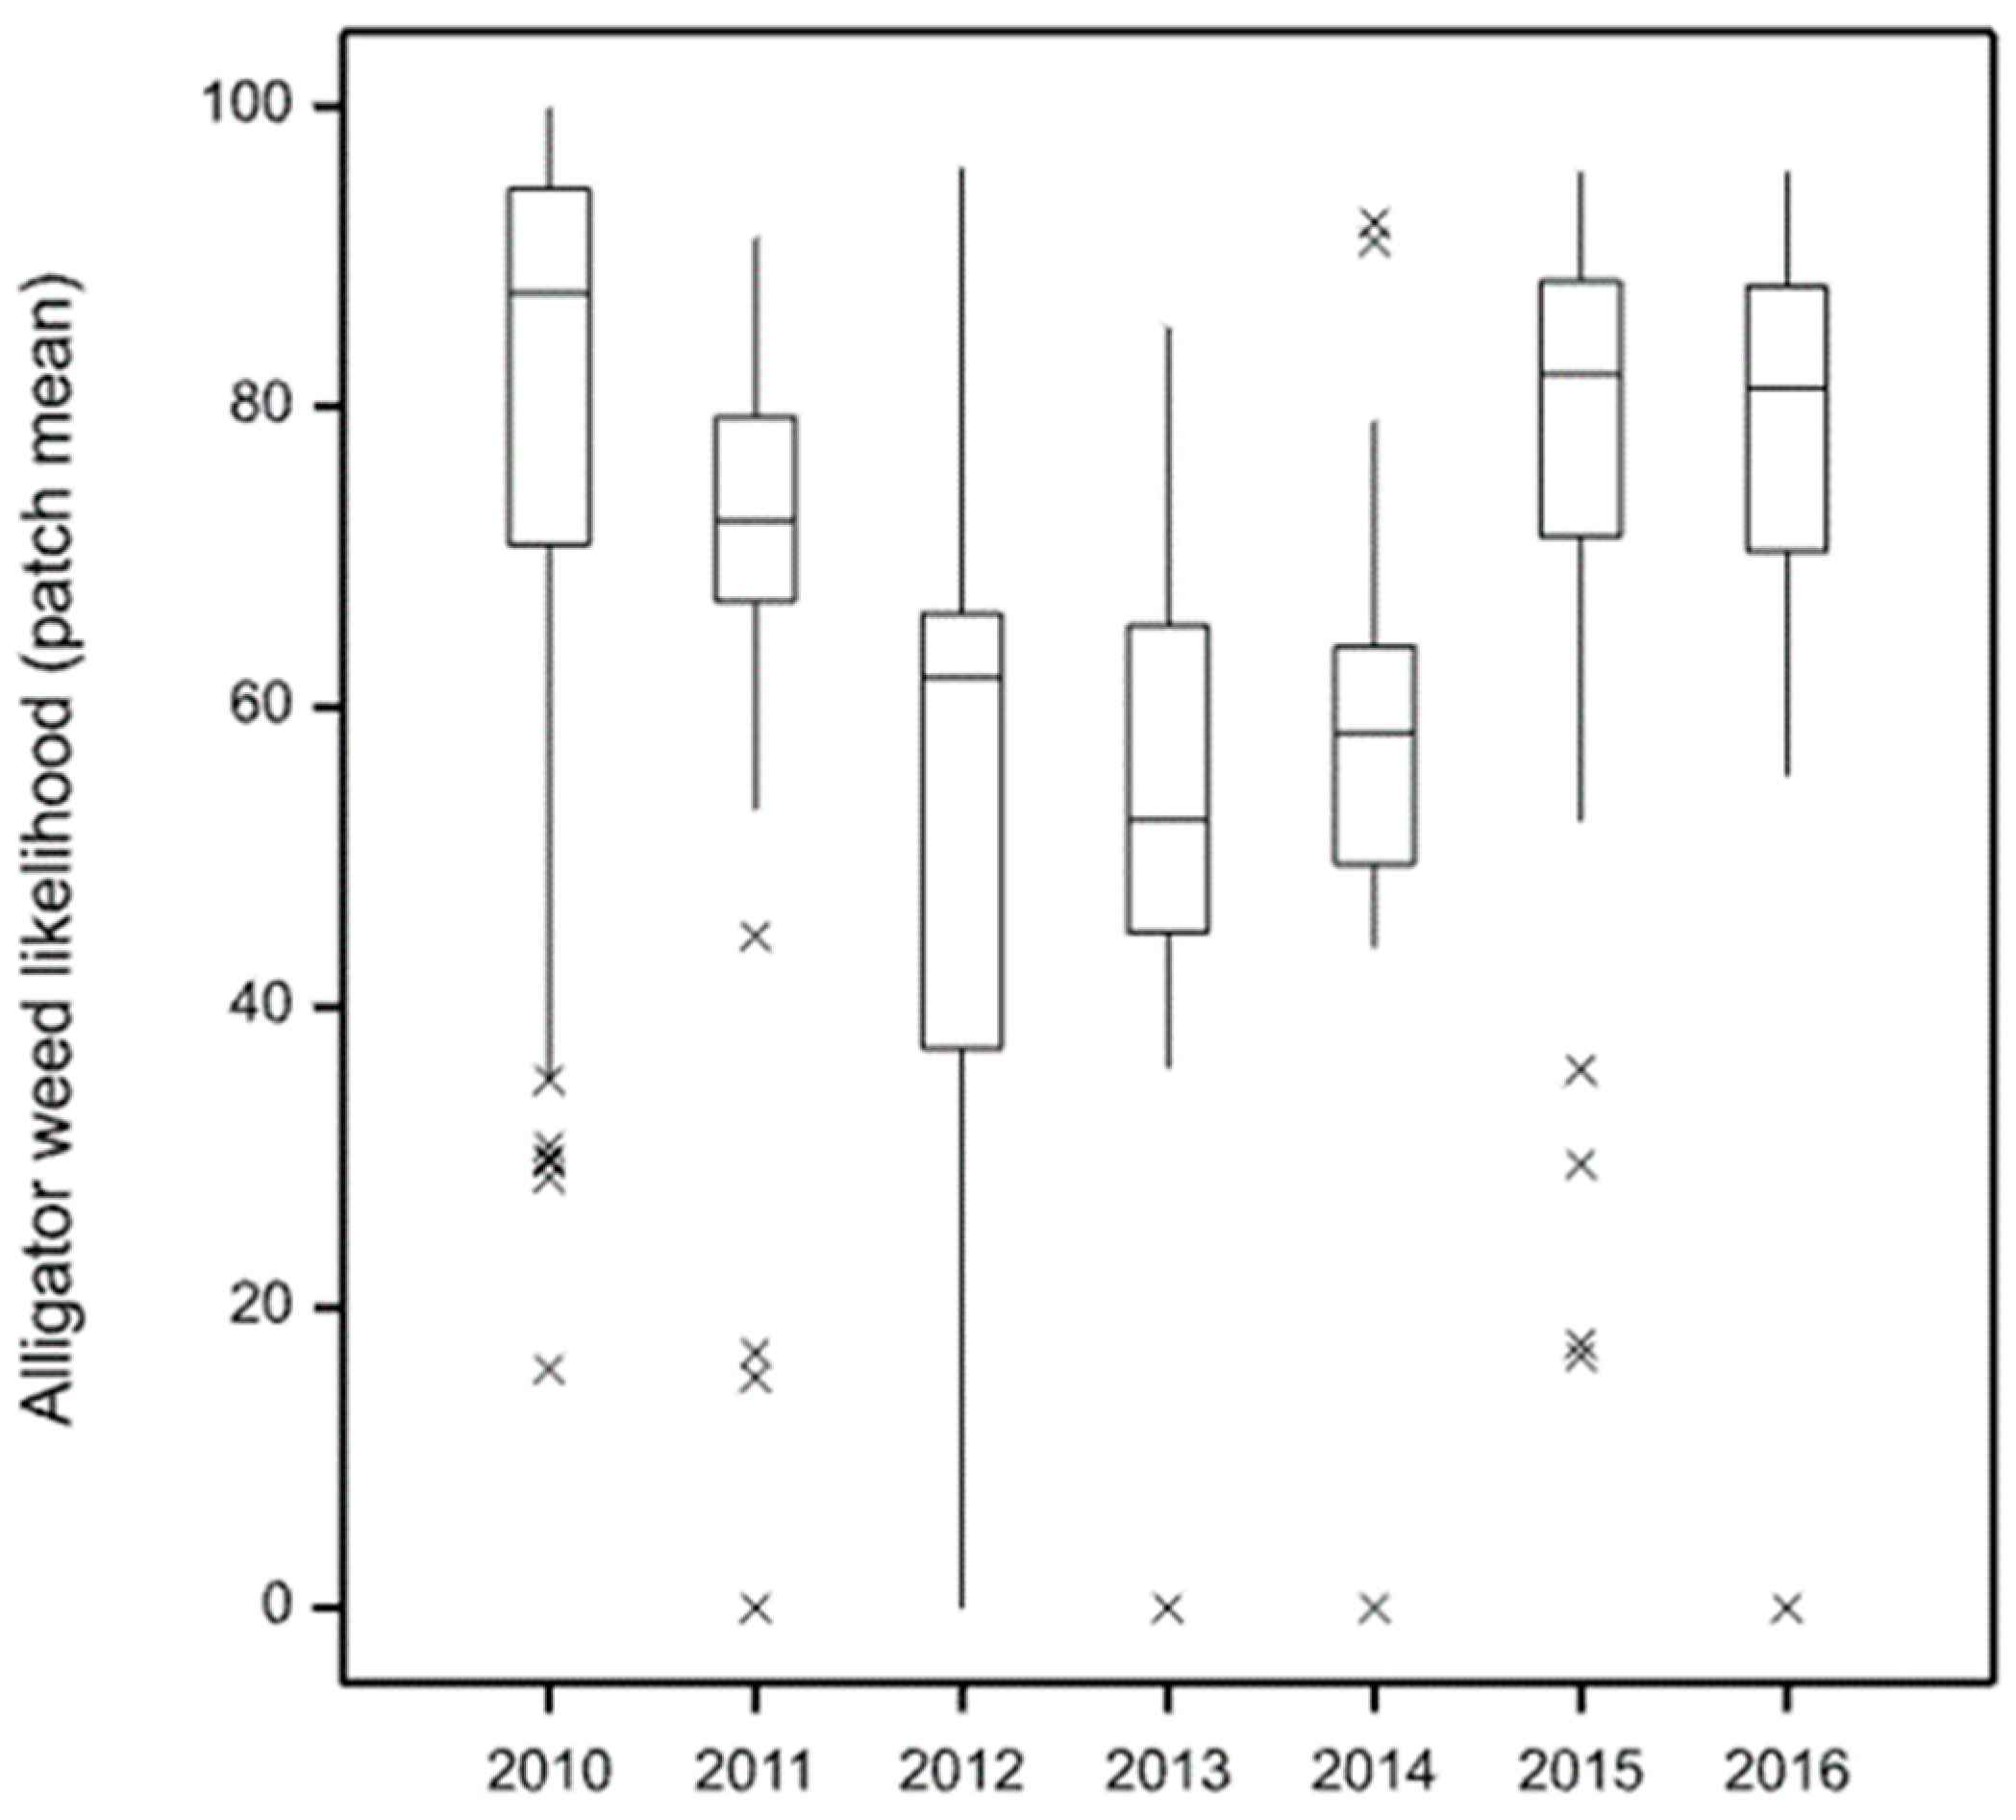
  • Produce repeatable results over a series of years (2010–2016), and
  • Be used to support monitoring operations at localised sites, as well as surveillance across landscapes.
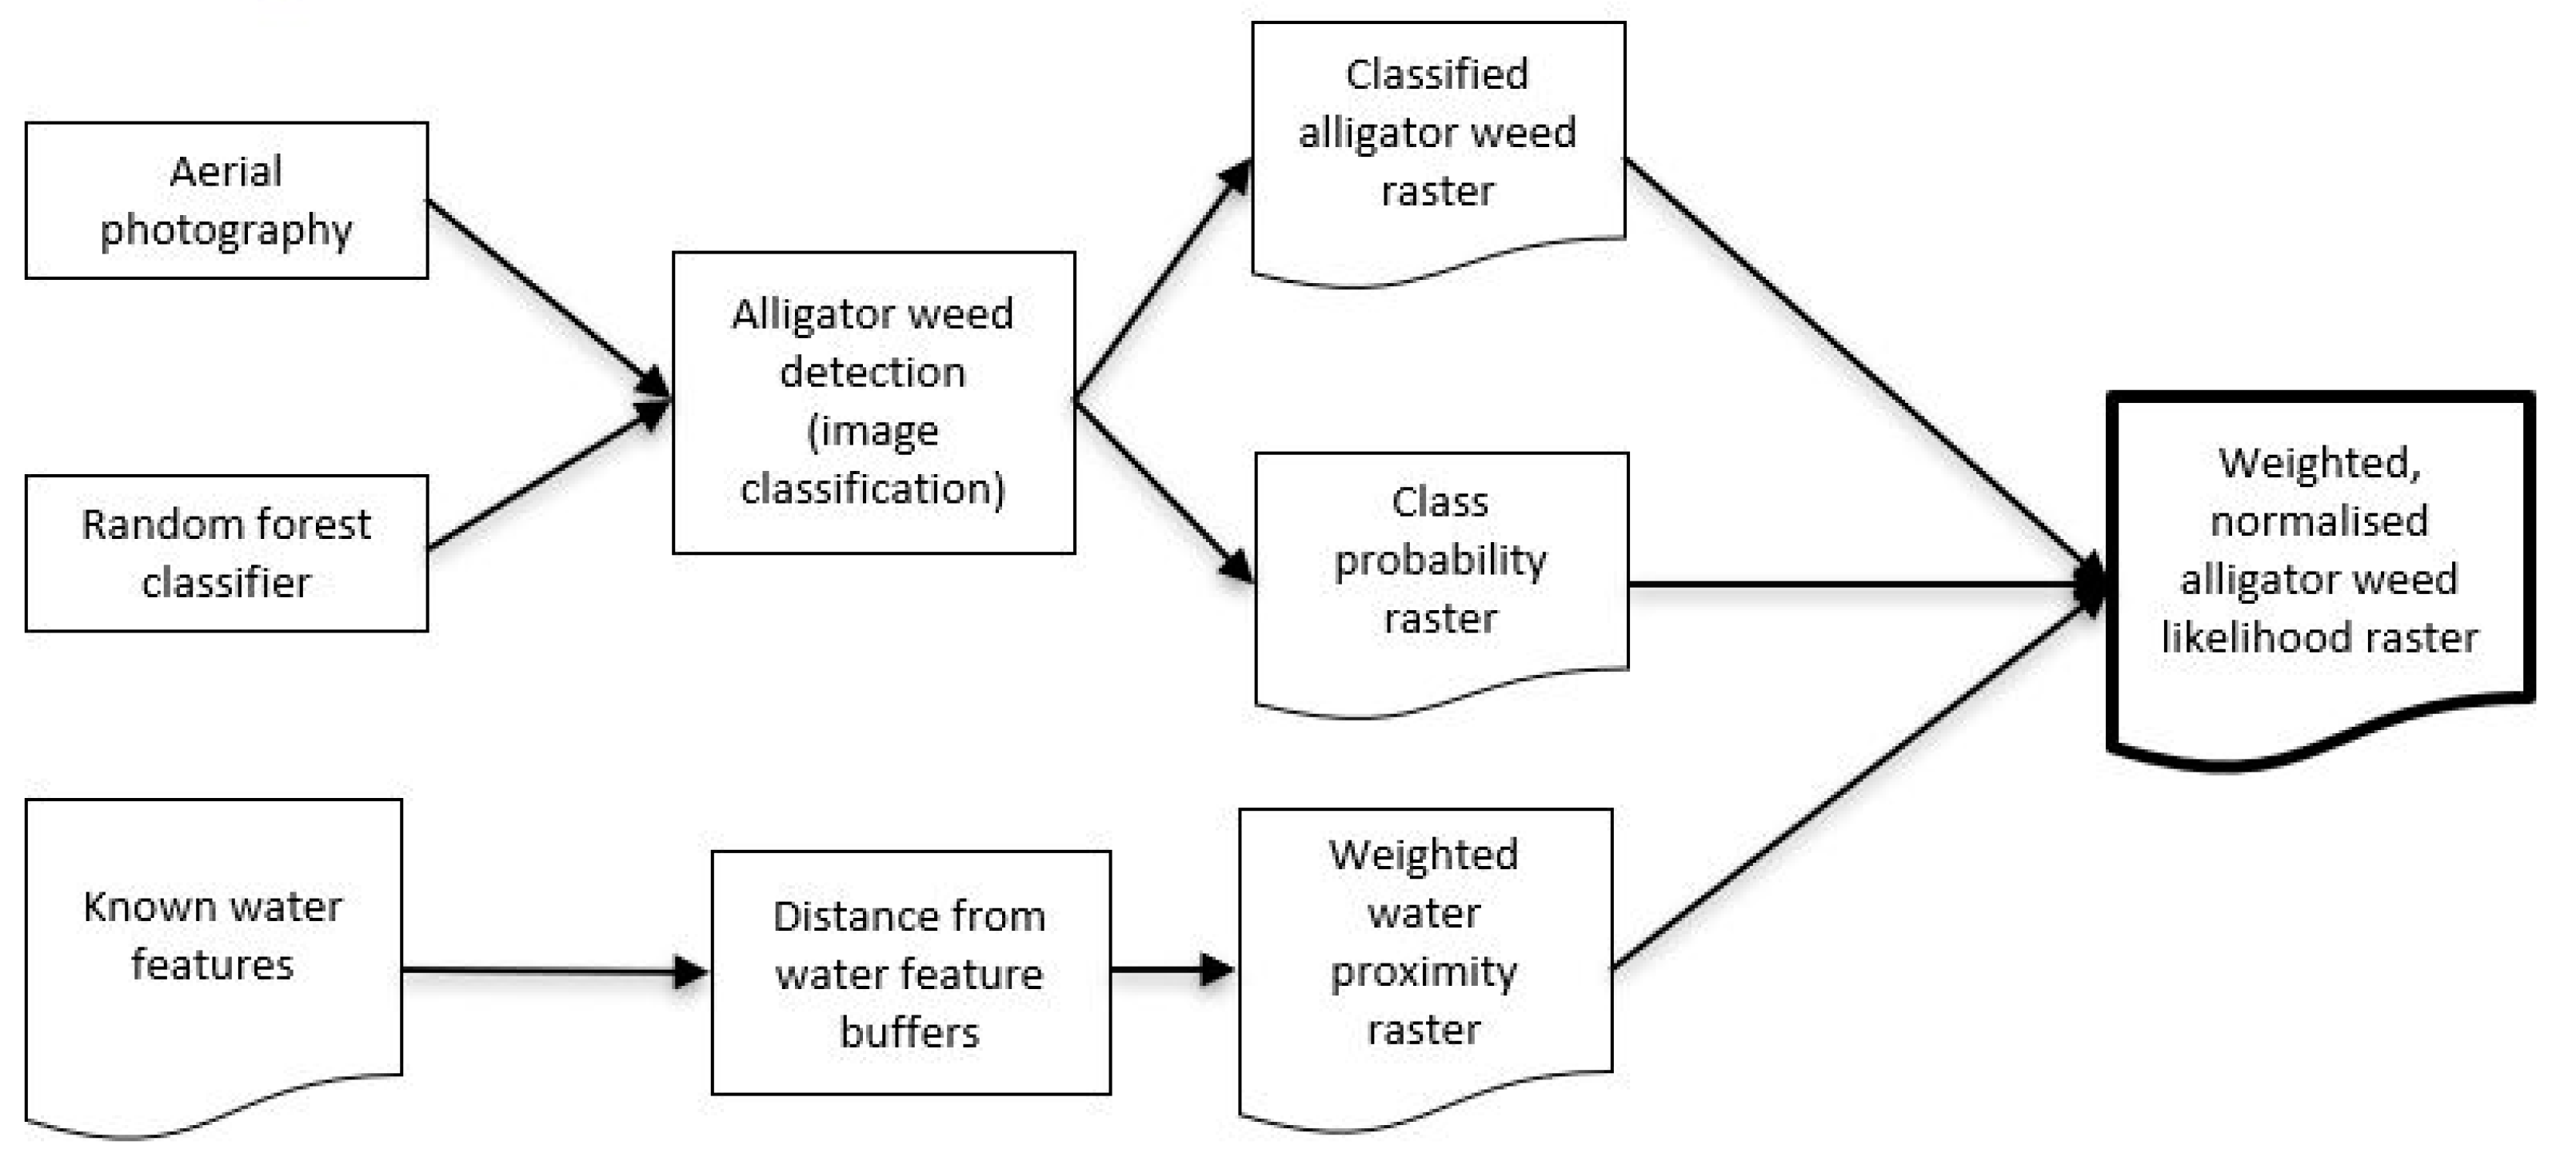
To achieve this, we explored the use of RF, combined with additional spatial data, for detecting aquatic alligator weed, as outlined below. While there are multiple classification approaches available, we used RF, as it is less sensitive to overfitting than some other approaches [36,37], is robust against training data mislabelling [36,37,38] and has been shown to support imbalanced training data classes [35,39,40], which are important considerations when dealing with a target species of limited abundance. The ability to examine underlying class probabilities, in addition to the nominated categorical class within the RF classification output, also proved beneficial for this study.

2. Materials and Methods

2.1. Study Area

The study area is located in eastern Melbourne, Victoria and covers approximately 26 km2 (Figure 1). It has a temperate climate (37–38°S). The study area is predominantly urban and urban-industrial land uses. The study area includes multiple waterways and waterbodies where alligator weed infestations have been present over the timeframe of this study (2010–2016).
Alligator weed has a significant impact on waterways throughout the world, including Melbourne, where it is considered to be a noxious weed in the highest category of concern. A study by Clements et al. [6] of a single waterbody between 2004 and 2009 within the study area highlighted the potential benefits of an automated RS classification to detect and subsequently remove alligator weed infestations, particularly if it was able to be used across the landscape. We chose this area because we have a high level of knowledge of the location and abundance of alligator weed patches within the area. This data has been collected multiple times per year since 2010 during ground inspections that occur to guide a program that aims to eradicate alligator weed from the state of Victoria. This data was available for us to use as training data for a RS classification (see Section 2.2.3). Further, AP was available for the entire area and timeframe, which we could use as the basis for a RS tool to detect alligator weed (see Section 2.2.1).

2.2. Data

2.2.1. Imagery

The study utilised AP, which is captured routinely across the study area using a fixed-wing aircraft [49]. The imagery was used to test the utility of existing sources of data already used by biosecurity staff in the study area, rather than introducing additional image sources at the outset. Red–Green–Blue (RGB) imagery was captured using a VisionMap A3 digital mapping camera system [50]. The airborne system includes dual CCDs with two 300 mm lenses, dual frequency GPS and a fast compression and image storage unit. A3 LightSpeed (VisionMap) ground processing system software was used to perform aerial triangulation bundle block adjustments, producing orthorectified photography with a horizontal accuracy of between 0.2 and 0.4 m.
AP captured between 2010 and 2016 was used in this study. The imagery was originally captured at spatial resolutions ranging from 10 to 35 cm. Prior to further analysis all AP was resampled to 30 cm using bilinear interpolation to ensure consistency between years. AP was captured at multiple times during the year. Where available, imagery acquired during summer months (December, January, February) was used as this corresponded with periods when alligator weed is actively growing. A summary of the AP used in this study is presented in Table 1.

2.2.2. Water Extent and Buffer Zones

As the focus of the study was detection of aquatic alligator weed in urban waterways, water features mapped in publicly available datasets were used to create an area of interest for the study [51]. Multiple buffers at distances of 2 m, 5 m, 10 m, 25 m and 50 m were created around these features within the study area (Figure 1). Areas beyond 50 m from a water feature were disregarded due to differences in the growth habit of alligator weed in terrestrial environments and the sparsity of terrestrial alligator weed (and consequent availability of image training data) in the study area. These water feature buffer zones were then weighted, with higher values given to areas closer to water features, as shown in Table 2.

2.2.3. Ground Data

The ground data used in this study were collected through a combination of ground-based surveys conducted over multiple years, and AP interpretation undertaken by biosecurity experts familiar with the study area. A database of known alligator weed locations held by Agriculture Victoria was used to guide the spatial delineation of alligator weed patches. Additional targeted ground surveys of waterbodies, both natural and constructed, undertaken between 2010 and 2014, were used to identify areas of alligator weed, as well as other riparian and aquatic vegetation such as various managed turf-grass species (e.g., ryegrass, bluegrass and kikuyu), common reed (Phragmites australis (Cav.) Trin. ex Steud.), slender knotweed (Persicaria decipens (R.Br.) K.L.Wilson), water couch (Paspalum distichum L.), clubrush (Bolboschoenus caldwellii (V.J.Cook) Sojak.), softstem bulrush (Schoenoplectus tabernaemontani (C.C.Gmel.) Palla) and various rush species (Juncus spp.) bordering or within water bodies. The number of alligator weed patches identified in the study area varied between years, as detailed in Table 3.

2.3. Image Processing

The approach taken consists of multiple steps, outlined in Figure 2. Two RF algorithms were trained based on data from 2010 and 2016. These classified images were combined with class probability and water proximity data to produce a weighted, normalised alligator weed likelihood data layer. The steps are outlined in further detail below. The spatial analysis was undertaken using ArcMap 10.6.1 [52] and QGIS 3.16 [53] mapping software. Development of the RF algorithms and image classification were completed using code written in Python 3.8, including the scikit-learn package [54,55].

2.3.1. Random Forest Classifier

Two RF classifiers were developed for this study, one using data from 2010 and one using data from 2016. This was implemented due to variations in image format within the AP time series. The selection of years used to train the classifiers was based on the available training data. An outline of the process and data used to train the RF classifiers is shown in Figure 3.
Calibration and validation data are critical components of image classification. These data were generated using a combination of on-ground mapping and AP interpretation as outlined above. Vector data was then converted to a raster format matching the extent and spatial resolution (30 cm) of the AP. Data were collated for both 2010 and 2016 (Table 4). Errors such as data mislabelling may be present in these datasets; however, RF is noted to be robust against such issues [36,37,38]. The final training datasets were imbalanced, reflective of the area proportions of the different classes in the study area. While this imbalance may impact the classification results, studies have shown RF can achieve better results when the class sizes are reflective of the area proportion [39,40]. Although the two years chosen were done so on the basis of the amount of alligator weed known in the study area, the relative rarity of alligator weed in the landscape does impact the amount of training data available. The training data was split into two random groups; 70% used for training the RF classifier and 30% used for validation.
The python scikit-learn module [54] was used to train the RF classifiers (sklearn.ensemble.RandomForestClassifier) and create the subsequent classifications. When training an RF classifier, there are a number of hyperparameters for which values can be set. Hyperparameter tuning is a process used to optimise these values. The randomised search CV function in the scikit-learn python module [56,57] was used to optimise the values for each of the following hyperparameters:
  • N_estimators: the number of decision trees in the final RF classifier,
  • Max_features: the maximum number of variables used to inform when a node is split,
  • Max_depth: the maximum depth of the tree,
  • Min_samples_split: the minimum number of data samples required to split an internal node, and
  • Min_samples_leaf: the minimum number of data samples required at a leaf (terminal) node.
The randomised search CV function (sklearn.model_selection.RandomizedSearchCV) takes a list of potential values for each hyperparameter nominated, then uses randomly selected combinations of these to fit a RF classifier and calculate the accuracy using that particular set of hyperparameter values [57]. This process is repeated, identifying the optimal combination of hyperparameter values to use in the final RF classifier through a cross-validation scoring process [57]. Additionally, the scikit-learn implementation of RF enabled the relative importance of each input variable (e.g., spectral band) to be evaluated during the classifier training process. The final RF classifier was saved for further use.
The pretrained RF classifier was then applied to imagery captured between 2010 and 2016 (Table 1). The 2010 RF classifier was used for images from 2010–2014 and the 2016 RF classifier was applied to imagery from 2015 to 2016. Two spatial outputs were generated for each image; the presence/absence of alligator weed (extracted from the four-class classification, Table 4) and the underlying probability associated with that classification.

2.3.2. Alligator Weed Likelihood Datasets

A weighted, normalised alligator weed likelihood dataset for each year was produced, as outlined in Figure 2 using the following data;
  • The presence or absence of alligator weed as determined by the RF classifier (classified alligator weed raster),
  • The underlying probability of a pixel’s class being alligator weed (class probability raster), and
  • Weighted buffer zones around water features (weighted water proximity raster; Section 2.2.2, Table 2).
The presence or absence of alligator weed was extracted from the four-class classification output from the RF classifier. The underlying probability of alligator weed was also saved as a separate output as part of the RF classification workflow. A graphical example of the process used to generate the alligator weed likelihood dataset is shown in Figure 4. This additional analysis was completed to reduce rates of false positive alligator weed detections and to produce spatial outputs which are useful for biosecurity programs to prioritise further surveillance work.

2.4. Accuracy Assessment and Evaluation Metrics

The performance of the RF classifiers were evaluated using multiple measures calculated through the scikit-learn package [54], including:
  • Precision, which is indicative of the rate of false positive classifications,
  • Recall, which is indicative of the rate of true positive classifications,
  • F1 score, which is the harmonic mean of the recall and precision metrics and is indicative of the algorithm’s overall ability to discriminate between classes, and
  • Overall accuracy, which is a simple metric of the percent of validation data correctly identified by the algorithm.
Raw confusion matrices are also included for each classifier. The metrics and associated confusion matrices were calculated using input data compiled for 2010 and 2016, with 30% of the data withheld as an independent validation dataset for each RF classifier (see Section 2.3.1).
As a separate validation process, the final output (the alligator weed likelihood dataset) from 2010 to 2016 was compared with known patches of alligator weed (Table 3) for the relevant year to quantify identification rates of known areas (true positive classifications). The mean likelihood score of each patch was calculated using zonal statistics and used as a complementary means of evaluation. These metrics evaluated the RF classifier and likelihood dataset on a larger dataset than those used to train and validate the RF classifier. Due to the historical nature of the AP and a lack of suitable ground data, a quantitative assessment of false positive classifications was not feasible. Qualitative observations regarding changes in alligator weed over time at specific locations are made where relevant.

3. Results

3.1. Random Forest Classifier Accuracy

Two RF classifiers were trained based on data from 2010 and 2016, respectively. The following reported accuracy metrics are pixel-based. Both classifiers had high levels of accuracy, with an overall accuracy of 96.8% in 2010 and 98.2% in 2016. The relative importance of each input variable (spectral band) was evaluated during the RF training process. While there were only a small number of variables, for the 2010 data, red reflectance was most important, while blue reflectance was the most important variable for the 2016 data.
Additional accuracy metrics are given for 2010 in Table 5 and for 2016 in Table 6. In all cases, precision and recall values were greater than 0.90, demonstrating low levels of misclassification between classes and high levels of certainty for correctly identifying a class when present. The F1-scores for all classes were also high.
Table 7 and Table 8 detail the confusion matrices produced for the 2010 and 2016 RF classifiers, respectively. These tables give a detailed assessment of pixels classified, using the validation dataset (30% of the full training dataset; Table 4).
As shown in Table 7 and Table 8, the predicted and true classes were strongly matched, with minimal confusion between classes. There were low rates of false positive identification of alligator weed, with approximately 2% and 5% of other vegetation validation data being misclassified as alligator weed in 2016 and 2010, respectively. There were no instances where water or other land surfaces were incorrectly identified as alligator weed. There were also low rates of false negative identification, with approximately 8% and 5% of alligator weed validation data being misclassified as either other vegetation, water or other land surfaces.
Alligator weed was discriminated from other aquatic and riparian plants growing within and around the waterbodies within the study area, with precision, recall and F1 scores for both classifiers > 0.91. Qualitative observations were also made at a number of sites. The vegetation within and around four of the wetlands used in the study (Figure 5, Figure 6 and Figure 7) consisted of a mixture of commonly occurring wetland species, including Persicaria decipiens, Paspalum distichum, Bolboschoenus caldwellii, Schoenoplectus tabernaemontani, Cycnogeton procerum (R.Br.) Buchenau, Eleocharis sphacelata R.Br. and E. acuta R.Br., while the vegetation beyond the aquatic zone consisted of various managed turf-grass species. Based on visual inspection of the final outputs and AP by people familiar with the areas, none of these common species were classified as patches of alligator weed. These qualitative observations are in accord with the low alligator weed false positive detection rates presented in the confusion matrices (Table 7 and Table 8). The pond shown in Figure 8 was surrounded by riparian trees, which were also discriminated effectively from alligator weed, along with irrigated turf which was classified with a low probability of being alligator weed for each year.

3.2. Alligator Weed Patch Detection (2010–2016)

To assess the broader multitemporal performance of the RF classifiers, known patches of alligator weed (Table 3) were compared to the alligator weed likelihood dataset for the corresponding year. This accuracy assessment was undertaken to characterise identification rates of known areas (true positive classifications) and to provide additional validation beyond the classifier accuracy assessment (Section 3.1).
The known patches of alligator weed ranged in size from <1 m2 to approximately 3900 m2. Patches smaller than 30 cm (the image spatial resolution) were excluded. The known patches also included alligator weed in varying states including growing on the water’s surface, partially or wholly submerged, or undergoing plant senescence. Patches were assessed as ‘detected’ where there was a positive identification from the alligator weed likelihood dataset within the mapped patch boundary.
Table 9 outlines patch detection rates for datasets from 2010 to 2016. Detection rates ranged from 76.5% to 100%.
Alligator weed typically appeared bright green and was represented in the alligator weed likelihood datasets as clusters of high likelihood image pixels, as illustrated in Figure 5 and Figure 6. The lowest patch detection rate was recorded in 2012. It is notable that the imagery used to produce the 2012 dataset was captured in October (spring), while the imagery used in other years, including to train the RF classifier, was captured in summer. Four patches were not identified from the 2012 dataset. None of these patches were visually characteristic of alligator weed, being very light in colour compared with other alligator weed which appeared bright green. Five of the seven patches not identified in the 2016 dataset were noted as being partially or wholly submerged at the time of image capture.
The alligator weed likelihood datasets not only provide indicative presence or absence of alligator weed, but an associated likelihood of that indication being correct. The datasets are weighted and normalised, with values ranging from zero (absent) to 100. Figure 9 shows the range of mean alligator weed likelihood value for each mapped patch of alligator weed between 2010 and 2016. In total, 452 alligator weed patches were assessed. The mean patch likelihood values are skewed towards higher values. A total of 51.6% of alligator weed patches had a mean likelihood score above 75, and 74.8% of alligator weed patches had a mean likelihood score above 60. Only 14.8% of alligator weed patches had a mean likelihood score less than 50, including 24 patches (5.3%) which scored zero. The median size of alligator weed patches which were undetected was 3 m2. Of the patches which were not identified by the algorithm, 62% were less than 4 m2 and 20% were less than 1 m2.
Application of the RF classifier to multiple years of imagery can be used to monitor sites of interest. The patch detection rates achieved between years (Table 9) supports a degree of confidence in this use of the data. Figure 8 tracks changes in alligator weed across a waterbody within the study area from 2010 to 2016. A large area of alligator weed was identified and mapped at the site in 2010. Herbicide spraying was undertaken to remove alligator weed after 2010, the impact of this is evident in 2013 and 2016, by which time the alligator weed infestation has been largely controlled. There is a small area of treated and dying alligator weed present in 2016 at the southern end of the waterbody. This was not identified as alligator weed by the RF classifier and associated likelihood dataset. Figure 7 is another demonstration of site monitoring for alligator weed during the initial infestation (Figure 7a, 2010), peak growth (Figure 7b, 2011) and after a removal program, including herbicide spraying, resulting in the eradication of alligator weed at the site (Figure 7c, 2016).

4. Discussion

This study aimed to develop an approach, utilising regularly acquired AP (RGB), to support existing biosecurity management and eradication programs for alligator weed. To facilitate this, the WASP conceptual framework proposed in Sheffield and Dugdale [32] was used to identify strategies and guide development of spatial outputs. The framework provided the basis for identifying key features of interest and evaluating the strengths and weaknesses of particular approaches. It also served as an effective communication tool across a multi-disciplinary team.
Machine learning techniques, including RF, are popular approaches for classifying remotely sensed imagery. RF utilises a large number of decision trees and are consequently less prone to overfitting than some other approaches [36]. RF classifiers are also less sensitive to the quality of training data used. There are many examples of using an RF approach to classify remotely sensed imagery, including to identify target weed species. To detect alligator weed from AP, two RF classifiers were trained. Both had high levels of accuracy, with an overall accuracy of 96.8% in 2010 and 98.2% in 2016, demonstrating the successful use of AP with a fine spatial resolution (30 cm) to identify aquatic alligator weed within an urban landscape. While no comparable studies have been published using an RF classifier to detect alligator weed, there are several examples where this approach has been used to identify water hyacinth from remotely sensed imagery, another aquatic weed species. Mukarugwiro et al. [28] and Akbari et al. [33] reported kappa values of 0.86 and 0.81, respectively. Singh et al. [29] also used an RF approach in their multistage approach to water hyacinth identification, achieving an F1 score of 0.87 and an overall accuracy of 0.93. These are comparable to the results achieved in this study, although marginally lower. Differences in target species and input imagery used (Sentinel-2 and Landsat 8 compared with the AP used in this study) may explain these differences.
A core aim of this study was to produce results of similar accuracy over a series of years. This was tested by applying the pretrained RF classifiers to imagery from 2010 to 2016, with additional spatial analytics used to produce alligator weed likelihood datasets for each year. Detection rates for known, mapped patches of alligator weed were then calculated. There was a consistently high rate of patch detection for the seven years of data. High rates of detection (true positive classifications) are an important prerequisite for weed management programs as the cost, in terms of potential damage, spread and removal, increases when the weed is not detected [16]. While our approach did identify known smaller patches (<1 m2), this was not consistent. The median size of known patches which were not detected was 3 m2. This is a similar threshold to the study published by Clements et al. [42], who found patches < 2.5 m2 were not detected by an automatic image classification algorithm. While both studies used RGB imagery, a key point of difference is the spatial resolution of the imagery: 30 cm AP in this study compared with <1 cm UAV imagery. The similarity in patch detection thresholds suggests that further research into the use of additional spectral and temporal features, rather than a focus on spatial resolution, may be critical to improving detection of smaller patches which would be highly beneficial for management and eradication programs.
The results also demonstrate that the pretrained RF classifiers are robust and able to be applied to imagery without additional training data. The implications for using this type of approach in a biosecurity program is that it can be used without previous field knowledge, with the spatial outputs able to act as a priori information instead. The use of RF classifiers between years is also an important consideration as the amount of alligator weed in the landscape decreases due to eradication programs, meaning sufficient data for training and validation of additional RF classifiers may not always be accessible. For image classification, an important consideration is the timing of image acquisition relative to collating training data when the target species is subject to an active weed removal program, as there is often a short window between identification of the weed and treatment or removal. Image acquisition timing also influences species discrimination, particularly regarding species phenological characteristics, and is important to consider for biosecurity applications with regards to currency of data and timing of subsequent responses to assist early detection and eradication [31,58].
The potential contribution of RS to invasive plant management has been widely acknowledged. Shaw [47] discussed the benefits of utilising RS in invasive plant management, using RS to guide more cost-effective and targeted field surveys. Spring et al. [48] demonstrated that, while imagery had a lower sensitivity than field surveys, it was beneficial to use lower cost imagery to monitor large areas and integrate these data with higher cost approaches such as field surveys and treatments. This current approach was developed as a demonstration of how RS can be utilised to support monitoring and surveillance at local sites, as well as search and identification efforts across landscapes using existing and regularly collected image datasets.
Site monitoring is an important component of alligator weed management as re-establishment is a risk, in addition to localised spread of alligator weed. Alligator weed can re-establish from roots, and can form new infestations from stem and root fragments, which are robust against damage [4,59]. Figure 7 and Figure 8 provide visual examples of site monitoring applications, providing evidence of management outcomes in localised areas. The datasets derived from AP displayed in these figures are derived from not only the RF classification of alligator weed presence or absence, but also take into account the probability of alligator weed being present and proximity to water. The figures show how the datasets can track alligator weed, and the likelihood of alligator weed being present, through time.
The alligator weed likelihood datasets were developed to provide additional information, complementary to a RS categorical classification, and reduce false positive identification of alligator weed. Integrating the proximity to water raster achieved this by removing areas >50 m from waterways and progressively down weighting likelihood scores up to 50 m from waterways (Table 2). In a weed eradication context, the cost of not identifying alligator weed at a site is higher than falsely identifying it, and the tolerance of false positive identification of alligator weed closer to an aquatic environment is higher because of this consideration. Therefore, areas of lower likelihood close to water bodies are still included in the datasets.
Further work is required to determine the specificity of species identification compared to other aquatic vegetation and mapping aquatic vegetation communities in greater detail. In our study area the RF classifier was able to discriminate alligator weed from coexisting aquatic vegetation belonging to a range of taxa that occur widely in wetland environments. We therefore expect that the RF classifier will be functional in other jurisdictions where similar RGB imagery is available, although additional classifier training will be required where local species have a similar spectral signature to alligator weed. The inclusion of additional spectral information (such as near-infrared), textural features or multitemporal analytics may improve the robustness of the classification and discrimination between different vegetation species.
The RF classifier is now being developed into a surveillance tool which can be used operationally by weed managers at a larger spatial scale than the study area tested here. The datasets can be used as a strategic management tool embedded within existing management programs, with decisions made based on the range of information available to guide and prioritise field surveys. This management tool could be adapted and developed for other high-risk aquatic weeds targeted for eradication, including water hyacinth (Eichhornia crassipes) and salvinia (Salvinia molesta).

5. Conclusions

This study demonstrated the effectiveness of using routinely captured RGB AP to detect potential alligator weed infestations within urban waterways. Two RF classifiers were developed with high levels of accuracy; one for imagery collected in 2010 with an overall accuracy of 96.8% and one for imagery collected in 2016 with an overall accuracy of 98.2%. Both RF classifiers were able to discriminate alligator weed effectively from other classes (F1 scores of >0.92). Qualitative observations in a broader landscape context also showed the approach was able to distinguish between alligator weed and other common wetland species such as slender knotweed (Persicaria decipiens), water couch (Paspalum distichum) and softstem bulrush (Schoenoplectus tabernaemontani). This study helps establish the use of RF to support RS classification as an expanding area of research.
The second aim of the study was to produce repeatable results over a series of years. The trained RF classifiers were applied to imagery acquired between 2010 and 2016, with additional spatial analytics used to produce annual alligator weed likelihood datasets for a study area in eastern Melbourne, Victoria, Australia. These datasets were used to assess rates of detection for known and mapped alligator weed patches, with very high (>86%) detection rates for all years except 2012 where the detection rate was 76.5%. Alligator weed was typically represented in the likelihood datasets as clusters of high likelihood image pixels. While patch detection was less consistent when patch size was <3 m2, the outputs did detect some small areas of alligator weed (<1 m2). Further research into the use of additional spectral and temporal features, to improve detection of smaller patches, would be highly beneficial for weed management and eradication programs.
The final, and key, outcome of this study was a demonstration of how RS could be used to support existing biosecurity monitoring and surveillance efforts at localised sites and across larger landscapes. This approach could be developed within a strategic management tool, which, when incorporated with other sources of information such as field surveys, will optimise the cost-effectiveness and outcomes of weed management programs.

Author Contributions

Conceptualisation, K.J.S., T.M.D. and D.C.; methodology, K.J.S. and T.M.D.; field data, T.M.D., D.C., D.J.C. and A.C.; validation, K.J.S., T.M.D., D.J.C. and A.C.; formal analysis, K.J.S.; writing—original draft preparation, K.J.S. and T.M.D.; writing—review and editing, K.J.S., T.M.D., D.C., D.J.C. and A.C. All authors have read and agreed to the published version of the manuscript.

Funding

This research was funded by Agriculture Victoria, Victorian Department of Jobs, Precincts and Regions.

Data Availability Statement

The data presented in this study are available on request from the corresponding author. Restrictions apply to the availability and use of some of these data.

Acknowledgments

We would like to thank Nigel Ainsworth and Mark Watt (Biosecurity and Agricultural Services, Agriculture Victoria) for their informative insights into alligator weed management and biosecurity programs in Victoria, Australia. We would also like to acknowledge and thank the reviewers, whose comments and feedback improved this manuscript.

Conflicts of Interest

The authors declare no conflict of interest.

References

  1. Baider, C.; Florens, F.V. Control of invasive alien weeds averts imminent plant extinction. Biol. Invasions 2011, 13, 2641–2646. [Google Scholar] [CrossRef]
  2. Llewellyn, R.S.; Ronning, D.; Ouzman, J.; Walker, S.; Mayfield, A.; Clarke, M. Impact of Weeds on Australian Grain Production: The Cost of Weeds to Australian Grain Growers and the Adoption of Weed Management and Tillage Practices; Report for GRDC; CSIRO: Canberra, ACT, Australia, 2016. [Google Scholar]
  3. European Plant Protection Organisation. Alternanthera philoxeroides (Mart.) Griseb. EPPO Bull. 2016, 46, 8–13. [Google Scholar] [CrossRef]
  4. van Oosterhout, E. Alligator Weed Control Manual: Eradication and Suppresion of Alligator Weed (Alternanthera philoxeroides) in Australia; NSW Department of Primary Industries: Orange, Australia, 2007.
  5. Dugdale, T.M.; Clements, D.; Hunt, T.; Butler, K. Alligatorweed produces viable stem fragments in response to herbicide treatment. J. Aquat. Plant Manag. (JAPM) 2010, 48, 84. [Google Scholar]
  6. Clements, D.; Dugdale, T.M.; Hunt, T.D. Growth of aquatic alligator weed (Alternanthera philoxeroides) over 5 years in south-east Australia. Aquat. Invasions 2011, 6, 77–82. [Google Scholar] [CrossRef]
  7. Julien, M. Alternanthera philoxeroides (Mart.) Grisb. In The Biology of Australian Weeds Volume 1; Groves, R., Shepard, R., Richardson, R., Eds.; R.G. and F.J. Richardson: Frankston, Australia, 1995; pp. 1–12. [Google Scholar]
  8. Sainty, G.; McCorkelle, G.; Julien, M. Control and spread of Alligator Weed Alternanthera philoxeroides (Mart.) Griseb, in Australia: Lessons for other regions. Wetl. Ecol. Manag. 1998, 5, 195–201. [Google Scholar] [CrossRef]
  9. McKirdy, S.J.; Sharma, S.B.; Bayliss, K.L. Quarantine and Biosecurity; Academic Press: Cambridge, MA, USA, 2014. [Google Scholar]
  10. Blood, K.; James, R.; Panetta, D.F.; Sheehan, M.; Adair, R.; Gold, B. Early Invader Manual: Managing Early Invader Environmental Weeds in Victoria; Department of Environment, Land, Water and Planning: Melbourne, VIC, Australia, 2019. [Google Scholar]
  11. Hulme, P.E. Plant invasions in New Zealand: Global lessons in prevention, eradication and control. Biol. Invasions 2020, 22, 1539–1562. [Google Scholar] [CrossRef] [Green Version]
  12. European Union. Invasive Alien Species of Union Concern; Publications Office of the European Union: Luxembourg, 2017.
  13. USDA. Animal and Plant Health Inspection Service: Noxious Weeds Program. Available online: https://www.aphis.usda.gov/aphis/ourfocus/planthealth/plant-pest-and-disease-programs/pests-and-diseases/sa_weeds/sa_noxious_weeds_program/ct_noxious_weeds_program_home (accessed on 21 May 2020).
  14. Dodd, A.J.; Ainsworth, N.; Burgman, M.A.; McCarthy, M.A. Plant extirpation at the site scale: Implications for eradication programmes. Divers. Distrib. 2015, 21, 151–162. [Google Scholar] [CrossRef]
  15. Thomas, M.L.; Gunawardene, N.; Horton, K.; Williams, A.; O’Connor, S.; McKirdy, S.J.; van der Merwe, J. Many eyes on the ground: Citizen science is an effective early detection tool for biosecurity. Biol. Invasions 2017, 19, 2751–2765. [Google Scholar] [CrossRef]
  16. Panetta, F.D. Weed eradication—An economic perspective. Invasive Plant Sci. Manag. 2009, 2, 360–368. [Google Scholar] [CrossRef]
  17. Thorp, K.; Tian, L. A review on remote sensing of weeds in agriculture. Precis. Agric. 2004, 5, 477–508. [Google Scholar] [CrossRef]
  18. Fernández-Quintanilla, C.; Peña, J.M.; Andújar, D.; Dorado, J.; Ribeiro, A.; López-Granados, F. Is the current state of the art of weed monitoring suitable for site-specific weed management in arable crops? Weed Res. 2018, 58, 259–272. [Google Scholar] [CrossRef]
  19. Asha, K.; Mahore, A.; Malkani, P.; Singh, A.K. Robotics-automation and sensor-based approaches in weed detection and control: A review. Intern. J. Chem. Stud. 2020, 8, 542–550. [Google Scholar]
  20. Bertacchi, A.; Giannini, V.; Di Franco, C.; Silvestri, N. Using unmanned aerial vehicles for vegetation mapping and identification of botanical species in wetlands. Landsc. Ecol. Eng. 2019, 15, 231–240. [Google Scholar] [CrossRef]
  21. Brinkhoff, J.; Hornbuckle, J.; Barton, J.L. Assessment of Aquatic Weed in Irrigation Channels Using UAV and Satellite Imagery. Water 2018, 10, 1497. [Google Scholar] [CrossRef] [Green Version]
  22. Cavalli, R.M.; Laneve, G.; Fusilli, L.; Pignatti, S.; Santini, F. Remote sensing water observation for supporting Lake Victoria weed management. J. Environ. Manag. 2009, 90, 2199–2211. [Google Scholar] [CrossRef]
  23. Artigas, F.; Pechmann, I.C. Balloon imagery verification of remotely sensed Phragmites australis expansion in an urban estuary of New Jersey, USA. Landsc. Urban Plan. 2010, 95, 105–112. [Google Scholar] [CrossRef]
  24. Xie, Y.; Zhang, A.; Welsh, W. Mapping Wetlands and Phragmites Using Publically Available Remotely Sensed Images. Photogramm. Eng. Remote Sens. 2015, 81, 69–78. [Google Scholar] [CrossRef]
  25. Abeysinghe, T.; Simic Milas, A.; Arend, K.; Hohman, B.; Reil, P.; Gregory, A.; Vázquez-Ortega, A. Mapping invasive Phragmites australis in the old woman creek estuary using UAV remote sensing and machine learning classifiers. Remote Sens. 2019, 11, 1380. [Google Scholar] [CrossRef] [Green Version]
  26. Khanna, S.; Santos, M.J.; Hestir, E.L.; Ustin, S.L. Plant community dynamics relative to the changing distribution of a highly invasive species, Eichhornia crassipes: A remote sensing perspective. Biol. Invasions 2012, 14, 717–733. [Google Scholar] [CrossRef]
  27. Hung, C.; Xu, Z.; Sukkarieh, S. Feature Learning Based Approach for Weed Classification Using High Resolution Aerial Images from a Digital Camera Mounted on a UAV. Remote Sens. 2014, 6, 12037–12054. [Google Scholar] [CrossRef] [Green Version]
  28. Mukarugwiro, J.; Newete, S.; Adam, E.; Nsanganwimana, F.; Abutaleb, K.; Byrne, M. Mapping distribution of water hyacinth (Eichhornia crassipes) in Rwanda using multispectral remote sensing imagery. Afr. J. Aquat. Sci. 2019, 44, 339–348. [Google Scholar] [CrossRef]
  29. Singh, G.; Reynolds, C.; Byrne, M.; Rosman, B. A Remote Sensing Method to Monitor Water, Aquatic Vegetation, and Invasive Water Hyacinth at National Extents. Remote Sens. 2020, 12, 4021. [Google Scholar] [CrossRef]
  30. Everitt, J.H.; Fletcher, R.S.; Elder, H.S.; Yang, C. Mapping giant salvinia with satellite imagery and image analysis. Environ. Monit. Assess. 2008, 139, 35–40. [Google Scholar] [CrossRef] [PubMed]
  31. Bradley, B.A. Remote detection of invasive plants: A review of spectral, textural and phenological approaches. Biol. Invasions 2014, 16, 1411–1425. [Google Scholar] [CrossRef]
  32. Sheffield, K.; Dugdale, T. Supporting Urban Weed Biosecurity Programs with Remote Sensing. Remote Sens. 2020, 12, 2007. [Google Scholar] [CrossRef]
  33. Akbari, V.; Simpson, M.; Maharaj, S.; Marino, A.; Bhowmik, D.; Prabhu, G.N.; Rupavatharam, S.; Datta, A.; Kleczkowski, A.; Sujeetha, J.A.R. Monitoring Aquatic Weeds In Indian Wetlands Using Multitemporal Remote Sensing Data With Machine Learning Techniques. In Proceedings of the 2021 IEEE International Geoscience and Remote Sensing Symposium IGARSS, Brussels, Belgium, 11–16 July 2021; pp. 6847–6850. [Google Scholar]
  34. Wang, A.; Zhang, W.; Wei, X. A review on weed detection using ground-based machine vision and image processing techniques. Comput. Electron. Agric. 2019, 158, 226–240. [Google Scholar] [CrossRef]
  35. Pal, M. Random forest classifier for remote sensing classification. Int. J. Remote Sens. 2005, 26, 217–222. [Google Scholar] [CrossRef]
  36. Belgiu, M.; Drăguţ, L. Random forest in remote sensing: A review of applications and future directions. ISPRS J. Photogramm. Remote Sens. 2016, 114, 24–31. [Google Scholar] [CrossRef]
  37. Breiman, L. Random Forests. Mach. Learn. 2001, 45, 5–32. [Google Scholar] [CrossRef] [Green Version]
  38. Mellor, A.; Boukir, S.; Haywood, A.; Jones, S. Exploring issues of training data imbalance and mislabelling on random forest performance for large area land cover classification using the ensemble margin. ISPRS J. Photogramm. Remote Sens. 2015, 105, 155–168. [Google Scholar] [CrossRef]
  39. Colditz, R.R. An evaluation of different training sample allocation schemes for discrete and continuous land cover classification using decision tree-based algorithms. Remote Sens. 2015, 7, 9655–9681. [Google Scholar] [CrossRef] [Green Version]
  40. Millard, K.; Richardson, M. On the importance of training data sample selection in random forest image classification: A case study in peatland ecosystem mapping. Remote Sens. 2015, 7, 8489–8515. [Google Scholar] [CrossRef] [Green Version]
  41. Göktoǧan, A.H.; Sukkarieh, S.; Bryson, M.; Randle, J.; Lupton, T.; Hung, C. A Rotary-wing Unmanned Air Vehicle for Aquatic Weed Surveillance and Management. J. Intell. Robot. Syst. 2009, 57, 467. [Google Scholar] [CrossRef]
  42. Clements, D.; Dugdale, T.; Hunt, T.; Fitch, R.; Hung, C.; Sukkarieh, S.; Xu, Z. Detection of alligator weed using an unmanned aerial vehicle. Plant Prot. Q. 2014, 29, 84–89. [Google Scholar]
  43. Lawes, R.A.; Wallace, J.F. Monitoring an invasive perennial at the landscape scale with remote sensing. Ecol. Manag. Restor. 2008, 9, 53–59. [Google Scholar] [CrossRef]
  44. Müllerová, J.; Pergl, J.; Pyšek, P. Remote sensing as a tool for monitoring plant invasions: Testing the effects of data resolution and image classification approach on the detection of a model plant species Heracleum mantegazzianum (giant hogweed). Int. J. Appl. Earth Obs. Geoinf. 2013, 25, 55–65. [Google Scholar] [CrossRef]
  45. Bubenheim, D.; Genovese, V.; Madsen, J.D.; Hard, E. Remote sensing and mapping of floating aquatic vegetation in the Sacramento–San Joaquin River Delta. J. Aquat. Plant Manag. 2021, 59, 46–54. [Google Scholar]
  46. Rodgers, L.; Pernas, T.; Redwine, J.; Shamblin, B.; Bruscia, S. Multiscale Invasive Plant Monitoring: Experiences from the Greater Everglades Restoration Area. Weed Technol. 2017, 32, 11–19. [Google Scholar] [CrossRef]
  47. Shaw, D.R. Translation of remote sensing data into weed management decisions. Weed Sci. 2005, 53, 264–273. [Google Scholar] [CrossRef]
  48. Spring, D.; Croft, L.; Kompas, T. Look before you treat: Increasing the cost effectiveness of eradication programs with aerial surveillance. Biol. Invasions 2017, 19, 521–535. [Google Scholar] [CrossRef]
  49. Department of Environment Land Water and Planning. Coordinated Imagery Program. Available online: https://www2.delwp.vic.gov.au/maps/maps-and-services/coordinated-imagery-program (accessed on 21 May 2020).
  50. Pechatnikov, M.; Shor, E.; Raizman, Y. VisionMap A3-super wide angle mapping system basic principles and workflow. In Proceedings of the 21st ISPRS Congress, Beijing, Oral Technical Session Commission IV SS-8 (2), Beijing, China, 3–11 July 2008; p. 200. Available online: https://www.isprs.org/proceedings/XXXVII/congress/4_pdf/302.pdf (accessed on 25 May 2022).
  51. Department of Environment Land Water and Planning. Vicmap Hydro 1:25,000. 2021. Available online: https://discover.data.vic.gov.au/dataset/vicmap-hydro-1-25000 (accessed on 22 February 2022).
  52. ESRI. ArcGIS Desktop 10.6.1; Environmental Systems Research Institute: Redlands, CA, USA, 2018. [Google Scholar]
  53. QGIS.org. QGIS Geographic Information System (v 3.16); QGIS Association. 2021. Available online: http://qgis.org (accessed on 22 February 2022).
  54. Pedregosa, F.; Varoquaux, G.; Gramfort, A.; Michel, V.; Thirion, B.; Grisel, O.; Blondel, M.; Prettenhofer, P.; Weiss, R.; Dubourg, V.; et al. Scitkit-learn: Machine Learning in Python. J. Mach. Learn. 2011, 12, 2825–2830. Available online: https://scikit-learn.org/stable/index.html (accessed on 21 May 2020).
  55. Scikit-Learn Developers. Scikit-Learn. Machine Learning in Python. Available online: https://scikit-learn.org/stable/ (accessed on 20 May 2021).
  56. Bergstra, J.; Bengio, Y. Random search for hyper-parameter optimization. J. Mach. Learn. Res. 2012, 13, 281–305. [Google Scholar]
  57. Scikit-Learn Developers. 3.2 Tuning the Hyper-Parameters of an Estimator: 3.2.2 Randomized Parameter Optimization. Available online: https://scikit-learn.org/stable/modules/grid_search.html#randomized-parameter-search (accessed on 20 November 2021).
  58. Müllerová, J.; Brůna, J.; Bartaloš, T.; Dvořák, P.; Vítková, M.; Pyšek, P. Timing is important: Unmanned aircraft vs. satellite imagery in plant invasion monitoring. Front. Plant Sci. 2017, 8, 887. [Google Scholar] [CrossRef] [Green Version]
  59. Clements, D.; Dugdale, T.M.; Butler, K.L.; Hunt, T.D. Management of aquatic alligator weed (Alternanthera philoxeroides) in an early stage of invasion. Manag. Biol. Invasions 2014, 5, 327. [Google Scholar] [CrossRef] [Green Version]
Figure 1. Study area located in eastern Melbourne (37–38°S), Victoria, Australia.
Remotesensing 14 02674 g001
Figure 2. Overview of the alligator weed aerial remote sensing detection classification workflow.
Remotesensing 14 02674 g002
Figure 3. Overview of the random forest classifier training workflow.
Remotesensing 14 02674 g003
Figure 4. Illustrative workflow used to generate the alligator weed likelihood dataset with examples of (a) classified alligator weed raster, (b) class probability raster, (c) weighted water proximity raster, (d) weighted, normalised alligator weed likelihood raster (darker colours indicating a higher normalised probability) and (e) an example of the final output overlaid on AP.
Remotesensing 14 02674 g004
Figure 5. Example output of a waterbody in 2016 showing (a) manually mapped patches of alligator weed and (b) the corresponding alligator weed likelihood output.
Remotesensing 14 02674 g005
Figure 6. Example output of a waterbody with high levels of alligator weed infestation in 2011 showing (a) manually mapped patches of alligator weed and (b) the corresponding alligator weed likelihood output.
Remotesensing 14 02674 g006
Figure 7. Site monitoring of alligator weed area over time in (a) the initial infestation stage during 2010, (b) peak coverage of alligator weed in 2011 and (c) 2016, following an alligator weed removal program at the site.
Remotesensing 14 02674 g007
Figure 8. Alligator weed infestation declining due to management and removal works in (a) 2010, (b) 2013 and (c) 2016.
Remotesensing 14 02674 g008
Figure 9. Boxplot of mean alligator weed likelihood values for each manually mapped patch from 2010 to 2016. Boxes represent 25th and 75th quartiles, with median indicated by the central line. Whiskers represent 1.5 times the interquartile range beyond the quartiles (or the maximum value, if smaller). Crosses represent outliers.
Remotesensing 14 02674 g009
Table 1. Summary of aerial imagery acquired [49] and used in this study.
YearImage Date/Range
201028 December 2010
201130 December 2011
201229 October 2012–30 October 2012
20135 January 2013–6 January 2013
201428 December 2013–8 January 2014
201515 February 2015–22 March 2015
201621 February 2016
Table 2. Distance from water features: buffer distances and associated weighted value. Higher weight values are areas closer to water features.
DistanceWeight Value
<2 m5
5 m4
10 m3
25 m2
50 m1
>50 m0
Table 3. Summary of alligator weed patches identified and digitised between 2010 and 2016 in the study area.
YearNumber of Patches
2010151
201139
201217
201339
201458
201566
201682
Table 4. Summary of data used to train and validate the random forest classifiers for alligator weed detection in Victoria, Australia.
YearClass NamePixel Count
2010Water13,058
Other vegetation 111,829
Alligator weed8266
Other land surfaces 257,270
2016Water13,188
Other vegetation 110,770
Alligator weed2397
Other land surfaces 254,922
1 Including various managed turf-grass species (such as ryegrass, bluegrass and kikuyu), common reed (Phragmites australis), slender knotweed (Persicaria decipiens), water couch (Paspalum distichum), clubrush (Bolboschoenus caldwellii), softstem bulrush (Schoenoplectus tabernaemontani) and various rush species (Juncus spp.). 2 Including roads, houses and bare ground.
Table 5. Summary of 2010 random forests classifier accuracy metrics.
ClassPrecisionRecallF1-Scoren Pixels
Water0.940.930.943896
Other vegetation0.910.910.913578
Alligator weed0.920.950.932428
Other land surfaces0.990.990.9917,225
Overall accuracy: 96.8%
Table 6. Summary of 2016 random forests classifier accuracy metrics.
ClassPrecisionRecallF1-scoren Pixels
Water0.980.980.983937
Other vegetation0.930.940.933169
Alligator weed0.910.920.92727
Other land surfaces1.000.990.9916,551
Overall accuracy: 98.2%
Table 7. Confusion matrix for the 2010 random forest classifier (pixel count from the validation dataset, the grey areas means correctly identified pixels).
Predicted Class
True class WaterOther vegetationAlligator weedOther land surfaces
Water3630181085
Other vegetation93326819324
Alligator weed1011822991
Other land surfaces12738017,060
Table 8. Confusion matrix for the 2016 random forest classifier (pixel count from the validation dataset, the grey areas means correctly identified pixels).
Predicted Class
True Class WaterOther vegetationAlligator weedOther land surfaces
Water385171015
Other vegetation8229676456
Alligator weed0596680
Other land surfaces1589016,447
Table 9. Summary of alligator weed patch detection rates between 2010 and 2016.
YearNumber of Mapped PatchesPatches DetectedPatch Detection Rate (%)
2010151151100.0
2011393897.4
2012171376.5
2013393589.7
2014585086.2
20156666100.0
2016827591.4
Publisher’s Note: MDPI stays neutral with regard to jurisdictional claims in published maps and institutional affiliations.

