Article

Pseudo-Spectral Time-Domain Method for Subsurface Imaging with the Lunar Regolith Penetrating Radar

1
Key Laboratory of Intelligent Computing and Signal Processing, Ministry of Education, Anhui University, Hefei 230601, China
2
Information Materials and Intelligent Sensing Laboratory of Anhui Province, Anhui University, Hefei 230601, China
3
Key Laboratory of Electromagnetic Environmental Sensing of Anhui Higher Education Institutes, Anhui University, Hefei 230601, China
*
Author to whom correspondence should be addressed.
Remote Sens. 2022, 14(12), 2791; https://doi.org/10.3390/rs14122791
Submission received: 27 April 2022 / Revised: 4 June 2022 / Accepted: 7 June 2022 / Published: 10 June 2022

Abstract

:
Recently and successfully, the Chang’E-5 (CE-5) lander was launched on a mission to bring 1.731 kg of lunar soil back to Earth. To investigate various compositions of lunar regolith, we apply the Lunar Regolith Penetrating Radar (LRPR) as the same scientific payload installed on the CE-5 lander. Based on the high-accuracy imaging technique, we achieve subsurface imaging to process LRPR-measured data collected from the lunar-like exploration tests in our laboratory. In this paper, we propose the pseudo-spectral time-domain (PSTD) method as the underlying code to implement the reverse-time migration (RTM) method and restore the uncertain subsurface area. With the significant advantage of lower spatial sampling density, the PSTD-RTM method not only saves major computational resources, but also rapidly confirms the object prediction in the effective imaging area. To further analyze the LRPR measured data, we employ the spectrum window to remove high- and low-frequency noise, and thus improve imaging visibility to some extent. The imaging results in this paper can prove the reliability and efficiency of the PSTD-RTM method for subsurface discoveries in planetary exploration.

Graphical Abstract

1. Introduction

So far, China has established itself as an important leader in space travel, especially in planetary exploration. To the best of our knowledge, the China National Space Administration (CNSA) has been intently developing and expanding its capabilities and technologies step by step in a series of Chang’E missions [1]. The Chinese Lunar Exploration Program (CLEP) has concentrated on the first two steps of Chang’E missions, namely, lunar orbit and lunar probe [2]. The Chang’E-1 (CE-1) and Chang’E-2 (CE-2) orbiters successfully launched as scheduled in 2007 and 2010, respectively, and then acquired high-resolution lunar-surface information, which makes China the fifth power to put a probe into lunar orbit [3]. In 2013, the Chang’E-3 (CE-3) lander and its rover, Yutu, as the first new visitors from China, set down on the dark plains of a lunar near-side basin [4,5]. They are equipped to study and analyze the lunar surface and subsurface based on their payloads, which contain ground-penetrating radar and a wide-angle ultraviolet camera. Unfortunately, due to many mechanical problems from the complex lunar environment, the rover Yutu could not move forward since 2014, but it continued to work in place and, in 2015, it discovered new rocks that were never explored [1].
Confined by exploration infrastructure technology, it was difficult for the several dozen in situ lunar missions to land on the lunar near-side; hence, the CLEP planned for the QueQiao relay satellite to facilitate lunar far-side in situ surface exploration and sample return missions [6]. Recently, the Chang’E-4 (CE-4) lander successfully finished a soft landing on the lunar far-side and has been providing worthy geodetic data for studies on subsequent lunar exploration [7], which will be helpful for subsurface exploration and sample returns of lunar regolith. As a critically important step of the CLEP, the Chang’E-5 (CE-5) lander was launched on a mission to bring 1.731 kg of lunar soil from subsurface depths of up to 2~3 m back to our Earth. Ground-penetrating radar (GPR) has been commonly adopted in geological surveys [8], in the mining industry [9], archeology [10], and civil engineering [11], to aid discoveries in these fields. Based on the same principle, the Lunar Regolith Penetrating Radar (LRPR), as an asymmetrical antenna array, was installed on the bottom of the CE-5 lander and used for guiding the sample drilling process. However, with the loose soils and hard rocks analyzed by the CE-3 detection, the CE-5 mission encountered the formidable challenges of drilling and coring.
In our research, to further grasp the data characteristics and provide a reference for LRPR’s data processing, we propose rapid subsurface imaging to identify the position of subsurface lunar rocks and implement lunar soil collection. With a limited number of measurement echoes, we employ the pseudo-spectral time-domain (PSTD) method as the underlying code to process the reverse-time migration (RTM) method [12,13,14,15] and then discover the unknown rocks in the layered structures. The main contributions of this work are as follows:
(a)
Due to the lower spatial sampling density [16], the PSTD-RTM method can save major computational resources such as CPU time and computer memory, which is conducive to finishing the lunar soil collection of the CE-5 lander during the whole exploration.
(b)
Combined with the LRPR’s facility, we can estimate the effective imaging subsurface area, which will be meaningful for the shallow geological study of the extraterrestrial planet.
(c)
After utilizing the spectral window, we can remove the invalid measured noise in high or low frequencies and improve the imaging visibility to some extent.
(d)
Based on the electromagnetic path, direct waves and interface echoes can be eliminated by the path’s propagation time.
The organization of this paper is as follows. The time-domain electromagnetic method and the RTM method are introduced simply in Section 2. In Section 3, we analyze the measurements of the experiment, i.e., the subsurface model and the LRPR’s data, and explain the effective imaging area under the CE-5 lander. In Section 4, we apply the conventional FDTD (C-FDTD) [17,18], high-order FDTD (HO-FDTD) [16,19], and PSTD [20,21], respectively, to implement the RTM method and compare with the other results. Further, we adopt the spectral window to remove noise in high or low frequencies, and make an attempt to improve imaging visibility in Section 5. The conclusion is drawn in Section 6.

2. Time-Domain Electromagnetic Method and Reverse-Time Migration Method

2.1. Time-Domain Electromagnetic Method

For the time-domain electromagnetic problem, Maxwell’s curl equations can be effectively expressed as the electromagnetic wave propagating to the outer region.
× H = D t + σ e E + J s ,
× E = B t ,
where the physical quantities E, D, H, and B are, respectively, electric field intensity, electric flux density, magnetic field intensity, and magnetic flux density. Js represents the input source for exciting the electromagnetic waves in the whole computational domain, and σe is the conductivity to determine the lossy media. The constitute relation must be established for the non-magnetic, isotropic, and linear media, shown as B = μ0 H and D = εrε0E, where εr is the relative permittivity, and the permittivity and the permeability in the vacuum are, respectively, ε0 = 8.85 × 10⁻¹² F/m and μ0 = 4π × 10−7 H/m.
Taking the x direction as an instance, we can build the time-domain discretization for Equations (1) and (2), as shown in
E x | i + 1 2 , j , k n + 1 = C e x e | i + 1 2 , j , k E x | i + 1 2 , j , k n + C e x h | i + 1 2 , j , k ( H z y | i + 1 2 , j , k n + 1 2 H y z | i + 1 2 , j , k n + 1 2 J s x | i + 1 2 , j , k n + 1 2 ) ,
H x | i , j + 1 2 , k + 1 2 n + 1 2 = H x | i , j + 1 2 , k + 1 2 n 1 2 + C h x e | i , j + 1 2 , k + 1 2 ( E z y | i , j + 1 2 , k + 1 2 n E y z | i , j + 1 2 , k + 1 2 n ) ,
where three iterative parameters can be expressed as
C e x e | i + 1 2 , j , k = ε | i + 1 2 , j , k Δ t 1 0.5 σ e | i + 1 2 , j , k ε | i + 1 2 , j , k Δ t 1 + 0.5 σ e | i + 1 2 , j , k ,   C e x h | i + 1 2 , j , k = 1 ε | i + 1 2 , j , k Δ t 1 + 0.5 σ e | i + 1 2 , j , k ,   C h x e | i , j + 1 2 , k + 1 2 = Δ t μ 0 ,
Considering the spatial derivative H z y | i + 1 2 , j , k n + 1 2 , we can obtain the spatial-domain discretization in C-FDTD and HO-FDTD, respectively, as below:
H z y | i + 1 2 , j , k n + 1 2 = H z | i + 1 2 , j + 1 2 , k n + 1 2 H z | i + 1 2 , j 1 2 , k n + 1 2 Δ y + O ( Δ y 2 )
H z y | i + 1 2 , j , k n + 1 2 = 9 8 H z | i + 1 2 , j + 1 2 , k n + 1 2 H z | i + 1 2 , j 1 2 , k n + 1 2 Δ y H z | i + 1 2 , j + 3 2 , k n + 1 2 H z | i + 1 2 , j 3 2 , k n + 1 2 24 Δ y + O ( Δ y 4 ) ,
For the pseudo-spectral method, the spatial derivation can be solved by the fast fourier transform (FFT) method, as expressed below:
H z y | i + 1 2 , j , k n + 1 2 = F y 1 ( j k y F y H z ) ,
where the function symbol F y and F y 1 are respectively denoted as the forward and inverse FFT in y-direction. ky, named as wave number, represents the spatial frequency in the y-direction.
Among the three methods depicted above, the spatial sampling density requires at least 15 points per wavelength (PPW) for the C-FDTD method, which inevitably leads to occupying more memory and CPU time in terms of the 3D layered problem. The HO-FDTD method can improve the numerical accuracy by setting 10 PPW, but it still needs much memory for the RTM process. Combined with the FFT method, we adopt the PSTD method, which can set a lower spatial sampling density to further implement the dramatical reduction in computer resources. As compared with the C- and HO-FDTD methods, the memory requirement for the single-field component of the PSTD method with 4 PPW in the 3D problems reduces to (4/15)3 ≈ 0.019 and (4/10)3 = 0.064 times, respectively. C-FDTD and HO-FDTD have the simple spatial difference and the easy code modification for numerical computation, as shown in the Equations (5) and (6). However, when using the PSTD method, we must compute the forward and inverse FFT that are needed to ensure stability in the initial code debugging. To implement the RTM method, we have to execute the boundary storage before the truncation boundary. For the C-FDTD and HO-FDTD method, the RTM method only needs the electromagnetic field data on one or two layers to implement the reverse-time computation. However, when executing the PSTD method, we have to choose the seven layers to pre-store the boundary field shown in Figure 2. With the PSTD advantage of spatial sampling density, we can still save significant computer memory. This is why the CE-5 adopted the C-FDTD and HO-FDTD as underlying code earlier.
Meanwhile, poor resolution comes from the measured data volume. In general geological imaging, the number of geophones is in the thousands to ensure the accuracy of the geological contour. However, CE-5 needs to work for lunar exploration, in which case it is difficult to take many antennas due to the special environment and the limited-weight lander. As a matter of fact, the RTM imaging aims to find hard rocks, in order to avoid damage to the only drill. Therefore, we only need the suitable region to ensure the appropriate subsurface situation under the drill. In fact, to improve the resolution, we just increase the number of transmitting and receiving antennas. At the same time, the computational time will be multiply enhanced.

2.2. Collection Process for Measured Data in Layered Area

For smooth implementation of the RTM imaging, it is essential to finish the data collection in our earth laboratory for the CE-5 lander. As shown in Figure 1, the main procedure can be described below:
① During the measurement of the experiment, all measuring antennas are placed in the air, and each one in turn transmits the temporal impulse underneath.
② Both interface echoes and transmission waves occur when electromagnetic waves impinge on the interface between air and media. Then, the transmission waves continue to propagate forward into the soil area.
③ In the known soil area, there are some unknown irregular objects, especially in the complex lunar soil. Once the electromagnetic waves collide with these objects, stochastic scattering waves occur, and the measuring antennas can receive some echoes that travel from the soil back to the air.
Repeating the three steps above, all the measuring antennas except the transmitted antennas can record three types of waves, such as direct waves, interface echoes, and subsurface echoes, in the final step. In fact, we cannot avoid both external and device noise interfering with the measurement information during the experiment. However, relying on these collections, we can still proceed to the imaging analysis for the certain soil area to find the unknown objects.

2.3. Procedure Analysis on the RTM Imaging

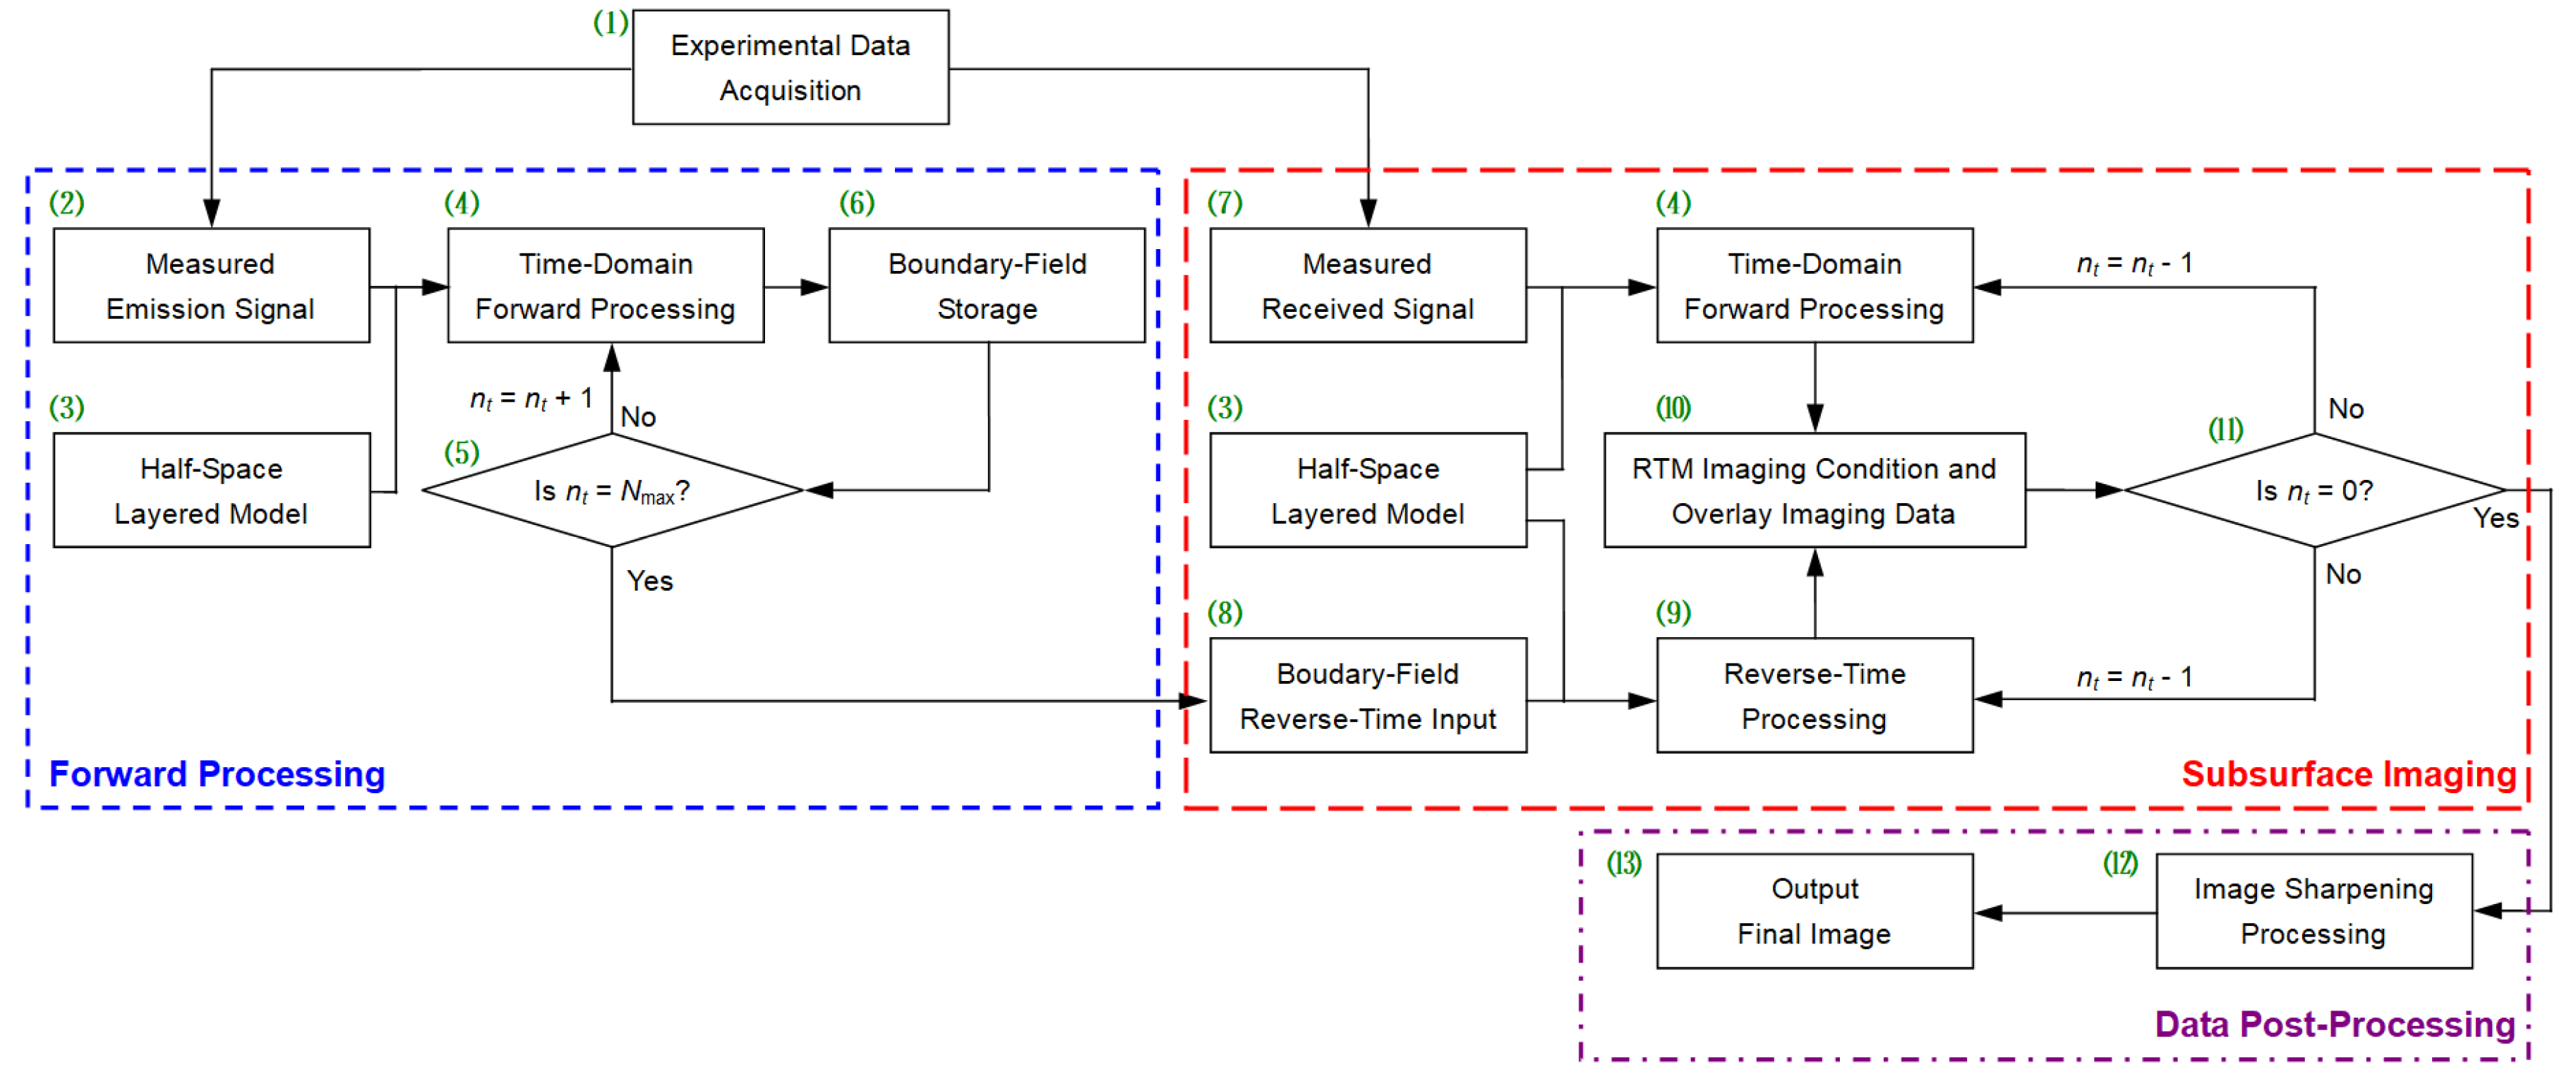
After the collection process, each measuring antenna must send subsurface measured data back to the RTM imaging workbench. The RTM method is the best imaging technique according to the two-way wave equation, but there is the quite obvious shortcoming that it occupies dramatic computer memory and CPU time, which leads to extremely low efficiency. To further conquer this problem, as illustrated in Figure 2, we store boundary fields based on the Huygens principle instead of compressing the whole physical region into forward computation. The RTM imaging process is introduced below:
(A)
As reflected in Figure 2, in the blue, short-dashed box marked Forward Processing, the measured emission signal propagates forward into the half-space layered model by using the time-domain electromagnetic algorithm. The time-step boundary fields are prestored for preparing the RTM imaging condition.
(B)
Based on Equations (3) and (4), the reverse-time computation can be obtained below:
E x | i + 1 2 , j , k n = 1 C e x e | i + 1 2 , j , k [ E x | i + 1 2 , j , k n + 1 C e x h | i + 1 2 , j , k ( H z y | i + 1 2 , j , k n + 1 2 H y z | i + 1 2 , j , k n + 1 2 J s x | i + 1 2 , j , k n + 1 2 ) ] ,
H x | i , j + 1 2 , k + 1 2 n 1 2 = H x | i , j + 1 2 , k + 1 2 n + 1 2 C h x e | i , j + 1 2 , k + 1 2 ( E z y | i , j + 1 2 , k + 1 2 n E y z | i , j + 1 2 , k + 1 2 n ) ,
When using the reverse-time computation, we can regain the original fields fT from the prestored boundary fields in step (9) above, the Reverse-Time Processing in the red, long-dashed box marked Subsurface Imaging. At the same time, the measured received signals, as counterclockwise input sources Js, radiate into the half-space layered model; therefore, the reversed-time fields fR can be achieved in (4) Time-Domain Forward Processing. Next, the original fields fT and the reversed-time fields fR match the RTM imaging condition in the same iterative timestep nt, as expressed below:
I f ( r ) = n t = 1 N max f T ( r , n t Δ t ) f R ( r , n t Δ t ) ,
(C)
For the multiple transmitted antennas, we must repeat steps (A) and (B) and then superpose with all the If (r) to implement the final image on the Data Post-Processing marked inside the purple dot-dashed box.
In our work, in order to enhance the efficiency in determining hard rocks, we establish consistent standards of imaging, defined below:
I N ( r ) = lg | I f ( r ) max | I f ( r ) | | ,
The unknown objects can be obviously distinguished in the uncertain area when the value is limited to [−1, −0.8] in Equation (11).

3. Experimental Measurement and Data Analysis for the CE-5 Lander

3.1. The Antenna Layout on the CE-5 Lander

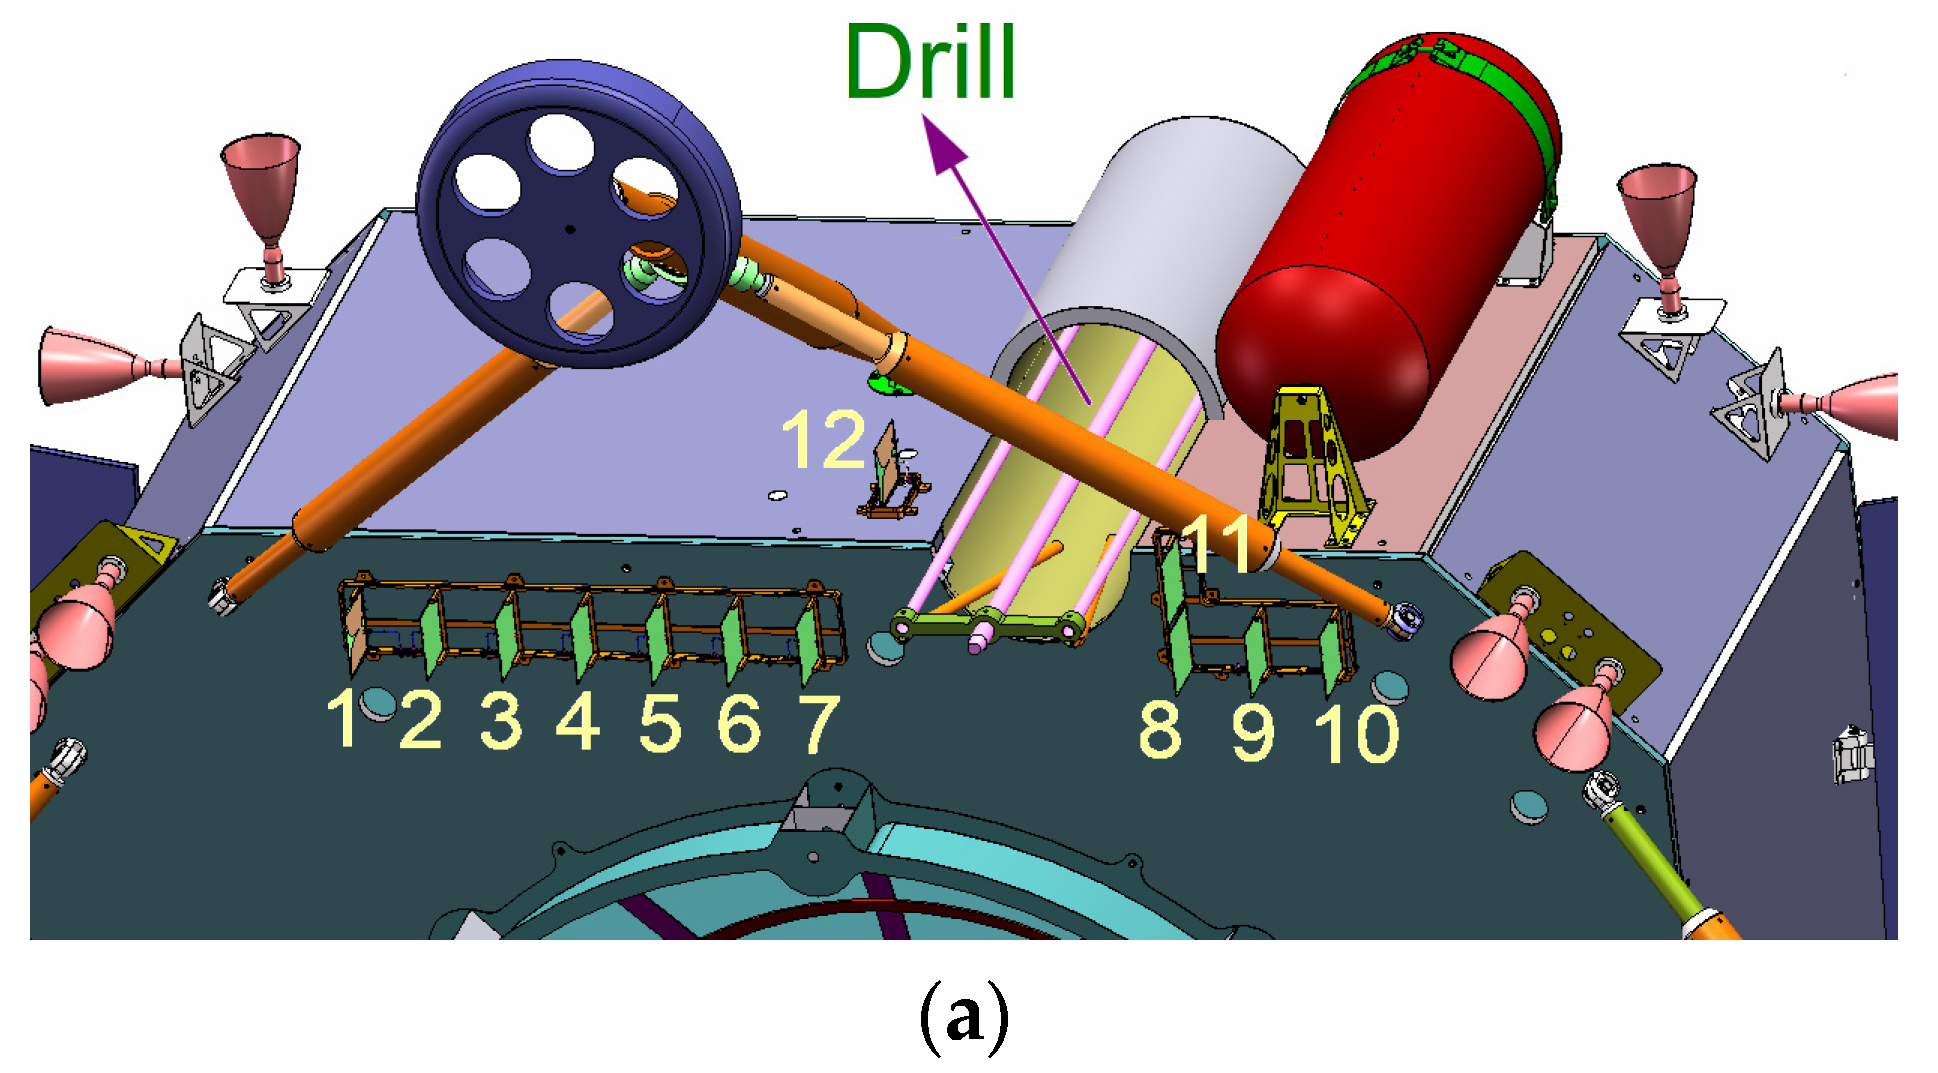
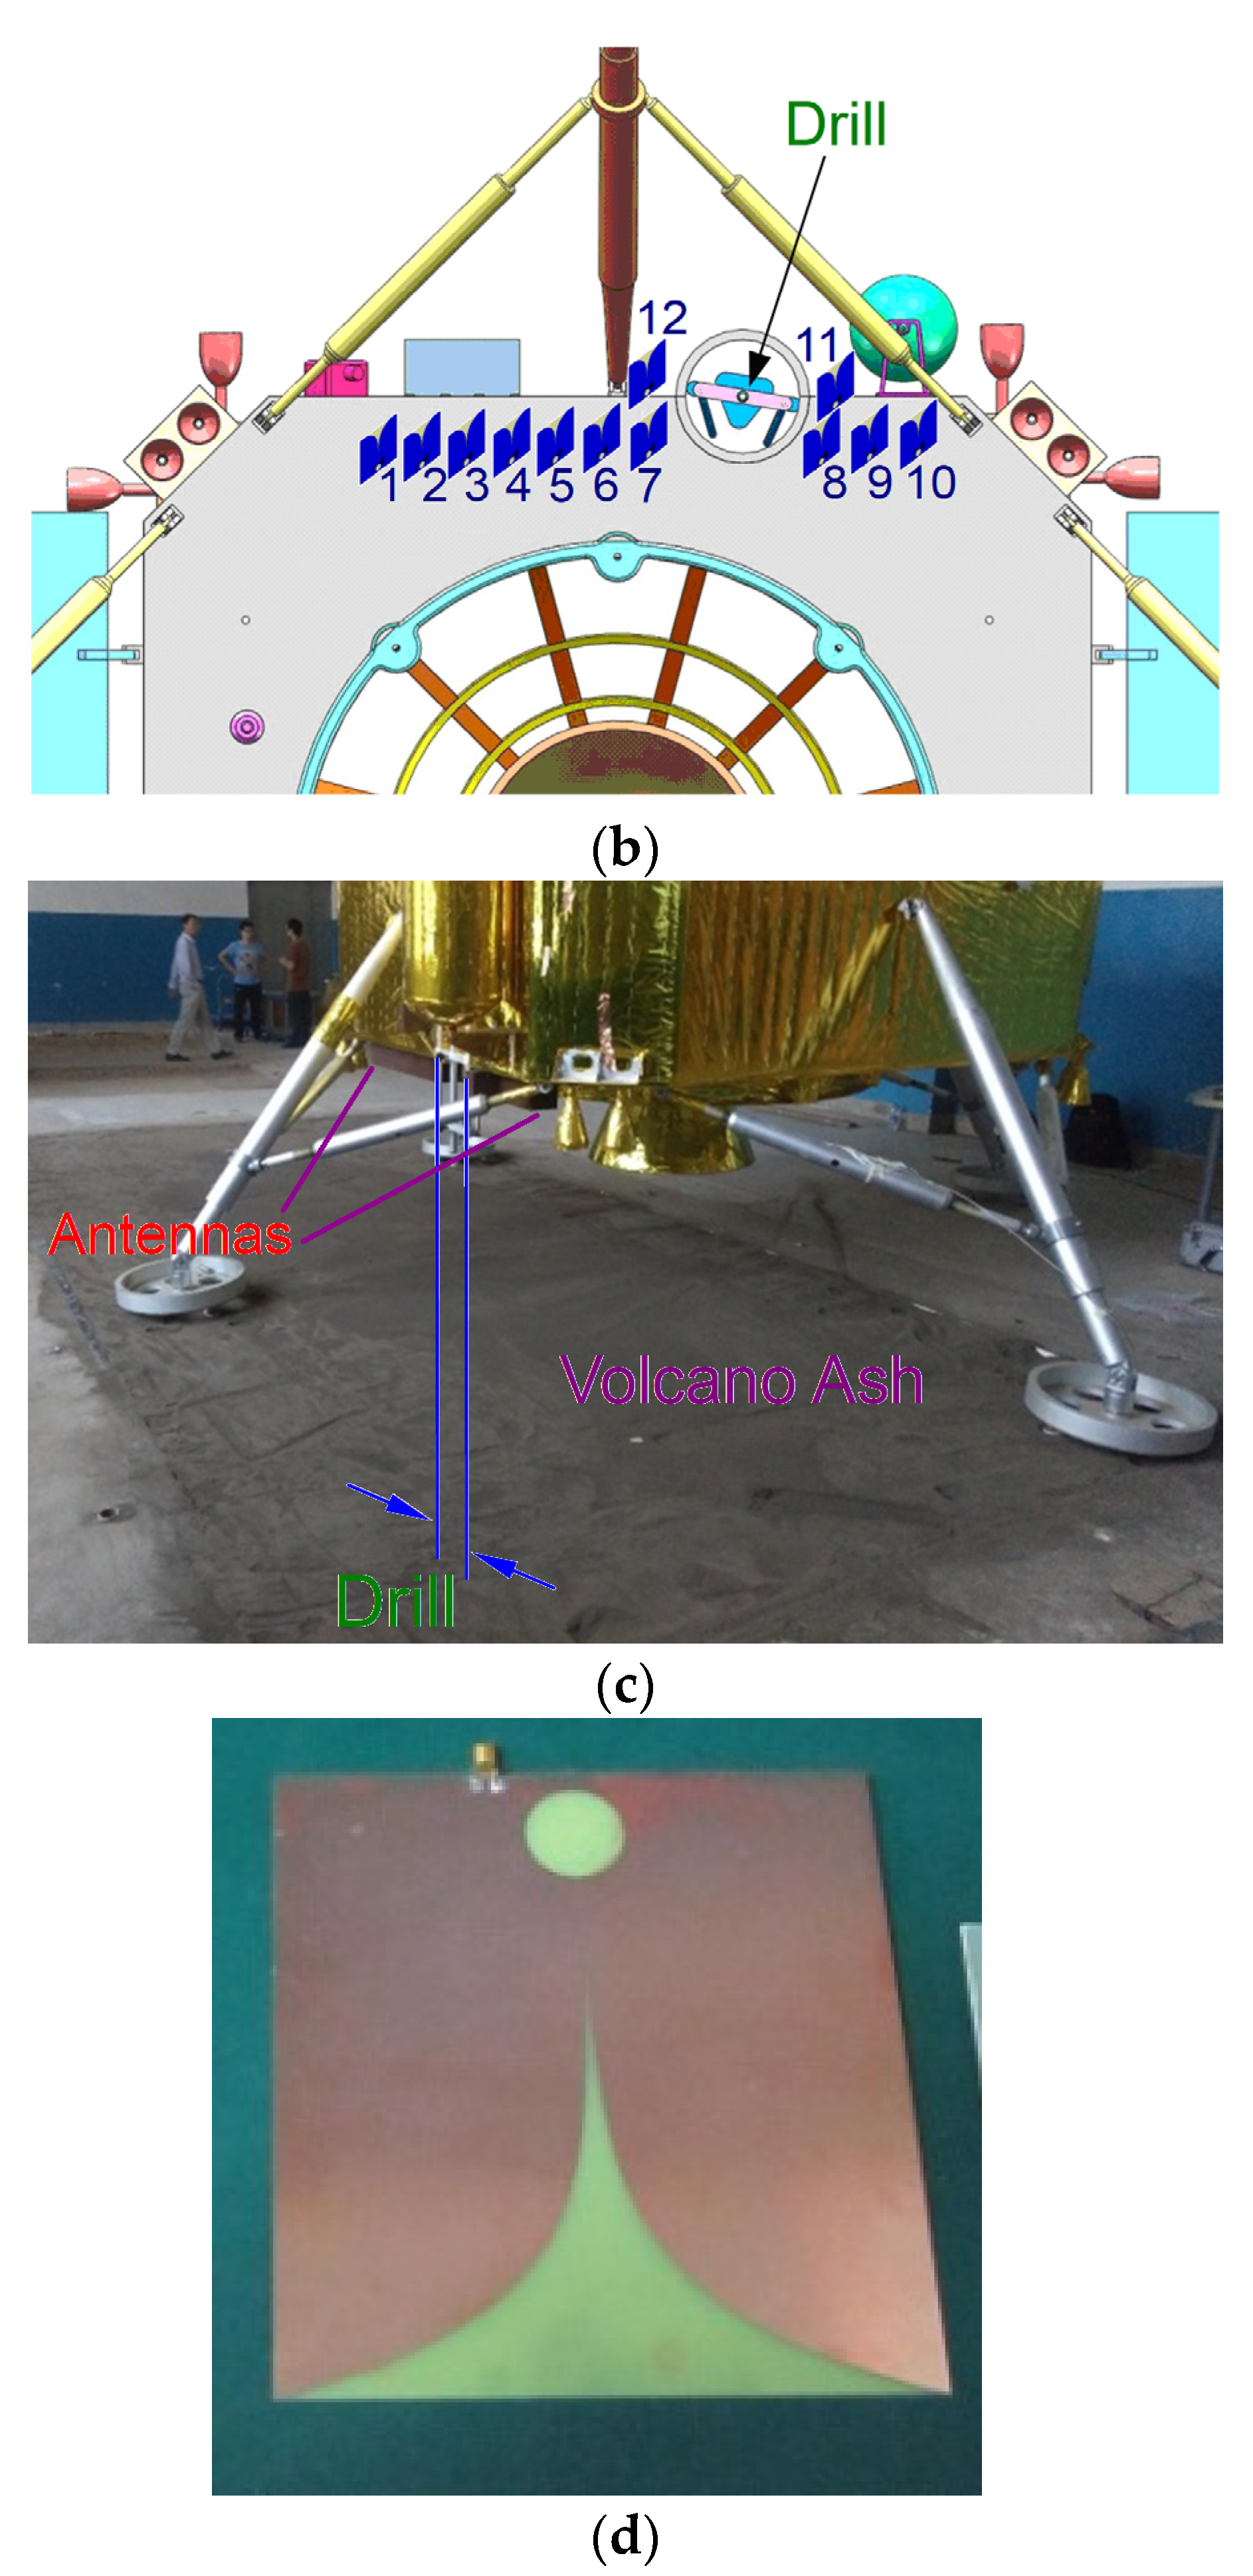
As the pilotless spacecraft first applied to lunar soil collection, the most critical piece of equipment used for alien detection within the Chang’E project is the CE-5 lander, fabricated by the Chinese Academy of Space Technology. In the foreseeable future, the CE-5 lander will be launched to detect the lunar soil area and bring 1.731 kg of lunar soil back to our Earth. As shown in Figure 3, for exploring the lunar subsurface information, twelve Vivaldi antennas are assembled on the CE-5 lander. To efficiently achieve the imaging in the subsurface area, in fact, we must avoid detail modeling for the complex structures of the CE-5 lander, and then remove redundant components such as some metal mechanical feet. In light of the actual coordinates shown in Table 1, an electric dipole can replace the ones from those initial Vivaldi antennas to carry out the RTM process.
As shown in Table 1 and Figure 3a,b, both the 11th and 12th antennas are located at the non-collinear position compared with the first 10 antennas. Further, both the 11th and 12th antennas are distributed near the drill and close to 8th and 7th antennas, respectively, along the x direction, in order to enhance echo information near the drill area. As metal itself, the drill installed on the CE-5 is easily damaged when encountering unknown hard rocks underneath the lunar soil. As a result, it is necessary for rapid subsurface imaging to identify the subsurface lunar soil and avoid the unknown hard rocks so that the collection mission can be successfully finished in the Chang’E project. To achieve this, we proceed with multiple experiments on site of large-scale volcanic ash in the earth laboratory shown in Figure 3c and collect measured data from the CE-5 lander with the 12 Vivaldi antennas shown in Figure 3d, leading to subsurface electromagnetic imaging to find the buried hard objects. The experimental content on site is elaborated below.

3.2. Measured Data Analysis of the CE-5

The ubiquitous lunar basalt may be a magnetic material, which shows a magnetite-bearing mineral with high magnetism. However, according to previous research analyses of the lunar data from the CE-1 to CE-4 lander, the lunar surface soil [16,22,23] can usually be considered as a non-magnetic, isotropic medium with the relative permittivity of εr = 3. For effectively conducting the lunar soil experiment, volcanic ash with the similar permittivity εr = 3 can be adopted instead, and applied as a background to covering the hard objects in the earth laboratory.
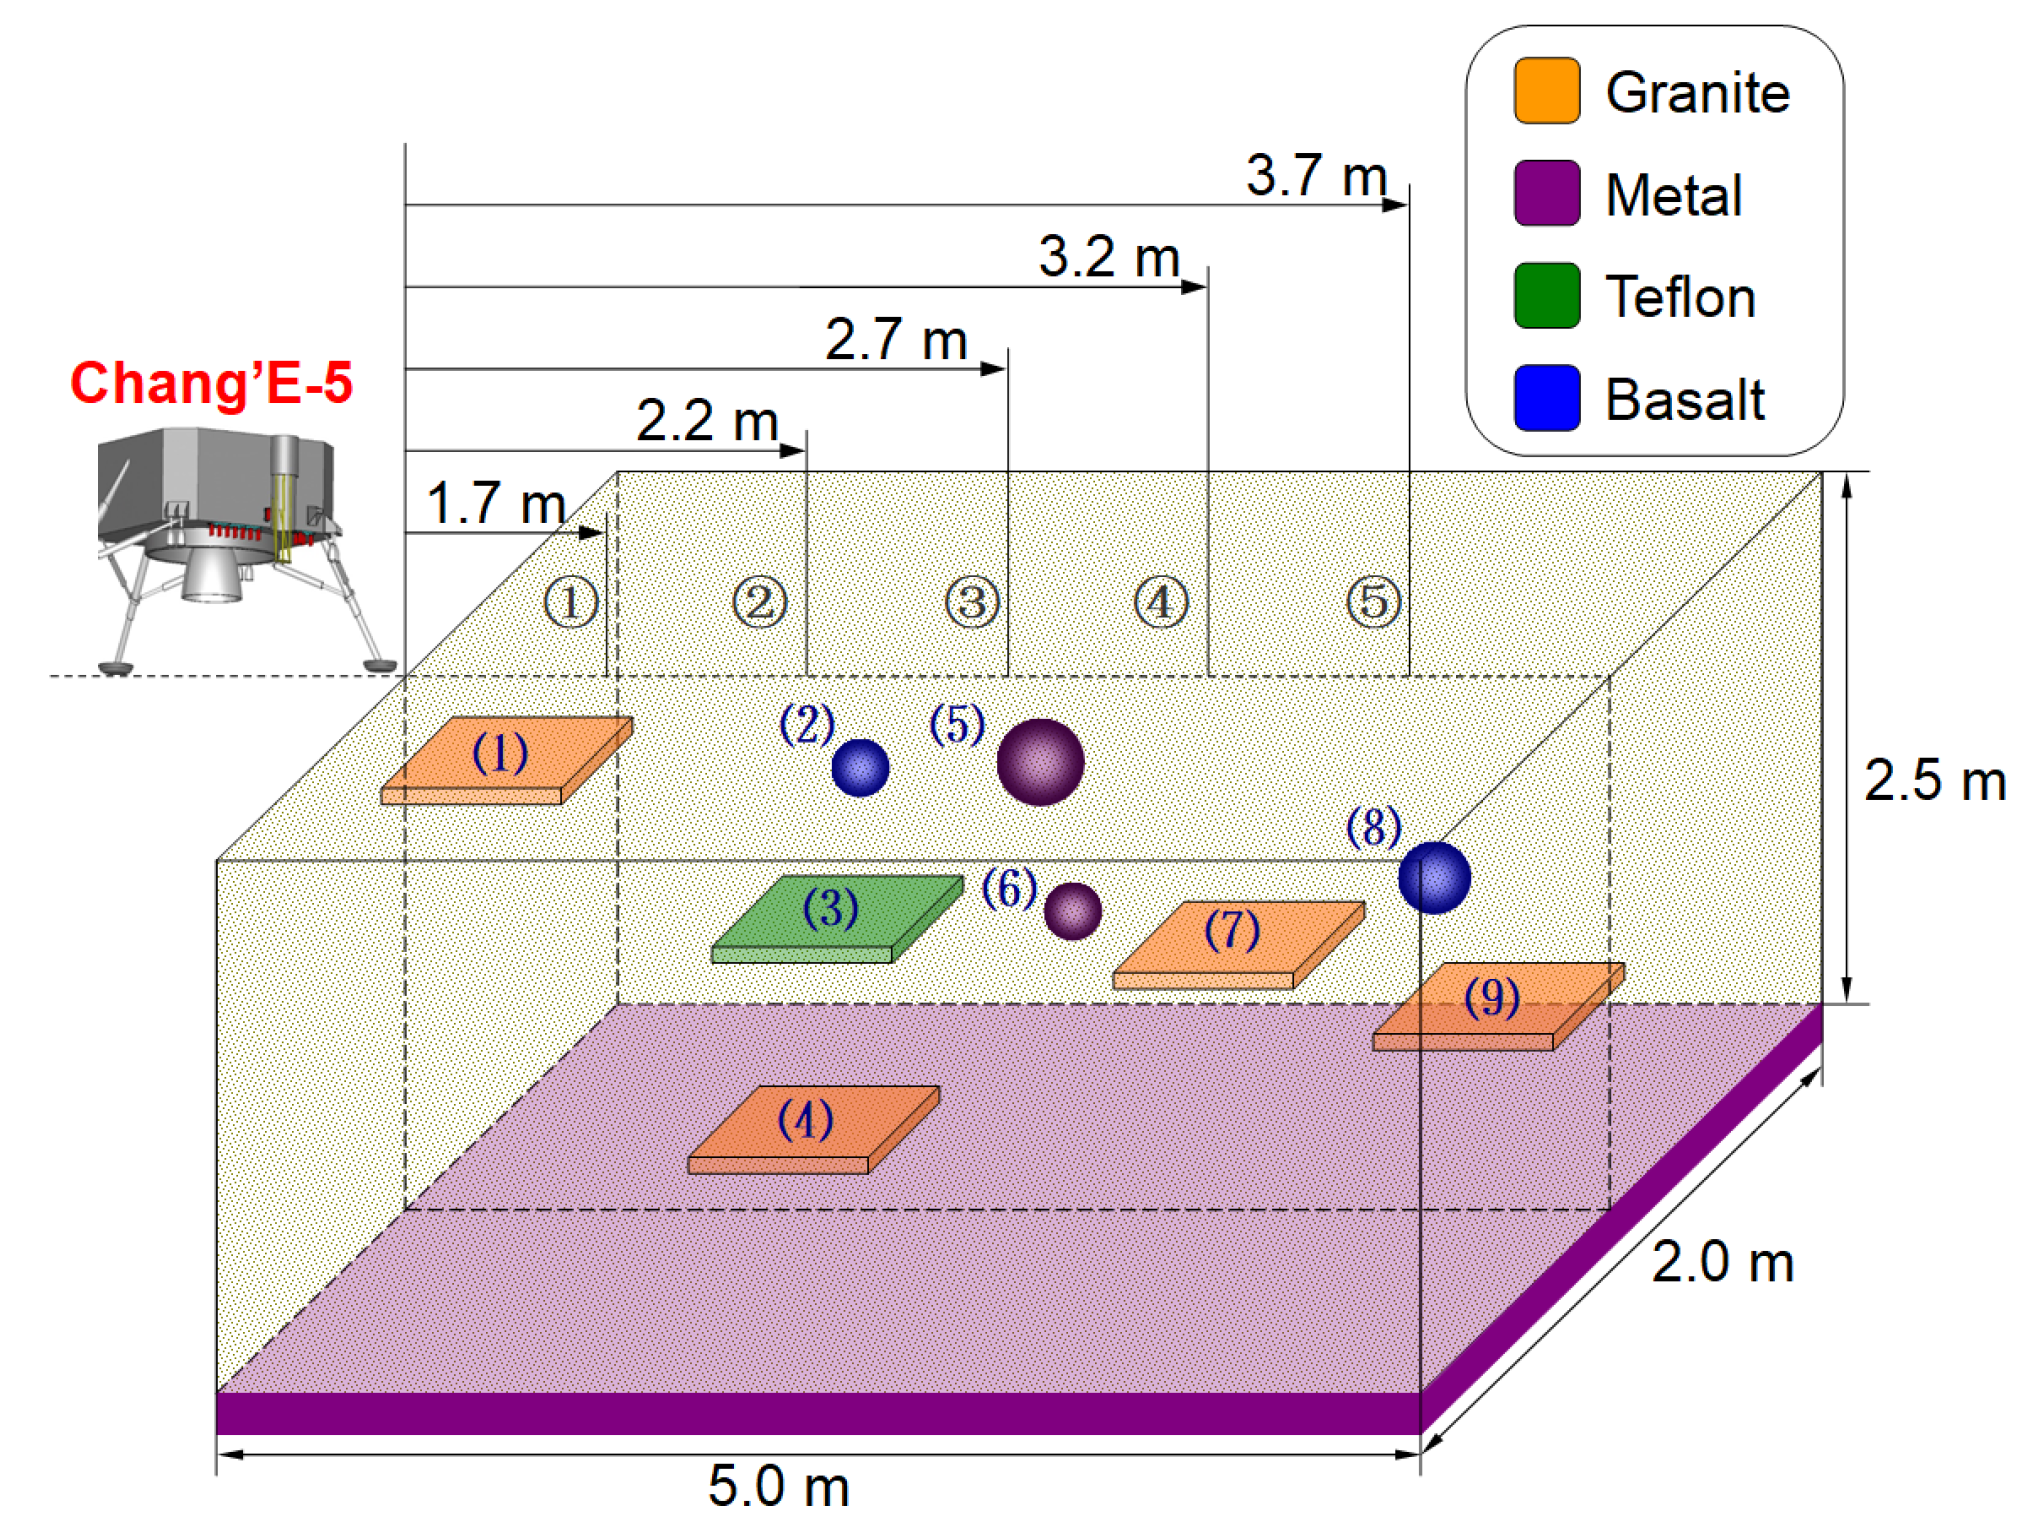
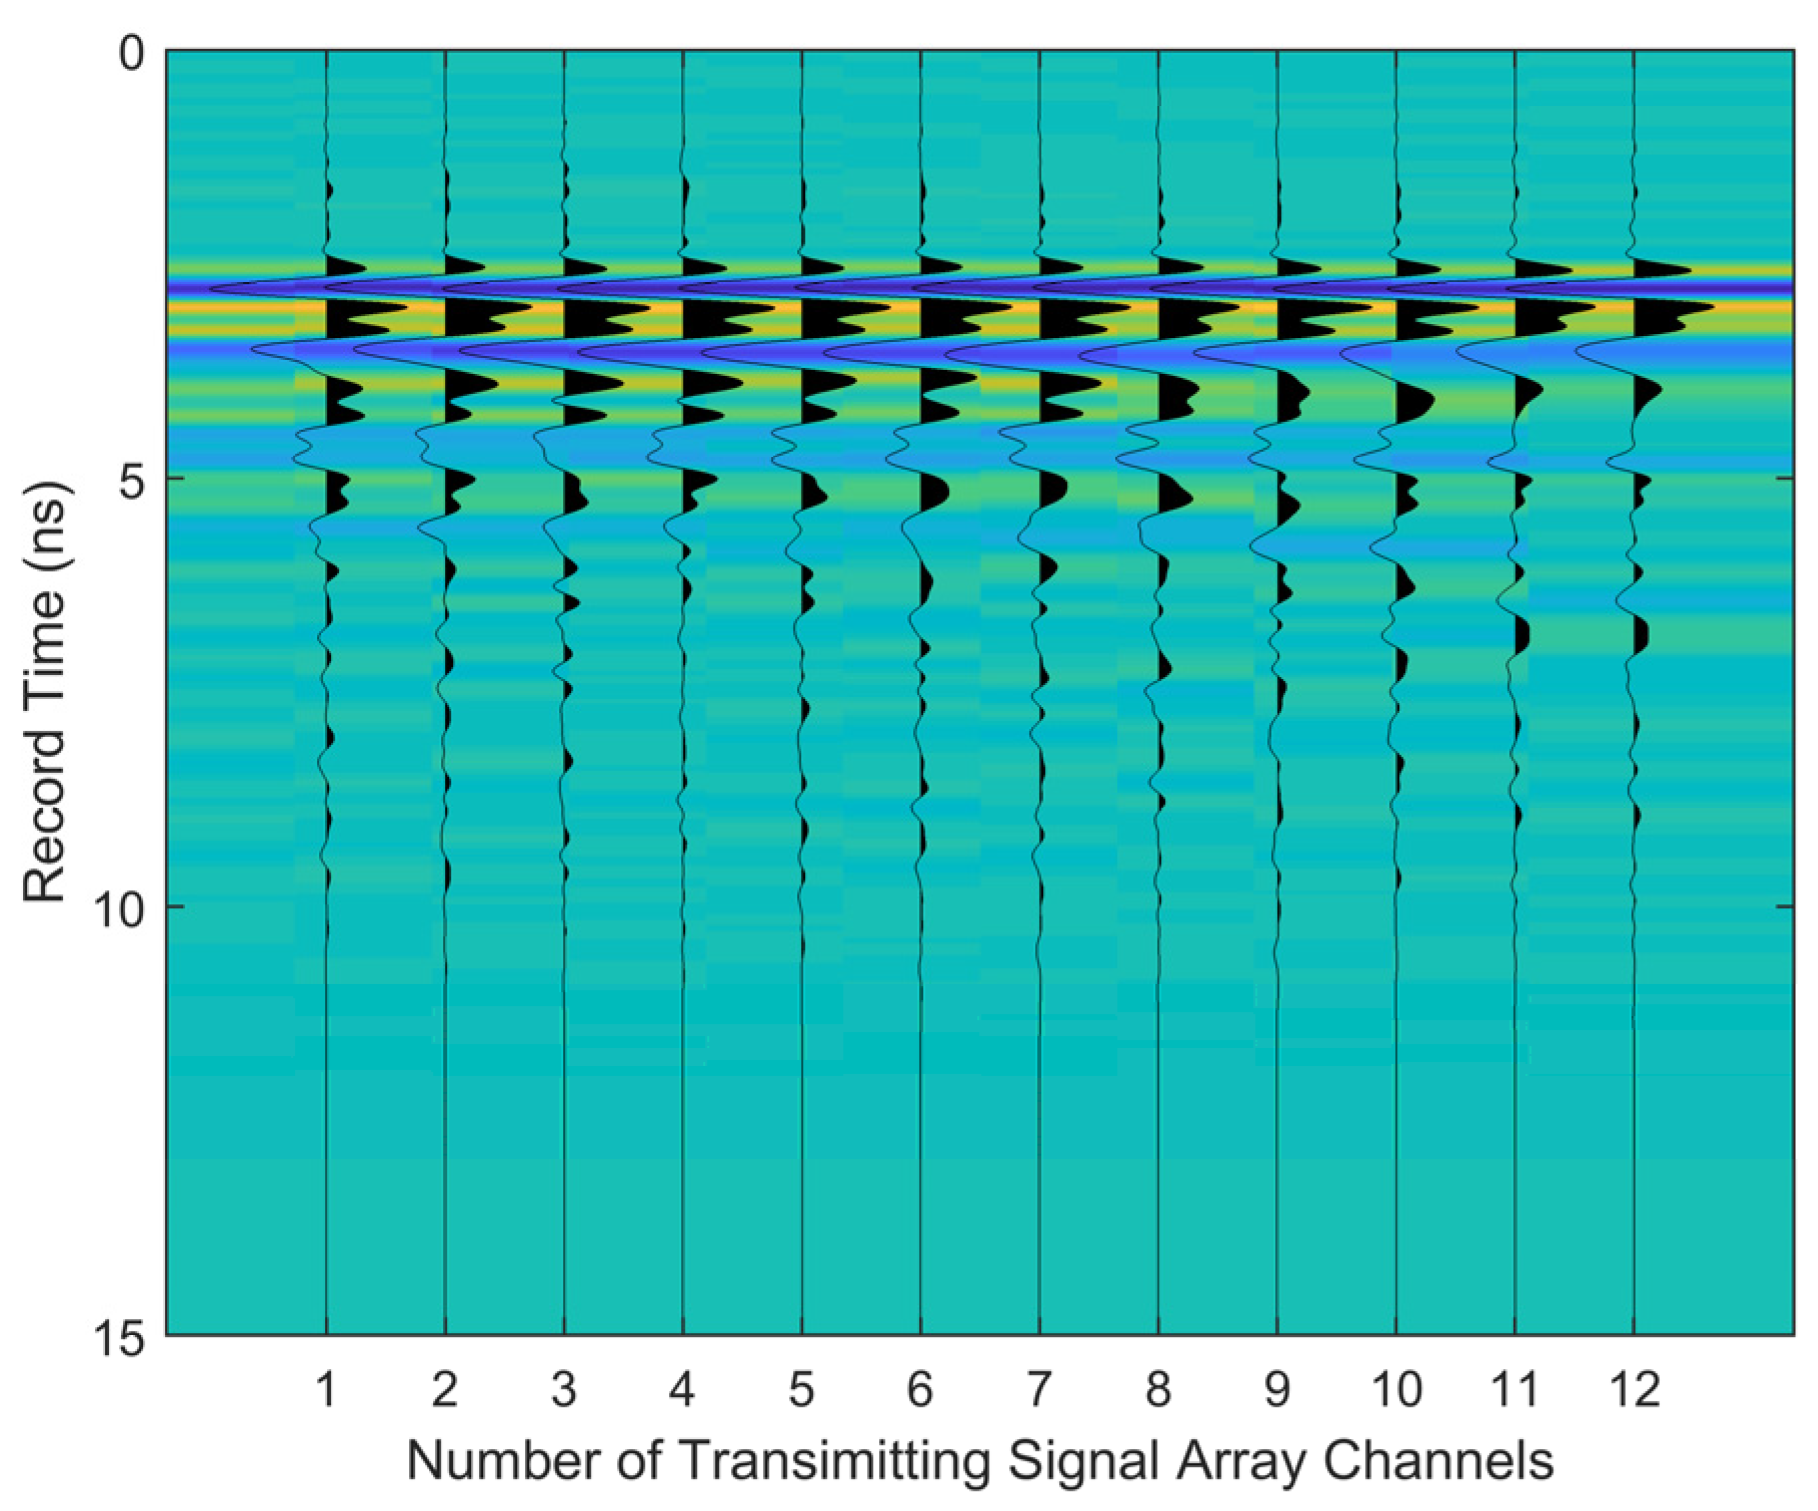
As shown in Figure 4, we chose granite, metal, Teflon, and basalt as the buried objects in the measurement area of the volcanic ash with 5 m × 2 m × 2.5 m size, and move the CE-5 lander transversely from station ① to ⑤ with corresponding locations at 1.7 m, 2.2 m, 2.7 m, 3.2 m, and 3.7 m, respectively. The rough depths of all the buried hard objects are depicted in Table 2. We can capture their echoes from the CE-5 lander by emission from the 12 Vivaldi antennas in turn. To further understand the reasonable imaging scope for the CE-5 lander, we need to handle the data analysis on the measured echoes. As observed in Figure 5, we first record emission signals from every Vivaldi antenna during the experimental measurement and catch sight of the time-domain impulse whose numerical value almost tends to zero when time t > 10 ns.
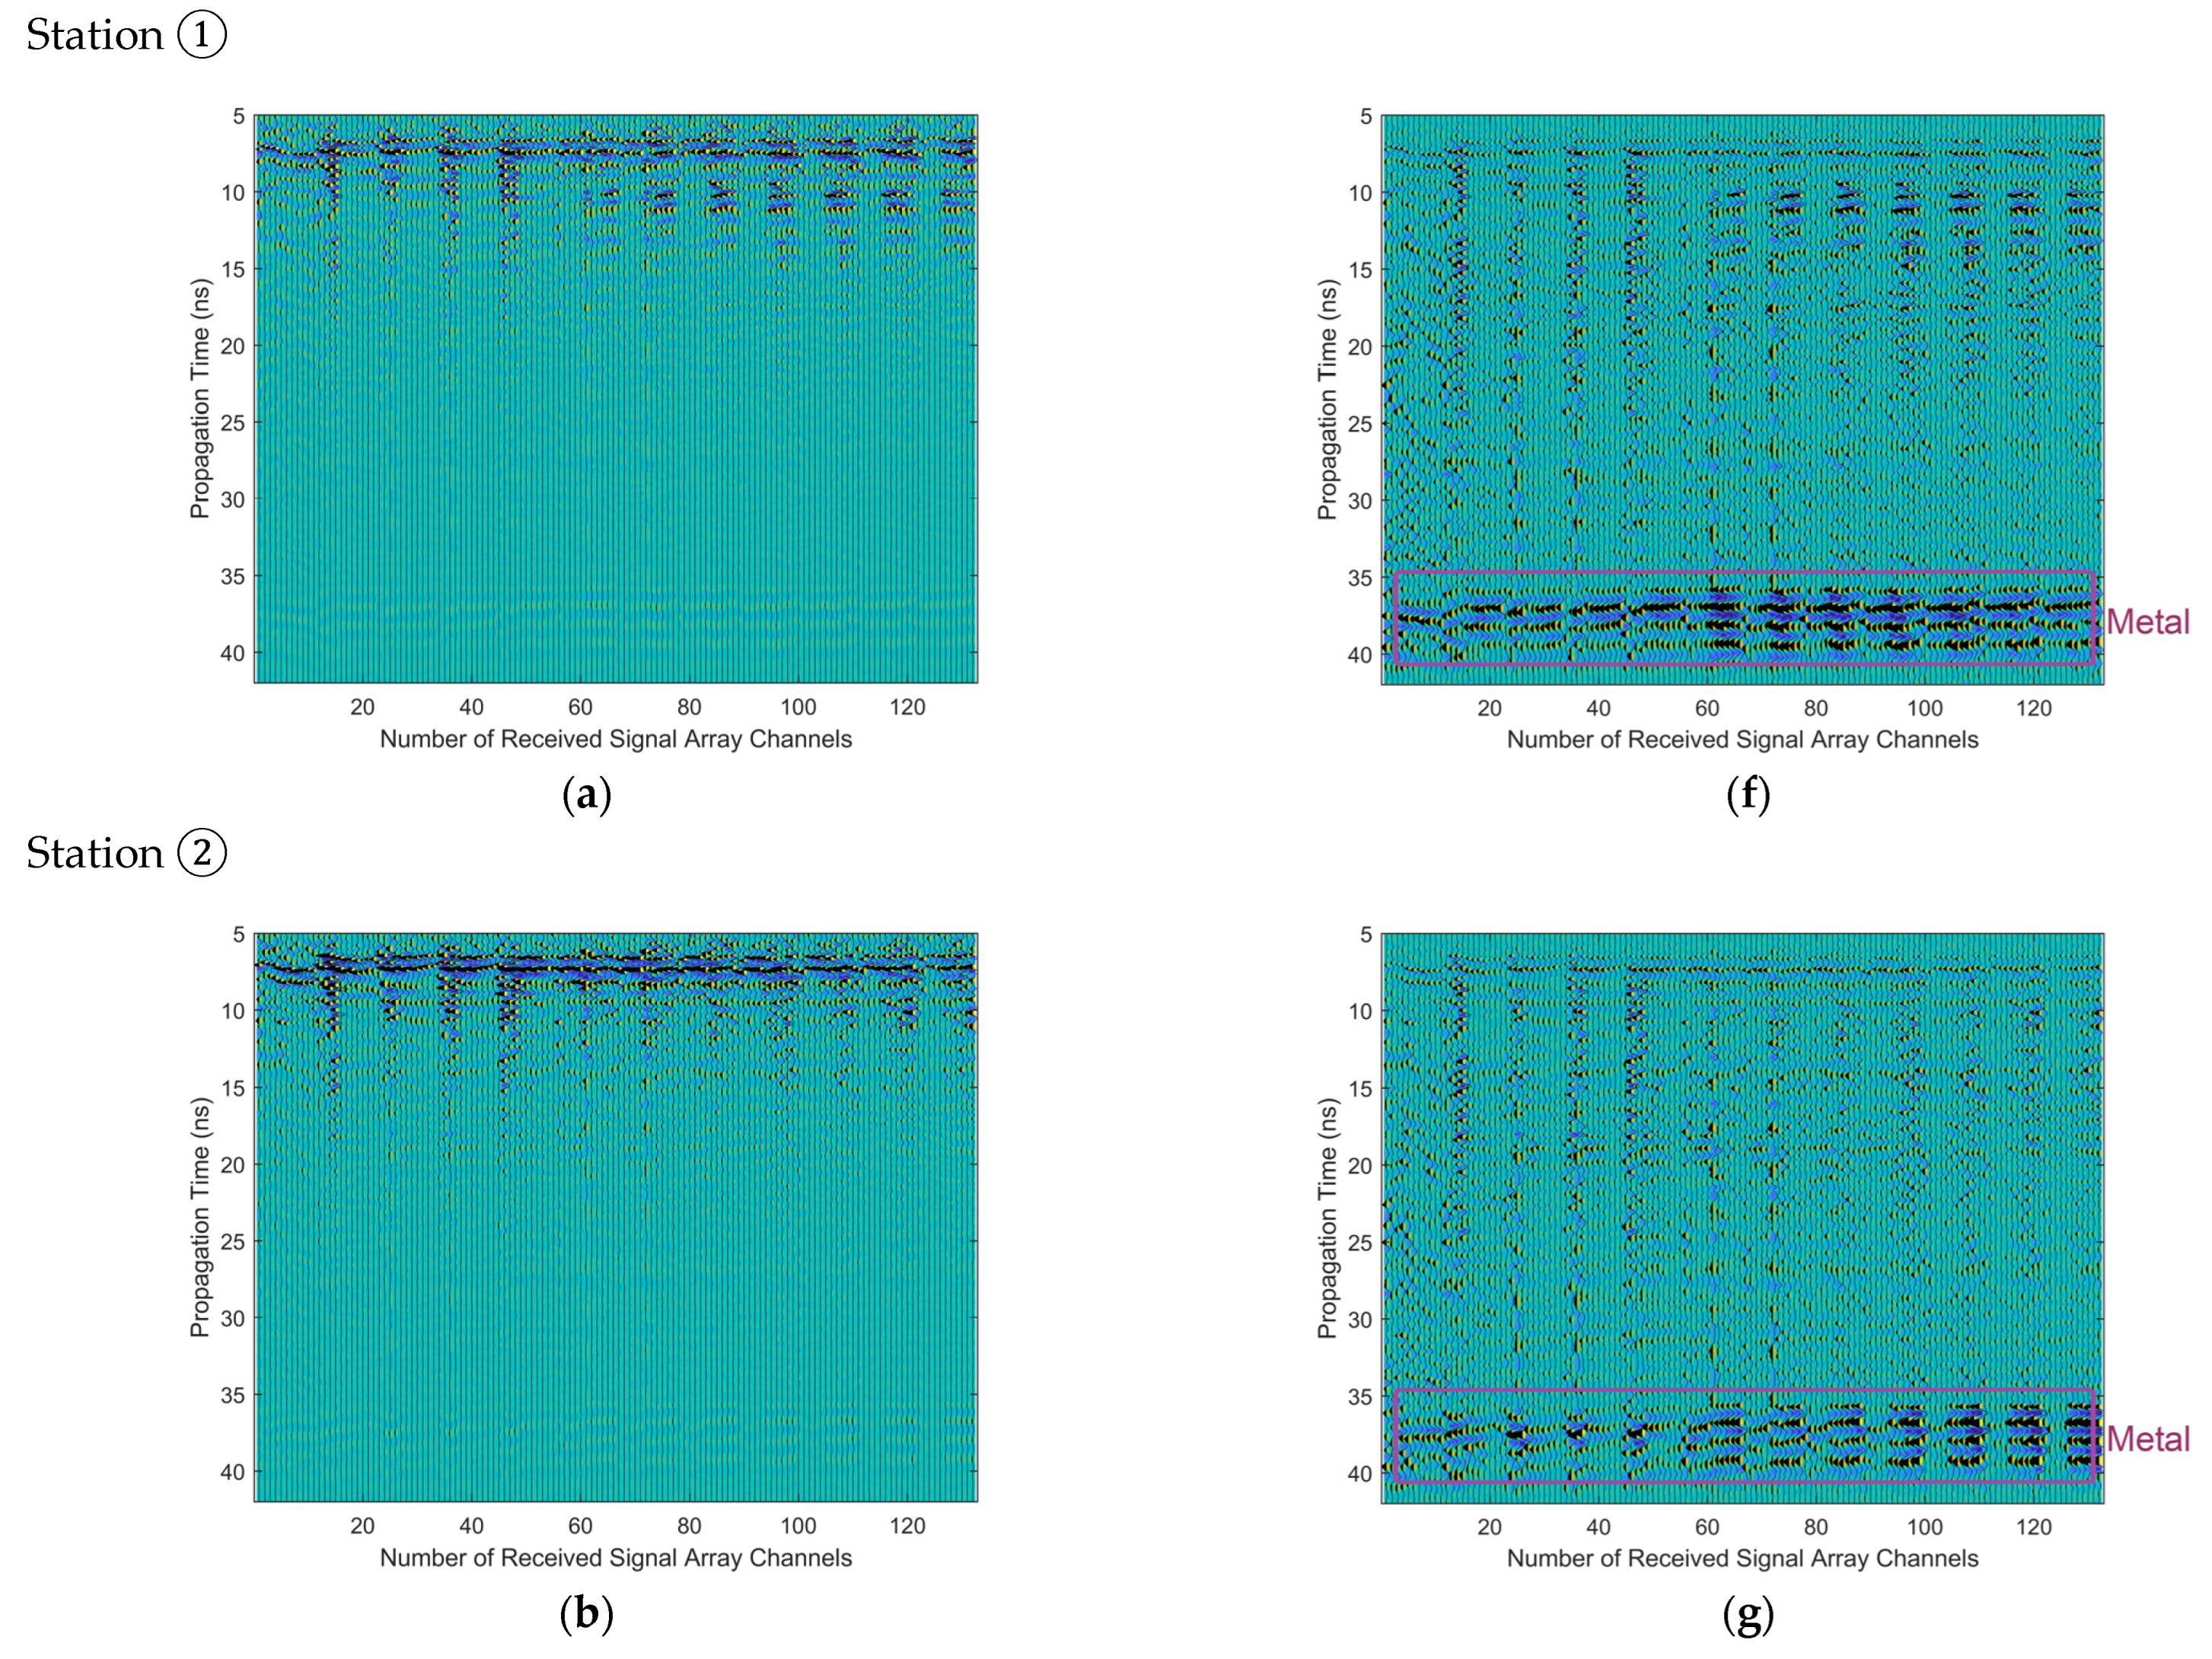
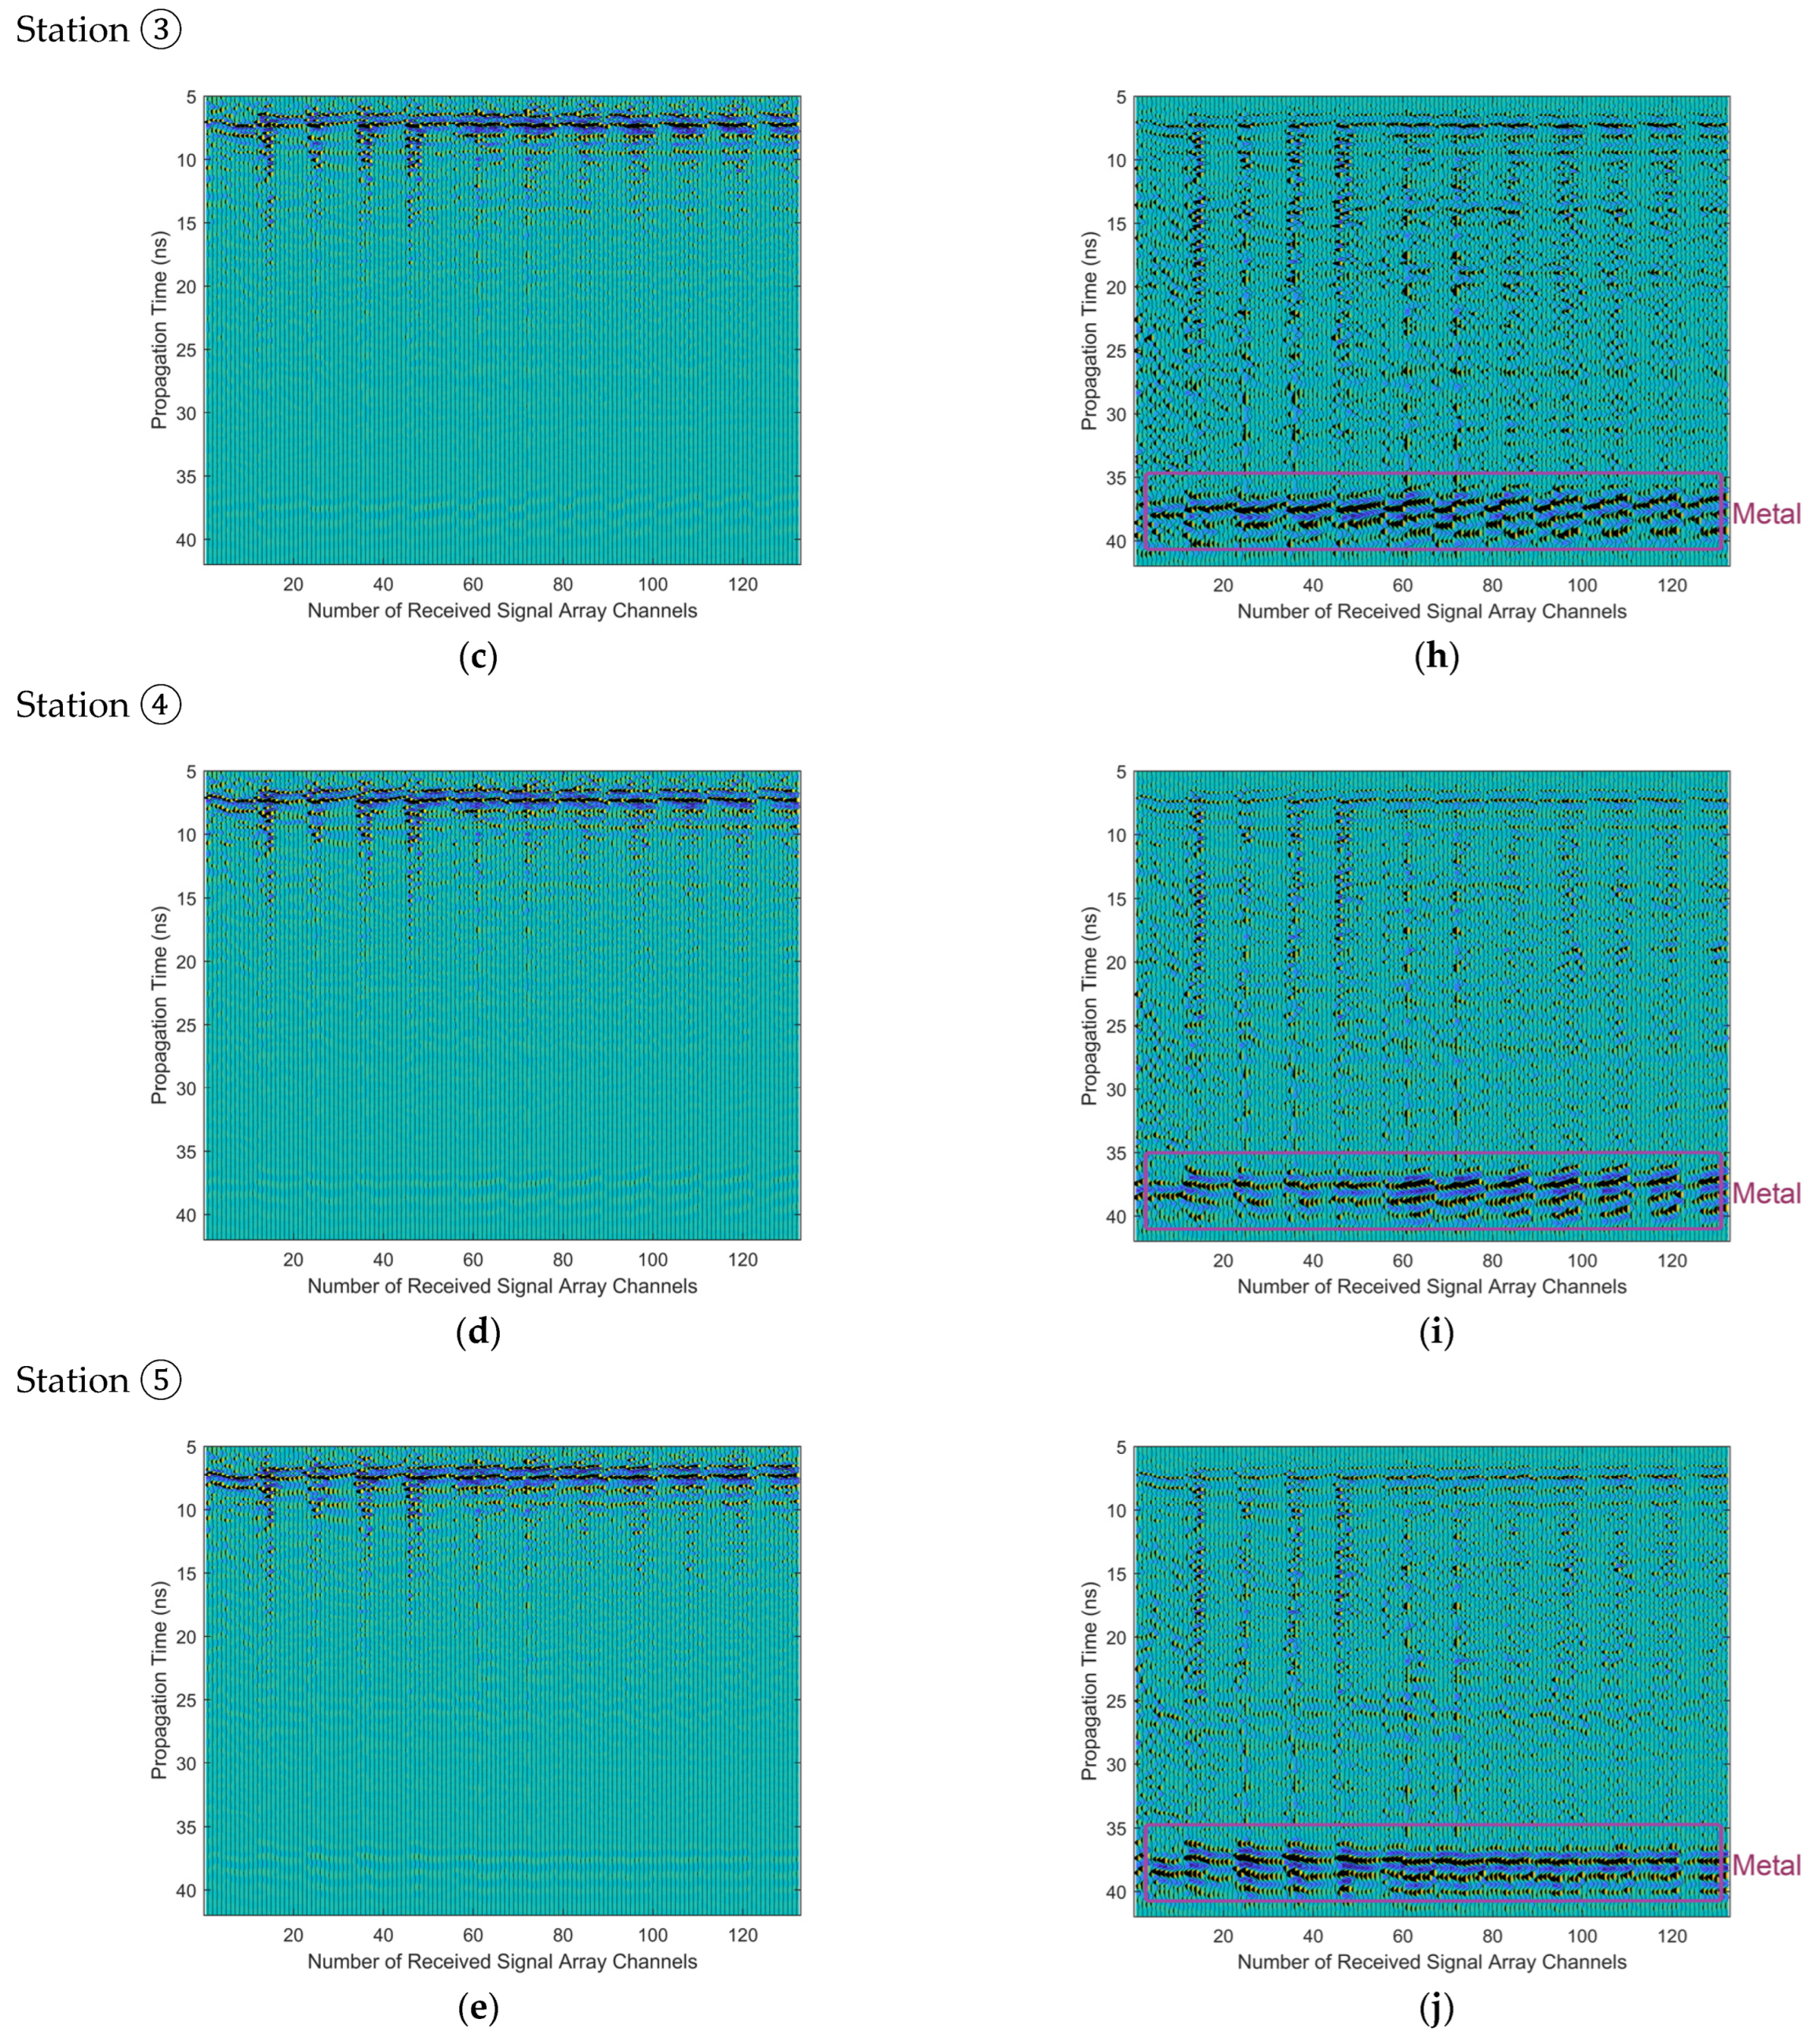
To avoid the confusion of echoes from the multiple antennas, we determine the single-input emission signal in one measurement station and then employ the non-emission antennas to receive the echoes; hence, each of the 12 Vivaldi microstrip antennas need to transmit an electromagnetic signal in turn, and an echo-array channel is built by those echo datasets in total of 11 × 12 = 132. As illustrated in Figure 6a–e, received echoes rapidly attenuate with time prolongation. For a more intuitive understanding of subsurface information, the relation between the echo dataset and propagation time is adjusted below:
D o p t i = D m e a s × t p r o p 2 ,
where Dmeas and Dopti are, respectively, the initial measured data and the optimal measured data. With these received antennas, the propagation time tprop is synchronously recorded in the CE-5 lander’s work. As shown in Figure 6f–j, the lowest bottom metal plate can be found at the echo’s time t = 36~40 ns. This long metal plate aims at preventing the electromagnetic echoes in deeper areas so that we can guarantee reliability and feasibility for the CE-5 lander measurements.

3.3. Reasonable Imaging Scope for CE-5 Lander

However, the measured echoes detected by the CE-5 lander cannot directly indicate an effective imaging area. On the one hand, as the surface of real objects is generally irregular, with those echoes exist lots of uncertainties, induced by diffuse reflection and complex volatility paths. On the other hand, rapid subsurface imaging aims at protecting the drill on the CE-5 lander and avoiding the hard rocks in the lunar soil. Therefore, we need to confirm sufficient echoes under the drill and further guarantee the imaging reliability.
As described in Figure 7, the 3D model can be considered as a layered case. Assuming that the electromagnetic propagation is the unidirectional transmitting and receiving in the whole area, corresponding to the electromagnetic path for the unique movable slab, the propagation time can be given below:
t r e a l = { 2 s 1 2 + h 1 2 v 1 D i r e c t W a v e s & I n t e r f a c e E c h o e s 2 s 1 2 + h 1 2 v 1 + 2 s 2 2 + h 2 2 v 2 S u b s u r f a c e ,
where s = 2(s1 + s2) denotes the distance between two antennas. The wave velocities v1 and v2 can be defined below:
v 1 = ( μ 0 ε 0 ) 1 2 , v 2 = ( μ 0 ε 0 ε r ) 1 2 ,
For the different positions of the antennas, the real times are different because of different length s1 and h1. The s1 and h1 can be computed from the antenna position, so the real time treal can be captured. With these results, the original measured data can be truncated into zeros by this reasonable superior time limit, which overcomes some invalid imaging information. In fact, with the development of modern communication, the frequency range of 2.4~6 GHz is commonly employed so that the laboratory measurement in earth cannot avoid the irregular noise. Therefore, we were also surprised to be able to adopt so little laboratory measurement data obtained by the antennas in order to obtain effective and fast imaging results. We place assumed transmitted and received antennas in the midpoint between the original locations and then compute the propagation time in this projection line, which can be expressed below:
t p r o j = { 2 h 1 v 1 D i r e c t W a v e s & I n t e r f a c e E c h o e s 2 h 1 v 1 + 2 h 2 v 2 S u b s u r f a c e ,
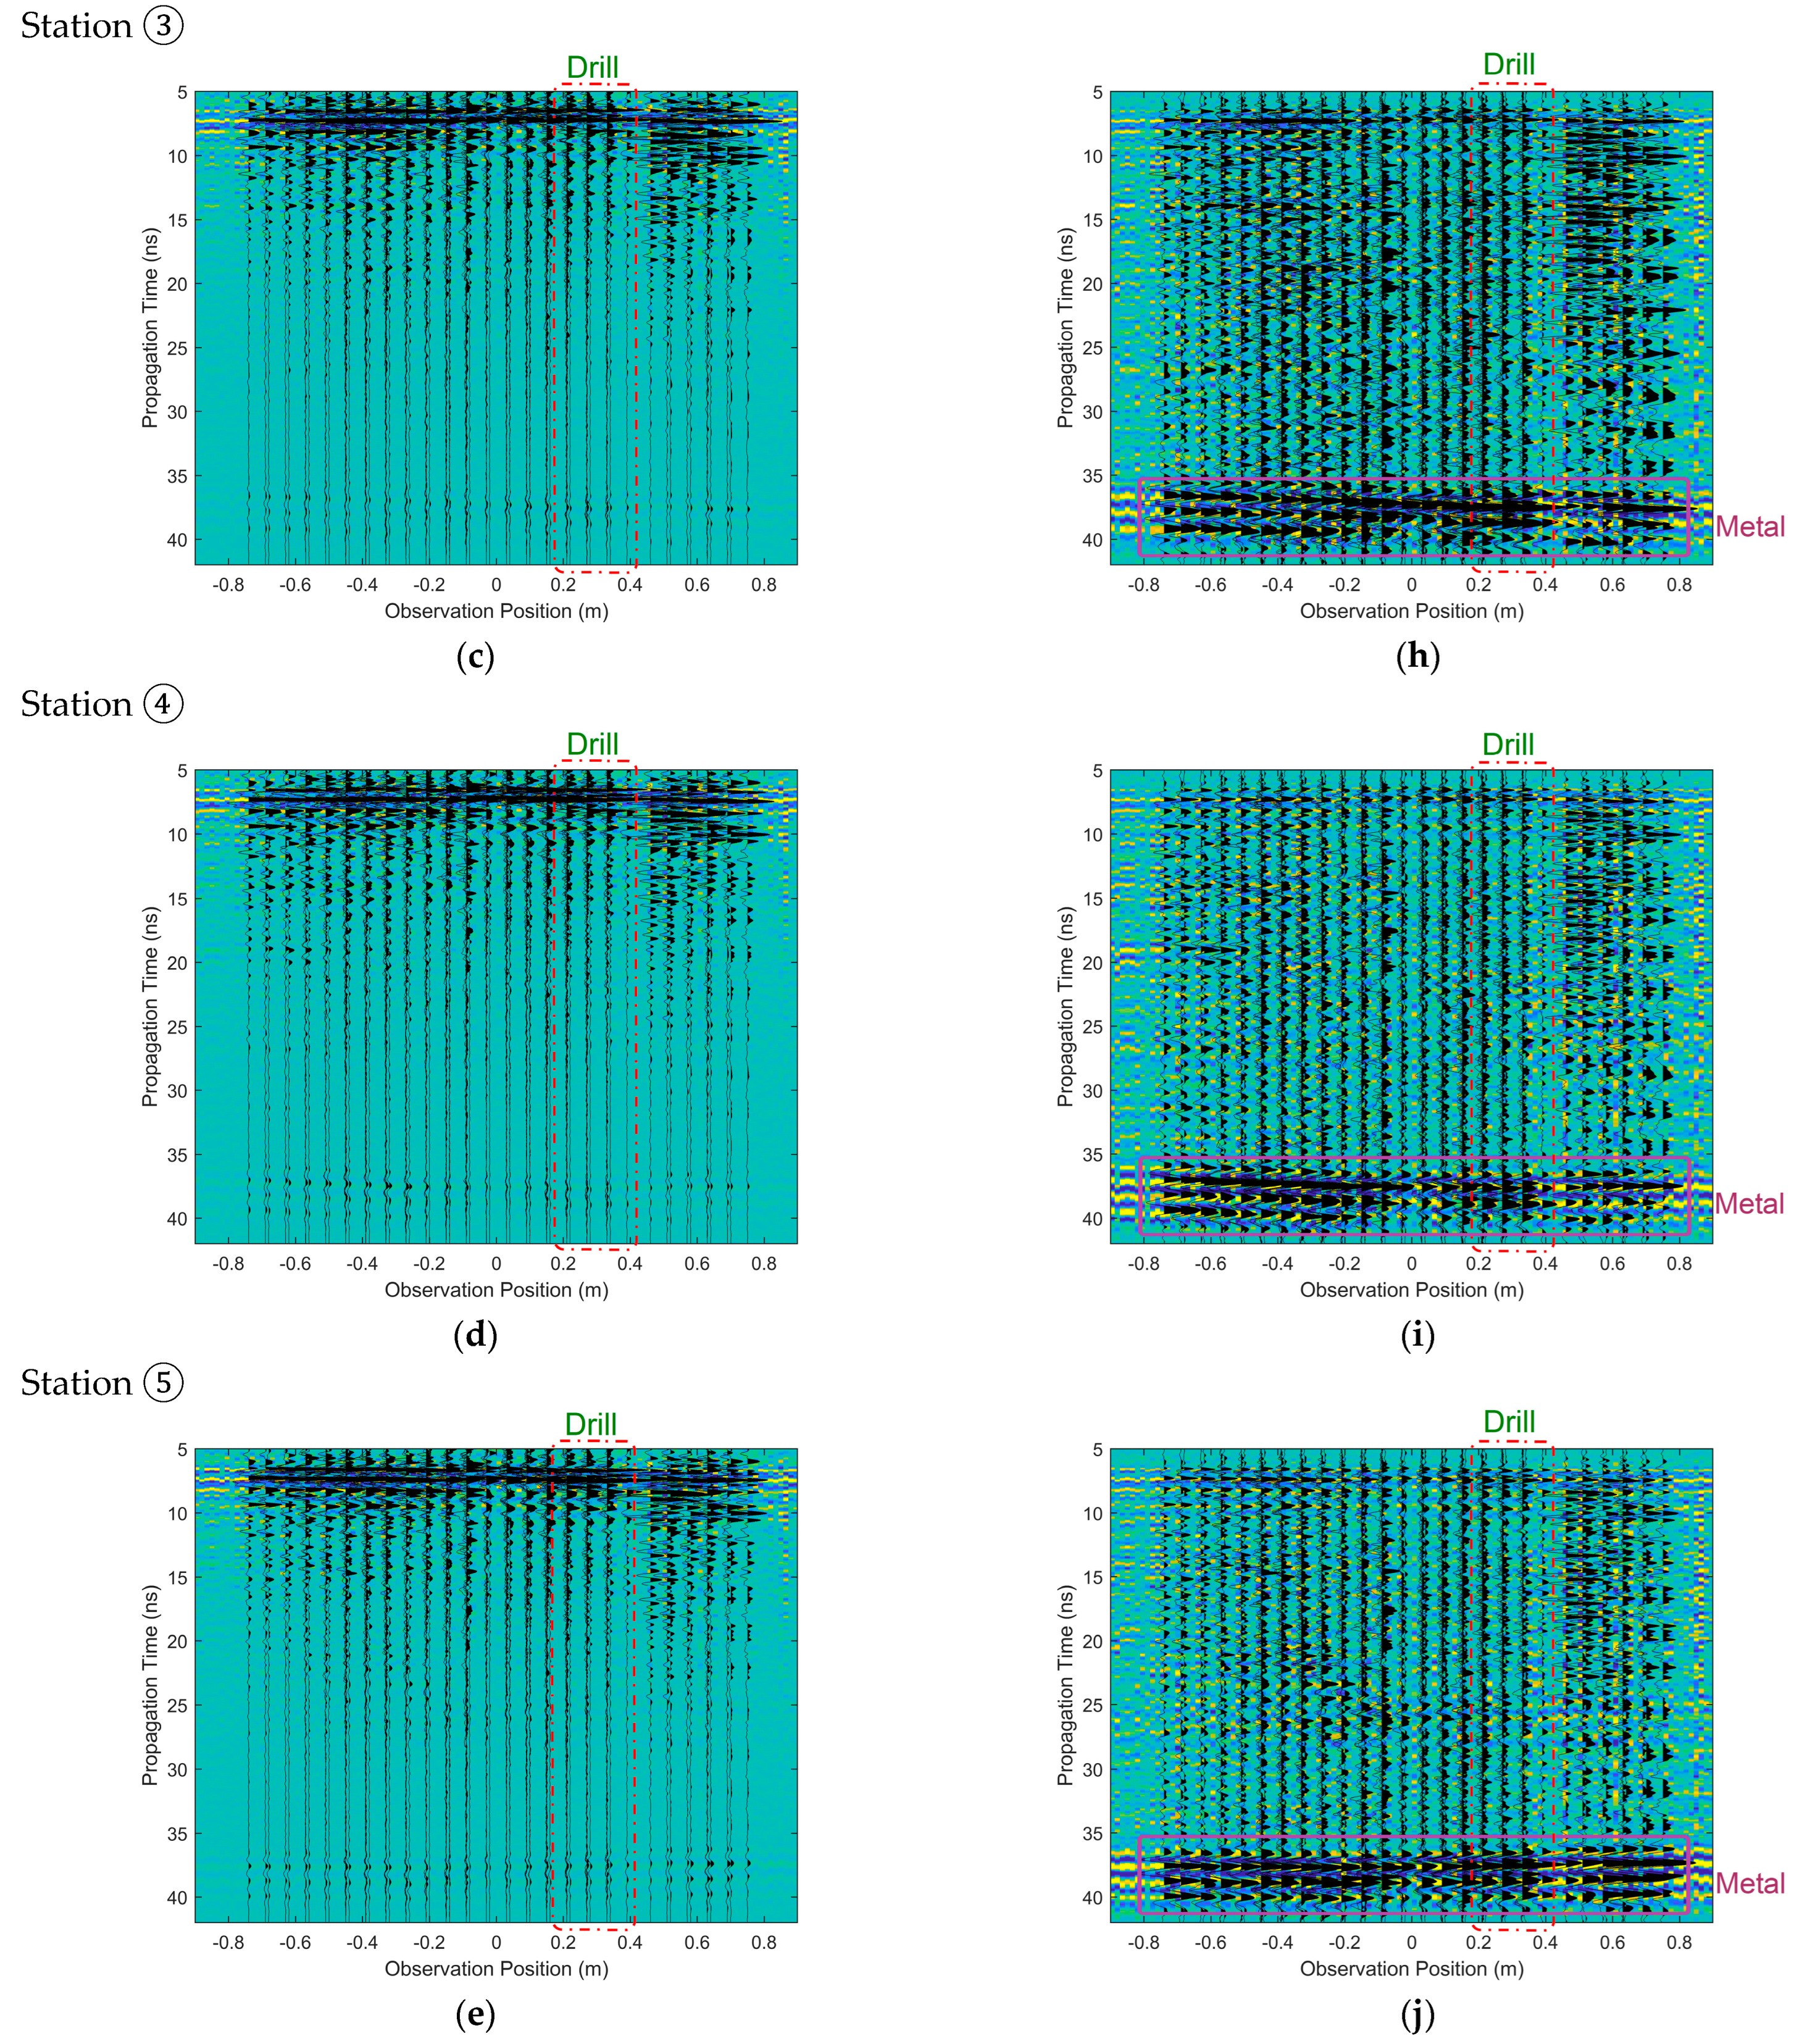
Meanwhile, the actual position can be recorded for the projection line. Regardless of both interface echoes and direct waves, we can construct the function relation with measured echoes g (treal) ↔ f (tproj). Based on measured echoes from the CE-5 lander, the interface echoes exist between 6 and 9 ns, as shown in Figure 8a–e. Due to the rapid attenuation and little energy from the echoes, it is difficult for us to identify the data after 15 ns. Moreover, it can be seen that the Vivaldi antennas can effectively capture electromagnetic echoes underneath the drill. As reflected in Figure 8f–j, the metal plate appears when t = 36~40 ns on the case of the projection function f (tproj). After the echoes’ amplification, there is a mess in the measured data due to mixing various noises, but as some datasets exist under the metal drill, we still adopt the initial measured data to implement the RTM imaging and distinguish all the unknown objects that are buried in the volcanic ash.

4. Subsurface Imaging for Measured Data from CE-5 Lander

By directly analyzing measured data from the CE-5 lander, we merely identify objects in shallow layers in the station ①. For other objects in deeper areas, it is hard to discover the actual positions of subsurface objects in terms of initial or optimal measured echoes. To successfully carry out the collection of lunar soil, we must ensure the metal drill remains without damage. As the retention time of the CE-5 on the lunar soil surface is extremely finite in the more complicated lunar environment, the lunar soil imaging needs to be implemented in a short time once obtaining the measured data.
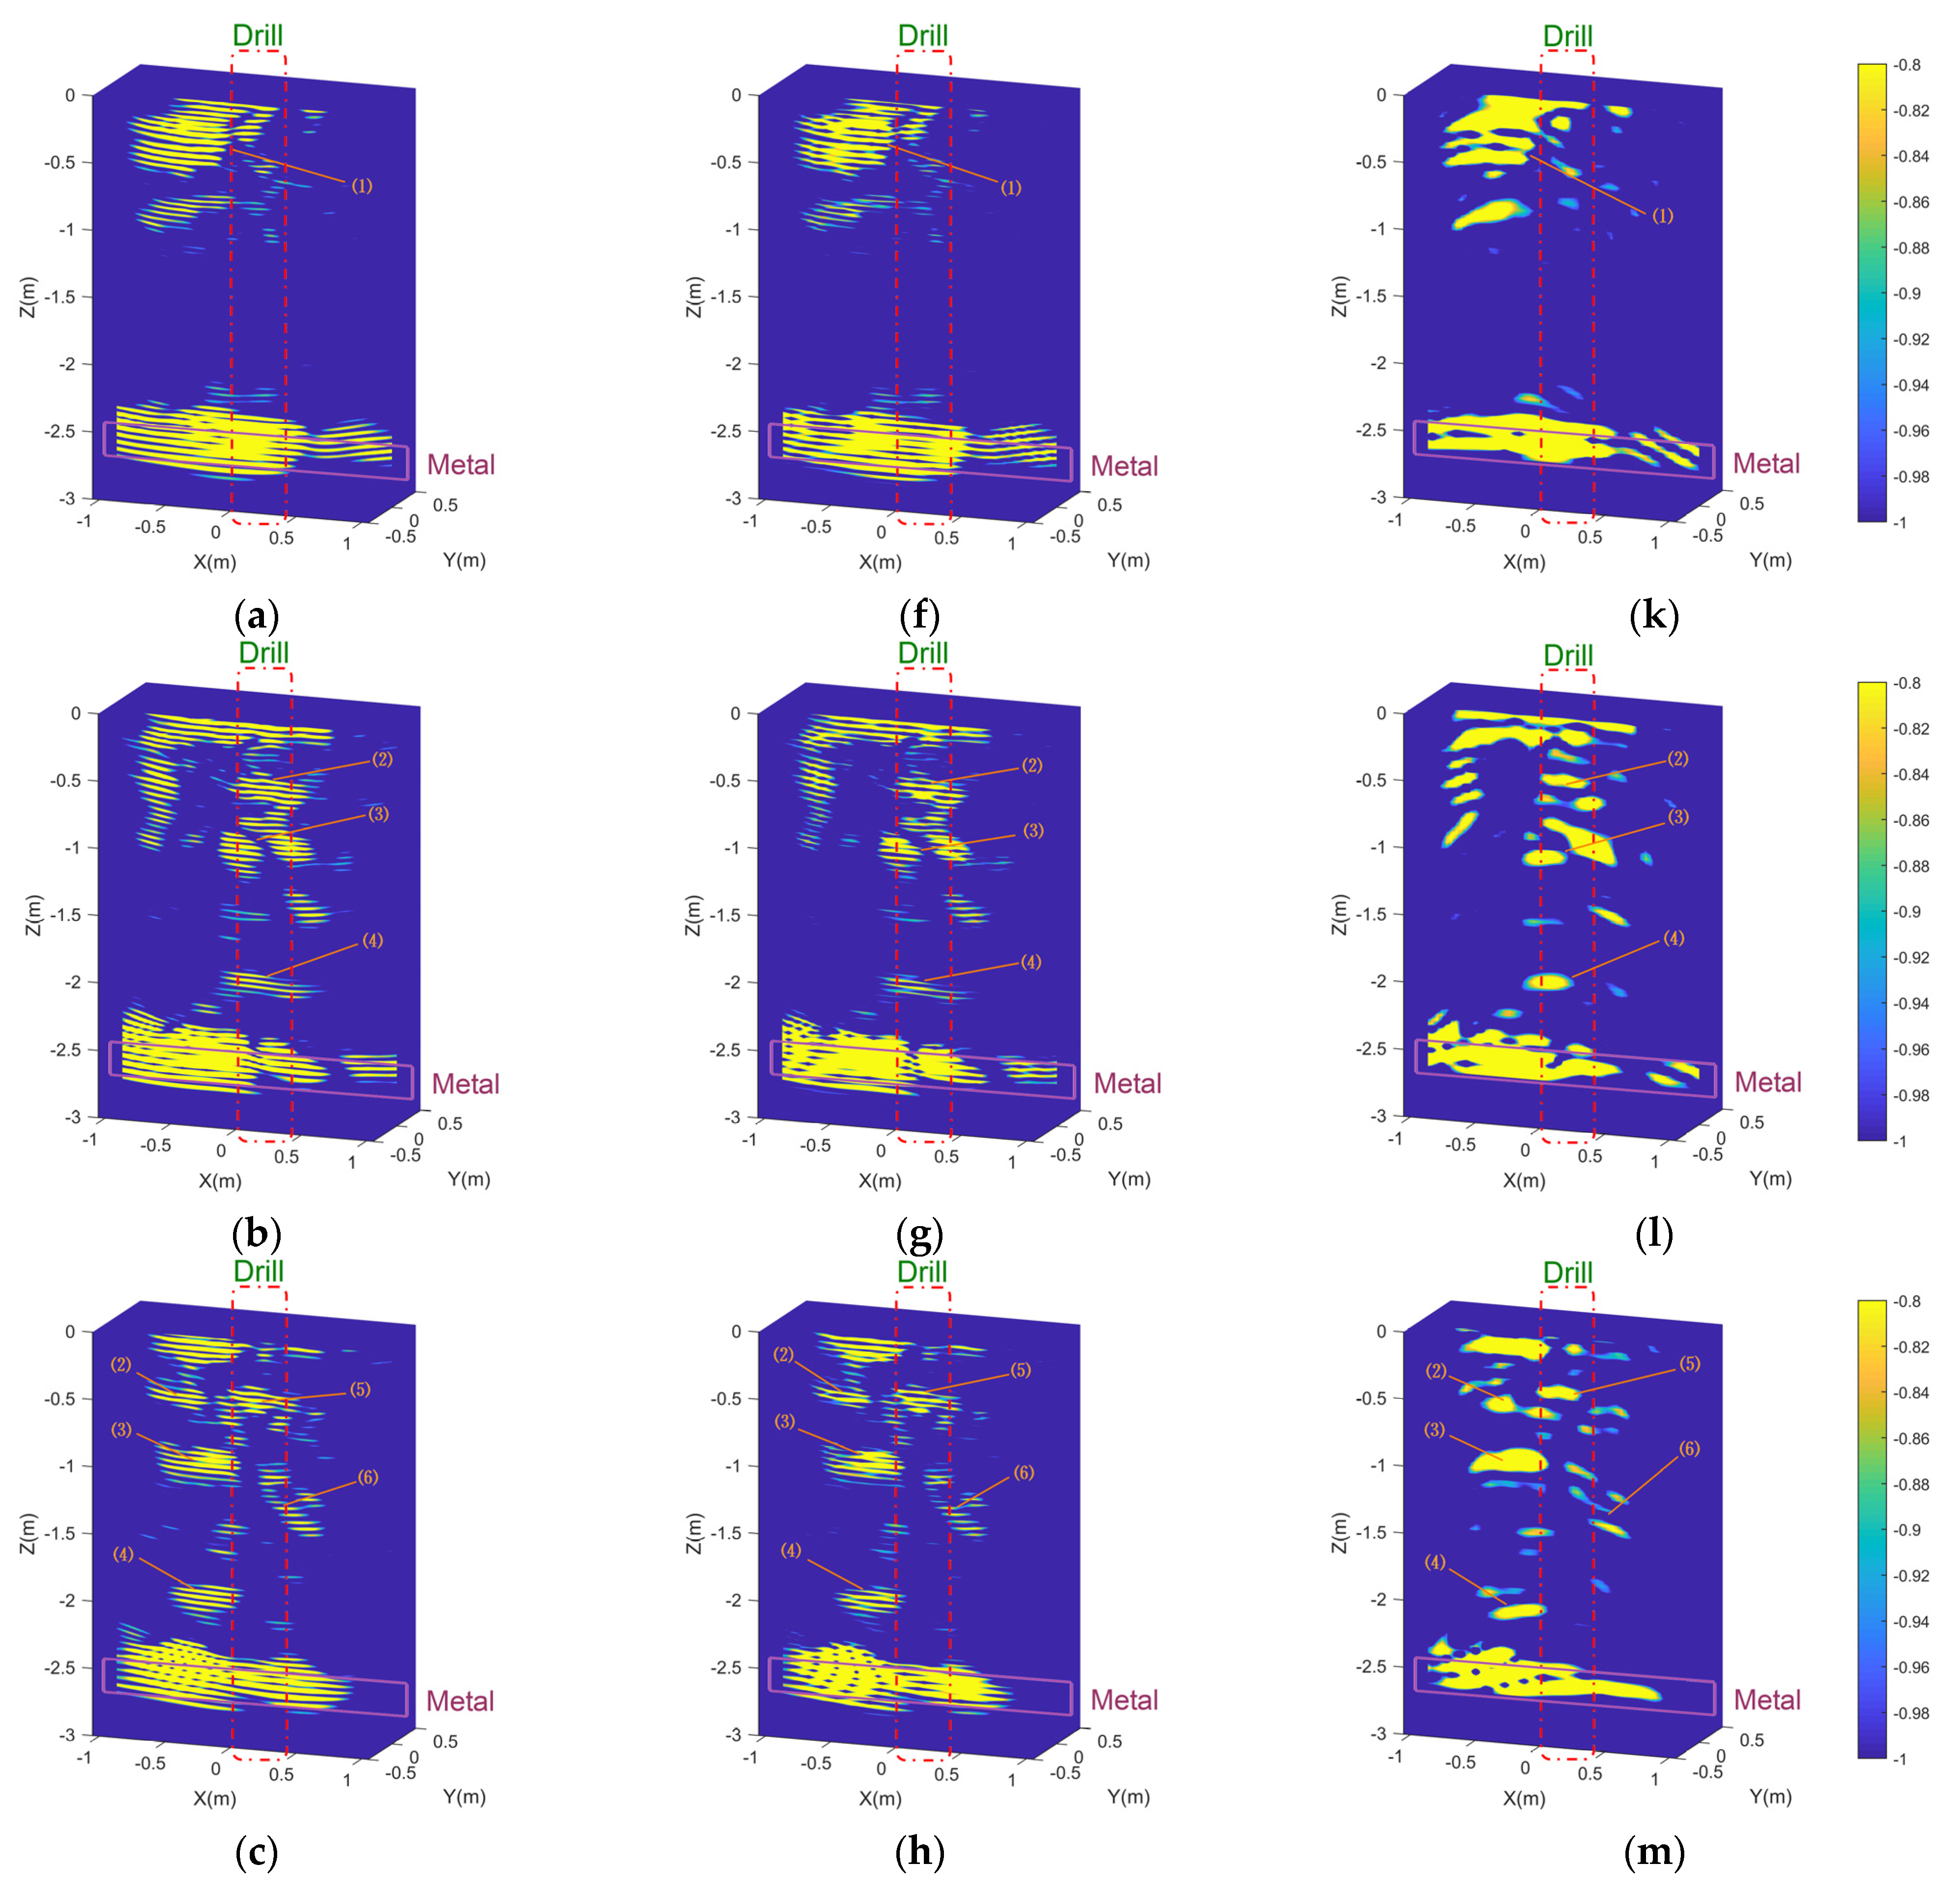
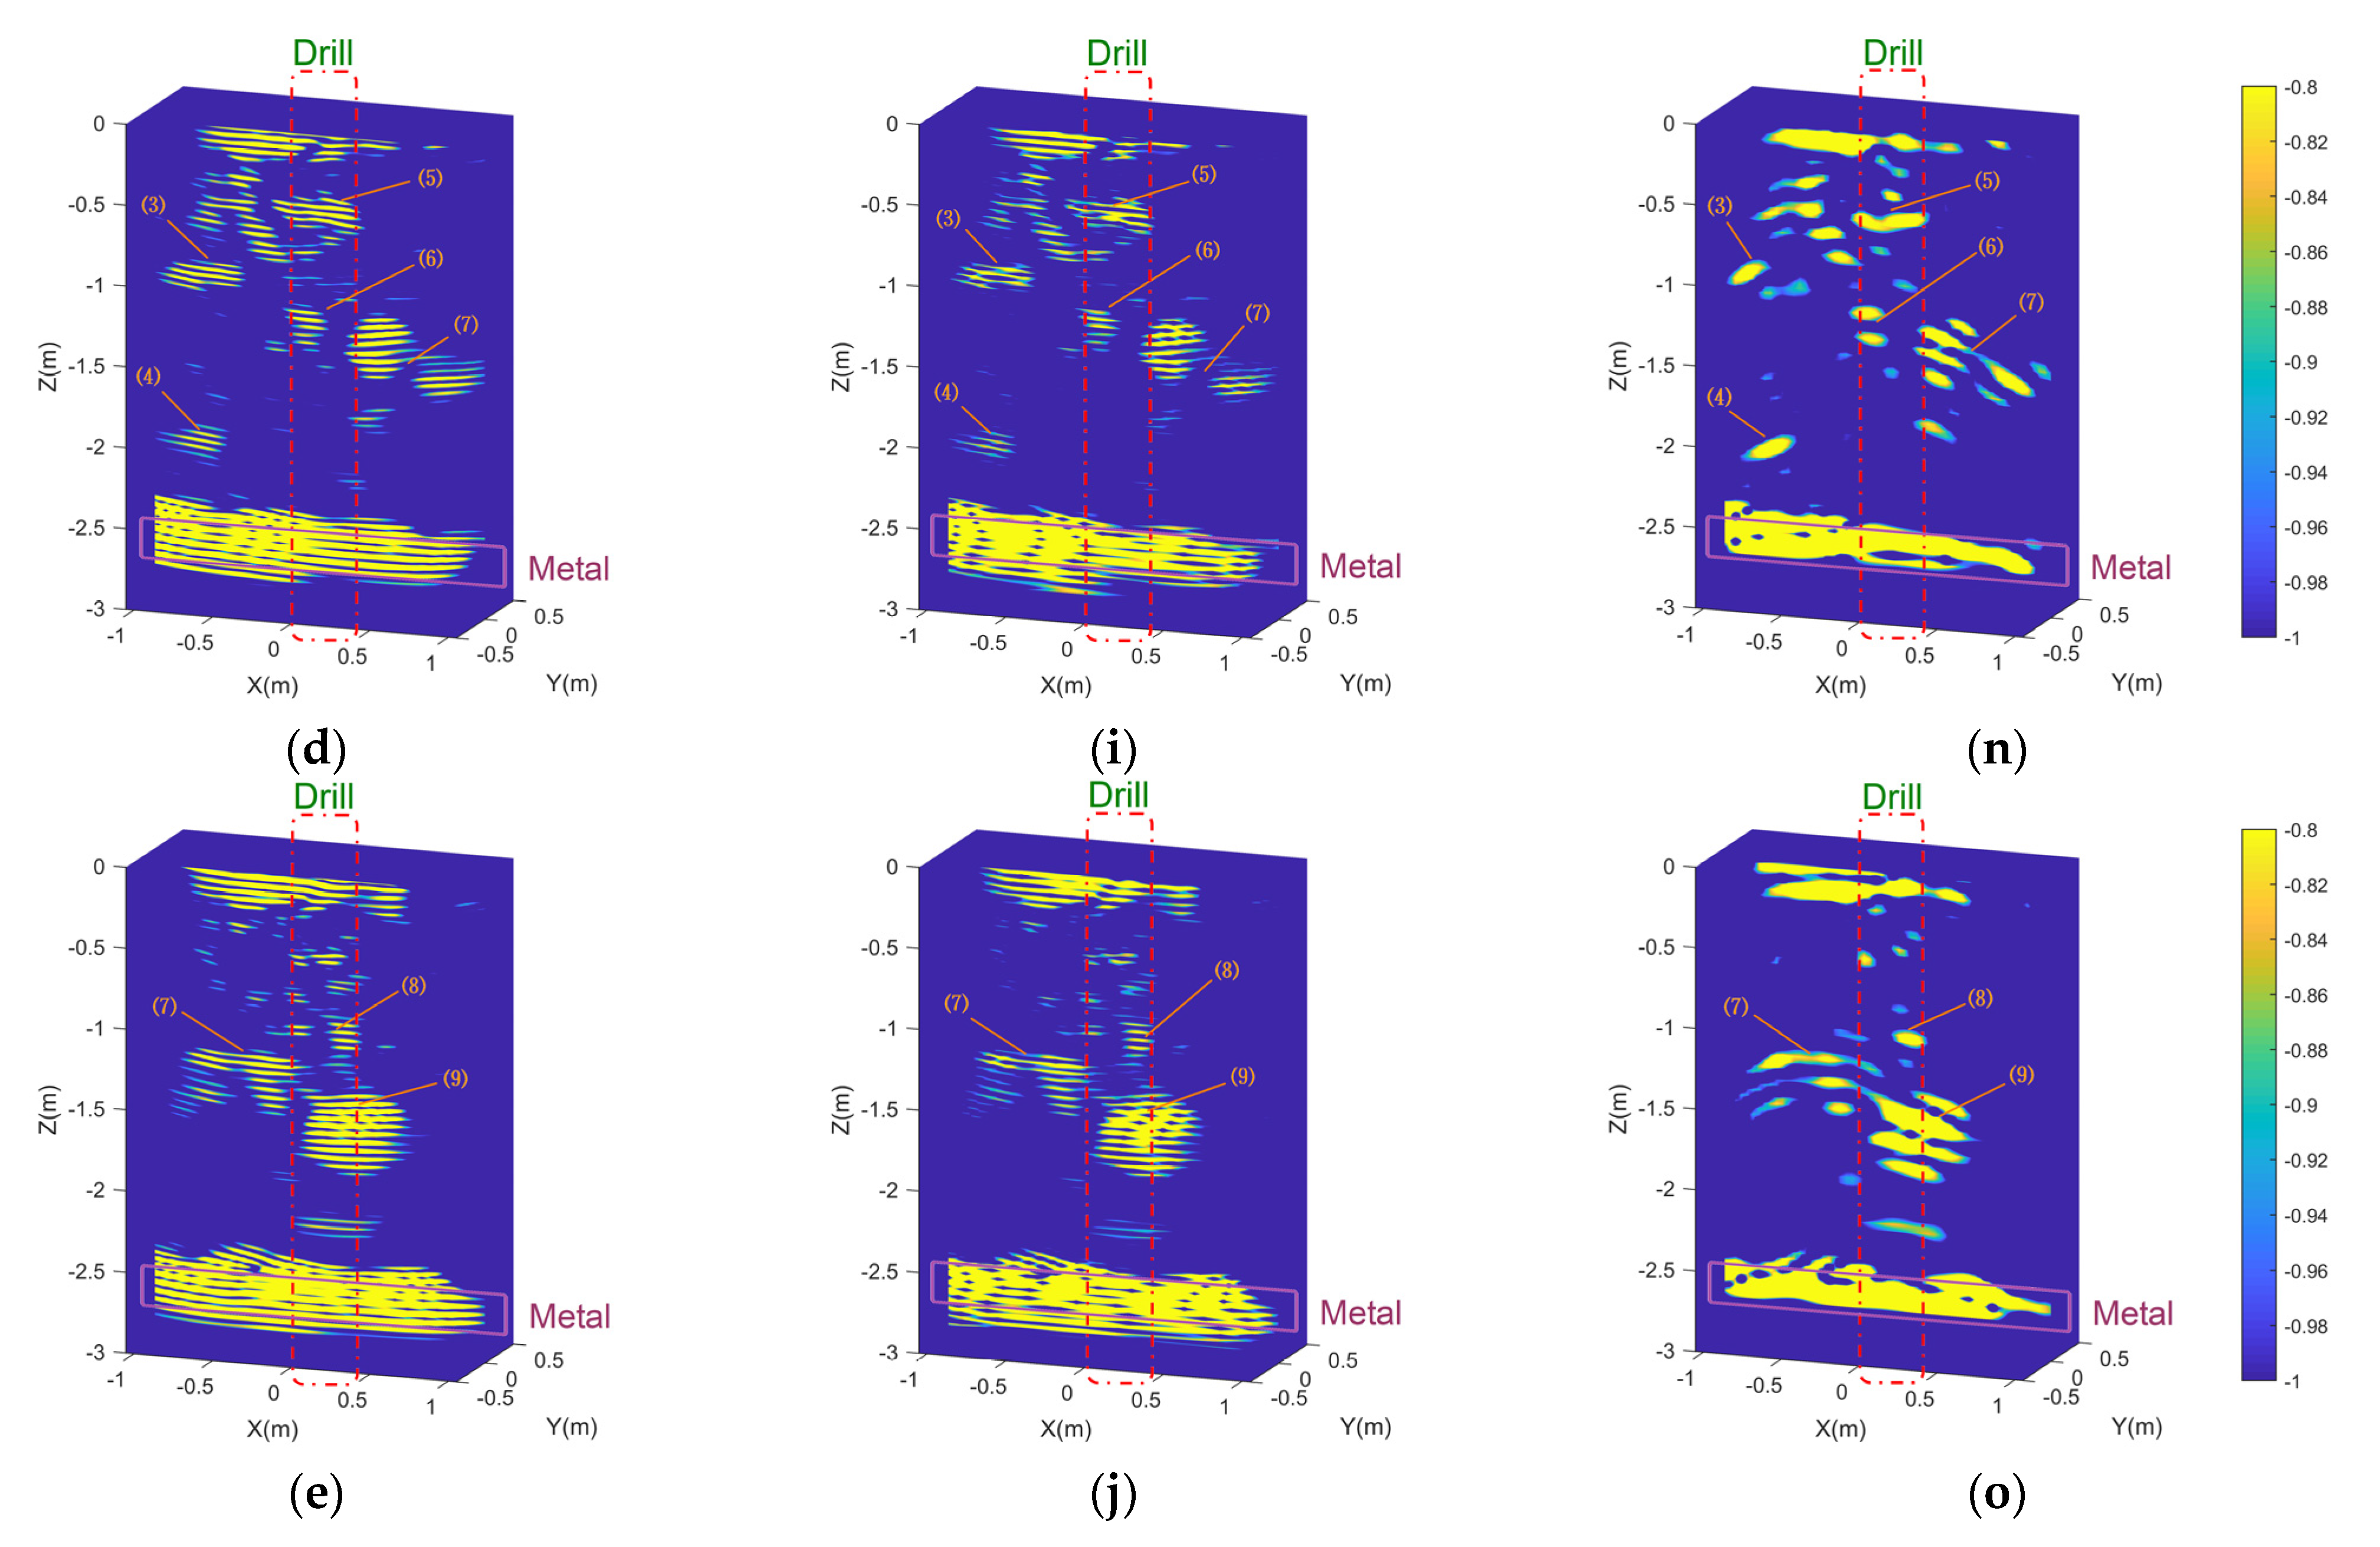
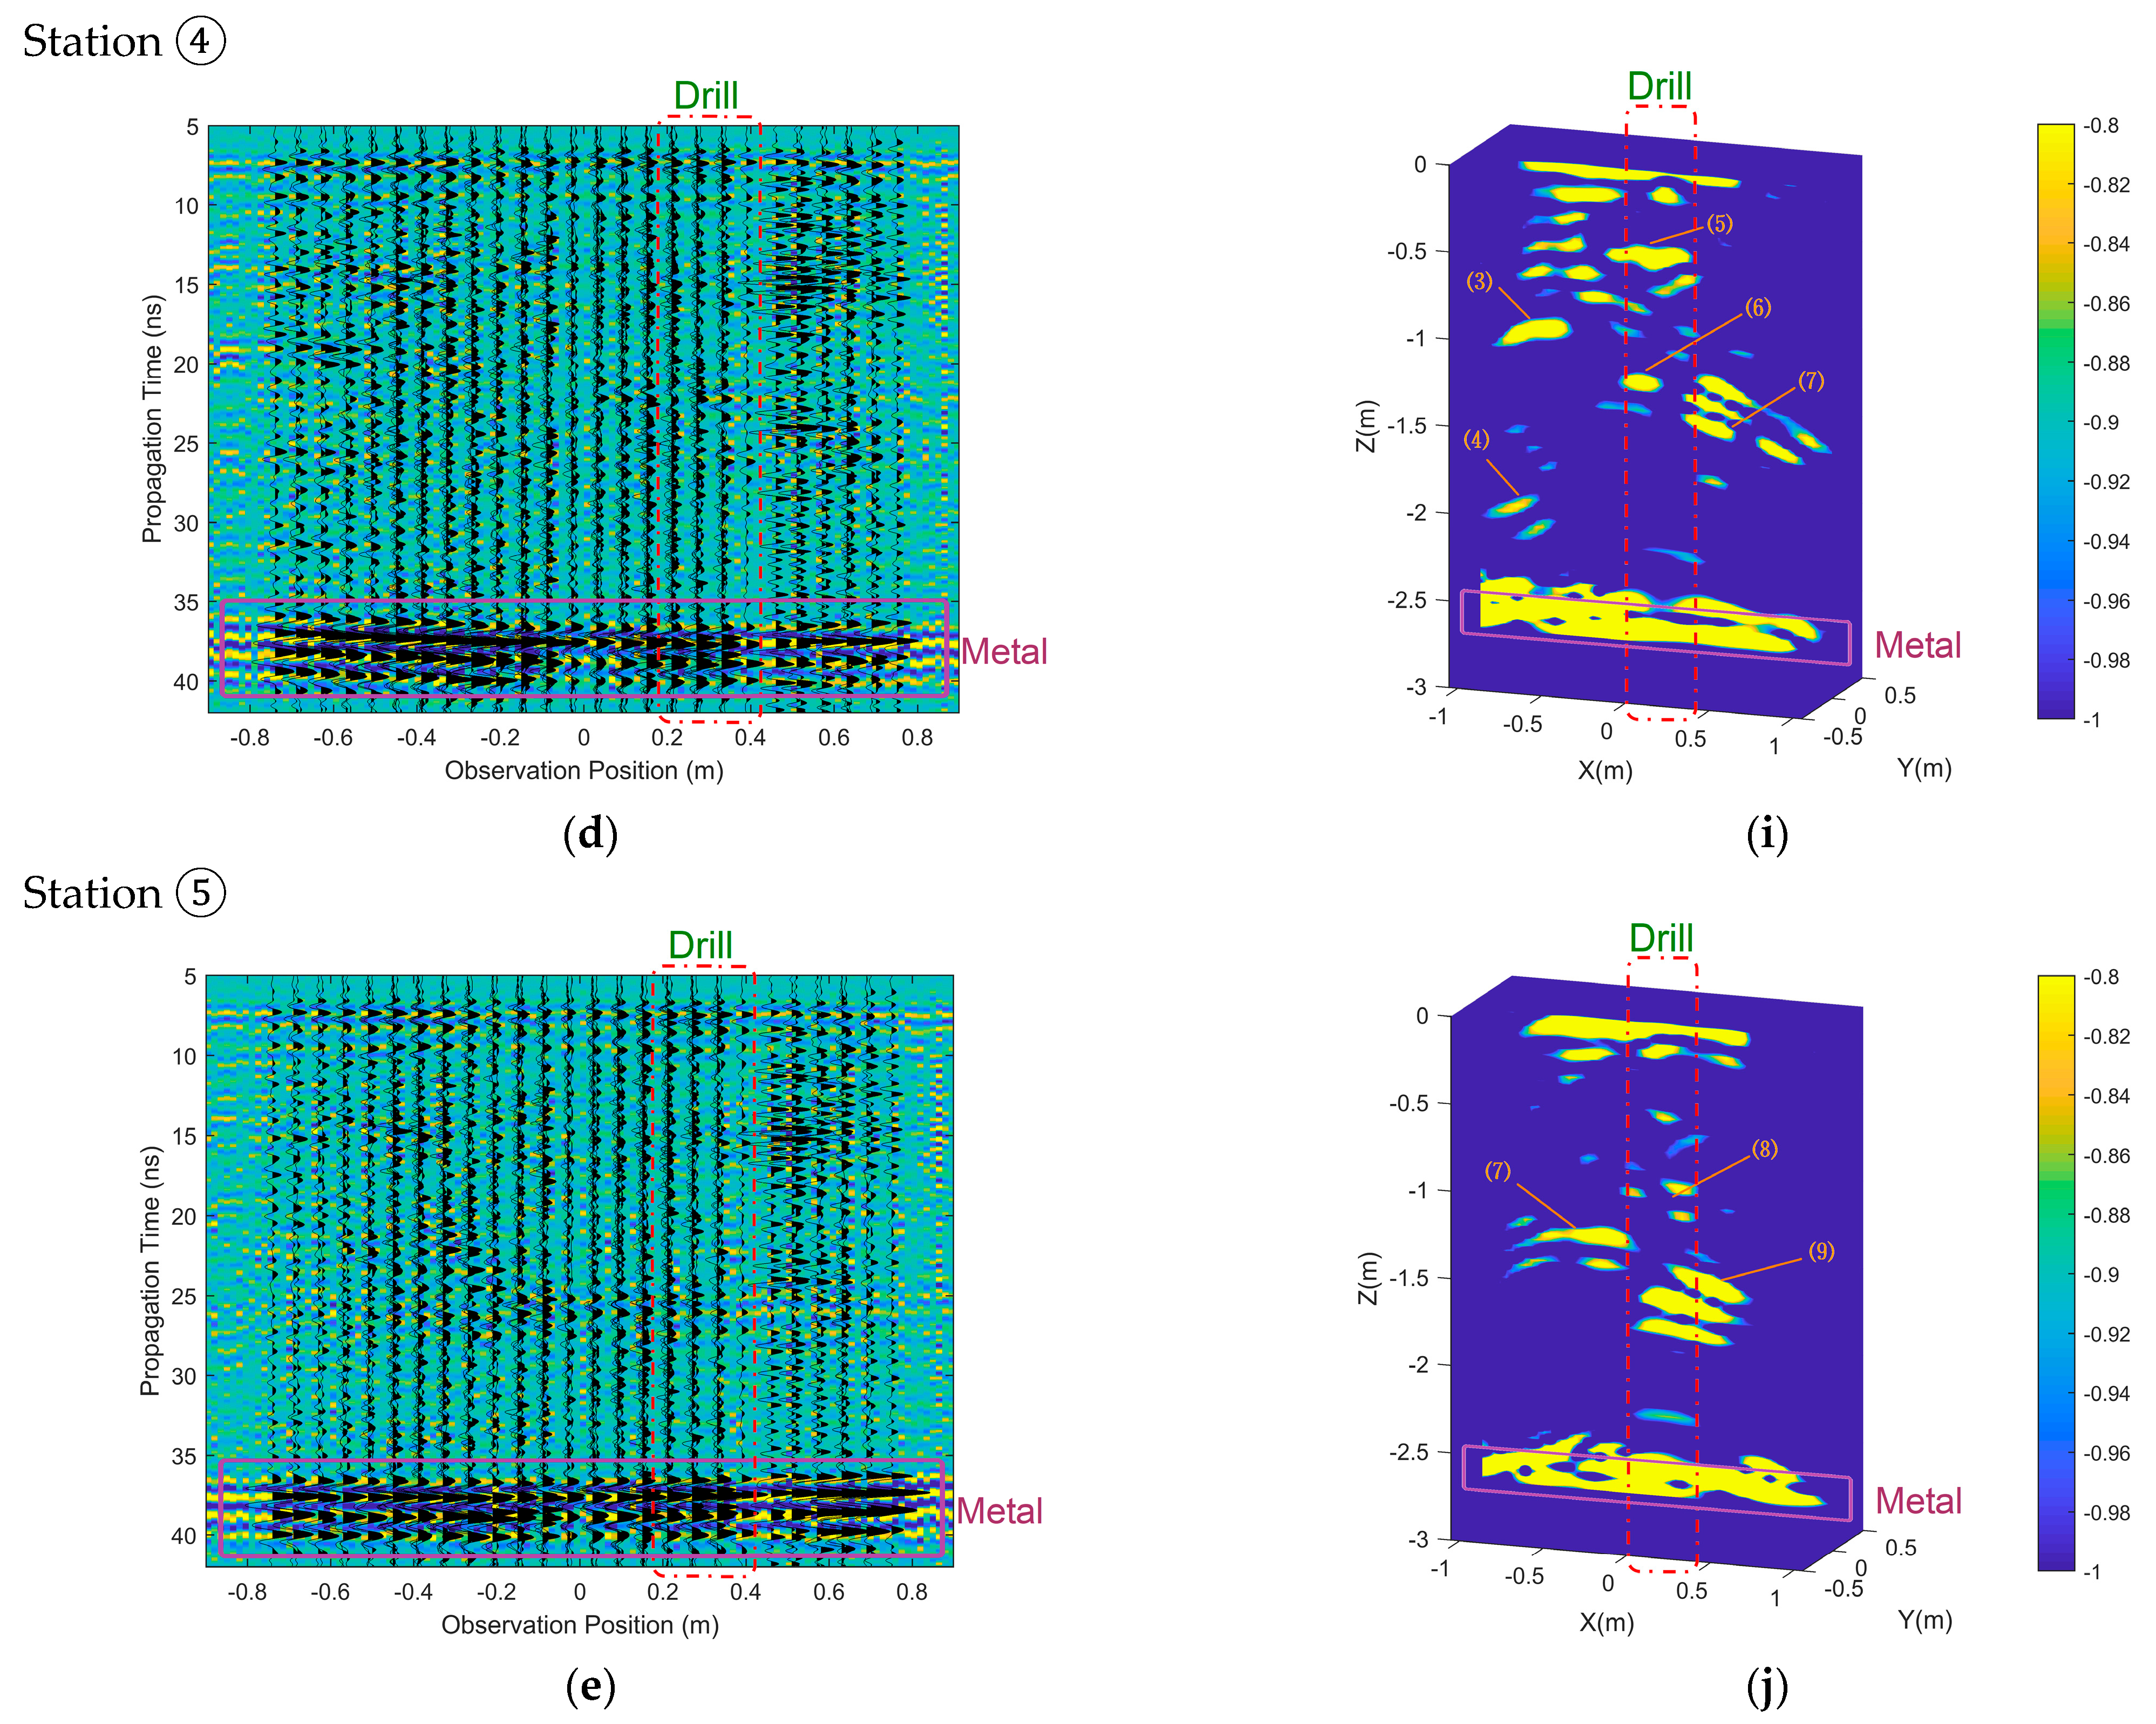
Combined with initial measured data for five stations from the CE-5 lander, the C-FDTD, HO-FDTD, and PSTD methods, as the underlying codes, are applied to acquiring the RTM imaging, as seen in Figure 9a–e, Figure 9f–j, and Figure 9k–o, respectively. It can be seen in Figure 9 that the rough positions of buried hard objects can be discovered after the RTM process with the five stations’ measured data, which correspond to similar labels in Table 2.
As illustrated in Figure 9a,f,k, the measured echoes of station ① are mainly applied in the shallow layer area, which verifies that the position of object (1) has a big deviation for the metal drill. With different material properties underneath the drill, as reflected in Figure 9b,g,l, both the 11th and 12th antennas can effectively enhance the imaging, which is consistent with the previous conclusion to find the object (2)–(4). The measurements of station ③ and ④ mainly focus on identifying the multiple objects (2)–(7), which we can therefore observe in Figure 9c,h,m and Figure 9d,i,n, respectively, and ensure corresponding coarse positions of uncertain areas explored by the CE-5 lander. According to the imaging results from station ⑤, it can be seen that a shorter distance exists among objects (7)–(9), so we can successfully predict the reliability in transverse distributions.
As exhibited in Figure 9, imaging patterns are somewhat different due to the different spatial sampling density served in these three methods, but consistent identifications can be achieved for the buried hard objects in the volcanic ash. To further discuss the computational efficiencies, we can understand with great satisfaction that the PSTD method can set a smaller spatial sampling density as compared with the C-FDTD and HO-FDTD methods in Table 3. Therefore, using a smaller spatial sampling density, the PSTD-RTM method can save major computational resources, thereby occupying far less memory and time, e.g., 21.50% and 4.673% of the HO-FDTD-RTM, and 6.312% and 0.9843% of the C-FDTD-RTM. Due to less mesh, higher efficiencies can be achieved in predicting more general subsurface situations in the lunar soil using the CE-5 measurements.

5. Discussions in Frequency-Domain Analysis of Measured Data and Corresponding Imaging

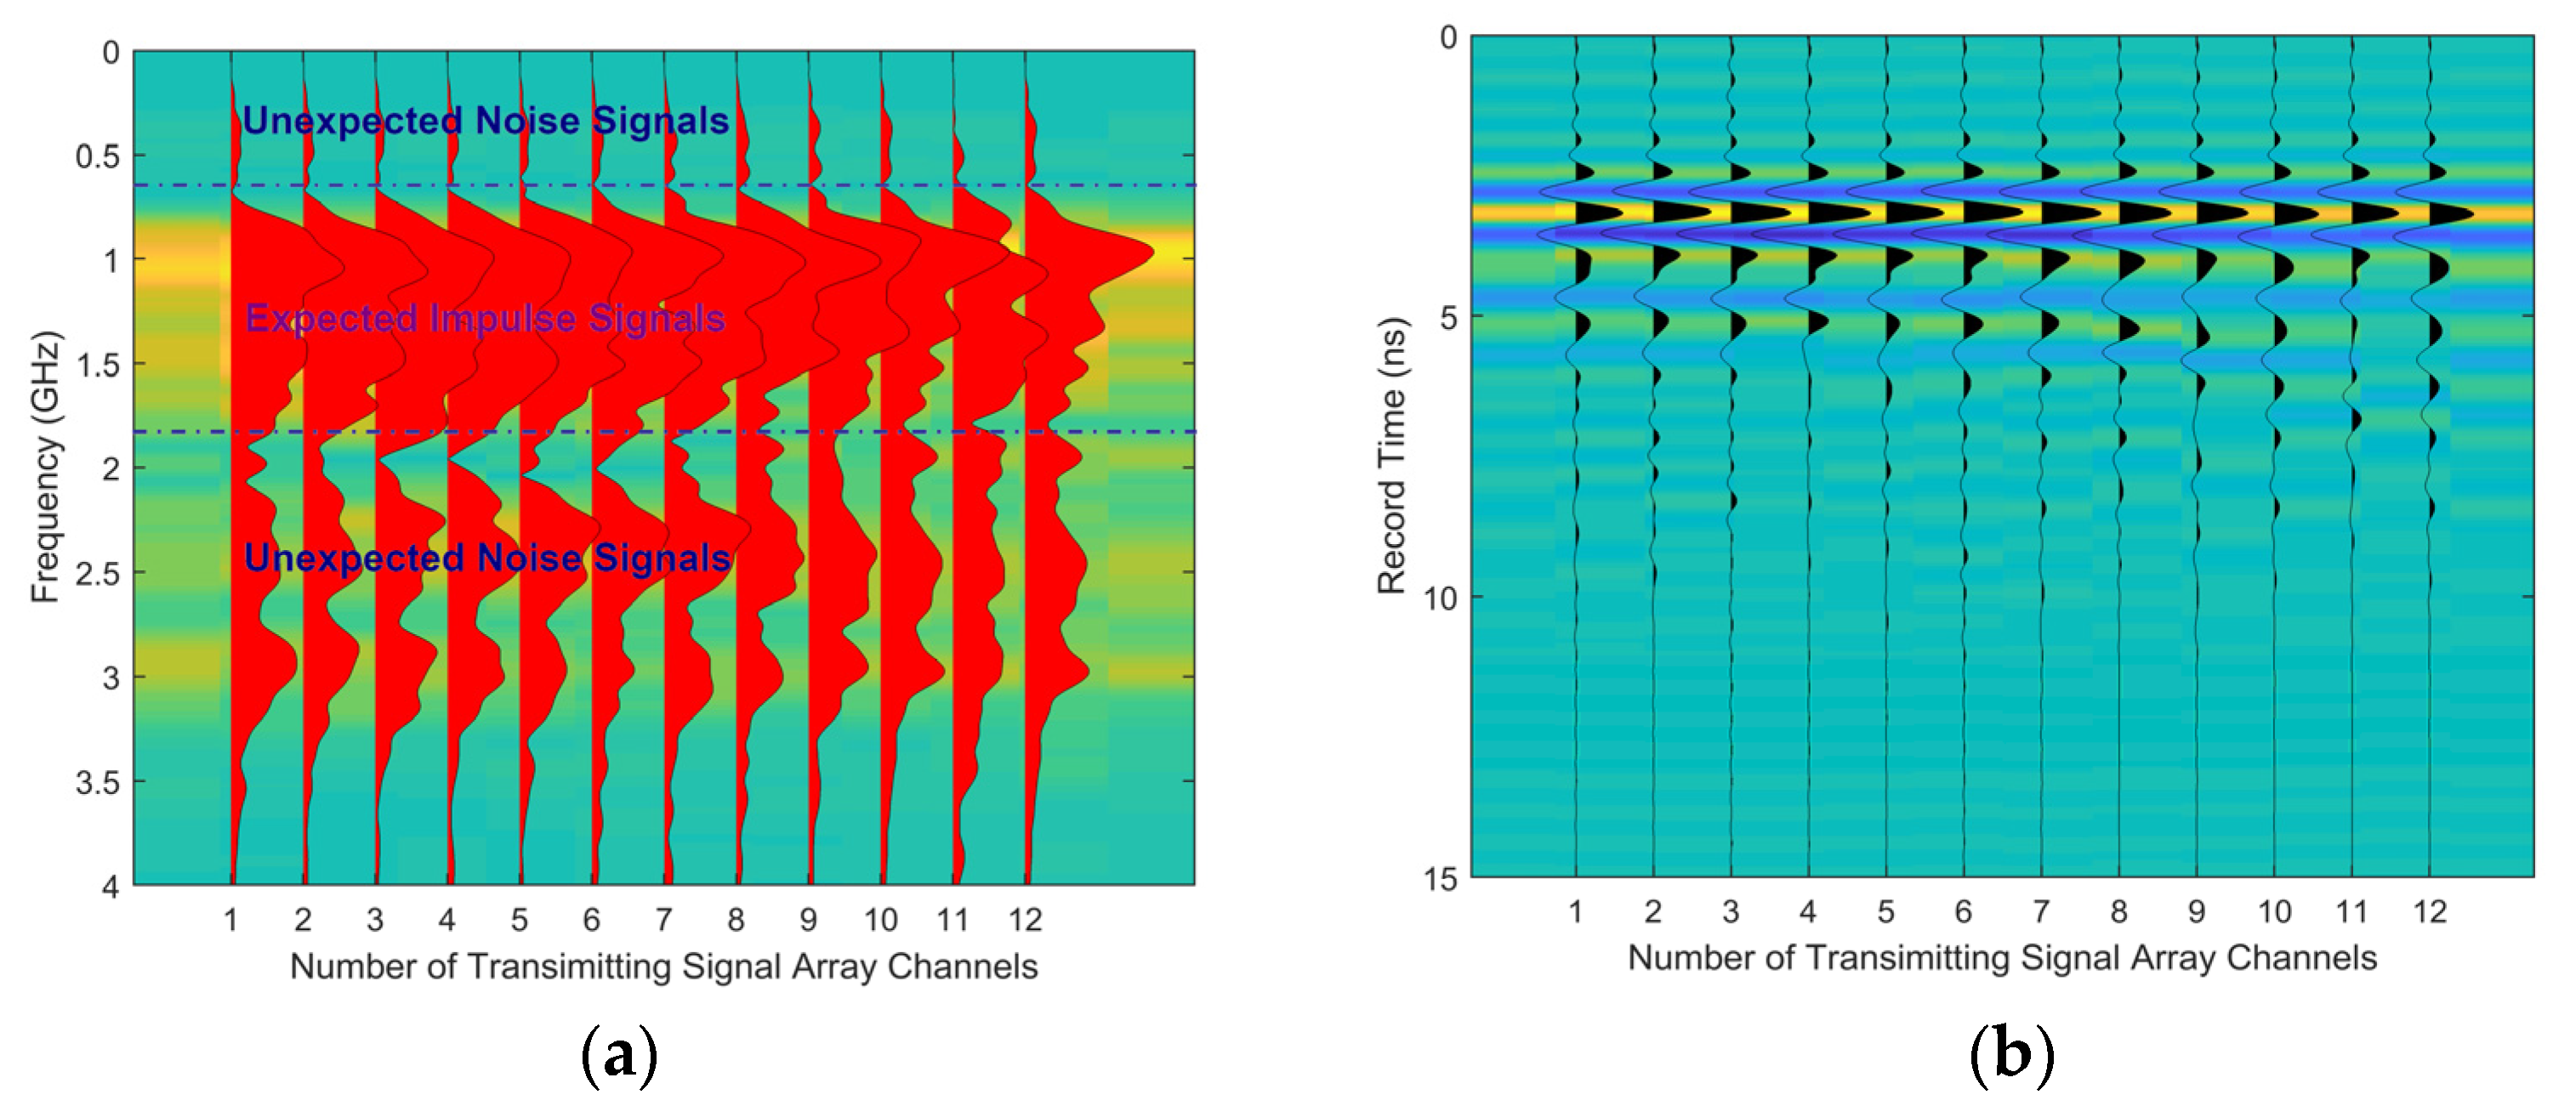
As known to all, numerical algorithms have a certain scope of application, and the time-domain forward algorithm is no exception. The time-domain electromagnetic impulse always contains wide spectra, which can require superimposition in all the frequencies to restore the signal. After the FFT computation, we can easily capture the corresponding spectrum, as shown in Figure 10a, from the 12 emission signals.
The maximum amplitudes are all located close to 1 GHz. Due to the skin effect in the electromagnetic propagation, the waves in lossy media attenuate very fast in higher frequency points. Therefore, some higher-frequency spectra affect the echoes back into the CE-5′s received antennas. As a matter of fact, lower-frequency spectra are inevitable from the circuit devices, which also have some noise interference for the RTM imaging. According to the spectra in Figure 10a, we distinguish the higher from the lower frequency, build the spectral window from 0.6 GHz to 1.8 GHz, and obtain 12 new channels’ transmitted signals by the IFFT, shown in Figure 10b. As a result, emission signals radiated by the CE-5 are indeed almost the same waveforms, unless higher- and lower-frequency noise appears, leading to the obvious difference for measured waveforms shown in Figure 5.
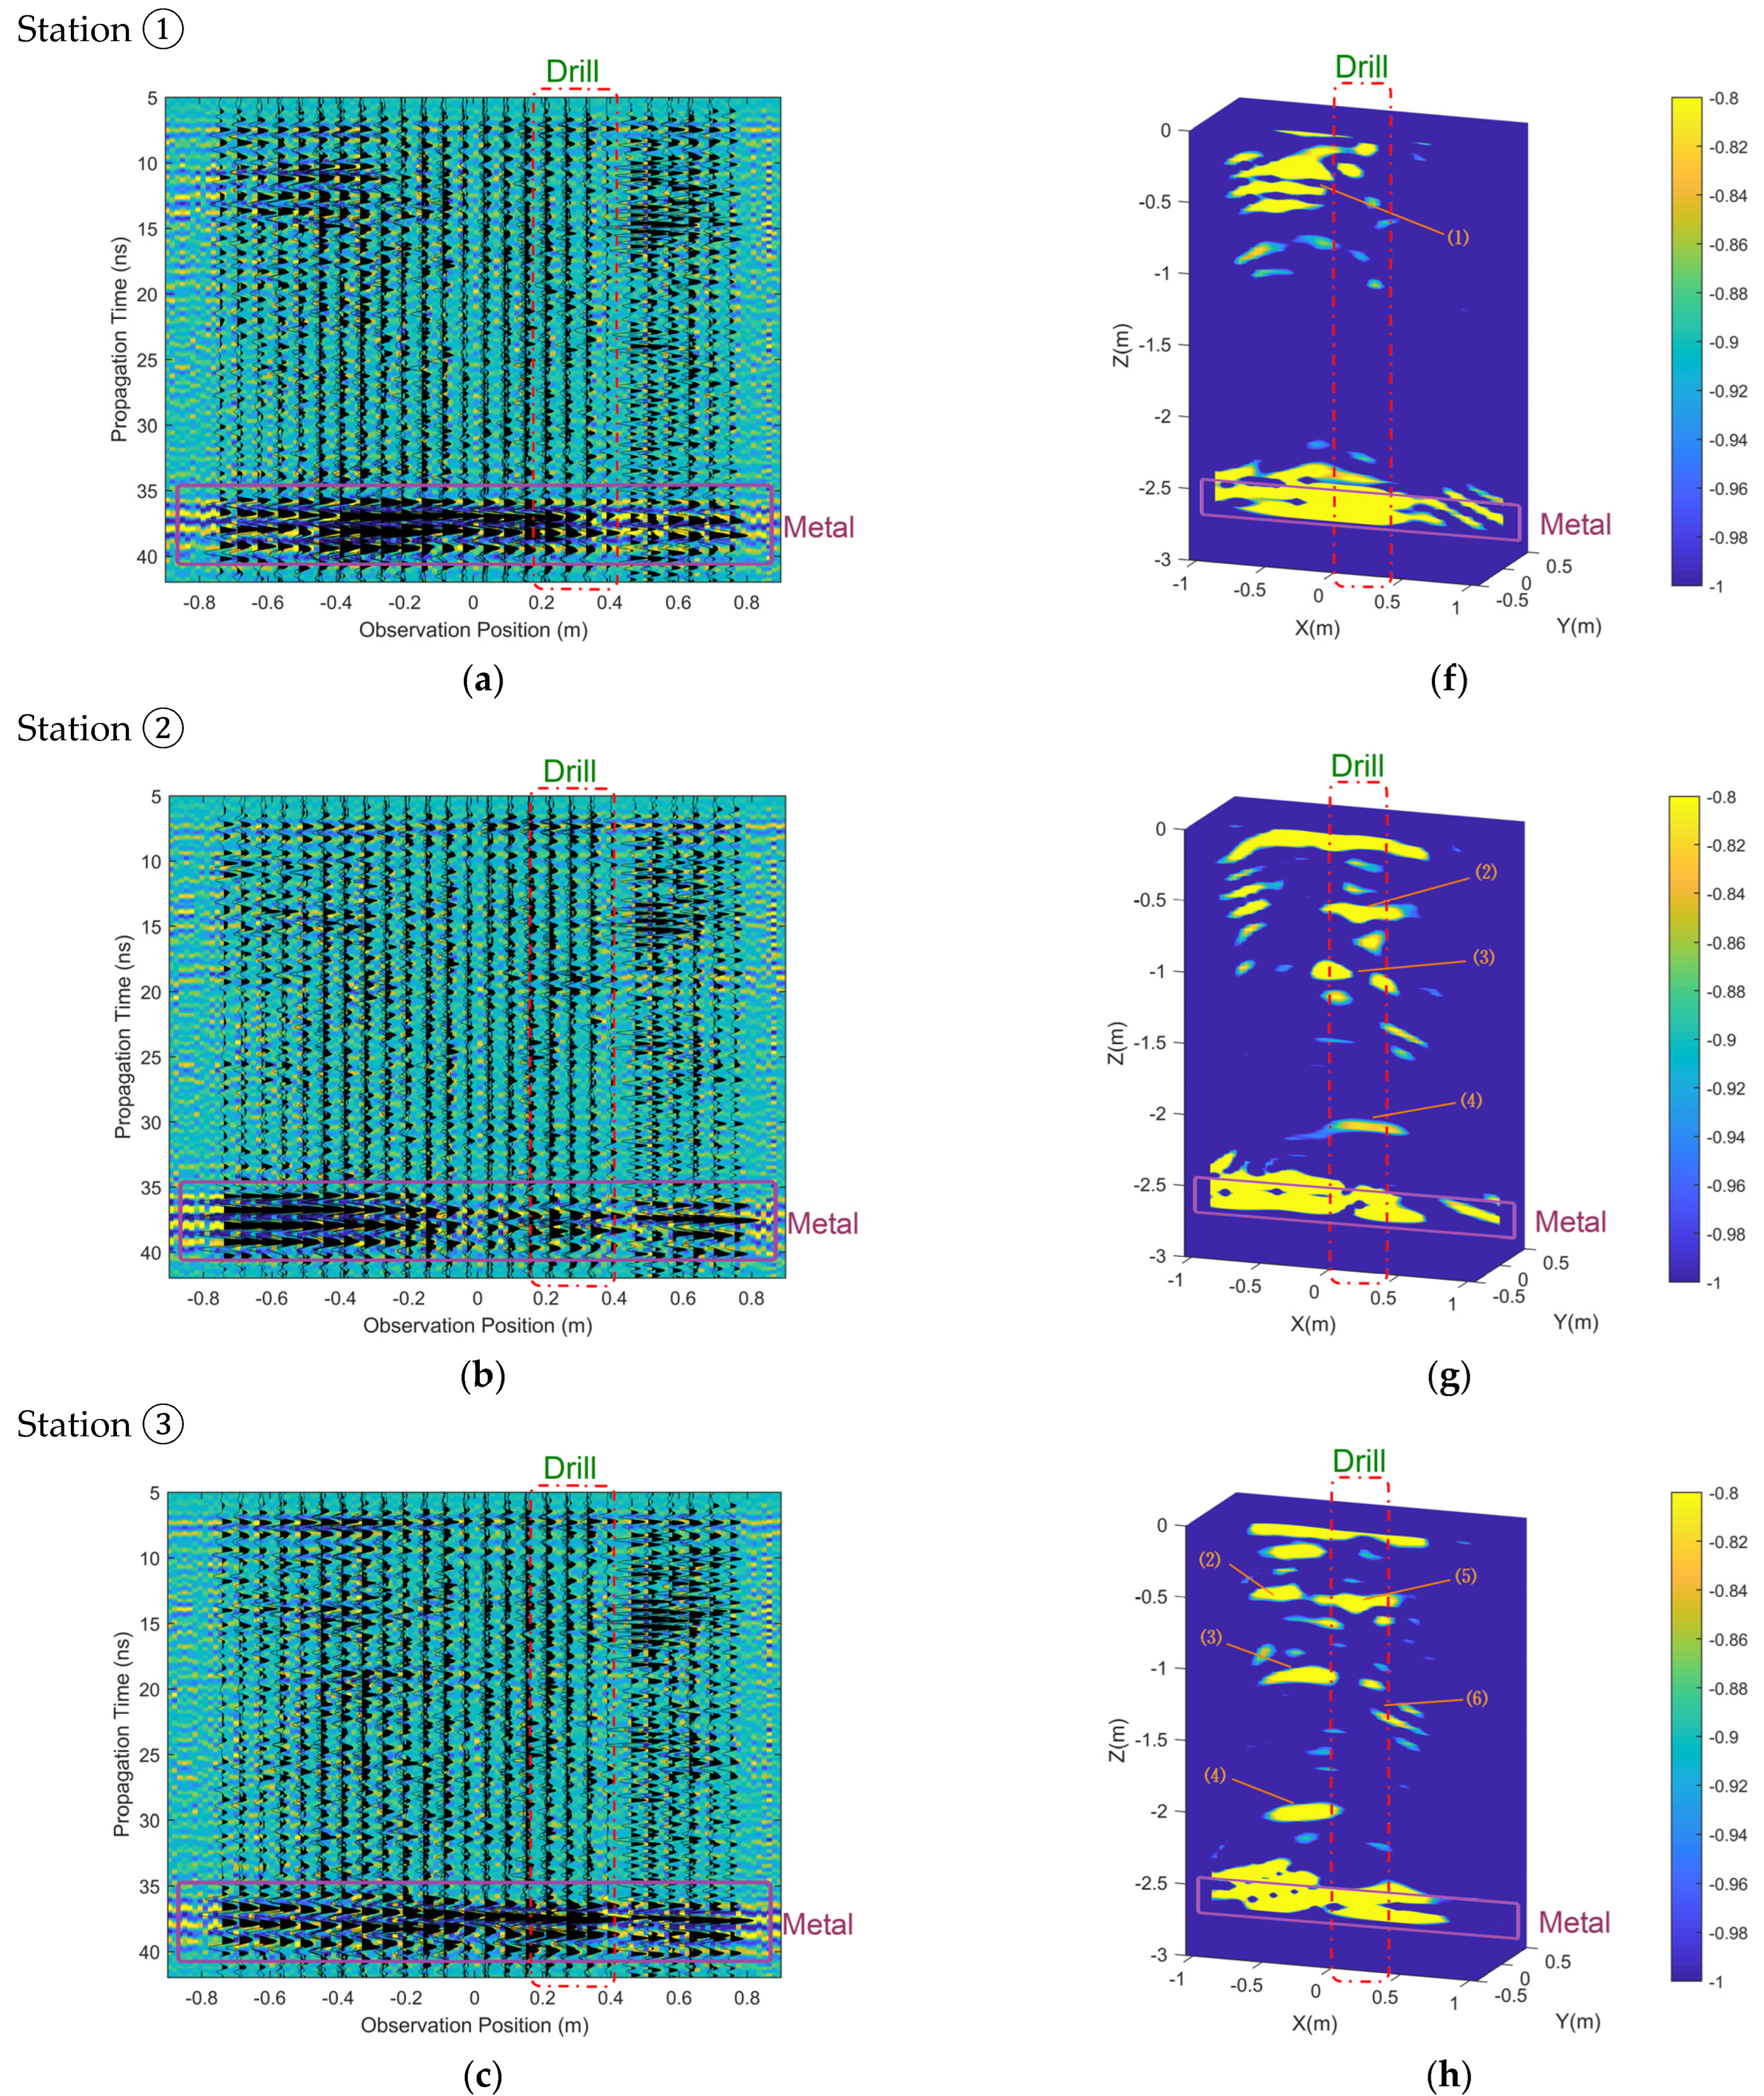
For dealing with stationary electromagnetic fields, the propagation still maintains the single fixed frequency. The measured echoes from the five stations can be processed by the same spectral window. As reflected in Figure 11a–e, the bottom metal plate can still be identified out. Other than the shallow object in station ①, which is easily found, other objects must be identified by the RTM imaging because of the complex echoes’ superposition. As shown in Figure 11f–j, the actual positions of the buried hard objects are discovered more specifically than the original imaging in Figure 9k–o.
As we know, all algorithms have a certain scope of application, and the time-domain forward algorithm is no exception. Compared with Figure 9k and Figure 11f below, we can see that Figure 9k has false imaging at the Z = −0.9 m, but Figure 11f has been attenuated at the same position. The target at Z = −0.3 m can be clearly found in both of them when we select the same colorbar range. We further make the comparison between Figure 9l and Figure 11g when keeping the same colorbar range. It can be seen that Figure 11g has less noise compared with Figure 9l. Hence, the sphere (2) and the brick (3) have more specific locations in Figure 11g. According to the brick (4), the specific shape can be formed at Figure 11g, but the original method with the noise still exists at the approximate location in Figure 9l. The application of data processing for further analysis is also very significant for the CE-5 lander to successfully finish its lunar exploration.

6. Conclusions

Applying all measured data captured by the CE-5 lander in the laboratory, we successfully implemented rapid imaging for an uncertain area with the depth of 2.5 m and identified the unknown objects in the large-area volcanic ash, which benefits the soil collection to be brought back to our Earth in the foreseeable future, especially from other planets. After in-depth research, it can be concluded that electromagnetic echoes can be received underneath a drill, which reminds us of the hark rocks that affected lunar-soil acquisition for the CE-5 mission. In addition, the C-FDTD, the HO-FDTD, and the PSTD are applied, respectively, as the underlying codes to implement RTM imaging. The PSTD-RTM method can achieve more efficient and rapid identification for those buried objects than the C- and HO-FDTDs’ RTM methods. Under circumstances of complex environment, the excellent effect of the PSTD-RTM imaging is achieved with the CE-5 lander based on measured data such as the emission signals and chaotic echoes by the spectral window. In the future, the PSTD-RTM imaging system will play a crucial role in the geological exploration of alien regions, in addition to the use of electromagnetic waves for imaging and detection.

Author Contributions

Conceptualization, G.X. and Y.Z.; methodology, N.F., G.X. and Y.Z.; formal analysis, Y.Z., G.X. and Z.H.; writing—original draft preparation, N.F., G.X. and Y.Z.; writing—review and editing, N.F., Y.Z., Z.H. and L.Y. All authors have read and agreed to the published version of the manuscript.

Funding

This research is funded by National Natural Science Foundation of China under Grant 62101333, U20A20164, and 61901274, the Natural Science Foundation of Guangdong Province under Grant 2020A1515011475, the Shenzhen Science and Technology Innovation Committee under Grant JCYJ20190808141818890, the University Stability Support Project of Shenzhen under Grant 20200813152750001, and the Open Fund of State Key Laboratory of Applied Optics under Grant SKLAO2020001A06.

Conflicts of Interest

The authors declare no conflict of interest.

References

  1. Xiao, L. China’s touch on the Moon. Nat. Geosci. 2014, 7, 391–392. [Google Scholar] [CrossRef]
  2. Qiu, J. Rising Start: Science is reaping the benefits of China’s investment in space. Nature 2017, 547, 395–396. [Google Scholar]
  3. Hand, E. China blasts off on lunar exploration. Nature 2007, 450, 12. [Google Scholar] [CrossRef] [PubMed]
  4. Lakdawalla, E. China lands on the Moon. Nat. Geosci. 2014, 7, 81. [Google Scholar] [CrossRef]
  5. Ling, Z.; Jolliff, B.L.; Wang, A.; Li, C.; Liu, J.; Zhang, J.; Li, B.; Sun, L.; Chen, J.; Xiao, L.; et al. Correlated compositional and mineralogical investigations at the Chang’E-3 landing site. Nat. Commun. 2015, 6, 8880. [Google Scholar] [CrossRef] [PubMed] [Green Version]
  6. Li, C.; Liu, D.; Liu, B.; Ren, X.; Liu, J.; He, Z.; Zuo, W.; Zeng, X.; Xu, R.; Tan, X.; et al. Chang’E-4 initial spectroscopic identification of lunar far-side mantle-derived materials. Nature 2019, 569, 378–382. [Google Scholar] [CrossRef] [PubMed]
  7. Liu, J.; Ren, X.; Yan, W.; Li, C.; Zhang, H.; Jia, Y.; Zeng, X.; Chen, W.; Gao, X.; Liu, D.; et al. Descent trajectory reconstruction and landing site positioning of Change’E-4 on the lunar side. Nat. Commun. 2019, 10, 4229. [Google Scholar] [CrossRef] [Green Version]
  8. Salvi, S.; Cinti, F.R.; Colini, L.; D’addezio, G.; Doumaz, F.; Pettinelli, E. Investigation of the active Celano-L’Aquila fault system, Abruzzi (central Apennines, Italy) with combined ground-penetrating radar and palaeoseismic trenching. Geophys. J. Int. 2003, 155, 805–818. [Google Scholar] [CrossRef] [Green Version]
  9. Strange, A.D.; Ralston, J.C.; Chandran, V. Near-surface interface detection for coal mining applications using bispectral features and GPR. Subsurf. Sens. Technol. Appl. 2005, 6, 125–149. [Google Scholar] [CrossRef] [Green Version]
  10. Pettinelli, E.; Barone, P.M.; Di Matteo, A.; Mattei, E.; Lauro, S.E. Mapping the undiscovered ruins of pompeii (naples, Italy) using ground penetrating radar. Archaeometry 2012, 54, 203–212. [Google Scholar] [CrossRef]
  11. Benedetto, A.; Pajewski, L. Civil Engineering Applications of Ground Penetrating Radar; Springer: Cham, Switzerland, 2015. [Google Scholar]
  12. Xie, J.; Guo, Z.; Liu, H.; Liu, Q.H. Reverse time migration using the pseudospectral time-domain algorithm. J. Comput. Acoust. 2016, 24, 1650005. [Google Scholar] [CrossRef]
  13. Xie, J.; Zhuang, M.; Guo, Z.; Liu, H.; Liu, Q.H. Reverse time migration of elastic waves using the pseudospectral time-domain method. J. Theor. Comput. Acoust. 2018, 26, 1750033. [Google Scholar] [CrossRef]
  14. Liu, H.; Long, Z.; Tian, B.; Han, F.; Fang, G.; Liu, Q.H. Two-Dimensional Reverse-Time Migration Applied to GPR With a 3-D-to-2-D Data Conversion. IEEE J. Sel. Top. Appl. Earth Obs. Remote Sens. 2017, 10, 4313–4320. [Google Scholar] [CrossRef]
  15. Leuschen, J.C.; Plumb, G.R. A matched-filter-based reverse-time migration algorithm for ground-penetrating radar data. IEEE Trans. Geosci. Remote Sens. 2001, 39, 929–936. [Google Scholar] [CrossRef] [Green Version]
  16. Zhang, Y.; Wang, L.; Feng, N.; Zhuang, M.; Feng, X.; Fang, G.; Liu, Q.H. A 3-D High-Order Reverse-Time Migration Method for High-Resolution Subsurface Imaging with a Multistation Ultra-Wideband Radar System. IEEE J. Sel. Top. Appl. Earth Obs. Remote Sens. 2019, 12, 744–751. [Google Scholar] [CrossRef]
  17. Yee, K.S. Numerical solution of initial boundary value problem involving Maxwell’s equations in isotropic media. IEEE Trans. Antennas Propag. 1966, 17, 585–589. [Google Scholar]
  18. Taflove, A.; Hagness, S.C. Computational Electrodynamics: The Finite-Difference Time-Domain Method; Artech House: Boston, MA, USA; London, UK, 1998. [Google Scholar]
  19. Wang, J.; Yin, W.Y. Development of a novel FDTD (2,4)-compatible conformal scheme for electromagnetic computations of complex curved PEC objects. IEEE Trans. Antennas Propag. 2013, 61, 299–309. [Google Scholar] [CrossRef]
  20. Liu, Q. Large-scale simulations of electromagnetic and acoustic measurements using the pseudospectral time-domain (PSTD) algorithm. IEEE Trans. Geosci. Remote Sens. 1999, 37, 917–926. [Google Scholar]
  21. Liu, Q.; Fan, G.X. Simulations of GPR in dispersive media using a frequency-dependent PSTD algorithm. IEEE Trans. Geosci. Remote Sens. 1999, 37, 2317–2324. [Google Scholar]
  22. Fa, W.; Zhu, M.H.; Liu, T.; Plescia, J.B. Regolith stratigraphy at the Chang’E-3 landing site as seen by lunar penetrating radar. Geophys. Res. Lett. 2015, 42, 10179–10187. [Google Scholar] [CrossRef]
  23. Wang, Z.; Wu, Y.; Blewett, D.T.; Cloutis, E.A.; Zheng, Y.; Chen, J. Submicroscopic metallic iron in lunar soils estimated from the in situ spectra of the Chang’E-3 mission. Geophys. Res. Lett. 2017, 44, 3485–3492. [Google Scholar] [CrossRef]
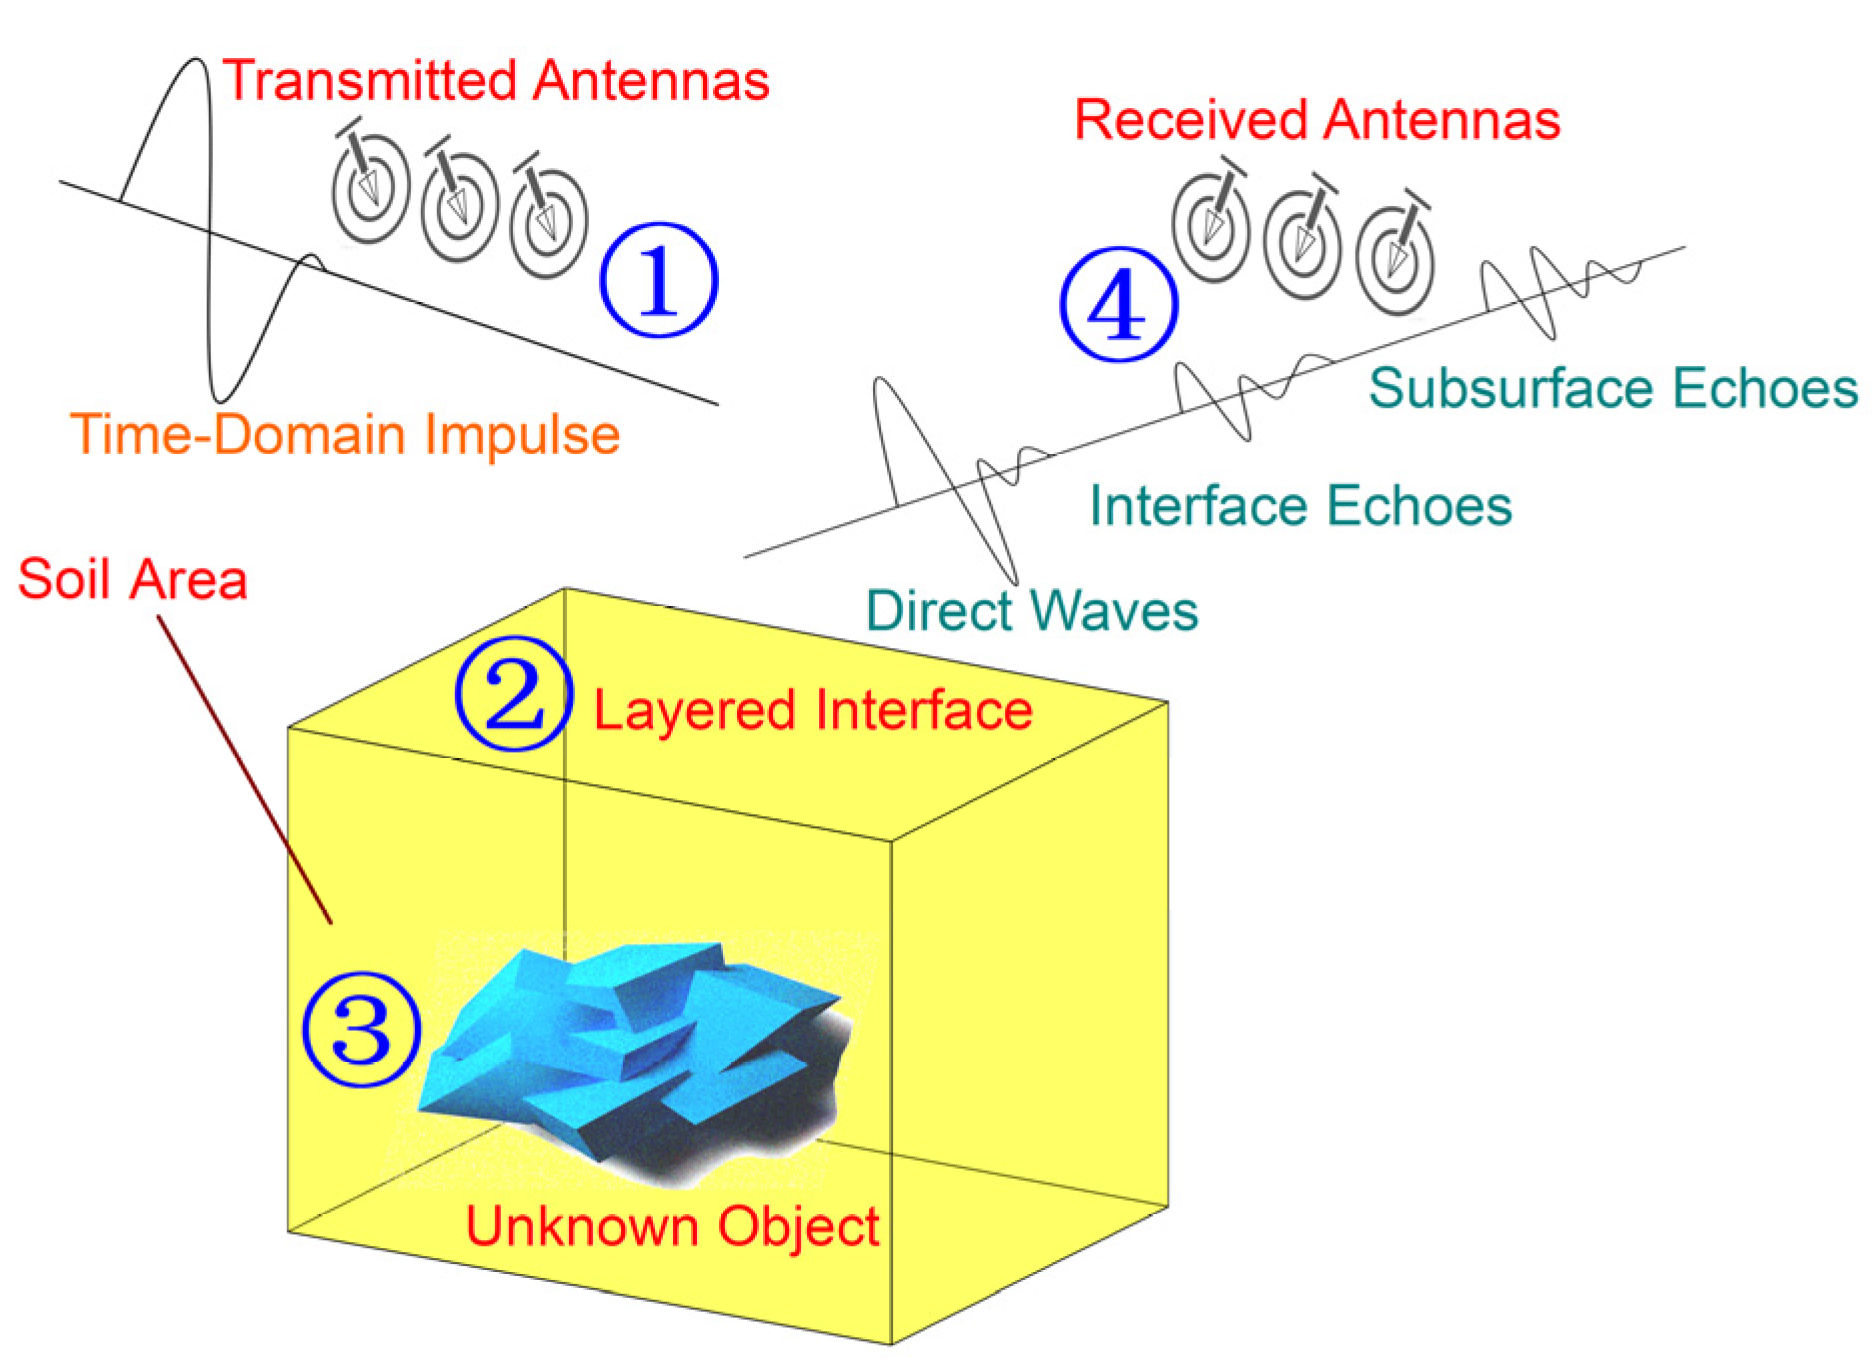
Figure 1. Collections process for measured data in the soil area.
Remotesensing 14 02791 g001
Figure 2. Flow chart on the RTM method.
Remotesensing 14 02791 g002
Figure 3. Diagram of 12 Vivaldi antennas on the CE-5 lander: (a) 3D view, (b) vertical view, (c) live photo for CE-5 lander, and (d) real Vivaldi antenna element.
Remotesensing 14 02791 g003aRemotesensing 14 02791 g003b
Figure 4. Model diagram of different subsurface hard objects in earth laboratory.
Remotesensing 14 02791 g004
Figure 5. Corresponding emission signals from 12 Vivaldi antennas.
Remotesensing 14 02791 g005
Figure 6. 132 channels’ echoes for the CE-5 experiments in the five stations: (ae) for initial echoes and (fj) for optimal echoes.
Remotesensing 14 02791 g006aRemotesensing 14 02791 g006b
Figure 7. Diagram of the electromagnetic path and the projection line, which are marked by the solid line and the dash line, respectively.
Remotesensing 14 02791 g007
Figure 8. Wiggle figure on 132 channels’ echoes corresponding to five stations: (ae) are the initial echos, (fj) are the optimal echoes.
Remotesensing 14 02791 g008aRemotesensing 14 02791 g008b
Figure 9. RTM imaging from the CE-5 measured data in different time-domain methods: (ae): C-FDTD-RTM; (fj): HO-FDTD-RTM; (ko) PSTD-RTM.
Remotesensing 14 02791 g009aRemotesensing 14 02791 g009b
Figure 10. Spectrum analysis: (a) corresponding spectrums of 12 emission signals from Vivaldi antennas, and (b) emission signals based on the spectral window.
Remotesensing 14 02791 g010
Figure 11. Received echoes from the 12 channel antennas in the five stations based on the spectral window (ae), and their corresponding RTM imaging (fj).
Remotesensing 14 02791 g011aRemotesensing 14 02791 g011b
Table 1. Actual Coordinates of twelve Vivaldi antennas on the CE-5 Lander.
Antenna No.Coordinates (m)Antenna No.Coordinates (m)
1(−0.80, 0.00, 0.95)7(−0.08, 0.00, 0.95)
2(−0.68, 0.00, 0.95)8(0.52, 0.00, 0.95)
3(−0.56, 0.00, 0.95)9(0.64, 0.00, 0.95)
4(−0.44, 0.00, 0.95)10(0.76, 0.00, 0.95)
5(−0.32, 0.00, 0.95)11(0.52, 0.12, 0.95)
6(−0.20, 0.00, 0.95)12(−0.02, 0.18, 1.13)
Table 2. The Rough Depth of Buried Objects in the Volcanic Ash.
Object
No.
Buried
Depth (m)
Object
No.
Buried
Depth (m)
Object
No.
Buried
Depth (m)
10.3042.0071.25
20.5050.5081.00
31.0061.1091.50
Table 3. Computational Efficiencies of RTM Imaging Methods with Three Schemes.
Time-Domain MethodSpatial-Sampling Density (PPW)Grid Scale
(m)
Grid Number
(Nx, Ny, Nz)
Memory
(GB)
CPU Time
(min)
C-FDTD151.00 × 10−2(300, 201, 480)16.033445.4802
HO-FDTD91.67 × 10−2(181, 121, 288)4.70893.8403
PSTD43.77 × 10−2(81, 55, 129)1.0124.3852
Publisher’s Note: MDPI stays neutral with regard to jurisdictional claims in published maps and institutional affiliations.