1. Introduction
As key technology in cross-boundary and high-precision conflicts and other national defense fields, infrared thermal imaging technology has advantages over passive detection, such as round-the-clock activity and high reliability. Infrared target detection is still one of the most popular research hotspots in military reconnaissance fields. Currently, most infrared small-target detection algorithms are based on a single morphological feature. These low-contrast targets have fewer pixels and lack shape and structure features; however, they are usually interfered with and submerged in the relatively strong background clutter and noise. It is difficult to meet the performance index of detection accuracy. Therefore, breakthroughs in infrared small-target detection are still an arduous and important scientific research task. The research findings could be widely applied in anti-missile warning, precise weapon guidance, missile tracking, and stealth aircraft identification systems.
Target detection algorithms based on deep learning can be divided into two categories: Detection methods based on region extraction, and detection methods based on regression [
1]. The method based on region extraction represented by a region convolutional neural network (R-CNN) [
2], spatial pyramid pooling network (SPPNet) [
3,
4], fast R-CNN [
5], faster R-CNN [
6,
7], (region-based fully convolutional network) RFCN [
8,
9], mask R-CNN [
10,
11], and cascade R-CNN [
12,
13] is also called the two-stage detection method. The method based on regression represented by you only look once (YOLO) [
14,
15], the single shot multi-box detector (SSD) [
16], RetinaNet [
17,
18], CornerNet [
19,
20], and EfficientDet [
21,
22] is also called the one-stage detection method. Firstly, the two-stage detection method extracts the region proposals, and then classifies and predicts the locations of the region proposals by regression. The one-stage detection method regards the whole image to be detected as one region proposal and directly inputs it into the convolutional neural network to regress the target position and classification of the image [
23]. Deep convolution neural networks (DCNNs) use more convolution layers and parameters to fit large-scale datasets. These networks use many technical methods of modern deep convolution neural networks for the first time, including the Relu nonlinear activation function, a dropout mechanism that could prevent overfitting, and a data augmentation mechanism to improve model accuracy. R-CNN draws lessons from the sliding window concept. Firstly, approximately 2000 region proposals are extracted from a given image. For each region, a fixed-length feature vector is extracted by a convolutional neural network. Finally, each extracted region is classified by support vector machines (SVMs). The regional scores are adjusted and filtered by bounding box regression and non-maximum suppression (NMS), and location regression is carried out in the fully connected network. The mAP on the general target detection dataset VOC2007 is 58.5%. The performance of R-CNNs has been improved compared with the traditional target detection algorithm, but the training and testing speed is slow, and the real-time performance is hard to ensure. He et al. proposed a SPPNet network in which the problem of the input fixed-size image was solved, and the accuracy of the benchmark detection model was improved. SPPNet is 24~102 times faster than the R-CNN method, while achieving better or comparable accuracy on Pascal VOC 2007 [
3]. Girshick et al. proposed a fast R-CNN network in which the region of interest (ROI) pooling layer was used to optimize regional feature selection. The fast R-CNN trains the very deep VGG-16 network 9 times faster than R-CNN, is 213 times faster at test-time, and achieves a higher mAP on PASCAL VOC 2012 [
5]. Ren et al. proposed a faster R-CNN [
6] network in which a regional proposal network (RPN) is introduced to replace the selective search algorithm that hinders the improvement of accuracy. In the framework of faster R-CNN, the convolution features of all images are shared in the whole detection process. RPN improves the detection speed by simultaneously predicting the bounding box and category confidence at each location. The faster R-CNN consists of four parts: The convolution layer, RPN network, ROI pooling layer, and classification and regression layer. The faster R-CNN, which takes VGG-16 as the backbone network, achieved a mAP of 73.2% on the Pascal VOC 2007 dataset. Nevertheless, there are still several problems, such as its unsuitability for small-target detection and limitations of the detection speed and accuracy. Dai et al. proposed an RFCN network in which a position-sensitive score graph was used to reduce the translation invariance of objects. RFCN achieved a competitive mAP of 83.6% and a test-time speed of 170 ms per image on the PASCAL VOC datasets with the 101-layer ResNet [
8]. He et al. proposed a mask R-CNN network in which bilinear interpolation was used to fill in the pixels on non-integer positions to improve the accuracy of target detection. Mask R-CNN extends the faster R-CNN by adding a branch for predicting an object mask in parallel with the existing branch for bounding box recognition. It is simple to train and adds only a small overhead to the faster R-CNN, running at 5 fps [
10]. Cai. et al. proposed a cascade R-CNN network, which consisted of a sequence of detectors trained with increasing IoU thresholds, to be sequentially more selective against close false positives. The average precision performance from multiple popular detectors to the cascade R-CNN is improved by 2% to 4% [
12].
Liu et al. proposed an SSD algorithm to balance the detection accuracy and speed. SSD takes VGG-16 as the backbone network for feature extraction. With the hierarchical feature extraction idea, SSD divides the single-level network into six levels and extracts feature maps of different semantic levels in each stage for target classification and bounding box regression. The combination of a multi-scale feature map and anchor mechanism improves the detection ability of the algorithm for targets with different scales. In addition, according to the bounding boxes obtained by anchors on different scales, SSD adopts the prediction mechanism to distinguish the classification and location of the target. Although the Map of SSD on the VOC2007 dataset reaches 79.8%, it is not ideal for the identification of small targets. Redmon et al. proposed a single-stage target detector called YOLO. The YOLO architecture consists of 24 convolution layers and 2 fully connected (FC) layers. The feature map of the top level is used for the bounding box prediction, which directly estimates the probability of each category. In the YOLO framework, each image is divided into an S × S grid cell, which is only responsible for predicting the target of the grid center. Feature extraction, classification, and regression are imputed into one convolutional network for simplification, in which the generation stage of the region proposal is omitted. However, it is easy to miss detections in the overlapping occlusion environment in the YOLO algorithm, and it is not fully applicable to small-target detection. Redmon et al. then developed the YOLO v3 [
24] network, in which a deeper Darknet-53 residual network combined with a feature pyramid network (FPN) is used for feature extraction, and a feature map with three scales is used to predict the bounding box with the number of anchors increasing at the same time. The multi-scale prediction mechanism significantly improves the detection performance of small targets. The map of the YOLO v3 framework was 57.9% on the COCO dataset. Bochkovskiy et al. proposed the YOLO v4 [
25] framework, in which a CSPDarkNet-53 backbone network is adopted instead of DarkNet-53. Spatial pyramid pooling and path aggregation network (SPP + PAN) are used instead of FPN so as to fuse the feature information of feature maps of different sizes. The SPP module adds the receptive fields, and the PAN module performs multi-channel feature fusion. The mosaic data augmentation mechanism and DropBlock regularization are adopted. Compared with YOLO v3, the YOLO v4 framework not only ensures the performance of speed, but also greatly improves the detection accuracy of targets. However, the YOLO series detectors have poor accuracy performance on small targets due to the influence of space constraints in bounding box prediction. Lin et al. proposed a RetinaNet network in which a novel focal loss was proposed to address the class imbalance. Compared to recent two-stage methods, RetinaNet achieves a 2.3-point gap above the top-performing Faster R-CNN [
17]. Law et al. proposed a CornerNet network in which we detected an object bounding box as a pair of keypoints, the top-left corner and the bottom-right corner, using a single convolution neural network. CornerNet achieves a 42.2% AP on MS COCO [
19]. Tan et al. proposed EfficientDet in which a weighted bi-directional feature pyramid network was proposed to allow easy and fast multi-scale feature fusion. It achieves state-of-the-art 52.2 AP on COCO test-dev with 52 M parameters and 325B FLOPs, being 4~9 times smaller and using 13~42 times fewer FLOPs than the previous detector [
21].
Although target detection based on convolutional neural networks has made great progress compared with traditional target detection, most of the above target detection algorithms are suitable for area targets and are not fully applicable to the detection of small targets. The research on small-target detection is still challenging in the field of computer vision. The detection is disadvantaged due to the low resolution, blurred image, less information, weak feature expression ability, and fewer extracted features of small targets. In the local contrast measure (LCM) method, target signal enhancement and background clutter suppression are achieved simultaneously [
26]. Infrared small-target detection is realized by the gray difference between the small target and the surrounding background. We introduce the concept of contrast to quantitatively describe the gray difference. When the maximum gray value of the central cell is divided by the mean gray value of the i
th surrounding cell, the quotient is obtained, which is called the contrast. If the contrast is larger than 1, the central cell is more likely to be the target. Additionally, the target signal enhancement is achieved by replacing the gray value of the central cell with the product of the contrast and the maximum gray value of it. CLP Chen et al. presented the local contrast measure method to enhance the targets. The experimental results show that this method significantly outperforms the conventional methods of top-hat and the average gray absolute difference maximum map (AGADMM), with a detection rate of 86.67%. It is not only simple but also suitable for infrared small-target detection. Yimian Dai et al. presented attentional local contrast networks (ALCNets) for infrared small-target detection, which modularizes this method as a depthwise, parameterless, nonlinear feature refinement layer in an end-to-end network, in which bottom-up attentional modulation is exploited, integrating the subtle smaller-scale details of low-level features into high-level features of deeper layers [
27]. The ALCNet outperforms the other 10 state-of-the-art methods, with an IoU of 0.757 and nIoU of 0.728 for the SIRST dataset. In the sparse and low-rank recovery method, an image is decomposed into a low-rank matrix, representing the background, and a sparse matrix, indicating the target region. The augmented Lagrange method (ALM) and alternating direction multiplier method (ADMM) are used for solving this model. Hu Zhu et al. presented a target detection method based on low-rank tensor completion with the top-hat regularization (TCTHR) model [
28] for infrared small-target detection based on low-rank tensor completion and ring top-hat regularization, which can be solved efficiently using ADMM. This model has achieved better infrared small-target detection performance than classic methods, with a high mean accuracy level of 93.4% and a low false alarm rate of 3.2% in seven experimental real image sequences. Yujie He et al. presented a low-rank and sparse representation model, named LRSR, for infrared small-target detection, which transforms the detection task into a separation process of background, noise, and target components by solving LRSR [
29]. This presented method has yielded a high detection rate of 91% in 1063 experimental original sequences.
According to the characteristics of small targets, multi-scale prediction is usually adopted in small-target detection. Small targets are detected using low-level features or amplified high-level features through up-sampling and deconvolution and fused with low-level features. Generative adversarial networks (GANs) [
30] are used for data augmentation of the original samples and quality improvements for small targets. However, these methods are not independent of each other. One or multiple methods can be used in one algorithm to improve the performance of small-target detection. Huaichao Wang et al. proposed a detection method based on fully convolutional networks in spatial and graph matching in temporal small-target detection [
31]. This method can detect small targets from complex moving backgrounds with high precision and a low false-alarm rate. Moran Ju et al. presented an efficient network for real-time small-target detection with a scale-matching strategy introduced to select suitable scales and anchor size and an adaptive receptive field fusion module added to increase the context information [
32]. The comparative results indicate that this method achieves 74.5% Map at 50.0 fps on VEDAI dataset and 45.7% Map at 51.1 fps on a small-target dataset. Jinming Du et al. proposed an interframe energy accumulation enhancement mechanism-based end-to-end spatial–temporal feature extraction and target detection framework [
33]. This method could effectively detect small targets by enhancing the target’s energy and suppressing the strong spatially nonstationary clutter. Qingyu Hou et al. proposed an infrared small-target detection U-net (ISTDU-Net), which not only introduces feature map groups in network down-sampling and enhances the weights of small-target feature-map groups but also introduces a fully connected layer in jump connection to suppress backgrounds with similar structures [
34]. The infrared small targets under a complex background are detected with a low false alarm rate, and the area under curve (AUC) value is 0.9977.
It is extremely difficult to detect infrared small targets that are seriously submerged in background clutter and noise due to the low resolution, blurred image, less information, weak feature expression ability, and fewer extracted features. Otherwise, the performance of infrared small-target detection would be greatly influential. Research on small-target detection is still a challenge. The abovementioned small-target detection methods focus on how to obtain more and deeper morphological feature information. However, infrared small targets lack shape features, and they are too dim to be detected only by morphological features. To solve the above problem, a novel multimodal feature fusion network (MFFN) is proposed based on the morphological characteristics, infrared radiation, and motion characteristics, which could compensate for the deficiency of the description of single modal characteristics of infrared small targets. In our framework, a novel backbone network is proposed to enhance the feature extraction ability of infrared small targets with weak intensity and low contrast. In addition, we propose a prediction model of atmospheric transmittance based on deep neural networks (DNNs) in the radiation characteristic domain. The overall flow chart of the model we proposed for infrared small-target detection is shown in
Figure 1.
The main contributions of our work are summarized as follows:
A multimodal feature fusion network (MFFN) is proposed based on morphological characteristics, infrared radiation, and motion characteristics.
In the morphological domain, we propose a network with the skip-connected feature pyramid network (SCFPN), in which, through the fusion of small-target features and context multi-scale features, the missed detection rate of small targets is reduced and the detection accuracy is improved.
In the radiation characteristic domain, we propose a prediction model of atmospheric transmittance based on a DNN. Through radiation characteristic inversion and atmospheric transmission correction, the infrared radiation intensity of the target itself is obtained. The atmospheric transmittance is predicted effectively without being limited by the complex environment and improves the accuracy of radiation characteristic measurements.
A dilated convolutional-neural-network-based bidirectional encoder representation from transformers (DC-BERT) structure combined with an attention mechanism is proposed for the feature extraction of radiation and motion characteristics.
We produce a new engineering medium-sized infrared dataset for small targets and verify our method on it. The experimental results on our private dataset and other general datasets show that our method is superior to the state-of-the-art algorithms in obtaining the mean average precision (Map).
The rest of this article is organized as follows. In
Section 2, we elaborate on the proposed framework in detail. The results of the ablation study and performance comparison experiments carried out on our private self-established dataset to verify the effectiveness of our network are presented in
Section 3. In
Section 4, the discussions of our proposed improvements are provided in a broader context. Finally, we summarize the research content, and the conclusions are drawn in
Section 5.
2. Data and Methods
2.1. Dataset
Based on the target characteristic database accumulated by our research group in air defense and antimissile experiments over the past ten years, we have developed an engineering medium-sized dataset, called the optoelectronic-equipment-detected dataset (OEDD), for performance evaluation experiments on four categories of small-target detections: Large and medium aircraft, small aircraft, floating balls, and birds. Partial images of the four categories of targets are shown in
Figure 2, in which the red boxes indicate the locations of the targets. Each frame of the images has corresponding measurement data, which include the radiation intensity, speed, acceleration, longitude, latitude, elevation, distance, azimuth, and pitch angle of the targets. The dataset samples, which totaled 20,673, are composed of two parts: Image data and measurement data. Among them, the number of each category of targets is approximately 5000, and the input image resolution is 640 × 512 with an 8-bit depth of each pixel. In order to ensure the balance and diversity of the samples, the single variable factor method is used to select the small-target images and the corresponding measurement sequences under different sky backgrounds (such as cloud or no cloud and target with or without occlusion), different weather, different target positions, and different time conditions. The pixels of most targets in the sample images are not more than 15 × 15, and there are also some point-target samples whose pixels are less than 9 × 9. The OEDD is used for training, validation, and testing. The dataset proportion of the training set, verification set, and testing set is 7:2:1.
2.2. Data Preprocessing
For the private multi-source infrared small-target dataset, data preprocessing includes Two parts: (1) Original data augmentation and (2) original image denoise.
Due to the imbalance in the number of samples and the large similarity of samples in each category in the original characteristic database obtained in years of experiments, it is necessary to enhance the original data by means of data augmentation to generate similar but different sample data to expand the size of the dataset in order to reduce the dependence on the original samples and improve the generalization capability of the model in the training process. The enhancement of multidimensional original data of small targets collected by our infrared optical equipment includes image data augmentation and radiation characteristic data augmentation. The original image data augmentation adopts the mosaic data augmentation mechanism to enrich the background and small targets of the detected object by randomly cutting, flipping, translating, and modifying the brightness of the original image.
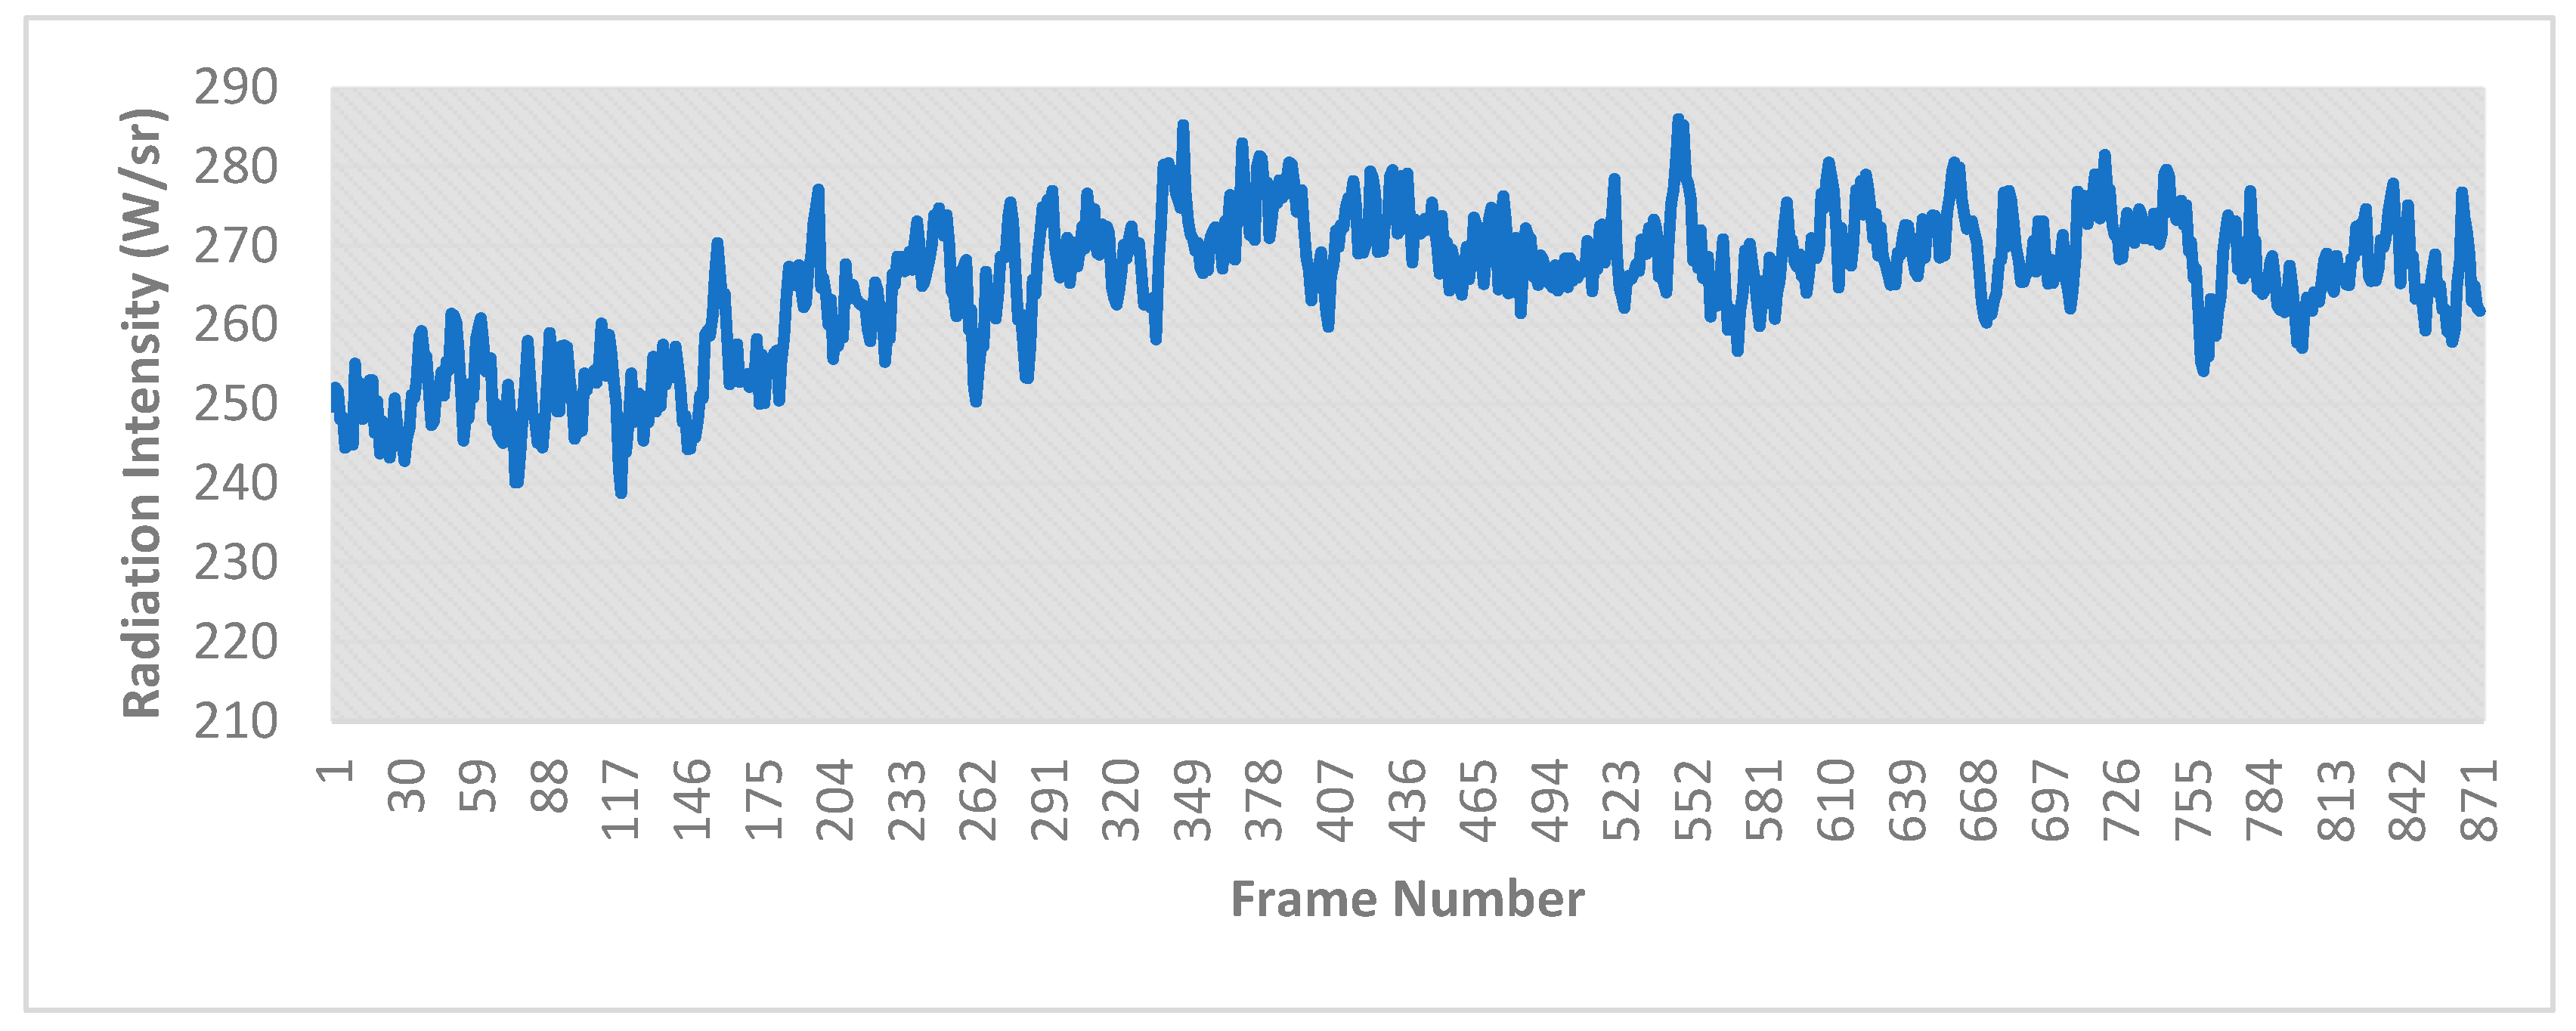
Referring to the relatively complete measured radiation data of the targets, the time-sequential variation curve of radiation intensity is simulated. In order to ensure completeness and consistency with the actual data, the cubic spline interpolation matching method is used to add additive Gaussian white noise to the target radiation simulation information. The formula is as follows:
The simulation data are obtained according to the established procedure, but the real data are affected by many uncertain factors. The noise is introduced to make the simulation data closer to the truth. The simplest additive Gaussian white noise added to this additive and independent noise model is only one of the numerous kinds of noise; thus, it would lead to potential weaknesses and problems of undermining the authenticity of the original data. Here, we added the Rayleigh noise, Gamma noise, exponential noise, and impulse noise to this simulation experiment. The probability density functions of the above four kinds of noise are listed sequentially in Equation (2) to Equation (5).
The standard deviation values expressed with the mathematical symbol σ are used to illustrate the dispersion of the simulation data compared with the true values. The standard deviations of the simulation data of the four kinds of targets in our dataset are shown in
Table 1. We conducted six groups of simulation experiments on each kind of target and obtained σ
1s-σ
6s for the above five types of noise. Notably, radiation characteristic data obtained from the actual measurements are regarded as the true values to compute the following standard deviations.
From
Table 1, we can see that the average standard deviations in the Gaussian white noise model of the three kinds of targets, i.e., the large and medium aircraft, floating balls, and the birds, are superior to the other four noise models, with values of 3.183%, 3.422%, and 3.215%, respectively. In addition, the average standard deviation of the Gaussian white noise model of the small aircraft is 3.235%, which is only 0.09% lower than that of the Gamma noise model. Finally, we can draw the conclusion that the obtained radiation characteristic data with added Gaussian white noise are closer to the true data. In this way, the robustness of the original data augmentation is improved.
Here, the Gaussian white noise is added to the procedure-obtained characteristic data; a simulation result is shown in
Figure 3.
Image noises are in various forms, such as Gaussian noise, impulsive noise, Rayleigh noise, Gamma noise, exponential noise, and uniform noise. GAN has the capability to learn more complex distributions. The GAN model can be trained by back-propagation and produce noise samples by forward-propagation without involving another component. In this section, a GAN–CNN-based blind denoiser (GCBD) is adopted in the original image denoising. Firstly, the approximate noise blocks extracted from the noisy images are exploited to train GAN for noise modeling and sampling. The majority of noisy blocks are sampled from the trained GAN model. Then, both extracted and generated noise blocks are combined with clean images to obtain paired training data, which are used to train the DCNN for denoising the noisy input images [
35,
36].
2.3. Network Structure
The limited target detection ability of single-mode opto-electronic equipment could lead to failure in the detection of small targets with inadequate shape information. Therefore, the complementarity between multimodal information might improve the detection ability of small targets and enhance the robustness of the detection system by combining the radiation, motion, and morphological features of infrared small targets.
The infrared radiation and motion characteristics of the target are deduced and calculated based on the measured data of the infrared system. Among them, the infrared radiation characteristics of the target mainly include the radiation intensity of the target and its mean value, variance, relevance, and other statistics. The motion characteristics include the speed, acceleration, elevation, azimuth, pitch angle, center moment, and origin moment of the target.
2.3.1. Morphological Feature Extraction Network
According to the imaging characteristics of infrared small targets, we propose a morphological feature extraction network model based on the multi-level video streaming (MSFE) detection structure.
The key frame and non-key frame in the streaming are automatically selected in the algorithm for global search and local search, respectively. Global feature extraction on key frames could help predict the position of the target. Non-key frames only perform shallow feature extraction in the backbone network. These features are sent to the bidirectional encoder representation from transformers (BERT) [
37] model, based on the multi-head attention mechanism, which could realize fast parallel feature extraction and then combine with global features extracted from key frames. The deep features of non-key frames are predicted by the deep features of key frames; then, the non-key frame features are fused. One out of every five frames is selected from the video streaming as the key frame, and the remaining frames will be used as the non-key frames in this framework. The structure of MSFE is shown in
Figure 4.
The feature extraction of the key frame introduces the dual-channel dilated convolutional block attention [
38] module integrated with Resblock (DAMR) into the backbone feature extraction network and adopts the structure of SCFPN. The feature extraction network structure of the key frame is shown in
Figure 5.
Through the fusion of multi-scale features in the context of the small target, the method of combining bottom-up and top-down helps to obtain stronger semantic features, strengthen feature fusion, improve the feature extraction ability of small targets and the detection accuracy, and reduce the missed alarm rate [
39,
40]. The attention mechanism is used in the shallow feature layer to ensure that the backbone network obtains the areas that need attention, captures the effective image areas, and enhances the feature extraction ability of small targets [
41]. Dilated convolution is used instead of the pooling layer to increase the receptive field; it is guaranteed that the size of dilated convolution is consistent with that of ordinary convolution at the same time [
42]. The receptive field of the shallow feature map is smaller, and the resolution is higher. However, its semantic information is insufficient. The receptive field of the deep feature map is larger, but the resolution is lower. The proportion of small targets in the receptive field is too small to accurately detect small targets on the deep feature map, but the deep feature has sufficient location information and semantic information [
43]. The features with high-level semantic information in the top layer are achieved in the FPN and fused with shallow features in the horizontal connection after continuously up-sampling [
44]. The fused features not only have higher semantic information but also have higher resolution. This pyramid network could effectively improve the detection performance of small targets.
The neck part of the key frame feature extraction is based on bi-directional feature pyramid networks (Bi-FPNs), where dilated spatial pyramid pooling (DSPP) is added to the deep feature layer [
45]. The DAMR is added at the end of each feature layer to increase the accuracy of small-target position information and the fine granularity of semantic information, and to improve the capability of the neck network to capture the effective imaging area of small targets. Each feature map passes through three dilation convolution modules with dilation rates of 1, 3, and 5, respectively, and the fused results are successively sent to the channel attention mechanism and spatial attention mechanism modules. The output results of the attention mechanism layer are fused with the input feature layer to obtain the output of the DAMR module through a short-cut route by a residual block. The schematic diagram of the structure is shownin
Figure 6.
The DSPP module adds dilated convolution modules with different divided rates (1, 2, and 5, respectively) before the three maximum pooling layers of SPP network. The residual structure of ResNet is added; thus, the feature enhancement module based on the dilated convolution DSPP is obtained [
46]. The structure is shown in the figure below.
The feature map generated by the neck network is sent to the RPN to generate the rough position of the region proposal. Then, the region proposal, together with the feature map, is sent to ROI pooling for location refinement. Finally, the location refinement results are sent to the full connection layer for bounding box regression and classification prediction to obtain the location information, classification, and confidence of the target, respectively [
47].
Each frame of the image sequence has a time-series correlation; therefore, at the front end of the network, the non-key frame feature extraction network extracts the shallow features, which are sent to the BERT module based on the multi-head attention mechanism after position coding to extract local features of the target. These features are integrated with the global high-level features of the key frame. Subsequently, they are linearized through the full connection layer, Softmax normalization is performed, and the detection results are outputted [
48,
49]. The algorithm structure of the non-key frame feature extraction network is shown in
Figure 7.
2.3.2. Radiation Characteristic Measurement Model Based on a DNN
The infrared radiation characteristics are important intrinsic physical attributes for target category judgment. We constructed an atmospheric transmittance prediction model based on the DNN through in-depth analysis and research on oblique atmospheric transmittance and obtained the target-apparent infrared radiation characteristics through the inversion of the radiation response of infrared radiation characteristic measurement systems. The apparent radiation characteristics are corrected by atmospheric transmittance and path radiation. Finally, infrared characteristics such as the radiance, radiation intensity, and radiation temperature of the target itself are obtained through the inversion of radiation characteristics.
When considering the infrared radiation characteristic measurement system, the output signal of the system has a linear relationship with the target radiance within the linear response range of the system. The formula of the target radiation measurement model is as follows:
In the above formula,
is the digital output value of the detector of the infrared measurement system.
is the radiance response of the infrared measurement system.
is the radiance of the measured target.
is the average atmospheric transmittance between the target and the infrared measurement system in the measurement band.
is the atmospheric path radiation between the target and the infrared measurement system.
is the offset value caused by thermal radiation of the opto-mechanical structure of the infrared measurement system itself, the scattered background radiation, and the dark current of the detector [
50,
51]. The target radiance can be retrieved from the above formula.
Among them, the radiance response and digital offset of the system are the values obtained by laboratory radiation calibration of the infrared measurement system in advance. In traditional measurement methods of target radiation characteristics, atmospheric observation equipment is used to measure atmospheric parameters such as aerosol extinction height distribution profile, ground visibility, and the temperature, humidity, and pressure height distribution profile. Then, these parameters are imputed into atmospheric radiation transmission calculation software, such as moderate spectral resolution atmospheric transmittance (MODTRAN), to calculate the atmospheric transmittance and path radiation between the target and the measurement system. Atmospheric transmission correction is a necessary part of target radiation measurement. In traditional radiation measurement methods, the atmospheric transmittance and path radiation, whose accuracy is approximately 18%~20%, are measured and calculated using atmospheric observation equipment and atmospheric radiation transmission calculation software. The measurement accuracy of the infrared radiation characteristics is approximately 20%~25%. Therefore, the measurement accuracy of atmospheric transmittance is an important factor restricting the accuracy of target radiation measurement.
According to the Beer–Lambert law and Langley plot calibration principle [
52], we can derive the following formula:
where
is the atmospheric extinction coefficient,
is the zenith angle, and
and
are the critical values of wavelength in a certain band. For example, in the medium-wave infrared band,
and
are
and
, respectively.
If no spectral measurement is carried out, the above formula is simplified as below:
where
is the atmospheric extinction coefficient of atmospheric molecules and aerosols,
is the atmospheric extinction coefficient of atmospheric meteorological conditions (such as cloud, fog, rain, and snow),
is the atmospheric extinction coefficient caused by water vapor absorption, and
is the atmospheric extinction coefficient caused by carbon dioxide absorption.
From the above formulas, it can be seen that atmospheric transmittance is a complex parameter related to many factors. We cannot obtain the specific value of atmospheric transmittance by formula deduction.
We constructed an atmospheric transmittance prediction model based on the DNN through the in-depth analysis and research of oblique atmospheric transmittance. The DNN-based model was constructed to predict the atmospheric transmittance, which could overcome the complex environmental limitations and effectively improve the measurement accuracy of the atmosphere transmittance and even the infrared radiation intensity. Additionally, the infrared radiation intensity is an intrinsic physical property of the target, which could be used as the basis of target detection. Accurate radiation intensity would contribute to feature extraction of the measurement sequence (
Section 2.3.2). Therefore, the atmospheric transmittance prediction model based on DNN could indirectly improve the accuracy of target detection. The input layer of this network model is composed of nine-dimensional data, which are the temperature, humidity, pressure, visibility, distance, zenith angle, longitude, latitude, and elevation information of the target. Namely, there could be nine neurons in the input layer of the model, 10, 1000, 1000, and 1000 neurons in the four hidden layers, respectively, and one neuron in the output layer. The structure of the radiation characteristic measurement model based on DNN is shown in
Figure 8.
We can overcome the environmental limitations, estimate the atmospheric transmittance in a complex atmospheric environment, and effectively improve the measurement accuracy of infrared radiation intensity by taking the above parameters as the inputs of the model and continuously adjusting the model parameters through iterative training for hundreds of generations. We conducted the model training on our self-established dataset, which utilizes the temperature, humidity, pressure, visibility, distance, zenith angle, longitude, latitude, and elevation as inputs, and the corresponding atmospheric transmittance values as outputs. The simulation results show that through the comparison between the atmospheric transmittance extracted by our model and the atmospheric transmittance measured by the blackbody real-time calibration, the fitting accuracy of our proposed method is better than 15%. The three-dimensional fitting results are shown in
Figure 9.
In the figure above, purple and red scatter points represent the prediction results of atmospheric transmittance of training 200 epochs and 300 epochs, respectively. The green scatter points represent the calibrated atmospheric transmittance values.
2.3.3. Feature Extraction Network of the Measurement Sequence
The DC-BERT model is adopted in the feature extraction of the measurement sequence vector. The measurement sequence vector is composed of the infrared radiation characteristic sequence, motion characteristic sequence, and statistical sequence composed of the origin moment and k-order central moment of each characteristic. The infrared radiation characteristic sequence is the radiation intensity sequence of the target. The motion characteristic sequence is mainly composed of the velocity, acceleration, elevation, azimuth, and pitch of the target.
The input measurement sequences have properties of a high degree of disorder in the short term and a certain change trend in the long term. In order to increase the nonlinearity of the model to extract the complex and scattered measurement sequence features in the multi-dimensional space and improve the robust classification capability of the measurement sequence feature extraction model, we apply dilated convolution to extract the multi-scale features of the sequence to ensure that the model obtains the feature capture capability of the multi-scale receptive field. Moreover, we could obtain the sequence characteristics, which reflect the local spatial structure of the sequence. Then, we could capture the interdependence relationship between the input sequence features and extract the global deep features of the sequence by learning the complex relationship between different spatial positions of sequence features based on the BERT model. Finally, the extracted features are sent to the attention mechanism layer, and we could achieve the output result after Softmax regression.
The local feature extraction of measurement sequence is realized by the dilated convolution combined with multi-scale context information fusion. It would not only increase the receptive field of the input sequence and enhance the robustness of the feature extraction network, but also be called a kind of data augmentation, which could reduce the dependence of the model on the original samples and improve the generalization capability for the model. The measurement sequence is composed of eight-dimensional features, which are the infrared radiation intensity, elevation, velocity, acceleration, azimuth, pitch angle, the statistics of the origin moment, and the k-order central moment of each characteristic. We define the measurement sequence with the K × Q × Q dimension as follows:
where K is the feature number of measurement sequences, which is set to 8 in Equation (11). Firstly, after 2D reconstruction and stitching preprocessing, the feature of each dimension of the measurement sequence is transformed into the Q × Q dimension; then, it would be carried out with three dilated convolutions whose dilated rates are 1, 2, and 3, respectively, including three processes: Convolution, batch normalization, and the Relu activation function. Finally, the local features of the measurement sequence are obtained. The advantage of this local feature extraction network is to expand the receptive field, capture the multi-scale context information, and improve the feature extraction capability for the sequence without losing information, introducing additional parameters, and increasing the amount of calculation.
The local features of the measurement sequence are sent to the BERT model, composed of multiple, multi-channel, self-attention mechanism modules, normalization modules, and forward networks, to extract the global features, which are sent to the attention mechanism module, and Softmax regression is conducted to output the prediction results of the measurement sequence. We consider the measurement sequence matrix composed of 49-frame measurement sequence vectors within 0.5 s to be the input of the measurement sequence feature extraction model. The network structure of the measurement sequence feature extraction is shown in
Figure 10.
2.3.4. Multimodal Feature Fusion Network
The multimodal feature fusion network (MFFN), which combines the morphological characteristics, radiation characteristics, and motion characteristics of infrared small targets, adjusts the input feature dimension in the convolutional layer and carries out the weighted fusion of the above three features. Finally, the weight of each channel in the end-to-end model could be learnt continuously by introducing an α feature vector [
53] through the attention mechanism layer. The target classification and detection ability could be improved through the complementarity between multimodal information. The schematic diagram of the structure of MFFN is shown in
Figure 11.
As is shown in the above figure, the feature output from the target morphological feature extraction model is called Feature1 and the infrared radiation features and motion features extracted by the DC-BERT model are called Feature2 and Feature3, respectively. Firstly, the three features of Feature1, Feature2, and Feature3, with a dimension of N × 1, are sent to the convolution module with a kernel size of 1 × 1 and channel number of 64. According to the formula below, we could obtain three feature outputs with a dimension of N × 1 × 64.
Then, the three features with the dimensions of N × 1 × 64 are weighted and fused to obtain the fusion feature
. The calculation formula is as follows:
Among them, the dimensions of
,
, and
are all N × 1 × 64.
,
, and
are the weights of each feature obtained by end-to-end model training [
54].
In the attention mechanism layer, the low-level features
of the 3N × 1 × 64 dimension are projected through a 1 × 1 convolution feature map to the same channel number of the high-level feature of the N × 1 × 64 dimension, which allows them to be contacted. Thus, we can obtain the fusion feature map
of the N × 1 × 64 dimensions; then, we reshape it to obtain
and transpose
to obtain
. Subsequently, we obtain
by the matrix multiplication of
and
; then, the feature fusion map
is obtained through a softmax layer.
is calculated as follows:
where
and
are the
and
feature vectors of
, respectively, and
indicates the impact of the
feature vector of
on the
feature vector. Finally, the transpositions of
and
are subjected to matrix multiplication and then multiplied by a factor
to obtain the output feature
. Specifically,
where
is initialized to 0 and gradually leans to a larger weight, reshaping
to
. It can be seen from Equation (15) that each feature of
is the weighted sum of all the features of the original feature maps
. Thus, the MFFN module further highlights the global semantic information and local spatial information from high-level and low-level features. Therefore, the feature fusion model we adopted has the learning ability to scale the importance of each feature automatically.
2.4. Calculation of the Loss Function
The loss function of the multimodal feature fusion network we proposed for infrared small-target detection consists of two parts, namely, the loss function of data preprocessing,
, and the loss function of the target classification and detection network,
.
In the pretraining process of the denoising module, we used the L
1 loss to represent the deviation between the output image of the network and the noiseless image [
55]. The expression of this loss function is as follows:
In Equation (17), and is set to 0.1 in our method. represents the network loss function of data processing and represents the loss function of the GAN-based model. In Equation (18), is the input noisy image, is the output of the blind denoising network, and is the true value corresponding to input x, namely, the noiseless image. is the number of the batch in the training process. Equation (19) is the loss function of GAN, in which represents the value returned by feeding data into discriminator D and represents the value returned by feeding noise into generator G.
- 2.
The loss function of the target classification and detection network.
The loss function of the target classification and detection network is composed of the classification loss function,
, and the regression loss function,
.
The cross-entropy loss is used to calculate
. The categorical cross-entropy is applied to the multi-classification network. The calculation formula is as follows:
Here, p represents the real value and q represents the predicted value. On this basis, the cross-entropy could be improved. We use focal loss, which could reduce the imbalance between positive and negative samples and pay more attention to the mining of difficult samples to replace the cross-entropy loss. The classification loss of small targets could be regressed by focal loss [
56,
57]. The formula is as follows:
where
represents the confidence of the ground truth box and
presents the confidence of the prediction box.
is usually taken as 2 and α is 0.25.
Generalized intersection over union loss (GIOU loss) is used by
to regress the position of the target.
is the GIOU loss [
48,
49,
50,
51,
52,
53,
54,
55,
56,
57,
58,
59,
60]. The calculation formula of GIOU is as follows.
Here, represents the ground truth box, represents the predicted box, and B represents the smallest enclosing convex box between and . Then, can be calculated through . The formula is as follows.
3. Experiments and Results
This section is introduced in the following four parts: (1) Evaluation indexes; (2) implementation details; (3) ablation study; and (4) performance comparisons with competed methods.
3.1. Evaluation Indexes
The performance evaluation indexes of target detection mainly include the real-time evaluation indexes and accuracy evaluation indexes.
The real-time evaluation indexes of target detection mainly include forward-pass time-consuming, detection speed (frames per second, FPS), and floating-point operations per second (FLOPs).
Forward-pass time-consuming: The time spent from inputting a frame of image to outputting the classification and detection result.
Detection speed (frames per second, FPS): The number of frames that can be processed per second.
Floating-point operations per second (FLOPs): This index could be understood as the amount of computation and is usually used to measure the complexity of the algorithm and the model [
61].
The accuracy evaluation indexes of the target detection include the precision indicator (precision), the recall indicator (recall), average precision (AP), mean average precision (mAP, namely, the mean value of the average precision of each classification), precision–recall (P–R) curve, average recognition rate (ARR), and F
1 score [
62,
63,
64]. The effect of target detection and classification is usually evaluated with the following three accuracy evaluation indexes:
The average recognition rate
could be calculated as follows:
where
represents the total number of all targets to be detected and
represents the number of targets that are detected correctly.
AP refers to the average precision of a certain category of targets, which represents the accuracy evaluation effect of the model on a certain category. However, mAP is the mean value of the APs of all categories, which represents the overall classification effect of the model on all categories. The calculation method of mAP is as follows.
Firstly, the P–R curve should be made with recall as the abscissa and precision as the ordinate. The P–R curve represents the change in precision and recall values when the target changes. Precision could be regarded as a function with recall as a variable. AP could be regarded as the area under the P–R curve [
65,
66].
In fact, the multiplication of the value of the maximum precision and the change in recall value is usually adopted to calculate AP. The calculation formulas of AP and mAP are as follows.
where
represents the number of samples in a certain category.
represents the change value of recall,
represents the maximum value of the corresponding precision, and C represents the number of samples in all categories [
67,
68].
mAP can interpret the perfect balance between the two mutually exclusive evaluation indexes of precision and recall in the target classification and detection network.
F
1 score is the harmonic average of precision and recall, whose maximum value is 1 and minimum value is 0. The calculation formula is as follows.
where precision is used to evaluate the accuracy of the prediction and recall is used to evaluate the completeness of the prediction. The calculation formulas are presented separately, as follows [
69].
where true positive (TP) is the number of samples that are correctively predicted, false positive (FP) is the number of samples predicted as this certain class that actually belong to other classes, and false negative (FN) is the number of samples predicted as other classes that are actually in this certain class [
70].
3.2. Implementation Details
Our experiment was conducted on a high-performance computer equipped with NVIDIA GeForce RTX 2070 Ti discrete graphics for progressive offline training and testing. The initial weight of the model pretrained on the CSPDarknet53 network was adopted in Pytorch1 8.1. The target detection model was trained on the self-made OEDD, in which 14,471 samples are contained in the training set with 350 epochs trained, the batch size of each epoch is set to eight, the Adam optimizer is adopted, the initialization learning rate is set to , momentum is set to 0.999, and weight decay is set to . Through training and testing, the parameters and hyper-parameters in the model are continuously adjusted to ensure that the target classification and detection network meet the requirements of real-time performance and accuracy indicators so as to achieve the best detection effect.
The choices of the parameters in neutral networks are irregular, and there would be no unified parameters for different models and data. The adjustment of parameters needs to be attempted repeatedly in the model training process. We can select a small batch of data to set the learning rate and other parameters at the start of the training process. If the total loss does not decrease after a certain number of epochs, it indicates that the choice of this group of parameters is not suitable for the model and data. We thus need to enact some changes and then implement the training process repeatedly. Through continuous attempts, the parameters, the network, and data are intended to be the best match as far as possible, to make the total loss optimal.
The choice of parameters is not completely independent of the data used for training. For instance, when the amount of sample data is small, the higher the learning rate, and the faster the loss will be reduced. However, this will lead to overfitting. This kind of training is rough, i.e., not fine; therefore, the accuracy of the training set may be close to 100%. However, for the testing set, its accuracy will not rise because some features of the targets have not been fully extracted.
3.3. Ablation Study
We performed an ablation study on the streaming sequences of large and medium aircraft, small aircraft, floating balls, and birds to demonstrate the performance of various algorithms and networks we have proposed above for infrared small-target detection. The effectiveness of several structures in the infrared small detection network we proposed is shown in the table below.
Table 2 illustrates the effectiveness of various models in our infrared small-target detection network. The models use the same training, validation, and testing set in the OEDD.
The baseline represents the network model of the infrared small-target detection without the structures and algorithms we proposed. The baseline in
Table 2 represents the modified YOLO v3 structure in which the anchor sizes are modified to adapt to small-target detection.
As can be seen in
Table 2, the AP and F
1 scores of large and medium aircraft sequences at 15.42 fps are 0.8217 and 0.8063, respectively. The AP and F
1 scores of small aircraft sequences at 15.49 fps are 0.8149 and 0.7986, respectively. The AP and F
1 scores of floating ball sequences at 15.41 fps are 0.8108 and 0.7953, respectively. The AP and F
1 scores of birds at 15.48 fps are 0.8123 and 0.7986, respectively.
3.3.1. Analysis with the SCFPN Module
The SCFPN is conducive to fusing more multi-scale context features of small targets, to reduce the missed alarm rate and improve the detection accuracy. In order to investigate the effectiveness of the SCFPN module we proposed, we conducted experiments on our private infrared small-target dataset: The OEDD. Compared with baseline, the AP and F1 scores of large and medium aircraft sequences were improved by 1.15% and 1.22%, respectively. The AP and F1 scores of small aircraft sequences were increased by 1.29% and 1.34%, respectively. The AP and F1 scores of floating ball sequences were increased by 1.86% and 1.78%, respectively. The AP and F1 scores of birds were increased by 1.49% and 1.51%, respectively.
3.3.2. Analysis with the DAMR Module
The residual dual-channel attention mechanism module based on dilated convolution effectively improves the accuracy of location information and the fine granularity of semantic information of the small targets to be captured. In order to investigate the effectiveness of the DAMR module we proposed, we conducted experiments on our private infrared small-target dataset: The OEDD. Compared with baseline, the AP and F1 scores of large and medium aircraft sequences were improved by 2.34% and 2.1%, respectively. The AP and F1 scores of small aircraft sequences were increased by 2.08% and 2.48%, respectively. The AP and F1 scores of floating ball sequences were improved by 2.95% and 3.14%, respectively. The AP and F1 scores of birds were increased by 2.56% and 2.58%, respectively.
3.3.3. Analysis with the DC-BERT Module
The BERT model based on a dilated convolution neural network has the feature capture ability of a multi-scale receptive field. In addition, the BERT model could learn the complex relationship between multi-dimensional spatial features of the sequence and has advantages over the extraction of global deep features. Finally, the attention mechanism module is introduced to increase the global contextual view of the feature extraction structure. In order to investigate the effectiveness of the DC-BERT module we proposed, we conducted experiments on our private infrared small-target dataset: The OEDD. Compared with baseline, the AP and F1 scores of large and medium aircraft sequences were improved by 6.19% and 5.62%, respectively. The AP and F1 scores of small aircraft sequences were increased by 6.21% and 6.26%, respectively. The AP and F1 scores of floating ball sequences were increased by 6.27% and 6.09%, respectively. The AP and F1 scores of birds were increased by 6.23% and 5.97%, respectively.
3.3.4. Analysis with the MFFN Module
The end-to-end multimodal feature fusion network we proposed is realized on feature-level fusion. The weight of each channel is automatically learned through the attention mechanism. The complementarity between the modal information is used to improve the classification and detection ability of the infrared small targets. In order to investigate the effectiveness of the MFFN module we proposed, we conducted experiments on our private infrared small-target dataset: The OEDD. Compared with baseline, the AP and F1 scores of large and medium aircraft sequences were improved by 10.47% and 10.39%, respectively. The AP and F1 scores of small aircraft sequences were increased by 10.64% and 10.73%, respectively. The AP and F1 scores of floating ball sequences were improved by 10.75% and 10.59%, respectively. The AP and F1 scores of birds were increased by 10.20% and 10.27%, respectively.
3.3.5. Analysis with the DNN-Based Radiation Characteristic Extraction Module
The infrared radiation characteristics measurement is inevitably affected by the environment. We have proposed a prediction model of atmospheric transmittance, which is the primary factor restricting the accuracy of characteristic measurements based on DNN, which could effectively improve the accuracy of atmospheric transmittance measurement and the measurement accuracy of radiation characteristics. This model could effectively predict atmospheric transmittance in a complex atmospheric environment through model training. It can be seen from
Table 3 that the error accuracy of the atmospheric transmittance measurement of the method we described (Err1 in
Table 3) is better than 15% on the basis of the atmospheric transmittance measured by the blackbody real-time calibration method, whereas the error accuracy of the DNN-based characteristic extraction method with MODTRAN software (Err2 in
Table 3) is more than 18%. The atmosphere transmittance results of the two methods are listed in the
12nd and
13rd columns of
Table 3.
We chose Modtran software and the blackbody real-time calibration method to compare with our method. In the blackbody real-time calibration method, a reference blackbody is placed near the measured target, and the distance and direction relative to the measurement system are nearly the same. When the infrared radiation of the target is measured by the infrared measurement system, the output DN values of the blackbody at high and low temperatures are recorded. Then, we will obtain three equations. From these equations, the atmospheric transmittance and the radiance of the target can be obtained. The accuracy of the atmospheric transmittance calculated by the blackbody real-time calibration method is better than 3.5%, which is a qualitative leap compared with the traditional target radiation inversion accuracy. Therefore, it is used as the reference value of atmospheric transmittance [
71]. However, engineering experiences show that this method is only effective in laboratory environments. Modtran software is a general atmospheric radiation transmission calculation software used worldwide. We have to say that Modtran has its own limitations. The measurement accuracy of Modtran is greatly affected because the atmospheric parameter models used in the United States are quite different from those in China.
3.4. Performance Comparisons with Competed Methods
3.4.1. Qualitative Evaluation
The detection results of the nine state-of-the-art detection algorithms, including YOLO V3, YOLO V4-Tiny, faster R-CNN, region fields block network (RFBnet), TCTHR, infrared small-target detection network (ISTDet) [
72], infrared small-target detection with a generative adversarial network (IRSTD-GAN) [
30], ALCNet, and the algorithms we proposed, are shown in
Figure 12. According to the first column in
Figure 11, the flare in the sky near the birds led to a false alarm in the detection results of the faster R-CNN and ISTDet algorithm. In the second column in
Figure 11, other types of objects occupied a large proportion of the whole image; thus, it was difficult to detect small aircraft in the air with YOLO V3, faster R-CNN, and RFBnet. TCTHR, ISTDet, and IRSTD-GAN failed to detect targets, and YOLO V4-Tiny and ALCNet produced a false alarm. In the third column, the large and medium aircraft are covered by clouds, which seriously disturbs the detection results of the YOLO series, TCTHR, and IRSTD-GAN, and the target is not detected. From the fourth column, in which the large and medium aircraft are on a simple background, we could find that the detection and localization effects of each algorithm were all good. In summary, the algorithm we proposed has a lower false alarm rate, higher precision, and better network robustness. This is because the network we proposed above could overcome the deficiency of single modal feature description for small targets, which utilizes the complementary between multi-modal features with a morphological domain fused with multi-scale context information and the measurement domain applied with two-level feature extraction, namely, local and global extraction, to achieve better detection performance.
3.4.2. Quantitative Evaluation
We conducted quantitative comparison experiments on nine state-of-the-art target detection methods, including YOLO V3, YOLO V4-tiny, faster R-CNN, RFBnet, TCTHR, ISTDet, IRSTD-GAN, ALCNet, and the methods we described above on our private dataset established in this paper, the OEDD.
The results of the real-time performance and accuracy indexes counted and evaluated of the above five algorithms are shown in
Table 4. To ensure fairness of the comparison, the following operations were performed. The anchors were tuned in the alternative methods using the K-means clustering algorithm [
73] for infrared small-target detection. The same data preprocessing procedure, which is addressed in
Section 2.2, was carried out for all the methods. The input data for all the structures mentioned in
Table 4 could be integrated into the same size of 208 × 208 by means of letterbox operation in which the ratio of the original image for equal scaling is kept and the rest of the short edges are filled with gray pixels.
From the table, it can be seen that the accuracy evaluation indexes of the algorithm we proposed, which are PavG And mAP, are better than those of the eight abovementioned target detection methods. Moreover, the F1 score was also the best of all. This indicates that our method has a good balance between precision and recall in infrared small-target detection. However, it must be mentioned that the evaluation of the real-time performance of the method decreases slightly. The FPS is 10.8 fps, whereas GFLOPs was only 179.51 at present.
It is known that the P–R curve could show the balance between the precision and recall of a classifier. The performance of an excellent classifier is as follows. Precision would remain at a high level while recall increases. However, the classifier with poor performance may lose a large amount of precision in exchange for the increase in recall. It can be seen from the P–R curve below that our method has a perfect balance between precision and recall, which means that it could focus on maintaining a higher accuracy of target detection in complex scenes with target size, classification, and position changes. The comparison results for the P–R curves of the nine state-of-the-art methods over the OEDD are shown in
Figure 13.
4. Discussion
MFFN is an end-to-end DNN-based detector, which combines the morphological characteristics, radiation, and motion characteristics of infrared small targets. The experimental results on the four real-time sequences demonstrate that the network we proposed has a better accuracy performance on infrared small targets. As can be seen in
Table 4, the p
AVg, mAP, and F
1 scores on the OEDD dataset are 92.64%, 92.01%, and 0.9052, respectively, which could meet the index requirements for the detection ability of our opto-electronic equipment. Moreover, this would have far-reaching significance on the performance improvements of the passive, long-distance, and high-precision detection of military small targets under diverse national defense fields such as anti-missile warning and ballistic missile penetration [
74].
We conducted comparison experiments on several datasets to demonstrate the extensive effectiveness of our algorithm; the results are shown in
Table 5. From the accuracy and real-time performance index comparison on the different datasets, which are CIFAR10, COCO, VOC, FLIR, and OEDD, it could be seen that the mAP and F
1 score of our algorithm on our own self-established dataset, the OEDD, is the best of all the other open-access datasets. However, the FPS on CIFAR10 outperforms ours because the resolution of the images is 32*32, which is lower than that of the other four datasets. Compared with CIFAR10, COCO, VOC, and FLIR, the mAPs on OEDD increased by 7.66%, 5.30%, 6.59%, and 3.77%, respectively, and the F
1 scores on OEDD increased by 8.11%, 5.37%, 6.65%, and 3.84%, respectively. This could be attributed to the OEDD containing the multimodal features of infrared targets, which would help promote the accuracy performance and enhance the robustness of the detection system. The radiation and motion characteristics could complement the deficiency of the single morphological features. Furthermore, it is indicated that the algorithm we proposed is not only effective in the detection of infrared targets, but is also available for visible targets from the accuracy performance indicators gained from training on CIFAR10, COCO, and VOC.
It can be seen from
Table 4 that the FPS and GFLOPs of our method gained from the training on the OEDD still need to be improved. We could have carried out some essential work, such as model distillation, to decrease the number of the parameters of our target detection network [
75]. The idea of model distillation is to use a trained, large, but effective teacher model to train a lightweight student model with fewer parameters with the accuracy of the student model ensured near the teacher model and reduced model size and fewer computing resources. The first step of model distillation is to train the big model, called the teacher model. The hard label is used to improve the accuracy of the model while training large amounts of epochs. Secondly, the student model and teacher model are combined to perform distillation training. The weight of the large model is frozen after loading to obtain the output of the soft target. The loss function of the soft target and hard target is calculated in the student model. The loss is weighted and summed; then, the gradient and the parameters of the student model are updated. Furthermore, it is proposed to adopt slice-aided hyper inference (SAHI) [
76] and fine-tuning architecture in order to further improve the accuracy of small-target detection. It is a general and open-source architecture and could be applied to any detector. This general solution could be used to detect small targets in high-resolution images with low complexity and memory required. We divide the input image into overlapping slices, perform interference on the smaller slices of the original image, and then combine the slice prediction on the original image in SAHI. In this way, we could achieve a network with both perfect real-time and precision performance, with a better speed–accuracy trade-off [
77].
5. Conclusions
A novel and effective infrared small-target classification and detection network was designed in this study. An MFFN with an attention mechanism combines the morphological characteristics, radiation, and motion characteristics of the infrared small targets. This network, with the ability to automatically learn the importance of the features of each channel, could make full use of the complementarity between multimodal information to make up for deficiencies in the description of single modal characteristics of the target and improve the ability of target classification and detection. The feature extraction of measurement sequences, including the radiation characteristic and motion sequence, is realized by the DC-BERT model combined with the channel attention mechanism. Among them, we have built an atmospheric transmittance prediction model based on a DNN and obtained the infrared radiation intensity of the target itself through radiation characteristic inversion and atmospheric transmission correction, which could overcome the limitations of complex environments to effectively predict atmospheric transmittance and improve the measurement accuracy of radiation characteristics. The morphological feature extraction was realized based on MSFE with a global search and local search carried out for the key frames and non-key frames, respectively. Among them, the key frame introduces the DAMR and the SCFPN structures to reduce the missed alarm rate of small targets and improve the detection accuracy through the fusion of small target features and multi-scale context features. The feature extraction of non-key frames obtains local features based on the BERT model and fuses them with the global high-level features of the key frames.
In addition, we have designed an engineering medium-sized private dataset, OEDD, with diverse categories and balanced numbers of samples based on the target characteristic database accumulated by our project team in air defense and antimissile experiments over the past ten years.
Finally, we conducted performance comparison experiments on infrared small targets on the sequences of large and medium aircraft, small aircraft, floating balls, and birds to demonstrate the detection performances of the network we have described above. The experimental results indicate that the detection algorithm we proposed outperformed other detection algorithms in terms of the accuracy of infrared small-target detection and has a better speed–accuracy trade-off in comparison.


