Asian Rice Calendar Dynamics Detected by Remote Sensing and Their Climate Drivers
Abstract
:1. Introduction
2. Materials and Methods
2.1. Study Area
2.2. Data
2.2.1. Ground Rice Calendars
2.2.2. Remote Sensing Data
2.2.3. Climate Variables
2.3. Methods
2.3.1. Phenological Dates Retrieved from GLASS AVHRR LAI
- (1)
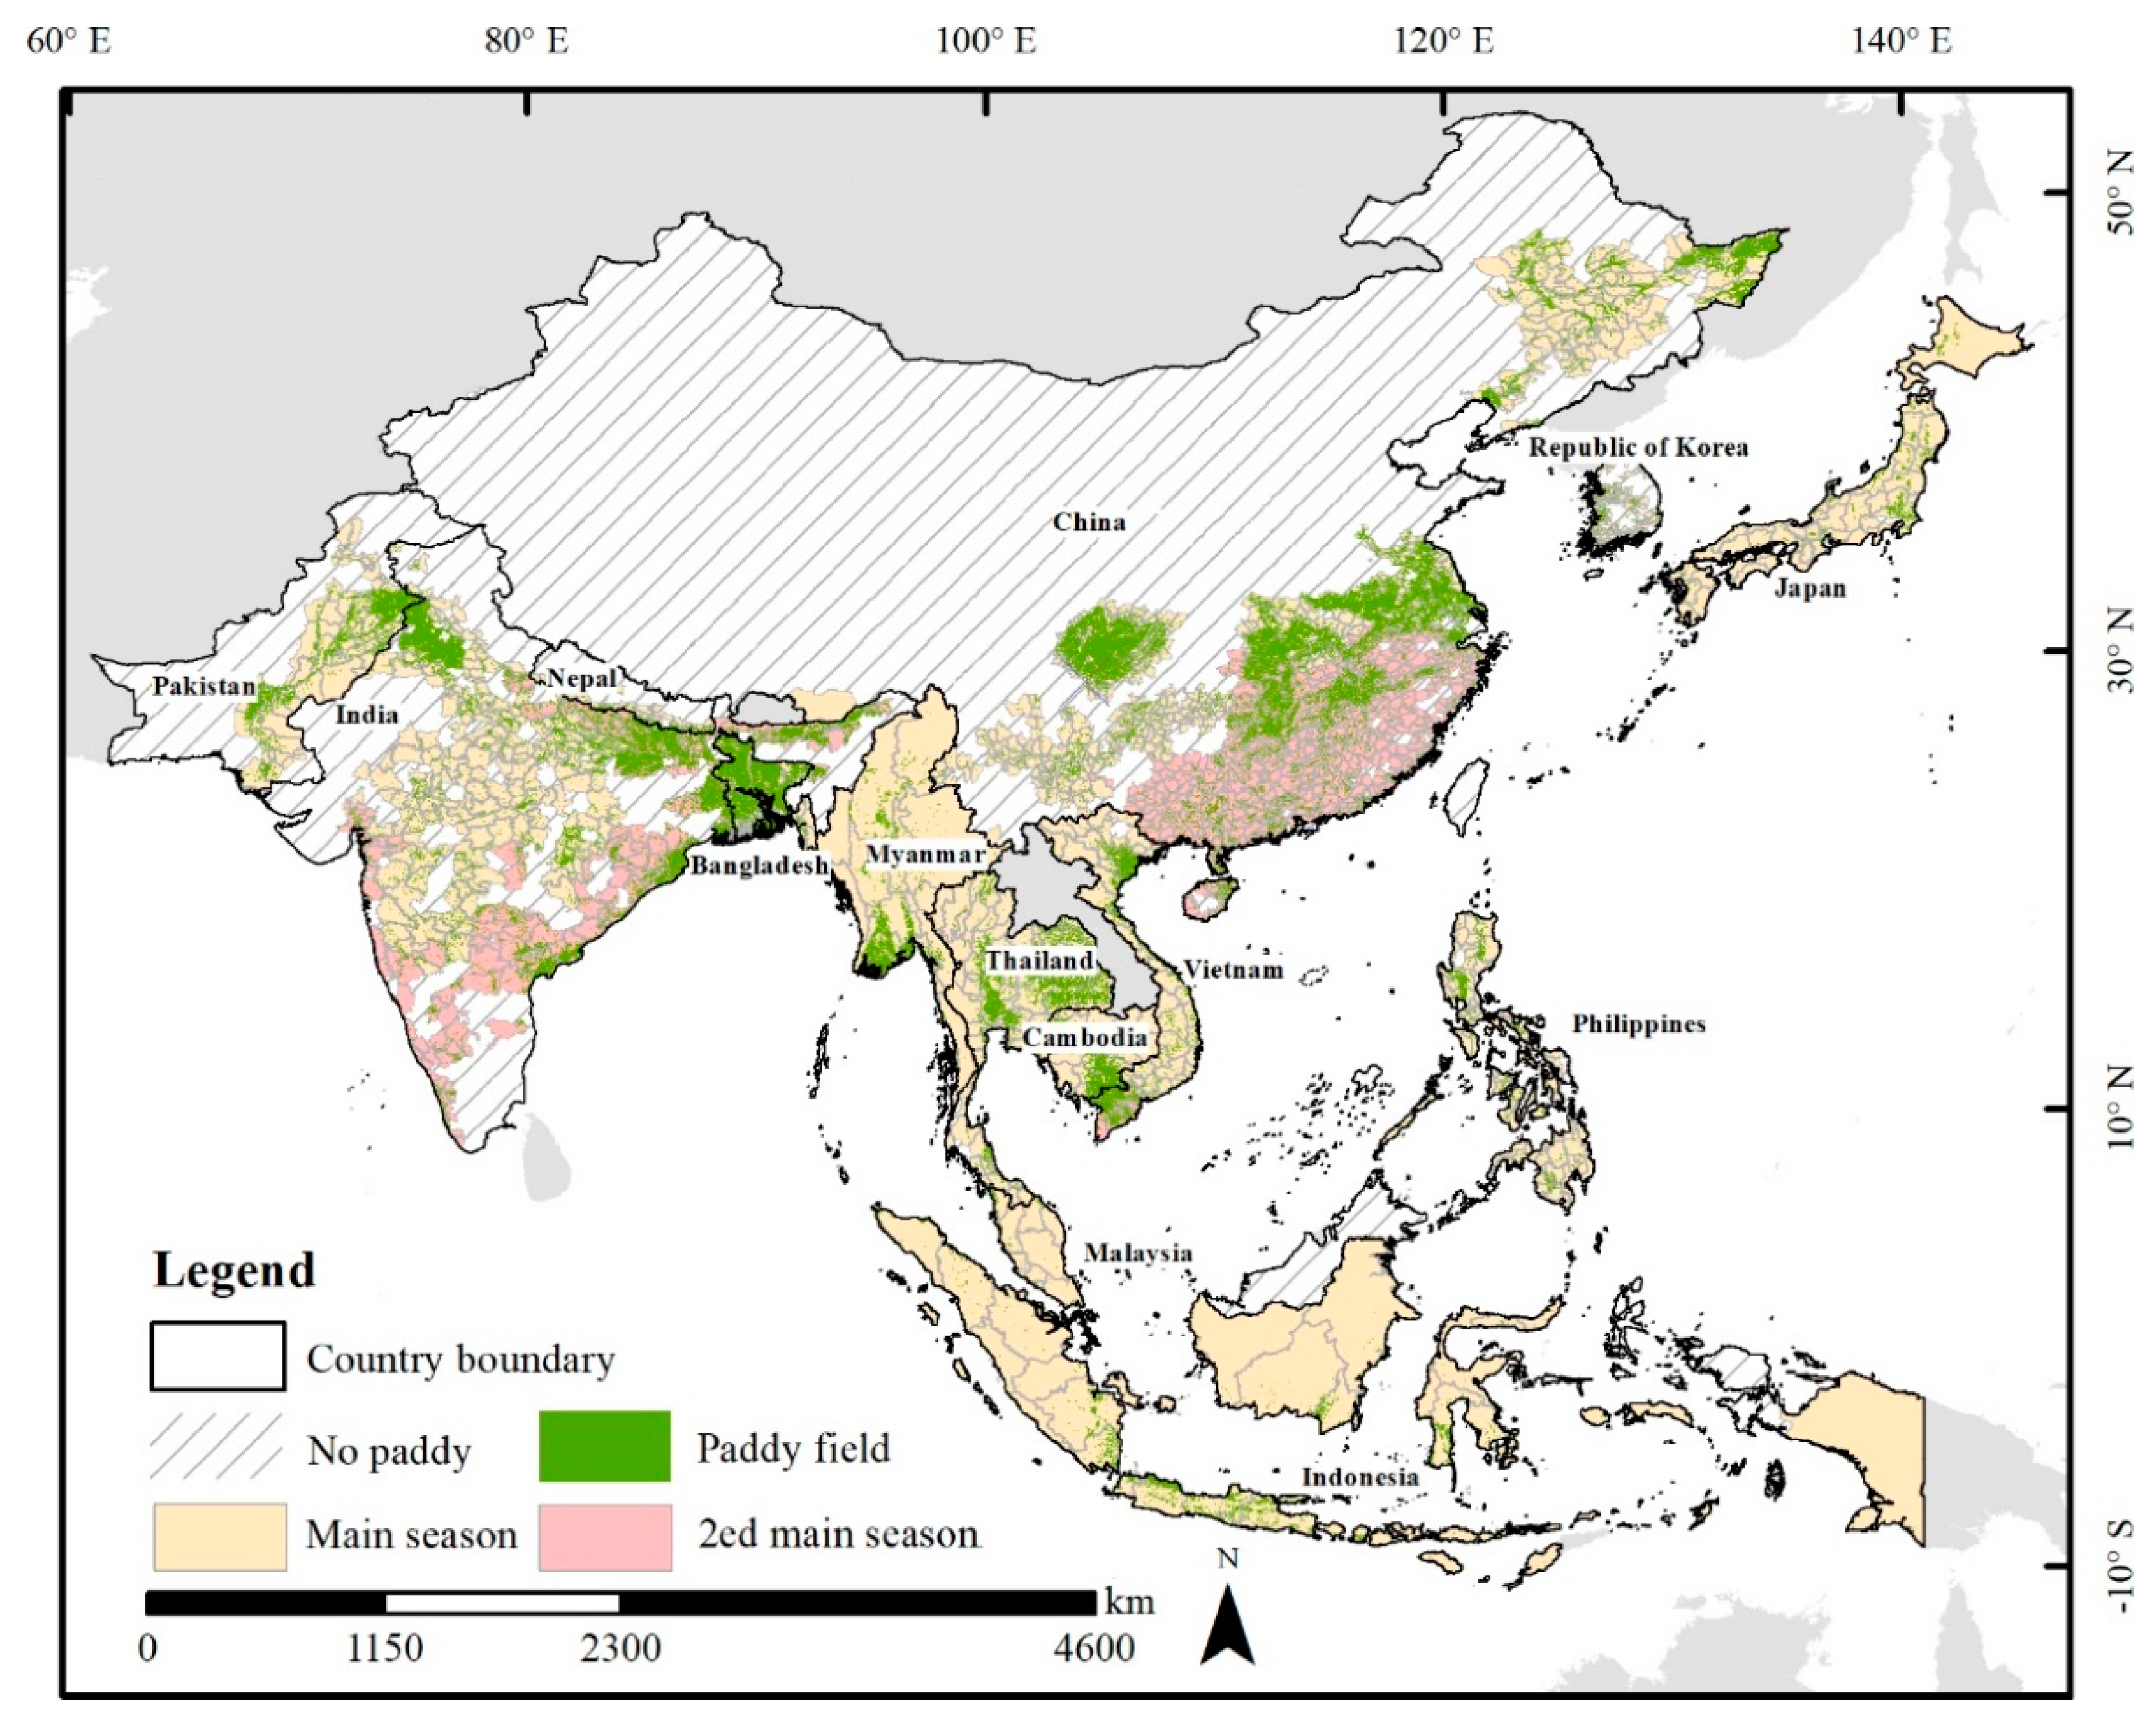
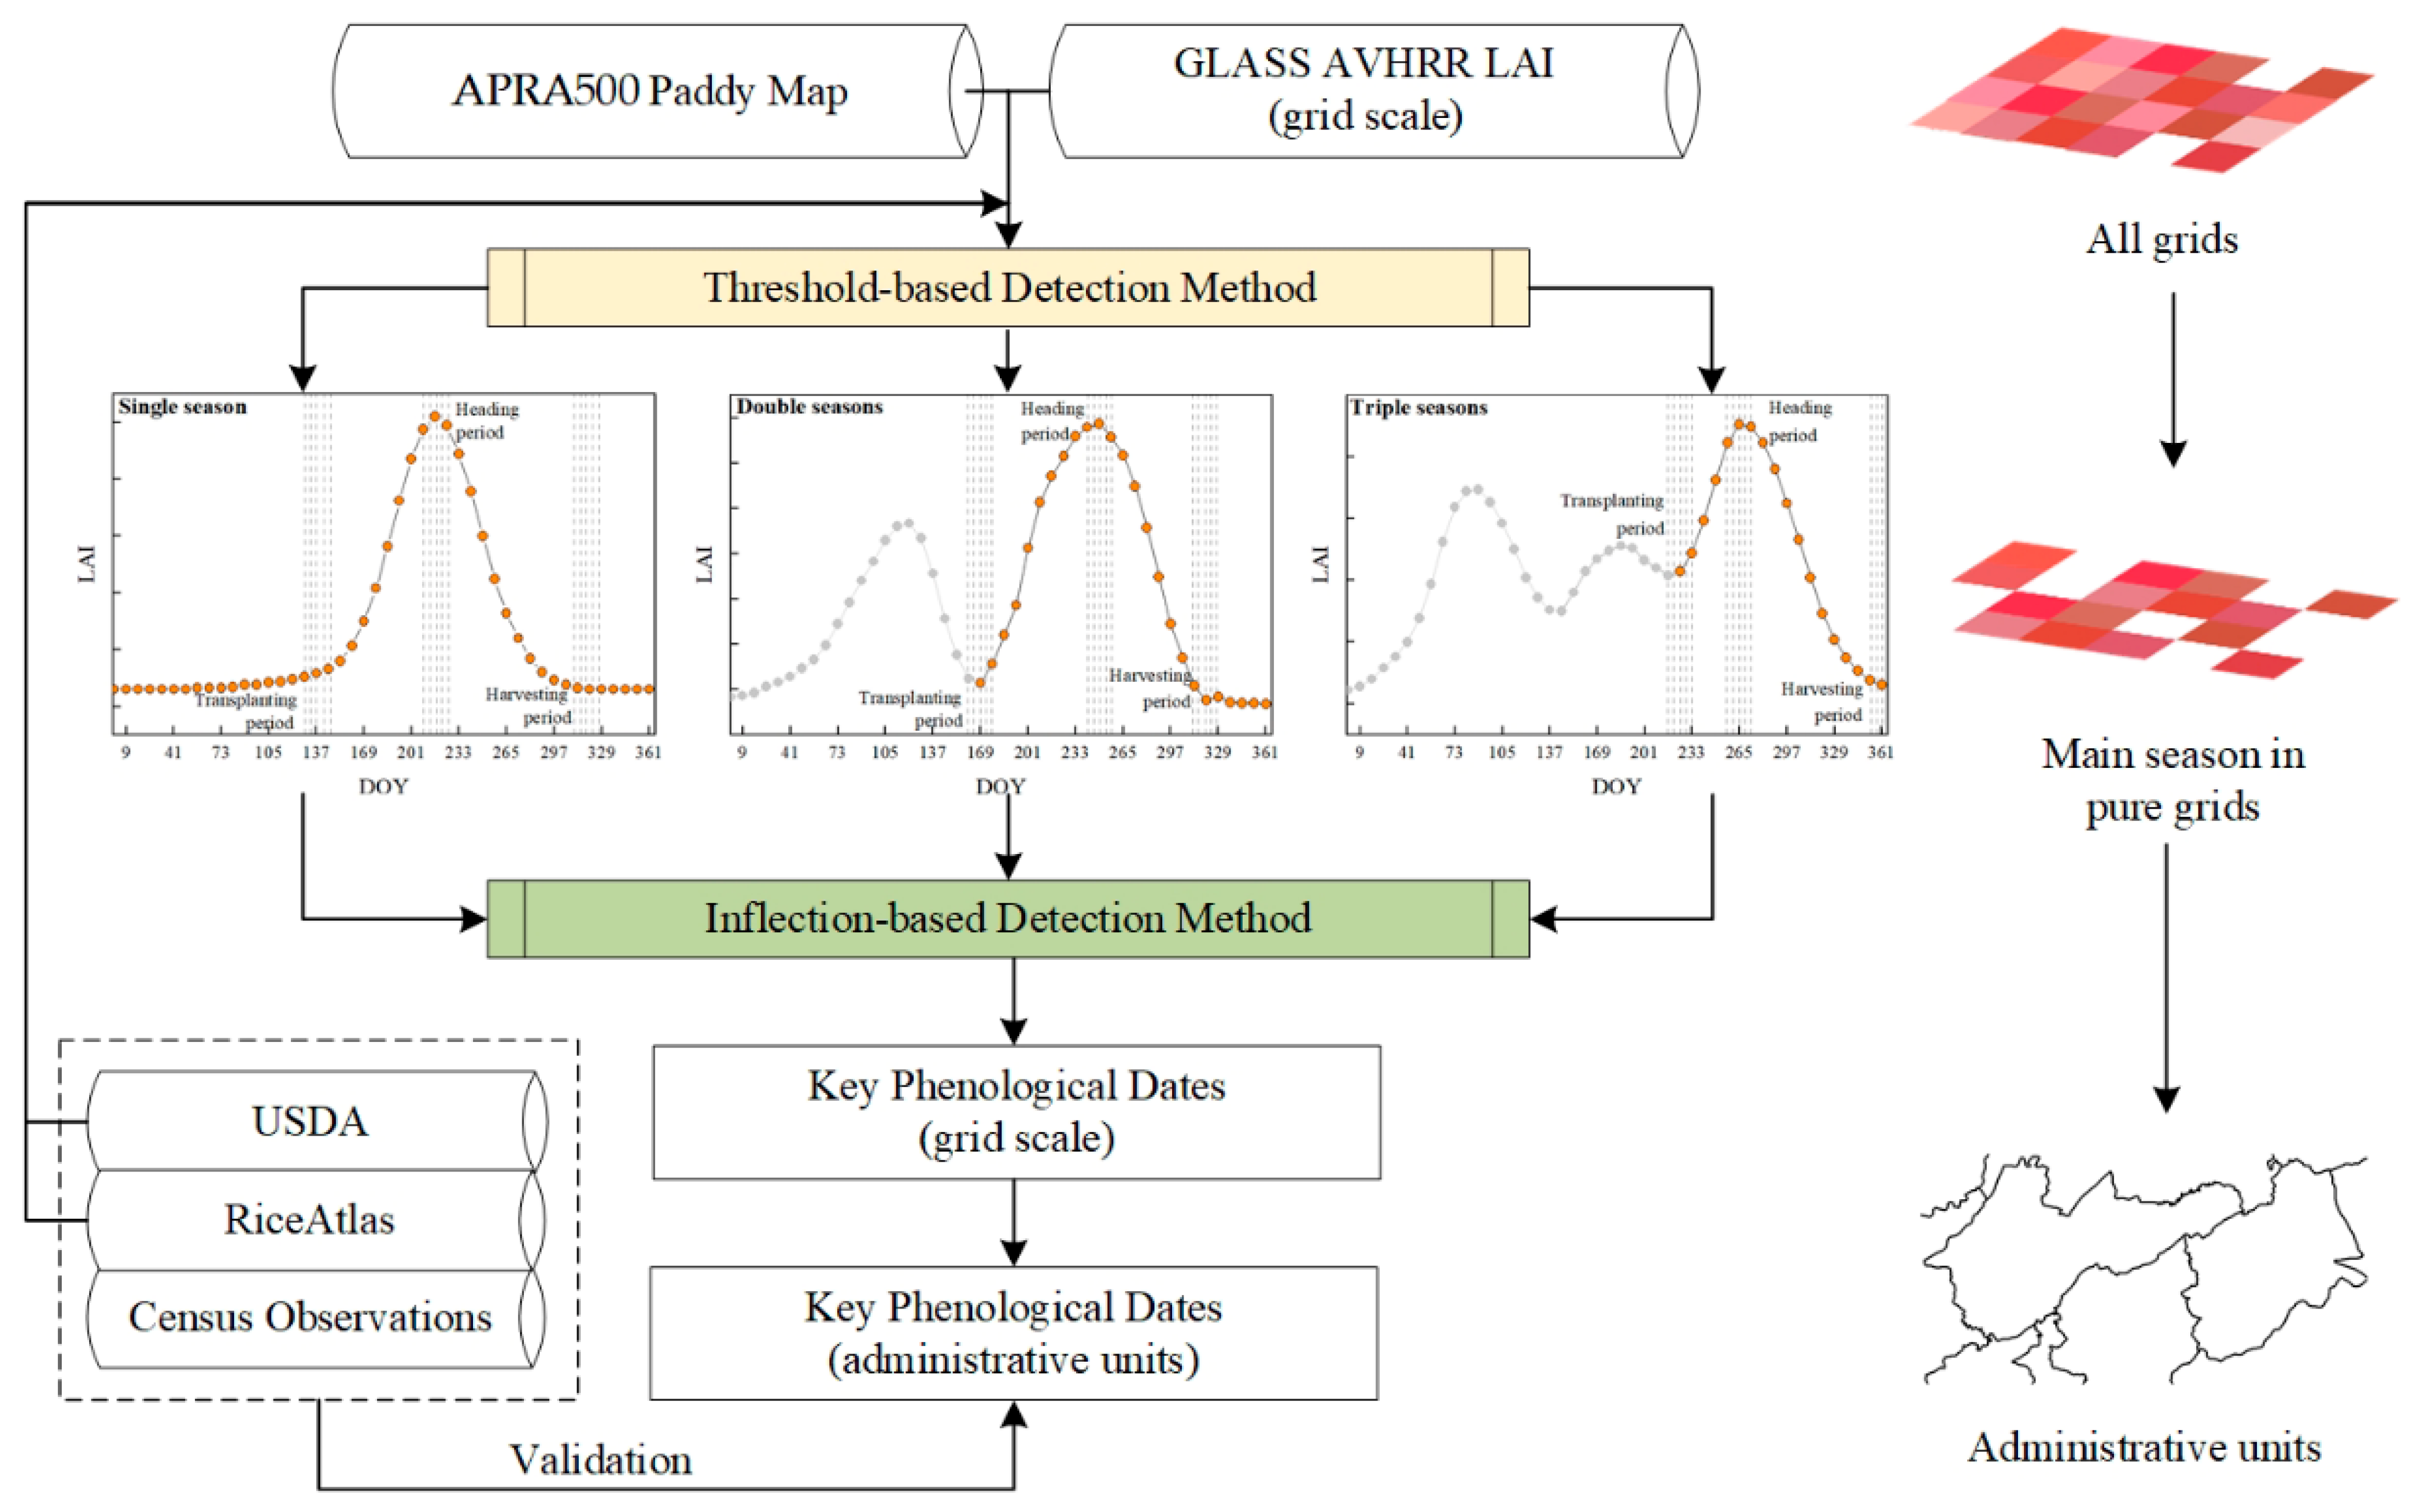
- We determined the pure grids for the main rice-cropping seasons based on the threshold method. First, we resampled paddy rice grids from the original resolution of APRA500 (500 m) to the resolution of the GLASS AVHRR LAI (0.05°) so that we could assign GLASS AVHRR LAI values to each 0.05° × 0.05° paddy rice grid. However, grids with the rice-specific LAI time series vary greatly among different rice seasons in each year because of the mixed-pixel problems and cloud pollution of remote sensing data. Therefore, second, we used the monthly growing windows information from the USDA (Table 1) as the thresholds to extract the LAI time series for each rice season at grid scale. For example, only LAI values during the period May–Dec were used for rice in Bangladesh. RiceAtlas [6] provided the start and end dates of the transplanting, heading, and harvesting periods, and we further applied them to each grid. Finally, the grid would be filtered out if half of its LAI time series was beyond the long-term average ± two times the standard deviation during 1995–2015. The rest of the grids were so-called “pure grids,” the LAI time series of which could reflect dynamic vegetation characteristics at key phenological stages of rice.
- (2)
- We retrieved the transplanting, heading, and harvesting dates from the LAI curve, based on the inflection-based method. Generally, the LAI remains at a low value before transplanting and then rapidly increases after this date. Therefore, if the first derivative is greater than 0 or the second derivative is equal to 0 at one point on the LAI curve during the transplanting period, this point indicates the transplanting date [28,29]. The heading date is at the inflection point with the peak LAI value on one LAI curve [30]. Finally, the point on the LAI curve has a negative first derivative value at the harvesting date because crop activities drop sharply during the harvesting period [9]. Furthermore, if there were imperfect LAI time series at grid scale, we also considered other remote-sensing-retrieved rice calendars in an effort to improve our results, for example, ChinaCropPhen1km [13].
- (3)
- We aggregated phenological dates from grids into administrative units (see Table 1) and assessed their accuracy assessment by comparing them with the ground rice calendars (see Section 2.2.1). In addition, the average of the retrieved phenological dates during 1995–2015 was calculated at the administrative unit scale to enable us to compare their accuracy with the peak value of each growing stage published in the RiceAtlas. Considering that the RiceAtlas had no heading date information, we used the midpoint of mid-season from the USDA as the referenced heading date for the accuracy assessment. The seasonally phenological dates from census-based observations also provided reference data for the accuracy assessment. The coefficient of determination (R2) and RMSE were used to evaluate the accuracy of the retrieved phenological dates for each rice season as follows:where n is the number of administrative units and i = 1, 2, …, n. represents the observed phenological dates from the USDA, RiceAtlas, and census-based observations at the ith administrative unit. is the average phenological date across all administrative units. represents the phenological date retrieved from remote sensing data at the ith administrative unit.
2.3.2. Sensitivity Analysis
3. Results
3.1. Accuracy Assessment of the Remote-Sensing-Retrieved Phenological Dates
3.2. Dynamic Changes of Rice Calendars in Asia
3.3. Impacts of Climate Variables on Rice Calendars
4. Discussion
4.1. An Extended Rice Calendar Based on Remote Sensing in Asia
4.2. Improvements in Identifying Climate Contributions on Rice Calendar Changes
4.3. Uncertainties and Limitations
5. Conclusions
Author Contributions
Funding
Data Availability Statement
Conflicts of Interest
References
- Piao, S.; Liu, Q.; Chen, A.; Janssens, I.A.; Fu, Y.; Dai, J.; Liu, L.; Lian, X.U.; Shen, M.; Zhu, X. Plant phenology and global climate change: Current progresses and challenges. Glob. Chang. Biol. 2019, 25, 1922–1940. [Google Scholar] [CrossRef] [PubMed]
- Ettinger, A.K.; Chamberlain, C.J.; Morales-Castilla, I.; Buonaiuto, D.M.; Flynn, D.F.B.; Savas, T.; Samaha, J.A.; Wolkovich, E.M. Winter temperatures predominate in spring phenological responses to warming. Nat. Clim. Chang. 2020, 10, 1137–1142. [Google Scholar] [CrossRef]
- Kawatsu, S.; Homma, K.; Horie, T.; Shiraiwa, T. Change of weather condition and its effect on rice production during the past 40 years in Japan. Jpn. J. Crop. Sci. 2007, 76, 423–432. [Google Scholar] [CrossRef]
- Zhang, L.; Zhang, Z.; Zhang, J.; Luo, Y.; Tao, F. Response of rice phenology to climate warming weakened across China during 1981–2018: Did climatic or anthropogenic factors play a role? Environ. Res. Lett. 2022, 17, 064029. [Google Scholar] [CrossRef]
- Bandumula, N. Rice production in Asia: Key to global food security. Proc. Natl. Acad. Sci. India Sect. B Biol. Sci. 2018, 88, 1323–1328. [Google Scholar] [CrossRef]
- Laborte, A.G.; Gutierrez, M.A.; Balanza, J.G.; Saito, K.; Zwart, S.J.; Boschetti, M.; Murty, M.V.R.; Villano, L.; Aunario, J.K.; Reinke, R.; et al. RiceAtlas, a spatial database of global rice calendars and production. Sci. Data 2017, 4, 1–10. [Google Scholar] [CrossRef]
- Mishra, B.; Busetto, L.; Boschetti, M.; Laborte, A.; Nelson, A. RICA: A rice crop calendar for Asia based on MODIS multi year data. Int. J. Appl. Earth Obs. Geoinf. 2021, 103, 102471. [Google Scholar] [CrossRef]
- Wang, C.; Zhang, Z.; Chen, Y.; Tao, F.; Zhang, J.; Zhang, W. Comparing different smoothing methods to detect double-cropping rice phenology based on LAI products—A case study in the Hunan province of China. Int. J. Remote Sens. 2018, 39, 6405–6428. [Google Scholar] [CrossRef]
- Zhang, J.; Zhang, Z.; Wang, C.; Tao, F. Double-rice system simulation in a topographically diverse region—A remote-sensing-driven case study in Hunan Province of China. Remote Sens. 2019, 11, 1577. [Google Scholar] [CrossRef]
- Zhang, X.; Friedl, M.A.; Schaaf, C.B.; Strahler, A.H.; Hodges, J.C.; Gao, F.; Reed, B.C.; Huete, A. Monitoring vegetation phenology using MODIS. Remote Sens. Environ. 2003, 84, 471–475. [Google Scholar] [CrossRef]
- Boschetti, M.; Stroppiana, D.; Brivio, P.A.; Bocchi, S. Multi-year monitoring of rice crop phenology through time series analysis of MODIS images. Int. J. Remote Sens. 2009, 30, 4643–4662. [Google Scholar] [CrossRef]
- Boschetti, M.; Busetto, L.; Manfron, G.; Laborte, A.; Asilo, S.; Pazhanivelan, S.; Nelson, A. PhenoRice: A method for automatic extraction of spatio-temporal information on rice crops using satellite data time series. Remote Sens. Environ. 2017, 194, 347–365. [Google Scholar] [CrossRef]
- Luo, Y.; Zhang, Z.; Chen, Y.; Li, Z.; Tao, F. ChinaCropPhen1km: A high-resolution crop phenological dataset for three staple crops in China during 2000–2015 based on leaf area index (LAI) products. Earth Syst. Sci. Data 2020, 12, 197–214. [Google Scholar] [CrossRef]
- Thackeray, S.J.; Henrys, P.A.; Hemming, D.; Bell, J.R.; Botham, M.S.; Burthe, S.; Helaouet, P.; Johns, D.G.; Jones, I.D.; Leech, D.I.; et al. Phenological sensitivity to climate across taxa and trophic levels. Nature 2016, 535, 241–245. [Google Scholar] [CrossRef]
- Yang, L.H.; Rudolf, V. Phenology, ontogeny and the effects of climate change on the timing of species interactions. Ecol. Lett. 2010, 13, 1–10. [Google Scholar] [CrossRef]
- Fu, Y.H.; Zhao, H.; Piao, S.; Peaucelle, M.; Peng, S.; Zhou, G.; Ciais, P.; Huang, M.; Menzel, A.; Peñuelas, J.; et al. Declining global warming effects on the phenology of spring leaf unfolding. Nature 2015, 526, 104–107. [Google Scholar] [CrossRef]
- Han, J.; Zhang, Z.; Luo, Y.; Cao, J.; Zhang, L.; Zhuang, H.; Cheng, F.; Zhang, J.; Tao, F. Annual paddy rice planting area and cropping intensity datasets and their dynamics in the Asian monsoon region from 2000 to 2020. Agric. Syst. 2022, 200, 103437. [Google Scholar] [CrossRef]
- Xiao, Z.; Liang, S.; Wang, J.; Chen, P.; Yin, X.; Zhang, L.; Song, J. Use of general regression neural networks for generating the GLASS leaf area index product from time-series MODIS surface reflectance. IEEE Trans. Geosci. Remote Sens. 2013, 52, 209–223. [Google Scholar] [CrossRef]
- Xiao, Z.; Liang, S.; Wang, J.; Xiang, Y.; Zhao, X.; Song, J. Long-time-series global land surface satellite leaf area index product derived from MODIS and AVHRR surface reflectance. IEEE Trans. Geosci. Remote Sens. 2016, 54, 5301–5318. [Google Scholar] [CrossRef]
- Claverie, M.; Matthews, J.L.; Vermote, E.F.; Justice, C.O. A 30+ year AVHRR LAI and FAPAR climate data record: Algorithm description and validation. Remote Sens. 2016, 8, 263. [Google Scholar] [CrossRef] [Green Version]
- Zhu, Z.; Bi, J.; Pan, Y.; Ganguly, S.; Anav, A.; Xu, L.; Samanta, A.; Piao, S.; Nemani, R.R.; Myneni, R.B. Global data sets of vegetation Leaf Area Index (LAI)3g and Fraction of Photosynthetically Active Radiation (FPAR)3g derived from Global Inventory Modeling and Mapping Studies (GIMMS) Normalized Difference Vegetation Index (NDVI3g) for the period 1981 to 2011. Remote Sens. 2013, 5, 927–948. [Google Scholar]
- Liu, Y.; Liu, R.; Chen, J.M. Retrospective retrieval of long-term consistent global leaf area index (1981–2011) from combined AVHRR and MODIS data. J. Geophys. Res.—Biogeosci. 2012, 117, G04003. [Google Scholar] [CrossRef]
- Xiao, Z.; Liang, S.; Jiang, B. Evaluation of four long time-series global leaf area index products. Agric. For. Meteorol. 2017, 246, 218–230. [Google Scholar] [CrossRef]
- Gao, X.; Liang, S.; He, B. Detected global agricultural greening from satellite data. Agric. For. Meteorol. 2019, 276, 107652. [Google Scholar] [CrossRef]
- Kumar, S.V.; Mocko, D.M.; Wang, S.; Peters-Lidard, C.D.; Borak, J. Assimilation of remotely sensed leaf area index into the Noah-MP land surface model: Impacts on water and carbon fluxes and states over the continental United States. J. Hydrometeorol. 2019, 20, 1359–1377. [Google Scholar] [CrossRef]
- Zhao, Y.; Feng, J.; Luo, L.; Bai, L.; Wan, H.; Ren, H. Monitoring Cropping Intensity Dynamics across the North China Plain from 1982 to 2018 Using GLASS LAI Products. Remote Sens. 2021, 13, 3911. [Google Scholar] [CrossRef]
- Abatzoglou, J.T.; Dobrowski, S.Z.; Parks, S.A.; Hegewisch, K.C. TerraClimate, a high-resolution global dataset of monthly climate and climatic water balance from 1958–2015. Sci. Data. 2018, 5, 1–12. [Google Scholar] [CrossRef]
- Chen, Y.; Zhang, Z.; Tao, F.; Palosuo, T.; Rötter, R.P. Impacts of heat stress on leaf area index and growth duration of winter wheat in the North China Plain. Field Crops Res. 2018, 222, 230–237. [Google Scholar] [CrossRef]
- Sakamoto, T.; Yokozawa, M.; Toritani, H.; Shibayama, M.; Ishitsuka, N.; Ohno, H. A crop phenology detection method using time-series MODIS data. Remote Sens. Environ. 2005, 96, 366–374. [Google Scholar] [CrossRef]
- Sakamoto, T.; Van Nguyen, N.; Ohno, H.; Ishitsuka, N.; Yokozawa, M. Spatio–temporal distribution of rice phenology and cropping systems in the Mekong Delta with special reference to the seasonal water flow of the Mekong and Bassac rivers. Remote Sens. Environ. 2006, 100, 1–16. [Google Scholar] [CrossRef]
- Liu, Y.; Zhou, W.; Ge, Q. Spatiotemporal changes of rice phenology in China under climate change from 1981 to 2010. Clim. Chang. 2019, 157, 261–277. [Google Scholar] [CrossRef]
- Pan, B.; Zheng, Y.; Shen, R.; Ye, T.; Zhao, W.; Dong, J.; Ma, H.; Yuan, W. High resolution distribution dataset of double-season paddy rice in China. Remote Sens. 2021, 13, 4609. [Google Scholar] [CrossRef]
- Soh, N.C.; Shah, R.M.; Giap, S.G.E.; Setiawan, B.I.; Minasny, B. High-Resolution Mapping of Paddy Rice Extent and Growth Stages across Peninsular Malaysia Using a Fusion of Sentinel-1 and 2 Time Series Data in Google Earth Engine. Remote Sens. 2022, 14, 1875. [Google Scholar]
- You, X.; Meng, J.; Zhang, M.; Dong, T. Remote sensing based detection of crop phenology for agricultural zones in China using a new threshold method. Remote Sens. 2013, 5, 3190–3211. [Google Scholar] [CrossRef]
- Tao, F.; Zhang, Z.; Shi, W.; Liu, Y.; Xiao, D.; Zhang, S.; Zhu, Z.; Wang, M.; Liu, F. Single rice growth period was prolonged by cultivars shifts, but yield was damaged by climate change during 1981–2009 in China, and late rice was just opposite. Glob. Chang. Biol. 2013, 19, 3200–3209. [Google Scholar] [CrossRef]
- Hu, X.; Huang, Y.; Sun, W.; Yu, L. Shifts in cultivar and planting date have regulated rice growth duration under climate warming in China since the early 1980s. Agric. For. Meteorol. 2017, 247, 34–41. [Google Scholar] [CrossRef]
- Ye, T.; Zong, S.; Kleidon, A.; Yuan, W.; Wang, Y.; Shi, P. Impacts of climate warming, cultivar shifts, and phenological dates on rice growth period length in China after correction for seasonal shift effects. Clim. Chang. 2019, 155, 127–143. [Google Scholar] [CrossRef]
- Chen, J.; Liu, Y.; Zhou, W.; Zhang, J.; Pan, T. Effects of climate change and crop management on changes in rice phenology in China from 1981 to 2010. J. Sci. Food Agric. 2021, 101, 6311–6319. [Google Scholar] [CrossRef]
- Manfron, G.; Delmotte, S.; Busetto, L.; Hossard, L.; Ranghetti, L.; Brivio, P.A.; Boschetti, M. Estimating inter-annual variability in winter wheat sowing dates from satellite time series in Camargue, France. Int. J. Appl. Earth Obs. 2017, 57, 190–201. [Google Scholar] [CrossRef]
- Gao, F.; Zhang, X. Mapping crop phenology in near real-time using satellite remote sensing: Challenges and opportunities. J. Remote Sens. 2021, 2021, 8379391. [Google Scholar] [CrossRef]
- Hansen, M.C.; Loveland, T.R. A review of large area monitoring of land cover change using Landsat data. Remote Sens. Environ. 2012, 122, 66–74. [Google Scholar] [CrossRef]
- Claverie, M.; Vermote, E.F.; Franch, B.; Masek, J.G. Evaluation of the Landsat-5 TM and Landsat-7 ETM+ surface reflectance products. Remote Sens. Environ. 2015, 169, 390–403. [Google Scholar] [CrossRef]
- Estiarte, M.; Peñuelas, J. Alteration of the phenology of leaf senescence and fall in winter deciduous species by climate change: Effects on nutrient proficiency. Glob. Chang. Biol. 2015, 21, 1005–1017. [Google Scholar] [CrossRef] [PubMed]
- Stone, P.J.; Sorensen, I.B.; Jamieson, P.D. Effect of soil temperature on phenology, canopy development, biomass and yield of maize in a cool-temperate climate. Field Crops Res. 1999, 63, 169–178. [Google Scholar] [CrossRef]
- Ata-Ul-Karim, S.T.; Cang, L.; Wang, Y.; Zhou, D. Effects of soil properties, nitrogen application, plant phenology, and their interactions on plant uptake of cadmium in wheat. J. Hazard. Mater. 2020, 384, 121452. [Google Scholar] [CrossRef]
- Li, C.; Tang, Y.; Luo, H.; Di, B.; Zhang, L. Local farmers’ perceptions of climate change and local adaptive strategies: A case study from the Middle Yarlung Zangbo River Valley, Tibet, China. Environ. Manag. 2013, 52, 894–906. [Google Scholar] [CrossRef]
- Liu, Y.; Zhang, J.; Pan, T.; Ge, Q. Assessing the adaptability of maize phenology to climate change: The role of anthropogenic-management practices. J. Environ. Manag. 2021, 293, 112874. [Google Scholar] [CrossRef]


| Country | Local Name of the Main Season | Administrative Unit 1 | Crop Calendar |
|---|---|---|---|
| Bangladesh | Aman | District | May–December |
| Cambodia | Wet | Province | June–February |
| Indonesia | Main | Province | August–March |
| Japan | Single | Prefectural | April–October |
| Malaysia | Main | State | September–February |
| Myanmar | Single | State | June–November |
| Nepal | Single | District | May–December |
| Pakistan | Single | District | May–December |
| Philippines | Main | Province | April–December |
| Republic of Korea | Single | Town | May–October |
| Thailand | Wet | Province | May–December |
| China | Single | County | April–September |
| Late (2ed) | July–November | ||
| India | Single | District | May–November |
| Kharif (2ed) | June–January | ||
| Vietnam | Autumn | Province | June–November |
| Winter (2ed) | November–March |
Publisher’s Note: MDPI stays neutral with regard to jurisdictional claims in published maps and institutional affiliations. |
© 2022 by the authors. Licensee MDPI, Basel, Switzerland. This article is an open access article distributed under the terms and conditions of the Creative Commons Attribution (CC BY) license (https://creativecommons.org/licenses/by/4.0/).
Share and Cite
Zhang, J.; Wu, H.; Zhang, Z.; Zhang, L.; Luo, Y.; Han, J.; Tao, F. Asian Rice Calendar Dynamics Detected by Remote Sensing and Their Climate Drivers. Remote Sens. 2022, 14, 4189. https://doi.org/10.3390/rs14174189
Zhang J, Wu H, Zhang Z, Zhang L, Luo Y, Han J, Tao F. Asian Rice Calendar Dynamics Detected by Remote Sensing and Their Climate Drivers. Remote Sensing. 2022; 14(17):4189. https://doi.org/10.3390/rs14174189
Chicago/Turabian StyleZhang, Jing, Huaqing Wu, Zhao Zhang, Liangliang Zhang, Yuchuan Luo, Jichong Han, and Fulu Tao. 2022. "Asian Rice Calendar Dynamics Detected by Remote Sensing and Their Climate Drivers" Remote Sensing 14, no. 17: 4189. https://doi.org/10.3390/rs14174189
APA StyleZhang, J., Wu, H., Zhang, Z., Zhang, L., Luo, Y., Han, J., & Tao, F. (2022). Asian Rice Calendar Dynamics Detected by Remote Sensing and Their Climate Drivers. Remote Sensing, 14(17), 4189. https://doi.org/10.3390/rs14174189


