
Characterizing the Distribution Pattern and a Physically Based Susceptibility Assessment of Shallow Landslides Triggered by the 2019 Heavy Rainfall Event in Longchuan County, Guangdong Province, China

Abstract
:
1. Introduction
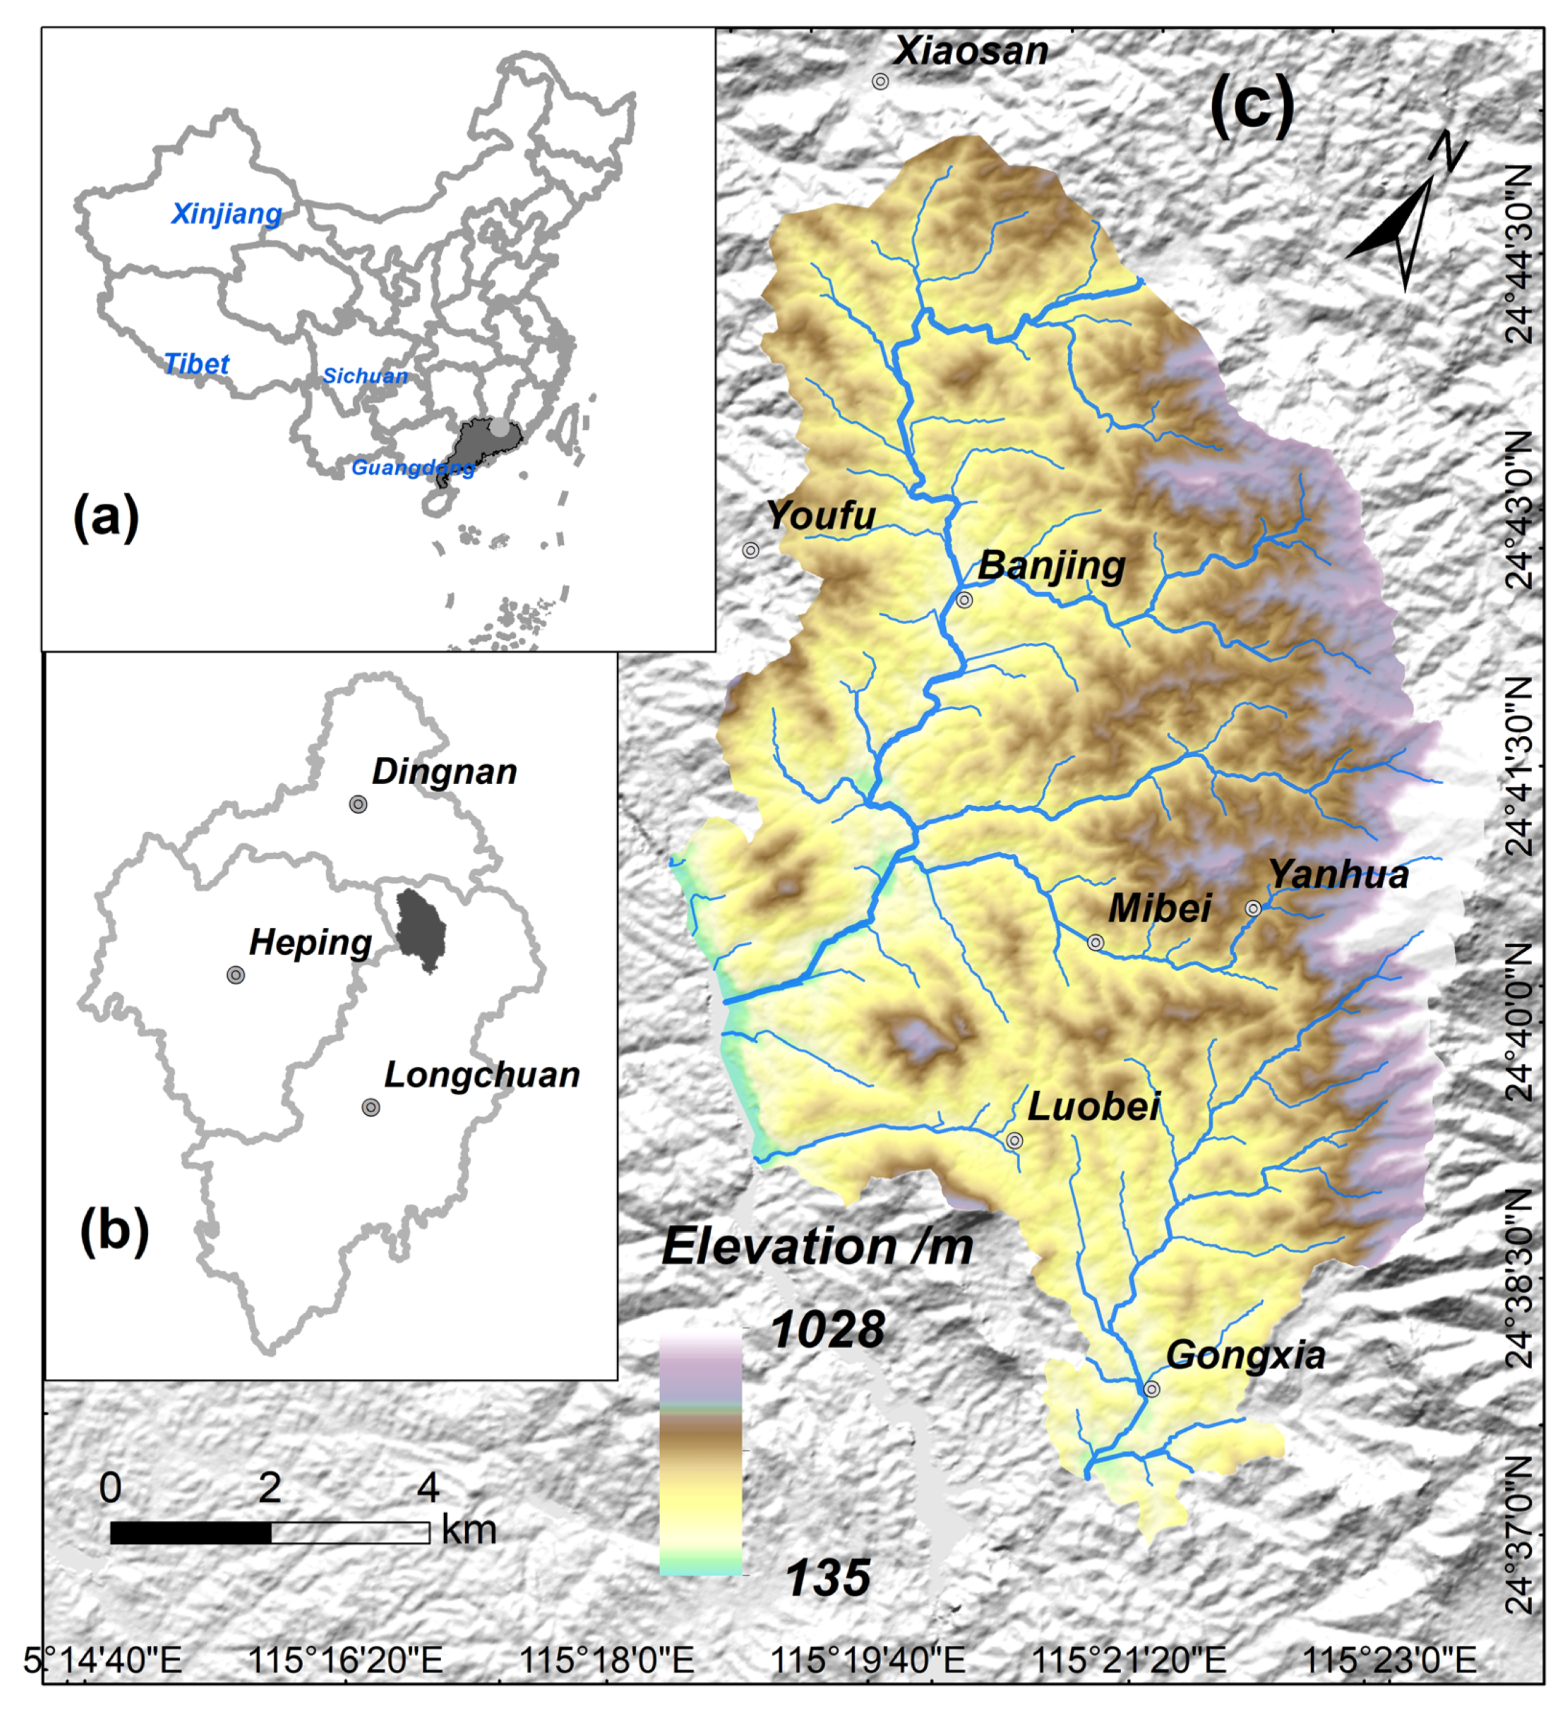
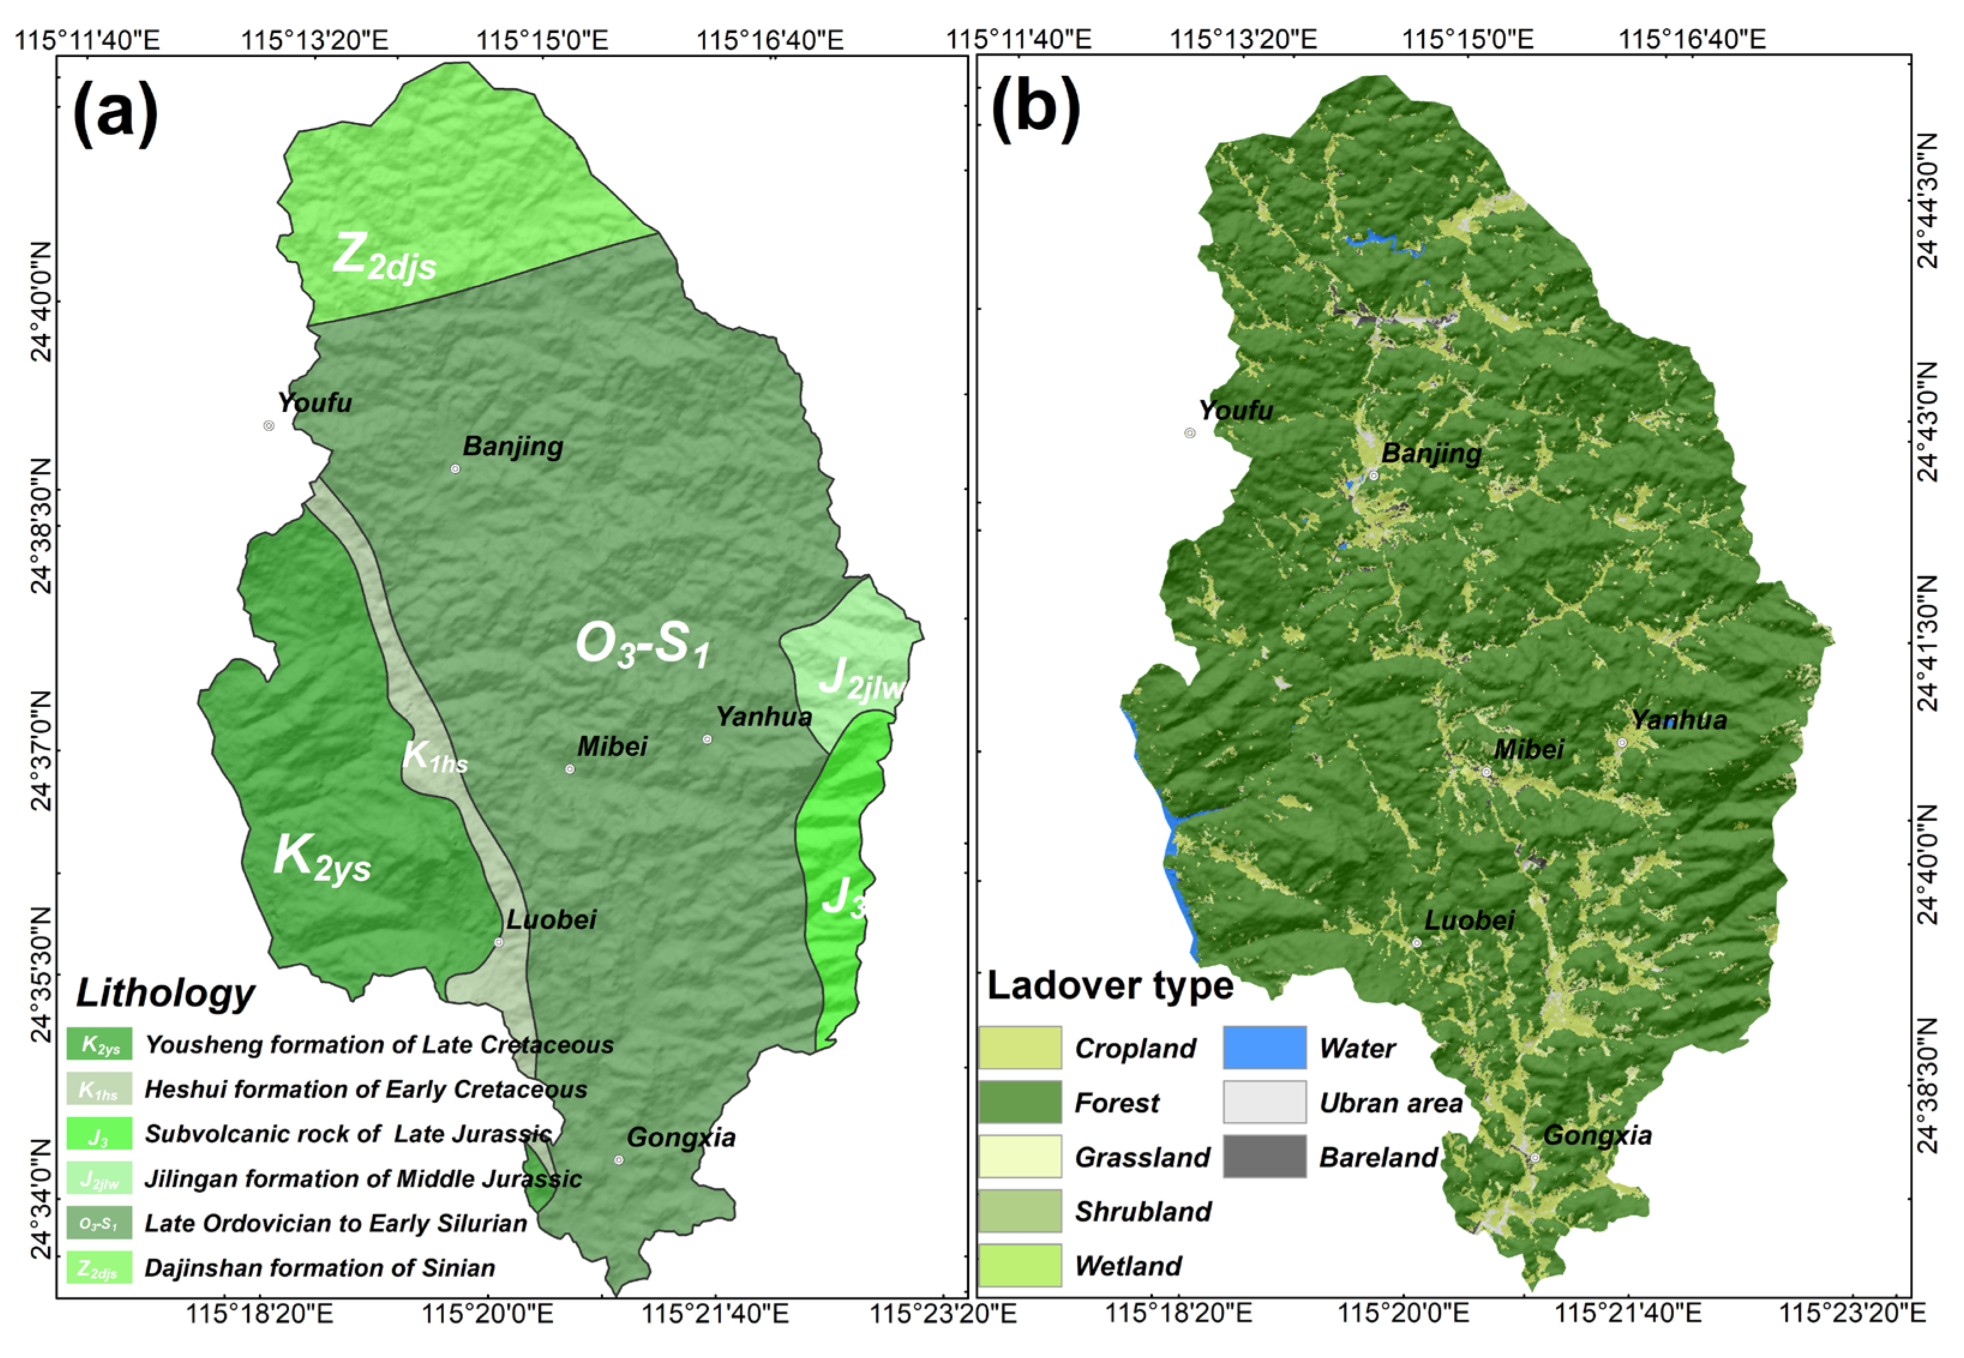
2. Study Area
3. Data and Method
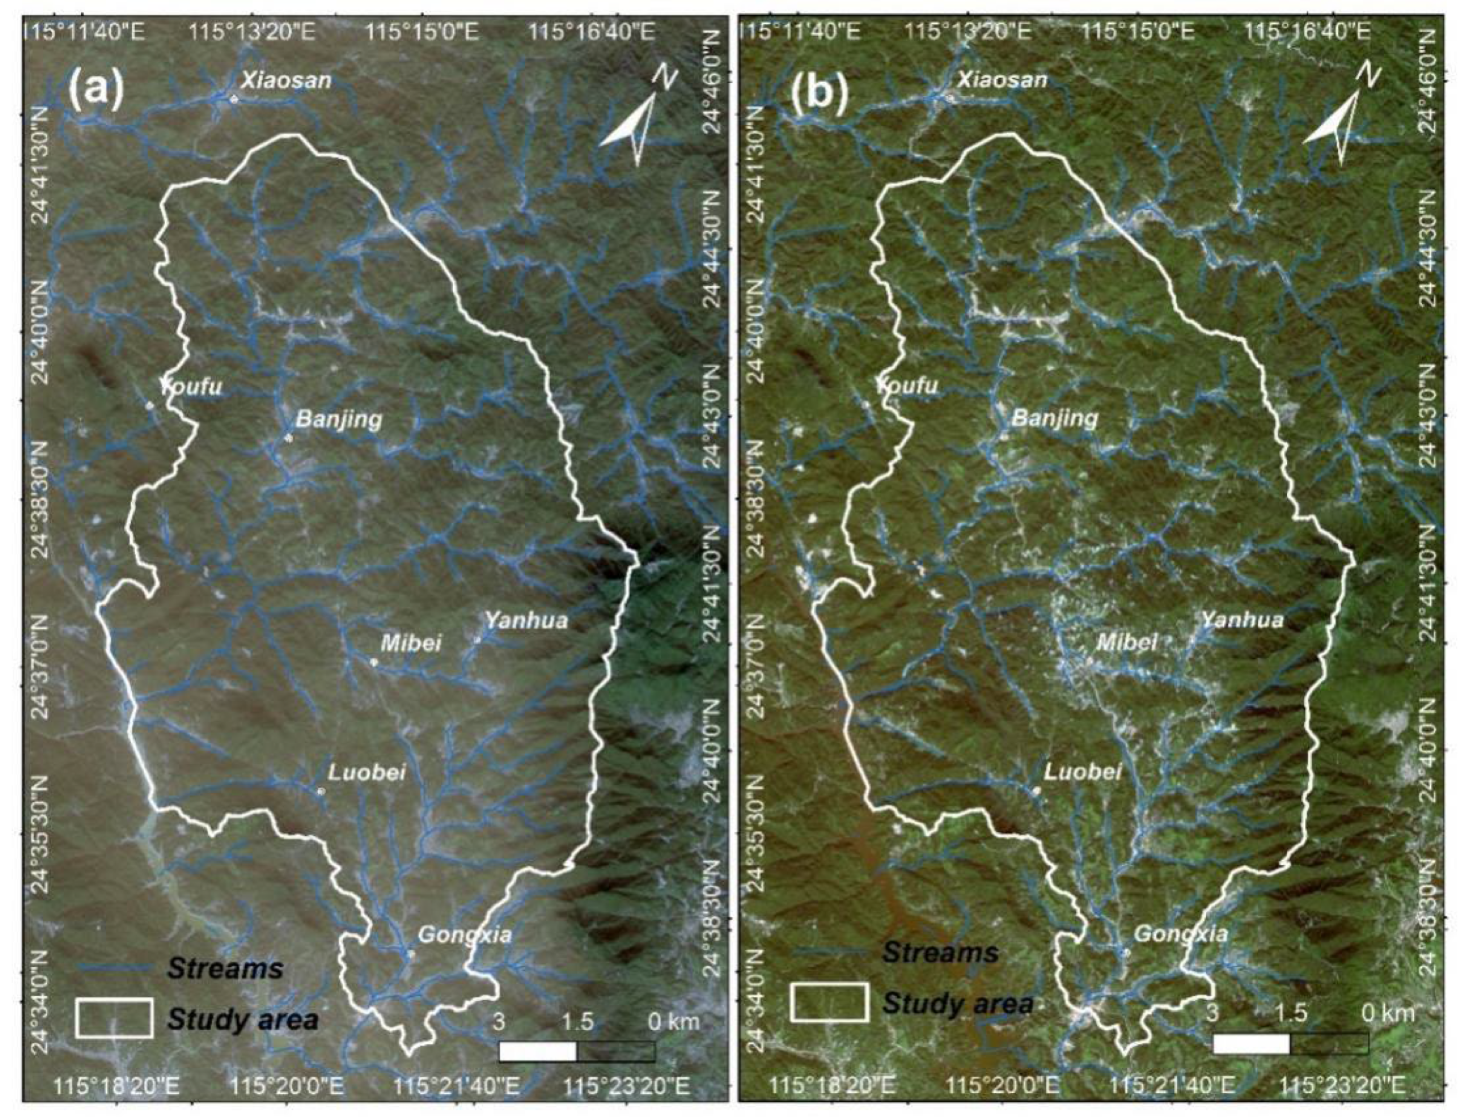
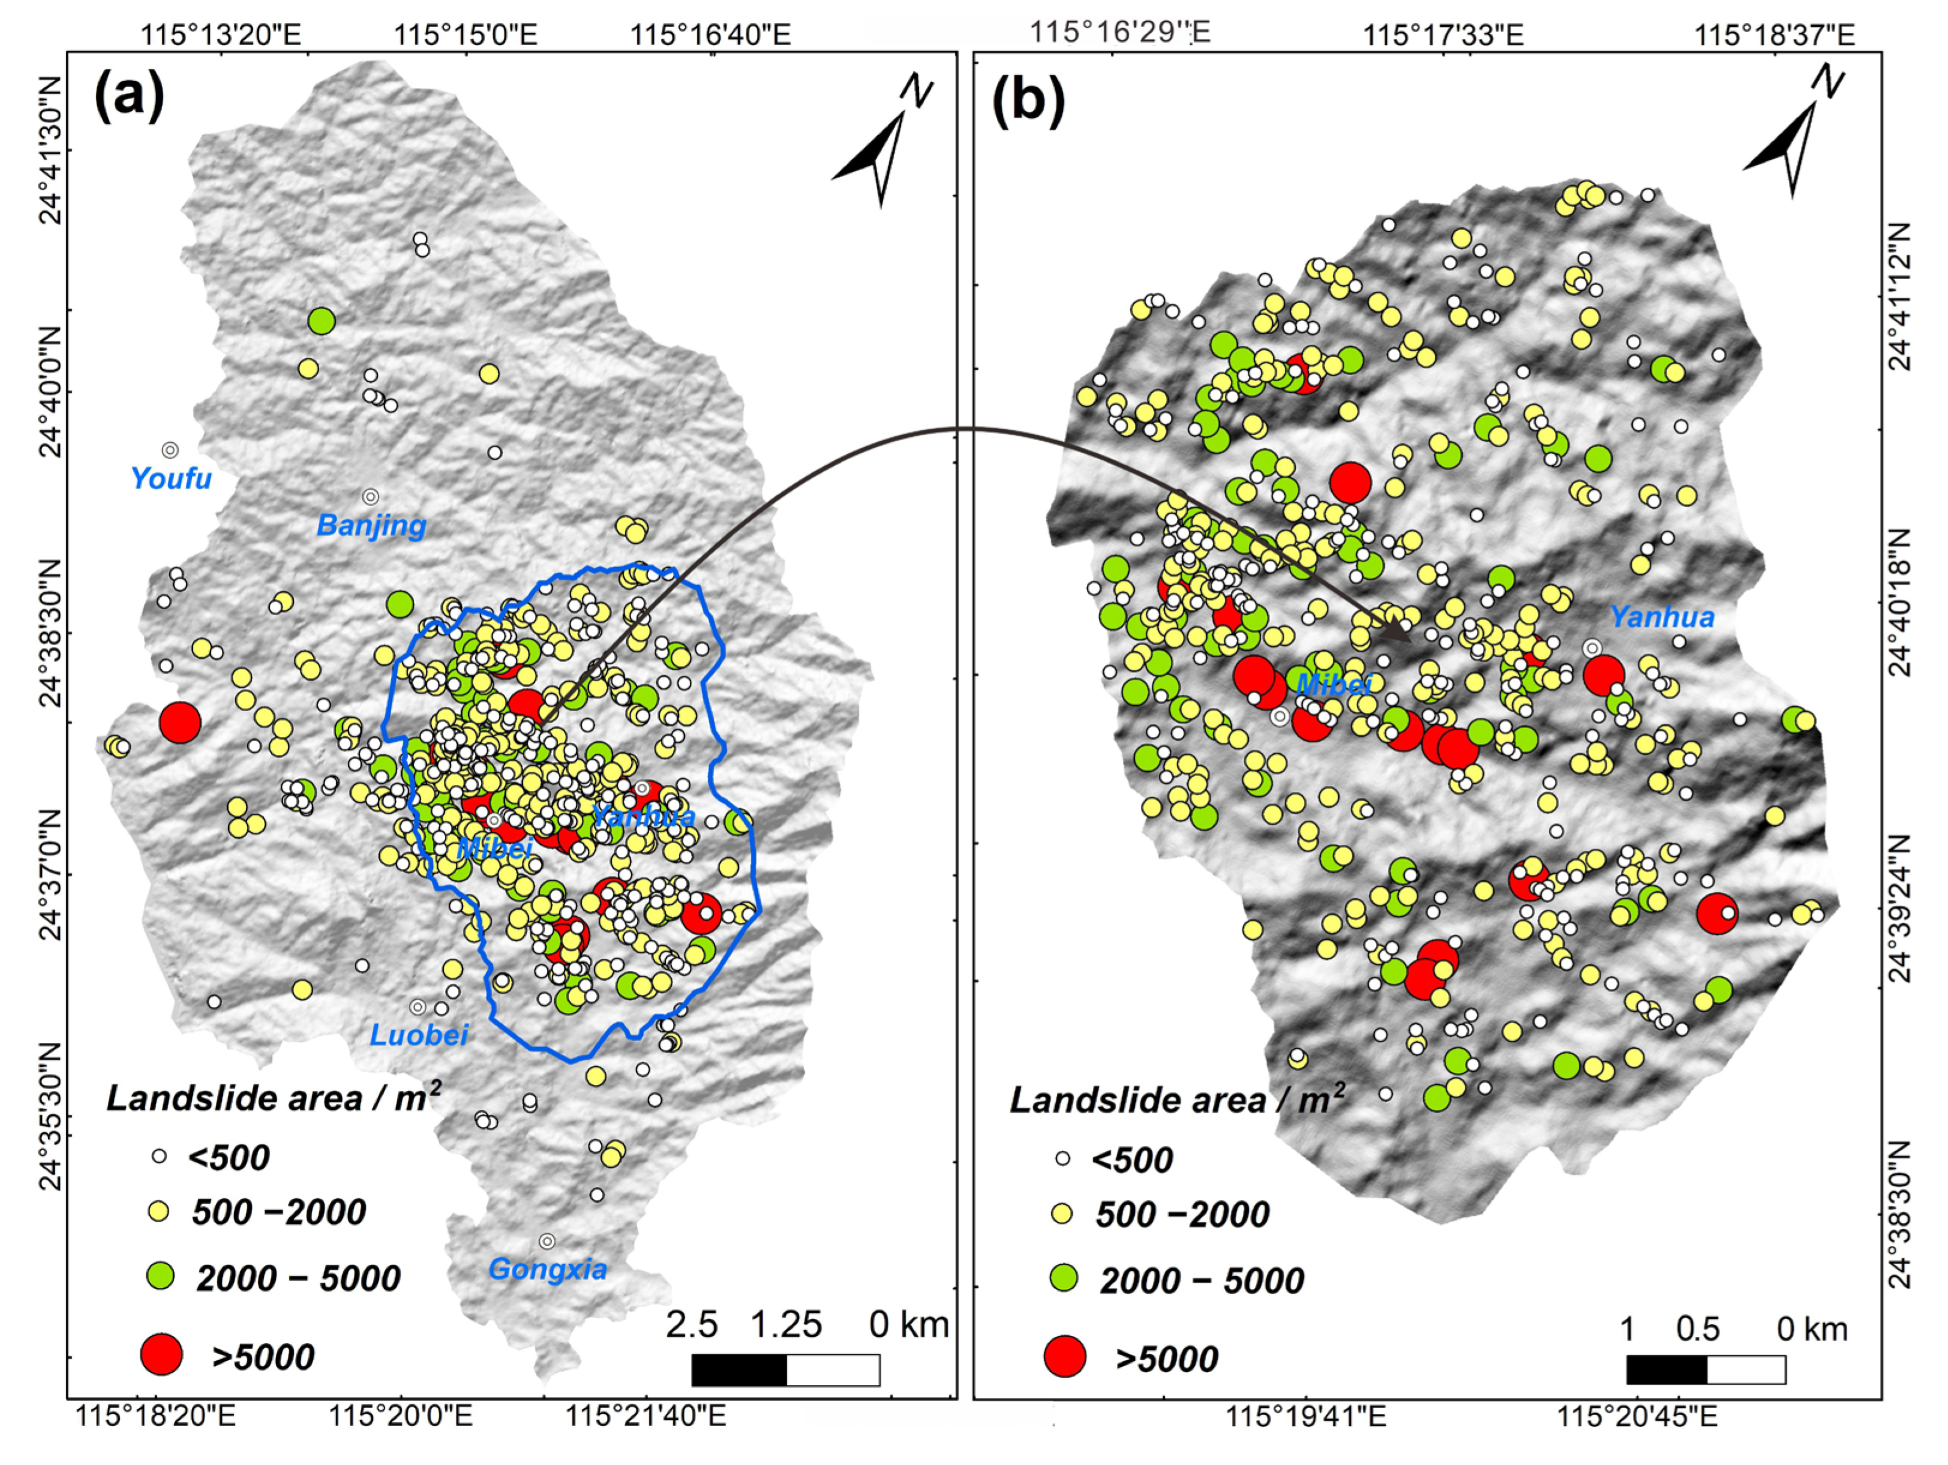
3.1. Landslide Mapping
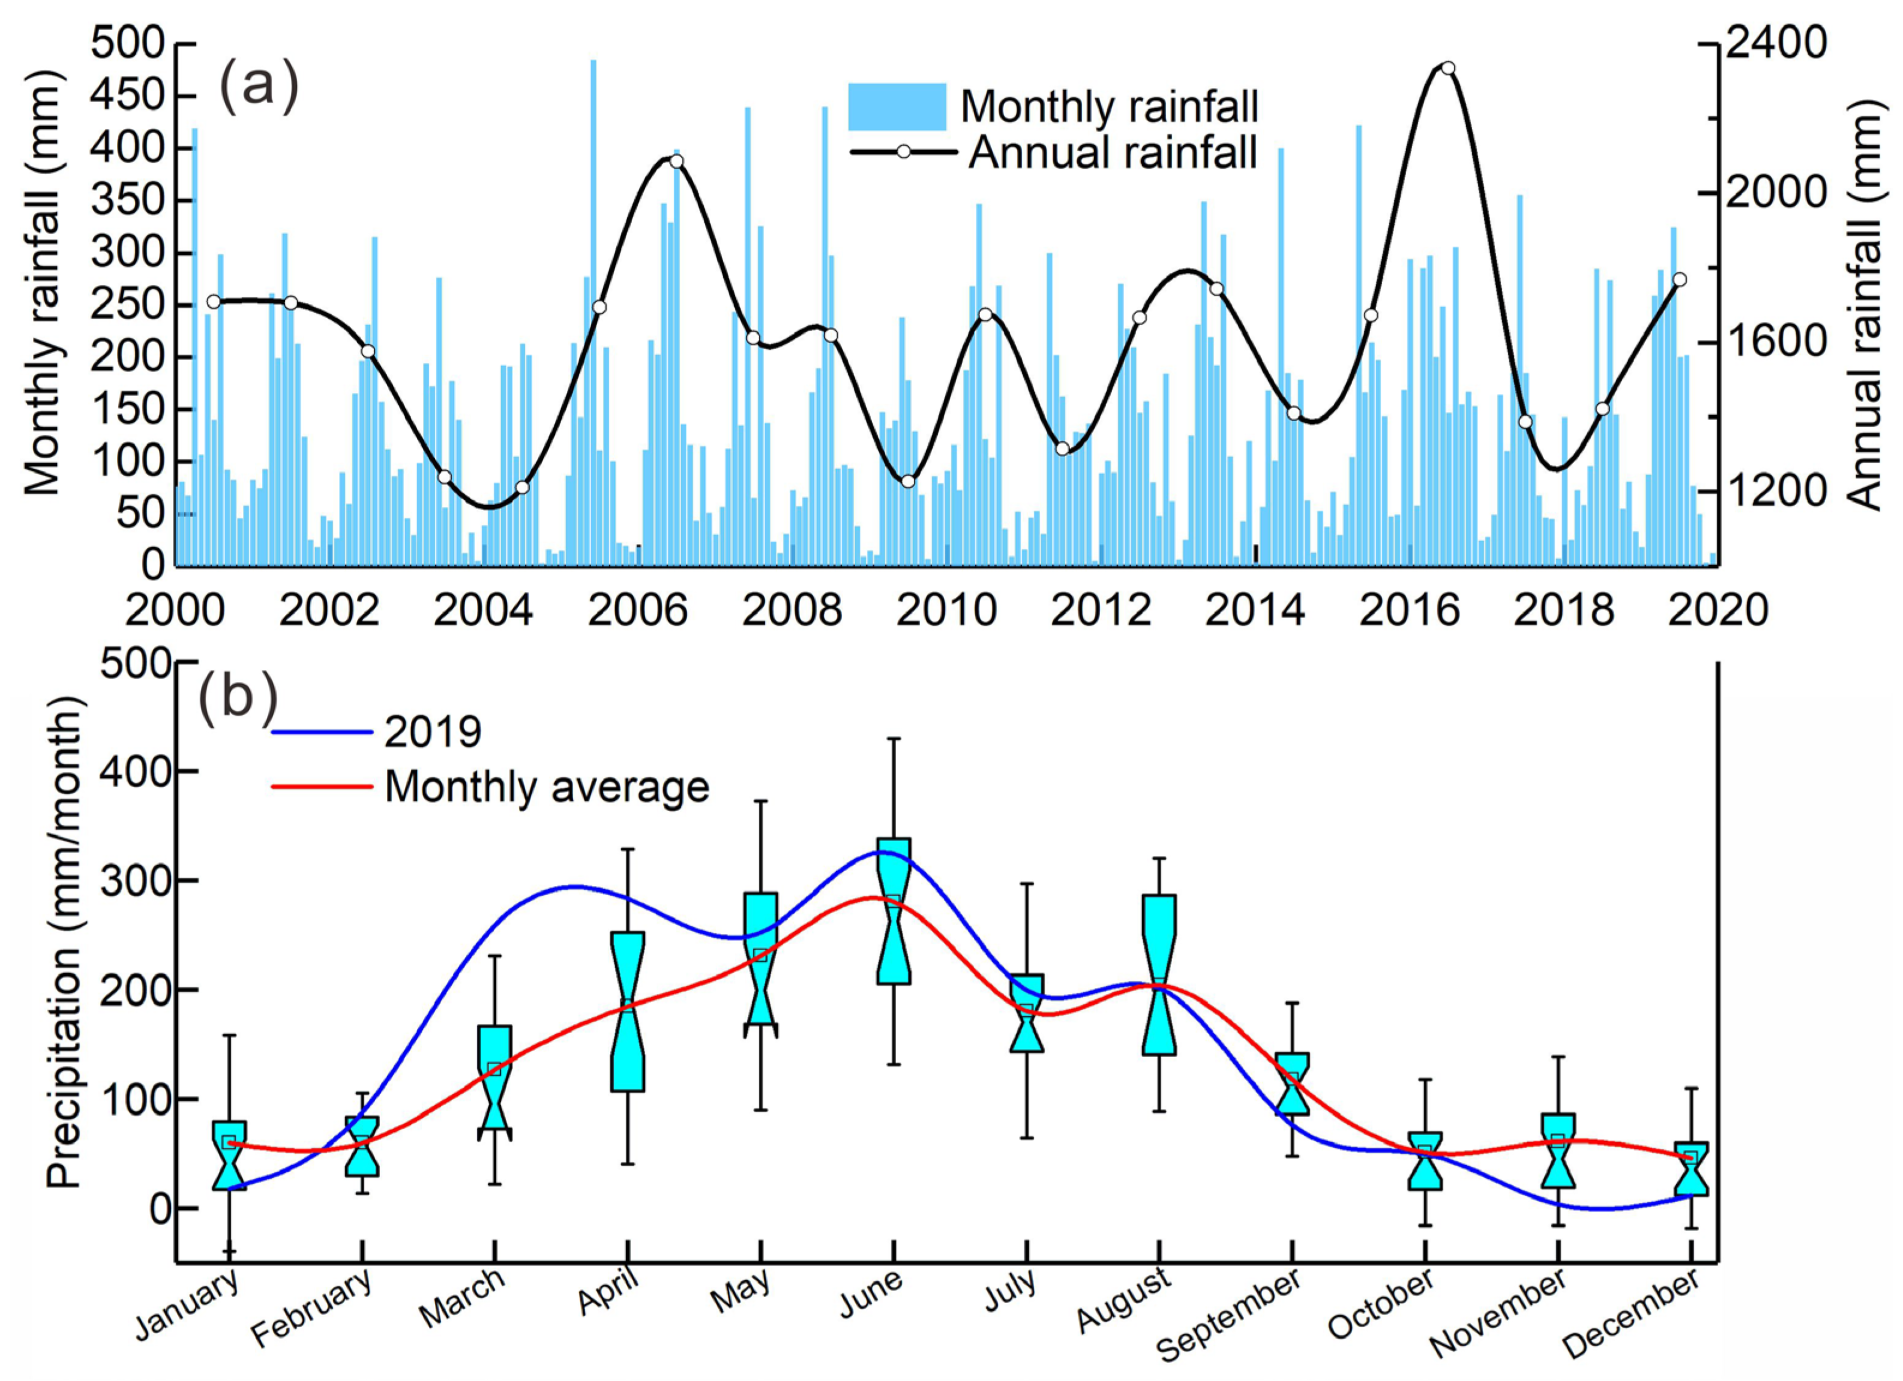
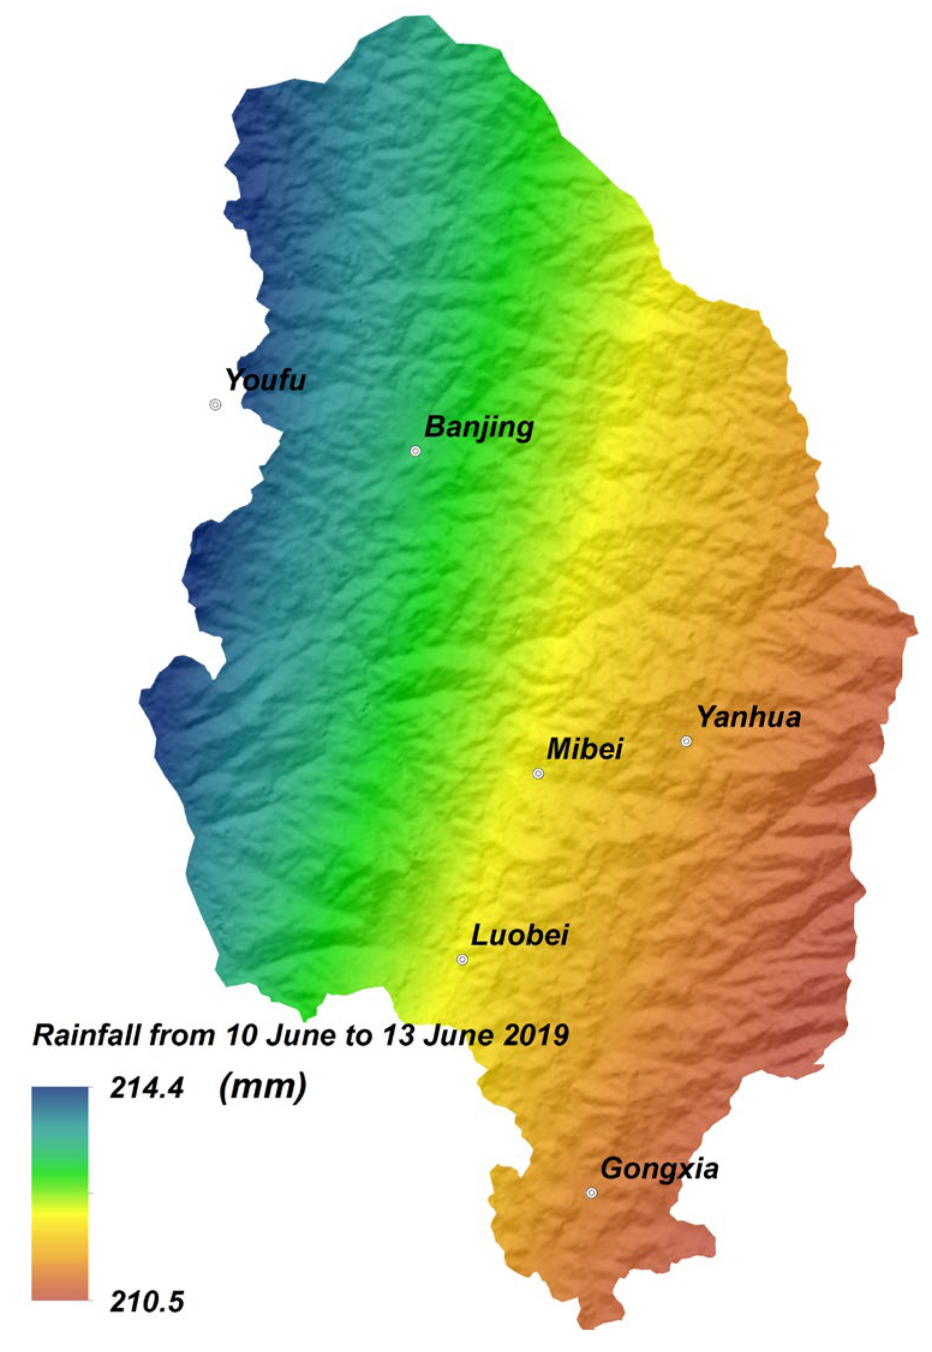
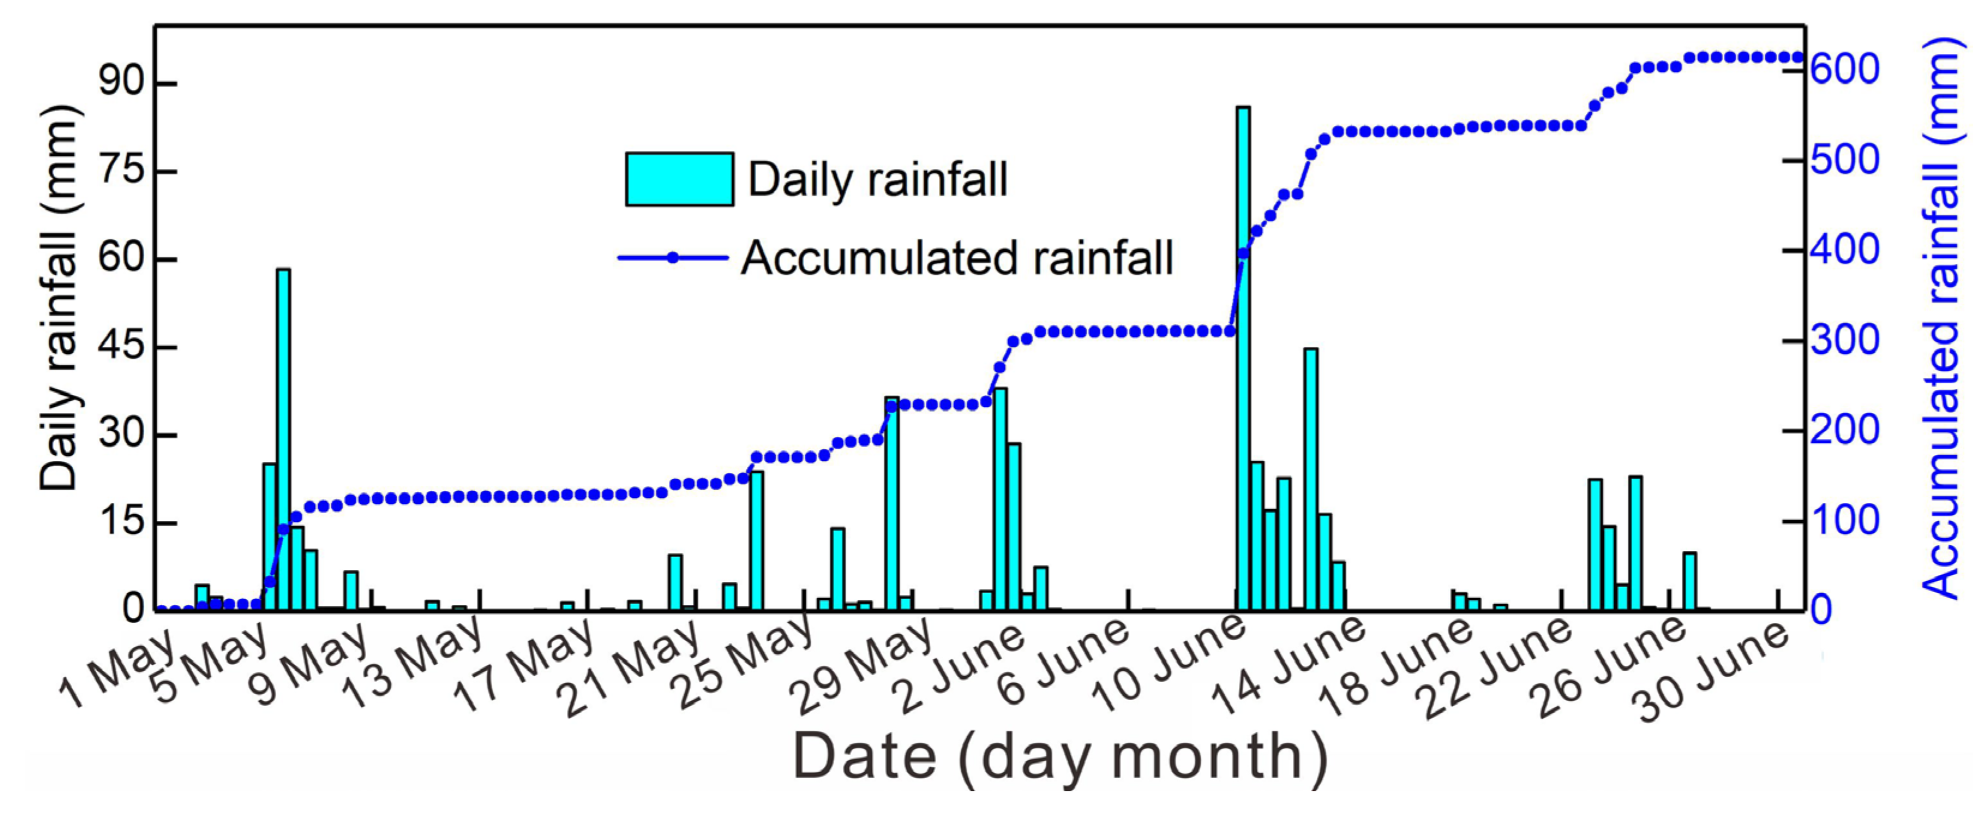
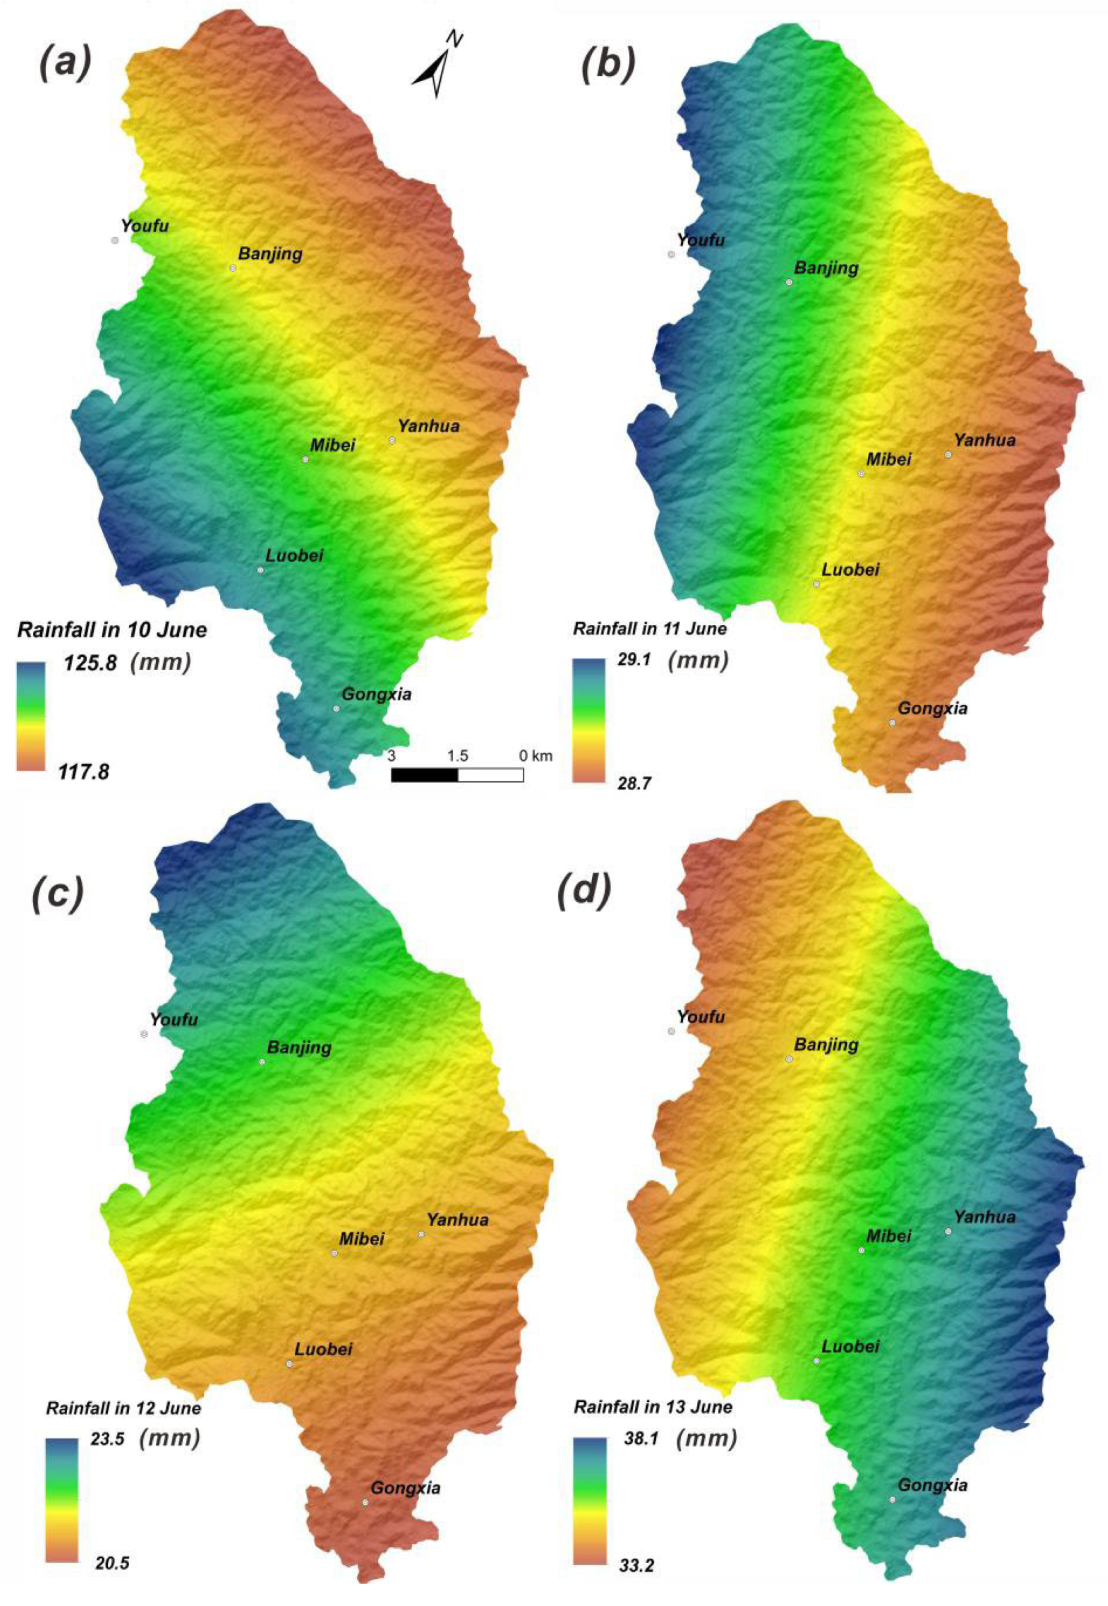
3.2. Rainfall Data
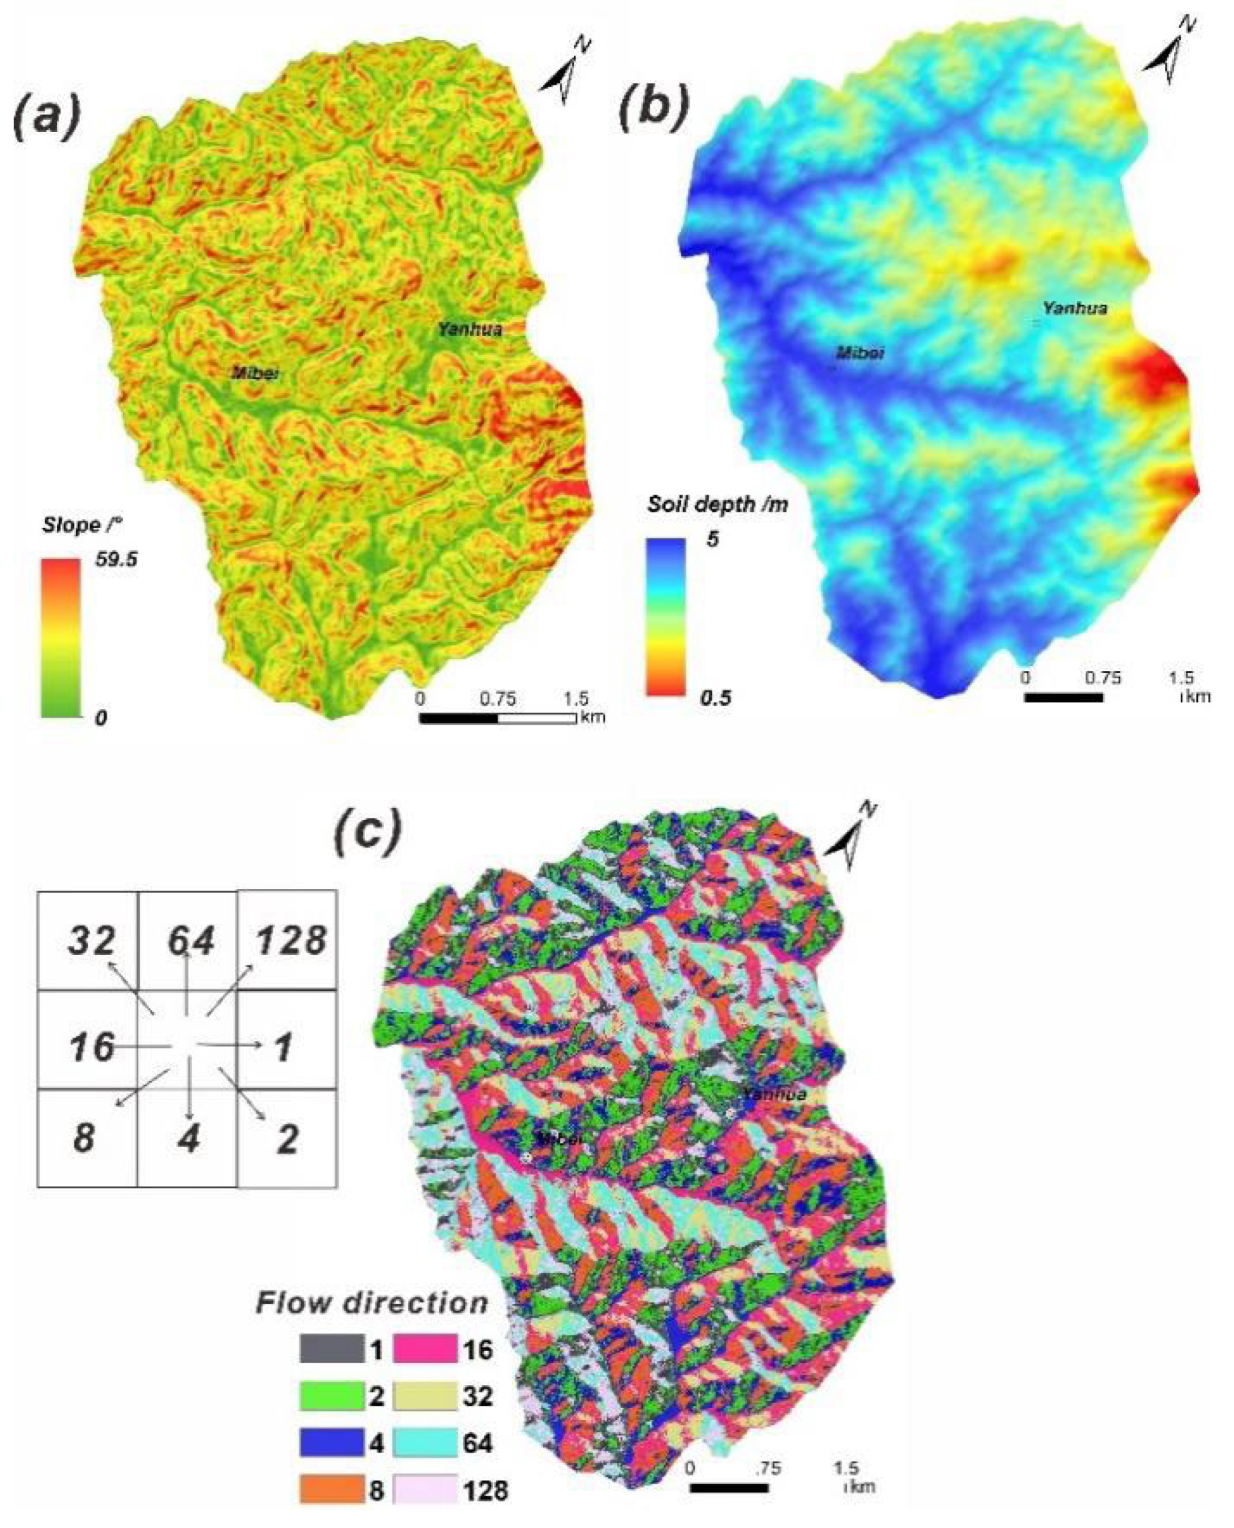
3.3. Data Related to Other Influencing Factors
3.4. TRIGRS Model
4. Rainfall-Induced Landslide Inventory
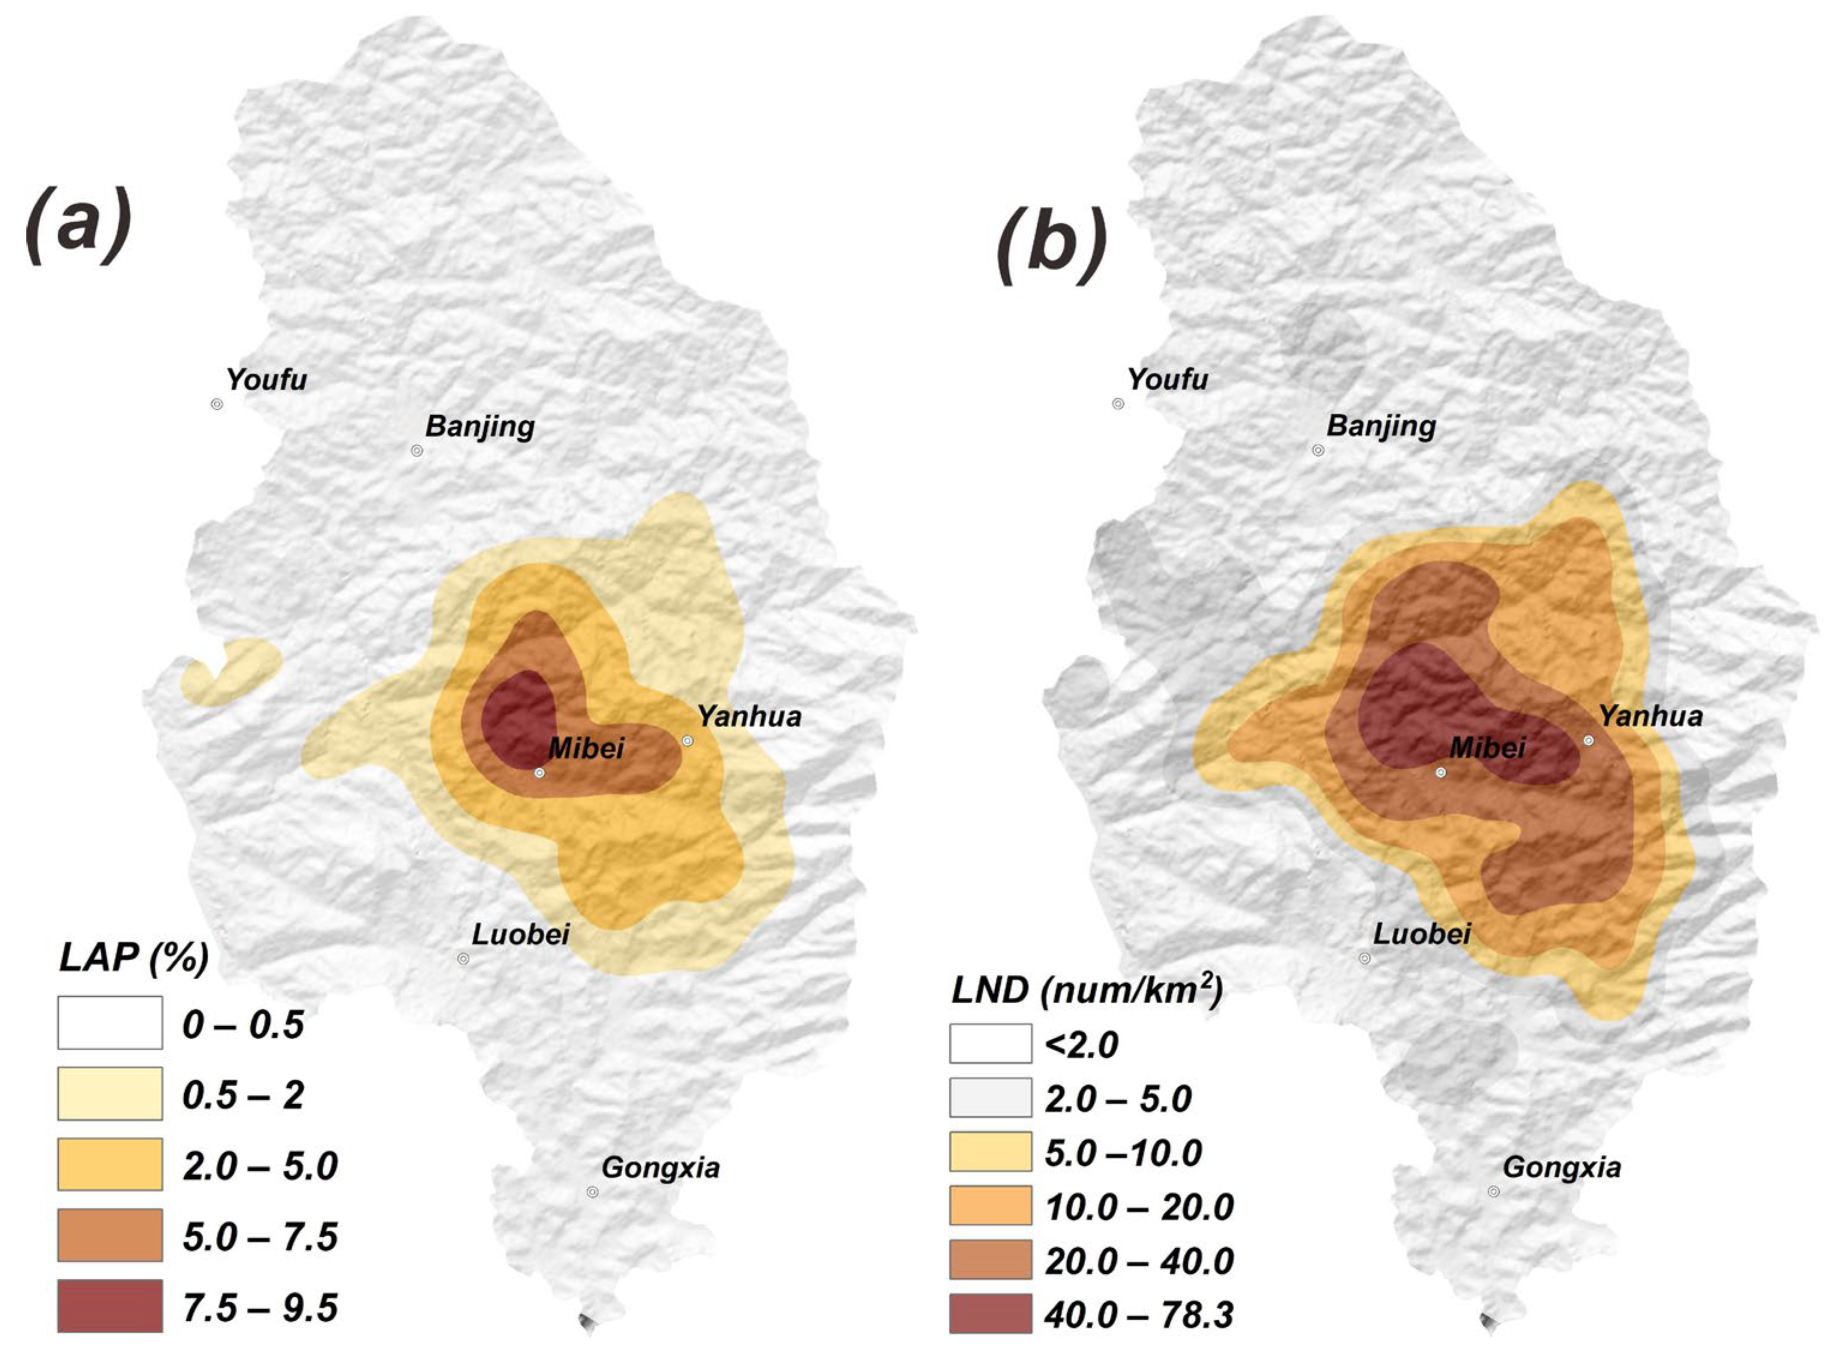
4.1. Basic Characteristics
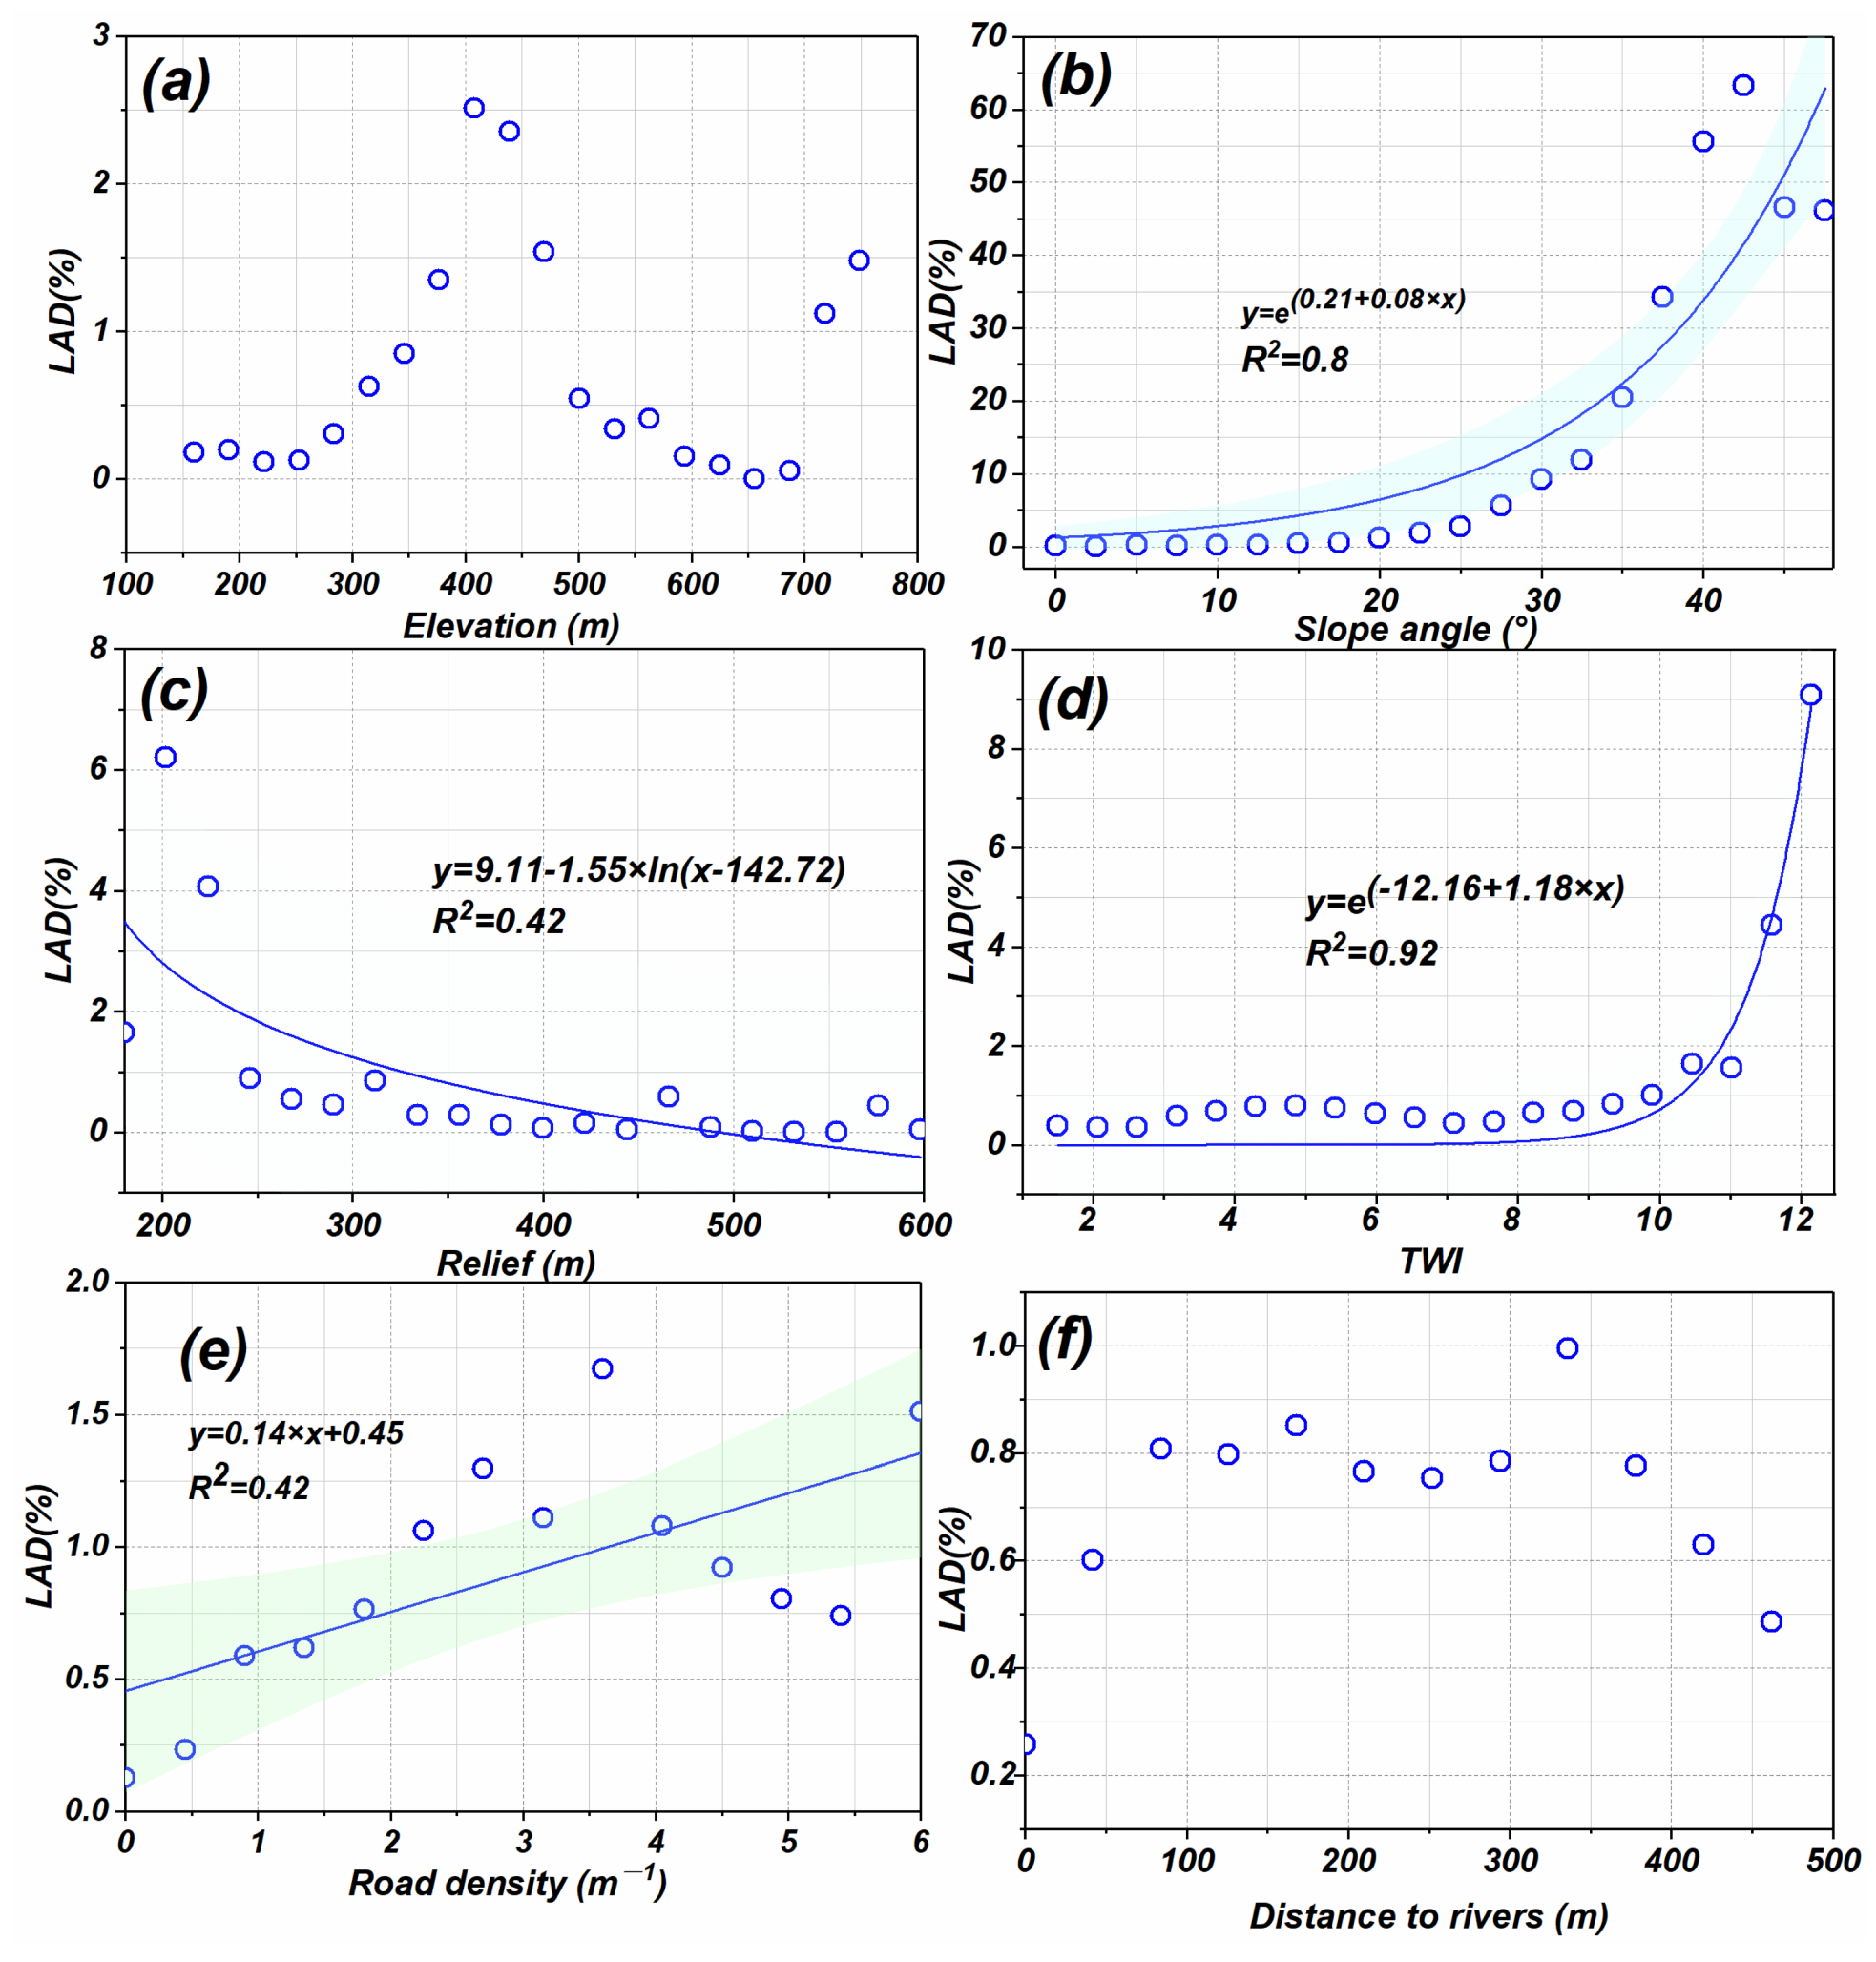
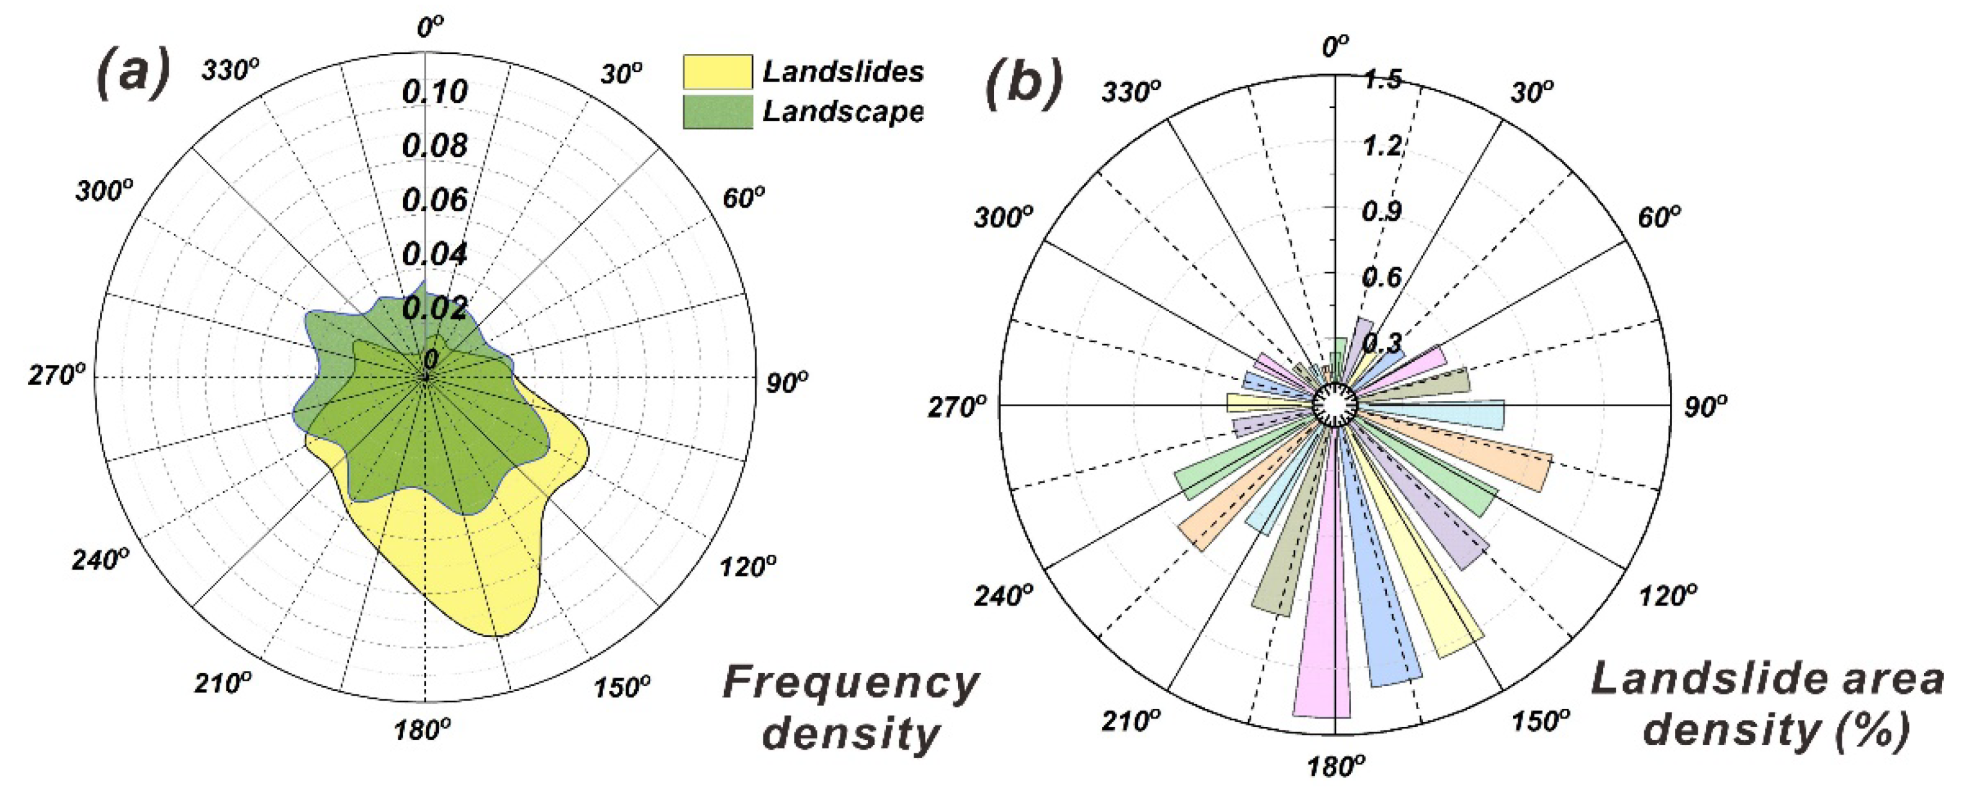
4.2. Factor Analysis
5. Physically Based Landslide Susceptibility Assessment
5.1. Brief Description of MAT.TRIGRS(V1.0)
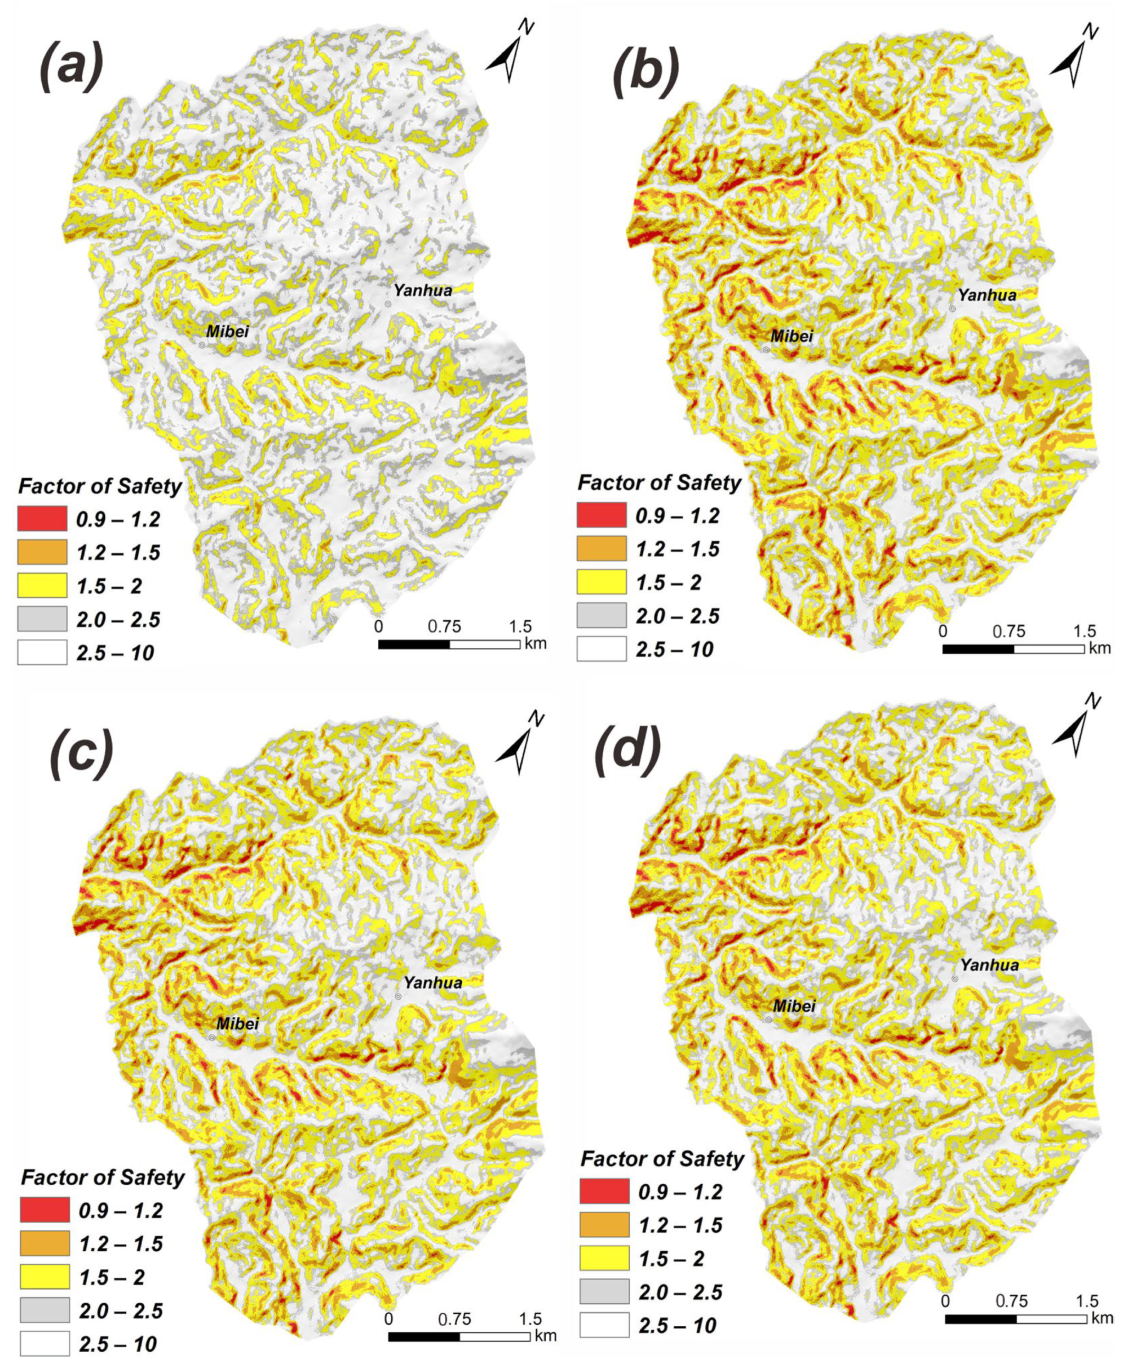
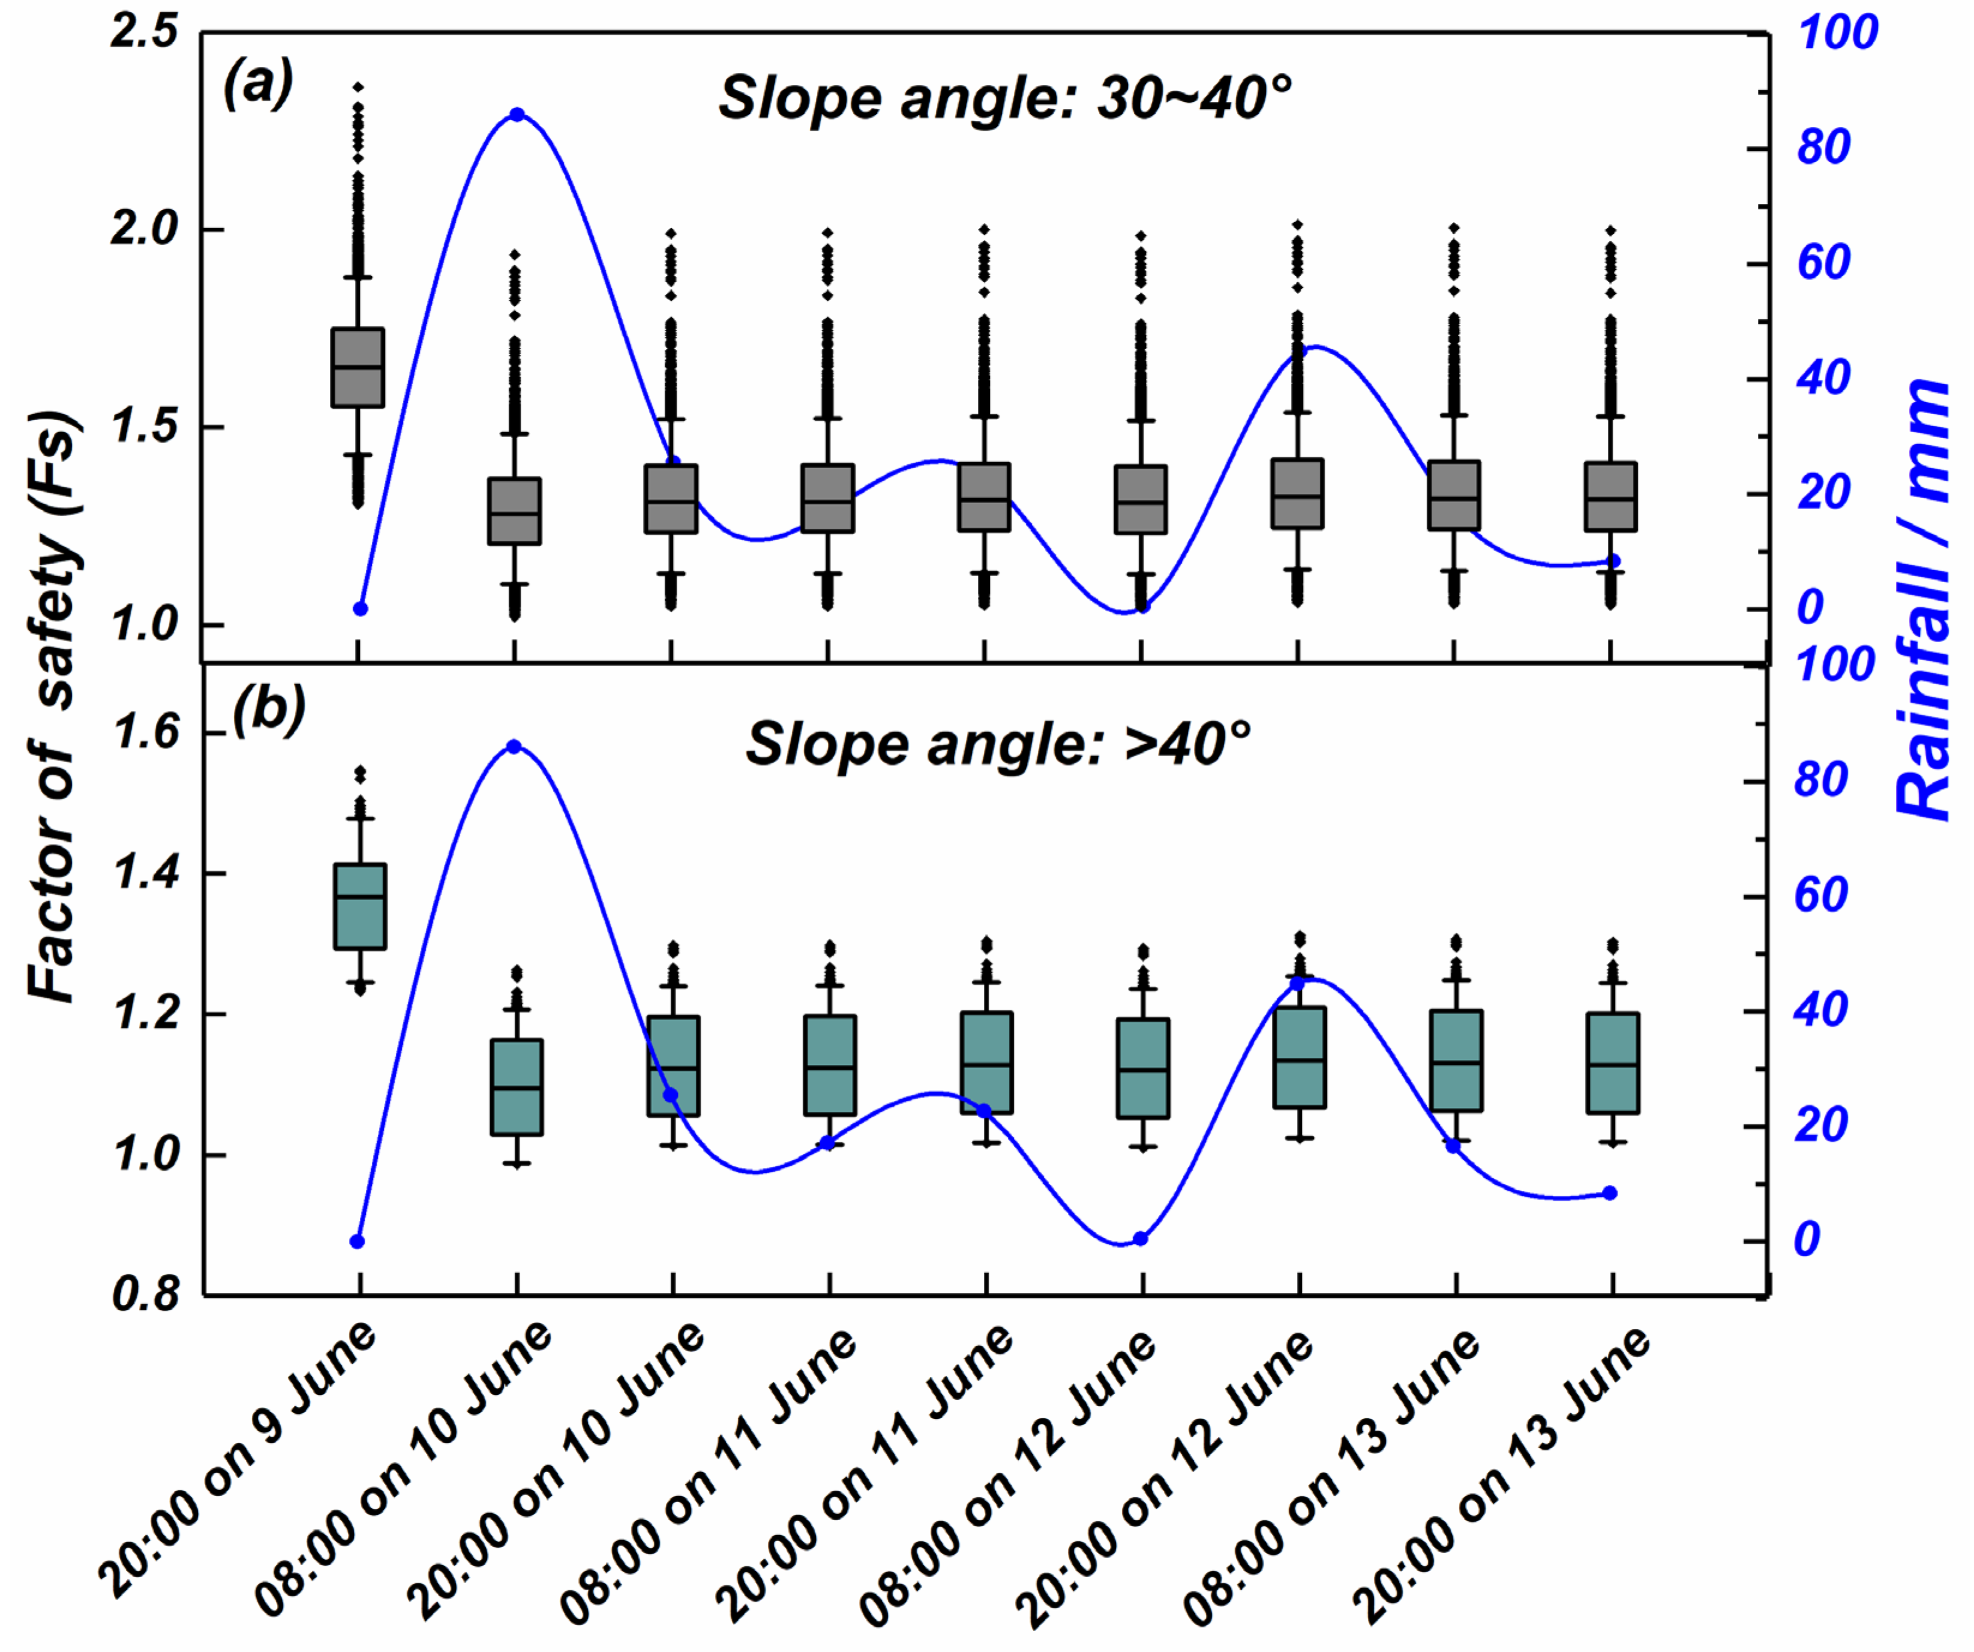
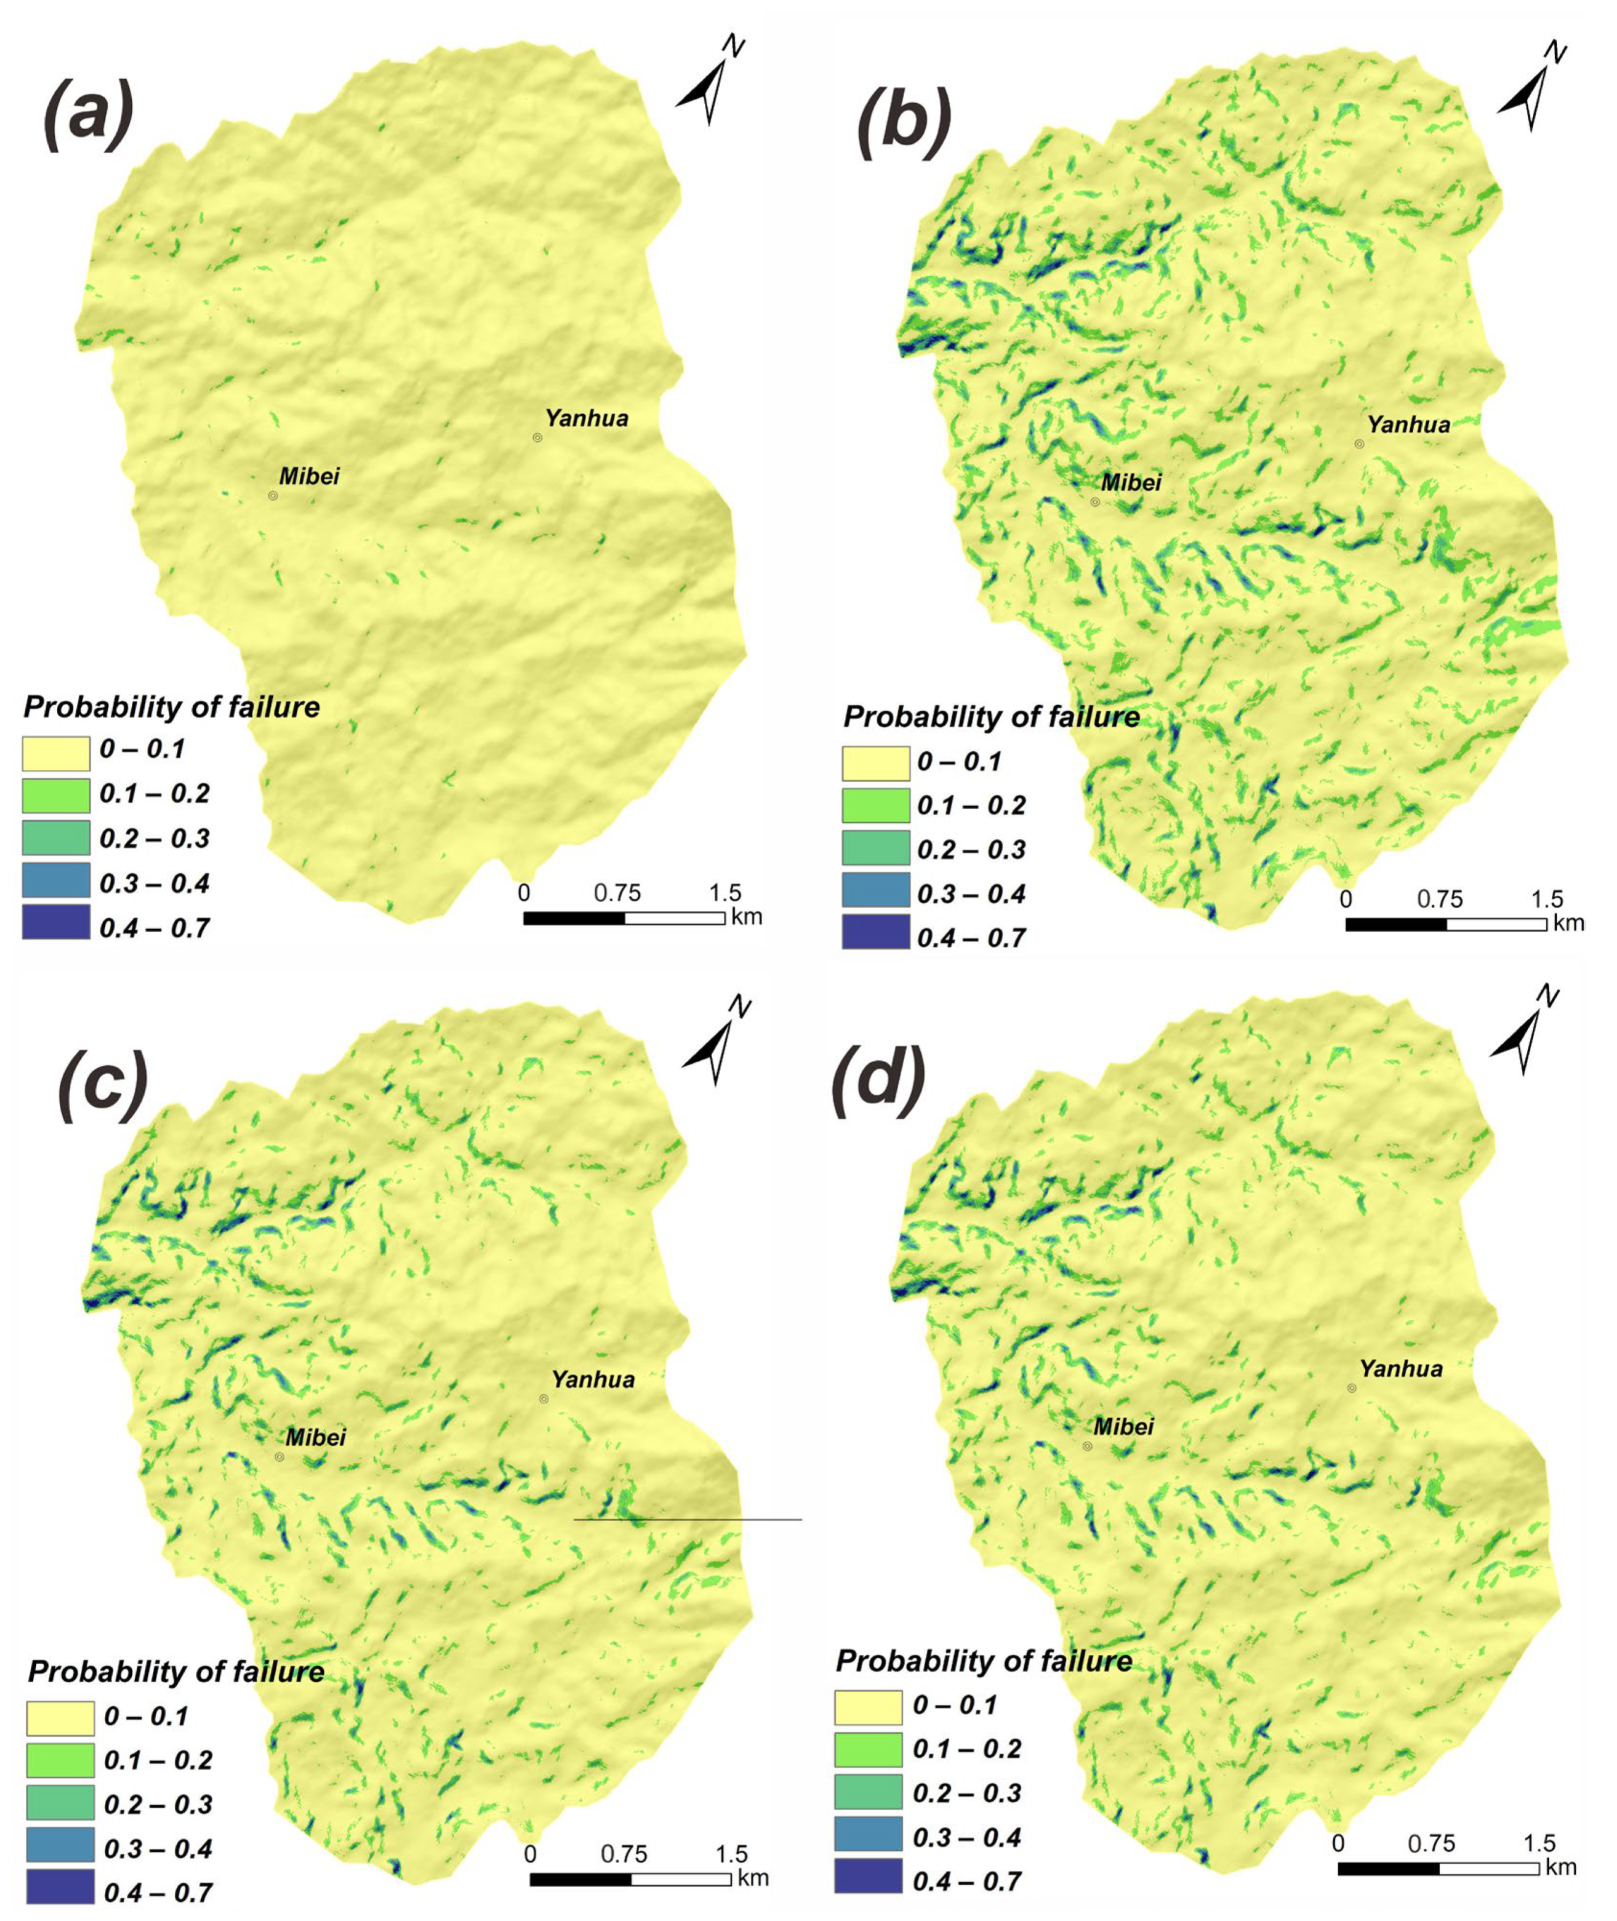
5.2. Landslide Susceptibility Assessment
6. Discussion
7. Conclusions
Author Contributions
Funding
Acknowledgments
Conflicts of Interest
References
- Kirschbaum, D.; Kapnick, S.B.; Stanley, T.; Pascale, S. Changes in Extreme Precipitation and Landslides Over High Mountain Asia. Geophys. Res. Lett. 2020, 47, e2019GL085347. [Google Scholar] [CrossRef]
- Emberson, R.; Kirschbaum, D.; Stanley, T. Global connections between El Nino and landslide impacts. Nat. Commun. 2021, 12, 2262. [Google Scholar] [CrossRef]
- Petley, D. Global patterns of loss of life from landslides. Geology 2012, 40, 927–930. [Google Scholar] [CrossRef]
- Lin, Q.; Wang, Y. Spatial and temporal analysis of a fatal landslide inventory in China from 1950 to 2016. Landslides 2018, 15, 2357–2372. [Google Scholar] [CrossRef]
- Gariano, S.L.; Guzzetti, F. Landslides in a changing climate. Earth Sci. Rev. 2016, 162, 227–252. [Google Scholar] [CrossRef]
- Huang, Y.; Xu, C.; Zhang, X.; Li, L. Bibliometric analysis of landslide research based on the WOS database. Nat. Hazards Res. 2022, 2, 49–61. [Google Scholar] [CrossRef]
- Dai, L.; Scaringi, G.; Fan, X.; Yunus, A.P.; Liu-Zeng, J.; Xu, Q.; Huang, R. Coseismic Debris Remains in the Orogen Despite a Decade of Enhanced Landsliding. Geophys. Res. Lett. 2021, 48, e2021GL095850. [Google Scholar] [CrossRef]
- Fan, X.; Yunus, A.P.; Scaringi, G.; Catani, F.; Siva Subramanian, S.; Huang, R. Rapidly Evolving Controls of Landslides After a Strong Earthquake and Implications for Hazard Assessments. Geophys. Res. Lett. 2020, 48, e2020GL090509. [Google Scholar] [CrossRef]
- Fan, X.; Scaringi, G.; Korup, O.; West, A.J.; van Westen, C.J.; Tanyas, H.; Hovius, N.; Hales, T.C.; Jibson, R.W.; Allstadt, K.E.; et al. Earthquake-induced chains of geologic hazards: Patterns, mechanisms, and impacts. Rev. Geophys. 2019, 57, 421–503. [Google Scholar] [CrossRef]
- Schmitt, R.; Tanyas, H.; Jessee, A.; Zhu, J.; Biegel, K.; Allstadt, K.; Jibson, R.; Thompson, E.; Westen, C.J.; Sato, H.; et al. An Open Repository of Earthquake-Triggered Ground-Failure Inventories; U.S. Geological Survey: Reston, VA, USA, 2017. [CrossRef]
- Tian, Y.; Xu, C.; Yuan, R.-M. Earthquake-Triggered Landslides. Treatise Geomorphol. 2021, 2, 583–614. [Google Scholar] [CrossRef]
- Xu, C.; Xu, X.; Zhou, B.; Shen, L. Probability of coseimic landslides: A new generation of earthquake-triggered landslide hazard model. J. Eng. Geol. 2019, 27, 1122. [Google Scholar] [CrossRef]
- Shao, X.; Xu, C. Earthquake-induced landslides susceptibility assessment: A review of the state-of-the-art. Nat. Hazards Res. 2022, in press. [Google Scholar] [CrossRef]
- Kirschbaum, D.; Stanley, T. Satellite-Based Assessment of Rainfall-Triggered Landslide Hazard for Situational Awareness. Earths Future 2018, 6, 505–523. [Google Scholar] [CrossRef] [PubMed]
- Emberson, R.; Kirschbaum, D.; Amatya, P.M.; Tanyas, H.; Marc, O. Insights from the topographic characteristics of a large global catalog of rainfall-induced landslide event inventories. Nat. Hazards Earth Syst. Sci. 2022, 22, 1129–1149. [Google Scholar] [CrossRef]
- Marc, O.; Stumpf, A.; Malet, J.P.; Gosset, M.; Uchida, T.; Chiang, S.-H. Initial insights from a global database of rainfall-induced landslide inventories: The weak influence of slope and strong influence of total storm rainfall. Earth Surf. Dyn. 2018, 6, 903–922. [Google Scholar] [CrossRef]
- Feng, W.; Bai, H.; Lan, B.; Wu, Y.; Wu, Z.; Yan, L.; Ma, X. Spatial–temporal distribution and failure mechanism of group-occurring landslides in Mibei village, Longchuan County, Guangdong, China. Landslides 2022, 19, 1957–1970. [Google Scholar] [CrossRef]
- Ma, T.; Li, C.; Lu, Z.; Bao, Q. Rainfall intensity–duration thresholds for the initiation of landslides in Zhejiang Province, China. Geomorphology 2015, 245, 193–206. [Google Scholar] [CrossRef]
- Chen, H.; Dadson, S.; Chi, Y.-G. Recent rainfall-induced landslides and debris flow in northern Taiwan. Geomorphology 2006, 77, 112–125. [Google Scholar] [CrossRef]
- Merghadi, A.; Yunus, A.P.; Dou, J.; Whiteley, J.; ThaiPham, B.; Bui, D.T.; Avtar, R.; Abderrahmane, B. Machine learning methods for landslide susceptibility studies: A comparative overview of algorithm performance. Earth Sci. Rev. 2020, 207, 103225. [Google Scholar] [CrossRef]
- Reichenbach, P.; Rossi, M.; Malamud, B.D.; Mihir, M.; Guzzetti, F. A review of statistically-based landslide susceptibility models. Earth Sci. Rev. 2018, 180, 60–91. [Google Scholar] [CrossRef]
- Hong, H.; Pradhan, B.; Xu, C.; Tien Bui, D. Spatial prediction of landslide hazard at the Yihuang area (China) using two-class kernel logistic regression, alternating decision tree and support vector machines. Catena 2015, 133, 266–281. [Google Scholar] [CrossRef]
- Shao, X.; Ma, S.; Xu, C.; Zhang, P.; Wen, B.; Tian, Y.; Zhou, Q.; Cui, Y. Planet Image-Based Inventorying and Machine Learning-Based Susceptibility Mapping for the Landslides Triggered by the 2018 Mw6.6 Tomakomai, Japan Earthquake. Remote Sens. 2019, 11, 978. [Google Scholar] [CrossRef]
- Shao, X.; Ma, S.; Xu, C.; Zhou, Q. Effects of sampling intensity and non-slide/slide sample ratio on the occurrence probability of coseismic landslides. Geomorphology 2020, 363, 107222. [Google Scholar] [CrossRef]
- Tanyu, B.F.; Abbaspour, A.; Alimohammadlou, Y.; Tecuci, G. Landslide susceptibility analyses using Random Forest, C4.5, and C5.0 with balanced and unbalanced datasets. CATENA 2021, 203, 105355. [Google Scholar] [CrossRef]
- Kavzoglu, T.; Sahin, E.K.; Colkesen, I. An assessment of multivariate and bivariate approaches in landslide susceptibility mapping: A case study of Duzkoy district. Nat. Hazards 2015, 76, 471–496. [Google Scholar] [CrossRef]
- Wang, Y.; Fang, Z.; Hong, H. Comparison of convolutional neural networks for landslide susceptibility mapping in Yanshan County, China. Sci. Total Environ. 2019, 666, 975–993. [Google Scholar] [CrossRef]
- Xu, C.; Xu, X.; Dai, F.; Saraf, A.K. Comparison of different models for susceptibility mapping of earthquake triggered landslides related with the 2008 Wenchuan earthquake in China. Comput. Geosci. 2012, 46, 317–329. [Google Scholar] [CrossRef]
- Arabameri, A.; Chandra Pal, S.; Rezaie, F.; Chakrabortty, R.; Saha, A.; Blaschke, T.; Di Napoli, M.; Ghorbanzadeh, O.; Thi Ngo, P.T. Decision tree based ensemble machine learning approaches for landslide susceptibility mapping. Geocarto Int. 2021, 37, 1–35. [Google Scholar] [CrossRef]
- Adnan, M.S.G.; Rahman, M.S.; Ahmed, N.; Ahmed, B.; Rabbi, M.F.; Rahman, R.M. Improving Spatial Agreement in Machine Learning-Based Landslide Susceptibility Mapping. Remote Sens. 2020, 12, 3347. [Google Scholar] [CrossRef]
- Rossi, M.; Guzzetti, F.; Reichenbach, P.; Mondini, A.C.; Peruccacci, S. Optimal landslide susceptibility zonation based on multiple forecasts. Geomorphology 2010, 114, 129–142. [Google Scholar] [CrossRef]
- Ma, S.; Xu, C.; Shao, X. Spatial prediction strategy for landslides triggered by large earthquakes oriented to emergency response, mid-term resettlement and later reconstruction. Int. J. Disaster Risk Reduct. 2020, 43, 101362. [Google Scholar] [CrossRef]
- Gutiérrez-Martín, A. A GIS-physically-based emergency methodology for predicting rainfall-induced shallow landslide zonation. Geomorphology 2020, 359, 107121. [Google Scholar] [CrossRef]
- Hong, Y.; Adler, R.; Huffman, G. Evaluation of the potential of NASA multi-satellite precipitation analysis in global landslide hazard assessment. Geophys. Res. Lett. 2006, 33, L22402. [Google Scholar] [CrossRef]
- Lin, Q.; Lima, P.; Steger, S.; Glade, T.; Jiang, T.; Zhang, J.; Liu, T.; Wang, Y. National-scale data-driven rainfall induced landslide susceptibility mapping for China by accounting for incomplete landslide data. Geosci. Front. 2021, 12, 101248. [Google Scholar] [CrossRef]
- Iverson, R.M. Landslide triggering by rain infiltration. Water Resour. Res. 2000, 36, 1897–1910. [Google Scholar] [CrossRef]
- Corominas, J.; van Westen, C.; Frattini, P.; Cascini, L.; Malet, J.P.; Fotopoulou, S.; Catani, F.; van Den Eeckhaut, M.; Mavrouli, O.; Agliardi, F.; et al. Recommendations for the quantitative analysis of landslide risk. Bull. Eng. Geol. Environ. 2014, 73, 209–263. [Google Scholar] [CrossRef]
- Fell, R.; Corominas, J.; Bonnard, C.; Cascini, L.; Leroi, E.; Savage, W. Guidelines for landslide susceptibility, hazard and risk zoning for land use planning. Eng. Geol. 2008, 102. [Google Scholar] [CrossRef]
- Sorbino, G.; Sica, C.; Cascini, L. Susceptibility analysis of shallow landslides source areas using physically based models. Nat. Hazards 2010, 53, 313–332. [Google Scholar] [CrossRef]
- Baum, R.L.; Savage, W.Z.; Godt, J.W. TRIGRS-A Fortran Program for Transient Rainfall Infiltration and Grid-Based Regional Slope-Stability Analysis, Version 2.0; US Geological Survey: Reston, VA, USA, 2008; pp. 1159–2008.
- Baum, R.L.; Godt, J.W.; Savage, W.Z. Estimating the timing and location of shallow rainfall-induced landslides using a model for transient, unsaturated infiltration. J. Geophys. Res. F Earth Surf. 2010, 115, F03013. [Google Scholar] [CrossRef]
- Domènech, G.; Alvioli, M.; Corominas, J. Preparing first-time slope failures hazard maps: From pixel-based to slope unit-based. Landslides 2019, 17, 249–265. [Google Scholar] [CrossRef]
- Schiliro, L.; Montrasio, L.; Scarascia Mugnozza, G. Prediction of shallow landslide occurrence: Validation of a physically-based approach through a real case study. Sci. Total Environ. 2016, 569-570, 134–144. [Google Scholar] [CrossRef] [PubMed]
- Sarkar, S.; Roy, A.K.; Raha, P. Deterministic approach for susceptibility assessment of shallow debris slide in the Darjeeling Himalayas, India. Catena 2016, 142, 36–46. [Google Scholar] [CrossRef]
- An, H.; Viet, T.T.; Lee, G.; Kim, Y.; Kim, M.; Noh, S.; Noh, J. Development of time-variant landslide-prediction software considering three-dimensional subsurface unsaturated flow. Environ. Model. Softw. 2016, 85, 172–183. [Google Scholar] [CrossRef]
- Montrasio, L.; Valentino, R.; Losi, G.L. Rainfall-induced shallow landslides: A model for the triggering mechanism of some case studies in Northern Italy. Landslides 2009, 6, 241–251. [Google Scholar] [CrossRef]
- Montrasio, L.; Valentino, R.; Corina, A.; Rossi, L.; Rudari, R. A prototype system for space–time assessment of rainfall-induced shallow landslides in Italy. Nat. Hazards 2014, 74, 1263–1290. [Google Scholar] [CrossRef]
- Montrasio, L.; Valentino, R.; Meisina, C. Soil Saturation and Stability Analysis of a Test Site Slope Using the Shallow Landslide Instability Prediction (SLIP) Model. Geotech. Geol. Eng. 2018, 36, 2331–2342. [Google Scholar] [CrossRef]
- Tran, T.V.; Lee, G.; An, H.; Kim, M. Comparing the performance of TRIGRS and TiVaSS in spatial and temporal prediction of rainfall-induced shallow landslides. Environ. Earth Sci. 2017, 76, 315. [Google Scholar] [CrossRef]
- Escobar-Wolf, R.; Sanders, J.D.; Vishnu, C.L.; Oommen, T.; Sajinkumar, K.S. A GIS Tool for Infinite Slope Stability Analysis (GIS-TISSA). Geosci. Front. 2021, 12, 756–768. [Google Scholar] [CrossRef]
- He, X.; Hong, Y.; Vergara, H.; Zhang, K.; Kirstetter, P.-E.; Gourley, J.J.; Zhang, Y.; Qiao, G.; Liu, C. Development of a coupled hydrological-geotechnical framework for rainfall-induced landslides prediction. J. Hydrol. 2016, 543, 395–405. [Google Scholar] [CrossRef]
- Zhang, K.; Xue, X.; Hong, Y.; Gourley, J.J.; Lu, N.; Wan, Z.; Hong, Z.; Wooten, R. iCRESTRIGRS: A coupled modeling system for cascading flood–landslide disaster forecasting. Hydrol. Earth Syst. Sci. 2016, 20, 5035–5048. [Google Scholar] [CrossRef]
- Rossi, G.; Catani, F.; Leoni, L.; Segoni, S.; Tofani, V. HIRESSS: A physically based slope stability simulator for HPC applications. Nat. Hazards Earth Syst. Sci. 2013, 13, 151–166. [Google Scholar] [CrossRef]
- Tofani, V.; Bicocchi, G.; Rossi, G.; Segoni, S.; D’Ambrosio, M.; Casagli, N.; Catani, F. Soil characterization for shallow landslides modeling: A case study in the Northern Apennines (Central Italy). Landslides 2017, 14, 755–770. [Google Scholar] [CrossRef]
- Salvatici, T.; Tofani, V.; Rossi, G.; D’Ambrosio, M.; Tacconi Stefanelli, C.; Masi, E.B.; Rosi, A.; Pazzi, V.; Vannocci, P.; Petrolo, M.; et al. Application of a physically based model to forecast shallow landslides at a regional scale. Nat. Hazards Earth Syst. Sci. 2018, 18, 1919–1935. [Google Scholar] [CrossRef]
- Salciarini, D.; Fanelli, G.; Tamagnini, C. A probabilistic model for rainfall—induced shallow landslide prediction at the regional scale. Landslides 2017, 14, 1731–1746. [Google Scholar] [CrossRef]
- Park, D.W.; Nikhil, N.V.; Lee, S.R. Landslide and debris flow susceptibility zonation using TRIGRS for the 2011 Seoul landslide event. Nat. Hazards Earth Syst. Sci. 2013, 13, 2833–2849. [Google Scholar] [CrossRef]
- Liao, Z.; Hong, Y.; Kirschbaum, D.; Adler, R.F.; Gourley, J.J.; Wooten, R. Evaluation of TRIGRS (transient rainfall infiltration and grid-based regional slope-stability analysis)’s predictive skill for hurricane-triggered landslides: A case study in Macon County, North Carolina. Natural Hazards 2011, 58, 325–339. [Google Scholar] [CrossRef]
- Lee, J.H.; Park, H.J. Assessment of shallow landslide susceptibility using the transient infiltration flow model and GIS-based probabilistic approach. Landslides 2015, 13, 885–903. [Google Scholar] [CrossRef]
- Li, H.-C.; Wu, T.; Wei, H.-P.; Shih, H.-J.; Chao, Y.-C. Basinwide disaster loss assessments under extreme climate scenarios: A case study of the Kaoping River basin. Nat. Hazards 2016, 86, 1039–1058. [Google Scholar] [CrossRef]
- Zhuang, J.; Peng, J.; Wang, G.; Iqbal, J.; Wang, Y.; Li, W.; Zhu, X. Prediction of rainfall-induced shallow landslides in the Loess Plateau, Yan’an, China, using the TRIGRS model. Earth Surf. Processes Landf. 2016, 42, 915–927. [Google Scholar] [CrossRef]
- An, K.; Kim, S.; Chae, T.; Park, D. Developing an Accessible Landslide Susceptibility Model Using Open-Source Resources. Sustainability 2018, 10, 293. [Google Scholar] [CrossRef]
- Hsu, Y.-C.; Liu, K.-F. Combining TRIGRS and DEBRIS-2D Models for the Simulation of a Rainfall Infiltration Induced Shallow Landslide and Subsequent Debris Flow. Water 2019, 11, 890. [Google Scholar] [CrossRef]
- Saadatkhah, N.; Mansor, S.; Kassim, A.; Lee, L.M.; Saadatkhah, R.; Sobhanmanesh, A. Regional modeling of rainfall-induced landslides using TRIGRS model by incorporating plant cover effects: Case study in Hulu Kelang, Malaysia. Environ. Earth Sci. 2016, 75, 445. [Google Scholar] [CrossRef]
- Gong, P.; Liu, H.; Zhang, M.; Li, C.; Wang, J.; Huang, H.; Clinton, N.; Ji, L.; Li, W.; Bai, Y.; et al. Stable classification with limited sample: Transferring a 30-m resolution sample set collected in 2015 to mapping 10-m resolution global land cover in 2017. Sci. Bull. 2019, 64, 370–373. [Google Scholar] [CrossRef]
- Sato, H.; Harp, E. Interpretation of earthquake-induced landslides triggered by the 12 May 2008, M7.9 Wenchuan earthquake in the Beichuan area, Sichuan Province, China using satellite imagery and Google Earth. Landslides 2009, 6, 153–159. [Google Scholar] [CrossRef]
- Tian, Y.; Owen, L.A.; Xu, C.; Ma, S.; Li, K.; Xu, X.; Figueiredo, P.M.; Kang, W.; Guo, P.; Wang, S.; et al. Landslide development within 3 years after the 2015 Mw 7.8 Gorkha earthquake, Nepal. Landslides 2020, 17, 1251–1267. [Google Scholar] [CrossRef]
- Weidner, L.; Oommen, T.; Escobar-Wolf, R.; Sajinkumar, K.S.; Samuel, R.A. Regional-scale back-analysis using TRIGRS: An approach to advance landslide hazard modeling and prediction in sparse data regions. Landslides 2018, 15, 2343–2356. [Google Scholar] [CrossRef]
- Tran, T.V.; Alvioli, M.; Lee, G.; An, H.U. Three-dimensional, time-dependent modeling of rainfall-induced landslides over a digital landscape: A case study. Landslides 2018, 15, 1071–1084. [Google Scholar] [CrossRef]
- Alvioli, M.; Baum, R.L. Parallelization of the TRIGRS model for rainfall-induced landslides using the message passing interface. Environ. Model. Softw. 2016, 81, 122–135. [Google Scholar] [CrossRef]
- Godt, J.; Baum, R.L.; Savage, W.Z.; Salciarini, D.; Schulz, W.; Harp, E.L. Transient deterministic shallow landslide modeling: Requirements for susceptibility and hazard assessments in a GIS framework. Eng. Geol. 2008, 102, 214–226. [Google Scholar] [CrossRef]
- Ma, S.; Shao, X.; Xu, C.; He, X.; Zhang, P. MAT.TRIGRS (V1.0): A new open-source tool for predicting spatiotemporal distribution of rainfall-induced landslides. Nat. Hazards Res. 2021, 1, 161–170. [Google Scholar] [CrossRef]
- Harp, E.; Michael, J.; Laprade, W. Shallow landslide hazard map of Seattle, Washington. Rev. Eng. Geol. 2008, 20, 67–82. [Google Scholar] [CrossRef]
- Baumann, V.; Bonadonna, C.; Cuomo, S.; Moscariello, M.; Biass, S.; Pistolesi, M.; Gattuso, A. Mapping the susceptibility of rain-triggered lahars at Vulcano island (Italy) combining field characterization, geotechnical analysis, and numerical modelling. Nat. Hazards Earth Syst. Sci. 2019, 19, 2421–2449. [Google Scholar] [CrossRef]
- Vieira, B.C.; Fernandes, N.F.; Augusto Filho, O.; Martins, T.D.; Montgomery, D.R. Assessing shallow landslide hazards using the TRIGRS and SHALSTAB models, Serra do Mar, Brazil. Environ. Earth Sci. 2018, 77, 260. [Google Scholar] [CrossRef]
- Saulnier, G.-M.; Beven, K.; Obled, C. Including spatially variable soil depths in TOPMODEL. J. Hydrol. 1997, 202, 158–172. [Google Scholar] [CrossRef]
- Bai, H.; Feng, W.; Yi, X.; Fang, H.; Wu, Y.; Deng, P.; Dai, H.; Hu, R. Group-occurring landslides and debris flows caused by the continuous heavy rainfall in June 2019 in Mibei Village, Longchuan County, Guangdong Province, China. Nat. Hazards 2021, 108, 3181–3201. [Google Scholar] [CrossRef]
- Das, B. Advanced Soil Mechanics; Taylor & Francis: London, UK; New York, NY, USA, 2008. [Google Scholar]
- He, J.; Qiu, H.; Qu, F.; Hu, S.; Yang, D.; Shen, Y.; Zhang, Y.; Sun, H.; Cao, M. Prediction of spatiotemporal stability and rainfall threshold of shallow landslides using the TRIGRS and Scoops3D models. Catena 2021, 197, 104999. [Google Scholar] [CrossRef]
- Medina, V.; Hürlimann, M.; Guo, Z.; Lloret, A.; Vaunat, J. Fast physically-based model for rainfall-induced landslide susceptibility assessment at regional scale. Catena 2021, 201, 105213. [Google Scholar] [CrossRef]
- Yu, C.-K.; Cheng, L.-W. Distribution and Mechanisms of Orographic Precipitation Associated with Typhoon Morakot (2009). J. Atmos. Sci. 2013, 70, 2894–2915. [Google Scholar] [CrossRef]
- Liu, J.-K.; Shih, P.T.-Y. Topographic Correction of Wind-Driven Rainfall for Landslide Analysis in Central Taiwan with Validation from Aerial and Satellite Optical Images. Remote Sens. 2013, 5, 2571–2589. [Google Scholar] [CrossRef] [Green Version]
- Chen, Y.-C.; Chang, K.-T.; Wang, S.F.; Huang, J.-C.; Yu, C.-K.; Tu, J.-Y.; Chu, H.-J.; Liu, C.-C. Controls of preferential orientation of earthquake- and rainfall-triggered landslides in Taiwan’s orogenic mountain belt. Earth Surf. Processes Landf. 2019, 44, 1661–1674. [Google Scholar] [CrossRef]
- Vorpahl, P.; Elsenbeer, H.; Märker, M.; Schröder, B. How can statistical models help to determine driving factors of landslides? Ecol. Model. 2012, 239, 27–39. [Google Scholar] [CrossRef]
- Kavzoglu, T.; Sahin, E.K.; Colkesen, I. Landslide susceptibility mapping using GIS-based multi-criteria decision analysis, support vector machines, and logistic regression. Landslides 2014, 11, 425–439. [Google Scholar] [CrossRef]
- Laimer, H.J. Anthropogenically induced landslides–A challenge for railway infrastructure in mountainous regions. Eng. Geol. 2017, 222, 92–101. [Google Scholar] [CrossRef]
- Vuillez, C.; Tonini, M.; Sudmeier-Rieux, K.; Devkota, S.; Derron, M.-H.; Jaboyedoff, M. Land use changes, landslides and roads in the Phewa Watershed, Western Nepal from 1979 to 2016. Appl. Geogr. 2018, 94, 30–40. [Google Scholar] [CrossRef]
- Li, Y.; Wang, X.; Mao, H. Influence of human activity on landslide susceptibility development in the Three Gorges area. Nat. Hazards 2020, 104, 2115–2151. [Google Scholar] [CrossRef]
- Tanyaş, H.; Görüm, T.; Kirschbaum, D.; Lombardo, L. Could road constructions be more hazardous than an earthquake in terms of mass movement? Nat. Hazards 2022, 112, 639–663. [Google Scholar] [CrossRef]


| Input Parameters | Cohesion (Kpa) | Friction Angle (°) | Unit Weight (kN/m3) | Saturated Hydraulic Conductivity (m/s) |
|---|---|---|---|---|
| 29 | 20 | 15 | 6.59 × 10⁻⁶ |
Publisher’s Note: MDPI stays neutral with regard to jurisdictional claims in published maps and institutional affiliations. |
© 2022 by the authors. Licensee MDPI, Basel, Switzerland. This article is an open access article distributed under the terms and conditions of the Creative Commons Attribution (CC BY) license (https://creativecommons.org/licenses/by/4.0/).
Share and Cite
Ma, S.; Shao, X.; Xu, C. Characterizing the Distribution Pattern and a Physically Based Susceptibility Assessment of Shallow Landslides Triggered by the 2019 Heavy Rainfall Event in Longchuan County, Guangdong Province, China. Remote Sens. 2022, 14, 4257. https://doi.org/10.3390/rs14174257
Ma S, Shao X, Xu C. Characterizing the Distribution Pattern and a Physically Based Susceptibility Assessment of Shallow Landslides Triggered by the 2019 Heavy Rainfall Event in Longchuan County, Guangdong Province, China. Remote Sensing. 2022; 14(17):4257. https://doi.org/10.3390/rs14174257
Chicago/Turabian StyleMa, Siyuan, Xiaoyi Shao, and Chong Xu. 2022. "Characterizing the Distribution Pattern and a Physically Based Susceptibility Assessment of Shallow Landslides Triggered by the 2019 Heavy Rainfall Event in Longchuan County, Guangdong Province, China" Remote Sensing 14, no. 17: 4257. https://doi.org/10.3390/rs14174257