Abstract
Urban green spaces (UGSs) are indispensable for providing various ecosystem services (ESs) to society and city-dwellers. The equitable allocation of ESs provided by UGSs is a prerequisite for maintaining urban sustainability and human well-being. However, empirical studies have assessed the dynamics of UGS equity from ES facets, while neglecting to strengthen integrated evaluation indicators and coupled spatially explicit models. A framework was developed in this study to assess the spatio-temporal patterns of ESs provided by UGSs and their equity based on models of the Intelligent Urban Ecosystem Management System, location entropy, and the Gini coefficient. The results indicated that with urban spatial expansion, in each concentric circle, the values of three ES averages were generally the lowest in the megacity (Xi’an), and the values of carbon sequestration and the recreation averages in the medium-sized cities (Baoji and Xianyang) were also lower than in the small-sized city (Tongchuan). The inequity of ESs provided by UGSs was exacerbated from 2000 to 2020 in the Xi’an Metropolitan Area. The ES equity was the worst in Xi’an and the best in Tongchuan. Areas with extremely low CR location entropy occupied 67.01% in 2020. As cities spatially expanded, areas with extremely low ES location entropy generally increased in 2020. Additionally, the zero-value area of the ES Gini coefficient in Xi’an was the largest from 2000 to 2020. The ES Gini values mostly increased in the same concentric circle of each city in 2020, which demonstrates that equity declined. Spatial equity could be improved by diversifying UGS structures, promoting spatial matching between the ES supply and beneficiaries’ demands, and integrating UGSs into any available space in future UGS planning. The findings of the study could offer insights for optimizing the equitable provision of UGS resources and the targeted planning of urban greening.
1. Introduction
Urban green spaces (UGSs) broadly include vegetated areas in cities, such as parks, forests, gardens, and greenways [1,2,3]. UGSs provide an array of ecosystem services (ESs) for city residents, which are essential for urban sustainable development [4,5]. The important ecological, social, and cultural functions and features that UGSs serve have mitigated the aggravation of environmental degradation caused by rapid urbanization [6]. Though most of the ESs provided by UGSs are poorly perceived by humans, these ESs play an irreplaceable role in human health promotion and urban sustainability [7,8] by regulating the urban climate [9], reducing noise [10], providing recreation [11], providing flood mitigation [12], etc. However, global urbanization has triggered intensified urban ecosystem issues, resource problems, and environmental stress on cities [6,13]. Additionally, urban population growth and rapid industrialization bring about the disorderly and unreasonable expansion of urban land [14]. These lead to increased fragmentation and reduced connectivity of UGSs, which bring ES decline and environmental issues, and profoundly affect urban dwellers’ life quality [1,15]. The imbalance of UGS patterns leads to an uneven distribution of human well-being from urban ecosystems, which will further result in increasingly prominent social equity issues [11,16,17]. The UN Sustainable Development Agenda also emphasizes that inequality in public resources threatens sustainable social and economic development [18]. Given the above, it is necessary to perform UGS equity assessments to achieve high-quality sustainable urban development and human well-being.
Due to the recognition of the importance of UGSs for physical and mental human well-being, scholars have made many efforts in the field of UGS equity in the last decade [19,20]. The current studies on UGS equity assessment are conducted from three aspects: (1) the quantitative equity of per capita indicators; (2) the social-group equity of residents of the social hierarchy; and (3) the spatial equity of residents’ actual needs [21,22,23,24]. Quantitative equity centers on per capita indicators such as the per capita greening rate and green coverage rate, ignoring the layout of UGSs and their availability to humans [25]. Social-group equity struggles to minimize the difference in UGS allocation in diversified social groups varying in gender, age structure, income level, etc. [26,27]. The spatial equity perspective focuses on the spatial matching of UGSs and the population, objectively spotlighting the residents’ real needs [2,28]. However, most of the existing studies from the perspective of spatial equity tend to calculate UGS accessibility to residents. For instance, Wolff et al. [29] detected spatial inequalities in green space accessibility, and their research revealed that unequal green space accessibility for urban green is compensated, in most countries, by more equal space for nonurban green. Hsu et al. [30] addressed UGS equity by adopting a multi-dimensional approach to measuring the accessibility and characteristics of UGSs in Australian metropolitan areas. However, the distinction of the well-being that different types of UGSs can offer is omitted in these studies [31]. In other words, UGSs differ in the underlying surface and vegetation coverage, which leads to the uneven well-being that people obtain from UGSs. Studies have investigated how the types, shapes, vegetation structure, and other configuration characteristics of UGSs’ influence the welfare of residents [3,32,33]. Yet, a large part of welfare comes from UGS ecosystems, and ESs are the core provider of diversified valuable well-being, maintaining city-dwellers’ healthy lives and counteracting the negative effects of urbanization [3]. Hence, it is more scientific and objective to weigh the spatial equity of ESs provided by different UGSs to mitigate the inequity of human well-being [13,34]. Integrating ESs into UGS planning has attracted increasing attention in the last decade [3,35], whereas research on UGS equity evaluation from the aspect of ESs is at the stage of constructing a theoretical framework for the lack of quantified data [1,34]. Although Chen et al. [18] innovatively evaluated the inequalities of per capita green space area and ESs in 20 cities of China using the Gini coefficient, the assessment is constrained to a single indicator and current static evaluation. Chen et al. [19] revealed a seasonal rhythm of UGS exposure inequality and demonstrated that the magnitude of changing inequality is highly dependent on the spatio-temporal variation in greenspace exposure. Therefore, empirical studies assessing the dynamics of the spatio-temporal equity of ESs provided by UGSs, using integrated evaluation indicators and coupled spatially explicit models, need to be further strengthened, particularly regarding urban differences in large-scale regions.
A process-based model has been proven to be the common methodology for the dynamic investigation of ESs provided by UGSs in comparatively large areas (e.g., an entire city or region) [36,37,38]. The InVEST (Integrated Valuation of Ecosystem Services and Tradeoffs) model, ARIES (Artificial Intelligence for Ecosystem Services) tool, SolVES (Social Values for Ecosystem Services) tool, and i-Tree tool [39] are the mainstream methods of ES assessment. Nevertheless, the ARIES, SolVES, and i-Tree tools are limited by scale and are incapable of simultaneously assessing a large number of urban ESs [12]. Although the InVEST model is widely used [40,41,42], it is not convenient or friendly for ecological assessment in China [43]. Additionally, the oversimplified processes and inappropriate assumptions of the InVEST model may lead to uncertainties in its application in urban areas [39]. The Intelligent Urban Ecosystem Management System (IUEMS), developed by Ouyang et al. [43] for urban ES evaluation based on the ecological process features of China in 2017, is the first online ES assessment platform in China. It features a low operating threshold, high process visualization, and common data input formats strongly applicable to Chinese ES evaluation [43]. For instance, Ma et al. [44] applied the carbon sequestration (CS) and oxygen release model to the IUEMS to measure the carbon sink in the Qinling Mountains, and validated that the IUEMS has strong applicability to the calculation of forest ecosystem carbon sinks. After quantifying the essential ESs provided by UGSs, another challenge is to spatially explicitly evaluate the ES equity of the inhabitants. The Gini coefficient, proposed as the income distribution equity indicator in economics, has been prevailing in the equity assessment of urban medical and educational resources and UGS allocation in the past two decades [4,18,31]. However, the Gini coefficient is mostly in a two-dimensional table or curve form at the whole-city scale when applied to the evaluation of UGS equity [27,28]. Thus, gaps exist in the evaluation of the spatial equity of ESs provided by UGSs at a finer scale.
In this setting, it is imperative to explore the past–present evolution of ESs provided by UGSs and their spatial equity in different-sized cities to propose feasible greening policy suggestions and achieve high-quality sustainable development. Here, the Xi’an Metropolitan Area (XMA) was employed as a case study to construct a framework aiming to (1) quantify and spatially map ESs provided by UGSs and clarify changes in ES spatio-temporal patterns; and (2) identify the spatio-temporal evolution of the equity of ESs provided by UGSs based on location entropy at a grid scale and the Gini coefficient at a concentric circle scale.
2. Materials and Methods
2.1. Study Area
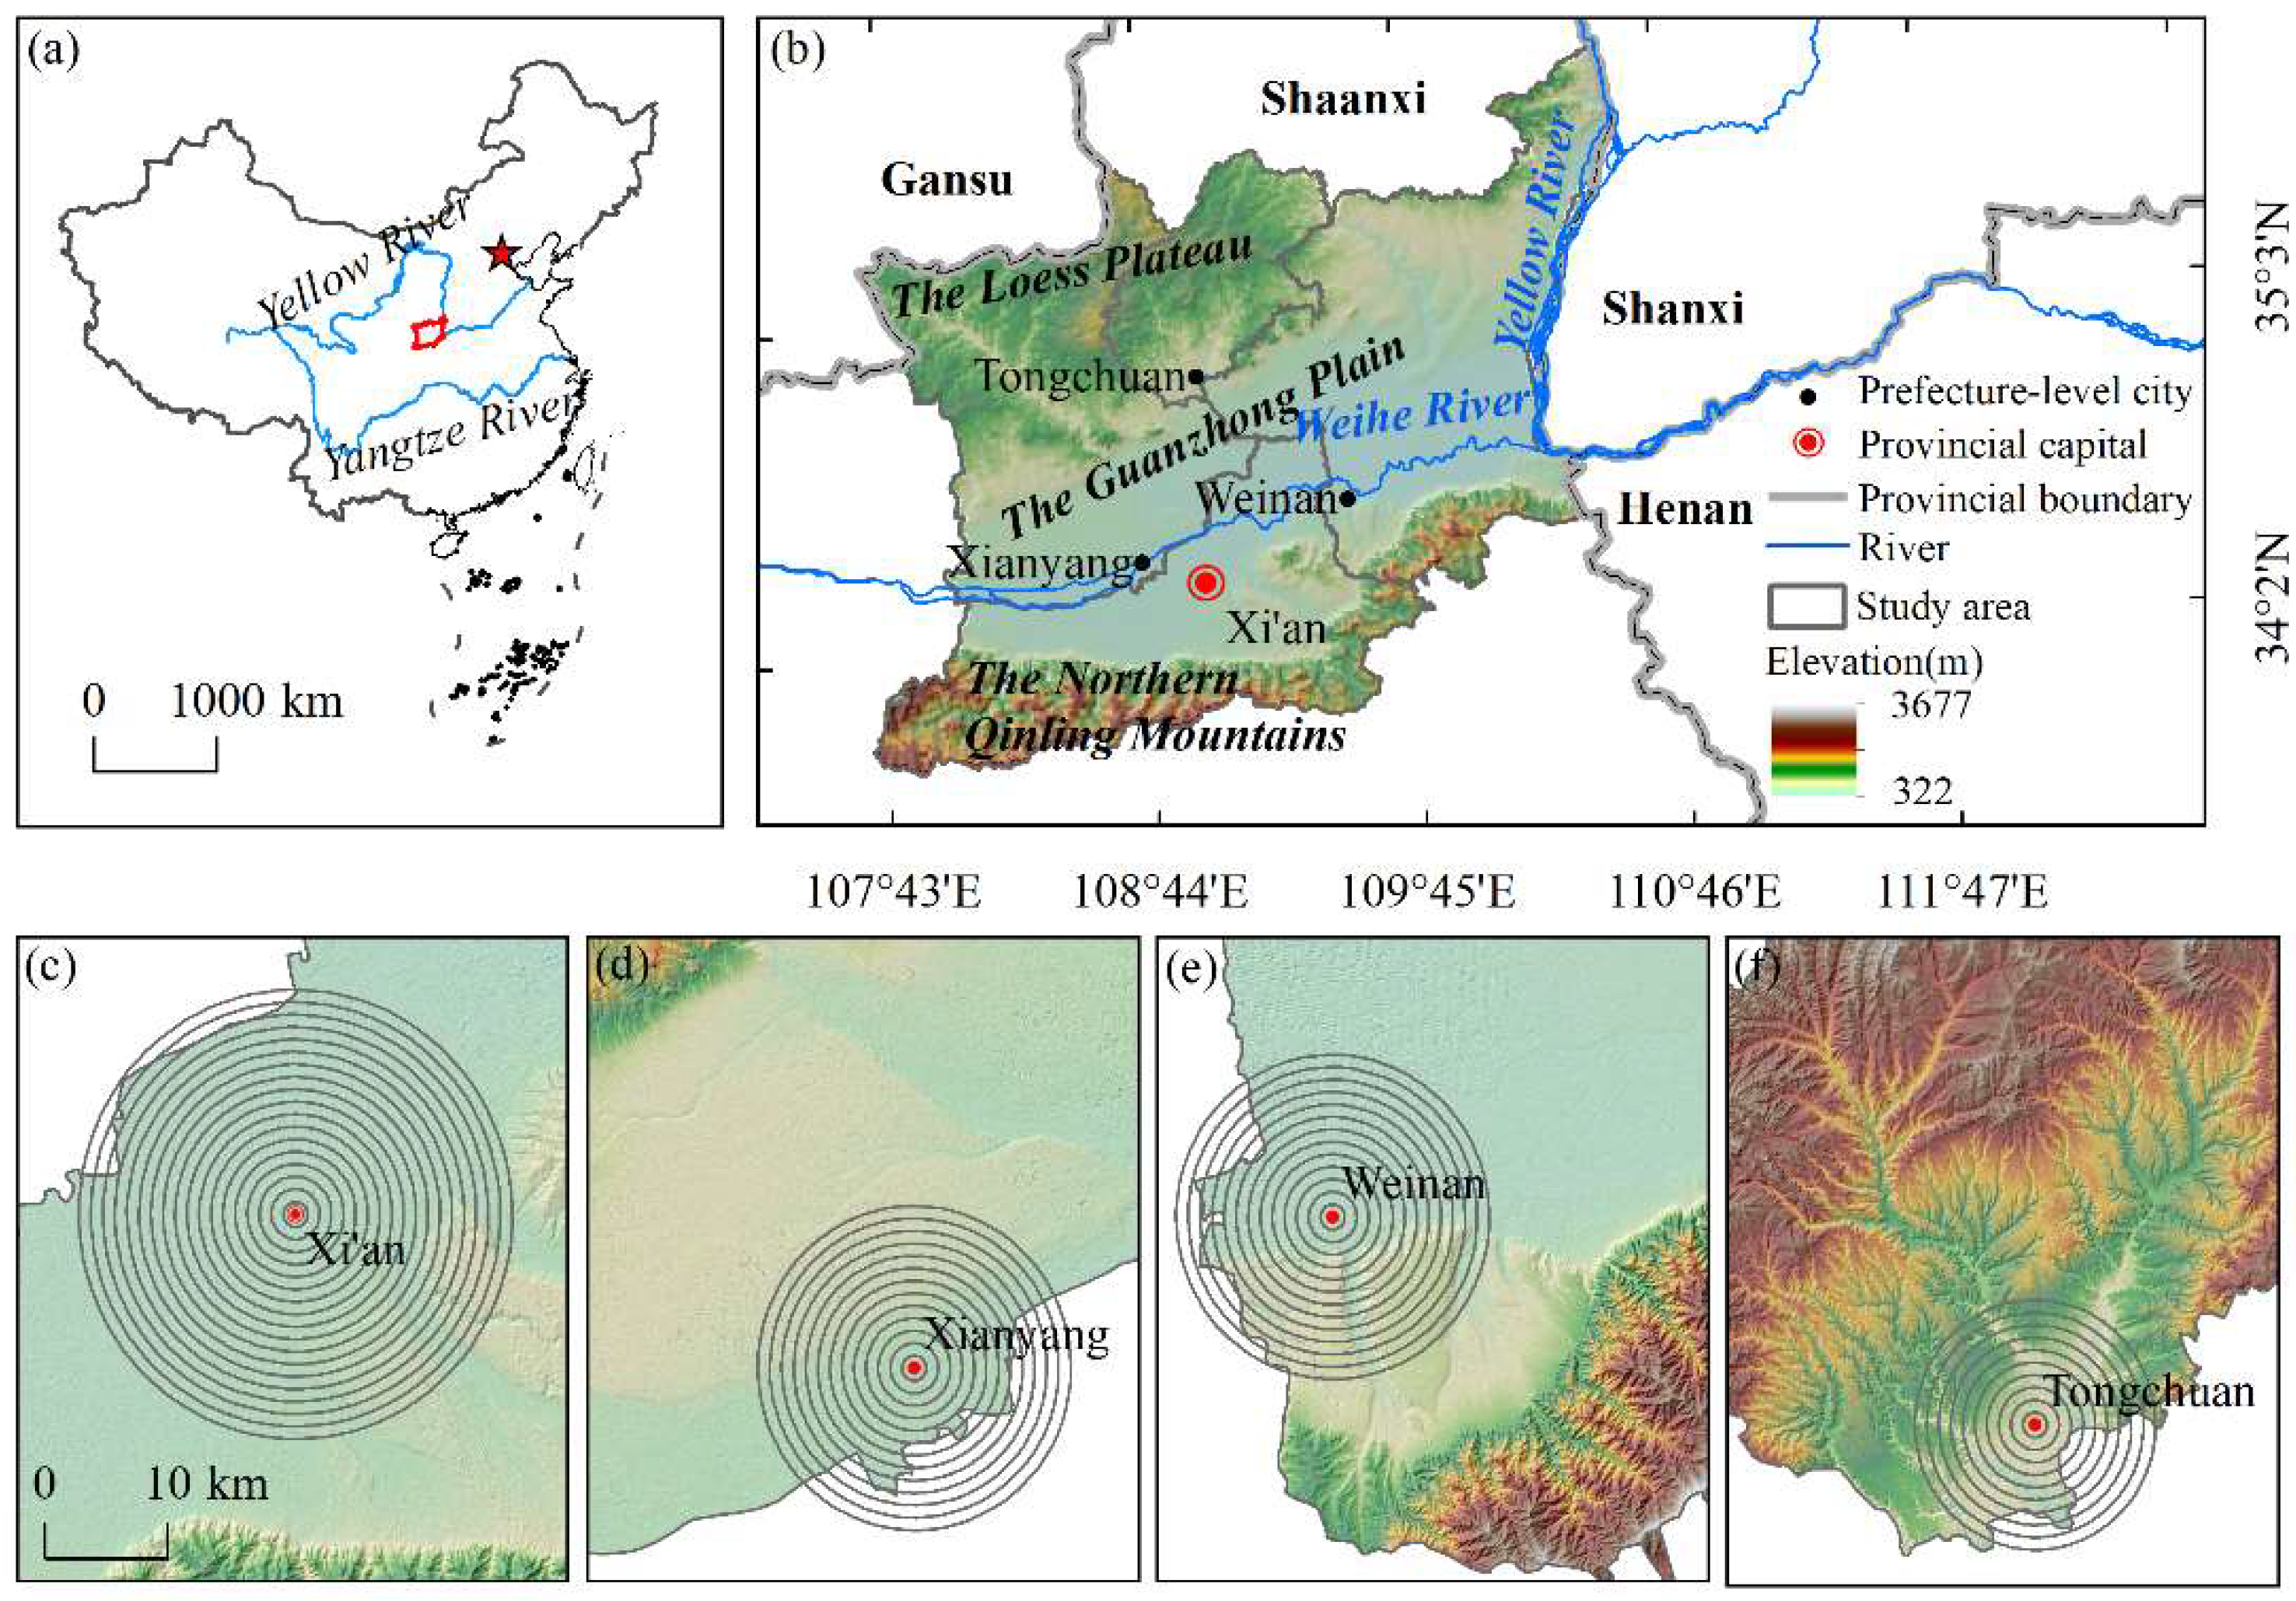
The XMA is the first metropolitan area in Northwest China (Figure 1). The topography of the XMA is complex and diverse, with the northwestern part bordering the Loess Plateau, a large plain in the middle, and a small part of the Northern Qinling Mountains in the south. The elevation of the XMA ranges from 322 m to 3677 m. The climate is predominated by a temperate continental climate with average annual precipitation of 600–800 mm and an average temperature of 6–13 °C [45,46]. The regional GDP of the XMA is about CNY 1.3 trillion. The development of the XMA is guided by the spatial development strategy of ‘one core, two axes, and many grouped clusters’. Under China’s Western Development Strategy, XMA construction is crucial for the ecological protection and high-quality development of the Yellow River basin and the co-construction of the belt and road [47]. In recent decades, the boost in the economy in the XMA has been accompanied by rapid urban expansion and a fast-growing population, leading to serious urban environmental degradation problems, including water scarcity, soil and water loss, river pollution, and harsh climate events [48,49,50]. With the increasing prominence of ecological and social issues in the XMA, rational UGS construction is more necessary to maintain urban sustainability and the high-quality lives of city-dwellers. The cities in the XMA can be categorized into three classes: (1) the megacity, Xian, with a resident population of more than 20 million; (2) the medium-sized cities, Xianyang and Weinan, with a resident population ranging from 3 to 6 million; and (3) the small-sized city, Tongchuan, with a resident population of less than 3 million. Different concentric circles were applied in different-sized cities for targeted and specific analysis along urban–rural gradients.
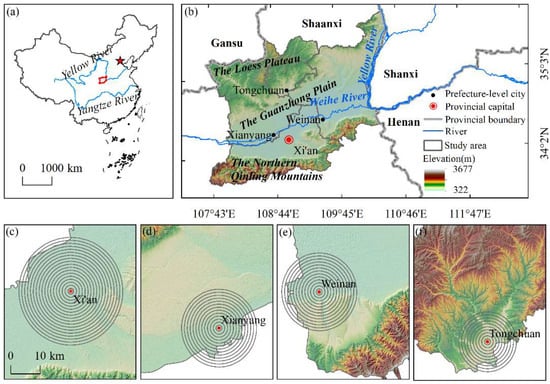
Figure 1.
Overview of the Xi’an Metropolitan Area: (a) the location in China; (b) the administrative status; topographical features of selected concentric circles along urban–rural gradients in (c) Xi’an, (d) Xianyang, (e) Weinan, and (f) Tongchuan.
2.2. Research Framework
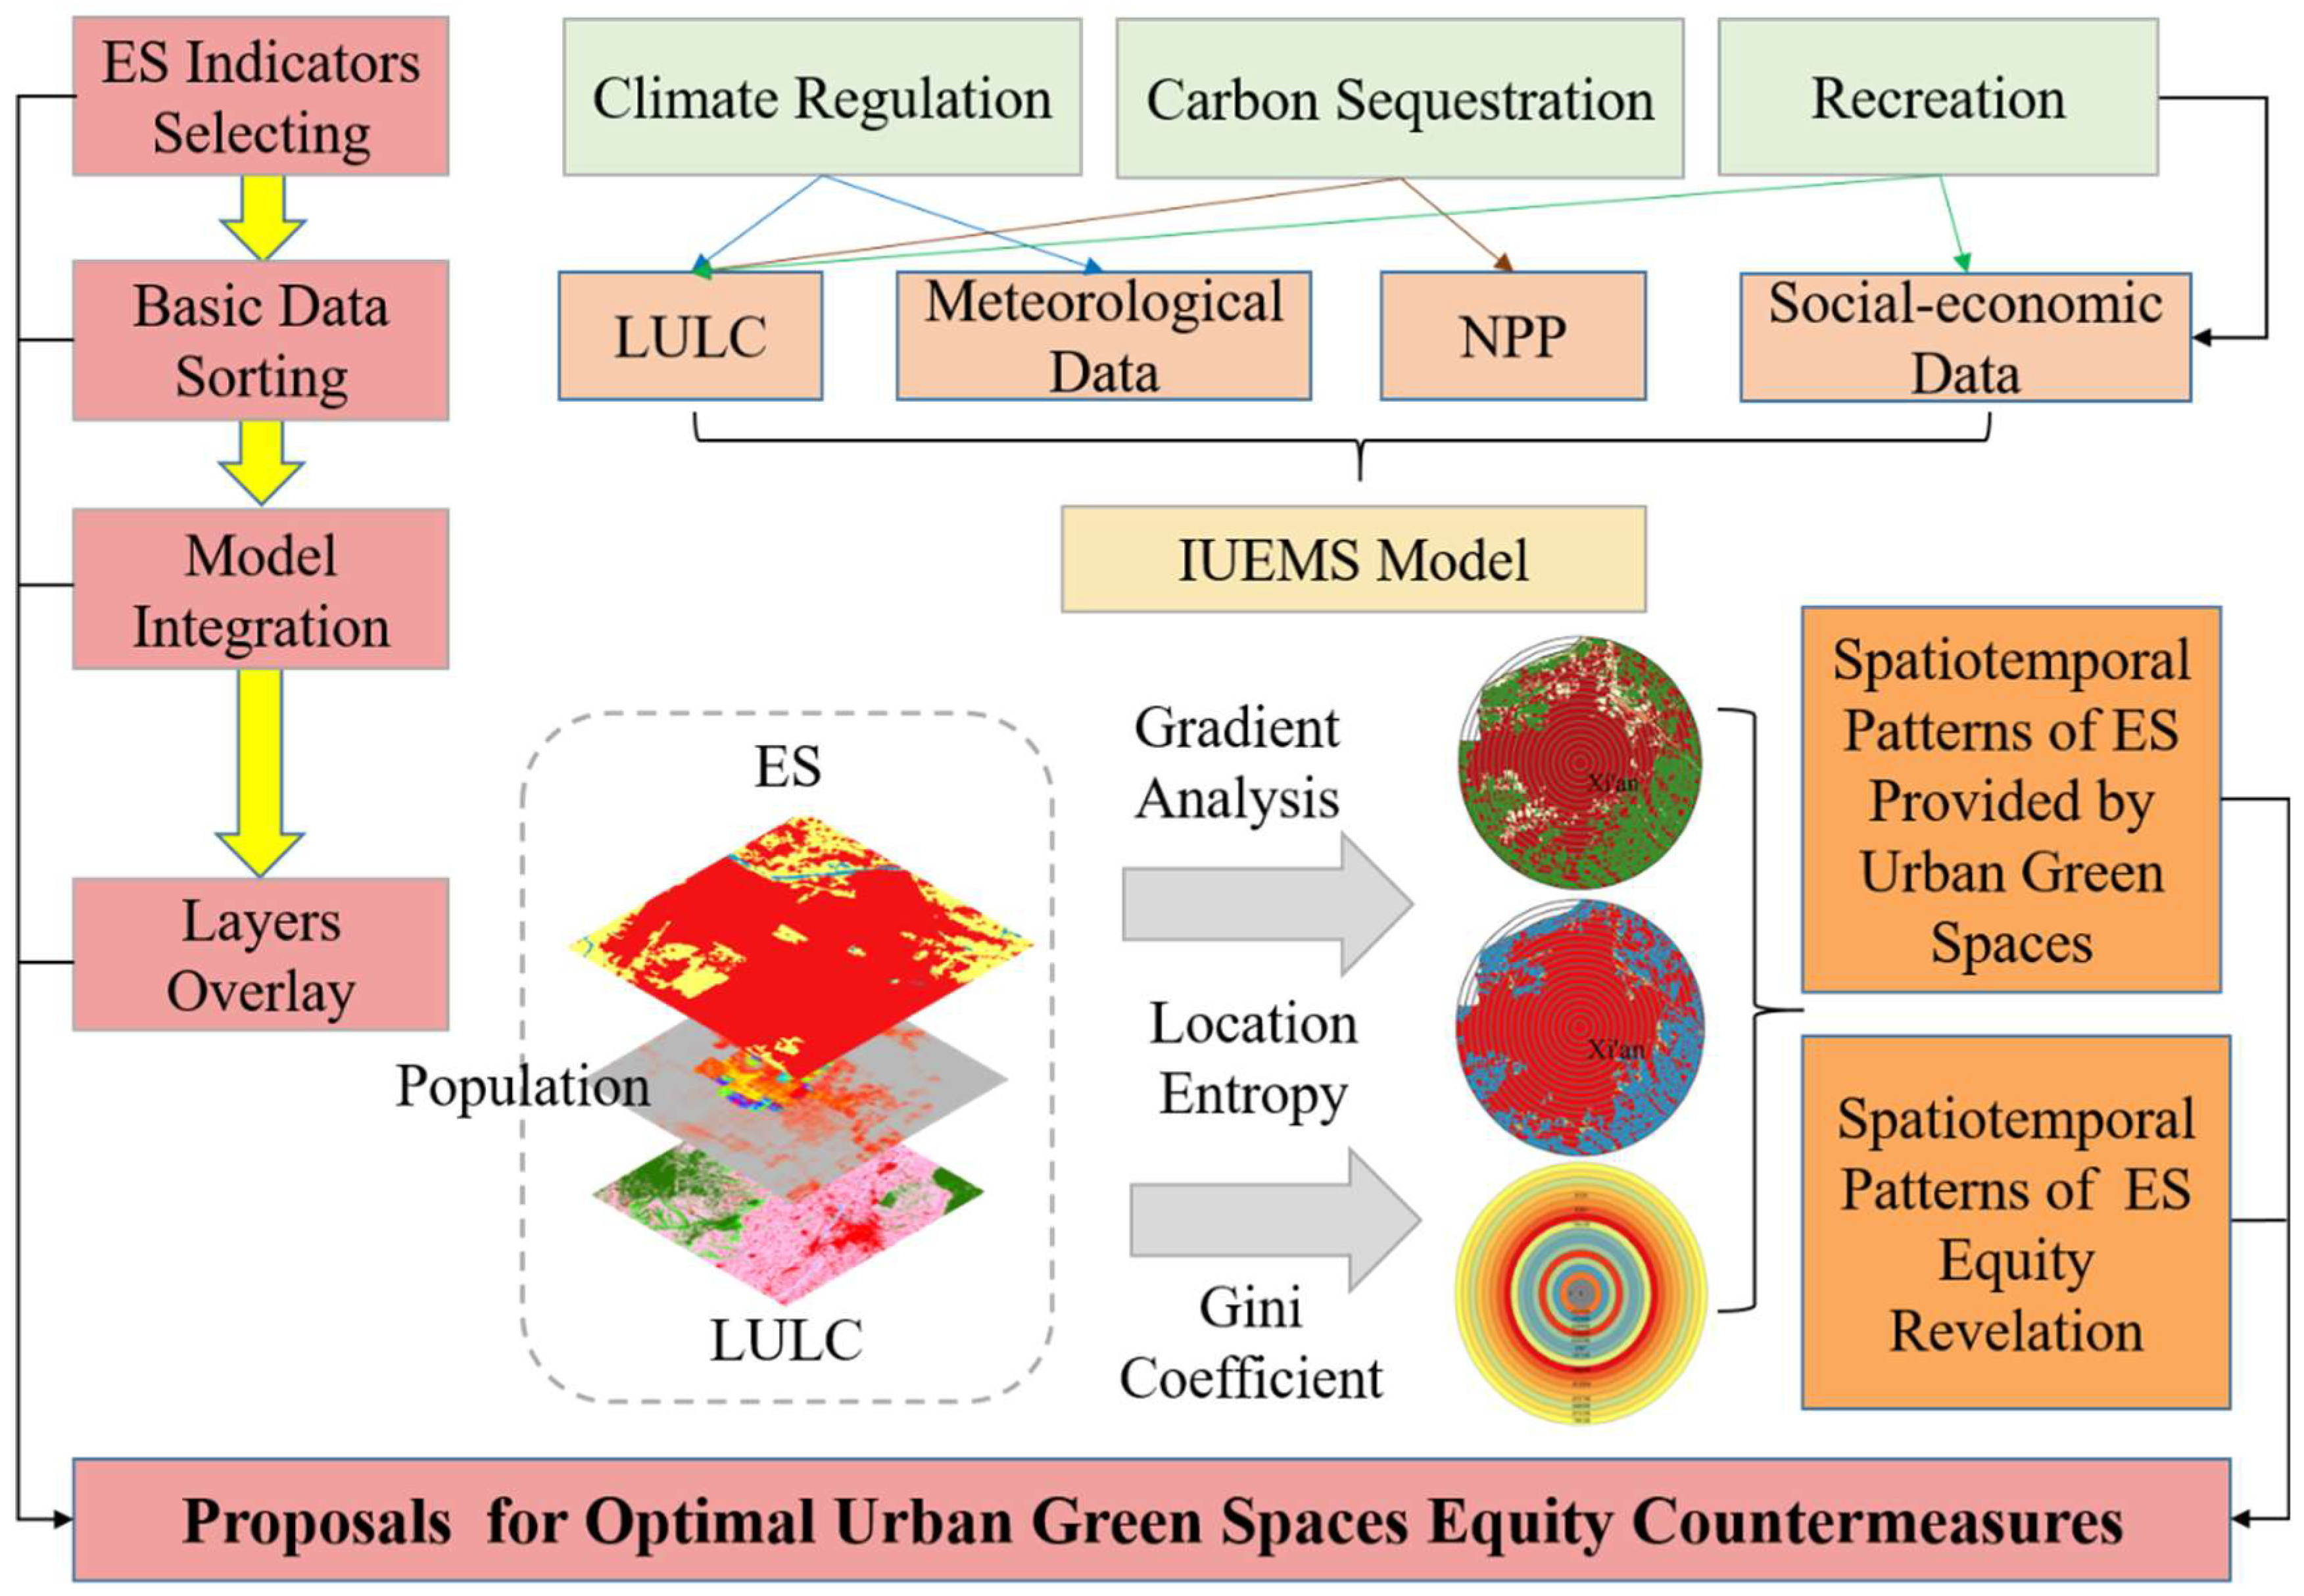
The integrated research framework was designed to identify the dynamics of ESs that humans derive from UGSs and their equity at a metropolitan area scale (Figure 2). The research framework consisted of five main phases: indicator selection, data collection, ES quantification, spatial overlay analysis, and proposed optimal UGS equity countermeasures. In the first stage, climate regulation (CR), CS, and recreation were selected as essential ES indicators given their importance for the regional sustainable development of the XMA. Next, basic data, including land use/land cover (LULC) data, meteorological data, etc., were collected. The selected ESs were quantified by models in the IUEMS during the third stage. In the fourth stage, the temporal and spatial patterns of ESs provided by UGSs and their equity were mapped and revealed using gradient analysis, location entropy, and the Gini coefficient across the urban–rural gradients. Finally, optimized proposals for UGS equity planning were explored. The framework contributed to identifying the differences in ESs and their equity patterns, and the influencing factors of different-sized cities, further providing support for urban greening planning in metropolitan areas.
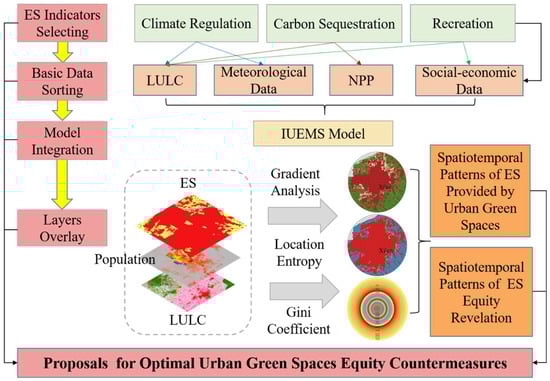
Figure 2.
The research framework of the spatio-temporal patterns of ecosystem services provided by urban green spaces and their equity evaluation.
2.3. Data Sources
Multisource datasets were integrated in this study (Table 1). The overall accuracy of the LULC data in 2010 from GlobeLand30 was 83.50%, and the Kappa coefficient was 0.78; the overall accuracy of the LULC data in 2020 for GlobeLand30 was 85.72%, and the Kappa coefficient was 0.82 [51,52]. The population density data were taken from WorldPop based on a random forest model and a global database of administrative unit-based census information [19]. Net primary productivity (NPP) was obtained by processing NASA’s MODIS17A3 data in Modis Reprojection Tools and ENVI 5.3 software. The ASTER DEMv3 data were requested from the National Earth System Science Data Center, National Science and Technology Infrastructure of China.

Table 1.
Summary of data involved in the study.
2.4. Methods
2.4.1. Quantification of ESs in IUEMS
In this study, CR, CS, and recreation were quantified using the ES assessment models in the IUEMS (https://www.iuems.com/eco/index.html, accessed on 24 July 2021) at a 30 m grid spatial resolution. The IUEMS, the first online ES assessment platform in China, has been successfully applied in the ES assessment-related work of Beijing, Shenzhen, Kunming, and other local governments [43]. It is equipped with powerful functions with various types of ES assessment models and comprehensive indicator-based assessment models, Eco-brain, E-sharing platform, etc. [44]. The models in the IUEMS were more suitable for urban ES evaluation in China for considering ecological characteristics. The principles and details of the ES assessment models are listed below.
- 1.
- Climate regulation (CR)
Natural ecosystems regulate their temperatures to moderate the negative effects of heat islands through biophysical processes such as the transpiration of vegetation and the evaporation of the water surface to absorb solar energy [37,53]. Based on the land-use data, the CR model in the IUEMS uses the total energy consumed by the evapotranspiration of ecosystems as a functional quantity to regulate climate. The formula is defined as follows:
where Ett refers to the total energy consumed by transpiration and evaporation in the ecosystem; Ept is the energy consumed by the transpiration of vegetation in an ecosystem; Ewe is the energy consumed by evaporation from the water surface of the ecosystem; i is the type of ecosystem; Eppi is the heat consumption per unit area of transpiration in ecosystem type i, which is set as default in the CR model of the IUEMS; Si is the area of ecosystem type i; D is the number of days with the air conditioning on, that is, days when air temperature is above 26 °C, and it is sorted by the day-scale air temperature data of the meteorological data from each city. Because D needs to be input as a single value in the model, the actual input of D is the average value of days in which the air temperature is higher than 26 °C in each meteorological station within four cities in the XMA. r stands for the air conditioner energy efficiency ratio (set as default in the model, namely 3). Ew is the water surface evaporation during days with the air conditioning on, which is calculated using the day-scale air temperature, humidness, and wind speed indicators of the meteorological data. Ew is the average Ew of each meteorological station within the four cities. q is the latent heat of volatilization (set using the average parameters of the humidifiers).
- 2.
- Carbon sequestration (CS)
Natural ecosystems absorb carbon dioxide from the atmosphere during photosynthesis to synthesize organic matter and fix the carbon in plants or the soil to reduce the concentration of carbon dioxide in the atmosphere, which helps mitigate the greenhouse effect and improve the habitat [42]. The calculated equations in the CS model are presented as follows:
where NEP refers to net ecosystem productivity; α is the conversion factor between NEP and NPP (set as default in the CS model); NPP is the net primary production of vegetation. The annual NPP (kg C m−2 a−1) derives from NASA’s MODIS17A3 data, and the unit needs to be converted to t C ha−1 a−1. is the coefficient of conversion of dry matter to carbon, namely 72/162 in the model; is the sequestration amount of carbon dioxide in the ecosystem; and is the coefficient by which carbon is converted to carbon dioxide, namely 44/12 in the model.
- 3.
- Recreation
Natural ecosystems have the biophysical capacity to provide recreational opportunities, which are influenced by biophysical UGS features including type, size, accessibility, configuration, biodiversity, etc. [32]. The default mode of the recreation model was adopted in this study, and the equations are shown below [54]:
where Gi is the UGS-to-population ratio of UGS pixel i; i refers to the count of UGS pixels; Si is the UGS area in pixel i; pk is the population in pixel i; dki is the Euclidean distance between pixels k and i; d0 is the search radius; and f (dki) is the decay function describing the decline in service against distance. The default decay function in the recreation model is applied in this study.
where Rj is the UGS per capita supplied to pixel j; j is any pixel in the study area; Ri is the UGS-population ratio of UGS pixel i; dij is the Euclidean distance between pixels i and j; and d0 is the search radius.
2.4.2. Gradient Analysis
Gradient analysis is a useful tool when studying the effects of human disturbances on ecological, social, and coupled natural–human systems [55,56]. The utilization of urban–rural gradients is important for formulating effective land management and conservation policies. UGS studies applying administrative boundaries which cover large rural areas may result in imprecise UGS assessments [55,57,58]. Therefore, different concentric circle ranges covering the urban core development zone were assigned as the extent of UGS equity evaluation along the urban–rural gradient, which was based on the development scale of Xi’an, Xianyang, Weinan, and Tongchuan according to the existing study [14] (Figure 1). A series of concentric circles with gradually expanding radius distances (unit: km) can explicitly elucidate changes in ES patterns and how UGS equity patterns respond to the extension of the spatial scope in differently sized cities. This provides a reference to analyze the mechanism of equity changes in differently sized cities.
2.4.3. Measuring UGS Equity by Location Entropy at Grid Scale
Location entropy was applied as a quantitative indicator to evaluate the equity of ESs provided by UGSs in this study. Location entropy has become increasingly popular in environmental equity measurements recently [59,60,61]. In this study, location entropy focused on characterizing the level of per capita ESs provided by UGSs across the entire study area at grid level from the aspect of spatial matching, with the classification into five classes in Table 2 referring to the existing studies [21,59,62]. The location entropy was expressed using the following equation:
where LEi means the location entropy of pixel i; i is the count of 100 m grids; Ei is the total number of corresponding single ES of pixel i; E is the total number of corresponding single ES of the study area; Pi is the total number of populations in pixel i; and P is the total number of populations in the study area.
Table 2.
Location entropy characterized by equity grade in this study area.
2.4.4. Measuring UGS Equity Using Gini Coefficient at Concentric Circle Scale
The Gini coefficient was spatially mapped at a finer concentric circle scale. As another equity assessment indicator, the Gini coefficient expresses the evenness of ESs provided by UGSs distributed to the inhabitants. The Gini coefficient has been well adopted in many recent studies on UGS inequity evaluation [19,24,63]. Additionally, in this study, the Gini coefficient was based on matching between the ESs and the population of each 100 × 100 m grid within a single concentric circle. The Gini equation was presented as follows:
where Gini represents the equity of ESs provided by UGSs within a concentric circle; j is the count of 100 m grids within a concentric circle; j = 1, …, n; Wj is the cumulative share of ESs in pixel j; Pj is the total number of populations in pixel j; Nn is the total number of populations in all pixels within the concentric circle; and Wn is the total share of ESs within the concentric circle. The ES equity characterized by the Gini coefficients was divided into five categories [2,4]—i.e., no ESs allocated to residents when the Gini coefficients of ESs equal to 0 within a concentric circle; the absolute average with Gini coefficients ranging from 0 to 0.2; the relative average with Gini coefficients between 0.2 and 0.5, relatively large gaps with Gini coefficients ranging from 0.5 to 0.8, and huge gaps with Gini coefficients between 0.8 and 1.
3. Results
3.1. Evolution of Land-Use Structure in the Xi’an Metropolitan Area
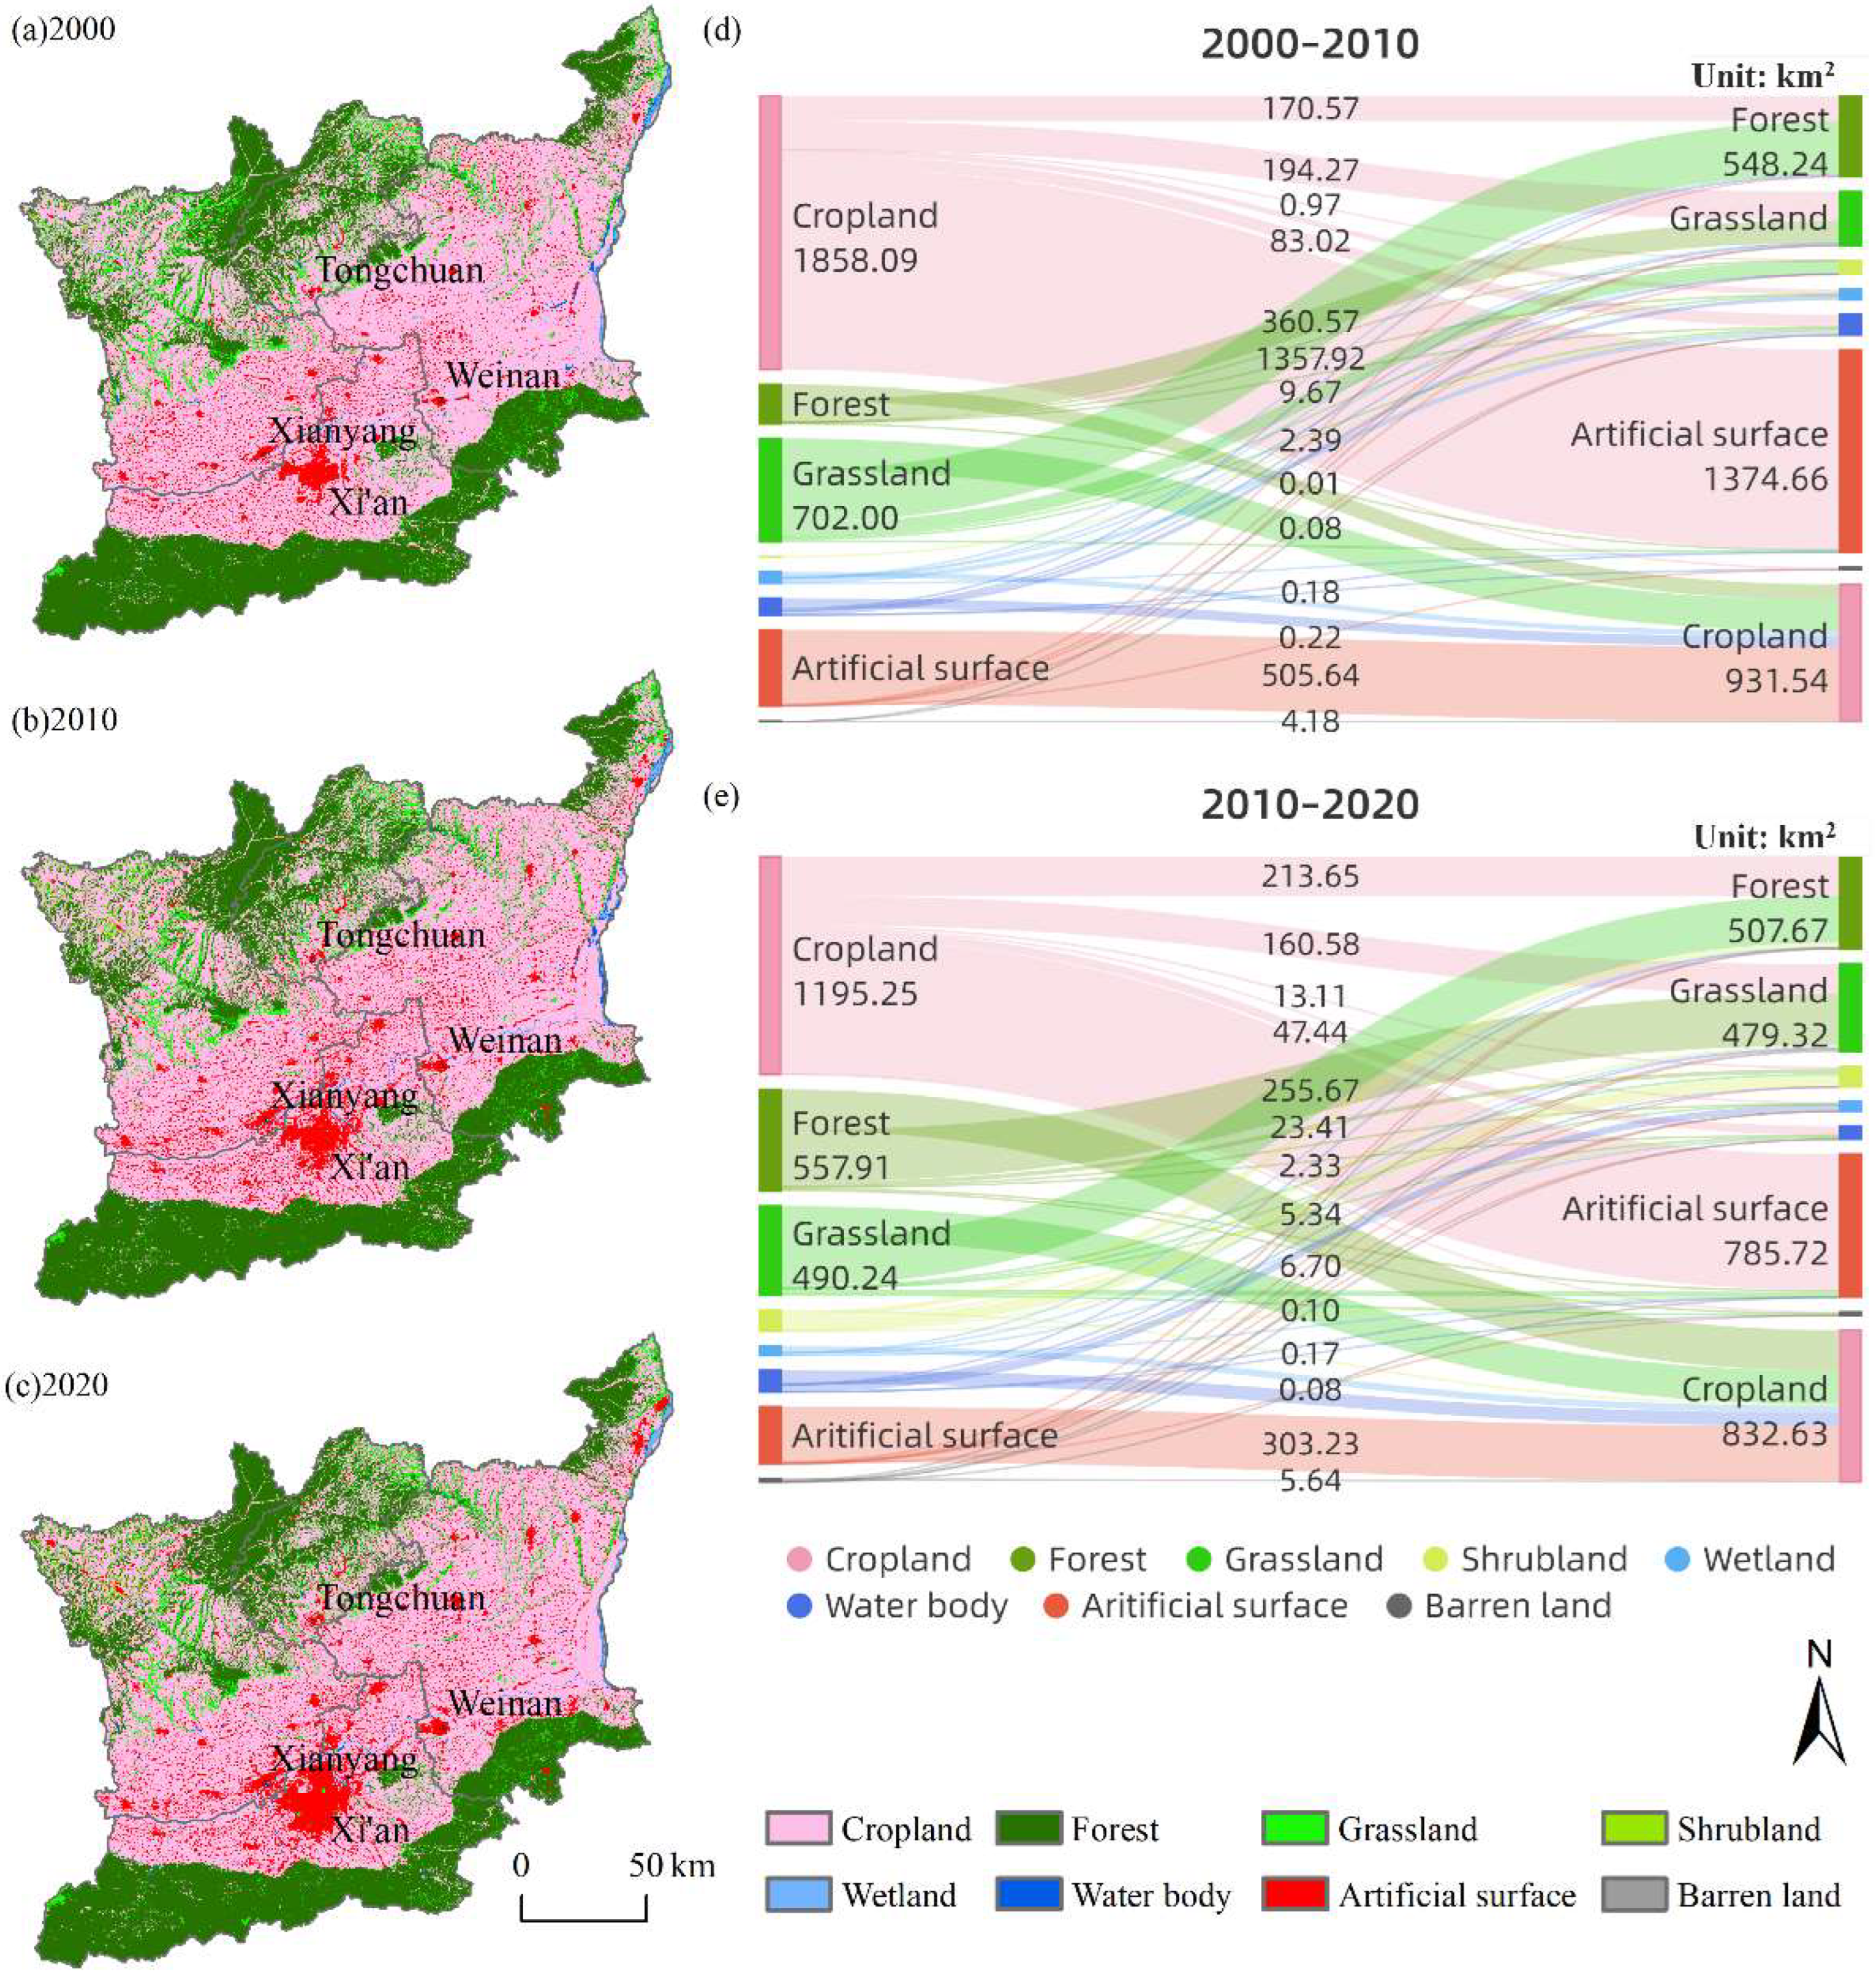
Cropland, forest, and artificial surface were the dominant land-use types, jointly accounting for about 93% of the total study area. The quantitative structure of each land-use type in the XMA has undergone considerable changes over 20 years (Figure 3). The change in cropland was the most dramatic, with an abidingly substantial decrease of 1289 km2 between 2000 and 2020. Forest showed a trend of increasing and then decreasing, with a net increase of 232.38 km2 from 2000 to 2020. During the study period, the total area of the artificial surface expanded significantly, with a growth rate of 56.27%. Additionally, it is worth noting that water bodies evidenced a sharp reduction (−21.16%) from 2010 to 2020. From 2000 to 2020, the conversion of cropland into artificial surface was the main form of land transfer in the XMA, followed by the transfer between grassland and forest and the conversion of water bodies into cropland. The transfer of cropland to artificial surface was the most prominent, with an area of 1357.92 km2 and 746.49 km2 shifted in 2010 and 2020, respectively. The considerable amount of cropland converted to grassland in 2010 (194.27 km2) and forest in 2020 (213.65 km2) is mainly attributed to the project of returning cropland to forest and grassland implemented in the study period.

Figure 3.
Land-use structure of the XMA in (a) 2000, (b) 2010, and (c) 2020; the flow of conversions in land use in the XMA from 2000 to 2010 (d) and from 2010 to 2020 (e) (unit: km2).
3.2. Spatio-Temporal Patterns of ESs across Urban Hierarchical Levels
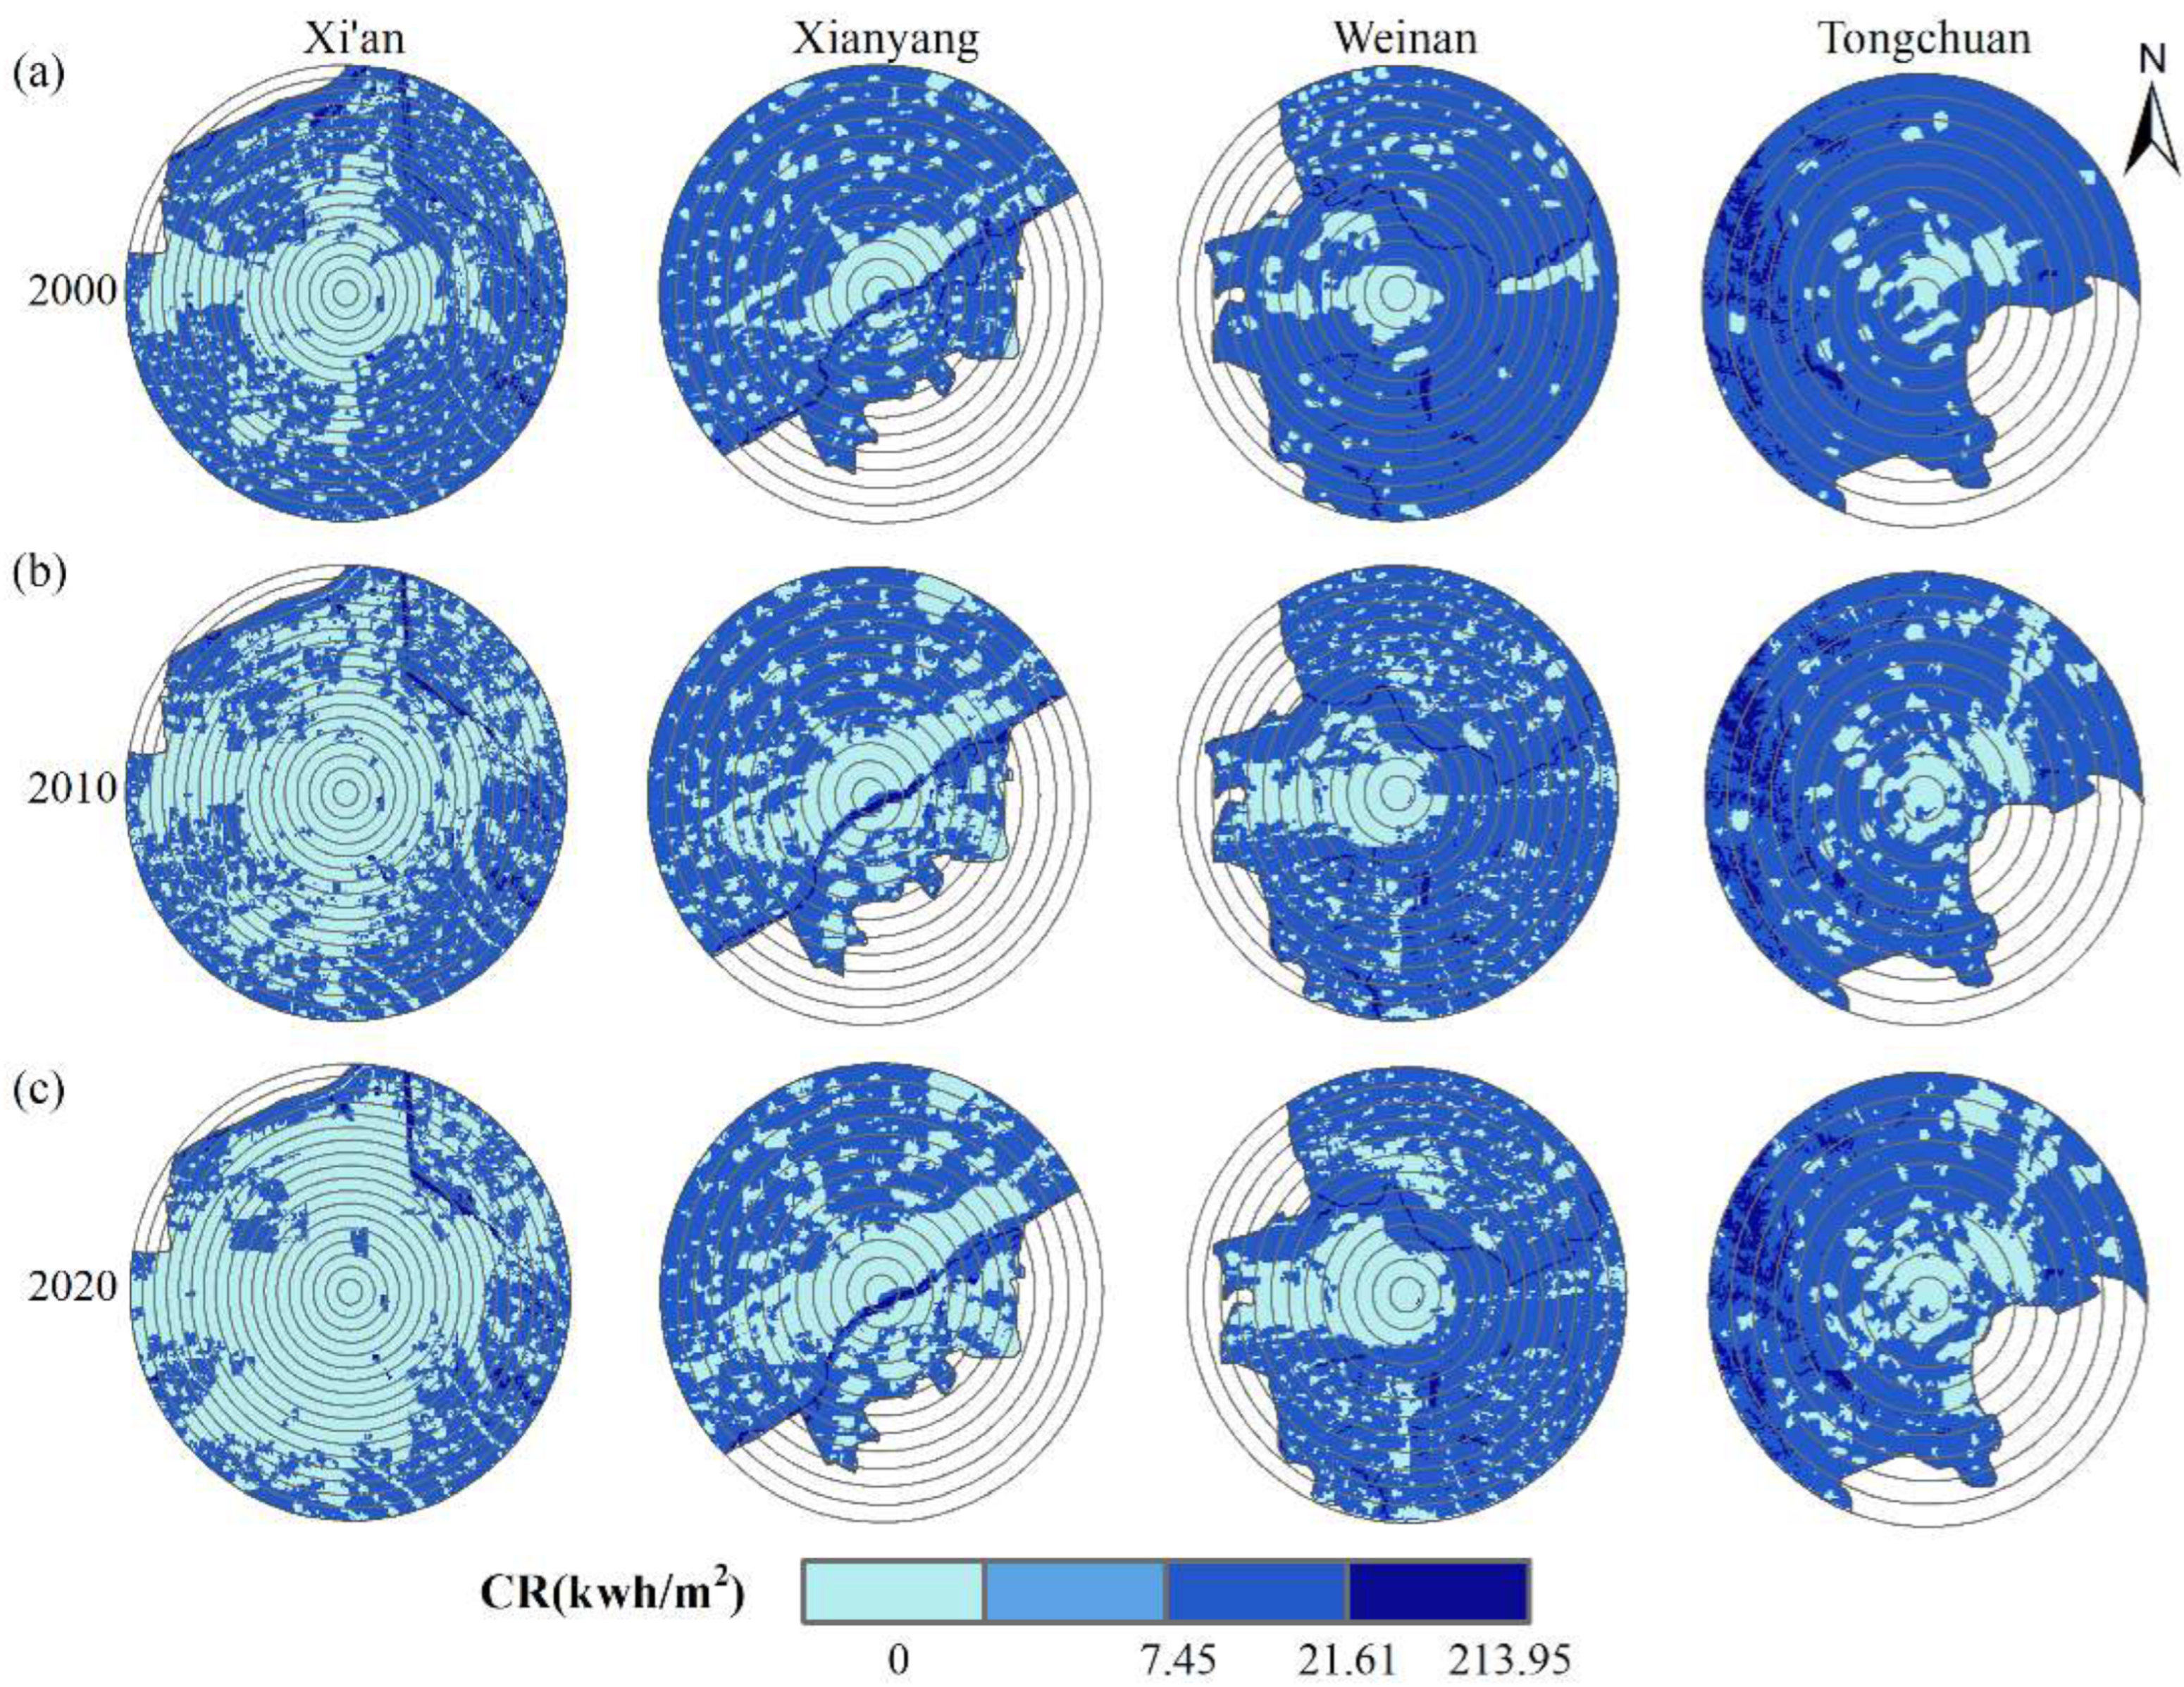
The large spatio-temporal heterogeneity of ES supply was shown in differently sized cities in the XMA (Figure 4, Figure 5 and Figure 6). ESs were generally in shortage in city centers and rich in the suburbs. From 2000 to 2020, the total CR in four cities and total recreation in Xi’an, Xianyang, and Tongchuan significantly decreased, while the total CS of all cities instantly increased, except Xi’an. The average ES in the four cities generally presented an increasing trend along the urban–rural gradients (Figure 7) and showed a hierarchical pattern among the cities of the XMA from 2000 to 2020. There existed a predominantly significant drop in average ES in the same concentric circle of all cities in 2020 as compared to 2000.
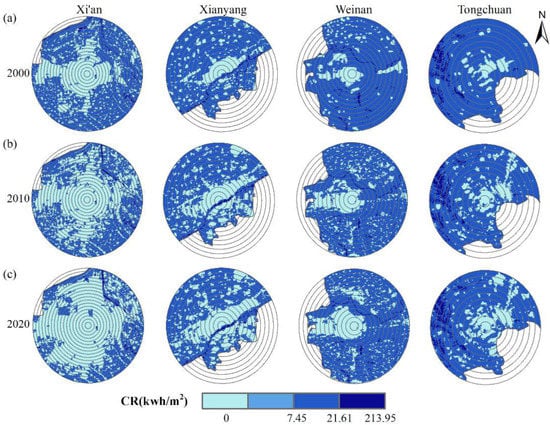
Figure 4.
Spatio-temporal dynamic maps of climate regulation (CR) in (a) 2000, (b) 2010, and (c) 2020 in the XMA (unit: kwh/m2).
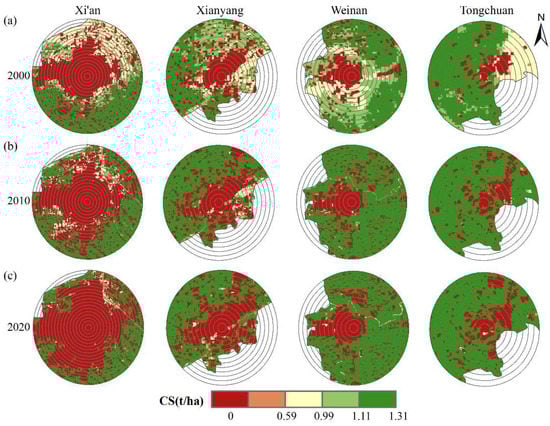
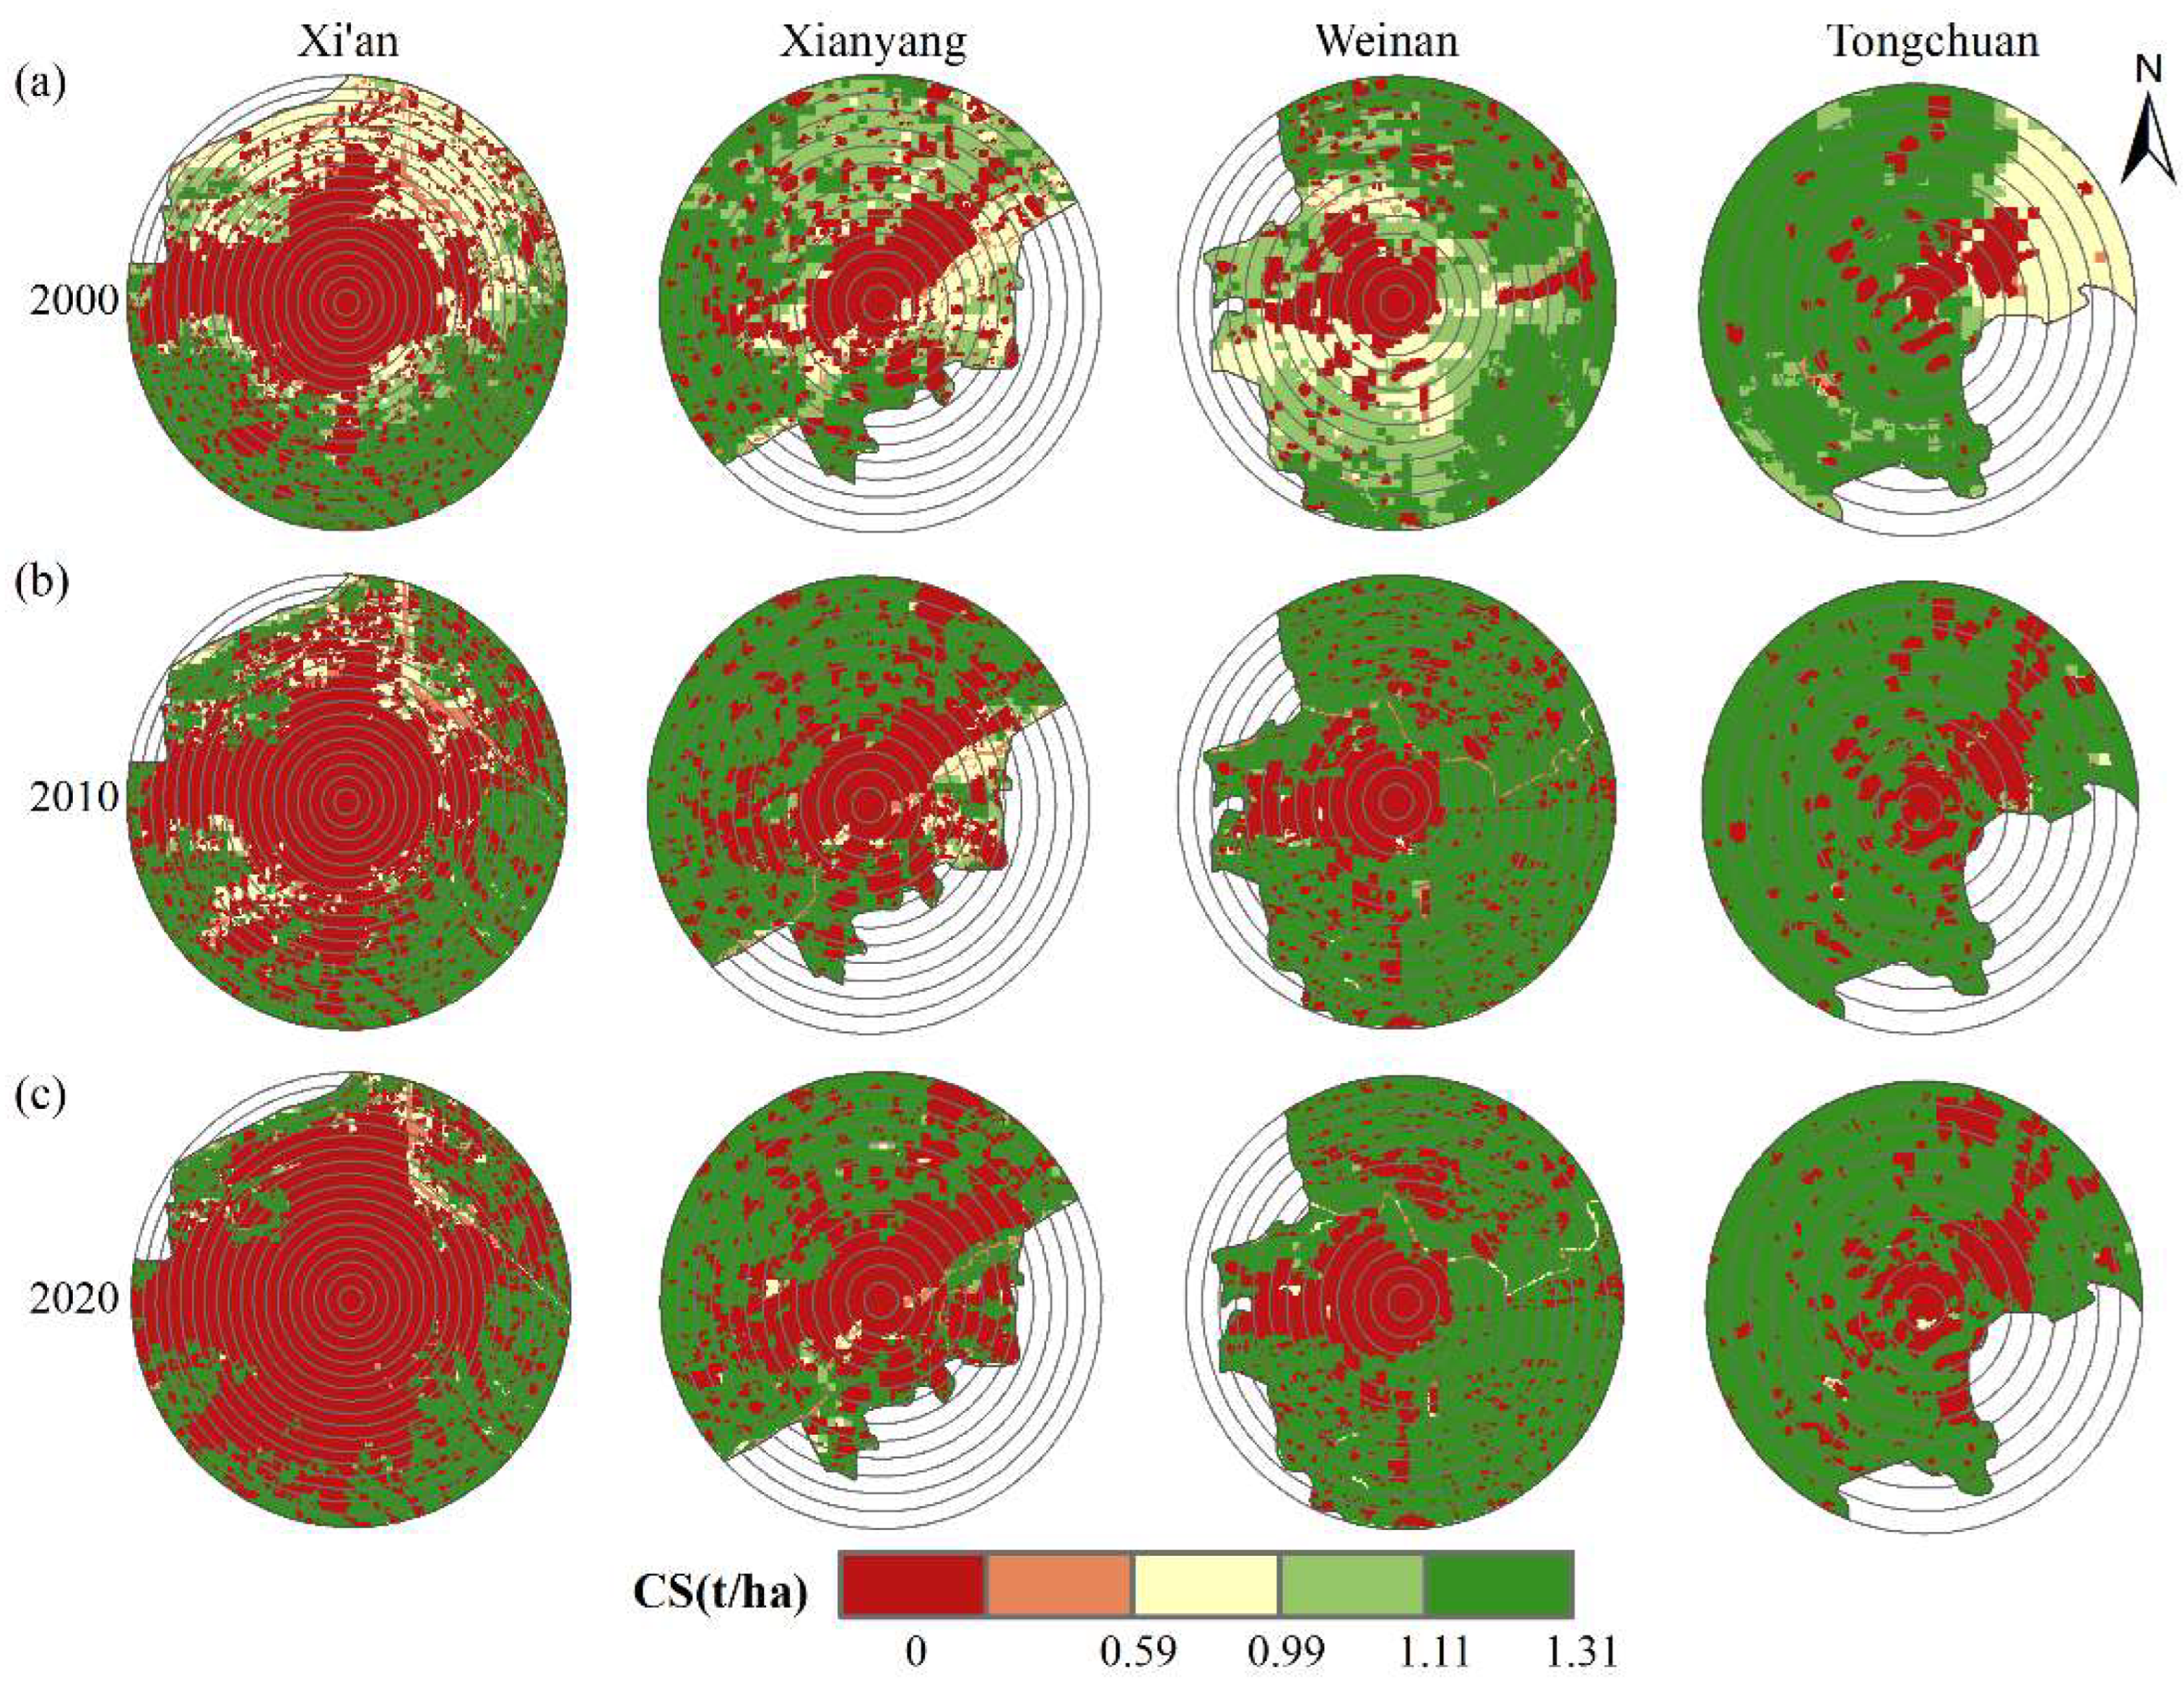
Figure 5.
Spatio-temporal dynamic maps of carbon sequestration (CS) in (a) 2000, (b) 2010, and (c) 2020 in the XMA (unit: t/ha).
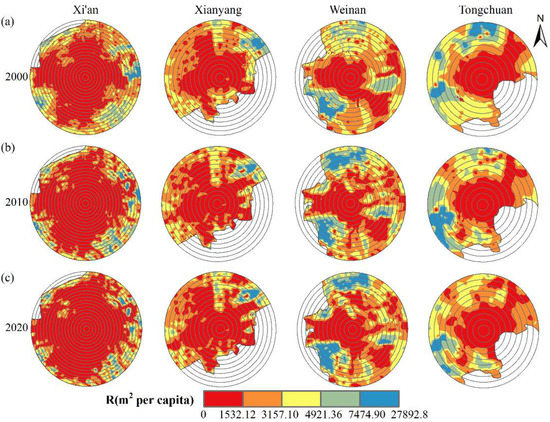
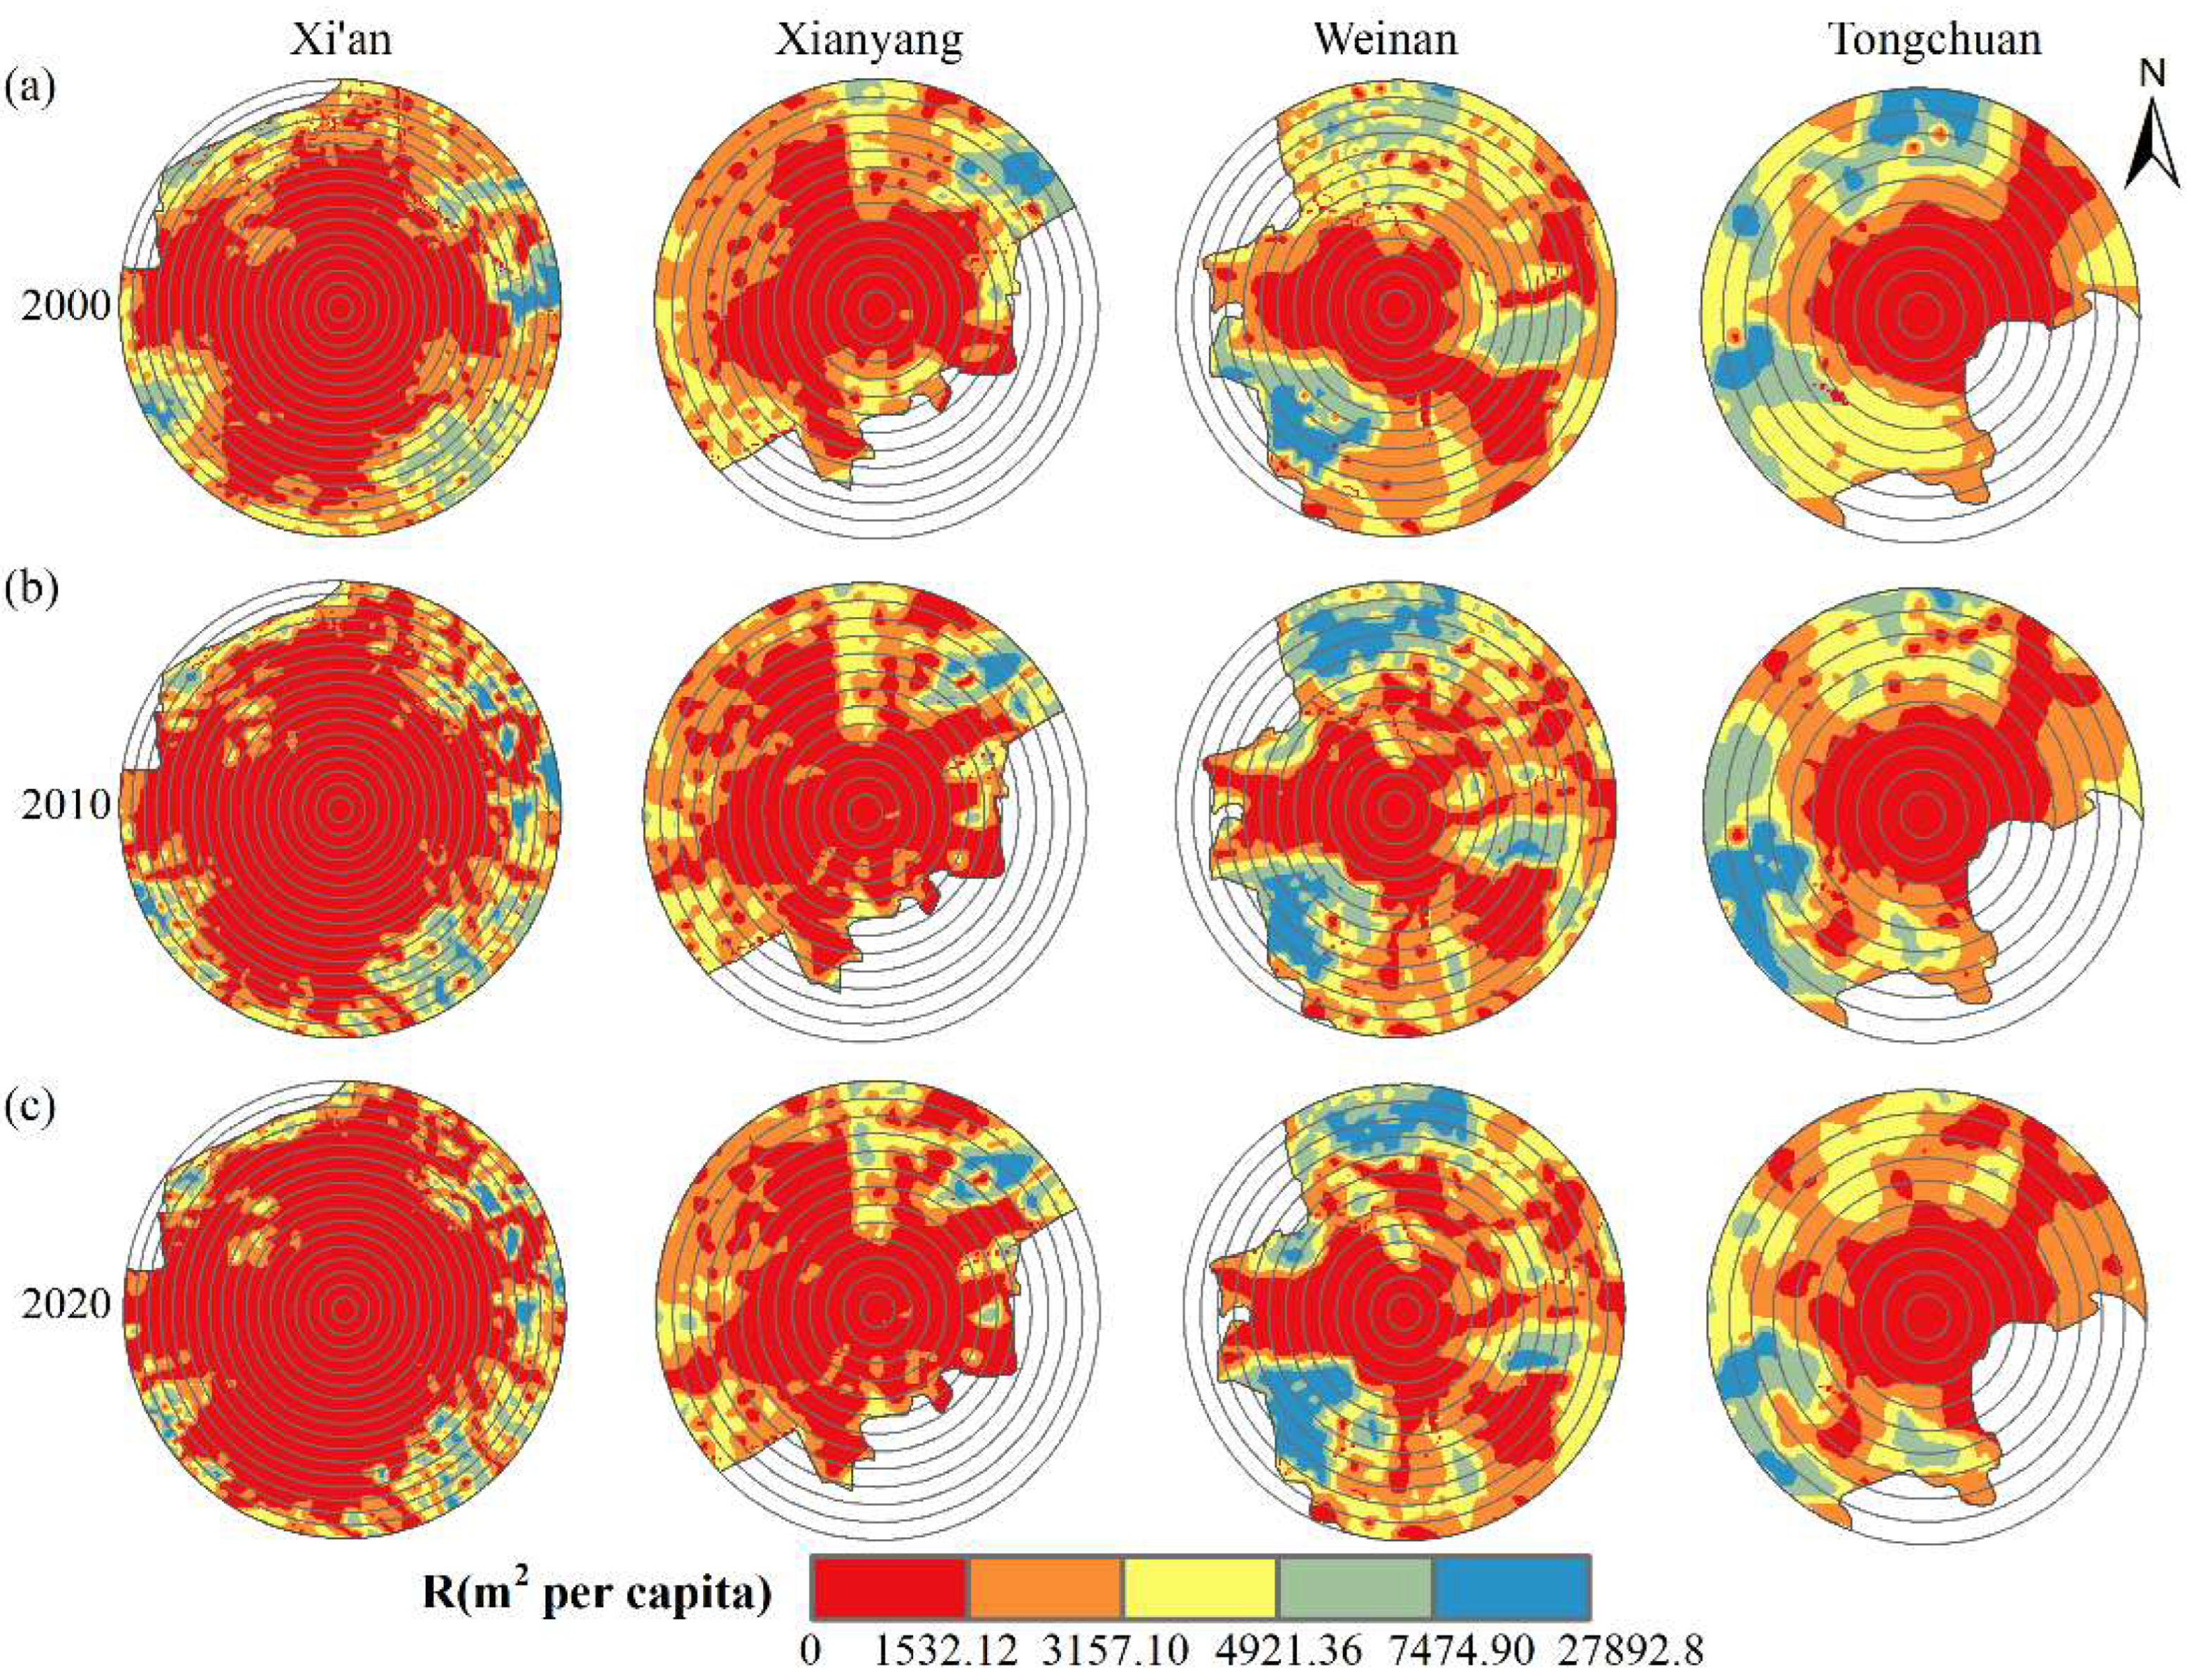
Figure 6.
Spatio-temporal dynamic maps of recreation (R) in (a) 2000, (b) 2010, and (c) 2020 in the XMA (unit: m2 per person).
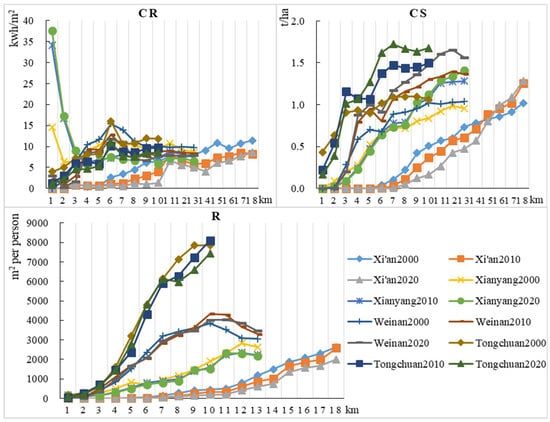
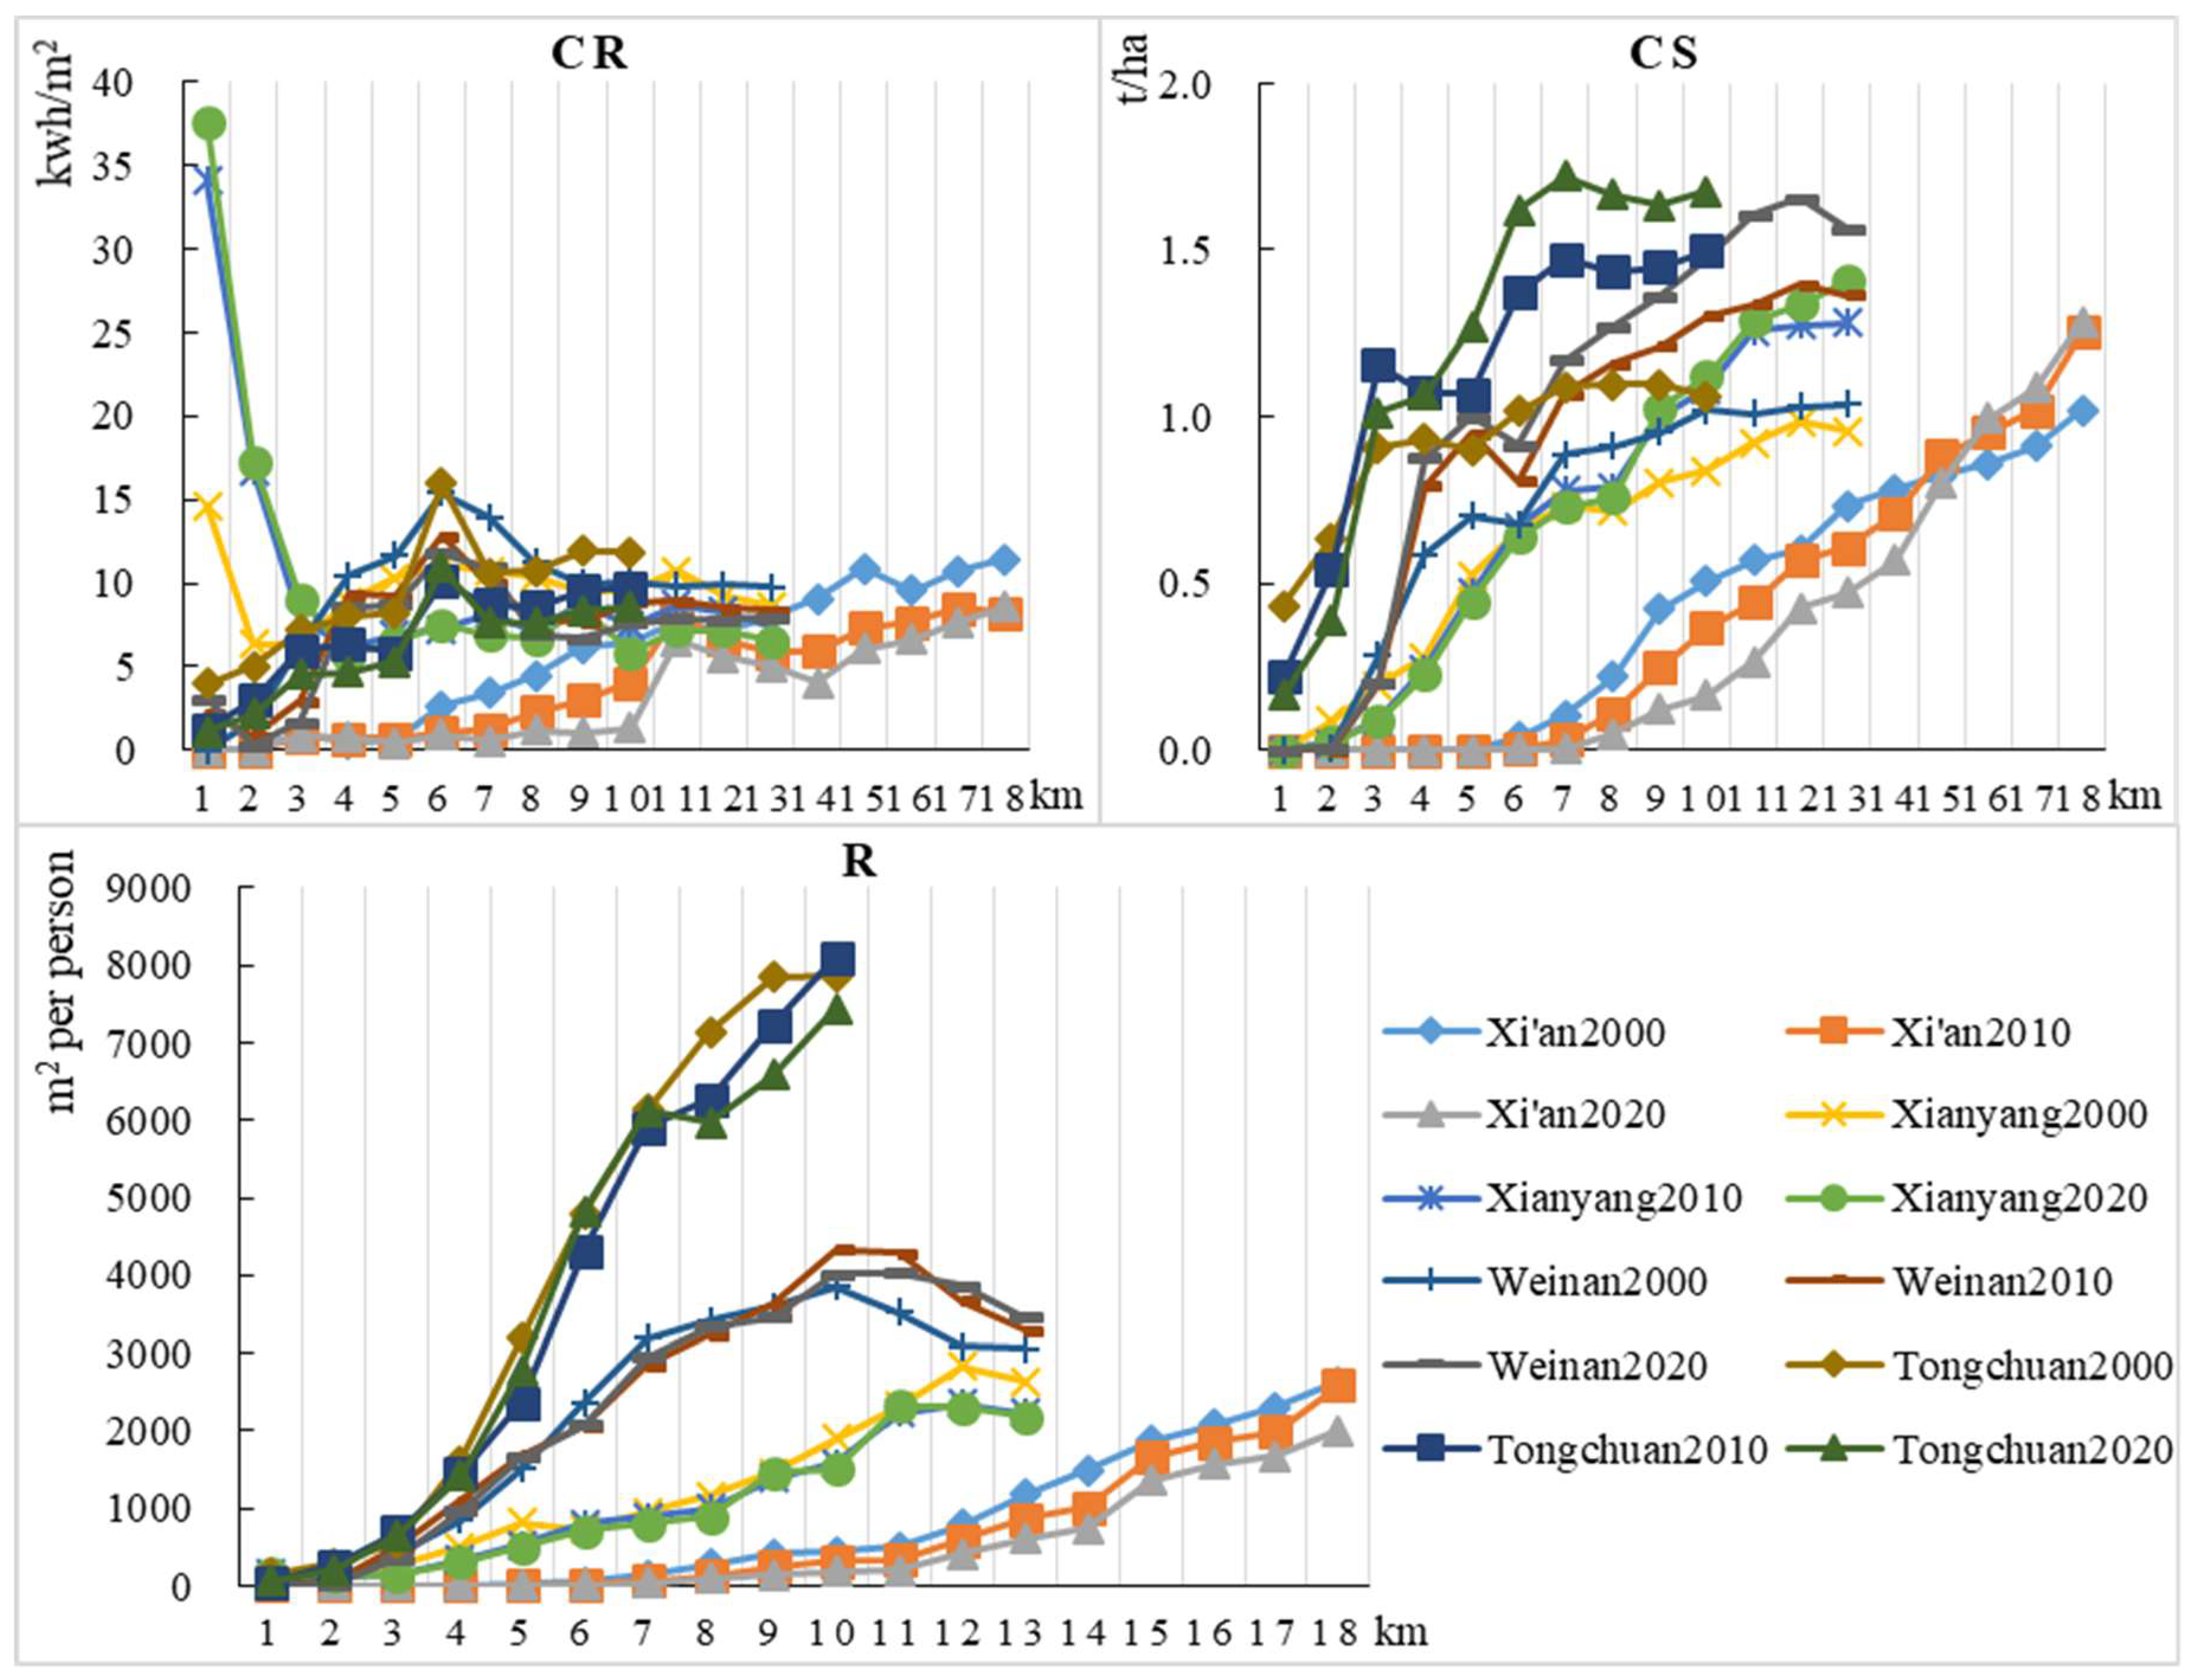
Figure 7.
Rural–urban gradient changes in climate regulation (CR), carbon sequestration (CS), and recreation (R) in the XMA in 2000, 2010, and 2020. Each point represents the average value of ecosystem services within a concentric circle.
For the megacity, the most significant decline in total CR appeared in Xi’an (−40.09%) from 2000 to 2020. CS decreased only in Xi’an from 2000 to 2020 (−23,889.44 t/ha), clustering in the northern part. The ES average of Xi’an was always the lowest in the same concentric circles, and the zero-value areas of ESs in Xi’an were the largest. As for medium-sized cities, total recreation exhibited a first-rise-then-fall trend only in Weinan. The significant reduction in average CR in Xianyang in the second concentric circle in 2000 and 2020 was up to 17.33 and 20.34, respectively. For the small-sized city, total CS had a sharp increase in Tongchuan from 2000 to 2020 (+112.89%). Its CR simultaneously peaked in the sixth concentric circle in 2000, 2010, and 2020. Recreation in Tongchuan experienced dramatic changes. Additionally, the average ES stabilized in the 17th–18th concentric circles in the megacity, the 11th–13th in medium-sized cities, and the 8th–10th in the small-sized city. In conclusion, as the city spatially expanded, in each concentric circle, the values of the three ES averages in the megacity were generally the lowest, and the values of the CS and recreation averages in the medium-sized cities were also lower than those of the small-sized city from 2000 to 2020.
3.3. Spatio-Temporal Patterns of Equity of Ecosystem Services Provided by Urban Green Spaces
3.3.1. Spatio-Temporal Pattern Evolution of Location Entropy
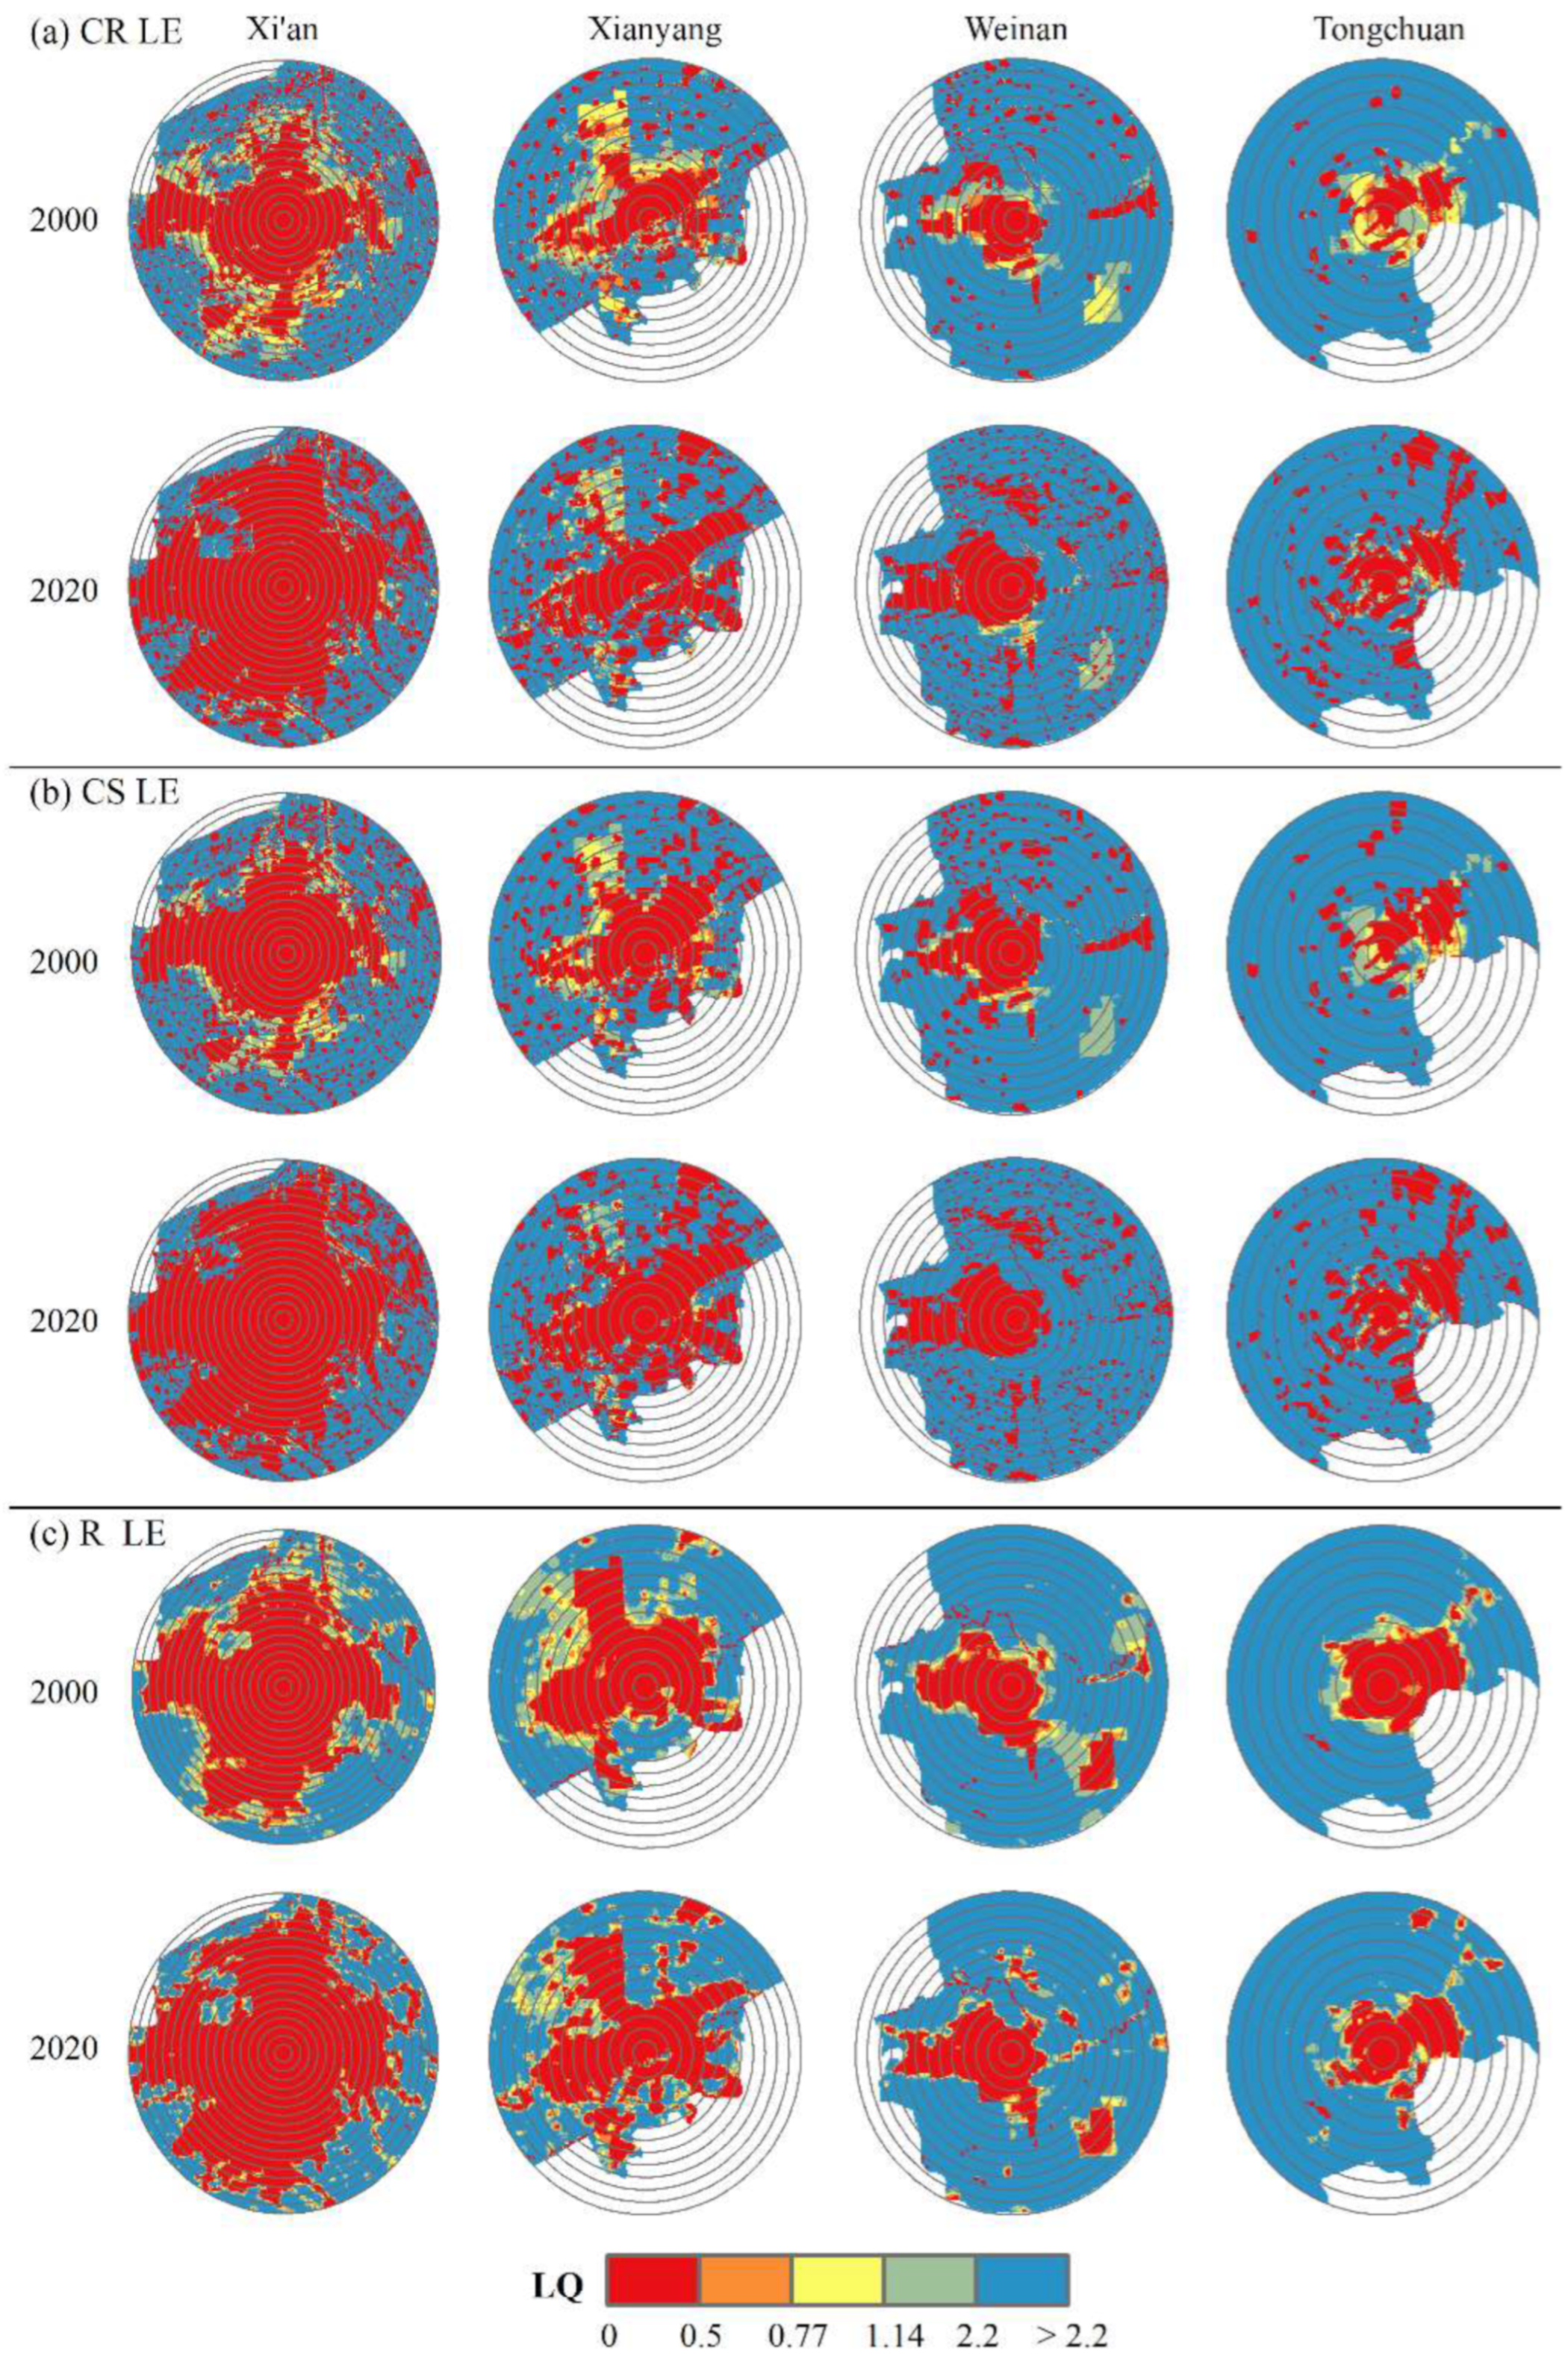
The location entropy of each ES exhibited significant spatio-temporal heterogeneity in differently sized cities (Figure 8). Variations in CR location entropy were much more striking than those of CS and recreation. With urban expansion, areas with extremely low ES location entropy (Below 0.5) generally increased in 2020. The megacity had the largest areas with extremely low ES location entropy, followed by the medium-sized cities and the small-sized city. Moreover, the average ES location entropy showed a general upward trend along the gradients (Figure 9).
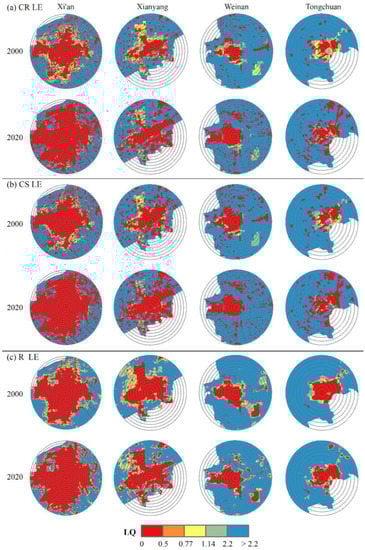
Figure 8.
The location entropy (LE) patterns of climate regulation (CR) (a), carbon sequestration (CS) (b), and recreation (R) (c) in 2000 and 2020 in the XMA.
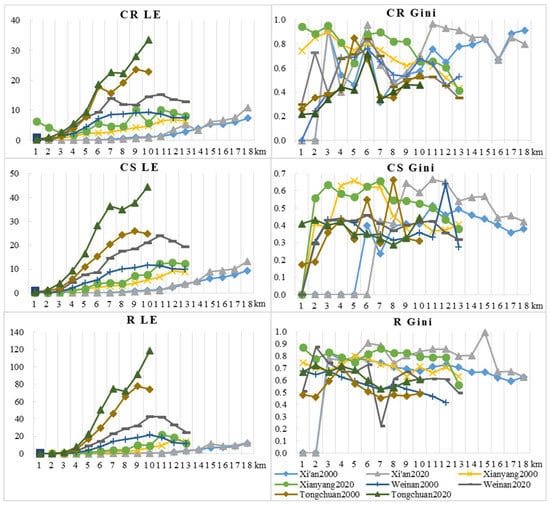
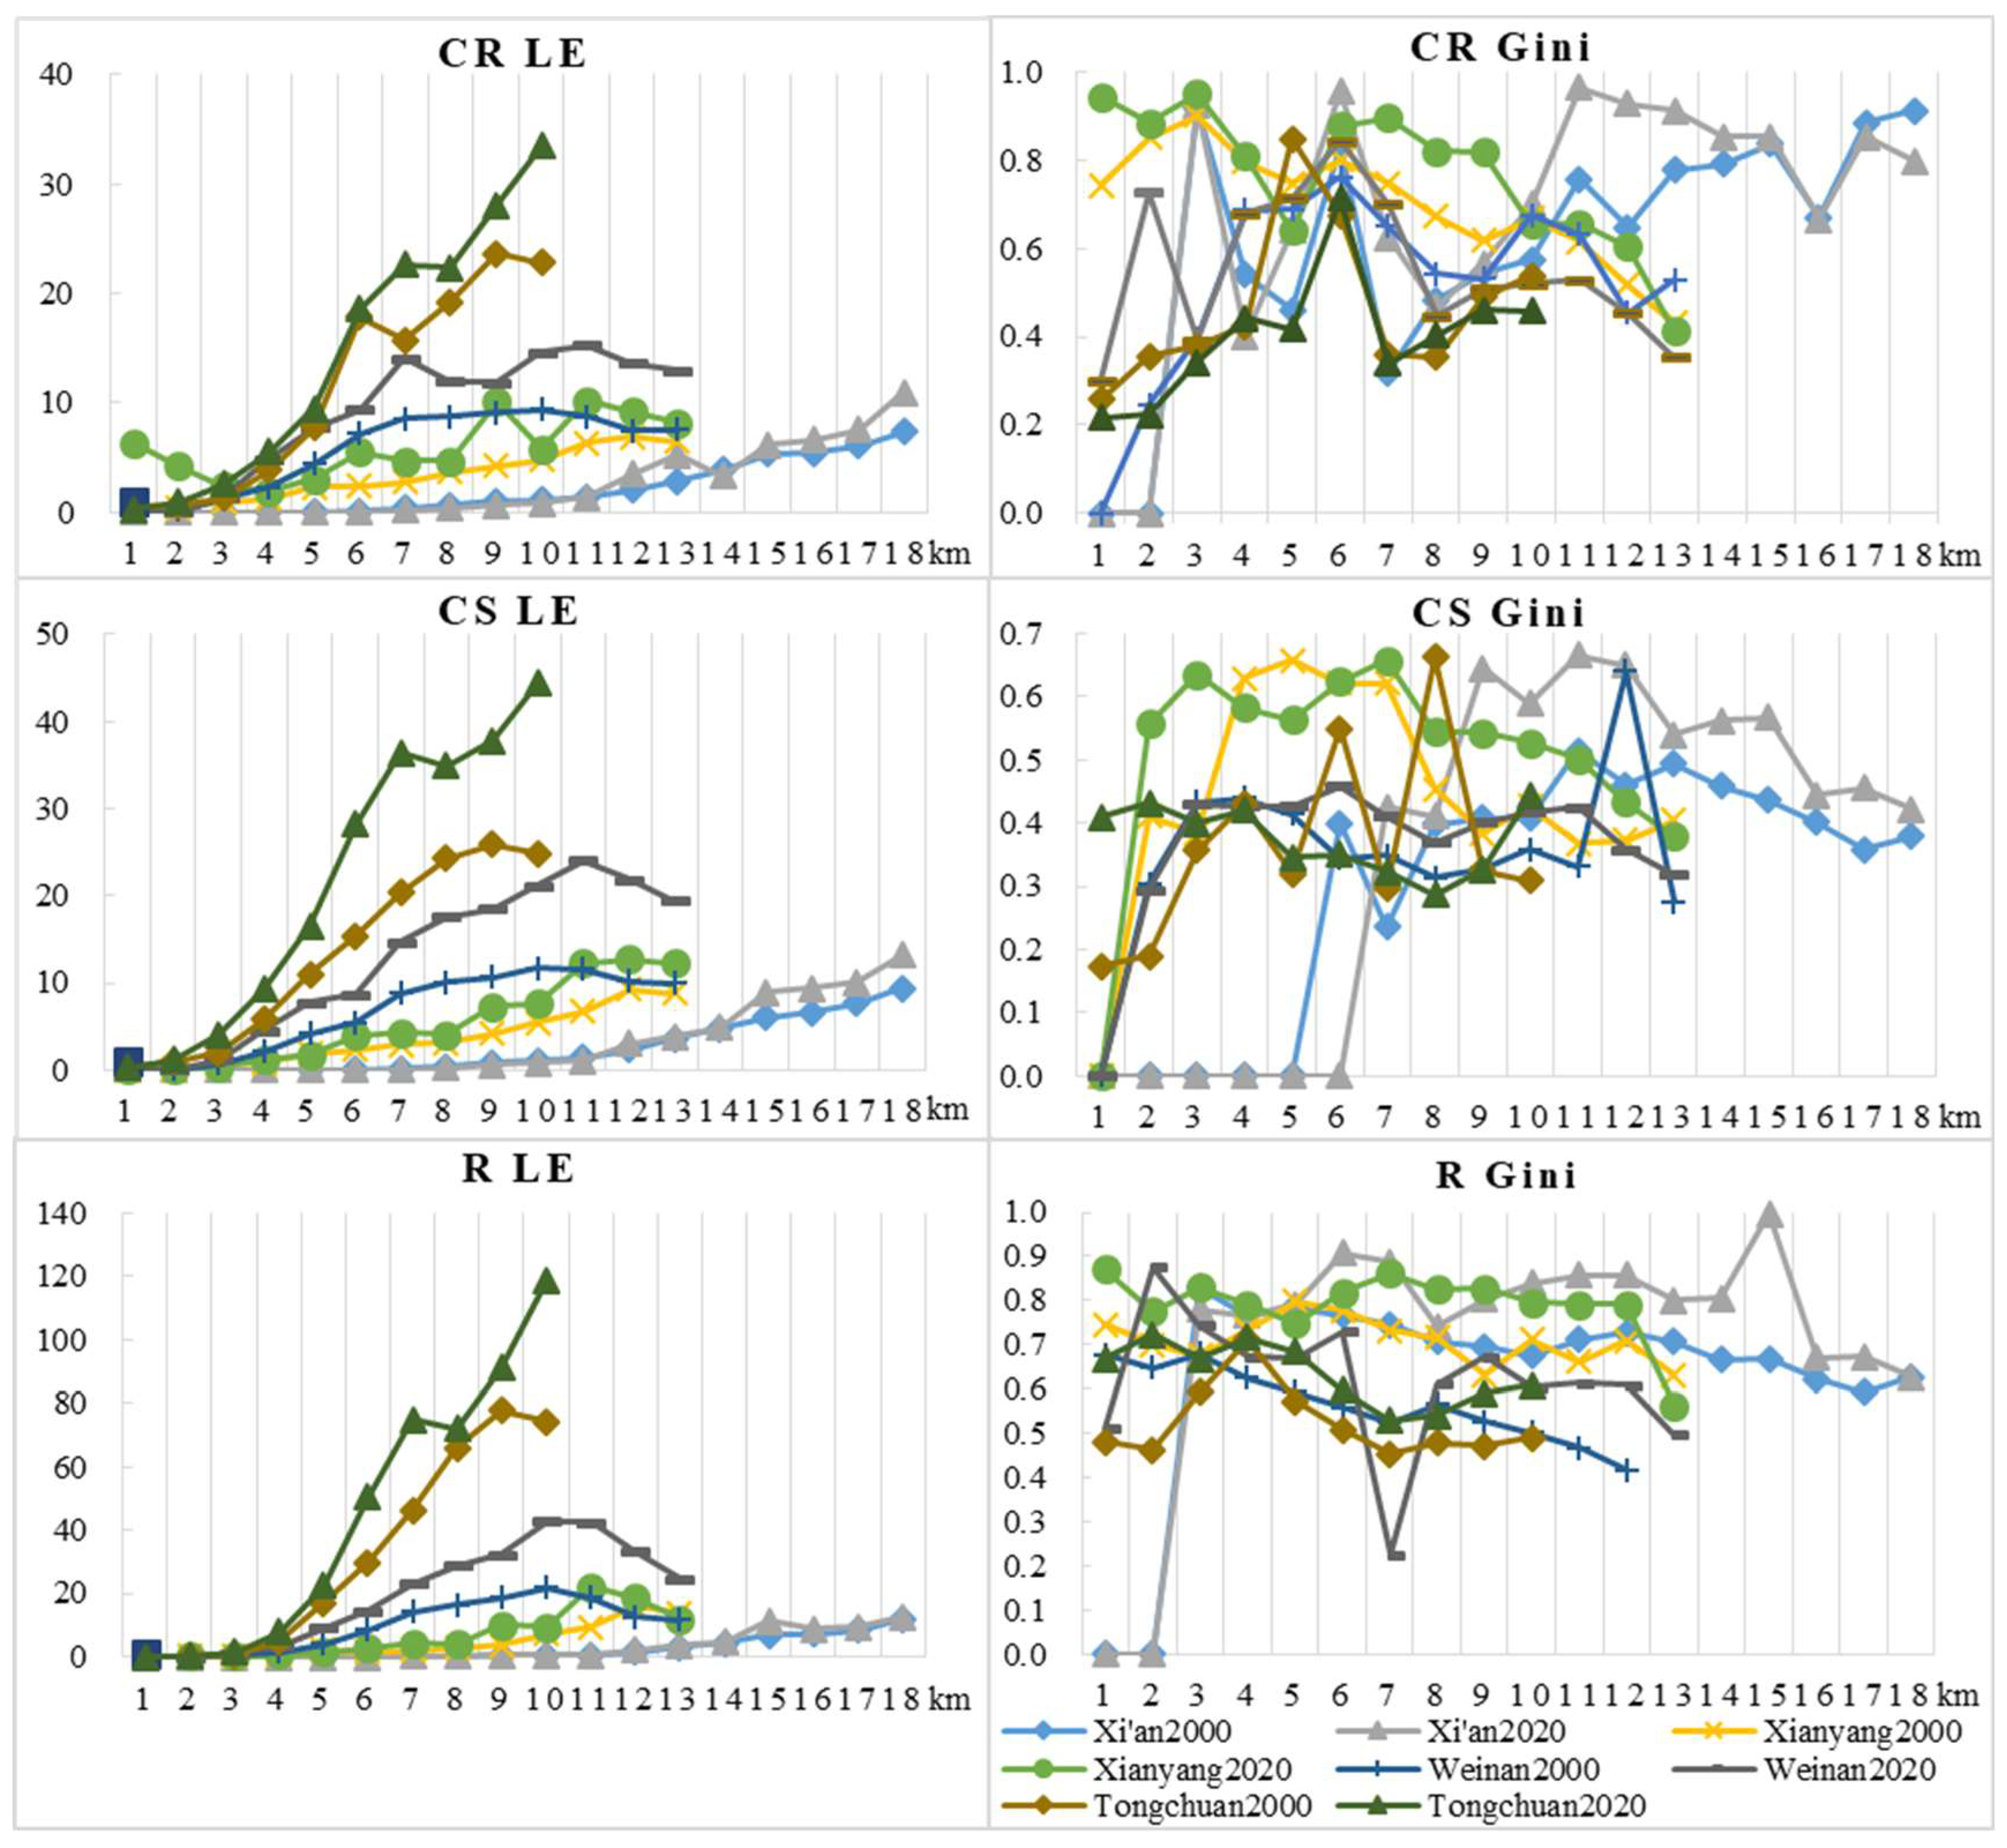
Figure 9.
The spatial variation in the location entropy of climate regulation (CR LE), carbon sequestration (CS LE), and recreation (R LE) in differently sized cities in 2000 and 2020 along urban–rural gradients in the XMA; the spatial variation in Gini coefficient of climate regulation (CR Gini), carbon sequestration (CS Gini), and recreation (R Gini) in differently sized cities in 2000 and 2020 along urban–rural gradients in the XMA.
The ES location entropy of most areas of Xi’an was at an extremely low level from 2000 to 2020. The areas with extremely low CR location entropy occupied 67.01% in 2020, which demonstrated the extremely low equity of ESs provided by UGSs in Xi’an, especially CR and recreation. For medium-sized cities, the areas at an extremely low level of ES location entropy in Xianyang were significantly larger than those of Weinan in the same period. For instance, in 2020, areas at an extremely low level of CS location entropy in Xianyang occupied 47.08%, while those in Weinan occupied 25.35%. For the small-sized city, the location entropy of CS and recreation were generally at an extremely high level (Larger than 2.2) and showed no significant change in most areas of Tongchuan. Additionally, the ranges of the average ES location entropy at an extremely low level in 2020 were: the first–seventh concentric circles in Xian; the first–second concentric circles in Xianyang and Weinan; and the first concentric circle in Tongchuan. Overall, the inequity of ESs provided by UGSs was exacerbated from 2000 to 2020. ES equity was the worst in general in the megacity, followed by the medium-sized cities and the small-sized city.
3.3.2. Spatio-Temporal Pattern Evolution of Gini Coefficient
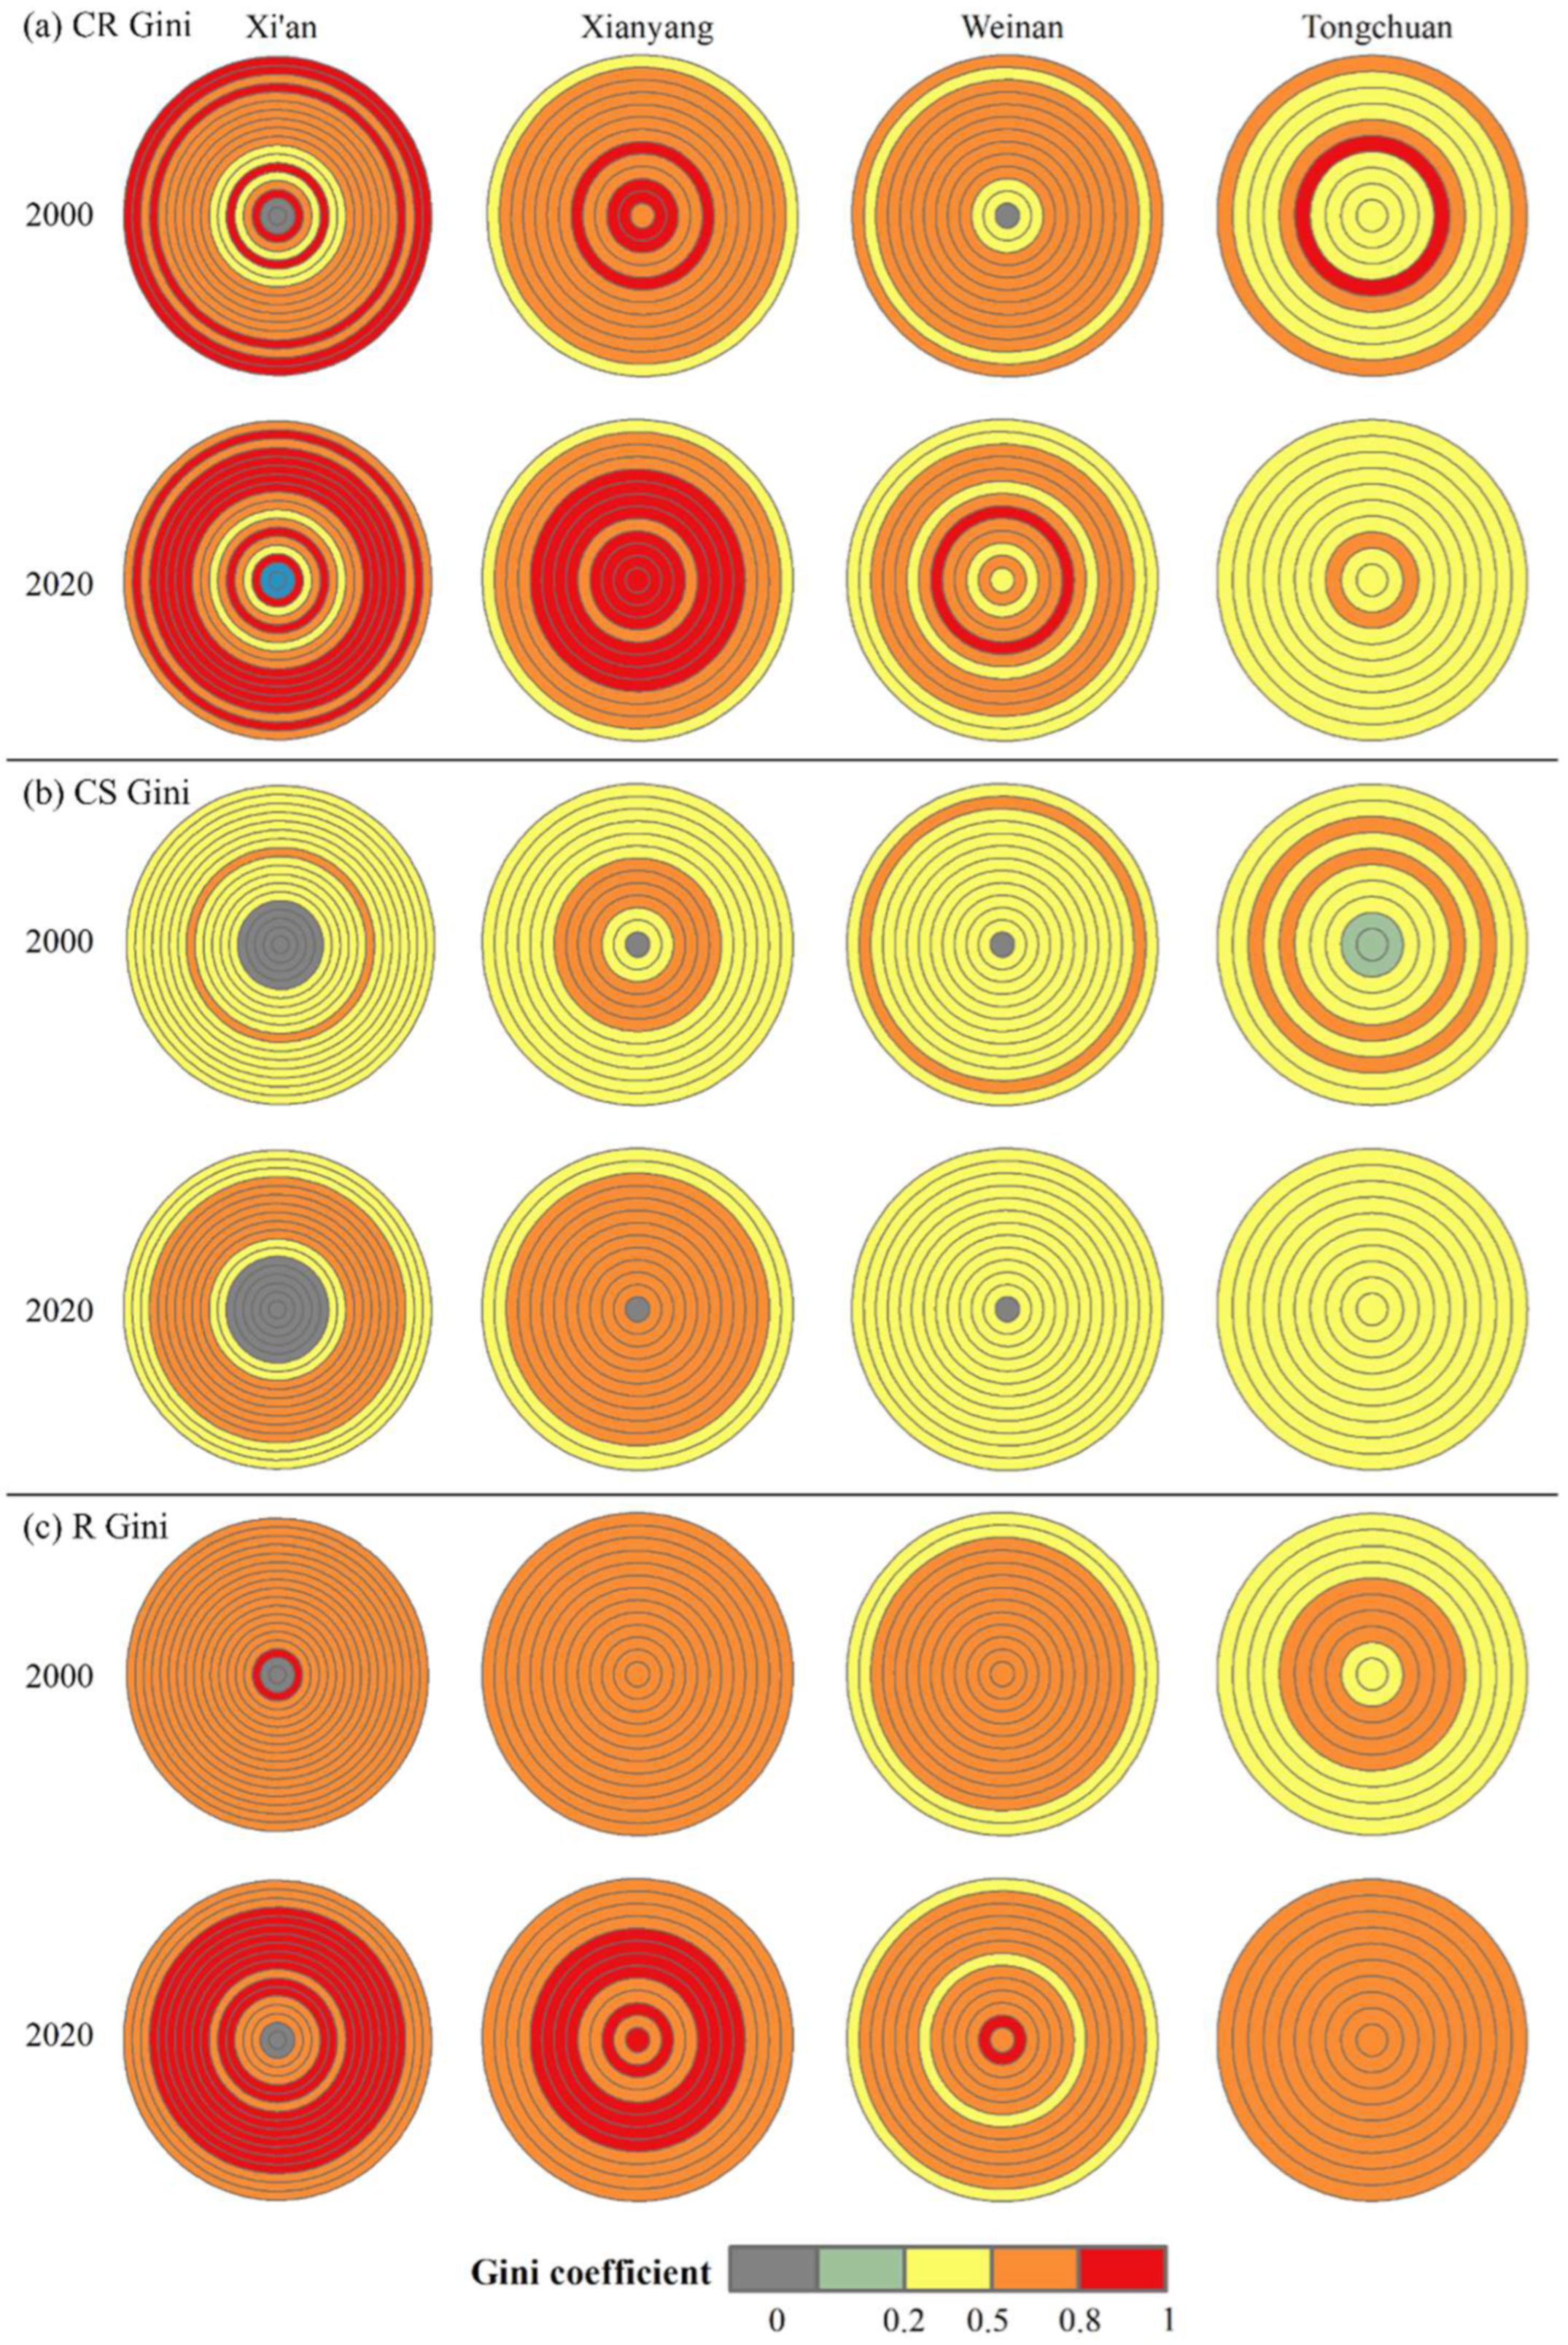
CS has the best equity of all cities, with the Gini coefficients fluctuating between 0.17 and 0.67 (Except for zero-value areas of the Gini coefficient) from 2000 to 2020 (Figure 10). In contrast, the CR Gini values span a wide range, fluctuating from 0.32 to 0.96 in the megacity, 0.25 to 0.95 in the medium-sized cities, and 0.22 to 0.85 in the small-sized city. The ES Gini values generally increased in the same concentric circle of each city from 2000 to 2020, depicting that equity became worse in 2020 (Figure 9). Overall, the megacity had the worst equity, and the small-sized city, had the best ES equity. For the megacity, the zero-value area of the ES Gini coefficient in Xi’an was the largest from 2000 to 2020. For the medium-sized cities, the inequity in Xianyang was more striking than in Weinan and Tongchuan. The ES Gini values of Xianyang in each concentric circle were generally larger than those for Weinan and Tongchuan. The recreation Gini values of Xianyang were from 0.63 to 0.80 (relatively “large gaps”) in 2000, while those of Weinan were from 0.41 to 0.68 (ranging from “relative average” to “relatively large gaps”), and those of Tongchuan were from 0.45 to 0.71 (ranging from “relative average” to “relatively large gaps”). In particular, CR equity in the third–fifth and CS equity in the seventh–eighth concentric circles in Xianyang were even worse than Xi’an in 2020. For the small-sized cities, most of the ES Gini values of Tongchuan were the lowest in the same concentric circles and less varied along the urban–rural gradients. Its recreation equity was the worst compared to the other ESs. Additionally, the average Gini values for recreation in Tongchuan were 0.14 larger than those for CR and 0.21 larger than those for CS.
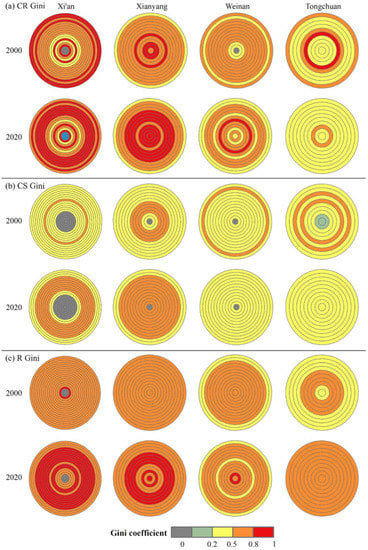
Figure 10.
The spatial patterns of Gini coefficients of (a) climate regulation (CR), (b) carbon sequestration (CS), and (c) recreation (R) in 2000 and 2020 along urban–rural gradients in the XMA.
4. Discussion
4.1. Drivers Influencing the Spatio-Temporal Pattern of ESs Provided by UGSs
UGSs are the physical carrier of ESs, influencing ESs’ supply, processes, and functions, and ESs are inextricably linked with UGSs [41,64]. Urban spatial expansion incurs land-use structure changes and decay and the fragmentation of UGSs, which are the leading factors causing urban ES degradation [65,66]. The findings showed that artificial surface significantly increased at the cost of encroaching on UGSs, especially cropland and grassland in the XMA, from 2000 to 2020. Different urban expansion degrees correspond to different urban scales, directly resulting in ES pattern distinction in differently sized cities in the XMA [65]. As the most urbanized megacity in the XMA, the artificial surface encroachment was very dramatic in Xi’an, leading to ES supply shortages in most regions from 2000 to 2020, which was consistent with the previous studies in Xi’an [59,67]. According to the CR model results, water bodies and wetlands provided the highest value of CR in Xi’an. The decrease in water bodies and wetlands contributed significantly to the decrease in total CR from 2010 to 2020. Studies have also demonstrated that the encroachment of artificial surface on water bodies, cropland, and forest has led to a decline in the CR value of Xi’an [68]. Additionally, climate change also has an impact on the CR provided by UGSs. For instance, CR improved in the river region in northeastern Xi’an from 2010 to 2020, not because of land-use change but of a small increase in water surface evaporation. In addition, the project aiming to return cropland to forest and grassland, started in 1999 in the XMA, which mitigates the serious soil erosion problem and brings many benefits to ES maintenance. The CS capacity of shrubland, forests and grassland is relatively higher; hence, the project contributed to a striking increase in total CS in the XMA during 2000–2020. However, the total CS of all the other cities were promoted, except Xi’an. The total CS decline in Xi’an was primarily due to the artificial surface encroachment of enormous cropland, which was the dominant part of the UGS structure in Xi’an from 2000 to 2020.
Meanwhile, these factors also matter for ES pattern changes in other cities. For the medium-sized cities, the urbanization in Xianyang has accelerated in recent years since the Xi’an and Xianyang Integration policy was proposed in 2002 [69]. The rapid expansion of artificial surface caused ES degradation in Xianyang, resulting in greater gradient differences in ESs in Xianyang than in Weinan, except the Weihe River basin, which had richer CR. For the less urbanized city in the XMA, Tongchuan had high-level ES provision, as the major land-use types in Tongchuan were cropland, forest, and grassland, which provide abundant ES. Significant spatial pattern changes in recreation in Tongchuan were due to the artificial surface expansion and the prominent reduction in grassland and cropland in central and southern areas from 2000 to 2020.
4.2. Factors Influencing the Spatio-Temporal Pattern of ES Equity within UGSs
The equity of ESs provided by UGSs is closely related to the total ES amount, while ESs per capita is not a good proxy for ES equity [18]. Like ES patterns, the land-use structure disparities within UGSs cause discrepant ES equity patterns in differently sized cities. Additionally, the urbanization factors of population growth and UGS decline, along with the spatial matching between ESs and the population, are more important drivers [63]. Take the megacity as an example; with cropland domination, the UGS structure in Xi’an was relatively homogeneous. Cropland provides relatively high CS but low CR and recreation. Therefore, even in suburban areas, the ES equity of Xi’an was not significantly higher. By contrast, a mass of scattered water bodies and wetlands, grassland, and forest in the southern part contributes greatly to the high ES equity of Weinan. Tongchuan was richer in UGSs, with cropland in the central city, and large, even grassland, as well as small portions of forest and wetlands, distributed as extending concentric circles, which led to the highest ES equity in the XMA.
Rapid urbanization has reshaped the environment worldwide beyond our imagination over the past few decades, which poses the threat of increasing environmental inequalities, including UGS provision and exposure [19]. As the leading driver of ES inequity within UGSs, the urbanization process with the growth and agglomeration of people triggers UGS fragmentation and ES decline and exacerbates spatial mismatching between ESs and population in the XMA. As the highest urbanized city of the XMA, Xi’an’s population density in 2020 was 2.46, 5.06, and 7.11 times that of Xianyang, Weinan, and Tongchuan, respectively, within the concentric circles. The worst ES equity implied by the location entropy and Gini coefficient of Xi’an in most areas was closely related to its very low ES provision and its highest population density. In addition, the location entropy rose rapidly while the Gini values had no significant decrease at the 12th–18th concentric circles in Xi’an; this suggests that the high mismatching between the population and ESs results in ES inequity in the suburban areas, which was also demonstrated in the previous study [59]. The mismatching degree may be attributed to the local UGS construction lag by economic activities’ agglomeration effects and urban spatial layout differences [70]. This also occurred in other cities with a lower population density. The population density of Xianyang is 2.06 times more densely populated than Weinan. The main urban area of Xianyang is developed along the Weihe River, which contributed to the highest CR in the XMA in the first to the third concentric circles in each study period. Within this range, Xianyang had high CR location entropy, but its equity, characterized by the Gini coefficient, was not significantly higher than that of Weinan. This is because residents adjacent to the Weihe River basin naturally enjoy a high CR supply, while residents away from the Weihe River basin in the same concentric circle receive a low CR supply. In contrast, relatively slow urban development and more dispersed built-up areas in Weinan resulted in higher ES equity of most areas.
4.3. Implications and Prospects
4.3.1. Implications for Greening Planning and Management Policies
People tend to rely on the ESs provided by UGSs to perceive, evaluate, and access UGSs, but the ESs that humans enjoy among different UGS types vary greatly [71,72]. This study confirms that it is more scientific to assess the equity of UGSs in terms of the different ESs they provide [34]. The findings in this study inform future greening planning and ES management in urban development. More attention should be paid to the disparities in ESs and their equity patterns within UGSs in differently sized cities in future UGS planning. More targeted policies and optimization measures for the management of ESs provided by UGSs are now needed in differently sized cities [65,73].
The effective spatial integration of UGSs into any available space in cities can be achieved by maximizing human well-being resulting from UGSs. On the one hand, the development of compact urban forms and more efficient land use should be encouraged [74,75]. On the other hand, it is feasible to increase greenery through structures such as green roofs, green belts, and rain gardens within cities [35], especially in Xi’an. Setting up an ’ecological red line’ is also viable for UGSs severely affected by urbanization, specifically for reinforcing regulating services [76,77,78]. The changing pattern of ES equity in the same city also illustrates the importance of UGS structure diversity for ES equity. Different vegetation arrangements and the spatial distribution of UGSs contribute to various UGS landscapes [79]. The abundance of UGS vegetation largely determines the richness of the ESs that UGSs provide. More attention should be paid to the medium-sized cities and the small-sized city in terms of the configuration and the vegetation shape of UGSs. Micro-climate-regulating benefits have targeted urban cool-space design, as well as the benefits of some more specific aspects of biodiversity and human health. Moreover, the spatial matching of the ES supply and dwellers’ demands for ESs provided by UGSs are at the core of promoting UGS equity in medium-sized cities. In particular, the ‘siloed’ UGS of the Weihe River basin in Xianyang [80,81] indicates that decision-makers in urban greening planning should focus on the actual life circle of residents [82]. Beneficiaries’ demands for ecological benefits should be targeted in combination with the level of ESs provided by UGSs, to precisely optimize the planning and management of UGSs.
In addition, each city also has unique characteristics which should be considered, such as different urban forms, policy distinctions, etc. Socioeconomic factors also influence the benefits people obtain from ESs within UGSs, including people’s access to ESs and their ability to maintain and manage ESs [83]. For instance, the income gap between the rich and the poor is huge, especially in the megacity, which leads to more environmental disparities and inequality in the ES distribution of their neighborhoods [84,85]. Greening construction space is limited in poor areas with dense populations and buildings in Xi’an, where there is a weak ability to resist ES losses. In high-density urban areas, some UGS types, including street plantations, green roofs and walls, small lawns, and pocket parks, play an important role in providing ESs to residents. This type of resource allocation and utilization is a feasible way to provide ESs for the poorer community in the megacity [19]. Additionally, apart from improving the type of UGS, an appropriate configuration of UGSs, such as optimizing the shape of green spaces and augmenting the tree canopy coverage and leaf area, are realistic measures to implement in densely populated and spatially confined poorer areas [79,84]. Overall, UGS planning needs to be oriented by the spatial distribution of the population, and take into account differences in urban scale and intra-urban characteristics, thus improving the equity of ESs provided by UGSs. These large-scale UGS assessment findings provide evidence and insights for governments and involved institutes to better understand the difference between physical greenspace coverage and realistic ES equity within UGSs. The study will also help policymakers and planners to implement sustainable and effective greening programs adjusted to cities at different scales in the metropolitan areas.
4.3.2. Insights for the Future Study
Much work needs to be conducted for enhanced deep exploration in future research. Though blocked by cumulative values in the Gini coefficient formula, future studies need to conquer these difficulties to achieve a raster scale to better support decision making. In addition, ES qualifications need further refinement. Moreover, it is difficult for the recreation model to withstand the operation of 30 m × 30 m grid data or more refined high-resolution data in large-scale areas. Additionally, the effects of socioeconomic, biophysical, and historical legacy factors on ES equity patterns can be explored in the near future to reveal ES equity pattern variation mechanisms. Meanwhile, field survey data in community, park, and plaza green spaces should be combined to precisely understand the residents’ demands for ESs and enhance ES equity within UGSs from point to surface scales in future explorations. With finer-scale data, the methods and framework presented in the study can be used for intra-city assessments, which will provide more explicit evidence and pathways for urban planning strategies. Though many inadequacies need to be improved, the exploration of temporal pattern evolutions in ES equity within UGSs in this study makes contributions to assessing the level of UGS construction in the XMA in the last 20 years, which has rarely been considered in previous studies [1,19]. In addition, the Gini coefficient is innovatively spatially mapped at a more refined ring buffer scale, which provides a new perspective for ES equity in large-scale regions. Moreover, the gradient analysis constitutes a basis for the mechanisms of spatial ES equity differences between urban and rural areas in cities of different sizes.
5. Conclusions
This research proposed an integrated framework for evaluating the spatio-temporal evolution of ESs provided by UGSs and their equity patterns. The divergent patterns of ES equity across differently sized cities along the urban–rural gradients were also explored. The results showed that land-use changes had significant effects on the spatio-temporal patterns of ESs and their equity within UGSs. Large spatio-temporal heterogeneity in ES supply existed in the cities of the XMA. The average ES generally increased along the urban–rural gradients and showed a hierarchical pattern among differently sized cities from 2000 to 2020. As urban space expanded, in each concentric circle, the values of three ES averages in the megacity were generally the lowest, and the CS and recreation averages were also lower in the medium-sized cities than in the small-sized city from 2000 to 2020. In addition, the inequity of ESs provided by UGSs was exacerbated from 2000 to 2020. The megacity, Xi’an, had the worst equity, and the small-sized city, Tongchuan, had the best equity in general. For one, with cities’ spatial expansion, areas with extremely low ES location entropy (below 0.5) generally increased in 2020. The megacity had the largest areas with extremely low-level ES location entropy, followed by the medium-sized cities and the small-sized city. Location entropy variations in CR were much more striking than in CS and recreation. Moreover, the ES Gini values generally increased in the same concentric circle of each city from 2000 to 2020, which demonstrated that equity became worse in 2020. Additionally, it proved that the equity of CS characterized by Gini was the best. In this setting, ES equity could be enhanced by improving UGS structure diversity, promoting spatial matching between the ES supply of UGSs and dwellers’ demands for ecological benefits, and integrating UGSs into any available space in future UGS planning. This study furnished a detailed understanding of the past–present evolution and spatial equity of ESs provided by UGSs, which could offer insights for equitable ES resource allocation and optimized urban greening planning. It also provides a reference for targeted ES management and UGS planning for multi-scale cities in other metropolitan areas. Moreover, field survey data from community, park, and plaza green spaces need to be combined to precisely improve ES equity within UGSs from point to surface in future explorations.
Author Contributions
Conceptualization, L.P. and L.Z.; methodology, L.P. and L.Z.; visualization, L.P. and Z.W.; formal analysis, L.P.; writing—original draft, L.P.; Writing—review and editing, L.Z., X.L., P.W., Z.W., L.J. and H.W.; supervision, W.Z.; funding acquisition, L.Z., L.J. and H.W. All authors have read and agreed to the published version of the manuscript.
Funding
This research was supported by the National Natural Science Foundation of China (41871187), and the Natural Science Basic Research Plan in Shaanxi Province of China (2020JQ415).
Institutional Review Board Statement
Not applicable.
Informed Consent Statement
Not applicable.
Data Availability Statement
The data that support the findings of this study are available from the first author upon reasonable request.
Conflicts of Interest
The authors declare no conflict of interest.
References
- Cheng, C.; Hu, Y.; Zhao, M. Progress and prospect of the spatiotemporal change and ecosystem services evaluation of urban green space pattern. Prog. Geogr. 2020, 39, 1770–1782. (In Chinese) [Google Scholar] [CrossRef]
- Wu, L.; Kim, S.K. Does socioeconomic development lead to more equal distribution of green space? Evidence from Chinese cities. Sci. Total Environ. 2021, 757, 143780. [Google Scholar] [CrossRef]
- van Oorschot, J.; Sprecher, B.; van’t Zelfde, M.; van Bodegom, P.M.; van Oudenhoven, A.P.E. Assessing urban ecosystem services in support of spatial planning in the Hague, the Netherlands. Landsc. Urban Plan. 2021, 214, 104195. [Google Scholar] [CrossRef]
- Li, F.; Zhang, F.; Li, X.; Wang, P.; Liang, J.; Mei, Y.; Cheng, W.; Qian, Y. Spatiotemporal Patterns of the Use of Urban Green Spaces and External Factors Contributing to Their Use in Central Beijing. Int. J. Environ. Res. Public Health 2017, 14, 237. [Google Scholar] [CrossRef]
- Zhang, J.; Yu, Z.; Cheng, Y.; Sha, X.; Zhang, H. A novel hierarchical framework to evaluate residential exposure to green spaces. Landsc. Ecol. 2021, 37, 895–911. [Google Scholar] [CrossRef]
- Mirici, M.E. The Ecosystem Services and Green Infrastructure: A Systematic Review and the Gap of Economic Valuation. Sustainability 2022, 14, 517. [Google Scholar] [CrossRef]
- Nero, B.F. Urban green space dynamics and socio-environmental inequity: Multi-resolution and spatiotemporal data analysis of Kumasi, Ghana. Int. J. Remote Sens. 2017, 38, 6993–7020. [Google Scholar] [CrossRef]
- Camară, G. Urban Green Spaces: Public Health and Sustainability in the United States. J. Am. Plan. Assoc. 2021, 88, 281–282. [Google Scholar] [CrossRef]
- Zardo, L.; Geneletti, D.; Pérez-Soba, M.; Van Eupen, M. Estimating the cooling capacity of green infrastructures to support urban planning. Ecosyst. Serv. 2017, 26, 225–235. [Google Scholar] [CrossRef]
- De Carvalho, R.M.; Szlafsztein, C.F. Urban vegetation loss and ecosystem services: The influence on climate regulation and noise and air pollution. Environ. Pollut. 2019, 245, 844–852. [Google Scholar] [CrossRef]
- Liu, H.; Remme, R.P.; Hamel, P.; Nong, H.; Ren, H. Supply and demand assessment of urban recreation service and its implication for greenspace planning-A case study on Guangzhou. Landsc. Urban Plan. 2020, 203, 103898. [Google Scholar] [CrossRef]
- Hamel, P.; Guerry, A.D.; Polasky, S.; Han, B.; Douglass, J.A.; Hamann, M.; Janke, B.; Kuiper, J.J.; Levrel, H.; Liu, H.; et al. Mapping the benefits of nature in cities with the InVEST software. NPJ Urban Sustain. 2021, 1, 25. [Google Scholar] [CrossRef]
- Veerkamp, C.J.; Schipper, A.M.; Hedlund, K.; Lazarova, T.; Nordin, A.; Hanson, H.I. A review of studies assessing ecosystem services provided by urban green and blue infrastructure. Ecosyst. Serv. 2021, 52, 101367. [Google Scholar] [CrossRef]
- Peng, L.; Zhang, L.; Li, X.; Wang, Z.; Wang, H.; Jiao, L. Spatial expansion effects on urban ecosystem services supply-demand mismatching in Guanzhong Plain Urban Agglomeration of China. J. Geogr. Sci. 2022, 32, 806–828. [Google Scholar] [CrossRef]
- Muhamad Nor, A.N.; Abdul Aziz, H.; Nawawi, S.A.; Muhammad Jamil, R.; Abas, M.A.; Hambali, K.A.; Yusoff, A.H.; Ibrahim, N.; Rafaai, N.H.; Corstanje, R.; et al. Evolution of Green Space under Rapid Urban Expansion in Southeast Asian Cities. Sustainability 2021, 13, 12024. [Google Scholar] [CrossRef]
- Lusseau, D.; Mancini, F. Income-based variation in Sustainable Development Goal interaction networks. Nat. Sustain. 2019, 2, 242–247. [Google Scholar] [CrossRef]
- Andersson, E.; Langemeyer, J.; Borgstrom, S.; McPhearson, T.; Haase, D.; Kronenberg, J.; Barton, D.N.; Davis, M.; Naumann, S.; Roschel, L.; et al. Enabling Green and Blue Infrastructure to Improve Contributions to Human Well-Being and Equity in Urban Systems. Bioscience 2019, 69, 566–574. [Google Scholar] [CrossRef]
- Chen, Y.; Ge, Y.; Yang, G.; Wu, Z.; Du, Y.; Mao, F.; Liu, S.; Xu, R.; Qu, Z.; Xu, B.; et al. Inequalities of urban green space area and ecosystem services along urban center-edge gradients. Landsc. Urban Plan. 2022, 217, 104266. [Google Scholar] [CrossRef]
- Chen, B.; Wu, S.; Song, Y.; Webster, C.; Xu, B.; Gong, P. Contrasting inequality in human exposure to greenspace between cities of Global North and Global South. Nat. Commun. 2022, 13, 4636. [Google Scholar] [CrossRef]
- Baró, F.; Camacho, D.A.; Del Pulgar, C.P.; Triguero-Mas, M.; Anguelovski, I. School greening: Right or privilege? Examining urban nature within and around primary schools through an equity lens. Landsc. Urban Plan. 2021, 208, 104019. [Google Scholar] [CrossRef]
- Tang, Z.; Gu, S. An Evaluation of Social Performance in the Distribution of Urban Parks in the Central City of Shanghai: From Spatial Equity to Social Equity. Urban Plan. Forum 2015, 222, 48–56. (In Chinese) [Google Scholar]
- Kimpton, A. A spatial analytic approach for classifying greenspace and comparing greenspace social equity. Appl. Geogr. 2017, 82, 129–142. [Google Scholar] [CrossRef]
- Wang, M.; Zhu, A.; Wang, J.; Lu, T. Supply and demand analysis of urban park distribution based on social equity and justice: A case study of Xuhui District, Shanghai. Acta Ecol. Sin. 2019, 39, 7035–7046. [Google Scholar]
- Cheng, P.; Min, M.; Hu, W.; Zhang, A. A Framework for Fairness Evaluation and Improvement of Urban Green Space: A Case of Wuhan Metropolitan Area in China. Forests 2021, 12, 890. [Google Scholar] [CrossRef]
- Apan, A.A.; Raine, S.R.; Paterson, M.S. Mapping and analysis of changes in the riparian landscape structure of the Lockyer Valley catchment, Queensland, Australia. Landsc. Urban Plan. 2002, 59, 43–57. [Google Scholar] [CrossRef]
- Kabisch, N.; Haase, D. Green justice or just green? Provision of urban green spaces in Berlin, Germany. Landsc. Urban Plan. 2014, 122, 129–139. [Google Scholar] [CrossRef]
- Tang, Z.; Gu, S. An Evaluation of Social Performance in the Distribution of Urban Parks in the Central City of Shanghai: From Social Equity to Social Justice. Urban Plan. Forum 2016, 227, 15–21. (In Chinese) [Google Scholar]
- Wüstemann, H.; Kalisch, D.; Kolbe, J. Access to urban green space and environmental inequalities in Germany. Landsc. Urban Plan. 2017, 164, 124–131. [Google Scholar] [CrossRef]
- Wolff, M.; Scheuer, S.; Haase, D. Looking beyond boundaries: Revisiting the rural-urban interface of Green Space Accessibility in Europe. Landsc. Ecol. 2020, 113, 106245. [Google Scholar] [CrossRef]
- Hsu, Y.-Y.; Hawken, S.; Sepasgozar, S.; Lin, Z.-H. Beyond the Backyard: GIS Analysis of Public Green Space Accessibility in Australian Metropolitan Areas. Sustainability 2022, 14, 4694. [Google Scholar] [CrossRef]
- Jang, S.; An, Y.; Yi, C.; Lee, S. Assessing the spatial equity of Seoul’s public transportation using the Gini coefficient based on its accessibility. Int. J. Urban Sci. 2016, 21, 91–107. [Google Scholar] [CrossRef]
- Plieninger, T.; Bieling, C.; Fagerholm, N.; Byg, A.; Hartel, T.; Hurley, P.; López-Santiago, C.A.; Nagabhatla, N.; Oteros-Rozas, E.; Raymond, C.M.; et al. The role of cultural ecosystem services in landscape management and planning. Environ. Sustain. 2015, 14, 28–33. [Google Scholar] [CrossRef]
- Zhou, W.; Shen, X.; Cao, F.; Sun, Y. Effects of Area and Shape of Greenspace on Urban Cooling in Nanjing, China. J. Urban Plan. Dev. 2019, 145, 04019016. [Google Scholar] [CrossRef]
- Calderón-Argelich, A.; Benetti, S.; Anguelovski, I.; Connolly, J.J.T.; Langemeyer, J.; Baró, F. Tracing and building up environmental justice considerations in the urban ecosystem service literature: A systematic review. Landsc. Urban Plan. 2021, 214, 104130. [Google Scholar] [CrossRef]
- Lonsdorf, E.V.; Nootenboom, C.; Janke, B.; Horgan, B.P. Assessing urban ecosystem services provided by green infrastructure: Golf courses in the Minneapolis-St. Paul metro area. Landsc. Urban Plan. 2021, 208, 104022. [Google Scholar] [CrossRef]
- Francis, L.F.M.; Jensen, M.B. Benefits of green roofs: A systematic review of the evidence for three ecosystem services. Urban For. Urban Green. 2017, 28, 167–176. [Google Scholar] [CrossRef]
- Bartesaghi Koc, C.; Osmond, P.; Peters, A. Evaluating the cooling effects of green infrastructure: A systematic review of methods, indicators and data sources. Sol. Energy 2018, 166, 486–508. [Google Scholar] [CrossRef]
- Prudencio, L.; Null, S.E. Stormwater management and ecosystem services: A review. Environ. Res. Lett. 2018, 13, 033002. [Google Scholar] [CrossRef]
- Ouyang, X.; Luo, X. Models for Assessing Urban Ecosystem Services: Status and Outlooks. Sustainability 2022, 14, 4725. [Google Scholar] [CrossRef]
- Kadaverugu, R.; Gurav, C.; Rai, A.; Sharma, A.; Matli, C.; Biniwale, R. Quantification of heat mitigation by urban green spaces using InVEST model—A scenario analysis of Nagpur City, India. Arab. J. Geosci. 2021, 14, 82. [Google Scholar] [CrossRef]
- Sun, X.; Ma, Q.; Fang, G. Spatial scaling of land use/land cover and ecosystem services across urban hierarchical levels: Patterns and relationships. Landsc. Ecol. 2022. [Google Scholar] [CrossRef]
- Sun, X.; Yang, P.; Tao, Y.; Bian, H. Improving ecosystem services supply provides insights for sustainable landscape planning: A case study in Beijing, China. Sci. Total Environ. 2022, 802, 149849. [Google Scholar] [CrossRef]
- Han, B.; Ouyang, Z. The comparing and applying Intelligent Urban Ecosystem Management System (IUEMS) on ecosystem services assessment. Acta Ecol. Sin. 2021, 41, 8697–8708. (In Chinese) [Google Scholar]
- Ma, X.; Li, J.; Zhao, K.; Wu, T.; Zhang, P. Simulation of Spatial Service Range and Value of Carbon Sink Based on Intelligent Urban Ecosystem Management System and Net Present Value Models—An Example from the Qinling Mountains. Forests 2022, 13, 407. [Google Scholar] [CrossRef]
- Zhang, L.; Yan, J. A judgment of warming-drying climate changes and drought disaster trend of Xianyang City. J. Arid. Land Resour. Environ. 2011, 25, 131–135. (In Chinese) [Google Scholar]
- Hu, Z.; Zhou, Z. Ecosystem services evaluation and its spatial pattern analysis of urban green land in Xi’an City. Arid Land Geogr. 2013, 36, 553–561. (In Chinese) [Google Scholar]
- Liu, L.; Liang, L.; Gao, P.; Fan, C.; Wang, H.; Wang, H. Coupling relationship and interactive response between ecological protection and high-quality development in the Yellow River Basin. J. Nat. Resour. 2021, 36, 176–195. (In Chinese) [Google Scholar] [CrossRef]
- Zhang, L.; Song, C.; Yan, J. Spatio-temporal Trends of Annual Extreme Temperature in Northern and Southern Qinling Mountains. Sci. Geogr. Sin. 2011, 31, 1007–1011. (In Chinese) [Google Scholar]
- Li, Y.; Zhang, L.; Yan, J.; Wang, P.; Hu, N.; Cheng, W.; Fu, B. Mapping the hotspots and coldspots of ecosystem services in conservation priority setting. J. Geogr. Sci. 2017, 27, 681–696. [Google Scholar] [CrossRef]
- Wang, Z.; Zhang, L.; Li, X.; Li, Y.; Wang, P.; Yan, J. Spatio-temporal pattern of supply-demand risk of ecosystem services at regional scale: A case study of water yield service in Shaanxi province. Acta Ecol. Sin. 2020, 40, 1887–1900. [Google Scholar]
- Chen, J. China: Open access to Earth land-cover map. Nature 2014, 514, 434. [Google Scholar]
- Chen, J.; Chen, J.; Liao, A.; Cao, X.; Chen, L.; Chen, X.; He, C.; Han, G.; Peng, S.; Lu, M.; et al. Global land cover mapping at 30 m resolution: A POK-based operational approach. ISPRS J. Photogramm. Remote Sens. 2015, 103, 7–27. [Google Scholar] [CrossRef]
- Wu, S.; Yang, H.; Luo, P.; Luo, C.; Li, H.; Liu, M.; Ruan, Y.; Zhang, S.; Xiang, P.; Jia, H.; et al. The effects of the cooling efficiency of urban wetlands in an inland megacity: A case study of Chengdu, Southwest China. Build. Environ. 2021, 204, 108128. [Google Scholar] [CrossRef]
- Liu, H.; Hamel, P.; Tardieu, L.; Remme, R.P.; Han, B.; Ren, H. A geospatial model of nature-based recreation for urban planning: Case study of Paris, France. Land Use Policy 2022, 117, 106107. [Google Scholar] [CrossRef]
- Kaminski, A.; Bauer, D.M.; Bell, K.P.; Loftin, C.S.; Nelson, E.J. Using landscape metrics to characterize towns along an urban-rural gradient. Landsc. Ecol. 2021, 36, 2937–2956. [Google Scholar] [CrossRef]
- Sen, S.K.; Pearsall, H.; Gutierrez-Velez, V.H.; Gilbert, M.R. Measuring Equity through Spatial Variability of Infrastructure Systems across the Urban-Rural Gradient. Land 2021, 10, 1202. [Google Scholar]
- Kroll, F.; Mueller, F.; Haase, D.; Fohrer, N. Rural-urban gradient analysis of ecosystem services supply and demand dynamics. Land Use Policy 2012, 29, 521–535. [Google Scholar] [CrossRef]
- Radford, K.G.; James, P. Changes in the value of ecosystem services along a rural-urban gradient: A case study of Greater Manchester, UK. Landsc. Urban Plan. 2013, 109, 117–127. [Google Scholar] [CrossRef]
- Dang, H.; Li, J.; Zhang, Y.; Zhou, Z. Spatial pattern of urban green space ecosystem service in Xi’an City based on fairness evaluation. Acta Ecol. Sin. 2021, 41, 6970–6980. (In Chinese) [Google Scholar]
- Chen, Y.; Yu, P.; Li, Z.; Wang, J.; Chen, Y. Environmental Equity Measurement of Urban Green Space from the Perspective of SDG11: A Case Study of the Central Urban Area of Wuhan. Geogr. GeoInf. Sci. 2021, 37, 81–89. (In Chinese) [Google Scholar]
- Mu, H.; Gao, Y.; Wang, Z.; Zhang, Y. Equity Evaluation of Park Green Space Service Level from the Perspective of Supply and Demand Balance: An Empirical Analysis based on big Data. Urban Stud. 2019, 26, 10–15. (In Chinese) [Google Scholar]
- Kuang, W.; Li, S.; Zhou, H. Method of accurately evaluating spatial equity of urban park green space: A case study of Haidian District, Beijing. J. Huazhong Agric. Univ. 2022, 41, 160–169. (In Chinese) [Google Scholar]
- Song, Y.; Chen, B.; Ho, H.C.; Kwan, M.P.; Liu, D.; Wang, F.; Wang, J.; Cai, J.; Li, X.; Xu, Y.; et al. Observed inequality in urban greenspace exposure in China. Environ. Int. 2021, 156, 106778. [Google Scholar] [CrossRef] [PubMed]
- Wu, Z.; Zhou, R.; Zeng, Z. Identifying and Mapping the Responses of Ecosystem Services to Land Use Change in Rapidly Urbanizing Regions: A Case Study in Foshan City, China. Remote Sens. 2021, 13, 4374. [Google Scholar] [CrossRef]
- Tao, Y.; Zhang, Z.; Ou, W.; Guo, J.; Pueppke, S.G. How does urban form influence PM2.5 concentrations: Insights from 350 different-sized cities in the rapidly urbanizing Yangtze River Delta region of China, 1998–2015. Cities 2020, 98, 102581. [Google Scholar] [CrossRef]
- Puplampu, D.A.; Boafo, Y.A. Exploring the impacts of urban expansion on green spaces availability and delivery of ecosystem services in the Accra metropolis. Environ. Chall. 2021, 5, 100283. [Google Scholar] [CrossRef]
- Liu, W.; Zhou, Z.; Lang, R. Supply-demand relations of ecosystem services of urban green infrastructure and its spatial optimization: A case of Xi’an City. Arid Land Geogr. 2021, 44, 1500–1513. (In Chinese) [Google Scholar]
- Zou, Y.; Zhou, Z. Impact of landscape pattern change on ecosystem service value of Xi’an City, China. Chin. J. Appl. Ecol. 2017, 28, 2629–2639. (In Chinese) [Google Scholar]
- Fan, X.; Qie, H. Analysis on the Characteristics of the Tempo-spatial Evolution of Xi’an Metropolitan Area. Urban Stud. 2021, 28, 34–39. (In Chinese) [Google Scholar]
- Keuschnigg, M. Scaling trajectories of cities. Proc. Natl. Acad. Sci. USA 2019, 116, 13759–13761. [Google Scholar] [CrossRef]
- Schipperijn, J.; Ekholm, O.; Stigsdotter, U.K.; Toftager, M.; Bentsen, P.; Kamper-Jørgensen, F.; Randrup, T.B. Factors influencing the use of green space: Results from a Danish national representative survey. Landsc. Urban Plan. 2010, 95, 130–137. [Google Scholar] [CrossRef]
- Kienast, F.; Degenhardt, B.; Weilenmann, B.; Wäger, Y.; Buchecker, M. GIS-assisted mapping of landscape suitability for nearby recreation. Landsc. Urban Plan. 2012, 105, 385–399. [Google Scholar] [CrossRef]
- Yang, X.; Zhang, Q.; Wu, S. Comparative Research on Multi-scale and System of Metropolis Green Space Pattern: Case Studies of Beijing, London, Paris and New York. Urban Plan. Int. 2017, 32, 83–92. (In Chinese) [Google Scholar] [CrossRef]
- Shoemaker, D.A.; BenDor, T.K.; Meentemeyer, R.K. Anticipating trade-offs between urban patterns and ecosystem service production: Scenario analyses of sprawl alternatives for a rapidly urbanizing region. Comput. Environ. Urban Syst. 2019, 74, 114–125. [Google Scholar] [CrossRef]
- Wang, L.; Omrani, H.; Zhao, Z.; Francomano, D.; Li, K.; Pijanowski, B. Analysis on urban densification dynamics and future modes in southeastern Wisconsin, USA. PLoS ONE 2019, 14, e0211964. [Google Scholar] [CrossRef]
- Lin, J.; Li, X. Large-scale ecological red line planning in urban agglomerations using a semi-automatic intelligent zoning method. Sust. Cities Soc. 2019, 46, 101410. [Google Scholar] [CrossRef]
- Wang, Z.; Zhang, S.; Peng, Y.; Wu, C.; Lv, Y.; Xiao, K.; Zhao, J.; Qian, G. Impact of rapid urbanization on the threshold effect in the relationship between impervious surfaces and water quality in shanghai, China. Environ. Pollut. 2020, 267, 115569. [Google Scholar] [CrossRef]
- Wang, R.; Bai, Y.; Alatalo, J.M.; Yang, Z.; Yang, Z.; Yang, W.; Guo, G. Impacts of rapid urbanization on ecosystem services under different scenarios-A case study in Dianchi Lake Basin, China. Ecol. Indic. 2021, 130, 108102. [Google Scholar] [CrossRef]
- Paschalis, A.; Chakraborty, T.C.; Fatichi, S.; Meili, N.; Manoli, G. Urban Forests as Main Regulator of the Evaporative Cooling Effect in Cities. AGU Adv. 2021, 2, e2020AV000303. [Google Scholar] [CrossRef]
- Peng, J.; Yang, Y.; Xie, P.; Liu, Y. Zoning for the construction of green space ecological networks in Guangdong Province based on the supply and demand of ecosystem services. Acta Ecol. Sin. 2017, 37, 4562–4572. (In Chinese) [Google Scholar]
- Herreros-Cantis, P.; McPhearson, T. Mapping supply of and demand for ecosystem services to assess environmental justice in New York City. Ecol. Appl. 2021, 31, e02390. [Google Scholar] [CrossRef] [PubMed]
- Zhao, P.; Luo, J.; Hu, H. Spatial match between residentsdaily life circle and public service facilities using big data analytics: A case of Beijing. Prog. Geogr. 2021, 40, 541–553. (In Chinese) [Google Scholar] [CrossRef]
- Villarreal-Rosas, J.; Vogl, A.L.; Sonter, L.J.; Possingham, H.P.; Rhodes, J.R. Trade-offs between efficiency, equality and equity in restoration for flood protection. Environ. Res. Lett. 2021, 17, 014001. [Google Scholar] [CrossRef]
- Chakraborty, T.; Biswas, T.; Campbell, L.S.; Franklin, B.; Parker, S.S.; Tukman, M. Feasibility of afforestation as an equitable nature-based solution in urban areas. Sustain. Cities Soc. 2022, 81, 103826. [Google Scholar] [CrossRef]
- Rothwell, J.T.; Massey, D.S. Density Zoning and Class Segregation in U.S. Metropolitan Areas. Soc. Sci. Q. 2010, 91, 1123–1143. [Google Scholar] [CrossRef] [PubMed] [Green Version]
Publisher’s Note: MDPI stays neutral with regard to jurisdictional claims in published maps and institutional affiliations. |
© 2022 by the authors. Licensee MDPI, Basel, Switzerland. This article is an open access article distributed under the terms and conditions of the Creative Commons Attribution (CC BY) license (https://creativecommons.org/licenses/by/4.0/).