Article

Winter Wheat Lodging Area Extraction Using Deep Learning with GaoFen-2 Satellite Imagery

1
School of Environment and Spatial Informatics, China University of Mining and Technology, Xuzhou 221116, China
2
Aerospace Information Research Institute, Chinese Academy of Sciences, Beijing 100094, China
*
Author to whom correspondence should be addressed.
Remote Sens. 2022, 14(19), 4887; https://doi.org/10.3390/rs14194887
Submission received: 23 August 2022 / Revised: 26 September 2022 / Accepted: 27 September 2022 / Published: 30 September 2022
(This article belongs to the Special Issue Digital Farming with Remote Sensing)

Abstract

:
The timely and accurate detection of wheat lodging at a large scale is necessary for loss assessments in agricultural insurance claims. Most existing deep-learning-based methods of wheat lodging detection use data from unmanned aerial vehicles, rendering monitoring wheat lodging at a large scale difficult. Meanwhile, the edge feature is not accurately extracted. In this study, a semantic segmentation network model called the pyramid transposed convolution network (PTCNet) was proposed for large-scale wheat lodging extraction and detection using GaoFen-2 satellite images with high spatial resolutions. Multi-scale high-level features were combined with low-level features to improve the segmentation’s accuracy and to enhance the extraction sensitivity of wheat lodging areas in the proposed model. In addition, four types of vegetation indices and three types of edge features were added into the network and compared to the increment in the segmentation’s accuracy. The F1 score and the intersection over union of wheat lodging extraction reached 85.31% and 74.38% by PTCNet, respectively, outperforming other compared benchmarks, i.e., SegNet, PSPNet, FPN, and DeepLabv3+ networks. PTCNet can achieve accurate and large-scale extraction of wheat lodging, which is significant in the fields of loss assessment and agricultural insurance claims.

Graphical Abstract

1. Introduction

Wheat lodging is one of the main factors for wheat yield reductions [1], which is usually presented in the form of obliquely and horizontally distributed crop stalks [2]. Lodging in wheat is often a result of the combined effects of the inadequate standing power of the crop, mainly caused by nitrogen excess [3,4]. In addition to nitrogen excess, conditions such as rain, wind, topography, and soil [5,6,7] also lead to wheat lodging. Easson et al. [8] showed that as little as 4 mm of rainfall could cause a decrease in soil strength and an increased risk of lodging. Strong winds and rainstorms are important reasons for large-area wheat lodging [9]. Lodging makes mechanical harvesting difficult, crops become vulnerable to diseases [10], and it blocks the photosynthesis of crops [11], which reduces the grain’s quality and yield [12]. The timely and accurate extraction of wheat lodging information is beneficial for yield prediction and essential for relevant agricultural insurance claims. In this sense, it is necessary to detect and extract lodging areas accurately and to quickly aid in decision-making processes for loss assessments in agricultural insurance and post-agricultural risk management.
In traditional wheat lodging detection, field measurements are used for marking and identifying lodging areas, which is time-consuming, laborious, even harmful to crops during measuring processes [13,14,15]. With the development of remote sensing, extensive studies have been conducted to detect and extract crop lodging information using various sensors, such as visible light sensors [16], infrared sensors [17], and microwave sensors [18]. Many useful features, including spectral characteristics [19,20], object height [21,22], thermal infrared brightness temperature [23], and texture information [24,25,26] from different remote sensing techniques, have been used to identify wheat lodging areas. Zhou et al. [21] utilized a canopy height model to retrieve the height of the maize canopy based on light detection and ranging (LiDAR) data from an unmanned aerial vehicle (UAV), which suggested that plant heights can be used to access the lodging degree of maize with R2 = 0.964. Wang et al. [20] combined synthetic aperture radar (SAR) features with spectral indices (SI) extracted from Sentinel-1 and Sentinel-2 observations to identify lodged rice and constructed a model for an optimal sensitive parameters selection (OSPL) with respect to lodging rice detection. The OSPL can distinguish lodged rice from healthy rice and selects the best SI and SAR features for classification with an accuracy of 91.29%. Extracting texture information from optical UAV data by gray-level co-occurrence matrix (GLCM) is also beneficial for crop lodging extraction. Rajapaksa et al. [24] used GLCM, local binary patterns (LBP), and Gabor filters to extract texture features from UAV images and trained a support vector machine (SVM). The prediction accuracy of lodged rape and wheat reached 97.6% and 96.4%, respectively. Liu et al. [25] used the principal component analysis transform, GLCM algorithm, and object-oriented method to extract image features. The results showed that the user’s accuracy for wheat lodging area detection was 81.86%. In addition, due to the temperature difference before and after the lodging event, Liu et al. [17] constructed a rice lodging recognition model using particle swarm optimization and an SVM algorithm with features of thermal-infrared information. The results showed that the combination of visible and thermal-infrared image features can significantly improve the recognition accuracy of rice lodging. Cao et al. [23] proposed a wheat lodging extraction method based on a watershed algorithm (WA) and an adaptive threshold segmentation algorithm (ATS), proving that the spectral reflectance and temperature of lodged wheat are higher than those of non-lodged wheat. The classification accuracy of the hybrid algorithm of WA and ATS is 93.58%. Traditional feature extraction methods mentioned above can extract crop lodging information using remote sensing images effectively. However, studies on the identification of crop lodging using the edge features generated by edge operators have not been found. Due to clear boundaries between lodged and non-lodged crops, extraction of edge feature is necessary for this research.
In addition, UAV data were used in most current research studies on crop lodging detection and extraction based on remote sensing technology. Tian et al. [27] constructed a rice lodging detection model based on the characteristics of spectral reflectance, vegetation indices (VIs), texture, and color features of UAV images, which indicated that the spectral reflectance of green- and red-edge bands and the green normalized difference vegetation index (GNDVI) was sensitive to rice lodging, and the accuracy of lodged wheat in the proposed lodging detection model was 98.74%. Wang et al. [28] employed a UAV carrying an RGB camera to compare various color features and found that the texture feature of the mean G/B was the optimum indicator. An unsupervised classification method based on the indicator was used to distinguish lodged wheat from non-lodged wheat, with an accuracy of 86.15% in the lodged wheat category. Chauhan et al. [29] used multispectral UAV data in nine bands to compare different grades of lodging severity and explored the variation in spectral reflectance in each band. The results showed that the more severe the lodging, the greater the spectral reflectance, particularly in the green-edge, red-edge, and near-infrared (NIR) bands. The overall accuracy of the nearest-neighbor classification was 90%. Because various features derived from UAV data can be taken as input into various machine learning algorithms, Zhang et al. [30] introduced five different features (i.e., gray level co-occurrence matrix, local binary pattern, Gabor, intensity, and Hu-moment) into three machine learning classifiers and compared the three algorithms. It showed that the accuracy of wheat lodging detection by combining the RGB images of UAV with a deep learning algorithm (i.e., GoogLeNet) is as large as 93% and can be considered as a simple and reliable tool for wheat lodging detection. The spatial resolution of UAV data is much higher than that of satellite data. In that case, more detailed information can be extracted, so the accuracy of crop lodging detection is highly based on UAV data. However, due to the limitations of their altitude and endurance, UAVs cannot be used for large-scale lodging detection. In addition, the data preprocessing of UAV data (especially radiance calibration) varies in different UAV categories because of various sensors and calibration plates. Satellite images are much wider than UAV images, which is up to tens of kilometers. Low-orbiting satellites can achieve sub-meter resolutions and short revisit periods. Thus, satellites can perform crop lodging detections over large areas and serve as tools for large-scale lodging area mapping. However, studies on crop lodging detection using optical satellite imagery are limited. A maize lodging monitoring model [31] was proposed by random forest (RF) and partial least squares (PLS), realizing the large-scale monitoring of maize lodging levels with GaoFen-1 satellite images. The results showed that the accuracy of lodging samples reached 79% with the method of RF, outperforming PLS. Researchers combined SAR images from Sentinel-1 with multi-spectral images from Sentinel-2 to assess the loss caused by crop lodging. For example, Abhishek et al. [32] utilized Sentinel-2 data to draw a map of jute distribution and Sentinel-1 data to assist in distinguishing the vitality categories of jute. Findings suggested that 12.46% of the total jute area over the study area was affected by a super cyclonic storm. Chauhan et al. [33] used Sentinel-1 and Sentinel-2 data to detect lodging incidences in wheat using time-series analysis. They demonstrated that dense time-series SAR and optical data can be used to detect wheat lodging and recognize lodging severity. Nevertheless, in these studies, the results of crop lodging monitoring are relatively rough. One reason is that the used satellite data possess lower spatial resolution than sub-meter-resolution satellite imagery. On the other hand, these traditional methods rely on the number and selection of samples.
With the rapid development of deep learning, semantic segmentation neural networks have shown powerful feature extraction abilities in recent years. This technology can be used to create effective schemes for detecting crop lodging. Yang et al. [34] established semantic segmentation network models to identify rice lodging using VIs, achieving an accuracy of 94.43% using FCN-AlexNet. A method [35] that combines transfer learning and DeepLabv3+ network proposed by Zhang et al. was used to extract lodging areas of wheat at multiple growth stages. It can be used to predict wheat lodging and has improved prediction effects compared to the U-Net. Song et al. [36] proposed an image fusion-based method for sunflower lodging recognition. Low-resolution multispectral images were fused with high-resolution visible images to obtain high-resolution multispectral images. Skip connection, deep separate convolution, and conditional random field technology were used to improve SegNet and segmentation accuracy reached 89.8%. Su et al. [37] improved U-Net by combining dense blocks, DenseNet, and skip connections. The accuracy of the model for rice lodging images was 97.30%. Unfortunately, these improved neural networks are all based on UAV data, whereas, compared with UAV data, the interclass homogeneity and intraclass heterogeneity of satellite data are high due to relatively low spatial resolutions. To the best of our knowledge, no semantic segmentation neural network is proposed based on satellite images.
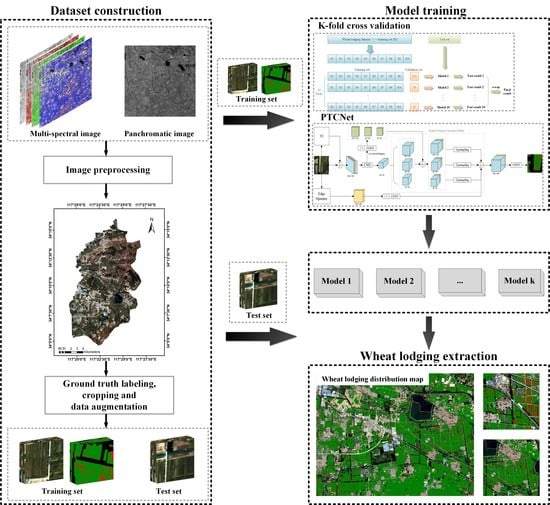
Large-scale detection of wheat lodging is challenging due to the small coverage of UAV images used in previous studies. Classical semantic segmentation networks do not pay attention to the characteristics of wheat lodging so the boundaries of wheat lodging areas cannot be clearly extracted. The main objective of this study is to propose a semantic segmentation neural network that can extract wheat lodging areas using satellite images with sub-meter spatial resolution. Datasets for wheat lodging from a satellite and a UAV were first constructed. Subsequently, the network in this study incorporated VIs and combined low-level features with high-level features at multiple scales. Edge features were generated by three edge operators and then concatenated with upsampled feature maps to enhance the boundary extraction for lodged wheat. Finally, the proposed network achieved accurate and large-scale detections of wheat lodging, which are significant in the areas of loss assessment and agricultural insurance claims.

2. Materials

2.1. Study Area and UAV Data Collection

The study area is Zhangji Town, southeast of Xuzhou, Jiangsu Province, China, covering 117°18′0″~117°27′0″E and 34°1′0″~34°15′45″N (Figure 1). The northern part of the town is a wheat-planting demonstration base in Jiangsu Province and is mainly planted with wheat and garlic, whereas in the southern of the town is planted with wheat, mulberry, and greenhouse vegetables. Because most wheats in the north include high-quality varieties and wheat stalks are short, wheat lodging events rarely occur. In contrast, wheat in the southern villages of the town is densely planted with tall stalks and more severe lodging. Therefore, our ground survey was conducted mainly in the southern part of the town.
Strong winds and showers occurred from 15 to 17 May 2021, resulting in wheat lodging. Wheat was in the milky stage. A ground survey was conducted following the lodging event. A DJI Phantom 4 drone was used to determine whether a collapse occurred on the far side of wheat fields. Five typical wheat lodging areas were captured by the UAV, and five UAV images were obtained. GPS real-time kinematic (RTK) positioning was used to acquire the precise position of the lodging areas to confirm the location of lodging areas in the satellite image during the follow-up study.

2.2. Satellite Image Preprocessing

In this study, a GaoFen-2 (GF-2) satellite image, which was generated one week after the occurrence of wheat lodging, was used to construct a wheat lodging dataset. The attributes of GF-2 are listed in Table 1. The satellite image was preprocessed using ENVI software (version 5.3.1, Harris Corporation, the USA). The workflow is illustrated in Figure 2. The calculation formula of radiometric calibration is described in Equation (1):
Le = Gain × DN + Bais,
where Le is the equivalent radiance at the entrance pupil of the satellite load channel, DN is digital number, and Gain and Bias denote the gain and offset of the calibration coefficient, respectively. The high spatial-resolution panchromatic image was used as the base image to perform the geometrical registration of the multispectral image. The nearest neighbor diffuse pan-sharpening algorithm was utilized to fuse the panchromatic image and the multispectral image. Finally, a multispectral image with four bands (i.e., G, B, R, and NIR) of 1 m spatial resolution was obtained.

2.3. Dataset Construction

ENVI 5.3 software was used to manually label the satellite images to generate ground truth data. The samples were divided into the background, wheat fields, and wheat lodging areas according to visual interpretations and on-site measured data. The values of the three types of samples, that is, background, wheat fields, and wheat lodging areas, were 0, 1, and 2, respectively. Pre-processed images and labeled images were clipped into images of size 256 × 256 pixels (Figure 3). Finally, 1000 images and 1000 labeled images were obtained and ready for use in constructing the dataset.
Both augmentation methods, offline augmentation and online augmentation, were used in this study because of the class imbalance problem. The images and their corresponding labels were divided into a training set and a test set before offline augmentation, consisting of 500 and 500 images, respectively. Because the number of images in the training set was low, offline augmentation was performed to increase the number of images in the training set to 2000, while the test set remained the same. The test set comprised 20% of the entire dataset.
The wheat lodging dataset collected from a UAV, which was used for the generalization test, was constructed simultaneously using the same workflow mentioned above. Figure 4 shows a UAV image. One thousand images of size 256 × 256 pixels were obtained after clipping five UAV images, with 800 used to train the pyramid transposed convolution network (PTCNet) using a finetuning method and 200 used to perform the generalization test.

3. Methodology

A flowchart of wheat lodging extraction is exhibited in Figure 5. Firstly, a wheat lodging dataset is generated using the preprocessed satellite image mentioned in Section 2.2 after ground-truth labeling. Meanwhile, vegetation indices were calculated and edge features were generated by edge operators. These two types of characteristics are concatenated with row images as a complete dataset. Secondly, the dataset is randomly shuffled and divided into training and test set. Subsequently, the augmented training set is used to perform model training by k-fold cross-validation method. The test set is used to produce results of the prediction of wheat lodging and to perform model performance assessment. Our approach is highlighted among existing studies of winter wheat extraction as follows: (1) A new semantic segmentation neural network used for wheat lodging extraction was proposed, which combines multi-scale low-level spatial features with multi-scale high-level semantic features to generate more complementary feature maps to benefit the finer extraction of wheat lodging. (2) Boundary refinement extraction problem was considered in the study. Edge operators were added to generate edge features that are fit for the good detection of boundaries between lodged and non-lodged wheat. To avoid overfitting in the small dataset, the k-fold cross-validation method was used to increase the reliability of the results.

3.1. Network Architecture

The majority of semantic segmentation networks adopt an encoder–decoder structure, which encodes the input to intermediate features and then decodes the intermediate features to the output. The PTCNet proposed in this study comprises two parts: encoder and decoder. In addition, PTCNet pays attention to VIs and edge features of wheat lodging areas in order to be suitable for detecting large-scale wheat lodging incidences. PTCNet’s architecture is shown in Figure 6a.
The first part is the encoder module, which comprises an improved Xception [38]. The improved Xception is divided into three flows: entry, middle, and exit. There are 20 blocks, including 3 for the entry flow, 16 for the middle flow, and 1 for the exit flow. Depth-wise separate convolutions are utilized in Xception, including depth-wise and point-wise convolutions. The former is the convolution of packets for which its number is equal to the number of channels, which implements a cross-channel correlation mapping, and the latter implements a spatial correlation mapping. This indicates that depth-wise separate convolutions achieve a complete decoupling of the cross-channel correlation and spatial correlation. High-level features with a size of 1/16 of the original input images were obtained after input images flowed into the backbone network. Meanwhile, low-level features at three different scales were extracted from the backbone network by performing 1 × 1 convolutions on three different output channels, that is, 32, 48, and 64 channels for the dimensionality’s reduction operation.
The decoder module mainly includes the pyramid transposed convolution (PTC) module, which we propose for upsampling high-level features of the encoder output by transposing convolutions at different scales. The detailed workflow of the PTC module is illustrated in Figure 6a,b. Transposed convolutions not only expand the size of feature maps but also extract the features of images. The obtained feature maps were 1/8, 1/4, and 1/2 the size of the original figures after transposed convolutions and upsampling at different levels. These three scales of feature maps are then concatenated with the corresponding low-level features to generate new feature maps of the three scales. The feature maps are then upsampled to the size of the original input images using the bilinear upsampling method.
In addition, studies [39,40,41] showed that the spectral reflectance of a crop tends to increase when lodging events occur, and the increase is different for each band. The four VIs varied with spectral reflectance. Therefore, four types of VIs were generated based on original input images, which are the normalized difference vegetation Index (NDVI), GNDVI, the enhanced vegetation index (EVI), and the ratio vegetation index (RVI). The formulae for the four VIs are listed in Table 2. One of the generated VIs was concatenated to the original input images before flowing into the Xception network.
Because of the obvious boundary between healthy plants and lodging plants after the lodging event, three types of edge operators were included in the network model: Scharr, Prewitt, and Roberts operators. The Scharr in the x and y directions, Prewitt in the x and y directions, and Roberts in the x and y directions are denoted as FilterSx and FilterSy (Equation (2)), FilterPx and FilterPy (Equation (3)), and FilterRx and FilterRy (Equation (4)), respectively.
F i l t e r S x = [ 3 0 3 10 0 10 3 0 3 ] ,   F i l t e r S y = [ 3 10 3 0 0 0 3 10 3 ] ,
F i l t e r P x = [ 1 0 1 1 0 1 1 0 1 ] ,   F i l t e r P y = [ 1 1 1 0 0 0 1 1 1 ] ,
F i l t e r R x = [ 1 0 0 1 ] ,   F i l t e r R y = [ 0 1 1 0 ] ,
Edge feature maps were created from original input images by edge operators. A 1 × 1 convolution was used to increase the dimension of the edge feature maps. Subsequently, these feature maps were concatenated with the feature maps flowing out from the PTC module, and predicted images were obtained by final convolutions.
As for the integration of VIs and edge features, VIs were calculated by corresponding formulas. The results were saved as images in TIF format. Meanwhile, edge features were extracted by edge operators. The extracted results were also saved as images in TIF format. Finally, the original images were concatenated with their corresponding VIs and edge features images. Spatial information would be lost after VIs and spectral features flew into the backbone network, while the integration of edge features made up for the loss of spatial information.

3.2. K-Fold Cross-Validation

Regarding the size of the wheat lodging dataset not being sufficiently large, we proposed using the k-fold cross-validation method for data training and performance assessment. In addition, this method effectively avoids overfitting. The training data were divided into ten folds in this study, with nine as the training set and one as the validation set. Each fold was set up for validation to remove the limitations and particularities of fixed partitions for small-scale datasets. A schematic of the k-fold cross-validation used in this study is shown in Figure 7. Each network was trained with the k-fold cross-validation method, and ten models were obtained each time. The test set was tested on these ten models resulting in ten results. The final result was obtained by averaging ten results. This workflow was designed to prevent overfitting problems due to the small size of the dataset.

3.3. Model Training

The experiment was conducted in a software environment with the CentOS Linux release 7.9 operating system, Python 3.8, PyTorch1.9.0, and CUDA 11.2. The convolution operation is followed by batch normalization (BN) and linear rectification (ReLU) to ensure the nonlinearity of the semantic segmentation network. The initial learning rate was 1 × 10⁻⁴ the image size in the training set was 256 × 256, the number of training epochs in each fold was 200, and batch size was four. The multi-class DiceLoss [42] was chosen as the loss function because it can handle the imbalances between positive (i.e., wheat lodging areas) and negative (i.e., others) samples in this semantic segmentation experiment. The learning rate schedule POLY was used for model training (Equation (5)):
l r = b a s e _ l r × ( 1 e p o c h n u m _ e p o c h ) p o w e r ,
where lr is the new learning rate, base_lr is the base learning rate, epoch is the training iterations, num_epoch is the maximum training iterations, and power is used to control the curve shape. Moreover, SegNet [43], PSPNet [44], FPN [45], and DeepLab v3+ [38] were used in this study.

3.4. Evaluation Method

Six evaluation indicators were used to quantitatively evaluate and analyze the segmentation’s results, using ground-truth data as a reference. It is assumed that the pixels in the result graphs are distinguished as follows: the pixels correctly identified as their categories (true positive, TP), the pixels correctly identified as other categories (true negative, TN), the pixels incorrectly identified as their categories (false positive, FP), and the pixels incorrectly identified as other categories (False Negative, FN). The precision, recall, F1 score, overall accuracy (OA), intersection over union (IoU), and mean intersection over union (mIoU) were chosen to evaluate the performance of models. The formulae for the six evaluation indicators are listed in Table 3.

4. Results and Discussion

4.1. Influence of Various VIs on Model Performance

To explore the differences in canopy spectral variations before and after wheat lodging, the spectral reflectance of lodged and non-lodged wheat in the study area was collected, as shown in Figure 8a. The spectral reflectance histograms of lodged wheat in the NIR and visible-light bands shifted from left to right, indicating an increase in the spectral reflectance of lodged wheat. Similarly, Figure 8b and Figure 9 show that the spectral reflectance of the wheat canopy increases after lodging. Additionally, they demonstrate that spectral changes in wheat after lodging during the filling stage of wheat are obvious, which provides a theoretical basis for monitoring lodging areas with high-resolution remote sensing images. As shown in Figure 9, the spectral reflectance of NIR is the highest among the four bands in both non-lodged wheat (0.40) and lodged wheat (0.48). The highest relative rate of increase was observed in the green band, which was approximately 20%.
These variations were related to changes in the canopy structure of wheat after lodging. A possible reason for this phenomenon is that the spikes and leaves of wheat contributed the most to the canopy spectrum before lodging, while the stalk became the main contributor to the canopy spectrum when lodging occurred, which reduced the shielding of the top leaves; thus, the spectral reflectance increased overall [12,40].
The VIs used in this study were calculated from spectral reflectance. Therefore, changes in vegetation spectral reflectance could result in changes in VIs. Figure 10 compares the values of NDVI, GNDVI, EVI, and RVI for lodged and non-lodged wheat. In the case of lodging, the reflectance of four VIs was larger than that of non-lodged wheat. However, no significant reflectance differences were observed between lodged and healthy wheat. In addition, the median and mean values of GNDVI in both cases were close due to the largest relative increase rate in the green band.
The encoder–decoder structure was used as the baseline model (BM) in the study. Four Vis mentioned above are added into BM separately to generate four models listed in Table 4. These four models were compared with the BM to further demonstrate the influence of Vis on the model. The results in Table 4 show that the performance of the model improved because the four Vis changed after wheat lodging, which implies that new features were introduced into the model. The sensitivity of wheat lodging increased the most when NDVI was used instead of the other three VIs, with an IoU and F1 score of 73.97% and 85.04%, respectively. GNDVI had the least effects on the improved model performance, which may be related to the fact that its values did not change significantly.

4.2. Influence of Various Edge Operators on Model Performance

Edge operators can extract edge features due to the discontinuity of adjacent pixels [46,47]. Obvious edges were generated after wheat lodging. Figure 11 shows the edge features extracted by the Scharr, Prewitt, and Roberts operators. It can be observed that the edges extracted by the Roberts operator are incomplete with respect to a few details. Edges extracted by the Scharr operator have many details but thay are not sufficiently clear.
The Roberts operator adopts the difference between two adjacent pixels in the diagonal direction, which is simple to implement but leads to some functional limitations. For example, it cannot effectively detect edges at 45°, 90°, and 135°, resulting in lower details in the edge’s features than the other two operators. Unlike the 2 × 2 filters used in the Roberts operator, the Prewitt operator uses 3 × 3 filters to calculate the pixels in the region of the kernel. Therefore, the edge detection effect of the Prewitt operator is superior to that of the Roberts operator in horizontal and vertical directions. The edges detected by the Scharr operator were thick, and there were some false edges. Although the weights of adjacent pixels of the Scharr operator are large enough to compute small gradient changes, they may cause the Scharr operator to extract too many edges.
Table 5 presents the test results for each of the three edge operators added to the BM and compares them with the test results of the BM. The results reveal that the addition of three edge operators can effectively improve the segmentation performance of the proposed model, with the Prewitt operator providing the most significant improvement in segmentation performances, followed by the Roberts operator.
According to Section 4.1, NDVI is the best VI among the four VIs regarding the improvement of wheat lodging detection performance using segmentation model. Therefore, the BM + NDVI model was taken as comparison model. Table 6 shows that three edge operators were added to each of the BM + NDVI models, and the test results were compared with those of the BM + NDVI model. The results indicate that the introduction of an edge operator to the BM + NDVI model improves the segmentation’s performance. The Prewitt operator still has the greatest effect. Hence, the BM + NDVI + Prewitt model was used as the final segmentation model, and the PTCNet model refers to this model in later sections.

4.3. Segmentation Result Comparison among Different Semantic Segmentation Networks

Figure 12a shows the changes in the IOU of wheat lodging areas and the loss function values for each model according to the number of epochs. As shown in Figure 12a, in previous epochs of each model, the IOU of the wheat lodging areas ascended abruptly and the loss value descended quickly. The network remained stable as the number of training epochs increased. The learning rate of each model decayed gradually with an increase in iterations due to the learning rate scheduler. As shown in Figure 12a–c, although all curves fluctuated slightly after the 175th epoch, the wheat lodging IOU, overall accuracy, and loss function values of each model remained stable. As shown in Figure 12a–c, PTCNet achieved the highest wheat lodging IOU, the highest overall accuracy, and the lowest loss function values, which are 83.46%, 96.47%, and 0.09, respectively. The wheat lodging IoU of the PTCNet model was 14.01, 8.38, 6.53, and 4.49% higher than that of SegNet [43], PSPNet [44], FPN [45], and DeepLab v3+ [38], respectively. The loss function values of the PTCNet model were 0.093, 0.042, 0.036, and 0.036 lower than those of SegNet, PSPNet, FPN, and DeepLab v3+, respectively. This reveals that PTCNet has a better segmentation performance than the other networks. Figure 12d shows that both the training loss and validation loss converged and the difference between them is small, which demonstrates that a high fitting goodness is achieved by PTCNet.
To further validate the actual segmentation effect of the proposed method, evaluations were conducted on a test set consisting of 500 images with a size of 256 × 256 pixels. Figure 13 shows visual segmentation results for the five models mentioned above. The original images, ground truth, and visualized segmentation results are demonstrated from left to right in Figure 13. The results of SegNet, PSPNet, FPN, DeepLab v3+, and PTCNet are shown in Figure 13c–g, respectively. As illustrated in Figure 13, the segmentation effects of the above networks are good for large lodging areas. However, PSPNet and SegNet cannot extract the details of the boundaries between lodging areas and normal areas. SegNet could not discriminate between wheat fields. The detection performance of wheat lodging boundaries by PTCNet is the most consistent with the ground truth among these five models, which is probably related to the edge operator module used in the model. Moreover, PTCNet was more sensitive to spotted and punctate lodging areas than the other networks.
Compared to the upsampling process, which uses bilinear interpolation and un-pooling operations, transposed convolution was used for upsampling in this study, because parameters of transposed convolution are learnable [48].
The joint usage of edge features and multi-scale high-level features makes PTCNet sensitive to the extraction of lodging areas. In the prediction of the test images in Figure 13, it is evident that PTCNet had a superior prediction effect than SegNet, PSPNet, FPN, and DeepLab v3+ in terms of edge information. Xception was used as the primary feature extractor in the PTCNet model, and transposed convolution was used to restore the size of the feature map to make use of the multi-scaled features of images for segmentation.
Notably, metric values of segmentation are highlighted for the result and discussion in Table 7. PTCNet had the highest wheat lodging IOU and highest F1 score (74.38% and 85.31%, respectively), as shown in Table 7. The results indicated that the PTCNet had the best identification performance for wheat lodging compared with other networks, for example, SegNet, PSPNet, DeepLabv3+, and FPN.

4.4. Ablation Experiments

Ablation experiments were conducted on the test dataset to validate the effectiveness of the VI and edge operator module proposed in this study. The evaluation indicators, that is, the F1 score and IoU value of the wheat and wheat lodging categories, are provided in Table 8.
As shown in Table 8, the combination of the VI and edge operator module has a positive effect on the segmentation results of the network. The IoU of wheat lodging improved from 73.72% to 73.97% when NDVI was combined with the BM. The IoU of wheat lodging increased by 0.58% when the Prewitt operator was used in the BM. This reveals that compared with VI, the edge operator module makes the network more effective in wheat lodging identification. The wheat and wheat lodging IoU on the test dataset increased from 91.64% and 73.72% to 91.70% and 74.38%, respectively, using VI and edge feature extraction modules simultaneously. The results of ablation studies proved that the effectiveness of multiple feature combinations can improve the segmentation accuracy of wheat lodging.

4.5. Generalization Ability Test

To verify the generalizability of the PTCNet model proposed in this study, UAV images collected over the study area were selected as the dataset for wheat lodging areas extraction. UAV images were divided into training and testing datasets. The images were trained by loading the trained PTCNet model by using a finetuning method, and a target model was obtained. A generalization ability test was then performed on the test dataset using the target model. The test results are shown in Figure 14.
It can be observed from Figure 14 that PTCNet has a great generalization ability in UAV images. However, the issues of false alarm and leak alarm rate still exist. For example, in the first and third rows of Figure 14, the PTCNet model is not particularly accurate in extracting the boundaries of lodged and non-lodged wheat; in the second row of Figure 14, the PTCNet model mistakenly identified part of the tree as wheat.
The test results of the PTCNet model are shown below each row of pictures in Figure 14 to quantitatively analyze its generalization ability. The overall accuracy of the PTCNet model is high, and the low accuracy of the second row of Figure 14 is due to the incorrect classification of trees near the wheat field. The wheat lodging IOU is stable with an accuracy ranging from 74.3% to 84.15% which indicates that the model after finetuning is highly sensitive to lodged wheat.

4.6. Mapping of the Study Area

The northern area of the study area comprises a scenic spot and a few wheat fields, and wheat fields are planted with dwarf wheat, which has good lodging resistance and almost no lodging. In order to make the mapping intuitive and clear, the southern area of the study area was selected as the wheat lodging extraction area. The size of the orthorectified Gaofen-2 image is around 13,000 × 9000 pixels, which is much larger than the 256 × 256 pixels size of patches in the model training. If the size of images is too large, the level of information abstraction will not be high, and calculations become much larger than that of images with small sizes. Therefore, 13,000 × 9000 pixels size images were cropped to 256 × 256 pixels. The same strategy of edge-ignoring prediction in [49] was adopted. In our experiment, the number of edge pixels ignored in the four directions of a patch is 28 pixels. the final size used for stitching is 200 × 200 pixels. In the end, the prediction results of each patch were mosaiced to map the southern part of Zhangji Town. Figure 15 is the distribution map of wheat and wheat lodging in Zhangji Town. It is clear that wheat lodging is more serious in the east and southwest parts than that in other parts.

5. Conclusions

Satellite imagery has a wider width compared with UAV imagery, which can realize a wide range of wheat lodging area identification. According to the characteristics of the satellite imagery, a semantic segmentation network model named PTCNet was proposed in this study for wheat lodging area extraction and detection using low-orbit satellite images with high spatial resolution, which outperformed other networks, such as SegNet, PSPNet, FPN, and DeepLabv3+. The main conclusions of this model are as follows:
(1)
After wheat lodging, the canopy structure changes, resulting in variations of canopy spectral reflectance. VIs also change and show an increasing trend. Therefore, VIs are added to PTCNet, and NDVI improves the performance of the model significantly.
(2)
Obvious boundaries appear between lodged and non-lodged wheat, so edge operators are added to PTCNet to get edge features. After combining dimension-upgrading edge features with advanced features obtained by convolutions, the performance of the model is enhanced, and the Prewitt operator has the greatest effect on the model.
(3)
PTCNet connects multi-scale high-level features with low-level features to improve the segmentation accuracy and enhance the sensitivity of the model to wheat lodging areas. Among several semantic segmentation networks, PTCNet achieves the highest wheat lodging IOU, which is 74.38%.
The results showed that the proposed model can be used to extract the lodging areas of wheat from satellite images. The results of the generalization ability test revealed that PTCNet had a good generalization performance, and it was suitable for the extraction of wheat lodging areas on UAV images. The study also proved the feasibility of using satellite images to identify wheat lodging areas and provided an effective solution for the monitoring of large-scale wheat lodging areas. It should be noted that the evaluation quality of the proposed method would be different in other growth stages due to changes in wheat characteristics. For future work, collecting data at different growth stages is necessary so that the model is suitable for monitoring lodging in the entire growth cycle.

Author Contributions

Conceptualization, Z.T. and Y.S.; methodology, Z.T. and Y.S.; software, Z.T. and S.C.; validation, X.Z., G.W., and H.S.; formal analysis, Z.T.; investigation, S.C. and X.Z.; resources, G.W.; data curation, Z.T.; writing—original draft preparation, Z.T.; writing—review and editing, Y.S., H.S., Y.Z., and K.Z.; visualization, Z.T.; supervision, Y.S.; project administration, Y.S.; funding acquisition, Y.S. All authors have read and agreed to the published version of the manuscript.

Funding

This study was supported by the Xuzhou Key R&D Program (Grant No. KC20181), 2022 Jiangsu Provincial Science and Technology Initiative-Special Fund for International Science and Technology Cooperation (BZ2022018), and the Fundamental Research Funds for the Central Universities (Grant No.2022QN1080).

Acknowledgments

We would like to thank Chaofa Bian for his help during fieldwork data collection.

Conflicts of Interest

The authors declare no conflict of interest.

References

  1. Chauhan, S.; Darvishzadeh, R.; Boschetti, M.; Pepe, M.; Nelson, A. Remote sensing-based crop lodging assessment: Current status and perspectives. Isprs J. Photogramm. 2019, 151, 124–140. [Google Scholar] [CrossRef]
  2. Berry, P.M.; Sterling, M.; Mooney, S.J. Development of a model of lodging for barley. J. Agron Crop. Sci 2006, 192, 151–158. [Google Scholar] [CrossRef]
  3. Zhang, W.J.; Li, G.H.; Yang, Y.M.; Li, Q.; Zhang, J.; Liu, J.Y.; Wang, S.H.; Tang, S.; Ding, Y.F. Effects of Nitrogen Application Rate and Ratio on Lodging Resistance of Super Rice with Different Genotypes. J. Integr. Agr. 2014, 13, 63–72. [Google Scholar] [CrossRef]
  4. Zhao, Y.N.; Huang, Y.F.; Li, S.; Chu, X.; Ye, Y.L. Improving the growth, lodging and yield of different density-resistance maize by optimising planting density and nitrogen fertilisation. Plant Soil Environ. 2020, 66, 453–460. [Google Scholar] [CrossRef]
  5. Berry, P.M.; Sterling, M.; Spink, J.H.; Baker, C.J.; Sylvester-Bradley, R.; Mooney, S.J.; Tams, A.R.; Ennos, A.R. Understanding and Reducing Lodging in Cereals. In Advances in Agronomy Volume 84; FAO: Rome, Italy, 2004; pp. 217–271. [Google Scholar]
  6. Sterling, A.; Baker, C.J.; Berry, P.M.; Wade, A. An experimental investigation of the lodging of wheat. Agr. Forest Meteorol. 2003, 119, 149–165. [Google Scholar] [CrossRef]
  7. Neenan, M.; Smith, J.L.S. An analysis of the problem of lodging with particular reference to wheat and barley. J. Agric. Sci. 1975, 85, 495–507. [Google Scholar] [CrossRef]
  8. Easson, D.L.; White, E.M.; Pickles, S.J. A study of lodging in cereals. In HGCA Project Report; 1992; No. 52; Available online: https://ahdb.org.uk/a-study-of.f-lodging-in-cereals (accessed on 19 August 2022).
  9. Niu, L.Y.; Feng, S.W.; Ding, W.H.; Li, G. Influence of Speed and Rainfall on Large-Scale Wheat Lodging from 2007 to 2014 in China. PLoS ONE 2016, 11, e0157677. [Google Scholar] [CrossRef]
  10. Norberg, O.S.; Mason, S.C.; Lowry, S.R. Ethephon Influence on Harvestable Yield, Grain Quality, and Lodging of Corn. Agron. J. 1988, 80, 768–772. [Google Scholar] [CrossRef]
  11. Setter, T.L.; Laureles, E.V.; Mazaredo, A.M. Lodging reduces yield of rice by self-shading and reductions in canopy photosynthesis. Field Crop. Res. 1997, 49, 95–106. [Google Scholar] [CrossRef]
  12. Berry, P.M.; Spink, J. Predicting yield losses caused by lodging in wheat. Field Crop. Res. 2012, 137, 19–26. [Google Scholar] [CrossRef]
  13. Fischer, R.A.; Stapper, M. Lodging Effects on High-Yielding Crops of Irrigated Semidwarf Wheat. Field Crop. Res. 1987, 17, 245–258. [Google Scholar] [CrossRef]
  14. Sposaro, M.M.; Berry, P.M.; Sterling, M.; Hall, A.J.; Chimenti, C.A. Modelling root and stem lodging in sunflower. Field Crop. Res. 2010, 119, 125–134. [Google Scholar] [CrossRef]
  15. Han, L.; Yang, G.J.; Feng, H.K.; Zhou, C.Q.; Yang, H.; Xu, B.; Li, Z.H.; Yang, X.D. Quantitative Identification of Maize Lodging-Causing Feature Factors Using Unmanned Aerial Vehicle Images and a Nomogram Computation. Remote Sens 2018, 10, 1528. [Google Scholar] [CrossRef]
  16. Yang, B.H.; Zhu, Y.; Zhou, S.J. Accurate Wheat Lodging Extraction from Multi-Channel UAV Images Using a Lightweight Network Model. Sensors 2021, 21, 6826. [Google Scholar] [CrossRef] [PubMed]
  17. Liu, T.; Li, R.; Zhong, X.C.; Jiang, M.; Jin, X.L.; Zhou, P.; Liu, S.P.; Sun, C.M.; Guo, W.S. Estimates of rice lodging using indices derived from UAV visible and thermal infrared images. Agr. Forest Meteorol. 2018, 252, 144–154. [Google Scholar] [CrossRef]
  18. Chauhan, S.; Darvishzadeh, R.; van Delden, S.H.; Boschetti, M.; Nelson, A. Mapping of wheat lodging susceptibility with synthetic aperture radar data. Remote Sens. Environ. 2021, 259, 112427. [Google Scholar] [CrossRef]
  19. Sun, Q.; Gu, X.H.; Chen, L.P.; Xu, X.B.; Pan, Y.C.; Hu, X.Q.; Xu, B. Monitoring rice lodging grade via Sentinel-2A images based on change vector analysis. Int. J. Remote Sens. 2022, 43, 1549–1576. [Google Scholar] [CrossRef]
  20. Wang, J.N.; Li, K.; Shao, Y.; Zhang, F.L.; Wang, Z.Y.; Guo, X.Y.; Qin, Y.; Liu, X.C. Analysis of Combining SAR and Optical Optimal Parameters to Classify Typhoon-Invasion Lodged Rice: A Case Study Using the Random Forest Method. Sensors 2020, 20, 7346. [Google Scholar] [CrossRef]
  21. Zhou, L.F.; Gu, X.H.; Cheng, S.; Yang, G.J.; Shu, M.Y.; Sun, Q. Analysis of Plant Height Changes of Lodged Maize Using UAV-LiDAR Data. Agriculture 2020, 10, 146. [Google Scholar] [CrossRef]
  22. Murakami, T.; Yui, M.; Amaha, K. Canopy height measurement by photogrammetric analysis of aerial images: Application to buckwheat (Fagopyrum esculentum Moench) lodging evaluation. Comput. Electron. Agr. 2012, 89, 70–75. [Google Scholar] [CrossRef]
  23. Cao, W.X.; Qiao, Z.Y.; Gao, Z.Y.; Lu, S.H.; Tian, F. Use of unmanned aerial vehicle imagery and a hybrid algorithm combining a watershed algorithm and adaptive threshold segmentation to extract wheat lodging. Phys. Chem. Earth 2021, 123, 3016. [Google Scholar] [CrossRef]
  24. Rajapaksa, S.; Eramian, M.; Duddu, H.; Wang, M.L.; Shirtliffe, S.; Ryu, S.; Josuttes, A.; Zhang, T.; Vail, S.; Pozniak, C.; et al. Classification of Crop Lodging with Gray Level Co-occurrence Matrix. IEEE Wint. Conf. Appl. 2018, 2018, 251–258. [Google Scholar] [CrossRef]
  25. Liu, H.Y.; Yang, G.J.; Zhu, H.C. The Extraction of Wheat Lodging Area in UAV’s Image Used Spectral and Texture Features. Appl. Mech. Mater. 2014, 651, 2390–2393. [Google Scholar]
  26. Guan, H.X.; Liu, H.J.; Meng, X.T.; Luo, C.; Bao, Y.L.; Ma, Y.Y.; Yu, Z.Y.; Zhang, X.L. A Quantitative Monitoring Method for Determining Maize Lodging in Different Growth Stages. Remote Sens. 2020, 12, 3149. [Google Scholar] [CrossRef]
  27. Tian, M.L.; Ban, S.T.; Yuan, T.; Ji, Y.B.; Ma, C.; Li, L.Y. Assessing rice lodging using UAV visible and multispectral image. Int. J. Remote Sens. 2021, 42, 8840–8857. [Google Scholar] [CrossRef]
  28. Wang, J.J.; Ge, H.; Dai, Q.G.; Ahmad, I.; Dai, Q.X.; Zhou, G.S.; Qin, M.R.; Gu, C.H. Unsupervised discrimination between lodged and non-lodged winter wheat: A case study using a low-cost unmanned aerial vehicle. Int. J. Remote Sens. 2018, 39, 2079–2088. [Google Scholar] [CrossRef]
  29. Chauhan, S.; Darvishzadeh, R.; Lu, Y.; Stroppiana, D.; Boschetti, M.; Pepe, M.; Nelson, A. Wheat Lodging Assessment Using Multispectral Uav Data. Int. Arch. Photogramm. Remote Sens. Spat. Inf. Sci. 2019, XLII-2/W13, 235–240. [Google Scholar] [CrossRef]
  30. Zhang, Z.; Flores, P.; Igathinathane, C.; Naik, D.L.; Kiran, R.; Ransom, J.K. Wheat Lodging Detection from UAS Imagery Using Machine Learning Algorithms. Remote Sens. 2020, 12, 1838. [Google Scholar] [CrossRef]
  31. Zhou, L.F.; Cheng, S.; Sun, Q.; Gu, X.H.; Yang, G.J.; Shu, M.Y.; Feng, H.K. Remote sensing of regional-scale maize lodging using multitemporal GF-1 images. J. Appl. Remote Sens. 2020, 14, 014514. [Google Scholar] [CrossRef]
  32. Chakraborty, A.; Srikanth, P.; Murthy, C.S.; Rao, P.V.N.; Chowdhury, S. Assessing lodging damage of jute crop due to super cyclone Amphan using multi-temporal Sentinel-1 and Sentinel-2 data over parts of West Bengal, India. Environ. Monit. Assess. 2021, 193, 464. [Google Scholar] [CrossRef]
  33. Chauhan, S.; Darvishzadeh, R.; Lu, Y.; Boschetti, M.; Nelson, A. Understanding wheat lodging using multi-temporal Sentinel-1 and Sentinel-2 data. Remote Sens. Environ. 2020, 243, 111804. [Google Scholar] [CrossRef]
  34. Yang, M.D.; Tseng, H.H.; Hsu, Y.C.; Tsai, H.P. Semantic Segmentation Using Deep Learning with Vegetation Indices for Rice Lodging Identification in Multi-date UAV Visible Images. Remote Sens. 2020, 12, 633. [Google Scholar] [CrossRef]
  35. Zhang, D.Y.; Ding, Y.; Chen, P.F.; Zhang, X.Q.; Pan, Z.G.; Liang, D. Automatic extraction of wheat lodging area based on transfer learning method and deeplabv3+network. Comput. Electron. Agr. 2020, 179, 105845. [Google Scholar] [CrossRef]
  36. Song, Z.S.; Zhang, Z.T.; Yang, S.Q.; Ding, D.Y.; Ning, J.F. Identifying sunflower lodging based on image fusion and deep semantic segmentation with UAV remote sensing imaging. Comput. Electron. Agr. 2020, 179, 105812. [Google Scholar] [CrossRef]
  37. Su, Z.B.; Wang, Y.; Xu, Q.; Gao, R.; Kong, Q.M. LodgeNet: Improved rice lodging recognition using semantic segmentation of UAV high-resolution remote sensing images. Comput. Electron. Agr 2022, 196, 106873. [Google Scholar] [CrossRef]
  38. Chen, L.C.E.; Zhu, Y.K.; Papandreou, G.; Schroff, F.; Adam, H. Encoder-Decoder with Atrous Separable Convolution for Semantic Image Segmentation. Lect. Notes Comput. Sci. 2018, 11211, 833–851. [Google Scholar] [CrossRef]
  39. Hu, Z.; Zhang, J.; Wang, Z. Spectral Variation Characteristics of Wheat Lodging in the Filling Period. J. Anhui Agri. Sci. 2011, 39, 3190–3192. [Google Scholar] [CrossRef]
  40. Liu, L.; Wang, J.; Song, X. The Canopy Spectral Features and Remote Sensing of Wheat Lodging. Natl. Remote Sens. Bull. 2005, 9, 323–327. [Google Scholar]
  41. Sun, Q.; Gu, X.H.; Chen, L.P.; Xu, X.B.; Wei, Z.H.; Pan, Y.C.; Gao, Y.B. Monitoring maize canopy chlorophyll density under lodging stress based on UAV hyperspectral imagery. Comput. Electron. Agr. 2022, 193, 106671. [Google Scholar] [CrossRef]
  42. Li, X.Y.; Sun, X.F.; Meng, Y.X.; Liang, J.J.; Wu, F.; Li, J.W. Dice Loss for Data-imbalanced NLP Tasks. In Proceedings of the 58th Annual Meeting of the Association for Computational Linguistics (Acl 2020), Stroudsburg, PA, USA, 5 July 2020; pp. 465–476. [Google Scholar] [CrossRef]
  43. Badrinarayanan, V.; Kendall, A.; Cipolla, R. SegNet: A Deep Convolutional Encoder-Decoder Architecture for Image Segmentation. IEEE Trans. Pattern Anal. 2017, 39, 2481–2495. [Google Scholar] [CrossRef]
  44. Zhao, H.S.; Shi, J.P.; Qi, X.J.; Wang, X.G.; Jia, J.Y. Pyramid Scene Parsing Network. Proc. Cvpr. IEEE 2017, 6230–6239. [Google Scholar] [CrossRef] [Green Version]
  45. Lin, T.Y.; Dollar, P.; Girshick, R.; He, K.M.; Hariharan, B.; Belongie, S. Feature Pyramid Networks for Object Detection. Proc. Cvpr. IEEE 2017, 7. [Google Scholar] [CrossRef]
  46. Hoang, N.D.; Nguyen, Q.L. Metaheuristic Optimized Edge Detection for Recognition of Concrete Wall Cracks: A Comparative Study on the Performances of Roberts, Prewitt, Canny, and Sobel Algorithms. Adv. Civ. Eng. 2018, 2018, 7163580. [Google Scholar] [CrossRef]
  47. Dorafshan, S.; Thomas, R.J.; Maguire, M. Comparison of deep convolutional neural networks and edge detectors for image-based crack detection in concrete. Constr. Build. Mater. 2018, 186, 1031–1045. [Google Scholar] [CrossRef]
  48. Lu, Y.; Zhou, Y.; Jiang, Z.Q.; Guo, X.Q.; Yang, Z.X. Channel Attention and Multi-level Features Fusion for Single Image Super-Resolution. In Proceedings of the 2018 IEEE International Conference on Visual Communications and Image Processing (Ieee Vcip), Taichung, Taiwan, 9–12 December 2018. [Google Scholar]
  49. Zhang, X.P.; Cheng, B.; Chen, J.F.; Liang, C.B. High-Resolution Boundary Refined Convolutional Neural Network for Automatic Agricultural Greenhouses Extraction from GaoFen-2 Satellite Imageries. Remote Sens. 2021, 13, 4237. [Google Scholar] [CrossRef]
Figure 1. Illustration of the study area: (a) administrative regions of Jiangsu Province and Xuzhou City; (b) administrative regions of Zhangji Town and the distribution of wheat cultivation; (c) typical wheat lodging areas.
Remotesensing 14 04887 g001
Figure 2. Workflow of satellite image preprocessing.
Remotesensing 14 04887 g002
Figure 3. Illustration of the labeled ground truth on the satellite image.
Remotesensing 14 04887 g003
Figure 4. Illustration of UAV dataset of lodged and non-lodged wheat.
Remotesensing 14 04887 g004
Figure 5. Flowchart of wheat lodging extraction.
Remotesensing 14 04887 g005
Figure 6. PTCNet architecture: (a) model structure of PTCNet; (b) structure of PTC module; (c) workflow of PTC module.
Remotesensing 14 04887 g006
Figure 7. Workflow of k-fold cross validation.
Remotesensing 14 04887 g007
Figure 8. Changes in spectral reflectance of each band: (a) histogram of spectral reflectance in four bands; (b) mean spectral reflectance change within each band and wheat lodging conditions.
Remotesensing 14 04887 g008
Figure 9. Increment of spectral reflectance of lodged wheat in each band, and relative increase rate of spectral reflectance of each band.
Remotesensing 14 04887 g009
Figure 10. Boxplots of four types of vegetation indexes across lodged and non-lodged wheat: (a) NDVI; (b) GNDVI; (c) EVI; (d) RVI. The orange line indicates the median, the red point represents the mean value, and the top and bottom edges of the box represent the upper quartile and lower quartile, respectively.
Remotesensing 14 04887 g010
Figure 11. Edge detection results: (a) original image; (b) results of the Scharr operator; (c) results of the Prewitt operator; (d) results of the Roberts operator.
Remotesensing 14 04887 g011
Figure 12. Training effect comparison of PTCNet and other models during training process: (a) wheat lodging IoU; (b) loss value; (c) overall accuracy; (d) training loss and validation loss of PTCNet.
Remotesensing 14 04887 g012
Figure 13. Segmentation results comparison on the test dataset: (a) original image in test dataset; (b) ground truth; (c) SegNet; (d) PSPNet; (e) FPN; (f) DeepLabv3+; (g) PTCNet.
Remotesensing 14 04887 g013
Figure 14. (a) Original UAV image; (b) ground truth; (c) segmentation results from the PTCNet.
Remotesensing 14 04887 g014
Figure 15. The distribution map of lodged and non-lodged wheat in the southern area of Zhangji Town.
Remotesensing 14 04887 g015
Table 1. Attributes of the GF-2 satellite images.
ParametersPanchromatic ImagesMultispectral Images
Spectral range0.45–0.90 μm0.45–0.52 μm
0.52–0.59 μm
0.63–0.69 μm
0.77–0.89 μm
Spatial resolution1 m4 m
Revisit period5 days
Image width>45 km
Average orbit altitude631 km
Table 2. Formulae of vegetation indices.
Vegetation IndicesFormulae
NDVI N D V I = N I R R N I R + R
GNDVI G N D V I = N I R G N I R + G
EVI E V I = 2.5 × N I R R N I R + 6 × R 7.5 × B + 1
RVI R V I = N I R R
Table 3. Evaluation indicators and formulae.
Vegetation IndicesFormulae
Precision P r e c i s i o n = T P T P + F P
Recall R e c a l l = T P T P + F N
F1 score F 1 = 2 × P r e c i s i o n × R e c a l l P r e c i s i o n + R e c a l l
OA O A = T P + T N T P + T N + F P + F N
IoU I O U = T P T P + F N + F P
mIoU m I O U = i n I O U n
Table 4. Segmentation results comparison of using different VIs on the test dataset.
ModelIndexWheat (%)Wheat Lodging (%)
BMF195.6484.87
IoU91.6473.72
BM + NDVIF195.6685.04
IoU91.6873.97
BM + EVIF195.6784.99
IoU91.7173.90
BM + RVIF195.7284.97
IoU91.7973.88
BM + GNDVIF195.6284.80
IoU91.6073.83
Table 5. Segmentation results comparison of using different edge operators on the test dataset.
ModelIndexWheat (%)Wheat Lodging (%)
BMF195.6484.87
IoU91.6473.72
BM + ScharrF195.6585.08
IoU91.6674.04
BM + RobertsF195.6885.15
IoU91.7174.15
BM + PrewittF195.7285.26
IoU91.8074.30
Table 6. Segmentation results comparison of using different edge operators with NDVI on the test dataset.
ModelIndexWheat (%)Wheat Lodging (%)
BM + NDVIF195.6684.04
IoU91.6873.97
BM + NDVI + ScharrF195.6685.12
IoU91.6874.10
BM + NDVI + RobertsF195.7985.15
IoU91.9274.14
BM + NDVI + PrewittF195.6785.31
IoU91.7074.38
Table 7. Segmentation results in comparison of different networks on the test dataset.
ModelIndexWheat (%)Wheat Lodging (%)
SegNetF194.5381.57
IoU89.6468.89
PSPNetF195.8682.48
IoU92.0570.18
DeepLabv3+F195.2182.99
IoU90.8570.93
FPNF195.6984.01
IoU91.7372.44
PTCNetF195.6785.31
IoU91.7074.38
Table 8. Segmentation results of the ablation study.
ModelIndexWheat (%)Wheat Lodging (%)
BMF195.6484.87
IoU91.6473.72
BM + NDVIF195.6685.04
IoU91.6873.97
BM + PrewittF195.7285.26
IoU91.8074.30
BM + NDVI + PrewittF195.6785.31
IoU91.7074.38
Publisher’s Note: MDPI stays neutral with regard to jurisdictional claims in published maps and institutional affiliations.

