

Activity and Kinematics of Two Adjacent Freeze–Thaw-Related Landslides Revealed by Multisource Remote Sensing of Qilian Mountain

 ,
,  , , ,
, , ,
Abstract
:1. Introduction
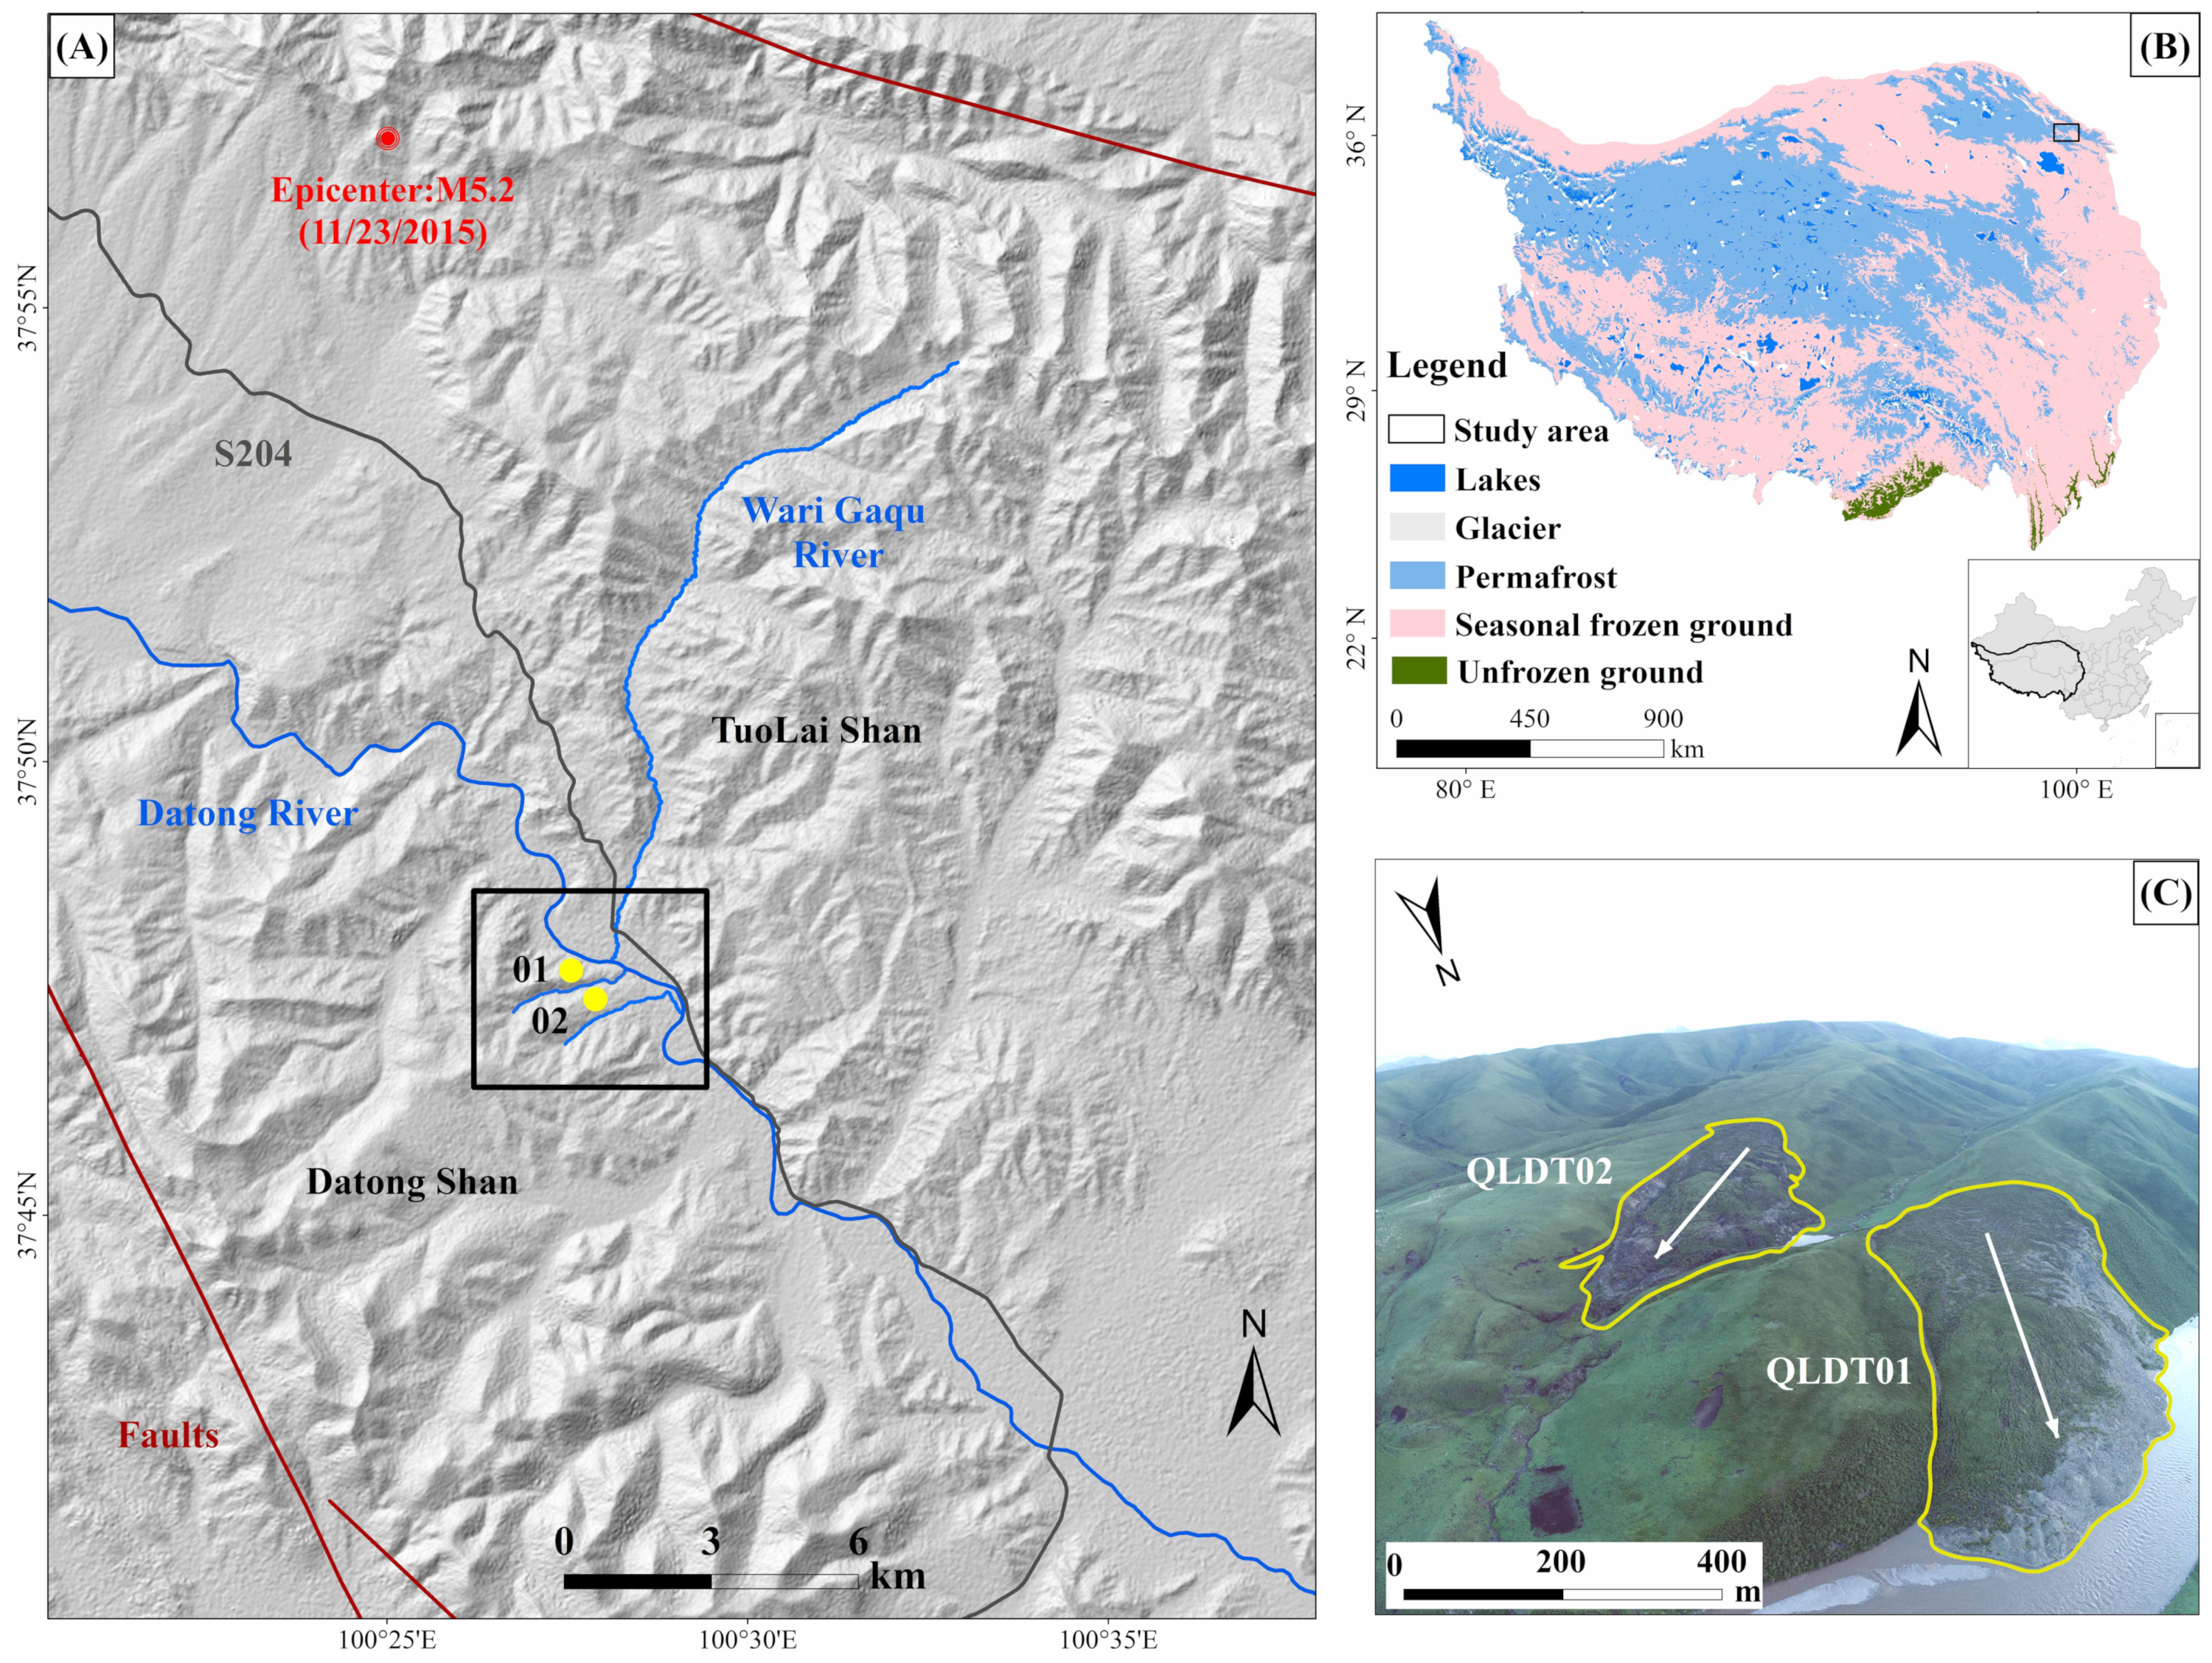
2. Study Area
3. Data and Methods
3.1. Data Sources
3.2. Mapping of Twin Landslides from Optical Remote Sensing
3.3. InSAR for Ground Deformation Monitoring
3.4. Climatic Factors
3.5. Risk Assessment
4. Results
4.1. Spatiotemporal Variations of the Twin Landslides
4.2. InSAR-Derived Downslope Movement of the Twin Landslides
5. Discussion
5.1. Triggering Mechanisms
5.1.1. Precipitation
5.1.2. Freeze–Thaw Processes
5.1.3. Other Triggering Factors
5.2. Hazard Analysis
6. Conclusions
- 1.
- The occurrence and development of the twin landslides and the adjacent river bank have been determined using high-resolution optical and radar images.
- 2.
- Significant downslope movements are observed within the twin landslides (up to 15 mm/day) and their surrounding slopes (up to 5 mm/day). The downslope movement exhibits distinct seasonality. During February-early July, the downslope velocity is nearly inactive; during late July-next January, mean velocity of about 4 mm/day is observed. The seasonality of downslope movement during both pre- and post-failure stages suggests that the occurrence and development of the twin landslide are strongly influenced by freeze–thaw processes.
- 3.
- Combining data on precipitation, air temperature, and InSAR-based deformation history, we infer that the occurrence of the twin landslides is mainly related to extensive precipitation, warm winters, and freeze–thaw processes.
- 4.
- From the UAV-based geomorphological features, InSAR-derived downslope movements, and dimensionless blockage index, we infer that new collapse and slope failure events may occur within the twin landslides and their surroundings, which may completely block the Datong River and cause a catastrophic disaster.
Author Contributions
Funding
Data Availability Statement
Conflicts of Interest
References
- Highland, L.; Bobrowsky, P.T. The Landslide Handbook: A Guide to Understanding Landslides; US Geological Survey: Reston, VA, USA, 2008.
- Anbalagan, R. Landslide hazard evaluation and zonation mapping in mountainous terrain. Eng. Geol. 1992, 32, 269–277. [Google Scholar] [CrossRef]
- Patton, A.I.; Rathburn, S.L.; Capps, D.M. Landslide response to climate change in permafrost regions. Geomorphology 2019, 340, 116–128. [Google Scholar] [CrossRef]
- Gariano, S.L.; Guzzetti, F. Landslides in a changing climate. Earth-Sci. Rev. 2016, 162, 227–252. [Google Scholar] [CrossRef] [Green Version]
- Lantz, T.C.; Kokelj, S.V. Increasing rates of retrogressive thaw slump activity in the Mackenzie Delta region, N.W.T., Canada. Geophys. Res. Lett. 2008, 35, L06502. [Google Scholar] [CrossRef]
- Segal, R.A.; Lantz, T.C.; Kokelj, S.V. Acceleration of thaw slump activity in glaciated landscapes of the Western Canadian Arctic. Environ. Res. Lett. 2016, 11, 034025. [Google Scholar] [CrossRef]
- Ward Jones, M.K.; Pollard, W.H.; Jones, B.M. Rapid initialization of retrogressive thaw slumps in the Canadian high Arctic and their response to climate and terrain factors. Environ. Res. Lett. 2019, 14, 055006. [Google Scholar] [CrossRef]
- Lewkowicz, A.G.; Way, R.G. Extremes of summer climate trigger thousands of thermokarst landslides in a High Arctic environment. Nat. Commun. 2019, 10, 1329. [Google Scholar] [CrossRef] [Green Version]
- Huang, L.; Luo, J.; Lin, Z.; Niu, F.; Liu, L. Using deep learning to map retrogressive thaw slumps in the Beiluhe region (Tibetan Plateau) from CubeSat images. Remote Sens. Environ. 2020, 237, 111534. [Google Scholar] [CrossRef]
- Mu, C.; Shang, J.; Zhang, T.; Fan, C.; Wang, S.; Peng, X.; Zhong, W.; Zhang, F.; Mu, M.; Jia, L. Acceleration of thaw slump during 1997–2017 in the Qilian Mountains of the northern Qinghai-Tibetan plateau. Landslides 2020, 17, 1051–1062. [Google Scholar] [CrossRef]
- Luo, J.; Niu, F.; Lin, Z.; Liu, M.; Yin, G. Recent acceleration of thaw slumping in permafrost terrain of Qinghai-Tibet Plateau: An example from the Beiluhe Region. Geomorphology 2019, 341, 79–85. [Google Scholar] [CrossRef]
- Farquharson, L.M.; Romanovsky, V.E.; Cable, W.L.; Walker, D.A.; Kokelj, S.V.; Nicolsky, D.D. Climate Change Drives Widespread and Rapid Thermokarst Development in Very Cold Permafrost in the Canadian High Arctic. Geophys. Res. Lett. 2019, 46, 6681–6689. [Google Scholar] [CrossRef] [Green Version]
- Mondini, A.C.; Guzzetti, F.; Chang, K.T.; Monserrat, O.; Martha, T.R.; Manconi, A. Landslide failures detection and mapping using Synthetic Aperture Radar: Past, present and future. Earth-Sci. Rev. 2021, 216, 103574. [Google Scholar] [CrossRef]
- Zhao, D.; Qu, C.; Shan, X.; Zuo, R.; Liu, Y.; Gong, W.; Zhang, G. Broadscale postseismic deformation and lower crustal relaxation in the central Bayankala Block (central Tibetan Plateau) observed using InSAR data. J. Asian Earth Sci. 2018, 154, 26–41. [Google Scholar] [CrossRef]
- Guzzetti, F.; Mondini, A.C.; Cardinali, M.; Fiorucci, F.; Santangelo, M.; Chang, K.T. Landslide inventory maps: New tools for an old problem. Earth-Sci. Rev. 2012, 112, 42–66. [Google Scholar] [CrossRef] [Green Version]
- Martha, T.R.; Kerle, N.; Van Westen, C.J.; Jetten, V.; Kumar, K.V. Segment optimization and data-driven thresholding for knowledge-based landslide detection by object-based image analysis. IEEE Trans. Geosci. Remote Sens. 2011, 49, 4928–4943. [Google Scholar] [CrossRef]
- Hölbling, D.; Füreder, P.; Antolini, F.; Cigna, F.; Casagli, N.; Lang, S. A Semi-Automated Object-Based Approach for Landslide Detection Validated by Persistent Scatterer Interferometry Measures and Landslide Inventories. Remote Sens. 2012, 4, 1310–1336. [Google Scholar] [CrossRef] [Green Version]
- Lu, P.; Stumpf, A.; Kerle, N.; Casagli, N. Object-oriented change detection for landslide rapid mapping. IEEE Geosci. Remote Sens. Lett. 2011, 8, 701–705. [Google Scholar] [CrossRef]
- Catani, F. Landslide detection by deep learning of non-nadiral and crowdsourced optical images. Landslides 2021, 18, 1025–1044. [Google Scholar] [CrossRef]
- Booth, A.M.; McCarley, J.; Hinkle, J.; Shaw, S.; Ampuero, J.; Lamb, M.P. Transient reactivation of a deep-seated landslide by undrained loading captured with repeat airborne and terrestrial lidar. Geophys. Res. Lett. 2018, 45, 4841–4850. [Google Scholar] [CrossRef] [Green Version]
- Rossi, G.; Tanteri, L.; Tofani, V.; Vannocci, P.; Moretti, S.; Casagli, N. Multitemporal UAV surveys for landslide mapping and characterization. Landslides 2018, 15, 1045–1052. [Google Scholar] [CrossRef]
- Niethammer, U.; James, M.R.; Rothmund, S.; Travelletti, J.; Joswig, M. UAV-based remote sensing of the Super-Sauze landslide: Evaluation and results. Eng. Geol. 2012, 128, 2–11. [Google Scholar] [CrossRef]
- Bernhard, P.; Zwieback, S.; Leinss, S.; Hajinsek, I. Mapping retrogressive thaw slumps using single-pass TanDEM-X observations. IEEE J. Sel. Top. Appl. Earth Obs. Remote. Sens. 2020, 13, 3263–3280. [Google Scholar] [CrossRef]
- Bernhard, P.; Zwieback, S.; Bergner, N.; Hajnsek, I. Assessing volumetric change distributions and scaling relations of retrogressive thaw slumps across the Arctic. Cryosphere 2022, 16, 1–15. [Google Scholar] [CrossRef]
- Colesanti, C.; Ferretti, A.; Prati, C.; Rocca, F. Monitoring landslides and tectonic motions with the Permanent Scatterers Technique. Eng. Geol. 2003, 68, 3–14. [Google Scholar] [CrossRef]
- Strozzi, T.; Delaloye, R.; Kääb, A.; Ambrosi, C.; Perruchoud, E.; Wegmüller, U. Combined observations of rock mass movements using satellite SAR interferometry, differential GPS, airborne digital photogrammetry, and airborne photography interpretation. J. Geophys. Res. Earth Surf. 2010, 115. [Google Scholar] [CrossRef] [Green Version]
- Hu, X.; Bürgmann, R.; Schulz, W.H.; Fielding, E.J. Four-dimensional surface motions of the Slumgullion landslide and quantification of hydrometeorological forcing. Nat. Commun. 2020, 11, 2792. [Google Scholar] [CrossRef]
- Bekaert, D.P.; Handwerger, A.L.; Agram, P.; Kirschbaum, D.B. InSAR-based detection method for mapping and monitoring slow-moving landslides in remote regions with steep and mountainous terrain: An application to Nepal. Remote Sens. Environ. 2020, 249, 111983. [Google Scholar] [CrossRef]
- Meng, Q.; Li, W.; Raspini, F.; Xu, Q.; Peng, Y.; Ju, Y.; Zheng, Y.; Casagli, N. Time-series analysis of the evolution of large-scale loess landslides using InSAR and UAV photogrammetry techniques: A case study in Hongheyan, Gansu Province, Northwest China. Landslides 2020, 18, 251–265. [Google Scholar] [CrossRef]
- Xie, M.; Zhao, W.; Ju, N.; He, C.; Huang, H.; Cui, Q. Landslide evolution assessment based on InSAR and real-time monitoring of a large reactivated landslide, Wenchuan, China. Eng. Geol. 2020, 277, 105781. [Google Scholar] [CrossRef]
- Zhu, Y.; Qiu, H.; Yang, D.; Liu, Z.; Ma, S.; Pei, Y.; He, J.; Du, C.; Sun, H. Pre- and post-failure spatiotemporal evolution of loess landslides: A case study of the Jiangou landslide in Ledu, China. Landslides 2021, 18, 3475–3484. [Google Scholar] [CrossRef]
- Eker, R.; Aydın, A. Long-term retrospective investigation of a large, deep-seated, and slow-moving landslide using InSAR time series, historical aerial photographs, and UAV data: The case of Devrek landslide (NW Turkey). Catena 2021, 196, 104895. [Google Scholar] [CrossRef]
- Cao, C.; Zhu, K.; Xu, P.; Shan, B.; Yang, G.; Song, S. Refined landslide susceptibility analysis based on InSAR technology and UAV multi-source data. J. Clean. Prod. 2022, 368, 133146. [Google Scholar] [CrossRef]
- Meng, Q.; Intrieri, E.; Raspini, F.; Peng, Y.; Liu, H.; Casagli, N. Satellite-based interferometric monitoring of deformation characteristics and their relationship with internal hydrothermal structures of an earthflow in Zhimei, Yushu, Qinghai-Tibet Plateau. Remote Sens. Environ. 2022, 273, 112987. [Google Scholar] [CrossRef]
- Zou, D.; Zhao, L.; Sheng, Y.; Chen, J.; Hu, G.; Wu, T.; Wu, J.; Xie, C.; Wu, X.; Pang, Q.; et al. A new map of permafrost distribution on the Tibetan Plateau. Cryosphere 2017, 11, 2527–2542. [Google Scholar] [CrossRef] [Green Version]
- Wang, Q.; Jin, H.; Zhang, T.; Cao, B.; Peng, X.; Wang, K.; Xiao, X.; Guo, H.; Mu, C.; Li, L. Hydro-thermal processes and thermal offsets of peat soils in the active layer in an alpine permafrost region, NE Qinghai-Tibet plateau. Glob. Planet. Chang. 2017, 156, 1–12. [Google Scholar] [CrossRef]
- Chen, R.; Han, C.; Liu, J.; Yang, Y.; Liu, Z.; Wang, L.; Kang, E. Maximum precipitation altitude on the northern flank of the Qilian Mountains, northwest China. Hydrol. Res. 2018, 49, 1696–1710. [Google Scholar] [CrossRef]
- Liu, J.; Chen, R. Discriminating types of precipitation in Qilian Mountains, Tibetan Plateau. J. Hydrol. Reg. Stud. 2016, 5, 20–32. [Google Scholar] [CrossRef] [Green Version]
- Rignot, E.; Echelmeyer, K.; Krabill, W. Penetration depth of interferometric synthetic-aperture radar signals in snow and ice. Geophys. Res. Lett. 2001, 28, 3501–3504. [Google Scholar] [CrossRef] [Green Version]
- Zebker, H.; Shankar, P.; Hooper, A. InSAR remote sensing over decorrelating terrains: Persistent scattering methods. In Proceedings of the 2007 IEEE Radar Conference, Waltham, MA, USA, 17–20 April 2007; pp. 717–722. [Google Scholar]
- Malamud, B.D.; Turcotte, D.L.; Guzzetti, F.; Reichenbach, P. Landslide inventories and their statistical properties. Earth Surf. Process. Landforms 2004, 29, 687–711. [Google Scholar] [CrossRef]
- Stumpf, A.; Malet, J.P.; Delacourt, C. Correlation of satellite image time-series for the detection and monitoring of slow-moving landslides. Remote Sens. Environ. 2017, 189, 40–55. [Google Scholar] [CrossRef]
- Fan, X.; Xu, Q.; Alonso-Rodriguez, A.; Subramanian, S.S.; Li, W.; Zheng, G.; Dong, X.; Huang, R. Successive landsliding and damming of the Jinsha River in eastern Tibet, China: Prime investigation, early warning, and emergency response. Landslides 2019, 16, 1003–1020. [Google Scholar] [CrossRef]
- Rosen, P.A.; Hensley, S.; Joughin, I.R.; Fuk, K.L.; Madsen, S.N.; Rodriguez, E.; Goldstein, R.M. Synthetic aperture radar interferometry. Proc. IEEE 2000, 88, 333–382. [Google Scholar] [CrossRef]
- Hao, J.; Wu, T.; Wu, X.; Hu, G.; Zou, D.; Zhu, X.; Zhao, L.; Li, R.; Xie, C.; Ni, J.; et al. Investigation of a Small Landslide in the Qinghai-Tibet Plateau by InSAR and Absolute Deformation Model. Remote Sens. 2019, 11, 2126. [Google Scholar] [CrossRef] [Green Version]
- Dini, B.; Daout, S.; Manconi, A.; Loew, S. Classification of slope processes based on multitemporal DInSAR analyses in the Himalaya of NW Bhutan. Remote Sens. Environ. 2019, 233, 111408. [Google Scholar] [CrossRef]
- Liu, L.; Millar, C.I.; Westfall, R.D.; Zebker, H.A. Surface motion of active rock glaciers in the Sierra Nevada, California, USA: Inventory and a case study using InSAR. Cryosphere 2013, 7, 1109–1119. [Google Scholar] [CrossRef] [Green Version]
- Berardino, P.; Fornaro, G.; Lanari, R.; Sansosti, E. A new algorithm for surface deformation monitoring based on small baseline differential SAR interferograms. IEEE Trans. Geosci. Remote Sens. 2002, 40, 2375–2383. [Google Scholar] [CrossRef] [Green Version]
- Werner, C.; Wegmüller, U.; Strozzi, T.; Wiesmann, A. Gamma SAR and interferometric processing software. In Proceedings of the ERS-ENVISAT Symposium, Gothenburg, Sweden, 16–20 October 2000; Volume 1620, p. 1620. [Google Scholar]
- Goldstein, R.M.; Werner, C.L. Radar interferogram filtering for geophysical applications. Geophys. Res. Lett. 1998, 25, 4035–4038. [Google Scholar] [CrossRef] [Green Version]
- Chen, C.W. Statistical-Cost Network-Flow Approaches to Two-Dimensional Phase Unwrapping for Radar Interferometry. Ph.D. Thesis, Stanford University, Stanford, CA, USA, 2001. [Google Scholar]
- Delacourt, C.; Briole, P.; Achache, J.A. Tropospheric corrections of SAR interferograms with strong topography. Application to Etna. Geophys. Res. Lett. 1998, 25, 2849–2852. [Google Scholar] [CrossRef]
- Hu, Y.; Liu, L.; Wang, X.; Zhao, L.; Wu, T.; Cai, J.; Zhu, X.; Hao, J. Quantification of permafrost creep provides kinematic evidence for classifying a puzzling periglacial landform. Earth Surf. Process. Landforms 2021, 46, 465–477. [Google Scholar] [CrossRef]
- Nelson, F.E.; Shiklomanov, N.I.; Mueller, G.R.; Hinkel, K.M.; Walker, D.A.; Bockheim, J.G. Estimating Active-Layer Thickness over a Large Region: Kuparuk River Basin, Alaska, U.S.A. Arct. Alp. Res. 1997, 29, 367–378. [Google Scholar] [CrossRef]
- Costa, J.E.; Schuster, R.L. Formation and Failure of Natural Dams. Bull. Geol. Soc. Am. 1988, 100, 1054–1068. [Google Scholar] [CrossRef]
- Casagli, N.; Ermini, L.; Rosati, G. Determining grain size distribution of the material composing landslide dams in the Northern Apennines: Sampling and processing methods. Eng. Geol. 2003, 69, 83–97. [Google Scholar] [CrossRef]
- Ermini, L.; Casagli, N. Prediction of the behaviour of landslide dams using a geomorphological dimensionless index. Earth Surf. Process. Landforms 2003, 28, 31–47. [Google Scholar] [CrossRef]
- Orlowsky, B.; Seneviratne, S.I. Global changes in extreme events: Regional and seasonal dimension. Clim. Chang. 2012, 110, 669–696. [Google Scholar] [CrossRef] [Green Version]
- Huggel, C.; Clague, J.J.; Korup, O. Is climate change responsible for changing landslide activity in high mountains? Earth Surf. Process. Landforms 2012, 37, 77–91. [Google Scholar] [CrossRef]
- Owczarek, P.; Opała-Owczarek, M.; Boudreau, S.; Lajeunesse, P.; Stachnik, Ł. Re-activation of landslide in sub-Arctic areas due to extreme rainfall and discharge events (the mouth of the Great Whale River, Nunavik, Canada). Sci. Total Environ. 2020, 744, 140991. [Google Scholar] [CrossRef]
- Pavlova, I.; Jomelli, V.; Brunstein, D.; Grancher, D.; Martin, E.; Déqué, M. Debris flow activity related to recent climate conditions in the French Alps: A regional investigation. Geomorphology 2014, 219, 248–259. [Google Scholar] [CrossRef]
- McRoberts, E.C.; Morgenstern, N.R. The Stability of Thawing Slopes. Can. Geotech. J. 1974, 11, 447–469. [Google Scholar] [CrossRef]
- Ding, Y.; Zhang, S.; Zhao, L.; Li, Z.; Kang, S. Global warming weakening the inherent stability of glaciers and permafrost. Sci. Bull. 2019, 64, 245–253. [Google Scholar] [CrossRef] [Green Version]
- Lacelle, D.; Brooker, A.; Fraser, R.H.; Kokelj, S.V. Distribution and growth of thaw slumps in the Richardson Mountains-Peel Plateau region, northwestern Canada. Geomorphology 2015, 235, 40–51. [Google Scholar] [CrossRef]
- Savi, S.; Comiti, F.; Strecker, M.R. Pronounced increase in slope instability linked to global warming: A case study from the eastern European Alps. Earth Surface Process Landforms 2021, 46, 1328–1347. [Google Scholar] [CrossRef]
- Liu, L.; Zhang, T.; Wahr, J. InSAR measurements of surface deformation over permafrost on the North Slope of Alaska. J. Geophys. Res. Earth Surf. 2010, 115. [Google Scholar] [CrossRef]
- Chen, J.; Wu, T.; Zou, D.; Liu, L.; Wu, X.; Gong, W.; Zhu, X.; Li, R.; Hao, J.; Hu, G.; et al. Magnitudes and patterns of large-scale permafrost ground deformation inferred from Sentinel-1 InSAR on the central Qinghai-Tibet Plateau. Remote Sens. Environ. 2022, 268, 112778. [Google Scholar] [CrossRef]
- Dini, B.; Manconi, A.; Loew, S. Investigation of slope instabilities in NW Bhutan as derived from systematic DInSAR analyses. Eng. Geol. 2019, 259, 105111. [Google Scholar] [CrossRef]
- Lacroix, P.; Berthier, E.; Maquerhua, E.T. Earthquake-driven acceleration of slow-moving landslides in the Colca valley, Peru, detected from Pléiades images. Remote Sens. Environ. 2015, 165, 148–158. [Google Scholar] [CrossRef]
- Moro, M.; Chini, M.; Saroli, M.; Atzori, S.; Stramondo, S.; Salvi, S. Analysis of large, seismically induced, gravitational deformations imaged by high-resolution COSMO-SkyMed synthetic aperture radar. Geology 2011, 39, 527–530. [Google Scholar] [CrossRef]
- Bontemps, N.; Lacroix, P.; Doin, M.P. Inversion of deformation fields time-series from optical images, and application to the long term kinematics of slow-moving landslides in Peru. Remote Sens. Environ. 2018, 210, 144–158. [Google Scholar] [CrossRef]


| Data | Resolution (m) | Date (YYYYMM) | Number of Scenes |
|---|---|---|---|
| 0.65 | 200910, 201006, 201712, 202007 | 4 | |
| Gaofen-2 | 0.8 | 201512, 201811, 202008 | 3 |
| ALOS PALSAR-1 | 7 | 2008–2010 | 6 |
| ALOS PALSAR-2 | 7 | 2015–2020 | 13 |
| UAV | 0.05 | 202104 | 1 |
| ALOS PALSAR-1 | ALOS PALSAR-2 | ||||||
|---|---|---|---|---|---|---|---|
| ID | Master–Slave (YYYYMMDD) | Time Span (Days) | (m) | ID | Master–Slave (YYYYMMDD) | Time Span (Days) | (m) |
| 1 | 20090630–20090815 | 46 | −32 | 1 | 20151009–20151218 | 70 | 200 |
| 2 | 20091231–20100215 | 46 | 491 | 2 | 20171201–20180209 | 70 | −98 |
| 3 | 20100703–20100818 | 46 | 116 | 3 | 20180209–20180601 | 112 | −44 |
| 4 | 20180601–20180727 | 56 | −6 | ||||
| 5 | 20181116–20190125 | 70 | 15 | ||||
| 6 | 20190125–20190531 | 126 | −60 | ||||
| 7 | 20190531–20190726 | 56 | 78 | ||||
| 8 | 20190726–20190906 | 42 | −10 | ||||
| 9 | 20200306–20200529 | 84 | 169 | ||||
Publisher’s Note: MDPI stays neutral with regard to jurisdictional claims in published maps and institutional affiliations. |
© 2022 by the authors. Licensee MDPI, Basel, Switzerland. This article is an open access article distributed under the terms and conditions of the Creative Commons Attribution (CC BY) license (https://creativecommons.org/licenses/by/4.0/).
Share and Cite
Chen, J.; Zhang, J.; Wu, T.; Hao, J.; Wu, X.; Ma, X.; Zhu, X.; Lou, P.; Zhang, L. Activity and Kinematics of Two Adjacent Freeze–Thaw-Related Landslides Revealed by Multisource Remote Sensing of Qilian Mountain. Remote Sens. 2022, 14, 5059. https://doi.org/10.3390/rs14195059
Chen J, Zhang J, Wu T, Hao J, Wu X, Ma X, Zhu X, Lou P, Zhang L. Activity and Kinematics of Two Adjacent Freeze–Thaw-Related Landslides Revealed by Multisource Remote Sensing of Qilian Mountain. Remote Sensing. 2022; 14(19):5059. https://doi.org/10.3390/rs14195059
Chicago/Turabian StyleChen, Jie, Jing Zhang, Tonghua Wu, Junming Hao, Xiaodong Wu, Xuyan Ma, Xiaofan Zhu, Peiqing Lou, and Lina Zhang. 2022. "Activity and Kinematics of Two Adjacent Freeze–Thaw-Related Landslides Revealed by Multisource Remote Sensing of Qilian Mountain" Remote Sensing 14, no. 19: 5059. https://doi.org/10.3390/rs14195059