Article

Precise Wetland Mapping in Southeast Asia for the Ramsar Strategic Plan 2016–24

1
Institute of Forest Resource Information Techniques, Chinese Academy of Forestry, Beijing 100091, China
2
Key Laboratory of Forestry Remote Sensing and Information System, National Forestry and Grassland Administration, Beijing 100091, China
3
Dongting Lake Remote Sensing Product Validation Station, Beijing 100091, China
4
National Forestry and Grassland Science Data Center, NFGSDC, Beijing 100091, China
*
Author to whom correspondence should be addressed.
Remote Sens. 2022, 14(22), 5730; https://doi.org/10.3390/rs14225730
Submission received: 25 September 2022 / Revised: 8 November 2022 / Accepted: 8 November 2022 / Published: 13 November 2022
(This article belongs to the Special Issue Remote Sensing of Wetlands and Biodiversity)

Abstract

:
A precise distribution map of wetlands can provide basic data of wetland conservation and management for Ramsar parties in each region. In this study, based on the Google Earth Engine (GEE) platform and Sentinel-2 images, the integrated inundation dynamic, phenological, and geographical features for a multi-class tropical wetland mapping method (IPG-MTWM) was used to generate the Southeast Asia wetland cover map (SEAWeC) in 2020, which has a 10 m spatial resolution with 11 wetland types. The overall accuracy (OA) of SEAWeC was 82.52%, which, in comparison with other mappings the SEAWeC, performs well. The results of SEAWeC show that (1) in 2020, the total wetland area in Southeast Asia was 123,268.61 km2, (2) for the category I, the coastal wetlands has the largest area, reaching 58,534.78 km2, accounting for 47.49%, (3) for the category II, the coastal swamp has the largest area, reaching 48,002.66 km2, accounting for 38.94% of the total wetland area in Southeast Asia, and (4) significant difference in wetland rate (WR) between countries in Southeast Asia, in which Singapore has a WR of 6.96%, ranking first in Southeast Asia. The SEAWeC can provide the detailed spatial and type distribution data as basic data for the Southeast Asia to support the Ramsar strategic plan 2016–24.

1. Introduction

Wetlands provide numerous water-related ecosystem services, including water purification, irrigation, flood control, coastal protection, biodiversity support, and climate regulation [1,2]. In the 20th century, the conversion of coastal wetlands has accelerated significantly more than that of inland wetlands worldwide [3,4,5,6], with wetland loss averaging between 54% and 57%, and a considerable portion of this has been in Asia [3,7]. Southeast Asia has the highest global mangrove tree diversity, thanks to hosting 42% of global mangroves [8,9]. However, a significant portion have been lost, including 55% of Thai mangroves that were cleared prior to 1961, and over 80% of original coastal wetlands in the Philippines. Southeast Asia has 56% of the global tropical peatland, but 45% has been converted to oil-palm [10]. Up to 45% of inter-tidal wetland already lost in Southeast Asia, the coastal resident, mangrove species and over 50 million migratory water birds have been seriously affected [11]. Across Southeast Asia, there has been a progressive degradation and loss of wetland ecosystems. The main drivers of degradation are the conversion of it to other land uses, including agriculture, or in extracting various resources, overfishing, siltation, and pollution [7]. We need to recognize the full value of wetlands on a regional scale, in the whole of Southeast Asia, and incorporate this information into decision-making in order to facilitate regional wetland protection and restoration [12,13,14].
In 1971, the first global inter-governmental environmental treaty of wetlands, The Convention on Wetlands of International Importance especially as Waterfowl Habitat, the original emphasis was upon the conservation and wise use of wetlands, primarily as habitat for waterbirds. This was the first modern multilateral environmental agreement on the sustainable use of natural resources [15,16]. It has been developed for more than 50 years, the Convention has broadened its scope of implementation to cover all aspects of wetland conservation and wise use, with the mission of “the conservation and wise use of all wetlands through local and national actions and international cooperation, as a contribution towards achieving sustainable development throughout the world”. Wetlands are now recognized as ecosystems that are vital for biodiversity conservation, as well as for sustainable development. In 2015, the United Nations set “the 2030 Agenda for Sustainable Development”, which focused on 17 sustainable development goals (SDGs) and called for action to end poverty, hunger, and environmental degradation [17,18,19]. Within these goals, the sustainable use of wetlands is closely related to SDGs [20,21,22]. “Wise use of wetlands” is defined as “the maintenance of wetland ecological service value, achieved through the implementation of ecosystem approaches, within the background of sustainable development” since 1971, but only recently has an explicit guideline for wetland conservation to meet SDGs been proposed [23,24]. The Ramsar convention’s fourth strategic plan for the period 2016–2024 (the Ramsar strategic plan 2016–2024) [21] identifies four goals: (1) addressing the drivers of wetland loss and degradation, (2) effectively conserving and managing the Ramsar site network, (3) wisely using all wetlands, and (4) enhancing implementation [17]. Precise wetland mapping is the most important foundation of the Ramsar strategic plan 2016–2024. Particularly, for cross regional wetland protection, by combining available data with the latest tools, this will provide the necessary available baseline data to examine the status, detect the changes, and identify emergencies for the management, evaluation, and dissemination of wetlands [7].
Since the 1980s, researchers have begun to explore global wetland mapping. In 1987, Matthews and Fung drew the first 1° spatial resolution global wetland map based on the statistical data of regional vegetation and soil characteristics [25]. In 1999, Finlayson made a global wetland inventory based on the Ramsar global inventory and began to call for the development of standardized methods for data collection, sorting and storage to collect the core data characteristics of global wetlands, such as area, boundary, location and landform [26]. In recent years, global or large-scale wetland remote sensing mapping research includes, but was not limited to, global lakes and wetlands database (GLDW) [27], global surface water [28,29], global tidal flats [30], global reservoirs and dams [31], global mangroves [32], global freshwater biodiversity [33], tidal wetlands of East Asia [34], national wetland mapping in China [35], Canadian wetland inventory maps [36], Chinese alpine lakes on the southeastern margin of the Qinghai–Tibet Plateau [37], coastal aquaculture of India [38], salt marsh monitoring of the mid-Atlantic coast [39], and mangrove forests in Campeche, Mexico [40]. In Southeast Asia, wetland mapping mainly focuses on paddy field [41], mangroves [42], coastal wetland vegetation [43] and tropical peatlands [44] in Indonesia, and coastal wetlands in the Mekong Delta, Vietnam [45]. However, most of the existing wetland maps focus on a single type for global use, or large-scale or multiple types for small-scale use [37]. Low resolution remote sensing images (MODIS) or manual interpretation with the local computing cannot meet the decision-maker’s requirements for large-scale or global wetland monitoring and conservation, such as Ramsar. Currently, Sentinel-2 images are widely used with their high spatiotemporal resolution and free availability [46,47]. The Google Earth Engine (GEE) cloud computing platform can access multi-temporal remote sensing data and other earth observation data from local, regional, and global coverage and provides sufficient computing capacity to process these data. Some studies had explored small-scale wetland mapping using Sentinel-2 images and GEE, such as small seasonal wetlands in South Africa [48], and salt-marsh vegetation in coastal wetlands [49].
Although wetland mapping is of great significance, in tropical regions such as Southeast Asia, where wetlands are seriously degraded, there are few precise maps of regional wetlands that can be used for wetland conservation and scientific research [50,51,52]. The difficulties in mapping wetlands in tropical areas are largely due to frequent cloud cover, changes in wetland extent with hydrological dynamics, poor accessibility of personnel in wetland areas, and spectral complexity of land surface coverage [53]. Sentinel-2 has a higher spatial resolution (10 m) than other medium spatial resolution images and the high temporal resolution of 5 days, and the availability of the red-edge bands to provide high resolution satellite data for land cover/use monitoring, climate change and disaster monitoring [49,54]. For example, Bruzzone, et al. applicated land cover/use monitoring [55], Africa developed a high spatial resolution (20 m) map in 2016 [56], the Copernicus Land cover the services of high spatial resolution maps [57], and Germany, Belgium, Bulgaria, Belgium, and Greece developed high spatial resolution maps [58,59]. All the above work is based on Sentinel-2 images [54]. For wetlands mapping, van Deventer, et al. derived monthly inundated extent and hydroperiod of wetlands from Sentinel-2 time series images for SDG and biodiversity reporting [60]. Gxokwe, et al. utilized Sentinel-2 images to characterize and map small seasonal wetlands in the semi-arid environments of South Africa [48]. Pahlevan, et al. evidenced that Sentinel-2 data provided an open opportunity for capturing the dynamics of near shore coastal and inland waters at rates that have never been possible before [61]. To support the Ramsar strategic plan 2016–2024 and manage wetland resources comprehensively, creating a precise spatial distribution map of regional wetlands under a unified classification system is extremely important [18,62,63]. Remote sensing has the capability of macro dynamic multi-scale monitoring to map the spatial distribution of multiple types of wetlands using time series Sentinel-2 images, IPG-MTWM method on GEE. Hope to help realize the Ramsar strategic plan 2016–2024 [64,65].
The aims of this study were as follows. (1) To design a wetland classification system, which corresponds to the Ramsar strategic plan 2016–2024 objectives, wetland landscapes, and the actual wetland resources in Southeast Asia (2) To use the GEE platform, time series Sentinel-2 images, and tropical wetland mapping method, to quickly and accurately obtain the 10 m SEAWeC in 2020. (3) To obtain statistical data on the spatial distribution and area of various types wetland in Southeast Asia in 2020, analyze the spatial characteristics of wetland distribution in Southeast Asia and discuss the significance of a large-scale precise wetland cover map for the Ramsar strategic plan 2016–2024.

2. Study Area and Data
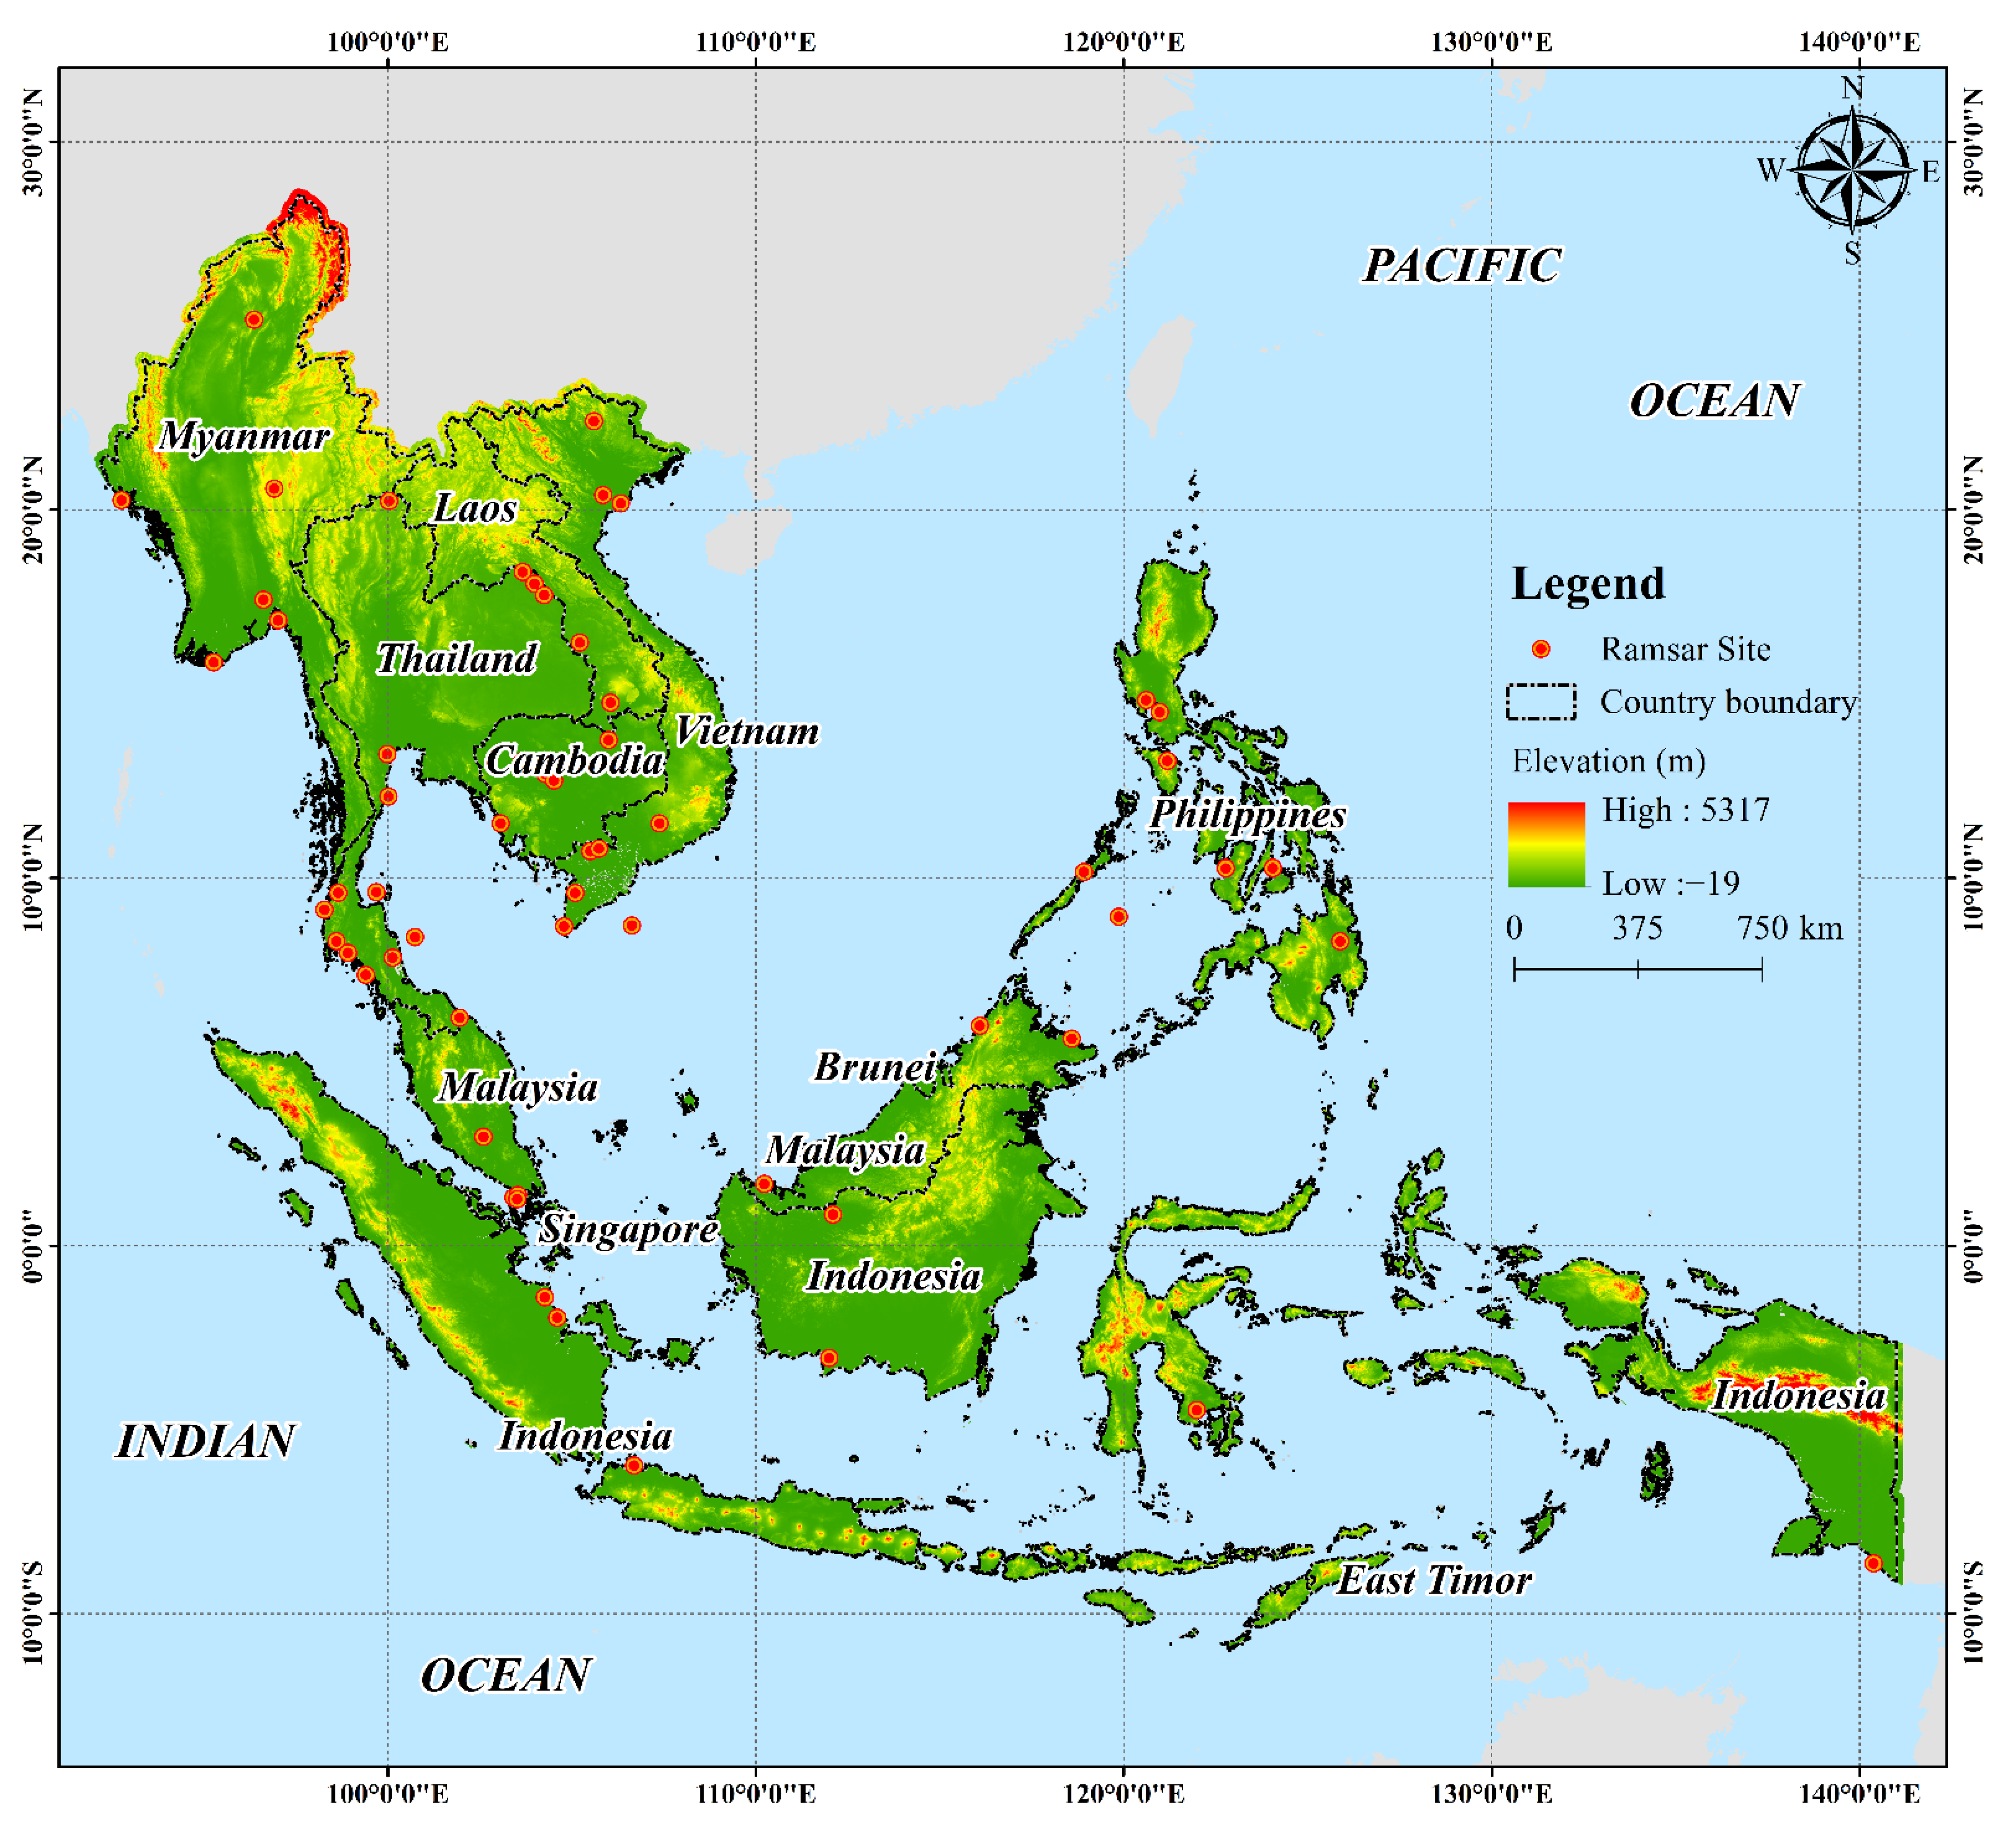
2.1. Study Area

Southeast Asia includes 59 Ramsar sites as of 2020, constituting a critical part of the global wetland network, that maintains vital ecosystem services. Southeast Asia covers an area of approximately 4.57 million km2 and comprises 11 countries: Thailand, Cambodia, Malaysia, Laos, Vietnam, Myanmar, Brunei, Singapore, the Philippines, Indonesia, and East Timor (Figure 1). There is considerable annual precipitation, ranging from 1500 mm to 2000 mm, owing to tropical and subtropical climatic zones [66,67]. Southeast Asia is often considered to be one of the areas most vulnerable to climate change. The three most significant impacts of climate change in this region are floods, biodiversity loss, and sea level rise [7]. The dynamic changes in wetland resources in this region will have an important impact on global society, politics, economy, and climate [68]. Statistics show that Southeast Asia has a population of approximately 655 million, with a population growth rate of approximately 2%, which is higher than the world average (1.4%) [69]. Most of the population and economic activities are concentrated in the coastal areas. The residents seriously rely on agriculture, especially those living below the poverty line [70,71].

2.2. Data

Sentinel-2 images covering the entire hydro-periods of Southeast Asia were used in this study. These images have a multi-spectral instrument (MSI) with spectral bands ranging 440–2200 nm and a spatial resolution from 10 m to 60 m (Figure 2C), providing global coverage every five days. Due to their shorter revisit time and more detailed spatial resolution (for example, compared to Landsat at every 16 days and 30 m pixels), using Sentinel-2 images can increase the probability of acquiring more cloudless images within the same time series to achieve more precision in tropical wetland monitoring [72].
We used a time series of Sentinel-2 Level-2 surface reflection (SR) images, with a preset buffer time of six months for the start and end times (total of 24 months), to capture the phenological response and inundation frequency and avoid situations where there was no available image in some areas [34]. From 1 June 2019 to 31 May 2021, 255,413 images were obtained, of which 156,909 images had cloud coverage greater than 70%, according to the quality assessment QA60 mask band to filter cloud cover (Figure 2A,B). In total, 98,504 Sentinel-2 images were generated covering this region for the next step. In order to obtain high-quality images, we assessed each image and used the Flask algorithm based on GEE to mask residual clouds and cloud shadows [34,73]. Finally, a single pixel obtained an average of 42 ± 13 cloud-free images (Figure 2A).

3. Methods

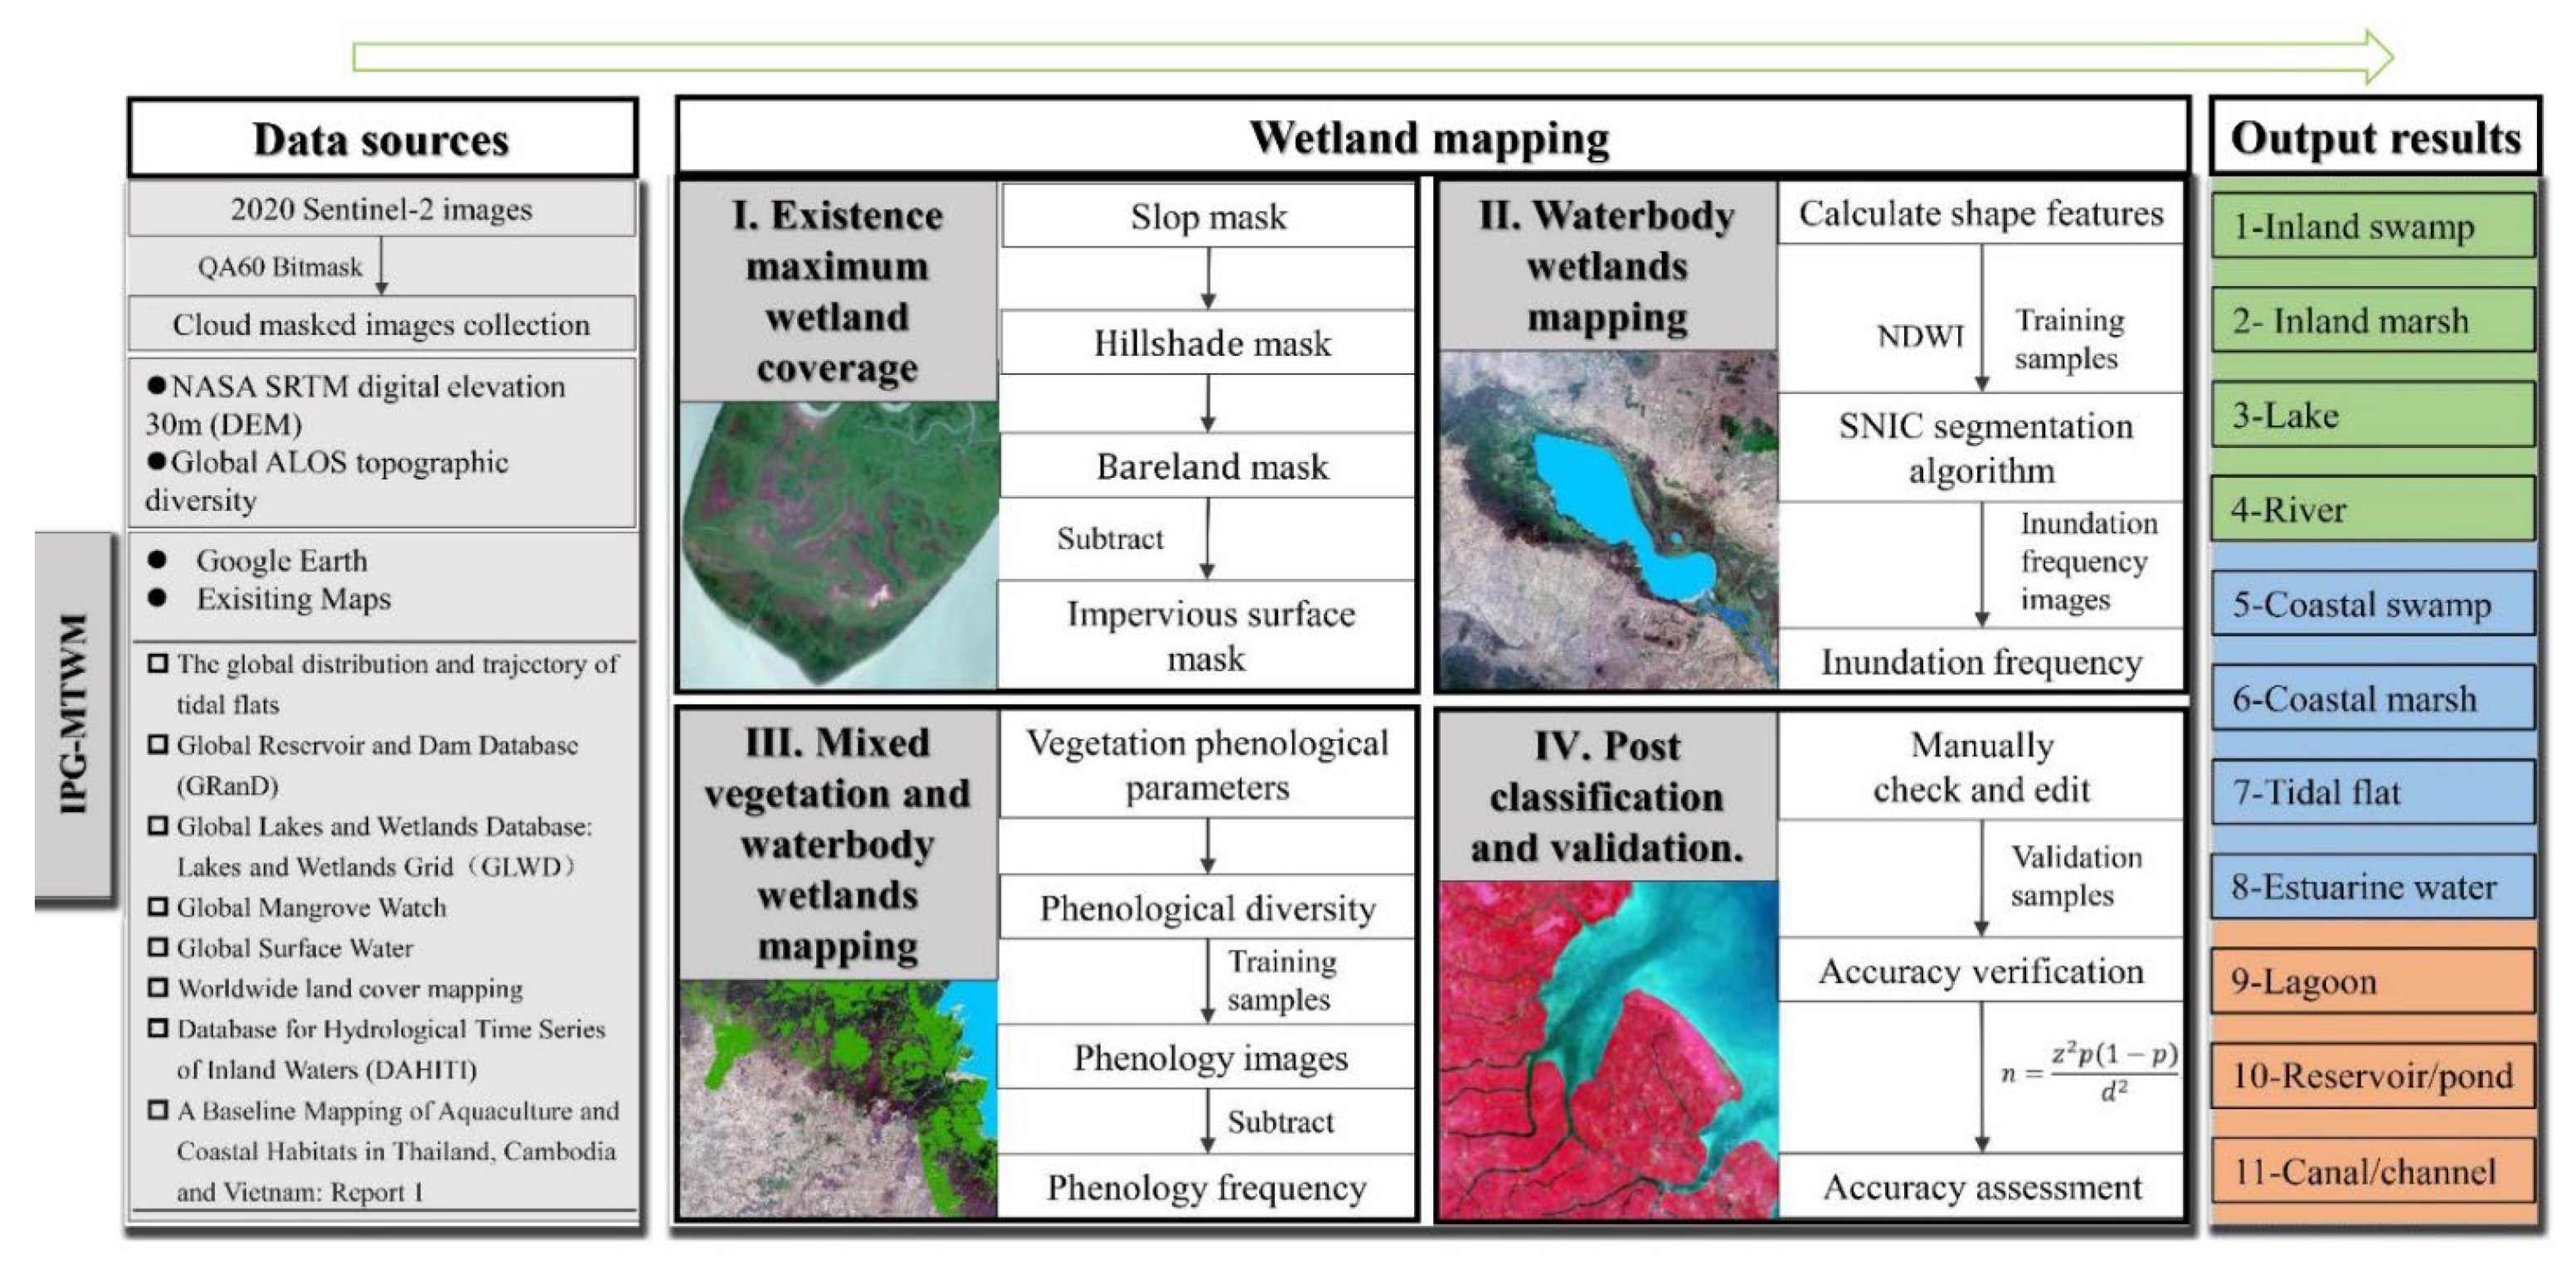
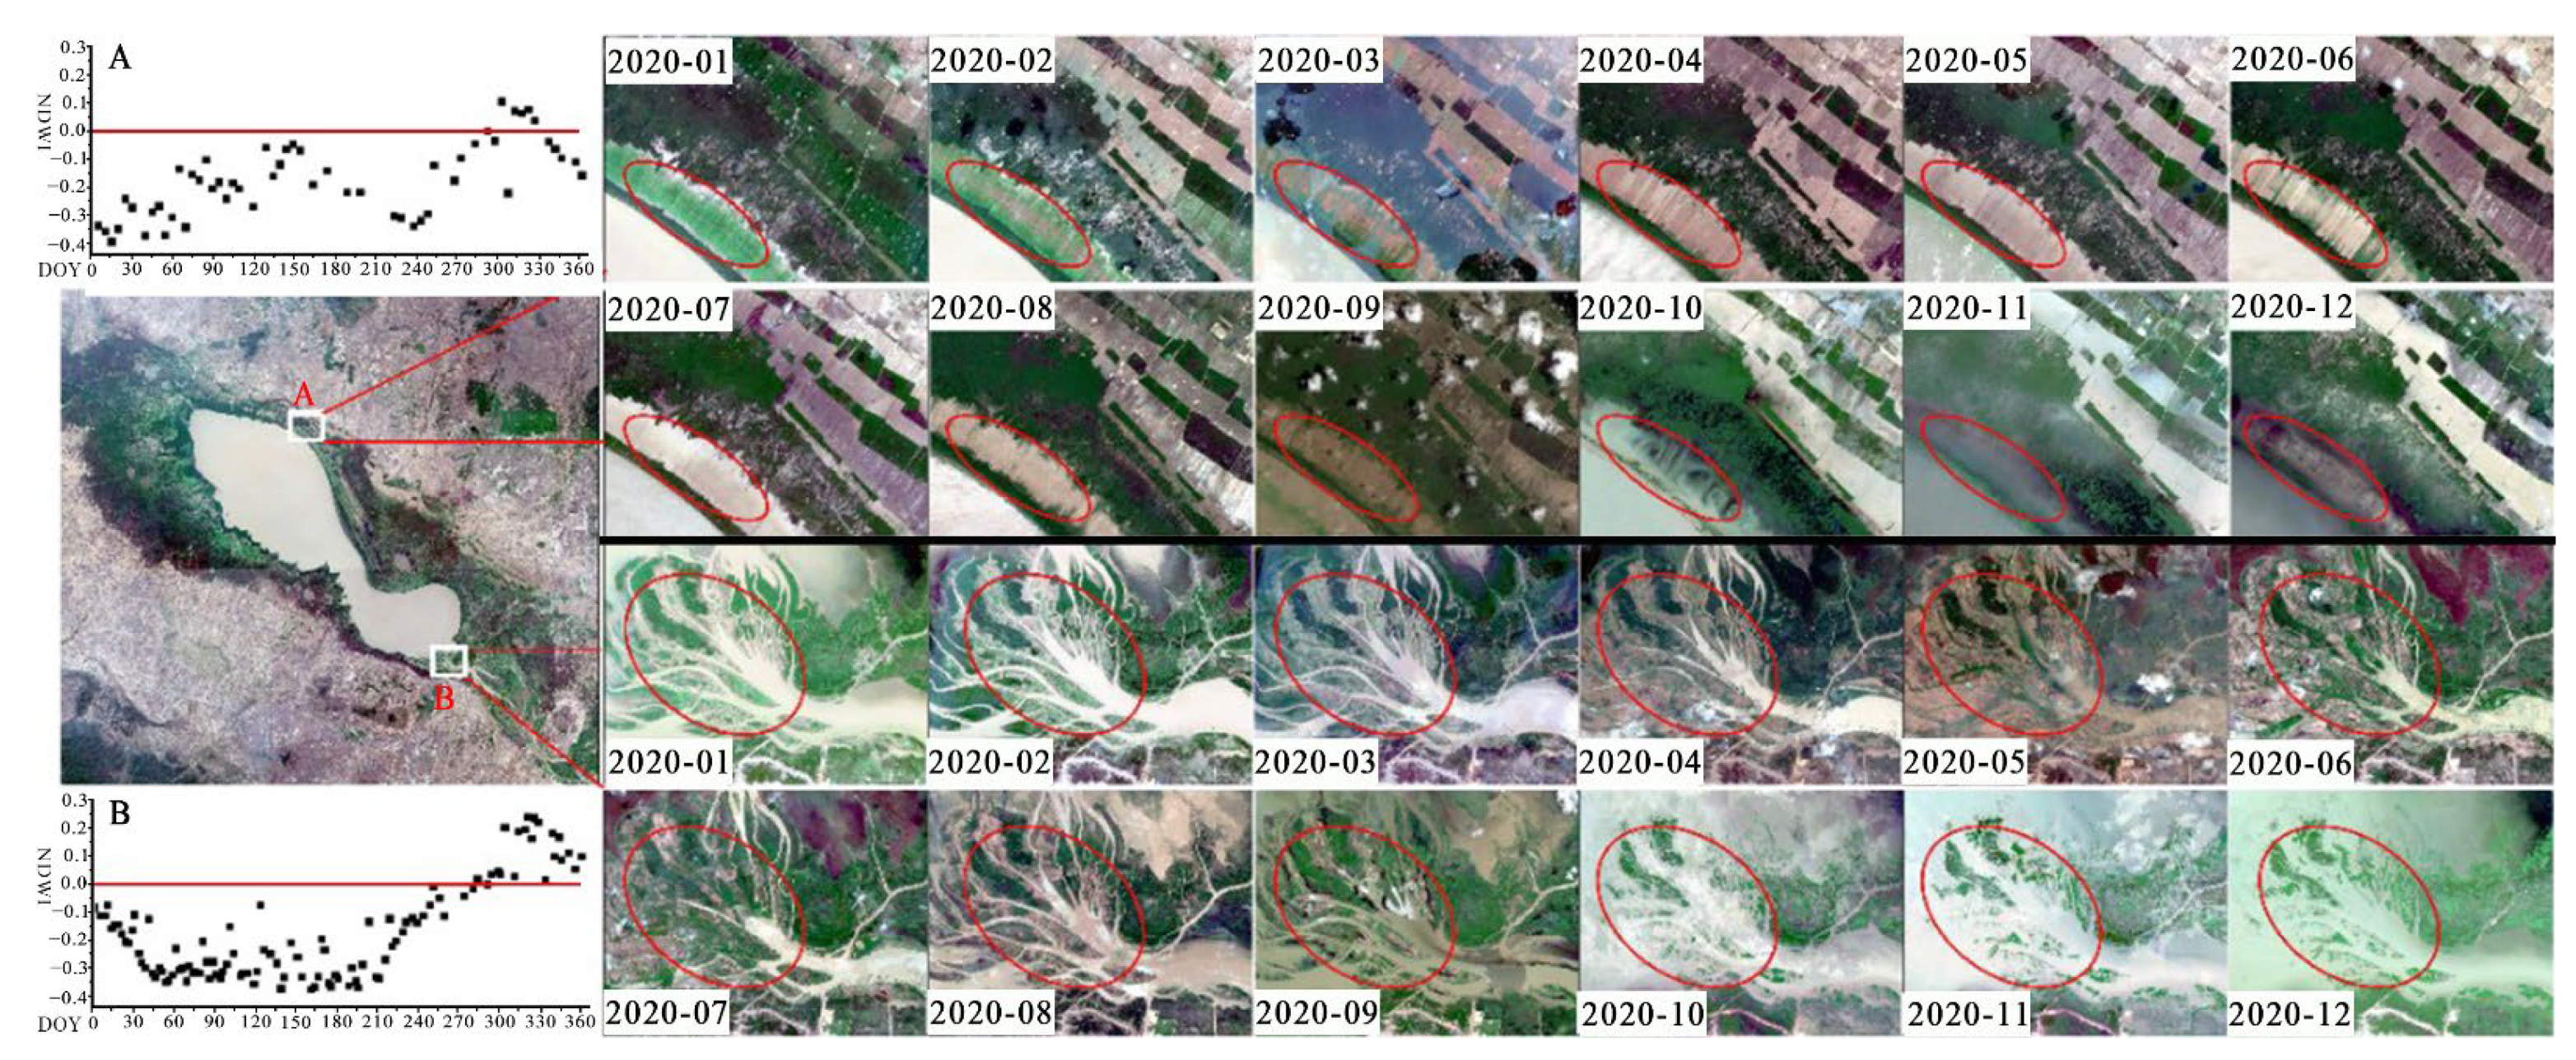
3.1. Wetland Classification System

To avoid conceptual confusion, we first defined a wetland as an area with an inundation frequency of more than seven months each year, referring to the following sources: the Ramsar strategic plan 2016–2024, wetland hydrology, vegetation, geomorphology, climate, and biological characteristics of Southeast Asia, the spectral, spatial, and temporal resolution of Sentinel-2 images, and the mapping method [35]. The Southeast Asian wetland classification system was segregated into two categories, including 11 wetland types at the category II, grouped into the category I: inland wetlands, coastal wetlands, and human-made wetlands [15]. As shown in Table 1.

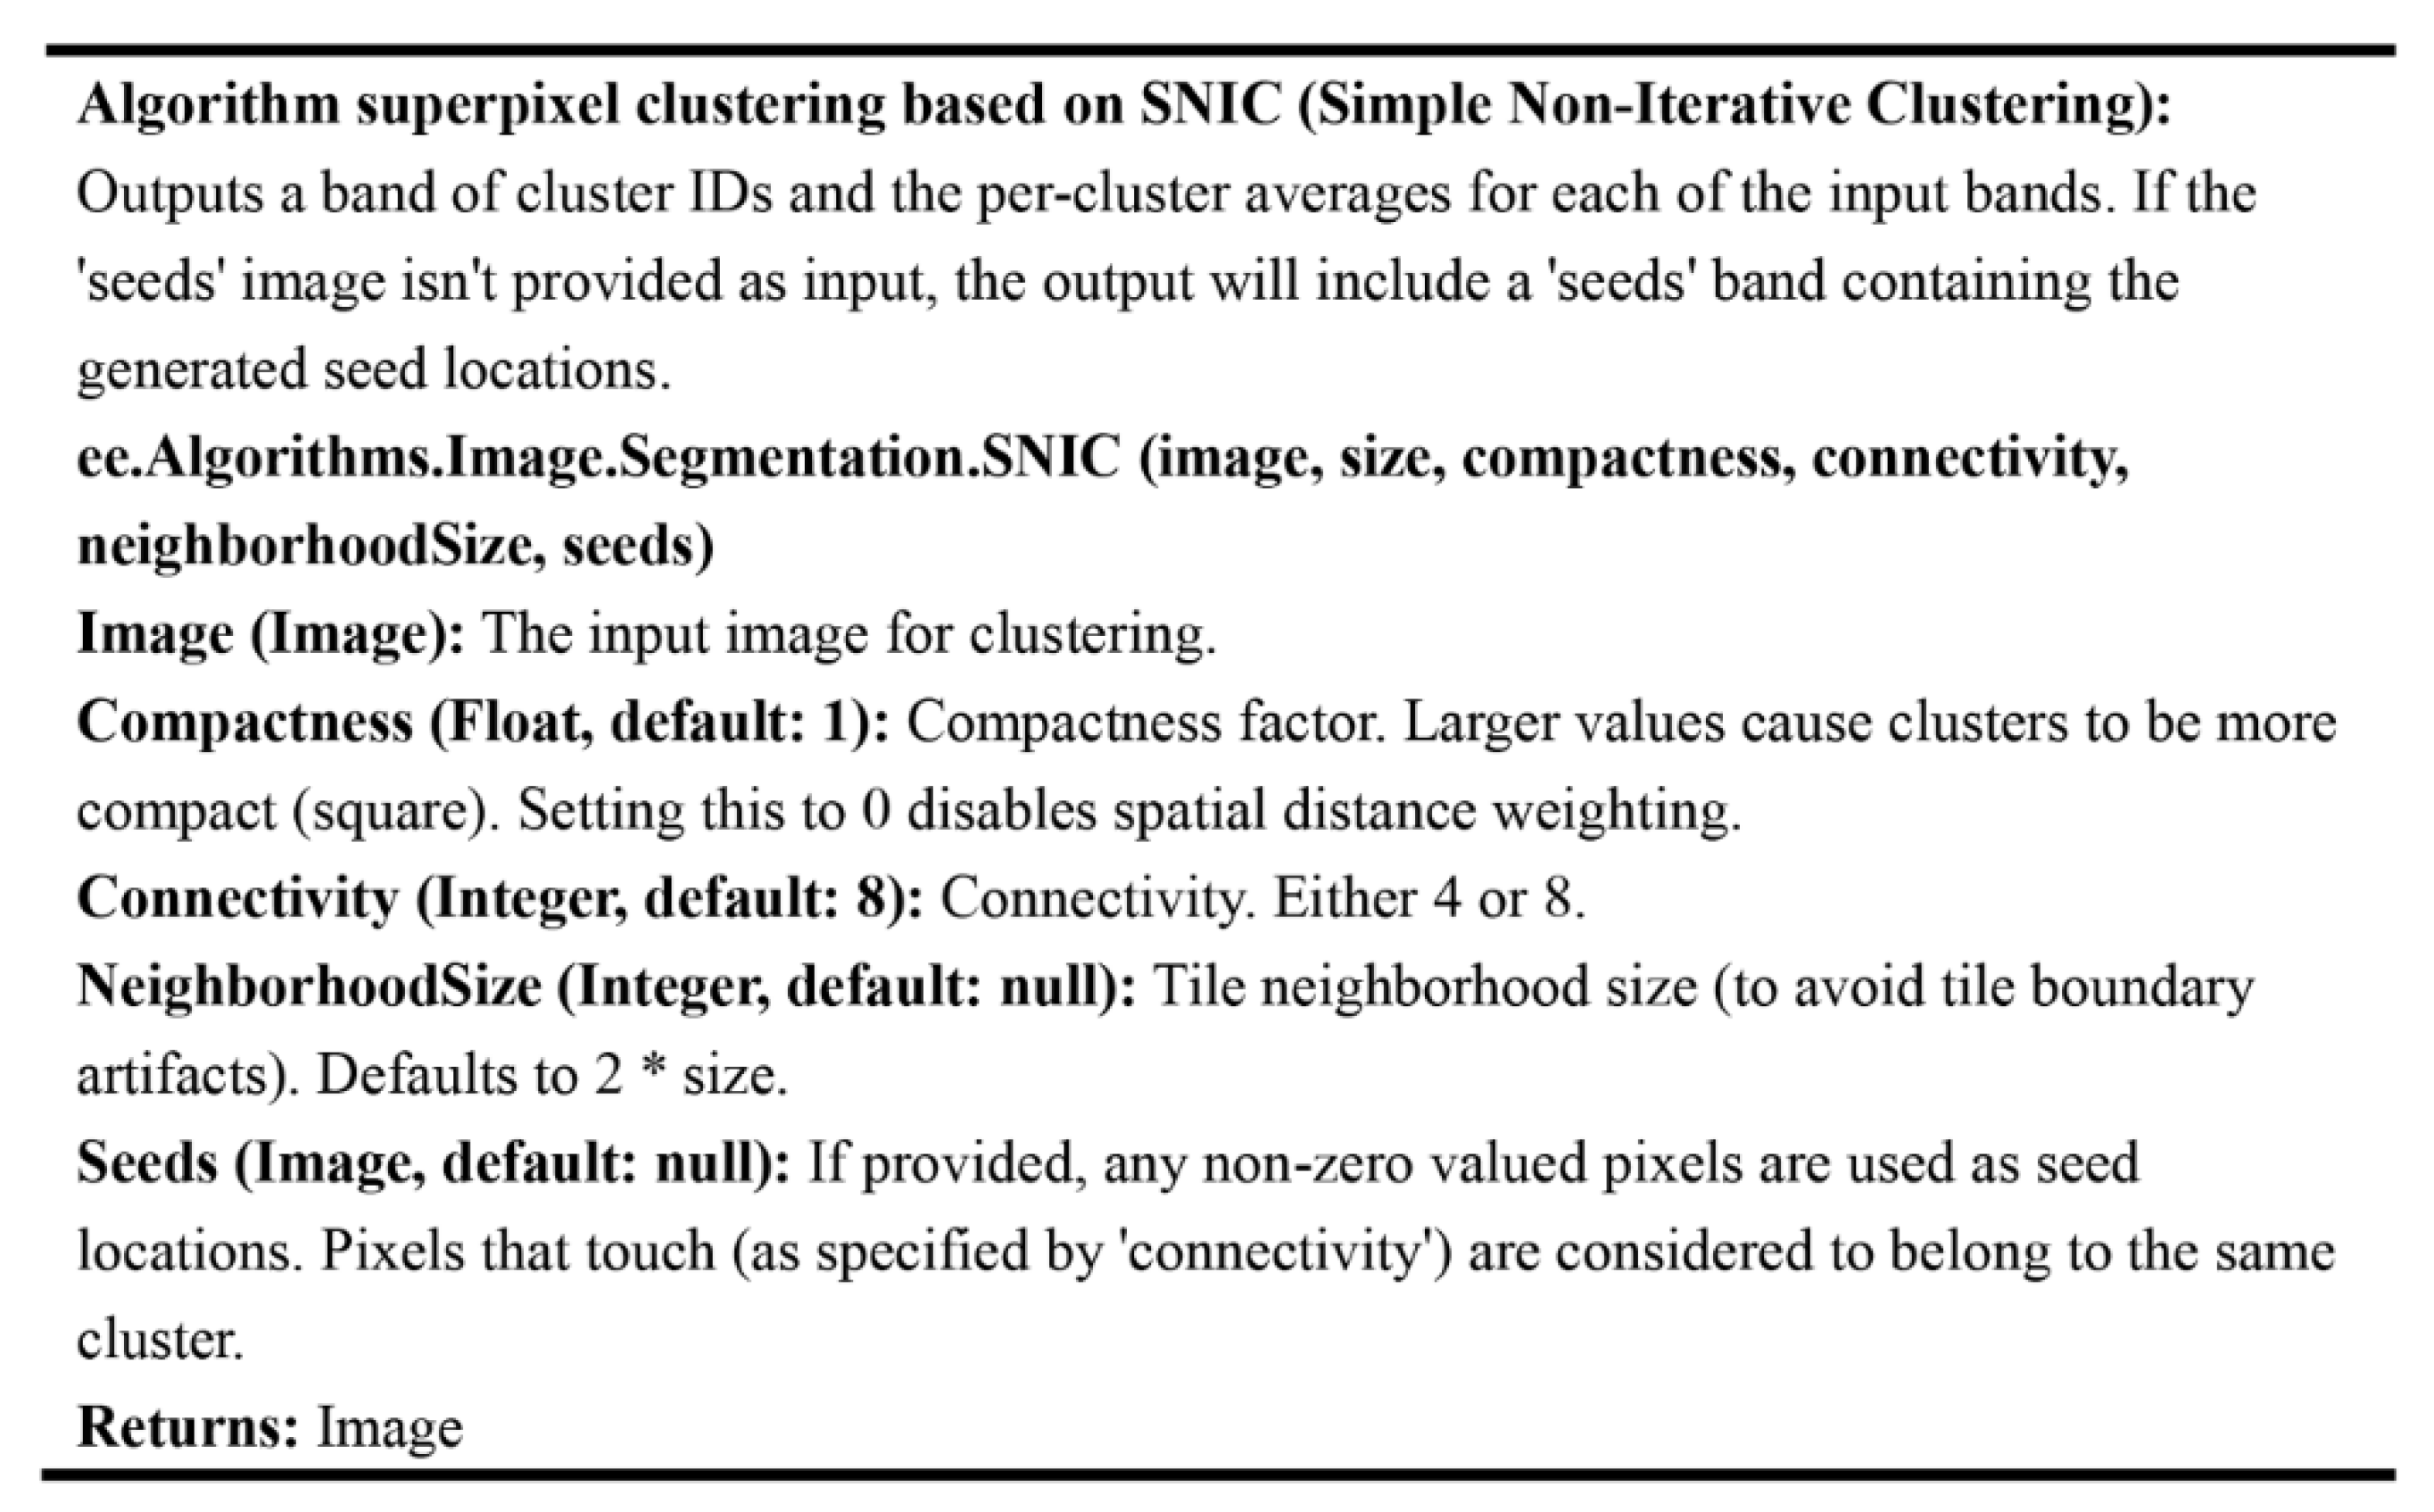
3.2. Tile Segmentation

Regular hexagonal grids have some advantages owing to their 6-fold rotational symmetry, such as equidistant neighbors, uniform connectivity, and isoperimetry. This makes hexagonal grids suitable for geospatial information processing and intelligent decision-making tasks [74]. Therefore, before start developing wetland mapping for Southeast Asia, the study area was divided into 1276 regular hexagonal grids with a side length of 50 km and area of 6495.20 km2 (except for the edge, a small area that did not meet the size of a single grid). In the processing of wetland mapping, a single regular hexagon grid was utilized as the basic unit, and a neighborhood iterative calculation was used, which, to a certain extent, broke through the memory and time limitations of GEE in the large-scale calculation.

3.3. Using IPG-MTWM for Southeast Asia Wetland Cover Map

After proposing the Southeast Asian wetland classification system based on the Ramsar strategic plan 2016–2024, we used the IPG-MTWM mapping method (Figure 3) based on the GEE platform, which was proposed by Liu et al. (2022) [75]. IPG-MTWM was developed using the time series of Sentinel-2 images based on wetland hydro-period to analyze wetland inundation dynamics, vegetation phenological stages, and geographical features, and object features oriented for precise mapping of tropical wetlands. The main steps are as follows: (1) existence of maximum wetland coverage in Southeast Asia, (2) waterbody wetland mapping, (3) mixed vegetation and waterbody wetland mapping, and (4) post-classification and validation.
We used the IPG-MTWM method to construct SEAWeC, which mainly uses wetland water inundation dynamics, vegetation phenological stages, and geographical features. According to the Ramsar strategic plan 2016–2024 [4] and the distribution of wetlands in Southeast Asia, we defined “wetland” as an area with annual continuous inundation frequency that exceeded seven months in this study. (1) The non-wetland areas in Southeast Asia were covered with a mask to generate the largest regional extent of Southeast Asian wetlands in 2020, and pixels unrelated to the wetland distribution were excluded to the greatest extent, such as forests, building roads, bare lands, agricultural lands, and mountain shadows. According to the geographical characteristics of wetland distribution, at a slope greater than 5° there are almost no wetlands that emerge [76]. The normalized vegetation index (NDVI) was used to remove the vegetation-covered forest areas. Elevation, solar incidence angle, and a physical model of mountain shadow extraction were established using the Lambert cosine law [77]. The incidence angle of the Lambert cosine law was obtained by calculating the slope normal in the digital elevation model (DEM) combined with the solar angle to mask the mountain shadow. Bare lands, buildings, roads, and other non-wetland area covers were masked according to the distribution frequency of NDVI and normalized difference water index (NDWI). (2) Regarding the mapping of wetlands, the NDWI has proven to be a useful tool for assessing inundation dynamics (Figure 4). In the IPG-MTWM method, the NDWI and NDVI were used to construct the inundation frequency. Object parameters were obtained according to the SNIC segmentation algorithm (Figure 5) and mapped to each type of waterbody wetland. (3) Mapping wetlands in areas with mixed water and vegetation Sentinel-2 was used to extract the time series vegetation index (VIs) to estimate the phenological parameters of various types of wetlands (Figure 6) and to map the spatial distribution of phenological indicators (beginning of the growing season, maximum green degree time, end of the growing season, and end of the season) in each grid.
E V I = 2.5 × N I R R e d / N I R + 6 × R e d 7.5 × B l u e + 1 ,
R V I = N I R / R e d
B S I = S W I R I 1 + R e d + B l u e N I R / S W I R I 1 + R e d + B l u e + N I R
N D V I = N I R R e d / N I R + R e d
N D W I = G r e e n N I R / G r e e n + N I R
where EVI, RVI, and BSI are enhanced vegetation index (EVI), ratio vegetation index (RVI), and bare soil index (BSI). blue, green, red, near infrared (NIR), and short-wave infrared 2 (SWIR 2) are the band of Sentinel-2 B2, B3, B4, B8, and B12, respectively.

3.4. Post Classification

Through visual inspection of the results [34,78], there were still several errors in the automatic mapping result, such as the following: (1) Misclassification. For example, bridges, roads, shadows, and other low-reflectance surfaces that occur frequently in mountainous areas and urban buildings, resulting in the misjudgment of extracting water body wetlands in this area (Figure 7A,B). The SWIR 2 (spatial resolution is 20 m) was introduced to correct these errors [79], with mean values of 10–90% (SWIR 2 mean 10–90%) intervals arranged in ascending order using the time series of images. To solve embankments misclassification such as reservoirs and aquaculture ponds in human-made wetlands (Figure 7C,D), we calculated the average value of the 85–95% interval of NDWI using the time series of images in ascending order and corrected it for auxiliary data. (2) Omission errors. Many inland swamps are covered by dense vegetation in the tropical rainforest, and it is difficult to detect water cover in the lower layer, resulting in some omission errors, which were manually checked according to the knowledge of local experts. For canals, there was also a large part of the missing error if the width of canals is less than the spatial resolution (10 m) of Sentinel-2 image. We also referred to local data for manual modification. (3) Other errors. When the shape features were calculated according to a single regular hexagonal grid, the shape features in a few areas were discontinuous. We corrected this misclassification using manual editing.

3.5. Accuracy Assessment

Four indicators were used in the validation assessment: producer accuracy (PA), user accuracy (UA), OA, and F1 score. PA quantifies the probability that the real ground samples are correctly classified in the mapping, and the omission error is measured. The UA quantified the proportion of each wetland type in the mapping results, consistent with the validation samples, and measured the mapping error. OA quantifies the scores of all correctly mapped verification samples. We introduced a compromise index F1 score to quantify the mapping error of each category, which is the harmonic average of the PA and UA [80]. We used Google Earth and Collect Earth (https://openforis.org/tools/collect-earth, accessed on 1 November 2021) to select auxiliary sampling points and used the time series NDVI curve to determine the pixel purity [73]. To offset the lack of field sampling points by referring to eight existing wetland products [81] (Table 2), 17,805 samples were used for validation, including 11 wetland types [15] and 1 “non-wetland” type; these 12 types of random samples were determined as the final samples after manual visual verification based on high-resolution Google Earth images [82]. Figure 8 shows the distributions of sampling points for each wetland cover type.

4. Results

4.1. Accuracy Assessment of the SEAWeC

In this case, 17,805 sample points were used to verify the accuracy of the SEAWeC. As shown in Table 3, there is a confusion matrix and F1 score of SEAWeC. The OA of SEAWeC was 82.52%. Except for the estuarine river and reservoir/pond, the F1 scores of all wetland types exceeded 0.80. The lagoon had the highest mapping accuracy with an F1 score of 0.84. Among all the wetland cover types, the estuarine river had the lowest mapping accuracy, F1 score of 0.76. As shown in Figure 9, SEAWeC smoothened and reduced the noises at the pixel level (Figure 9B) effectively. As ponds and paddy fields are important error sources for mapping waterbody wetlands, inundation and phenological indices, such as IF, were used for mapping ponds in Southeast Asia. In addition, dividing Southeast Asia into 1276 regular hexagonal grids played a vital role in invoking the IPG-MTWM method based on the GEE cloud platform for Southeast Asia wetland cover mapping.

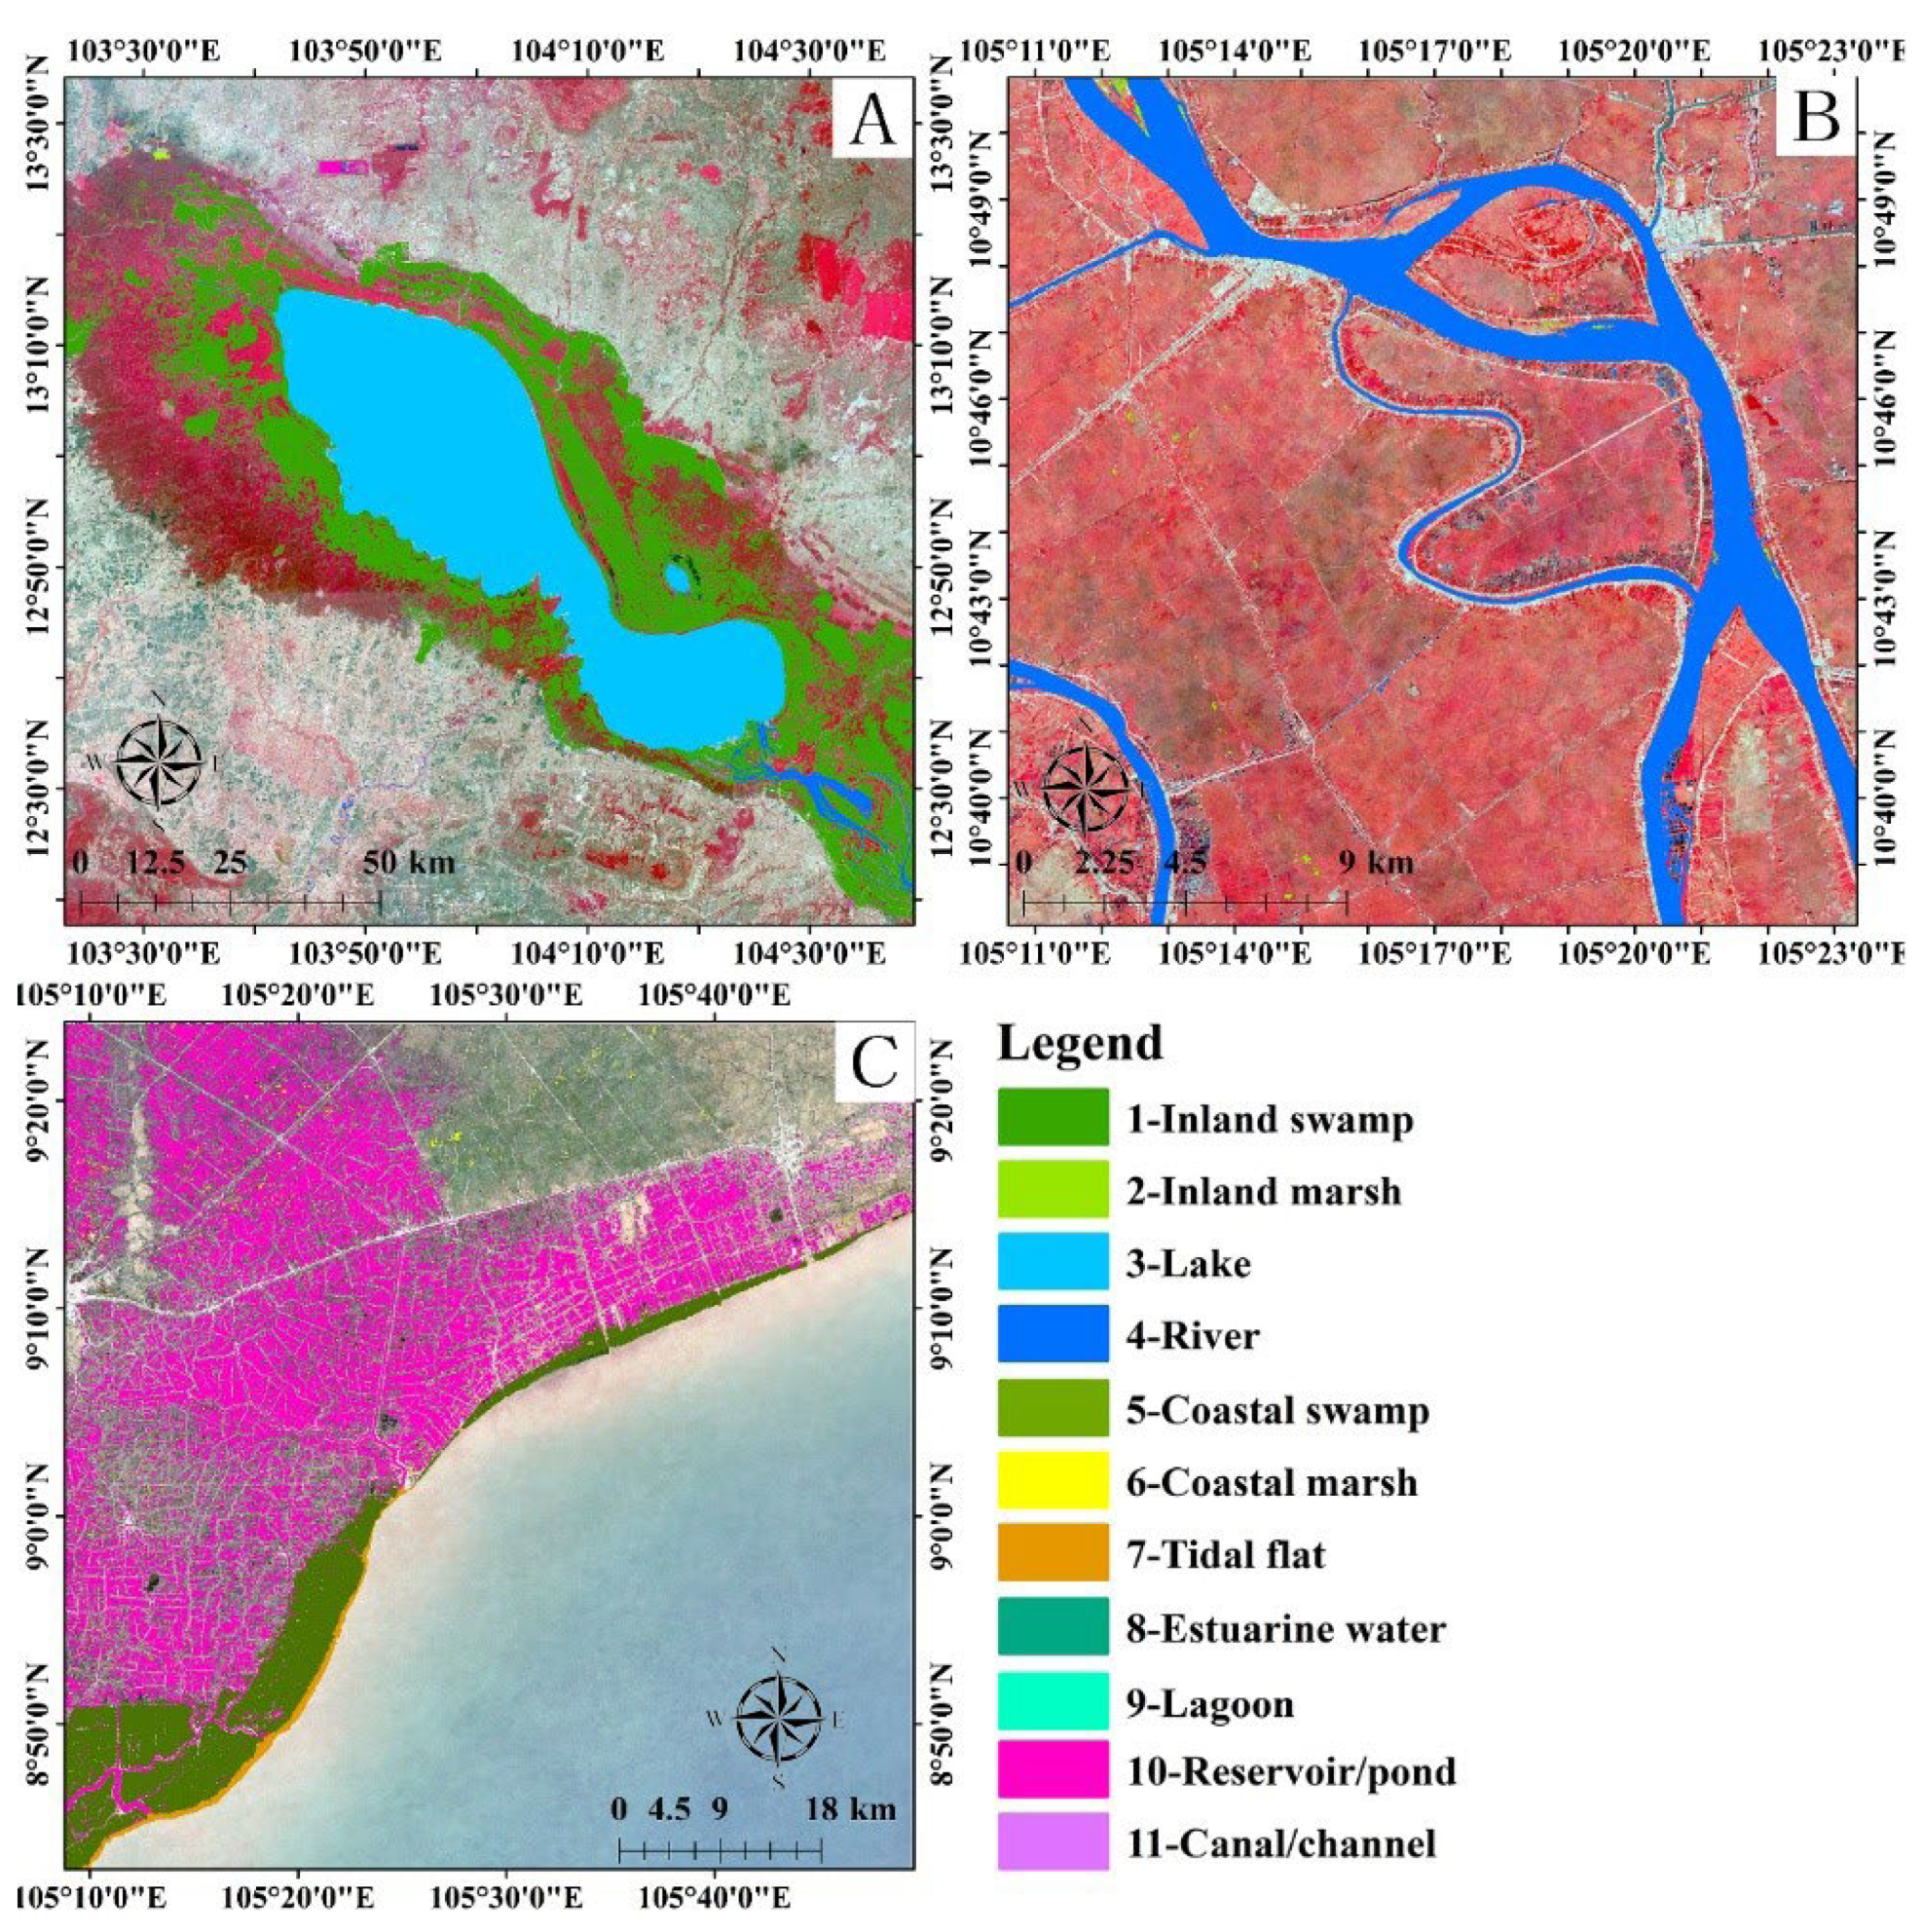
4.2. Distribution of Wetlands in Southeast Asia

Using time series Sentinel-2 images based on GEE in 2020, an unprecedented 10 m spatial resolution SEAWeC was produced. The area of each wetland type is summarized in Table 4. In 2020, the total area covered by wetlands in Southeast Asia was approximately 123,268.61 km2.
At the category I, the coastal wetland areas account for the largest proportion, approximately 47.49%, 58,534.78 km2. The second is inland wetland areas, approximately 40.19%, 49,536.64 km2. The areas of artificial wetland account for approximately 12.33%, 15,197.19 km2. At the category II, the coastal swamp has the largest area, approximately 48,002.66 km2, accounting for 38.94%, and the canal/channel is the smallest wetland type, approximately 103.39 km2, accounting for 0.08%, as shown in Table 4 and Figure 10.
Various wetland types and areas exist in different countries. We defined the ratio of the total wetland area of each country to the corresponding land area as the wetland rate (WR) [15]. According to the ranking analysis of WR for each country in Southeast Asia, there was a significant difference. Indonesia has the largest wetland area 60,155.23 km2, accounting for 48.80% of Southeast Asia, but with a WR of 3.14%. The country with the highest WR in Southeast Asia is Singapore, with a wetland area of 50.73 km2 and WR of 6.96%, as shown in Table 5 and Figure 11.
WR = Wetland   area / Land   area ,

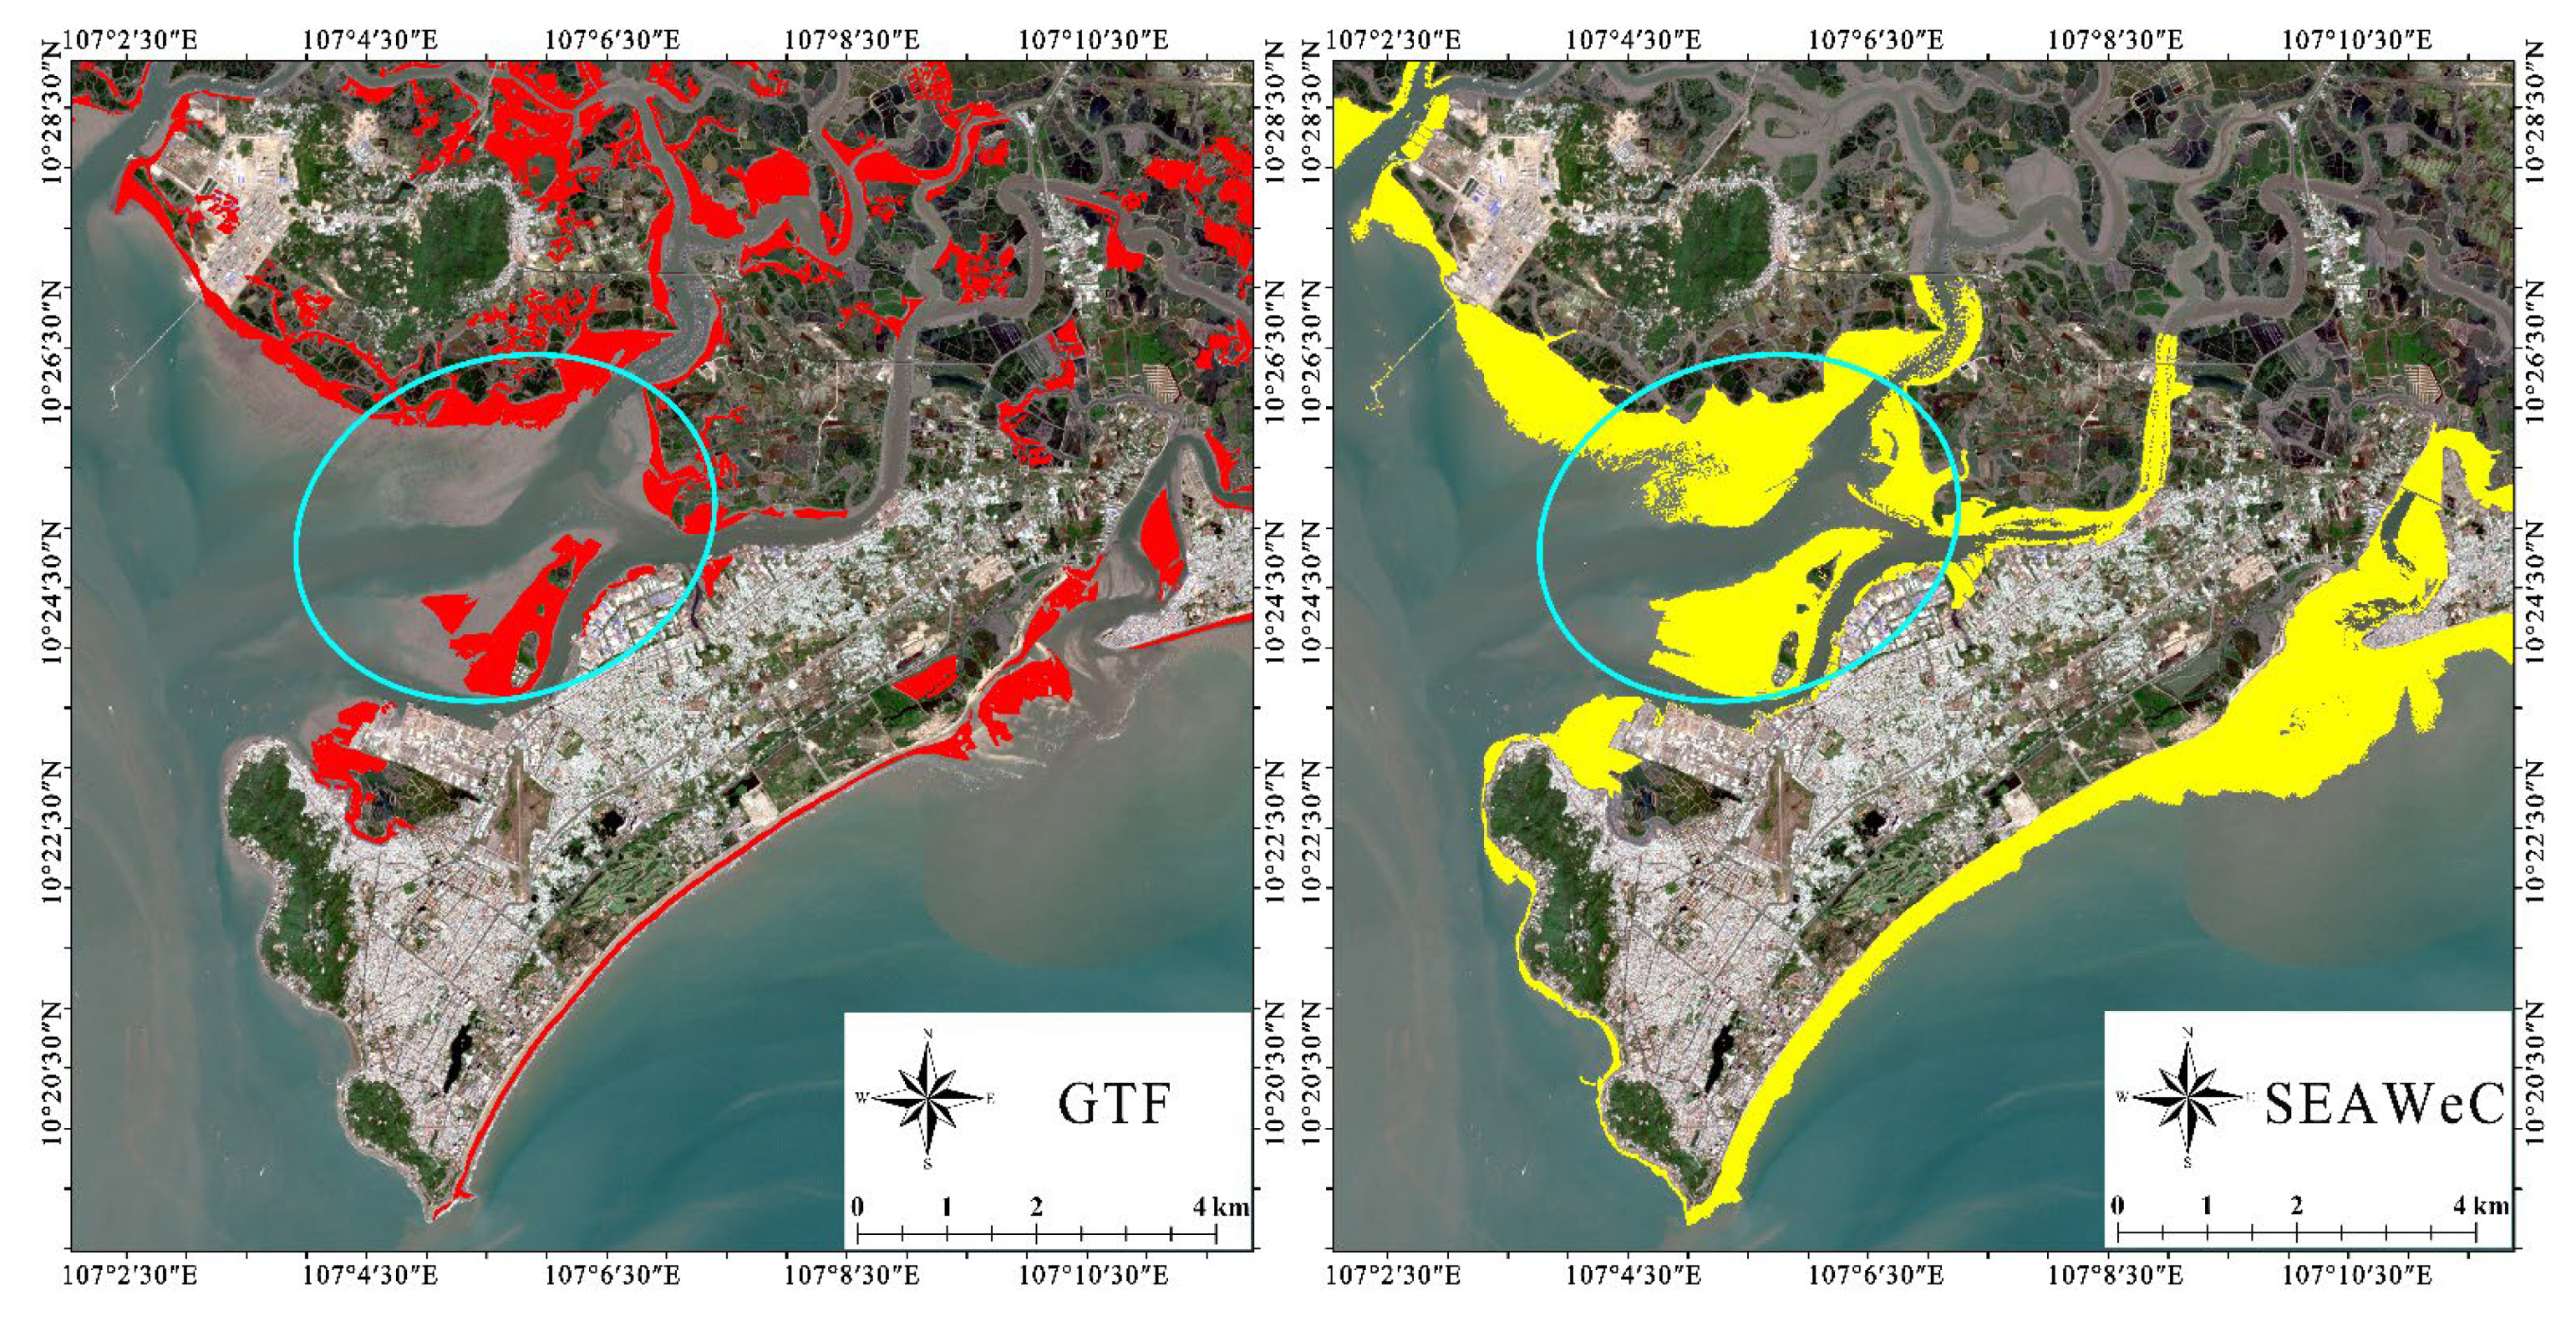
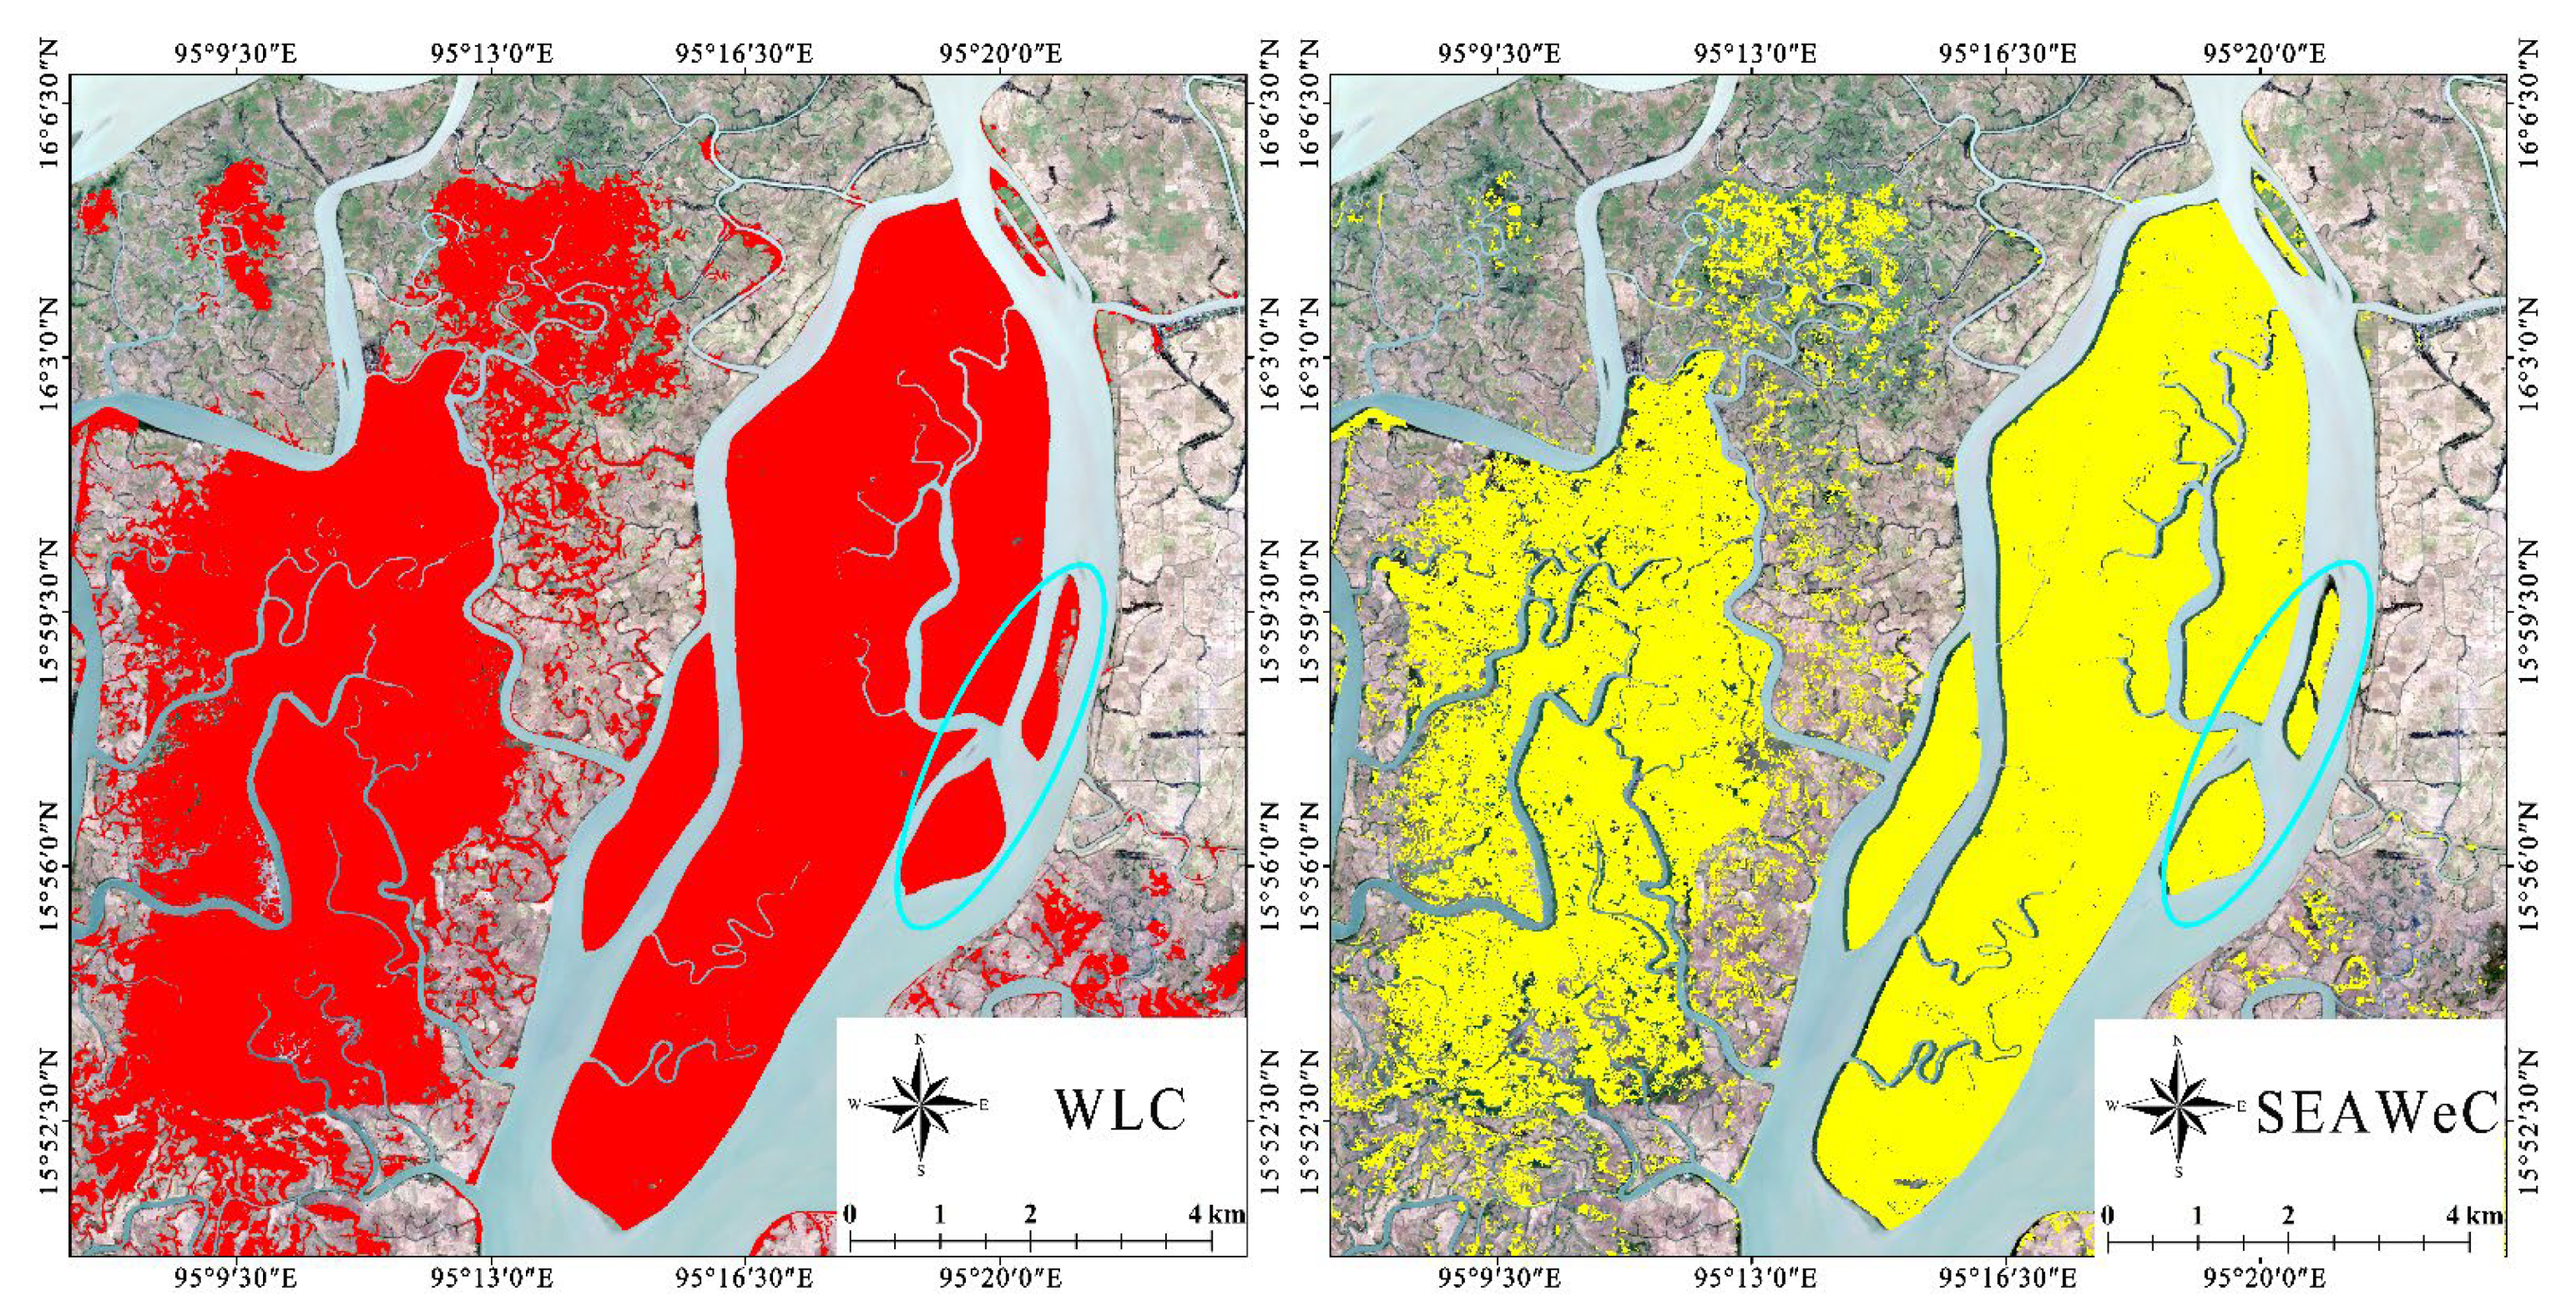
4.3. Comparison of the SEAWeC with Other Mappings

The effectiveness of the SEAWeC wetland was verified in more detail, according to the principles of (1) covering Southeast Asia, (2) similar spatial resolution, and (3) similar mapping time. Four existing wetland map products were chosen for comparison with SEAWeC [73,77,78], as listed in Table 6. Generally, the results were consistent, but small differences still existed because of the following reasons.
(1) The differences between remote sensing data and their spatial and temporal resolutions. GTF was based on Landsat 8 OLI optical images with a revisit of 16 days and a spatial resolution of 30 m, and SEAWeC was based on Sentinel-2 optical images with a revisit of 5 days and a spatial resolution of 10 m. Sentinel-2 has a higher spatiotemporal resolution, making it more sensitive for detecting wetland changes and identifying narrow and small areas of wetlands, such as tidal flats separated from adjacent coastal aquaculture ponds and coastal marshes, as shown in Figure 12. However, MLC uses MODIS data with a spatial resolution of 500 m, and it is difficult to detect small wetlands, which is the main reason for the difference between MLC and SEAWeC, as shown in Figure 13.
(2) Climate and human influences impact during different periods. Wetlands in different periods were affected by temperature, precipitation, and human activities, and the distribution and areas of wetlands varied, especially in the coastal areas of Southeast Asia, which may also cause differences between the GMW, WLC, and SEAWeC, as shown in Figure 14 and Figure 15.
(3) The inconsistency in the classification system. In the same mapping periods and the same remote sensing data source, WLC and SEAWeC also have some differences, and inconsistency in the classification system is the main source of these differences. WLC covers all land surface covers (including broad wetlands such as rice fields), while SEAWeC is mainly for various wetland cover types, as shown in Figure 13.

4.4. Implications of Precise Wetland Mapping on a Large Scale for the Ramsar Strategic Plan 2016–24

The Ramsar Convention and SDGs both widely recognize the necessity of strengthening the performance of wetland ecological functions and providing services within an appropriate region, especially at the basin level or in coastal regions. However, unified monitoring and data sharing of wetlands in large regions or the whole basin, especially in transnational major basins, such as the Mekong Basin, are still limited [62]. Currently, many reports have shown that there are significant challenges in the precise and large-scale monitoring of wetland ecosystems, especially the lack of monitoring technology and methods [18]. The development and application of remote sensing classification flow can quantify the spatial distribution of different types wetland ecosystems, detect their changes, and trace the reasons for their changes, solving the strategies in the Ramsar strategic plan 2016–24, such as (1) obtain wetland monitoring data, trace the driving factors affecting wetland degradation and loss, and evaluate wetland resources and ecosystem benefits, (2) strengthen contact with relevant stakeholders of wetlands, unify monitoring standards, to reduce wetland threats, and provide data exchange support, (3) use basic monitoring data to highlight wetland benefits in national/local policy strategies and plans, such as water, energy, mining, agriculture, tourism, urban development, infrastructure, industry, forestry, aquaculture, fisheries and other related key sectors, (4) respect the needs of wetland ecosystems, especially at the basin level or along a coastal zone to monitor whether fulfil wetland functions and provide ecological services within an appropriate scale. Furthermore, (5) the Ramsar parties must commit themselves to the protection and effective management of the existing Ramsar wetlands, and expand the coverage of the Ramsar Convention, through continuous efforts to increase the number and area of wetlands recognized by the Ramsar Convention, (6) in order to ensure the wise use of all wetlands in progress in order to enhance Ramsar Convention implementation, (7) initiate, complete, update and disseminate the national wetland inventories, and to promote the conservation and effective management of wetlands, (8) in river basins or coastal areas, integrated comprehensive resource management on an appropriate scale for wise using of wetlands. In addition, (9) widely demonstrated, disseminate and documented wetland functions, services and benefits, and (10) the precise wetlands mappings will help to strengthen the implementation of the three strategic objectives of the Ramsar strategic plan 2016–24 [4]. At the global and regional levels, this will help to develop related scientific guidance and technical methods and make them available for decision-makers and practitioners in appropriate formats and languages.
However, precise wetland mapping promotes an understanding of the status of wetlands and wetland-related SDGs. To the best of our knowledge, no research has explored the progress of wetland-related SDGs based on the analysis of wetland spatiotemporal distribution using remote sensing for the whole of Southeast Asia [18]. Wetlands as nature-based solutions are crucial for achieving the SDGs, and existing wetland remote sensing research in Southeast Asia has not comprehensively described the progress of countries or researchers in achieving these goals. For regions with vast wetlands, remote sensing data and technology are undoubtedly more convenient and effective than traditional field investigation technologies.

5. Discussion

Based on the Ramsar strategic plan 2016–24, our study built a unified wetland classification system in Southeast Asia. The GEE cloud computing platform, Sentinel-2 images with a spatial resolution of 10 m, and the IPG-MTWM method were used to quickly and accurately map the spatial cover of wetlands in Southeast Asia. We obtained the spatial distribution and area information of 11 types of wetlands in Southeast Asia and emphasized that wetlands have faced various threats from climate change and human activities. In 2022, China will host the 14th Meeting of the Conference of the Contracting Parties (COP14) (https://www.ramsar.org/event/14th-meeting-of-the-conference-of-the-contracting-parties, accessed on 1 May 2022) Our research results will help monitor and understand the achievements and challenges of wetland conversation. Since the Ramsar strategic plan 2016–24 is an interrelated community, geospatial and remote sensing technologies can help uncover the mysteries of mutual relations and promote connectivity. At the same time, supporting the Ramsar strategic plan 2016–24 requires the active involvement of government, research institutions, non-governmental organizations, and local stakeholders. The Ramsar wetland has made significant contributions to protecting natural wetlands and stopping the declining trend of wetland areas [2]. However, wetland protection in Southeast Asia has expanded significantly under the Ramsar Convention. Human impacts, including agricultural reclamation, urbanization, industrialization, aquaculture, and tourism development, are widespread in all wetland environments in Southeast Asia (Figure 16) [16]. The threat of Ramsar wetlands is also increasing, according to the report of the Ramsar Convention, the major threats faced by wetlands are pollution, agricultural invasion, construction land expansion, overfishing and harvesting, and alien species invasion [4]. These threats often involve some relatively small-scale wetlands. Compared with large-scale wetlands, which have received more attention and implemented more perfect protection measures. However, small-scale wetlands are often “absent” from existing wetland conversation systems, protection lists, and wetland resource investigations [83]. Unifying the classification system and integrating resource monitoring of large- and small-scale wetlands using effective monitoring methods is also crucial. In our study, we developed and applied precise remote sensing mapping flow to effectively promote small-scale wetland conservation, as follows:
(1)
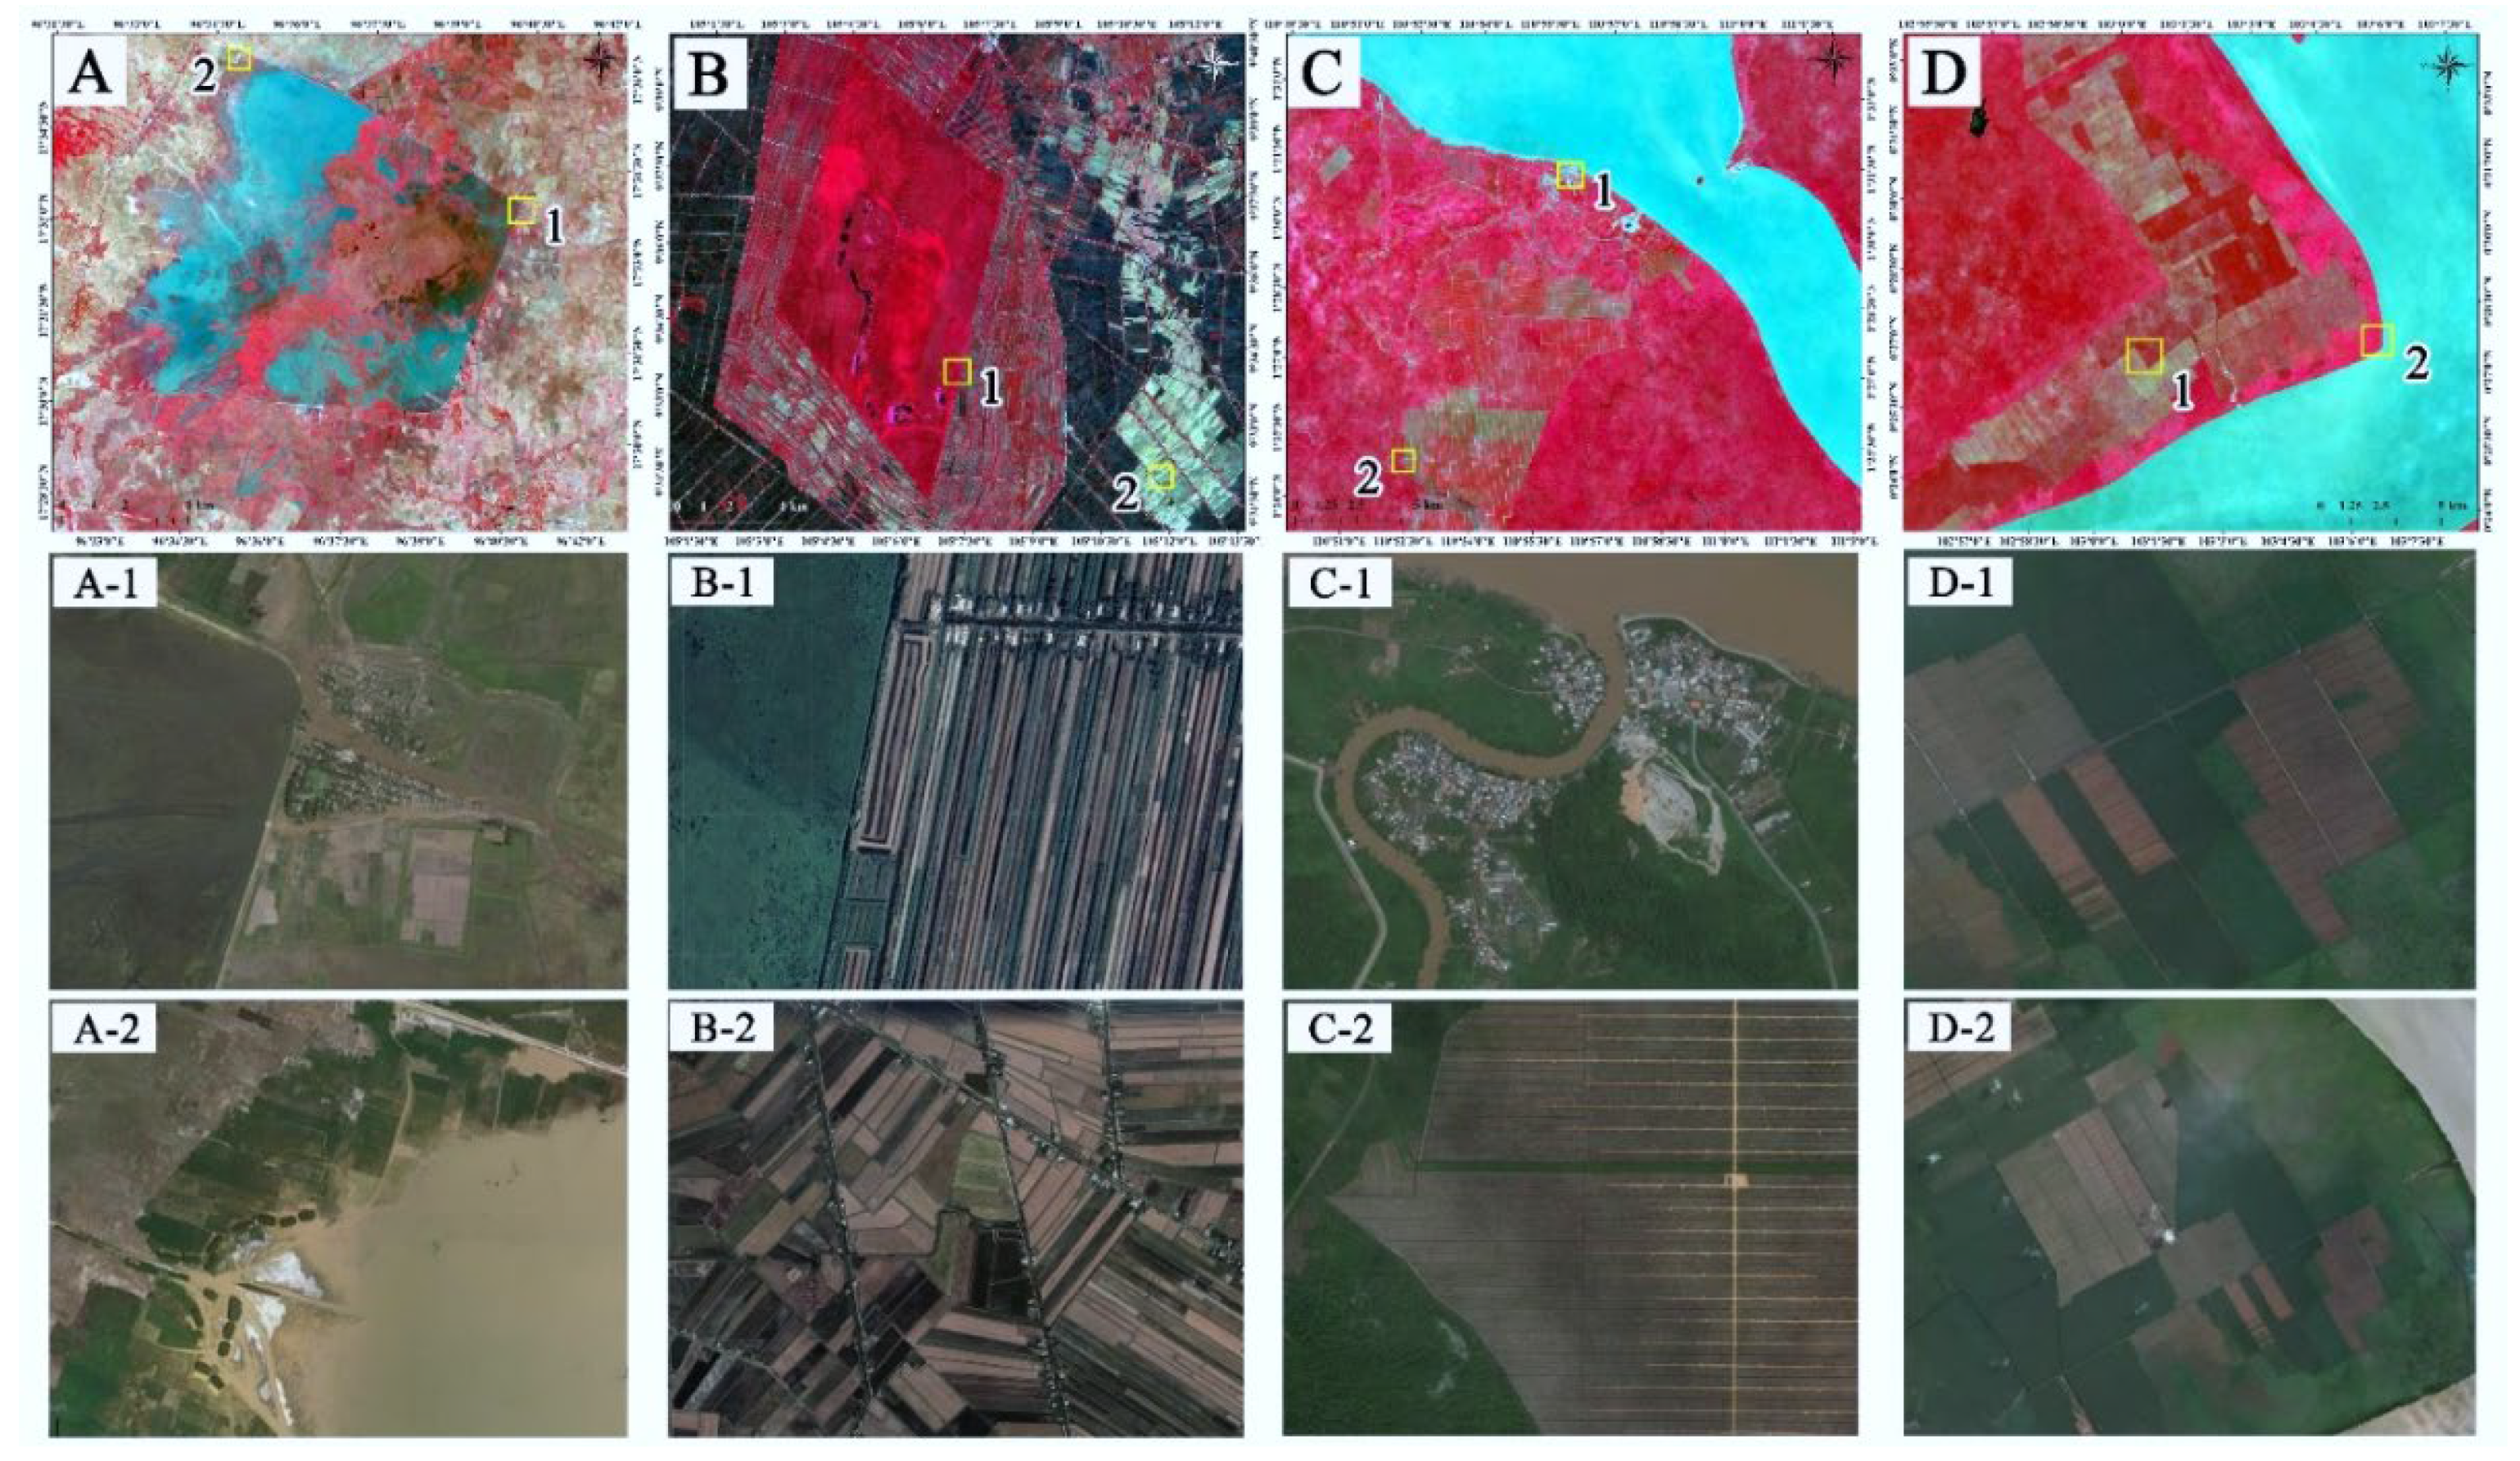
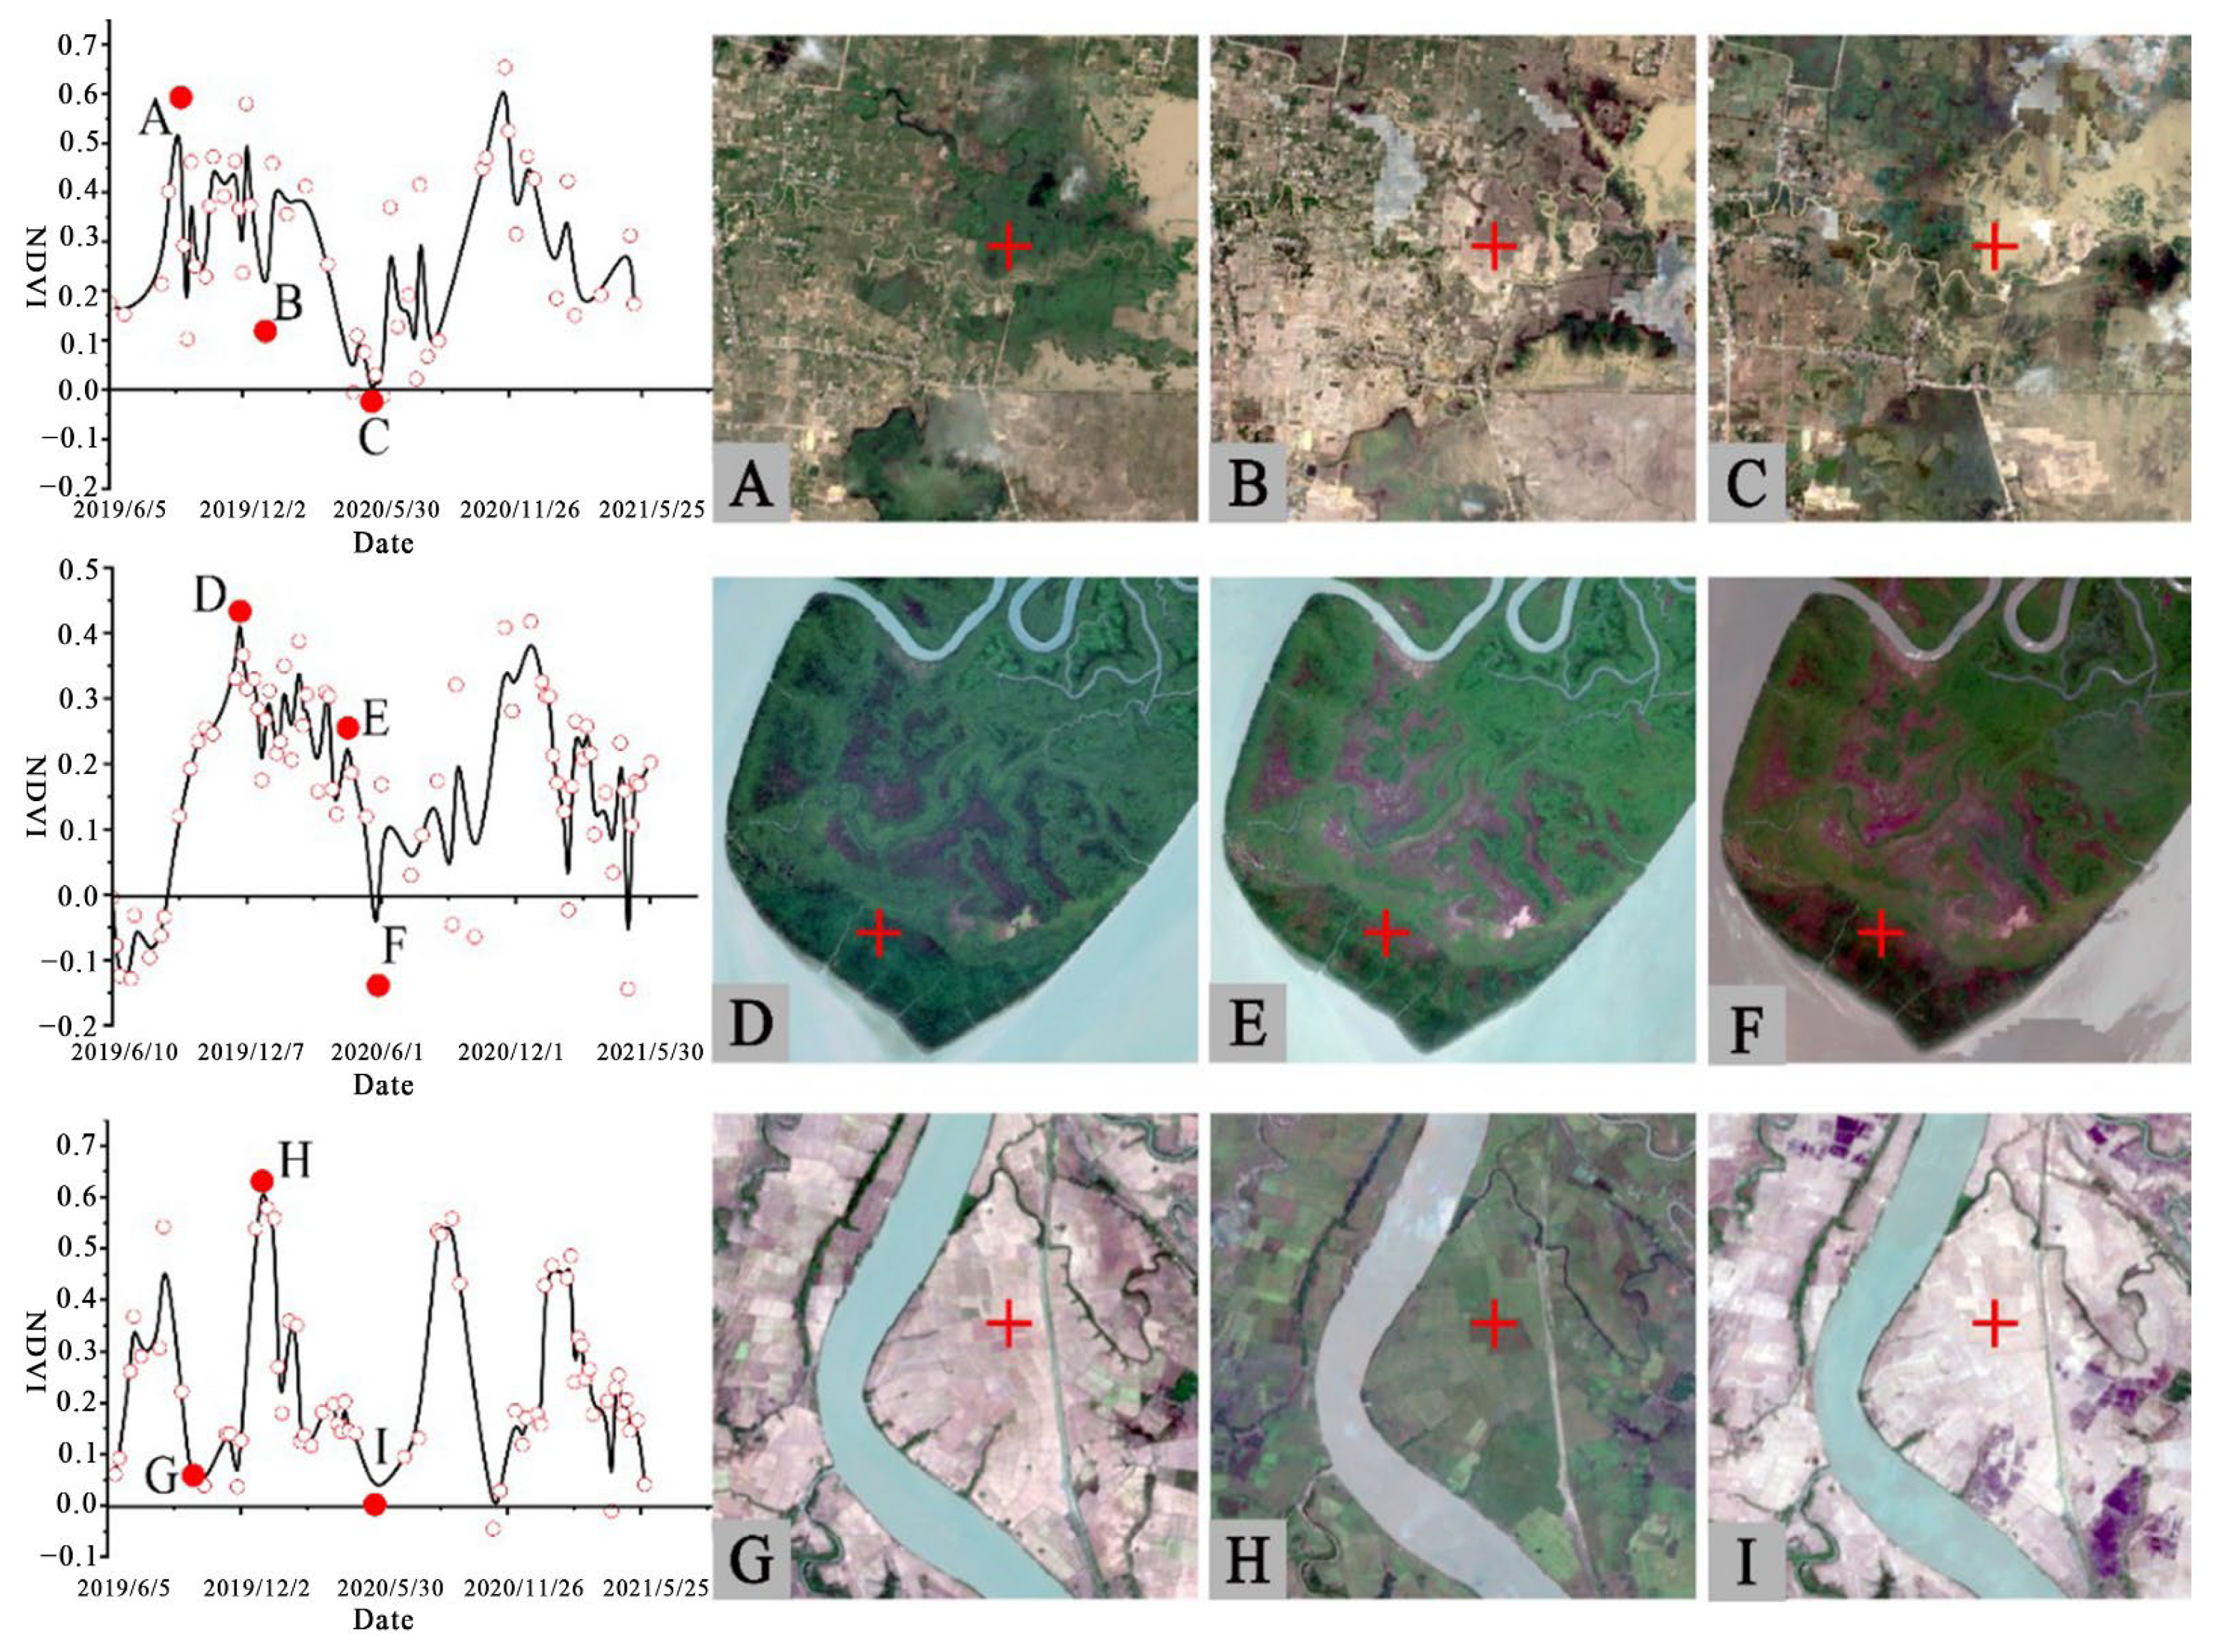
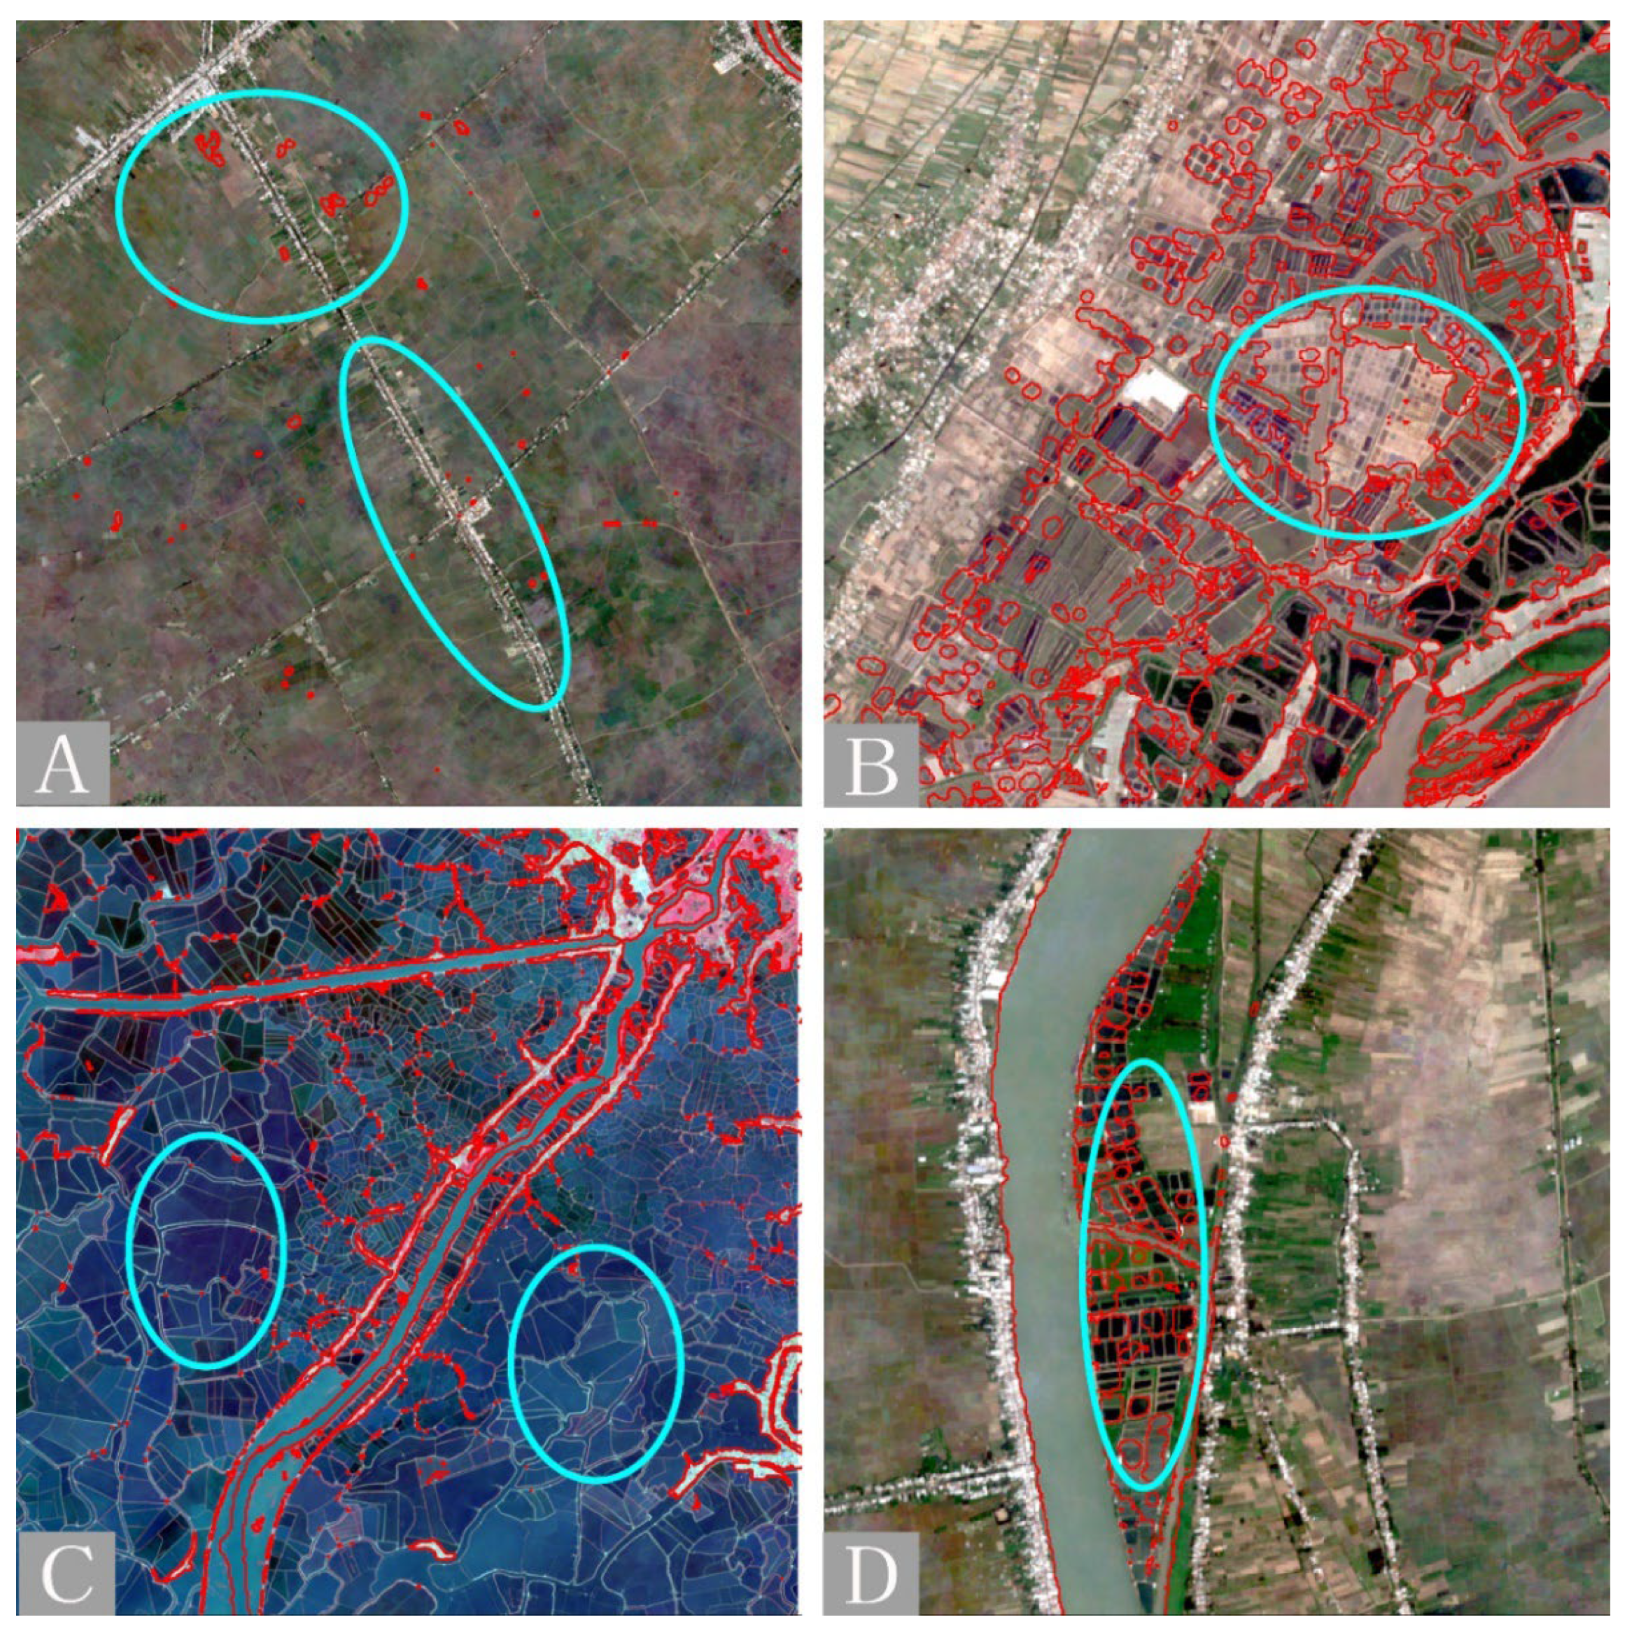
Precise spatial resolution. Most studies have used medium-low resolution remote sensing images, such as Landsat (30 m) and MODIS (500 m), because of free availability and time-series coverage. The Sentinel-2 images with a high resolution of 10 m was used in our study, and the results show that better spatial resolution can provide better wetland mapping details, as shown in Figure 9. However, to some extent, it requires a higher storage performance and increases the complexity of the computing process. Simultaneously, there were more detailed interference problems. With big data, cloud computing and artificial intelligence (AI) have made great progress, providing huge opportunities for obtaining and analyzing huge amounts of data to support the Ramsar strategic plan 2016–24 and the SDGs.
(2)
Precise wetland type. Try to cover all wetlands, including aquaculture ponds, streams, and ditches. Wetland pollution is a serious problem, particularly in small wetlands in densely populated areas. Ensuring the wise use of wetlands, maintaining the ecological characteristics of wetlands, and clarifying the spatial distribution of small-scale wetlands can assist in the realization of the Ramsar strategic plan 2016–24 and SDGs from a long-term perspective.
Figure 16. The expansion of human activities overlaid on the Sentinel-2 images: (A) Moeyungyi Wetland Wildlife Sanctuary Ramsar (Myanmar). (B) U Minh Thuong National Park Ramsar site (Vietnam). (C) Kuching Wetlands National Park Ramsar site (Malaysia). (D) Kampar River Basin (Indonesia).
Remotesensing 14 05730 g016
In the future, using remote sensing data and geographic information technology to support the Ramsar Convention and achieve the SDGs, wetland research can focus on four key aspects: (1) expanding the target objects to cover various wetlands, including small-scale wetlands, (2) integrating other satellite data, as Sentinel-1 and Gaofen-2, (3) long-term monitoring, track wetland dynamic changes, obtain change drivers, and improve protection measures, and (4) find focus sites, especially in urban areas.

6. Conclusions

The IPG-MTWM method provides a solution for precise tropical wetland mapping based on the GEE cloud platform to improve the knowledge and ability of wetland ecosystem assessment. Mapping various wetland types in Southeast Asia enabled us to capture the distribution characteristics of the wetlands. These results provide knowledge bases for parties in each region of Ramsar sites and national parks to identify conservation and restoration areas and guide the sustainable management of water, as well as natural and agricultural resources, from a hydro-ecological perspective. To support the implementation of wetland indicator monitoring related to the Ramsar Convention and the SDGs, the Ramsar information table and the Ramsar strategic plan 2016–24.
In the background of the Ramsar strategic plan 2016–24, our study focuses on wetlands in the whole of Southeast Asia (accounting for almost 17% of the land area in Southeast Asia), based on the GEE cloud platform, 255413 sentinel-2 SR images from 1 June 2019 to 31 May 2021, used IPG-MTWM method, applied wetland inundation fluctuation frequency features, wetland vegetation phenological features, and wetland distribution spatial geographical features, 11 wetland types were finally discriminated with high accuracy, the OA was 82.52%. Mapped SEAWeC can be used to evaluate the spatial distribution of the wetland ecosystem over 123,268.61 km2. The IPG-MTWM method was used to prove that it was suitable for the complex spatial structure and composition of tropical wetlands. SEAWeC will provide basic data for the monitoring, management, and restoration of wetland ecosystems in Southeast Asia. In the next step, we can enhance the mapping of small-scale wetlands by combining multi-source satellite data to enhance the mission of the Ramsar Convention using wetlands wisely.

Author Contributions

Conceptualization, Y.L. and H.Z.; methodology, Y.L. and K.L.; software, Y.L., Z.C. and Y.Z.; validation, Y.L., T.Y. and J.Z.; formal analysis, Y.L. and J.Z.; investigation, Y.L., K.L., Z.C. and Y.Z.; resources, Y.L., Z.C. and P.J.; data curation, Y.L., Z.C. and Y.Z.; writing original draft preparation, Y.L.; writing review and editing, Y.L. and H.Z.; visualization, Y.L. and Z.C.; supervision, Y.L. and H.Z.; project administration, H.Z.; funding acquisition, H.Z. All authors have read and agreed to the published version of the manuscript.

Funding

This research was supported by the National Forestry and Grassland Science Data Center (NFGSDC) Grant: Research and Development of Wetland Cover Map Products in Southeast Asia, Australia, and New Zealand, No. NFGSDC-2022-D01.

Data Availability Statement

Not applicable.

Conflicts of Interest

The authors declare no conflict of interest.

References

  1. Junk, W.J.; An, S.; Finlayson, C.M.; Gopal, B.; Květ, J.; Mitchell, S.A.; Mitsch, W.J.; Robarts, R.D. Current state of knowledge regarding the world’s wetlands and their future under global climate change: A synthesis. Aquat. Sci. 2013, 75, 151–167. [Google Scholar] [CrossRef] [Green Version]
  2. Russi, D.; ten Brink, P.; Farmer, A.; Badura, T.; Coates, D.; Förster, J.; Kumar, R.; Davidson, N. The Economics of Ecosystems and Biodiversity for Water and Wetlands; IEEP, Ramsar Secretariat: Gland, Switzerland, 2013. [Google Scholar]
  3. Davidson, N.C. How much wetland has the world lost? Long-term and recent trends in global wetland area. Mar. Freshw. Res. 2014, 65, 936–941. [Google Scholar] [CrossRef] [Green Version]
  4. Ramsar Convention Secretariat. The Fourth Ramsar Strategic Plan 2016–2024. In Ramsar Handbooks for the Wise Use of Wetlands, 5th ed.; Ramsar Convention Secretariat: Gland, Switzerland, 2016; Volume 2. [Google Scholar]
  5. Langan, C.; Farmer, J.; Rivington, M.; Smith, J.U. Tropical wetland ecosystem service assessments in East Africa; A review of approaches and challenges. Environ. Model. Softw. 2018, 102, 260–273. [Google Scholar] [CrossRef]
  6. Davidson, N.C.; Fluet-Chouinard, E.; Finlayson, C.M. Global extent and distribution of wetlands: Trends and issues. Mar. Freshw. Res. 2018, 69, 620. [Google Scholar] [CrossRef] [Green Version]
  7. Hughes, A.C. Understanding the Drivers of Southeast Asian Biodiversity Loss. Ecosphere 2017, 8, e01624. [Google Scholar] [CrossRef]
  8. Polidoro, B.A.; Carpenter, K.E.; Collins, L.; Duke, N.C.; Ellison, A.M.; Ellison, J.C.; Farnsworth, E.J.; Fernando, E.S.; Kathiresan, K.; Koedam, N.E.; et al. The Loss of Species: Mangrove Extinction Risk and Geographic Areas of Global Concern. PLoS ONE 2010, 5, e10095. [Google Scholar] [CrossRef]
  9. Giri, C.; Ochieng, E.; Tieszen, L.L.; Zhu, Z.; Singh, A.; Loveland, T.; Masek, J.; Duke, N. Status and Distribution of Mangrove Forests of the World Using Earth Observation Satellite Data. Glob. Ecol. Biogeogr. 2011, 20, 154–159. [Google Scholar] [CrossRef]
  10. Gopal, B. Future of Wetlands in Tropical and Subtropical Asia, Especially in the Face of Climate Change. Aquat. Sci. 2013, 75, 39–61. [Google Scholar] [CrossRef]
  11. Conklin, J.R.; Verkuil, Y.I.; Smith, B. Prioritizing Migratory Shorebirds for Conservation Action on the East Asian-Australasian Flyway; WWF-Hong Kong: Hong Kong, China, 2014. [Google Scholar]
  12. Abbott, B.W.; Bishop, K.; Zarnetske, J.P.; Minaudo, C.; Chapin, F.S.; Krause, S.; Hannah, D.M.; Conner, L.; Ellison, D.; Godsey, S.E.; et al. Human domination of the global water cycle absent from depictions and perceptions. Nat. Geosci. 2019, 12, 533–540. [Google Scholar] [CrossRef] [Green Version]
  13. Betbeder, J.; Gond, V.; Frappart, F.; Baghdadi, N.N.; Briant, G.; Bartholome, E. Mapping of Central Africa forested wetlands using remote sensing. IEEE J. Sel. Top. Appl. Earth Obs. Remote Sens. 2013, 7, 531–542. [Google Scholar] [CrossRef]
  14. Muñoz, D.F.; Muñoz, P.; Alipour, A.; Moftakhari, H.; Moradkhani, H.; Mortazavi, B. Fusing multisource data to estimate the effects of urbanization, sea level rise, and hurricane impacts on long-term wetland change dynamics. IEEE J. Sel. Top. Appl. Earth Obs. Remote Sens. 2021, 14, 1768–1782. [Google Scholar] [CrossRef]
  15. Ramsar Convention Secretariat. An Introduction to the Ramsar Convention on Wetlands; Ramsar Convention Secretariat: Gland, Switzerland, 2016. [Google Scholar]
  16. Ramsar Convention on Wetlands. Global Wetland Outlook: State of the World’s Wetlands and Their Services to People; Ramsar Convention Secretariat: Gland, Switzerland, 2018. [Google Scholar]
  17. Wetlands International Act Now on Wetlands for Achieving the Sustainable Development Goals (Agenda 2030). Available online: https://www.wetlands.org/publications/act-now-on-wetlands-for-agenda-2030/ (accessed on 13 December 2018).
  18. Jaramillo, F.; Desormeaux, A.; Hedlund, J.; Jawitz, J.; Clerici, N.; Piemontese, L.; Rodríguez-Rodriguez, J.; Anaya, J.; Blanco-Libreros, J.; Borja, S.; et al. Priorities and interactions of sustainable development goals (SDGs) with focus on wetlands. Water 2019, 11, 619. [Google Scholar] [CrossRef] [Green Version]
  19. Allen, C.; Metternicht, G.; Wiedmann, T. Prioritising SDG targets: Assessing baselines, gaps and interlinkages. Sustain. Sci. 2019, 14, 421–438. [Google Scholar] [CrossRef]
  20. Thorslund, J.; Jarsjo, J.; Jaramillo, F.; Jawitz, J.W.; Manzoni, S.; Basu, N.B.; Chalov, S.R.; Cohen, M.J.; Creed, I.F.; Goldenberg, R.; et al. Wetlands as large-scale nature-based solutions: Status and challenges for research, engineering and management. Ecol. Eng. 2017, 108, 489–497. [Google Scholar] [CrossRef]
  21. Ramsar Convention on Wetlands. Scaling Up Wetland Conservation, Wise Use and Restoration to Achieve the Sustainable Developmenct Goals 2018. Available online: https://www.ramsar.org/sites/default/files/documents/library/wetlands_sdgs_e.pdf (accessed on 1 February 2019).
  22. Mitsch, W.J.; Bernal, B.; Hernandez, M.E. Ecosystem services of wetlands. Int. J. Biodivers. Sci. Ecosyst. Serv. Manag. 2015, 11, 1–4. [Google Scholar] [CrossRef] [Green Version]
  23. McInnes, R.J.; Simpson, M.; Lopez, B.; Hawkins, R.; Shore, R. Wetland ecosystem services and the Ramsar Convention: An assessment of needs. Wetlands 2017, 37, 123–134. [Google Scholar] [CrossRef]
  24. Maltby, E. Wetland management goals: Wise use and conservation. Landsc. Urban Plan. 1991, 20, 9–18. [Google Scholar] [CrossRef]
  25. Matthews, E.; Fung, I. Methane emission from natural wetlands: Global distribution, area, and environmental characteristics of sources. Glob. Biogeochem. Cycles 1987, 1, 61–86. [Google Scholar] [CrossRef]
  26. Finlayson, C.M.; Davidson, N.C.; Spiers, A.G.; Stevenson, N.J. Global Wetland Inventory-Current Status and Future Priorities. Mar. Freshw. Res. 1999, 50, 717–727. [Google Scholar] [CrossRef]
  27. Global Lakes and Wetlands Database. Available online: https://www.worldwildlife.org/pages/global-lakes-and-wetlands-database (accessed on 1 September 2021).
  28. Pekel, J.F.; Cottam, A.; Gorelick, N.; Belward, A.S. High-resolution mapping of global surface water and its long-term changes. Nature 2016, 540, 418–422. [Google Scholar] [CrossRef]
  29. Gong, P.; Li, X.; Wang, J.; Bai, Y.; Chen, B.; Hu, T.; Liu, X.; Xu, B.; Yang, J.; Zhang, W.; et al. Annual maps of global artificial impervious area (GAIA) between 1985 and 2018. Remote Sens. Environ. 2020, 236, 111510. [Google Scholar] [CrossRef]
  30. Murray, N.J.; Phinn, S.R.; DeWitt, M.; Ferrari, R.; Johnston, R.; Lyons, M.B.; Clinton, N.; Thau, D.; Fuller, R.A. The global distribution and trajectory of tidal flats. Nature 2019, 565, 222–225. [Google Scholar] [CrossRef] [PubMed]
  31. Lehner, B.; Liermann, C.R.; Revenga, C.; Vörösmarty, C.; Fekete, B.; Crouzet, P.; Döll, P.; Endejan, M.; Frenken, K.; Magome, J.; et al. High-resolution mapping of the world’s reservoirs and dams for sustainable river-flow management. Front. Ecol. Environ. 2011, 9, 494–502. [Google Scholar] [CrossRef] [Green Version]
  32. GMW—Global Mangrove Watch (1996–2020). Available online: https://data.unep-wcmc.org/datasets/45,%201996%E2%80%932016 (accessed on 19 September 2021).
  33. Available online: https://www.feow.org/ecoregions/interactive-map (accessed on 14 October 2021).
  34. Zhang, Z.; Xu, N.; Li, Y.; Li, Y. Subcontinental-scale mapping of tidal wetland composition for East Asia: A novel algorithm integrating satellite tide-level and phenological features. Remote Sens. Environ. 2022, 269, 112799. [Google Scholar] [CrossRef]
  35. Mao, D.; Wang, Z.; Du, B.; Li, L.; Tian, Y.; Jia, M.; Zeng, Y.; Song, K.; Jiang, M.; Wang, Y. National wetland mapping in China: A new product resulting from object-based and hierarchical classification of Landsat 8 OLI images. ISPRS J. Photogramm. 2020, 164, 11–25. [Google Scholar] [CrossRef]
  36. Mahdianpari, M.; Salehi, B.; Mohammadimanesh, F.; Brisco, B.; Homayouni, S.; Gill, E.; DeLancey, E.R.; Bourgeau-Chavez, L. Big data for a big country: The first generation of Canadian wetland inventory map at a spatial resolution of 10-m using Sentinel-1 and Sentinel-2 data on the Google Earth Engine cloud computing platform. Can. J. Remote Sens. 2020, 46, 15–33. [Google Scholar] [CrossRef]
  37. Zhang, E.; Wang, Y.; Sun, W.; Shen, J. Holocene Asian monsoon evolution revealed by a pollen record from an alpine lake on the southeastern margin of the Qinghai-Tibetan Plateau, China. Clim. Past 2016, 12, 415–427. [Google Scholar] [CrossRef] [Green Version]
  38. Prasad, K.A.; Ottinger, M.; Wei, C.; Leinenkugel, P. Assessment of coastal aquaculture for India from Sentinel-1 SAR time series. Remote Sens. 2019, 11, 357. [Google Scholar] [CrossRef] [Green Version]
  39. Campbell, A.D.; Wang, Y. Salt marsh monitoring along the mid-Atlantic coast by Google Earth Engine enabled time series. PLoS ONE 2020, 15, e0229605. [Google Scholar] [CrossRef] [Green Version]
  40. Cissell, J.R.; Delgado, A.M.; Sweetman, B.M.; Steinberg, M.K. Monitoring mangrove forest dynamics in Campeche, Mexico, using Landsat satellite data. Remote Sens. Appl. Soc. Environ. 2018, 9, 60–68. [Google Scholar] [CrossRef]
  41. Xiao, X.; Boles, S.; Frolking, S.; Li, C.; Babu, J.Y.; Salas, W.; Moore, B. Mapping Paddy Rice Agriculture in South and Southeast Asia Using Multi-Temporal MODIS Images. Remote Sens. Environ. 2006, 100, 95–113. [Google Scholar] [CrossRef]
  42. Xiao, H.; Su, F.; Fu, D.; Lyne, V.; Liu, G.; Pan, T.; Teng, J. Optimal and Robust Vegetation Mapping in Complex Environments Using Multiple Satellite Imagery: Application to Mangroves in Southeast Asia. Int. J. Appl. Earth Obs. Geoinf. 2021, 99, 102320. [Google Scholar] [CrossRef]
  43. Aslan, A.; Rahman, A.F.; Warren, M.W.; Robeson, S.M. Mapping Spatial Distribution and Biomass of Coastal Wetland Vegetation in Indonesian Papua by Combining Active and Passive Remotely Sensed Data. Remote Sens. Environ. 2016, 183, 65–81. [Google Scholar] [CrossRef]
  44. Anda, M.; Ritung, S.; Suryani, E.; Sukarman; Hikmat, M.; Yatno, E.; Mulyani, A.; Subandiono, R.E.; Suratman; Husnain. Revisiting Tropical Peatlands in Indonesia: Semi-Detailed Mapping, Extent and Depth Distribution Assessment. Geoderma 2021, 402, 115235. [Google Scholar] [CrossRef]
  45. Dang, A.T.N.; Kumar, L.; Reid, M.; Nguyen, H. Remote sensing approach for monitoring coastal wetland in the Mekong Delta, Vietnam: Change trends and their driving forces. Remote Sens. 2021, 13, 3359. [Google Scholar] [CrossRef]
  46. Wua, Q.; Lane, C.R.; Li, X.; Zhao, K.; Zhou, Y.; Clinton, N.; DeVries, B.; Golden, H.E.; Lang, M.W. Integrating LiDAR data and multi-temporal aerial imagery to map wetland inundation dynamics using Google Earth Engine. Remote Sens. Environ. 2019, 228, 1–13. [Google Scholar] [CrossRef] [Green Version]
  47. Zeng, L.; Wardlow, B.D.; Xiang, D.; Hu, S.; Li, D. A review of vegetation phenological metrics extraction using time-series, multispectral satellite data. Remote Sens. Environ. 2020, 237, 111511. [Google Scholar] [CrossRef]
  48. Gxokwe, S.; Dube, T.; Mazvimavi, D. Leveraging Google Earth Engine platform to characterize and map small seasonal wetlands in the semi-arid environments of South Africa. Sci. Total Environ. 2022, 803, 150139. [Google Scholar] [CrossRef]
  49. Chen, C.; Ma, Y.; Ren, G.; Wang, J. Aboveground biomass of salt-marsh vegetation in coastal wetlands: Sample expansion of in situ hyperspectral and Sentinel-2 data using a generative adversarial network. Remote Sens. Environ. 2022, 270, 112885. [Google Scholar] [CrossRef]
  50. Wang, C.; Jiang, W.; Deng, Y. Long time series water extent analysis for SDG 6.6. 1 based on the GEE platform: A case study of Dongting Lake. IEEE J. Sel. Top. Appl. Earth Obs. Remote Sens. 2021, 15, 490–503. [Google Scholar] [CrossRef]
  51. Biswas, N.K.; Hossain, F.; Bonnema, M.; Okeowo, M.A.; Lee, H. An altimeter height extraction technique for dynamically changing rivers of South and South-East Asia. Remote Sens. Environ. 2019, 221, 24–37. [Google Scholar] [CrossRef]
  52. Hardy, A.; Oakes, G.; Ettritch, G. Tropical wetland (TropWet) mapping tool: The automatic detection of open and vegetated waterbodies in Google Earth engine for tropical wetlands. Remote Sens. 2020, 12, 1182. [Google Scholar] [CrossRef] [Green Version]
  53. Ivory, S.J.; Mcglue, M.M.; Spera, S.; Silva, A.; Bergier, I. Vegetation, rainfall, and pulsing hydrology in the Pantanal, the world’s largest tropical wetland. Environ. Res. Lett. 2019, 14, 124017. [Google Scholar] [CrossRef] [Green Version]
  54. Phiri, D.; Simwanda, M.; Salekin, S.; Nyirenda, V.R.; Murayama, Y.; Ranagalage, M. Sentinel-2 Data for Land Cover/Use Mapping: A Review. Remote Sens. 2020, 12, 2291. [Google Scholar] [CrossRef]
  55. Bruzzone, L.; Bovolo, F.; Paris, C.; Solano-Correa, Y.T.; Zanetti, M.; Fernández-Prieto, D. Analysis of multitemporal Sentinel-2 images in the framework of the ESA Scientific Exploitation of Operational Missions. In Proceedings of the 2017 9th International Workshop on the Analysis of Multitemporal Remote Sensing Images (MultiTemp), Brugge, Belgium, 27–29 June 2017; pp. 1–4. [Google Scholar]
  56. Xu, Y.; Yu, L.; Feng, D.; Peng, D.; Li, C.; Huang, X.; Lu, H.; Gong, P. Comparisons of three recent moderate resolution African land cover datasets: CGLS-LC100, ESA-S2-LC20, and FROM-GLC-Africa30. Int. J. Remote Sens. 2019, 40, 6185–6202. [Google Scholar] [CrossRef]
  57. Gromny, E.; Lewiński, S.; Rybicki, M.; Malinowski, R.; Krupiński, M.; Nowakowski, A.; Jenerowicz, M. Creation of training dataset for Sentinel-2 land cover classification. In Proceedings of the Photonics Applications in Astronomy, Communications, Industry, and High-Energy Physics Experiments 2019, Wilga, Poland, 6 November 2019; p. 111763D. [Google Scholar]
  58. ESA. Mapping Germany’s Agricultural Landscape; ESA, Ed.; 2017. Available online: https://www.esa.int/ESA_Multimedia/Images/2017/2008/Mapping_Germany_s_agricultural_landscape (accessed on 19 September 2021).
  59. Sitokonstantinou, V.; Papoutsis, I.; Kontoes, C.; Lafarga Arnal, A.; Armesto Andrés, A.P.; Garraza Zurbano, J.A. Scalable Parcel-Based Crop Identification Scheme Using Sentinel-2 Data Time-Series for the Monitoring of the Common Agricultural Policy. Remote Sens. 2018, 10, 911. [Google Scholar] [CrossRef] [Green Version]
  60. Van Deventer, H.; Linström, A.; Durand, J.F.; Naidoo, L.; Cho, M.A. Deriving the Maximum Extent and Hydroperiod of Open Water from Sentinel-2 Imagery for Global Sustainability and Biodiversity Reporting for Wetlands. Water SA 2022, 48, 75–89. [Google Scholar] [CrossRef]
  61. Pahlevan, N.; Chittimalli, S.K.; Balasubramanian, S.V.; Vellucci, V. Sentinel-2/Landsat-8 Product Consistency and Implications for Monitoring Aquatic Systems. Remote Sens. Environ. 2019, 220, 19–29. [Google Scholar] [CrossRef]
  62. Fitoka, E.; Tompoulidou, M.; Hatziiordanou, L.; Apostolakis, A.; Höfer, R.; Weise, K.; Ververis, C. Water-related ecosystems’ mapping and assessment based on remote sensing techniques and geospatial analysis: The SWOS national service case of the Greek Ramsar sites and their catchments. Remote Sens. Environ. 2020, 245, 111795. [Google Scholar] [CrossRef]
  63. Weise, K.; Höfer, R.; Franke, J.; Guelmami, A.; Simonson, W.; Muro, J.; O’Connor, B.; Strauch, A.; Flink, S.; Eberle, J.; et al. Wetland extent tools for SDG 6.6. 1 reporting from the Satellite-based Wetland Observation Service (SWOS). Remote Sens. Environ. 2020, 247, 111892. [Google Scholar] [CrossRef]
  64. Sun, Y.; Huang, J.; Ao, Z.; Lao, D.; Xin, Q. Deep learning approaches for the mapping of tree species diversity in a tropical wetland using airborne LiDAR and high-spatial-resolution remote sensing images. Forests 2019, 10, 1047. [Google Scholar] [CrossRef] [Green Version]
  65. Hu, X.; Zhang, P.; Zhang, Q.; Wang, J. Improving wetland cover classification using artificial neural networks with ensemble techniques. GISci. Remote Sens. 2021, 58, 603–623. [Google Scholar] [CrossRef]
  66. Zhao, M.; Zhou, Y.; Li, X.; Cheng, W.; Zhou, C.; Ma, T.; Li, M.; Huang, K. Mapping urban dynamics (1992–2018) in Southeast Asia using consistent nighttime light data from DMSP and VIIRS. Remote Sens. Environ. 2020, 248, 111980. [Google Scholar] [CrossRef]
  67. Tian, S.; Wang, S.; Bai, X.; Luo, G.; Li, Q.; Yang, Y.; Hu, Z.; Li, C.; Deng, Y. Global patterns and changes of carbon emissions from land use during 1992–2015. Environ. Sci. Ecotechnol. 2021, 7, 100108. [Google Scholar] [CrossRef]
  68. Lin, H.I.; Yu, Y.Y.; Wen, F.I.; Liu, P. Status of food security in East and Southeast Asia and challenges of climate change. Climate 2022, 10, 40. [Google Scholar] [CrossRef]
  69. Wang, T.; Wang, W.; Xie, G.; Li, Z.; Fan, X.; Yang, Q.; Wu, X.; Cao, P.; Liu, Y.; Yang, R.; et al. Human population history at the crossroads of East and Southeast Asia since 11,000 years ago. Cell 2021, 184, 3829–3841.e21. [Google Scholar] [CrossRef]
  70. Von Rintelen, K.; Arida, E.; Häuser, C.; von Rintelen, K.; Arida, E.; Häuser, C.; von Rintelen, K.; Arida, E.; Häuser, C.; von Rintelen, K.; et al. A review of biodiversity-related issues and challenges in megadiverse Indonesia and other Southeast Asian countries. Res. Ideas Outcomes 2017, 3, e20860. [Google Scholar] [CrossRef] [Green Version]
  71. Segarra, J.; Buchaillot, M.L.; Araus, J.L.; Kefauver, S.C. Remote sensing for precision agriculture: Sentinel-2 improved features and applications. Agronomy 2020, 10, 641. [Google Scholar] [CrossRef]
  72. Zhu, Z.; Wang, S.; Woodcock, C.E. Improvement and expansion of the Fmask algorithm: Cloud, cloud shadow, and snow detection for Landsats 4–7, 8, and Sentinel 2 images. Remote Sens. Environ. 2015, 159, 269–277. [Google Scholar] [CrossRef]
  73. Maniatis, D.; Dionisio, D.; Guarnieri, L.; Marchi, G.; Mollicone, D.; Díaz, A.S.P.; Morales, C. Toward a More Representative Monitoring of Land-Use and Land-Cover Dynamics: The Use of a Sample-Based Assessment through Augmented Visual Interpretation Using Open Foris Collect Earth. Remote Sens. 2021, 13, 4197. [Google Scholar] [CrossRef]
  74. Luo, J.; Zhang, W.; Su, J.; Xiang, F. Hexagonal convolutional neural networks for hexagonal grids. IEEE Access 2019, 7, 142738–142749. [Google Scholar] [CrossRef]
  75. Liu, Y.; Zhang, H.Q.; Zhang, M.; Cui, Z.Y.; Lei, K.X.; Zhang, J.; Yang, T.D.; Ji, P. Vietnam wetland cover map: Using hydro-periods Sentinel-2 images and Google Earth Engine to explore the mapping method of tropical wetland. Int. J. Appl. Earth Obs. Geoinf. 2022. (submitted). [Google Scholar]
  76. Niu, Z.G.; Gong, P.; Cheng, X.; Guo, J.H.; Wang, L.; Huang, H.B.; Shen, S.Q.; Wu, Y.Z.; Wang, X.F.; Wang, X.W.; et al. Geographical characteristics of China’s wetlands derived from remotely sensed data. Sci. China Ser. D-Earth Sci. 2009, 52, 723–738. [Google Scholar] [CrossRef]
  77. Du, W.; Li, J.; Bao, A.; Wang, B. Mapping Changes in the Glaciers of the Eastern Tienshan Mountains during 1977–2013 Using Multitemporal Remote Sensing. J. Appl. Remote Sens. 2014, 8, 84683. [Google Scholar] [CrossRef] [Green Version]
  78. Li, Y.; Niu, Z. Systematic Method for Mapping Fine-Resolution Water Cover Types in China Based on Time Series Sentinel-1 and 2 Images. Int. J. Appl. Earth Obs. Geoinf. 2022, 106, 102656. [Google Scholar] [CrossRef]
  79. D’Andrimont, R.; Verhegghen, A.; Lemoine, G.; Kempeneers, P.; Meroni, M.; van der Velde, M. From Parcel to Continental Scale–A First European Crop Type Map Based on Sentinel-1 and LUCAS Copernicus in-Situ Observations. Remote Sens. Environ. 2021, 266, 112708. [Google Scholar] [CrossRef]
  80. Gong, P.; Li, X.; Zhang, W. 40-Year (1978–2017) Human Settlement Changes in China Reflected by Impervious Surfaces from Satellite Remote Sensing. Sci. Bull. 2019, 64, 756–763. [Google Scholar] [CrossRef] [Green Version]
  81. Stehman, S.V.; Foody, G.M. Key Issues in Rigorous Accuracy Assessment of Land Cover Products. Remote Sens. Environ. 2019, 231, 111199. [Google Scholar] [CrossRef]
  82. Zheng, Y.; Niu, Z.; Gong, P.; Wang, J. A Database of Global Wetland Validation Samples for Wetland Mapping. Sci. Bull. 2015, 60, 428–434. [Google Scholar] [CrossRef] [Green Version]
  83. Mwita, E.; Menz, G.; Misana, S.; Becker, M.; Kisanga, D.; Boehme, B. Mapping small wetlands of Kenya and Tanzania using remote sensing techniques. Int. J. Appl. Earth Obs. Geoinf. 2013, 21, 173–183. [Google Scholar] [CrossRef]
Figure 1. A map of the study area.
Remotesensing 14 05730 g001
Figure 2. Geographic, temporal, and spectral coverage of the Sentinel-2 Level-2 surface reflection archive between 1 June 2019 and 31 May 2021 in Southeast Asia: (A) Total image number of a single pixel. (B) The number of images per month. (C) Spectral display of B1, B2, B3, B4, and B8.
Remotesensing 14 05730 g002
Figure 3. The schematic flowchart of IPG- MTWM method.
Remotesensing 14 05730 g003
Figure 4. The inundation dynamic of the Tonle Sap lake: (A,B) are the NDWI values and Sentinel-2 images of two sites of the Tonle Sap lake.
Remotesensing 14 05730 g004
Figure 5. SNIC parameter description.
Remotesensing 14 05730 g005
Figure 6. Mixed vegetation and waterbody wetlands phenological features: (AC) are the NDVI values and Sentinel-2 images of inland swamp at the maximum green degree time, end of the growing season, and end of the season, respectively. (DF) are the NDVI values and Sentinel-2 images of coastal swamp at the maximum green degree time, end of the growing season, and end of the season, respectively. (GI) are the NDVI values and Sentinel-2 images of agricultural land at the beginning of the growing season, maximum green degree time, and end of the growing season, respectively.
Remotesensing 14 05730 g006
Figure 7. Automatic mapping errors: (A,B) are examples of misclassification as roads and bare land. (C,D) are embankments misclassification in aquaculture ponds.
Remotesensing 14 05730 g007
Figure 8. The spatial distribution of samples.
Remotesensing 14 05730 g008
Figure 9. The mapping results. (A) Lake and inland swamp. (B) River. (C) Coastal swamp and reservoir/pond.
Remotesensing 14 05730 g009
Figure 10. The SEAWeC.
Remotesensing 14 05730 g010
Figure 11. The wetlands statistics data of each country in Southeast Asia from the SEAWeC, 2020.
Remotesensing 14 05730 g011
Figure 12. A comparison of the SEAWeC from the GTF product.
Remotesensing 14 05730 g012
Figure 13. A comparison of the SEAWeC from the MLC product.
Remotesensing 14 05730 g013
Figure 14. A comparison of the SEAWeC from the GMW product.
Remotesensing 14 05730 g014
Figure 15. A comparison of the SEAWeC from the WLC product.
Remotesensing 14 05730 g015
Table 1. The Southeast Asia wetland cover map classification system.
Category ICategory IIFeatures
Inland wetlandsInland swamp(1) Vegetation and water mixed areas, including forest and shrub wetlands;
(2) Irregular shape;
(3) No obvious phenological dynamics in tropical areas;
(4) Influenced by inundation frequency.
Inland marsh(1) Herbaceous vegetation and water mixed areas;
(2) Irregular shape, smooth texture;
(3) No obvious phenological dynamics in tropical areas;
(4) Influenced by inundation frequency.
Lake(1) Standing waterbody;
(2) Smooth texture;
(3) No obvious phenological dynamics;
(4) Influenced by inundation frequency.
River(1) Standing waterbody;
(2) Linear shape and smooth texture;
(3) No obvious phenological dynamics;
(4) Influenced by inundation frequency.
Coastal wetlandsCoastal swamp(1) Vegetation and water mixed areas, including forest and shrub wetlands;
(2) Irregular shape and smooth texture;
(3) Obvious phenological dynamics;
(4) Influenced by inundation frequency.
Coastal marsh(1) Herbaceous vegetation and water mixed areas;
(2) Irregular shape, smooth texture;
(3) No obvious phenological dynamics in tropical areas;
(4) Influenced by inundation frequency.
Tidal flat(1) Sand beach, rocky shore, and coral reef mixed areas;
(2) Influenced by inundation frequency.
Lagoon(1) Standing waterbody;
(2) Smooth texture;
(3) No obvious phenological dynamics;
(4) Influenced by inundation frequency.
Estuarine water(1) Boundary of inland river and coastline;
(2) Irregular shape;
(3) Obvious phenological dynamics;
(4) Influenced by inundation frequency.
Human-made wetlandsReservoir/pond/salt pan(1) Artificial polygon waterbody with obvious dam;
(2) Regular shape;
(3) Obvious inundation frequency.
Canal/channel(1) Artificial waterbody with obvious dam;
(2) Linear shape.
Table 2. The referenced wetland mapping products for collecting samples.
DatasetTimeSpatial
Resolution
Purpose of this ResearchSource
The global distribution and trajectory of tidal flats (GTF)201430 mTo extract validation sample reference data of tidal flat wetlands.https://www.intertidal.app, accessed on 1 September 2021
Global Reservoir and Dam Database (GRanD)201930 mTo extract validation sample reference data of reservoir wetlands. http://globaldamwatch.org/data/#core_global, accessed on 1 September 2021
Global Lakes and Wetlands Database: Lakes and Wetlands Grid (GLWD)The 1990s30″To extract validation sample reference data of lake wetlands.https://www.worldwildlife.org/publications/global-lakes-and-wetlands-database-lakes-and-wetlands-grid-level-3, accessed on 1 September 2021
Global Mangrove Watch (GMW)2016To extract validation sample reference data of mangrove wetlands.https://data.unep-wcmc.org/datasets/45, accessed on 1 September 2021
Landsat Global Inland Water (LGIW)200030 mTo extract validation sample reference data of river wetlands.http://data.ess.tsinghua.edu.cn/, accessed on 1 September 2021
Worldwide land cover mapping (WLC)202010 mTo extract validation sample reference data of no-wetlands.https://esa-worldcover.org/en, accessed on 1 September 2021
MODIS Land Cover (MLC)2020500 mTo extract permanent wetlands.https://lpdaac.usgs.gov/products/mcd12q1v006/, accessed on 1 September 2021
Database for Hydrological Time Series of Inland Waters (DAHITI)201810 mTo extract validation sample reference data of inland waters.https://dahiti.dgfi.tum.de/en/, accessed on 1 September 2021
Table 3. The mapping accuracy of the SEAWeC.
ClassificationInland InlandLakeRiverCoastalCoastalTidalEstuarineLagoonReservoir/Canal/Non-WetlandTotalPA%F1
SwampMarshSwampMarshFlatWaterPondChannel
Inland swamp98353853734114164612120081.92%0.81
Inland marsh4991467243793124215110083.09%0.80
Lake781332411417242933352931160083.25%0.81
River463813232528182732362736160082.69%0.82
Coastal swamp36541623196466347721261469240081.83%0.81
Coastal marsh262221196511392933146521140081.36%0.80
Tidal flat1372211362515115821181226176085.85%0.84
Estuarine water39182734793154117617121419152077.37%0.76
Lagoon8431262513181510589612122586.37%0.84
Reservoir/pond51373727115847893046100078.90%0.79
Canal/channel61323919211632782331100082.30%0.81
Non-wetland2311393484625181334321681200084.05%0.83
Total11991099160915992399139917591519122410001000199917,805--
UA%81.98%83.17%82.78%82.74%81.87%81.42%85.90%77.42%86.44%78.90%82.30%84.09%-82.52%-
Table 4. The areas of the various wetland types in Southeast Asia Wetland Cover map.
Category ICategory IIArea (km2)PercentageArea/Percentage
Inland wetlandsInland swamp11,066.598.98%49,536.64 km2
40.19%
Inland marsh4961.454.02%
Lake11,965.059.71%
River21,543.5517.48%
Coastal wetlandsCoastal swamp48,002.6638.94%58,534.78 km2
47.49%
Coastal marsh2224.541.80%
Lagoon353.750.29%
Tidal flat3078.592.50%
Estuarine water4875.243.95%
Human-madeReservoir/pond15,093.8012.24%15,197.19 km2
12.33%
wetlandsCanal/channel103.390.08%
Total123,268.61100.00%100.00%
Table 5. The wetland areas in each country of Southeast Asia.
CountryWetland Area (km2)Land Area (km2)WR
Singapore50.73728.606.96%
Cambodia8751.0218,1359.624.83%
Vietnam11,251.41329,556.003.41%
Brunei181.845777.803.15%
Indonesia60,155.23191,3578.683.14%
Malaysia9512.28330,000.002.88%
Philippines7949.31299,700.002.65%
Myanmar13,996.17676,578.002.07%
Thailand8639.13513,000.001.68%
Laos2615.64236,800.001.10%
East Timor166.8915,007.001.11%
Total123,269.654,460,864.812.74%
Table 6. The wetland areas of Southeast Asia from the SEAWeC, GTF, GMW, WLC, and MLC products.
DatasetTimeSpatial
Resolution
Comparison TypeArea (km2)
DatasetSEAWeC
The global distribution and trajectory of tidal flats (GTF)201630 mTidal flat2633.783078.59
Global Mangrove Watch (GMW)2020Coastal swamp48,703.1848,002.66
Worldwide land cover mapping (WLC)202010 mCoastal swamp55,921.8248,002.66
MODIS Land Cover (MLC)2020500 mWetland total areas in Southeast Asia88,145.91123,268.61
Publisher’s Note: MDPI stays neutral with regard to jurisdictional claims in published maps and institutional affiliations.

