Article

Estimation of Soil Freeze Depth in Typical Snowy Regions Using Reanalysis Dataset: A Case Study in Heilongjiang Province, China

1
Qilian Alpine Ecology and Hydrology Research Station, Northwest Institute of Eco-Environment and Resources, Chinese Academy of Sciences, Lanzhou 730000, China
2
College of Urban and Environment Sciences, Northwest University, Xi’an 710127, China
*
Author to whom correspondence should be addressed.
Remote Sens. 2022, 14(23), 5989; https://doi.org/10.3390/rs14235989
Submission received: 24 October 2022 / Revised: 22 November 2022 / Accepted: 24 November 2022 / Published: 26 November 2022
(This article belongs to the Special Issue Remote Sensing of the Cryosphere)

Abstract

:
Soil freeze depth variations greatly affect energy exchange, carbon exchange, ecosystem diversity, and the water cycle. Given the importance of these processes, obtaining freeze depth data over large scales is an important focus of research. This paper presents a simple empirical algorithm to estimate the maximum seasonally frozen depth (MSFD) of seasonally frozen ground (SFG) in snowy regions. First, the potential influences of driving factors on the MSFD variations were quantified in the baseline period (1981–2010) based on the 26 meteorological stations within and around the SFG region of Heilongjiang province. The three variables that contributed more than 10% to MSFD variations (i.e., air freezing index, annual mean snow depth, and snow cover days) were considered in the analysis. A simple multiple linear regression to estimate soil freeze depth was fitted (1981–2010) and verified (1975–1980 and 2011–2014) using ground station observations. Compared with the commonly used simplified Stefan solution, this multiple linear regression produced superior freeze depth estimations, with the mean absolute error and root mean square error of the station average reduced by over 20%. By utilizing this empirical algorithm and the ERA5-Land reanalysis dataset, the multi-year average MSFD (1981–2010) was 132 cm, ranging from 52 cm to 186 cm, and MSFD anomaly exhibited a significant decreasing trend, at a rate of −0.38 cm/decade or a net change of −28.14 cm from 1950–2021. This study provided a practical approach to model the soil freeze depth of SFG over a large scale in snowy regions and emphasized the importance of considering snow cover variables in analyzing and estimating soil freeze depth.

1. Introduction

Soil freeze depth arises from the complex heat exchange processes between the ground and atmosphere and is highly sensitive to climate change, thus reflecting long-term changes in the climate system [1,2]. Global warming caused mainly by greenhouse gas emissions has led to substantial changes in soil freeze depth at regional, national, and hemispheric scales [1,3,4,5,6,7,8,9,10,11], which then affects carbon exchange, ecosystem diversity, hydrological processes, and engineering construction in cold regions [12,13,14,15,16].
Soil freeze depth is generally obtained by manual observation through standard frost tubes when the ground surface temperature is below 0 °C [17]. Using ground observations, substantial efforts have been made to estimate the spatial distribution and change in the maximum seasonally frozen depth (MSFD) of seasonally frozen ground (SFG), such as in the Three Rivers Source Region [5] and Qinghai-Tibetan Plateau (QTP) of China [6,14], all of China [9,10], and Eurasian high latitudes [1]. However, the results may have been partially affected by the number and distribution of stations, particularly at high altitudes and latitudes with sparse site distribution due to harsh natural environments and expensive observation costs [18,19]. In addition, analysis based on station observations cannot reflect the spatiotemporal variations of soil freeze depth in data-scarce areas. Under such conditions, the development of soil freeze depth estimation models can be an effective way to obtain regional-scale freeze depth data. Over a regional scale, soil freeze/thaw processes have often been simulated by incorporating numerical solution schemes (e.g., finite element and finite volume) into land surface or hydrological models [4,20,21,22], but the high computational cost and large data requirement for model calibration have limited their application in large scale surveys [19]. By utilizing climatic variables such as air temperature, precipitation, snow depth, or freeze–thaw indexes, some empirical or semi-empirical solutions have performed adequately in soil freeze depth simulations [1,4,6,9,23,24,25]. Among them, the Stefan solution has been most widely used to estimate the soil freeze depth of SFG and active layer thickness above permafrost by utilizing air temperature and soil parameters (e.g., soil thermal conductivity, soil bulk density, and soil water content) as main inputs [9,26,27].
Due to the significant correlation between the soil freeze depth and air temperature, the Stefan solution has been simplified and widely used in MSFD estimation at both point [28,29] and regional scales [8,9,30,31,32]. However, considering air temperature as the only input variable and generalizing other variables as constants [31,33] may lead to large uncertainties in MSFD estimations. For example, in areas with deep snow cover, the effect of snow cover on soil temperature [34,35,36], the soil freeze depth of SFG [37], and the active layer thickness above permafrost [38,39,40,41] has been significant or even exceeded that of air temperature. However, the potential impact of snow cover parameters on soil freeze depth was not fully considered in the simplified Stefan solution, which may limit its wide application in areas with substantial snow cover. Other variables, such as soil properties and vegetation characteristics, may also influence the variation in soil freeze depth [1,42]. For example, soil properties mainly affect the thermal and hydraulic conductivity of soil and thus influence the freeze/thaw process [43]. Vegetation can affect the energy balance of the ground via changes in the surface albedo (e.g., bare ground versus vegetation cover), vegetation transpiration, and shading effects [44,45], which influence the freezing conditions of the soil [46].
Northeast China is a stable snow cover distribution area, where average snow depth, snow density, and snow water equivalent are larger than in other regions of China [47,48,49]. Heilongjiang province is located in the northern part of Northeast China, where the annual average air temperature has risen at a rate of 0.35 °C/decade from 1960 to 2015 [50], leading to clear changes in the frozen ground [51,52]. With Heilongjiang province as the study area, we aimed to develop a simple empirical algorithm for estimating the MSFD of SFG in snowy regions. To this end, we first quantified the potential influences of driving factors (including air temperature, snow cover, vegetation, and soil properties) on the MSFD variation based on the data from the 26 meteorological stations within and around the SFG region of Heilongjiang province. By selecting and fitting the principal driving elements, the empirical algorithm for MSFD estimation was developed, and its performance was evaluated by comparing it with the observed freeze depths and the estimations of the simplified Stefan solution. This empirical algorithm was also combined with the ERA5-Land reanalysis dataset to investigate the spatiotemporal variations in the soil freeze depth of SFG in Heilongjiang province.

2. Materials and Methods
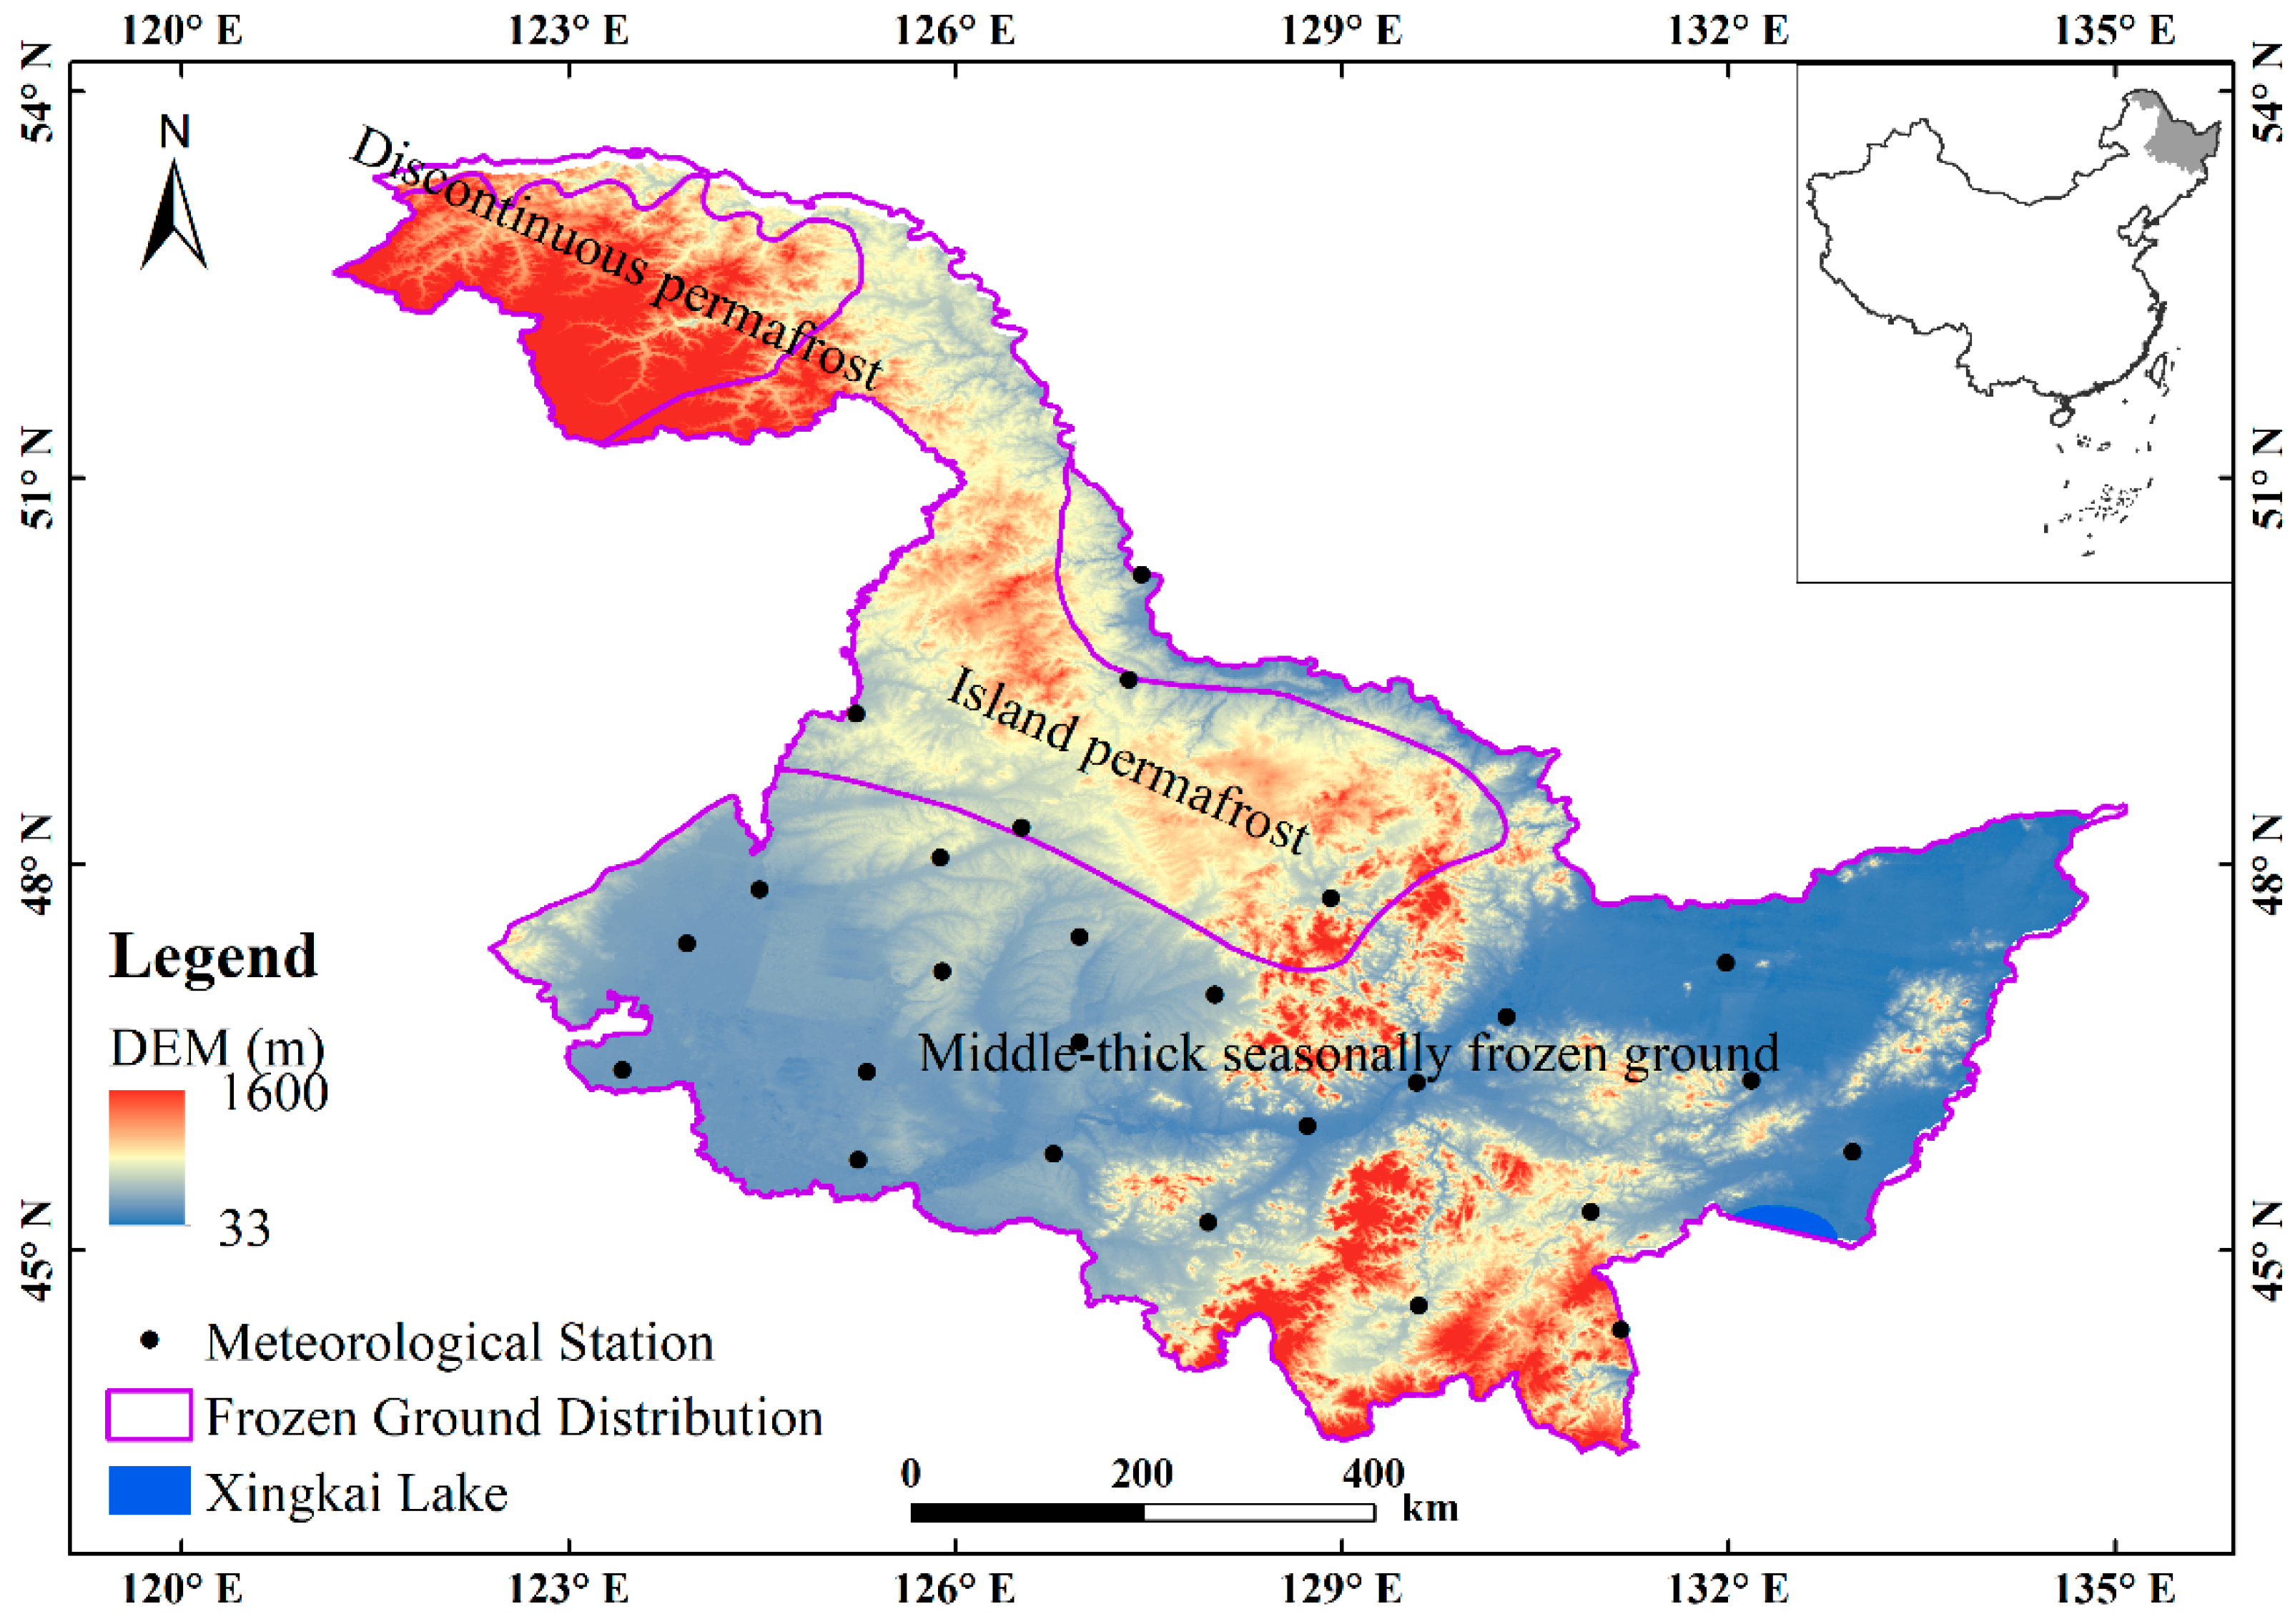
2.1. Study Area

With a geographical boundary of approximately 121°11′–135°05′E and 43°26′–53°33′N, Heilongjiang province extends 930 km from east to west and 1120 km from north to south (Figure 1). The elevation ranges from 28 to 1637 m, with only 3.24% of the area exceeding 800 m.
As a typical cold temperate continental monsoon climate region, Heilongjiang province experiences hot and rainy summers and cold and dry winters [53]. According to the distribution map of frozen ground across China [54], discontinuous permafrost, island permafrost, and seasonally frozen ground are distributed predominantly from north to south in Heilongjiang province (Figure 1). Among them, seasonally frozen ground comprises up to 68% of the total area and is the focus of this paper.

2.2. Data and Methods

Historical climate data of daily observations within Heilongjiang province, including soil freeze depth, air temperature, and snow depth, were obtained from the China Meteorological Administration. Daily soil freeze depth was manually measured at 08:00 Beijing time using a standard frost tube by trained professional technicians when the ground surface temperature was below 0 °C. The mean daily air temperature was calculated from the arithmetic means of four daily observations (02:00, 08:00, 14:00, and 20:00 Beijing time). Snow depth was measured at 08:00 Beijing time using a centimeter-scale wooden ruler when snow covered the ground and was recorded as an integer [17]. The annual MSFD was determined as the maximum daily frozen ground depth during a freezing year from September to August of the following year [6,10]. Twenty-six meteorological stations, with records available for more than three-quarters of the study period from 1975 to 2014 within and around the SFG region of Heilongjiang province, were selected to quantify the effect of main driving factors on MSFD variations and construct the MSFD estimation algorithm. Among the 26 stations, 4 were located in island permafrost regions but were not themselves above permafrost (Figure 1). The annual air freezing index (FI), which is the sum of the absolute values of all daily air temperatures below 0 °C, was used to evaluate the influence of air temperature on soil freeze depth [33,43]. Annual snow cover days (SCD) and average snow depth (ASD) were obtained from daily snow depth observations from each station. SCD is the number of days in a year with snow on the ground at a depth of ≥1 cm [55], and ASD is the ratio of the total of all daily snow depths to SCD [56].
Due to the shortage of observational data, the time series data of soil moisture content (SM) and leaf area index (LAI) of the 26 stations were extracted from the ERA5-Land hourly reanalysis dataset (https://cds.climate.copernicus.eu (accessed on 10 May 2022)), depending on the longitude and latitude of the stations using ArcGIS 10.6. The ERA5-Land reanalysis dataset provides a consistent view of the evolution of land variables over several decades at high temporal (1 h) and spatial (0.1° × 0.1°) resolutions from 1950 to the present, which grants it utility for many land surface applications, such as water resource, land, and environmental management [57,58]. To estimate the MSFD at regional scales, gridded air temperature (at 2 m above the land surface), snow depth, SM, and LAI data were also extracted from the ERA5-Land reanalysis dataset. Specifically, SM refers to the mean values of soil moisture at depths of 0–7, 7–28, and 28–100 cm.
To evaluate hourly air temperature and snow depth data from ERA5-Land, the values of FI, ASD, and SCD calculated from the observations of the 26 stations were compared with those calculated from the ERA5-Land dataset using two evaluation indexes: root mean square error (RMSE) and mean absolute error (MAE). For the evaluation of hourly SM and LAI data from ERA5-Land, we compared the possible impact of using different data products to quantify the effects of the main driving factors on MSFD variations and to construct the MSFD estimation algorithm. Among these data products, gridded normalized difference vegetation index (NDVI) data from 1982 to 2010 with 5 km spatial resolution were collected from the National Earth System Science Data Center of the National Science & Technology Infrastructure of China (http://www.geodata.cn (accessed on 15 May 2022)); the data are produced by the National Oceanic and Atmospheric Administration NDVI Climate Data Record. The SM data were provided by the Global Land Data Assimilation System (GLDAS V2.0), which produces operational spatiotemporally continuous global soil moisture data sets (https://disc.gsfc.nasa.gov (accessed on 15 May 2022)), and has been widely used in previous research [59,60,61]. The mode of the GLDAS used in this study was the Noah Land Surface Model with a spatial resolution of 0.25 degrees and the monthly time series data from 1948 to 2015 [62,63]. Soil moisture was calculated as the mean soil moisture values at depths of 0–10, 10–40, and 40–100 cm. All these data (i.e., FI, ASD, SCD, LAI, NDVI, and SM) of the 26 stations from different data products were extracted depending on the longitude and latitude of the stations using ArcGIS 10.6.
During the baseline period (i.e., 1981–2010), the relative contributions of the environment variables (i.e., FI, SCD, ASD, SM, and LAI) to MSFD variations were quantified with hierarchical partitioning analysis implemented using the R package “rdacca.hp” in R programming language [64]. In practical applications, this package has demonstrated advantages in managing multicollinearity [65,66,67] and allows us to directly compare the relative contributions of these explanatory variables by standardizing each variable. This R package “rdacca.hp” is available at the open-access repository Zenodo https://zenodo.org/record/5796018 (accessed on 10 March 2022). To reduce the complexity of the model, only variables contributing more than 10% to MSFD variations were retained to fit the MSFD estimation algorithm. A simple multiple linear regression was performed with these variables to explore the possible empirical relationships between the MSFD and these environmental variables in Heilongjiang province. MSFD measurement data during the baseline period (i.e., 1981–2010) were used to construct the MSFD estimation algorithm, and 10 years of observational data (i.e., 1975–1980 and 2011–2014) were used to verify the accuracy of the algorithm. The MAE and RMSE were used to compare the observed and estimated MSFD values. We also compared the results from our empirical algorithm with those obtained from commonly used estimation methods (i.e., the simplified Stefan solution; see Equation (S2) in Supporting Materials). Based on the ERA5-Land reanalysis dataset, this empirical equation was applied to investigate the detailed spatiotemporal variations in the soil freeze depth of SFG in Heilongjiang province. By utilizing the modified Mann–Kendall test and Sen’s slope estimator method [68,69], the trends of MSFD change were evaluated at both regional and grid scales. Here, changes in MSFD at regional scales were based on a time series of anomalies (with respect to the mean of the 30-year baseline period, i.e., 1981–2010) from 1950 to 2021.

3. Results

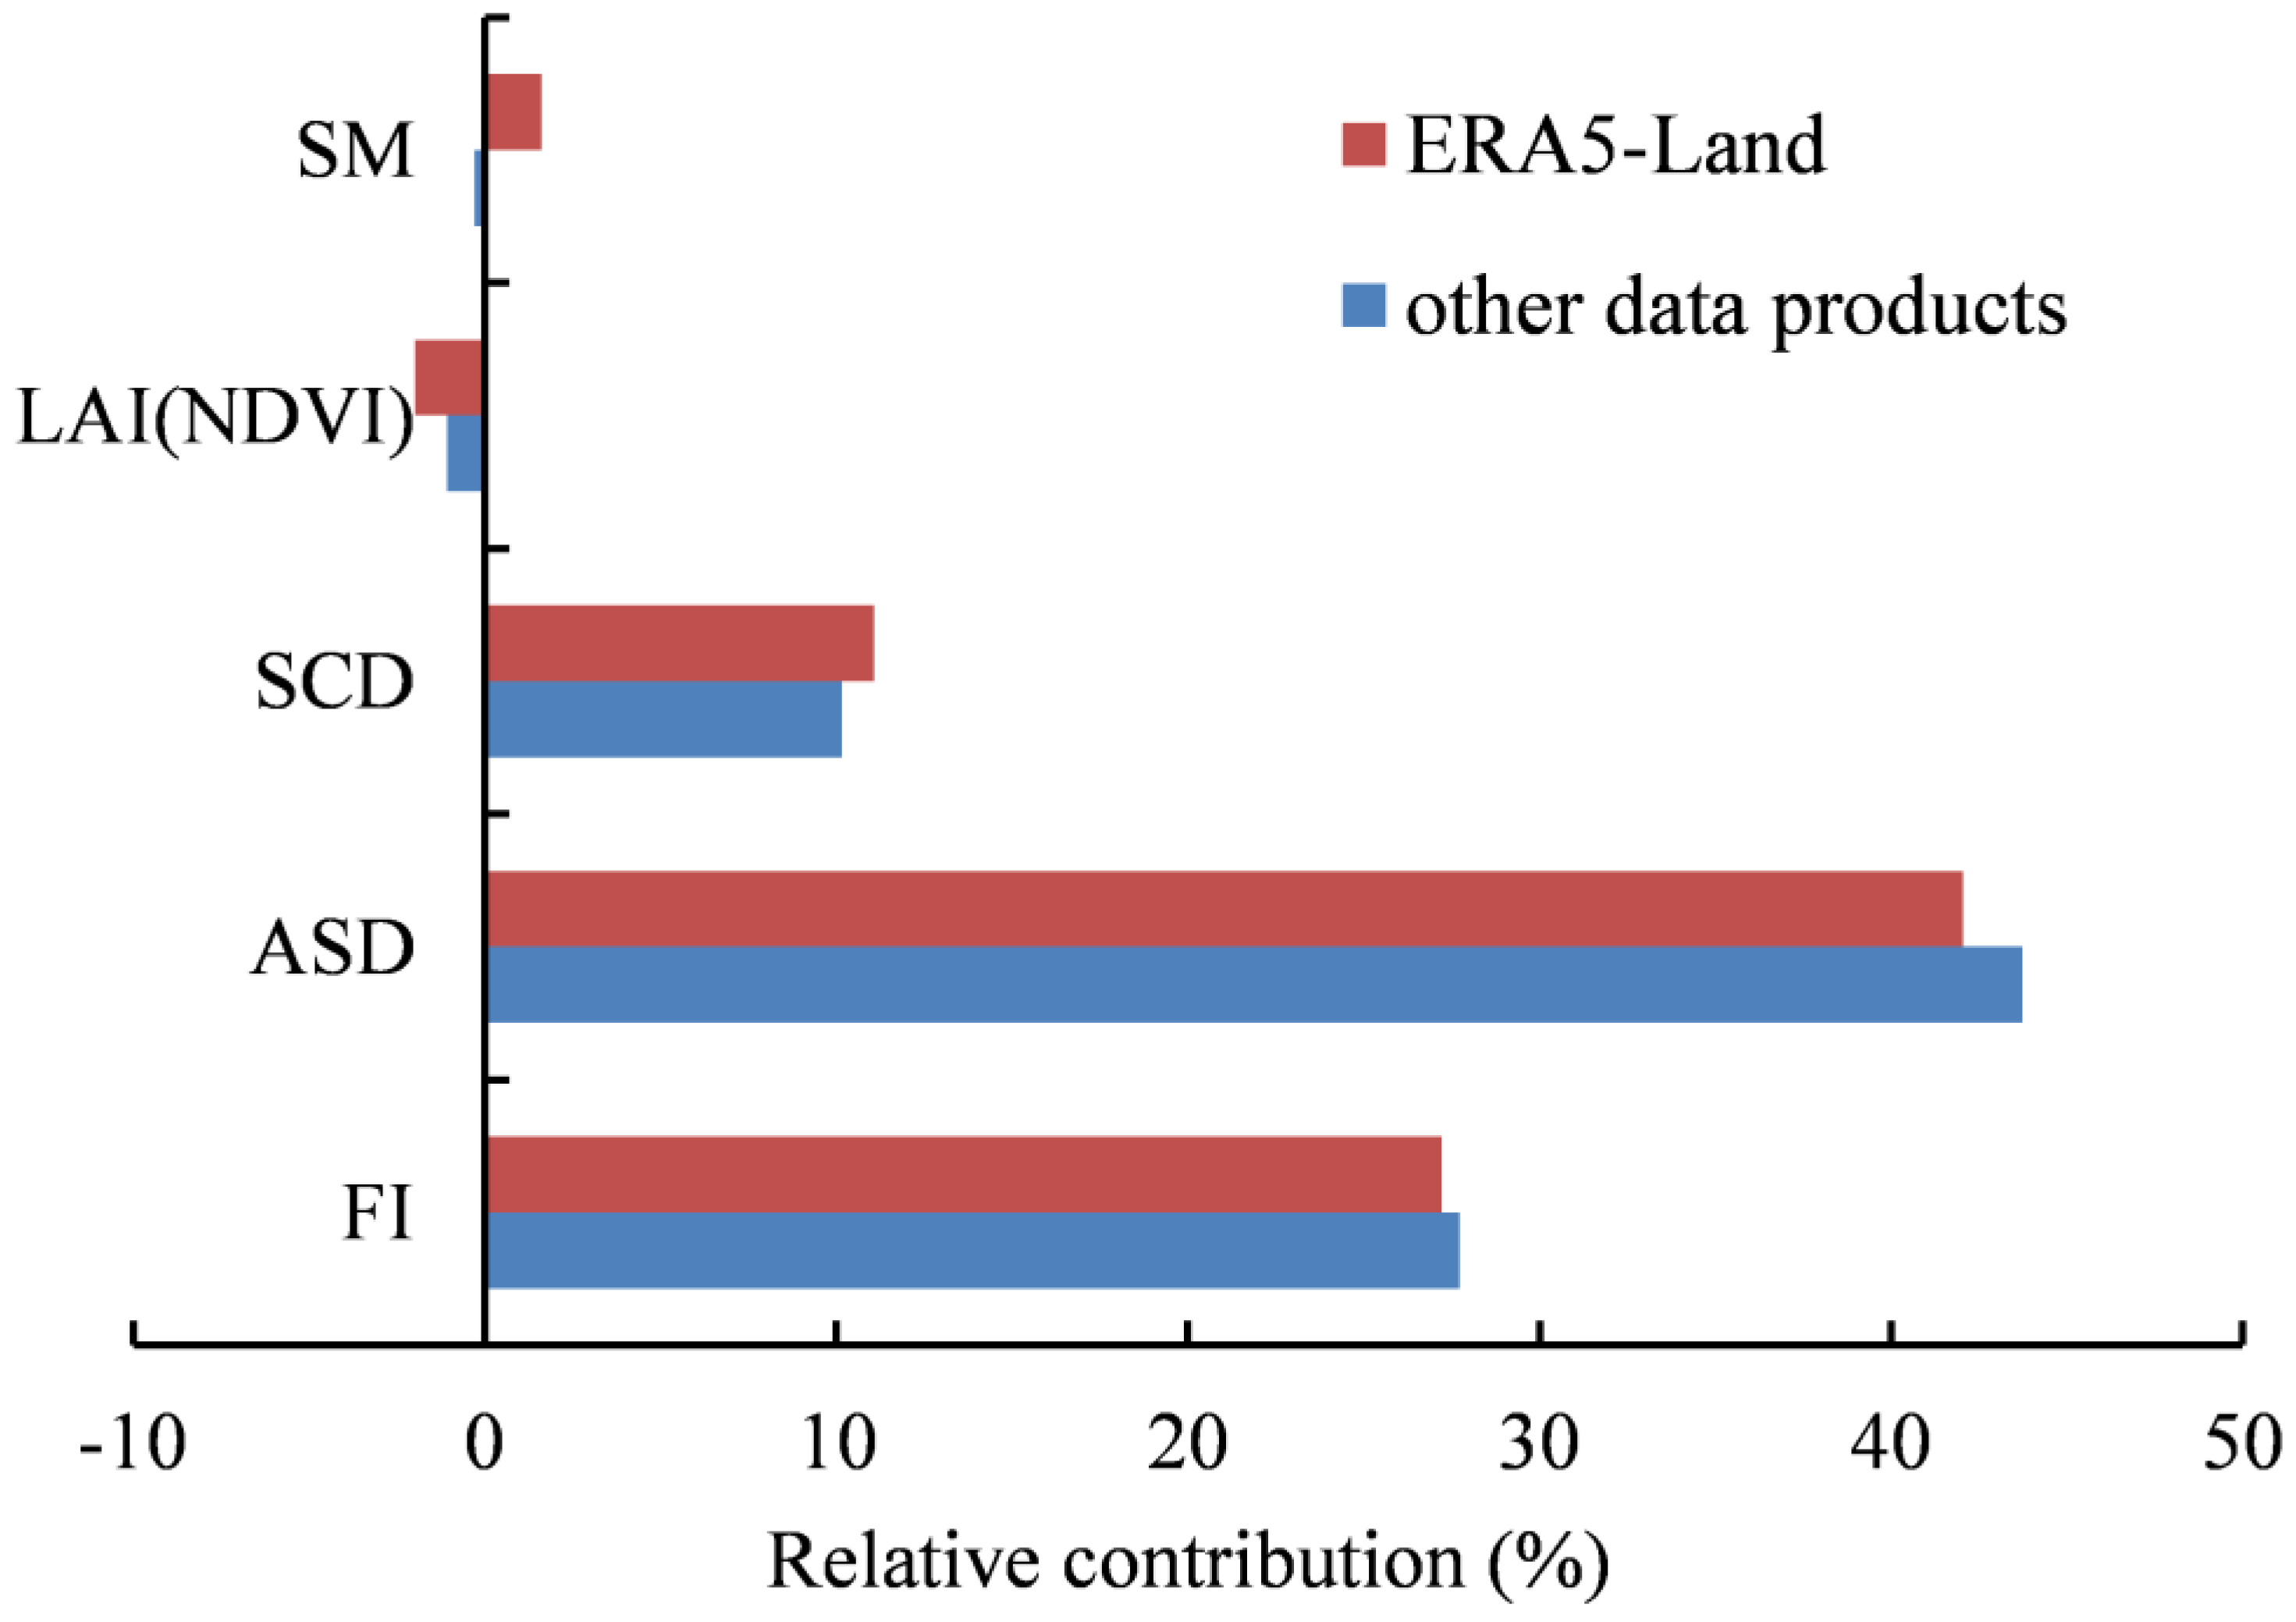
3.1. Driving Factors of MSFD Variation

Based on data from 26 stations during the 30-year baseline period (1981−2010), the relative contributions of five environment variables to MSFD variations estimated from different data products (i.e., vegetation indices and soil moisture) were highly consistent (Figure 2), with the contribution of ASD > FI > SCD. The other two variables contributed less than 2% each. This suggests that different data products may have only minor effects on the quantification of the main driving factors of MSFD variations.
The results from ERA5-Land data (i.e., SM and LAI data were obtained from ERA5-Land) showed that (Figure 2) approximately 42.04% of the total variability in MSFD was explained by ASD during the baseline period (i.e., 1981–2010), while ~27.20% was explained by FI. Further study indicated that the station average contributions of ASD to MSFD were over 30%, with nearly 85% of sites contributing more than 10%, whereas the station average contributions of FI to MSFD were ~12.71%, with 13 stations contributing more than 10%. These findings indicated that the influence of air temperature (characterized by FI) on soil freeze depth was clearly lower than that of average snow depth in the study area. We also found that SCD explained approximately 11.07% of the total variability in MSFD, while the effect of SM and LAI on MSFD was negligible, with contributions of less than 2% each.
Overall, these findings indicated that ASD had the greatest effect on the MSFD dynamics, followed by FI and SCD, while annual SM and LAI changes had negligible effects.

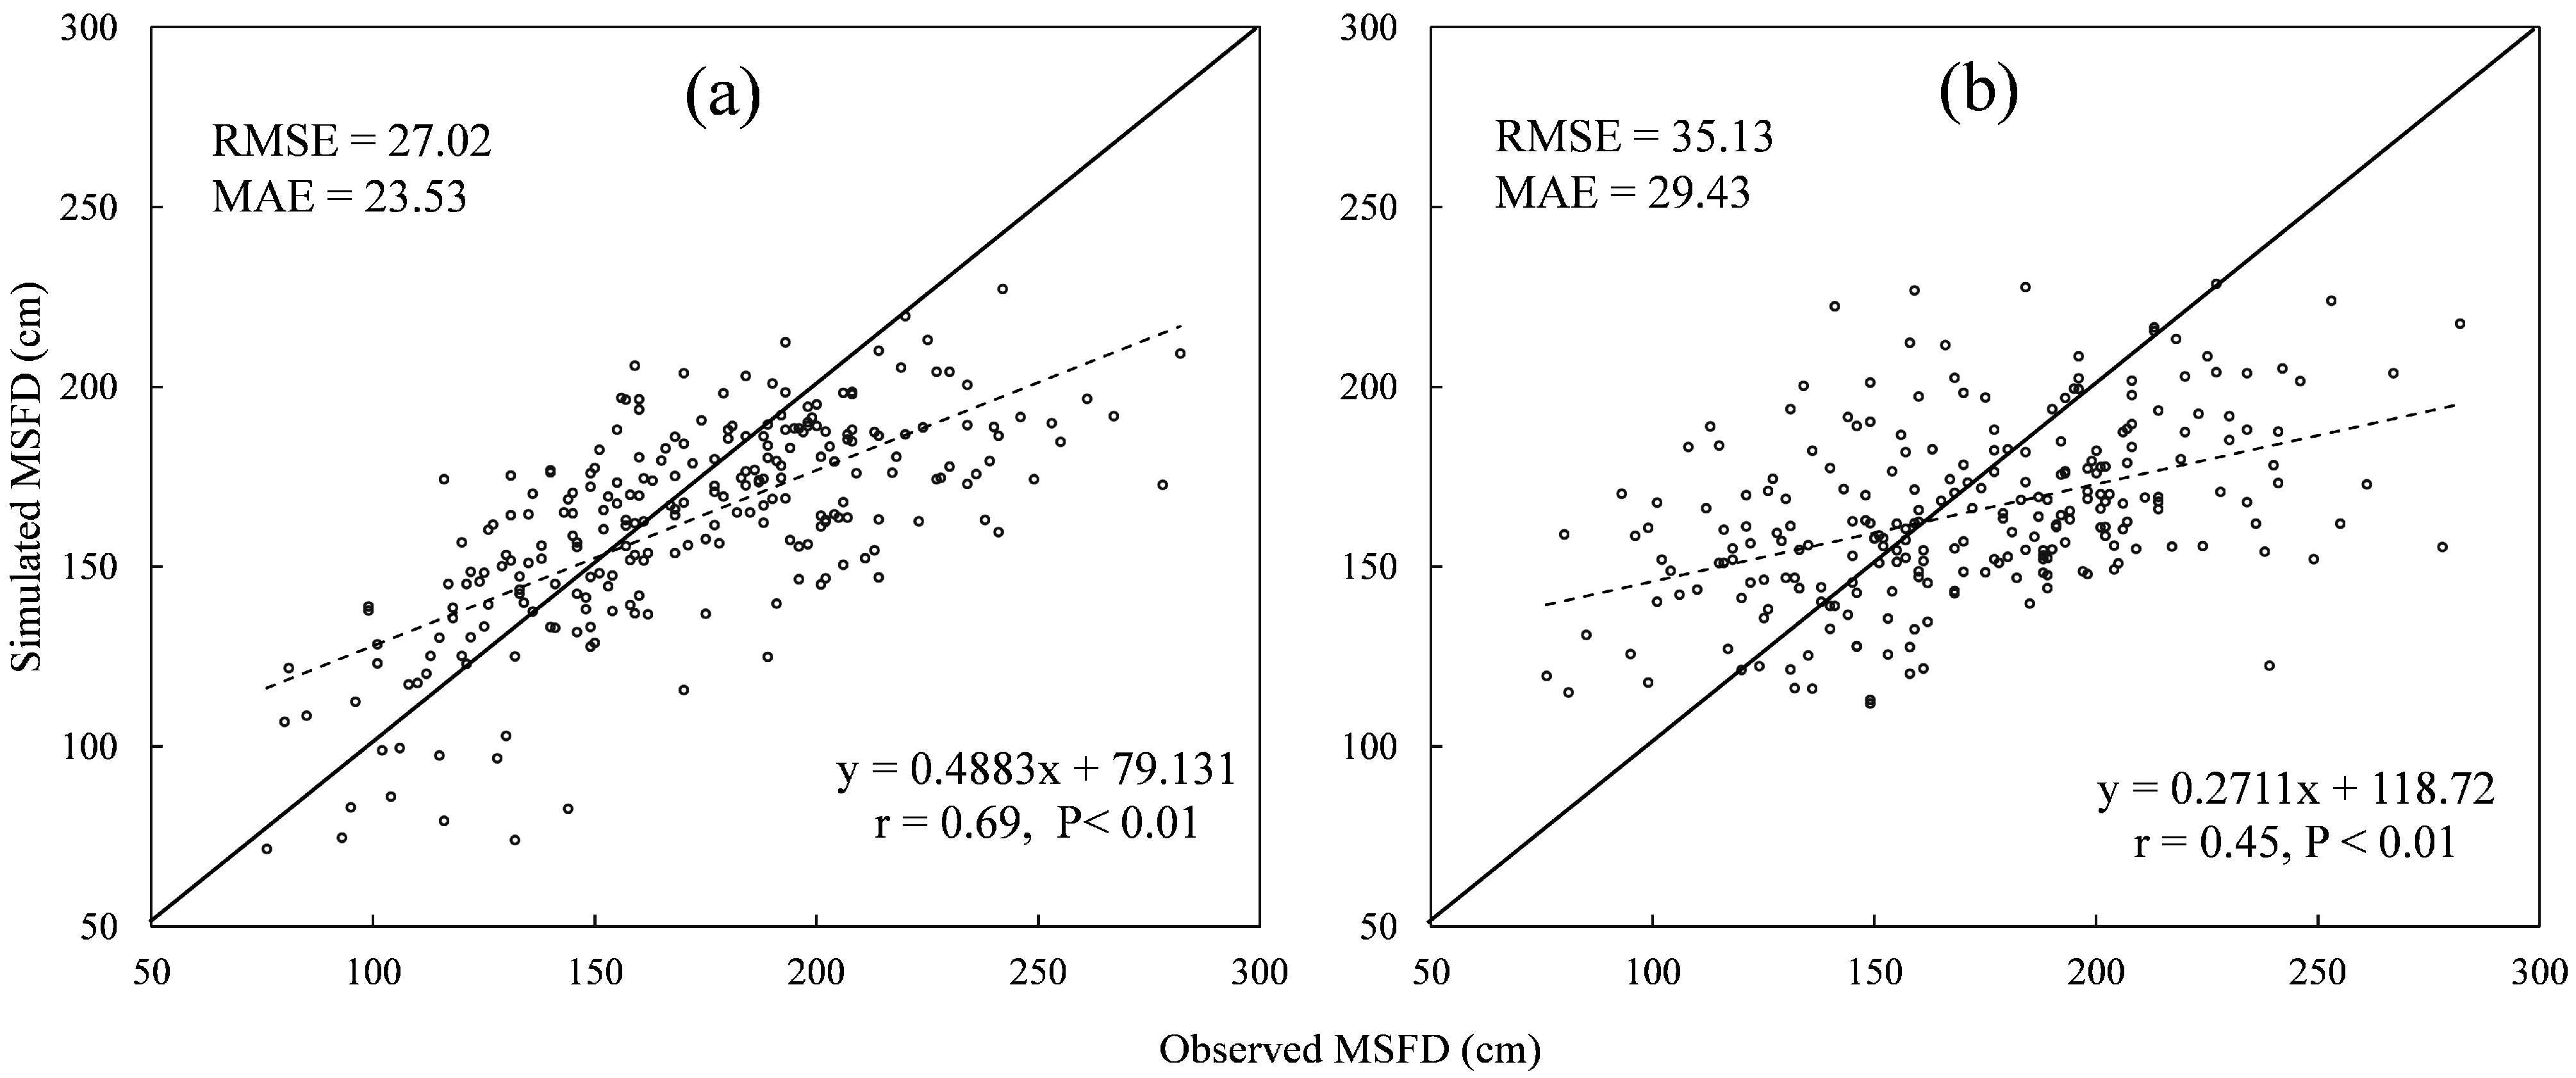
3.2. Development of the MSFD Estimation Algorithm

Considering that three variables (i.e., FI, ASD, and SCD) each contributed more than 10% to MSFD variation, and the sum of the relative contribution of these three variables was 81.4% (Figure 2), they were included in a multiple linear regression to construct the MSFD estimation algorithm. Their fitting equation was expressed as:
MSFD = 102.1380 + 0.0506 FI 0.1606 ASD 3.3630 SCD
where MSFD is the annual maximum freeze depth (cm), FI is the air freezing index (°C), ASD is the annual mean snow depth (cm), and SCD is the snow cover days (days). The multiple regression equation was significant despite a relatively low R2 (p < 0.01, R2 = 0.37) and could thus be used to estimate the MSFD for the study region.
Compared with the simplified Stefan formula, the RMSE and MAE of the station average during the 10-year validation period (i.e., 1975–1980 and 2011–2014) obtained from the multiple regression equation were reduced by approximately 23.1% and 20.1%, respectively (Figure 3). Additionally, the obtained station average RMSEs and MAEs from the multiple regression equation were ~10% lower than those obtained using the Stefan formula for 1975–1980 and more than 30% lower for 2011–2014. The above comparative results suggest that this simple regression equation has wide applicability for estimating soil freeze depth in the study area and also emphasize the need to consider snow cover variables when estimating soil freeze depth in snowy areas.

3.3. Application of the MSFD Estimation Algorithm at Regional Scales

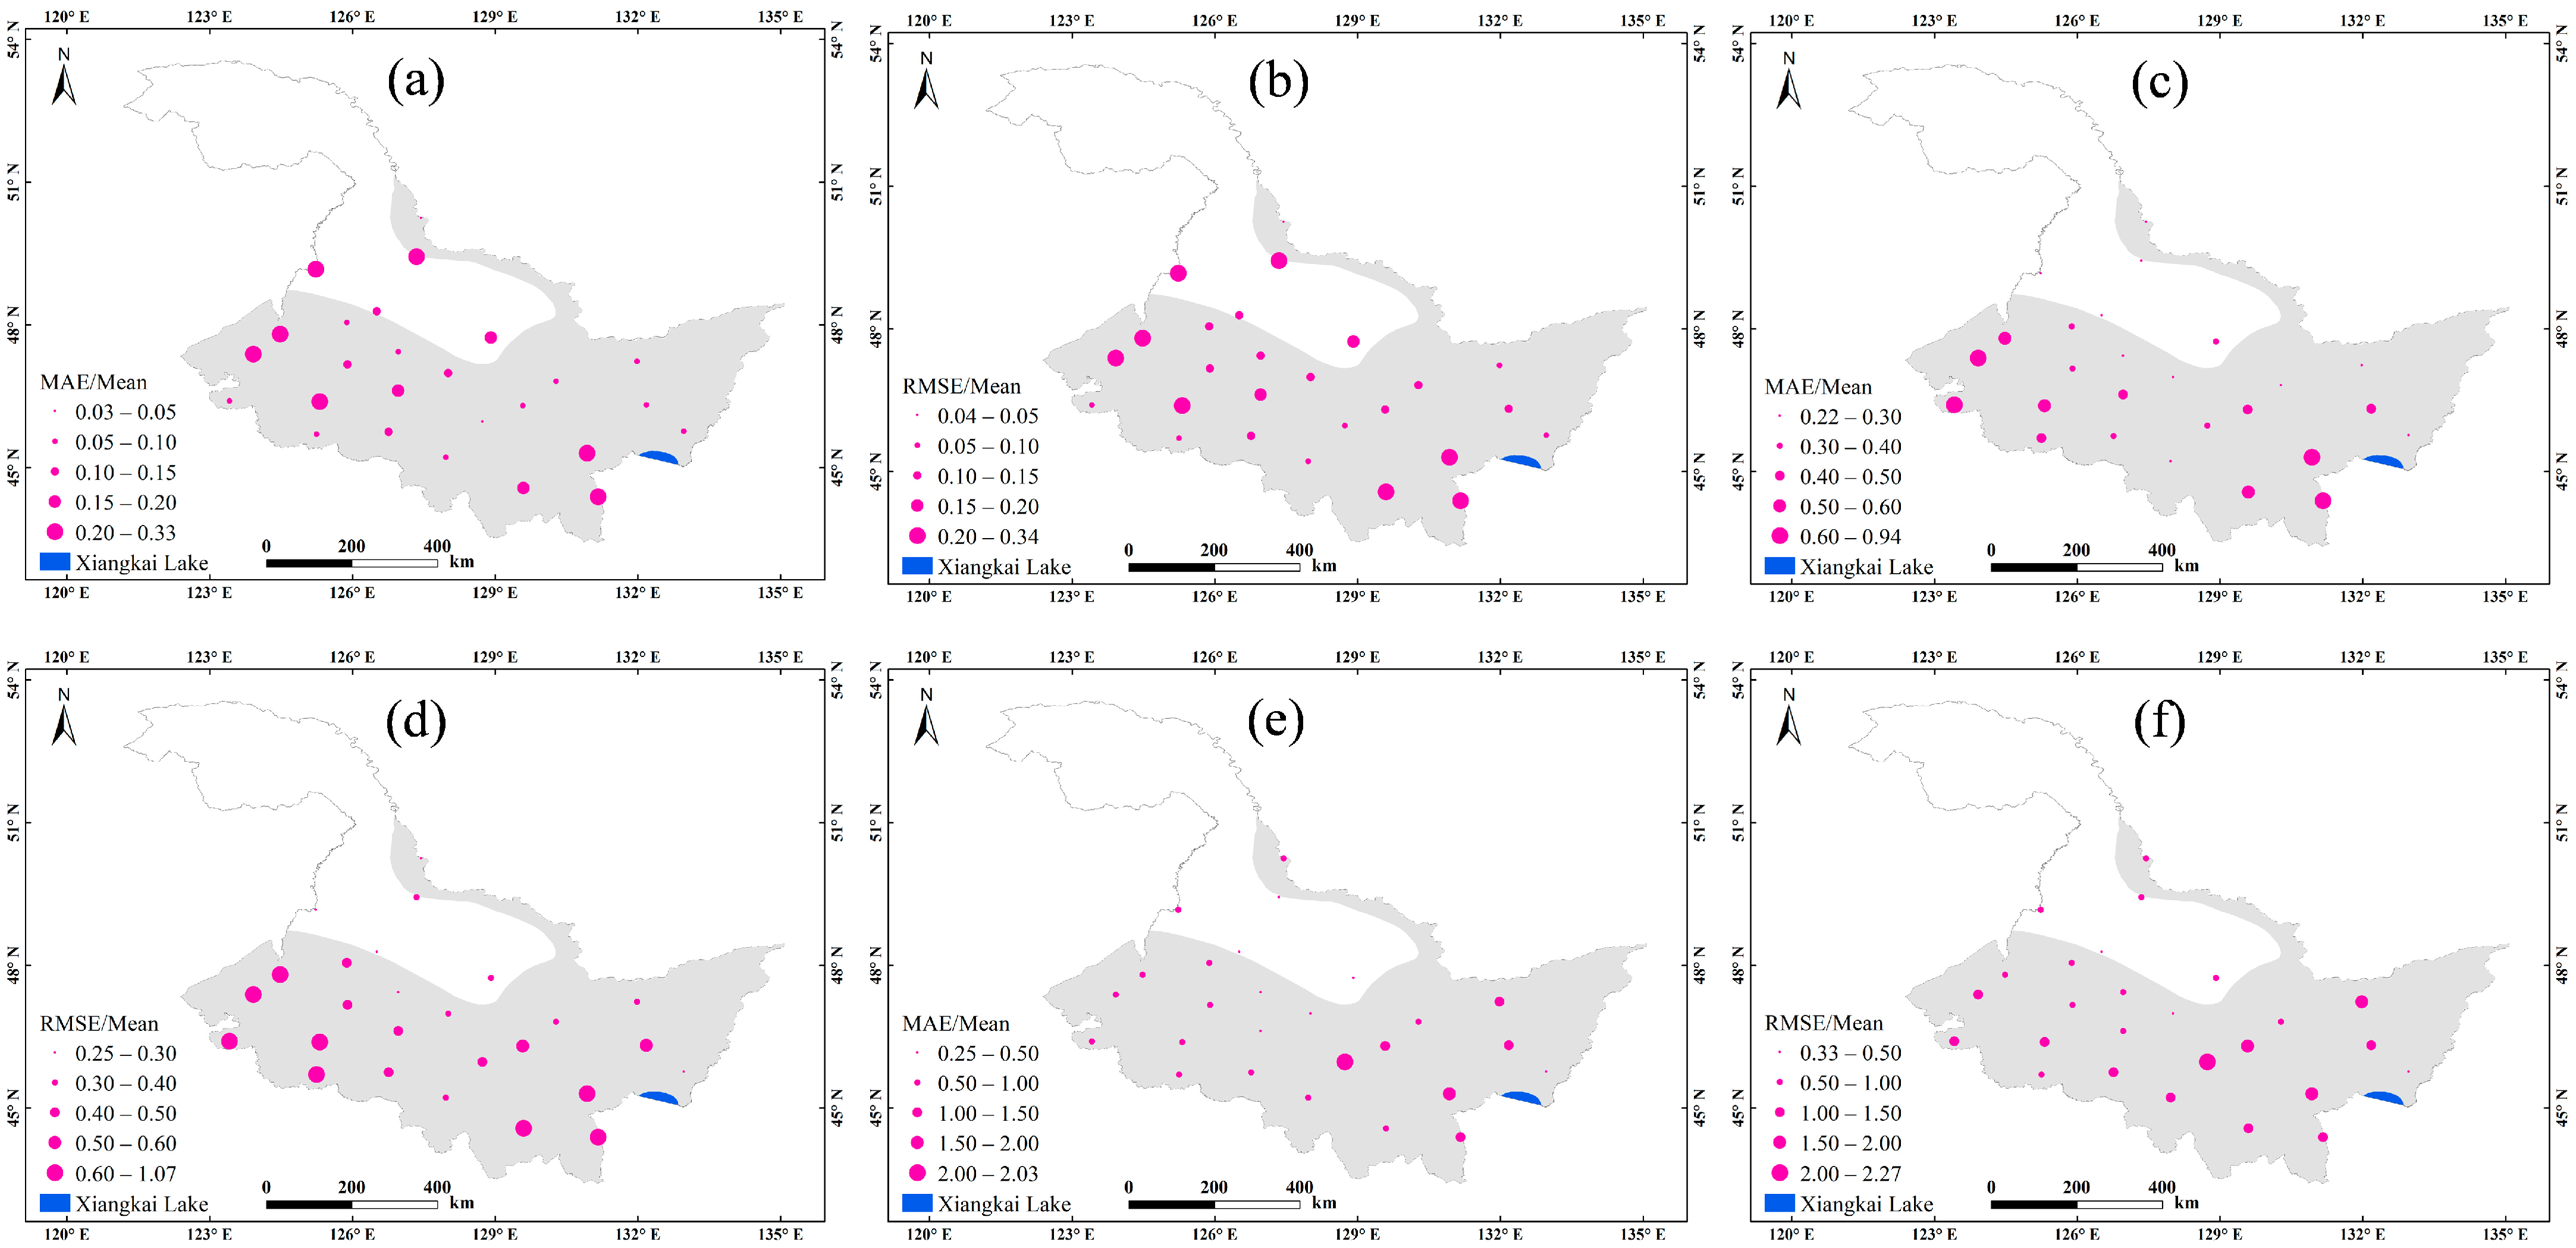
3.3.1. Performance of ERA5-Land

Figure 4 shows the statistical criteria between the calculated using the ERA5-Land reanalysis dataset and observed FI, ASD, and SCD at 26 meteorological stations in Heilongjiang province from 1975−2014. Due to relatively large differences in the FI and SCD values for each station, the MAE and RMSE varied greatly between stations. The ratios of MAE and RMSE to annual mean FI, ASD, and SCD (RMSE/Mean and MAE/Mean, respectively) were selected to analyze the ERA5-Land performance [48].
For FI, the RMSE/Mean and MAE/Mean of the station average were 0.16 and 0.15, respectively, with 18 stations (69.2 %) having an RMSE/Mean < 0.2 and 19 (73.1 %) having an MAE/Mean < 0.2. These relatively low values suggest relatively high estimation accuracy for air temperature using the ERA5-Land reanalysis dataset in Heilongjiang province. For SCD, the RMSE/Mean and MAE/Mean of the station average were 0.49 and 0.42, respectively, with 19 stations (73.1 %) having an RMSE/Mean < 0.6 and 22 (84.6 %) having an MAE/Mean < 0.6. For ASD, the RMSE/Mean and MAE/Mean of the station average were 1.01 and 0.80, respectively, with 14 stations (53.8 %) having an RMSE/Mean < 1.0 and 20 (76.9 %) having an MAE/Mean < 1.0. Compared with the statistical criteria of the calculated and observed snow depth in China from 1951 to 2009 [48], the RMSE/Mean and MAE/Mean of the corresponding sites in this study were relatively low, which suggests that the snow depth estimation result in Heilongjiang province using the ERA5-Land reanalysis dataset was reasonable and reliable.

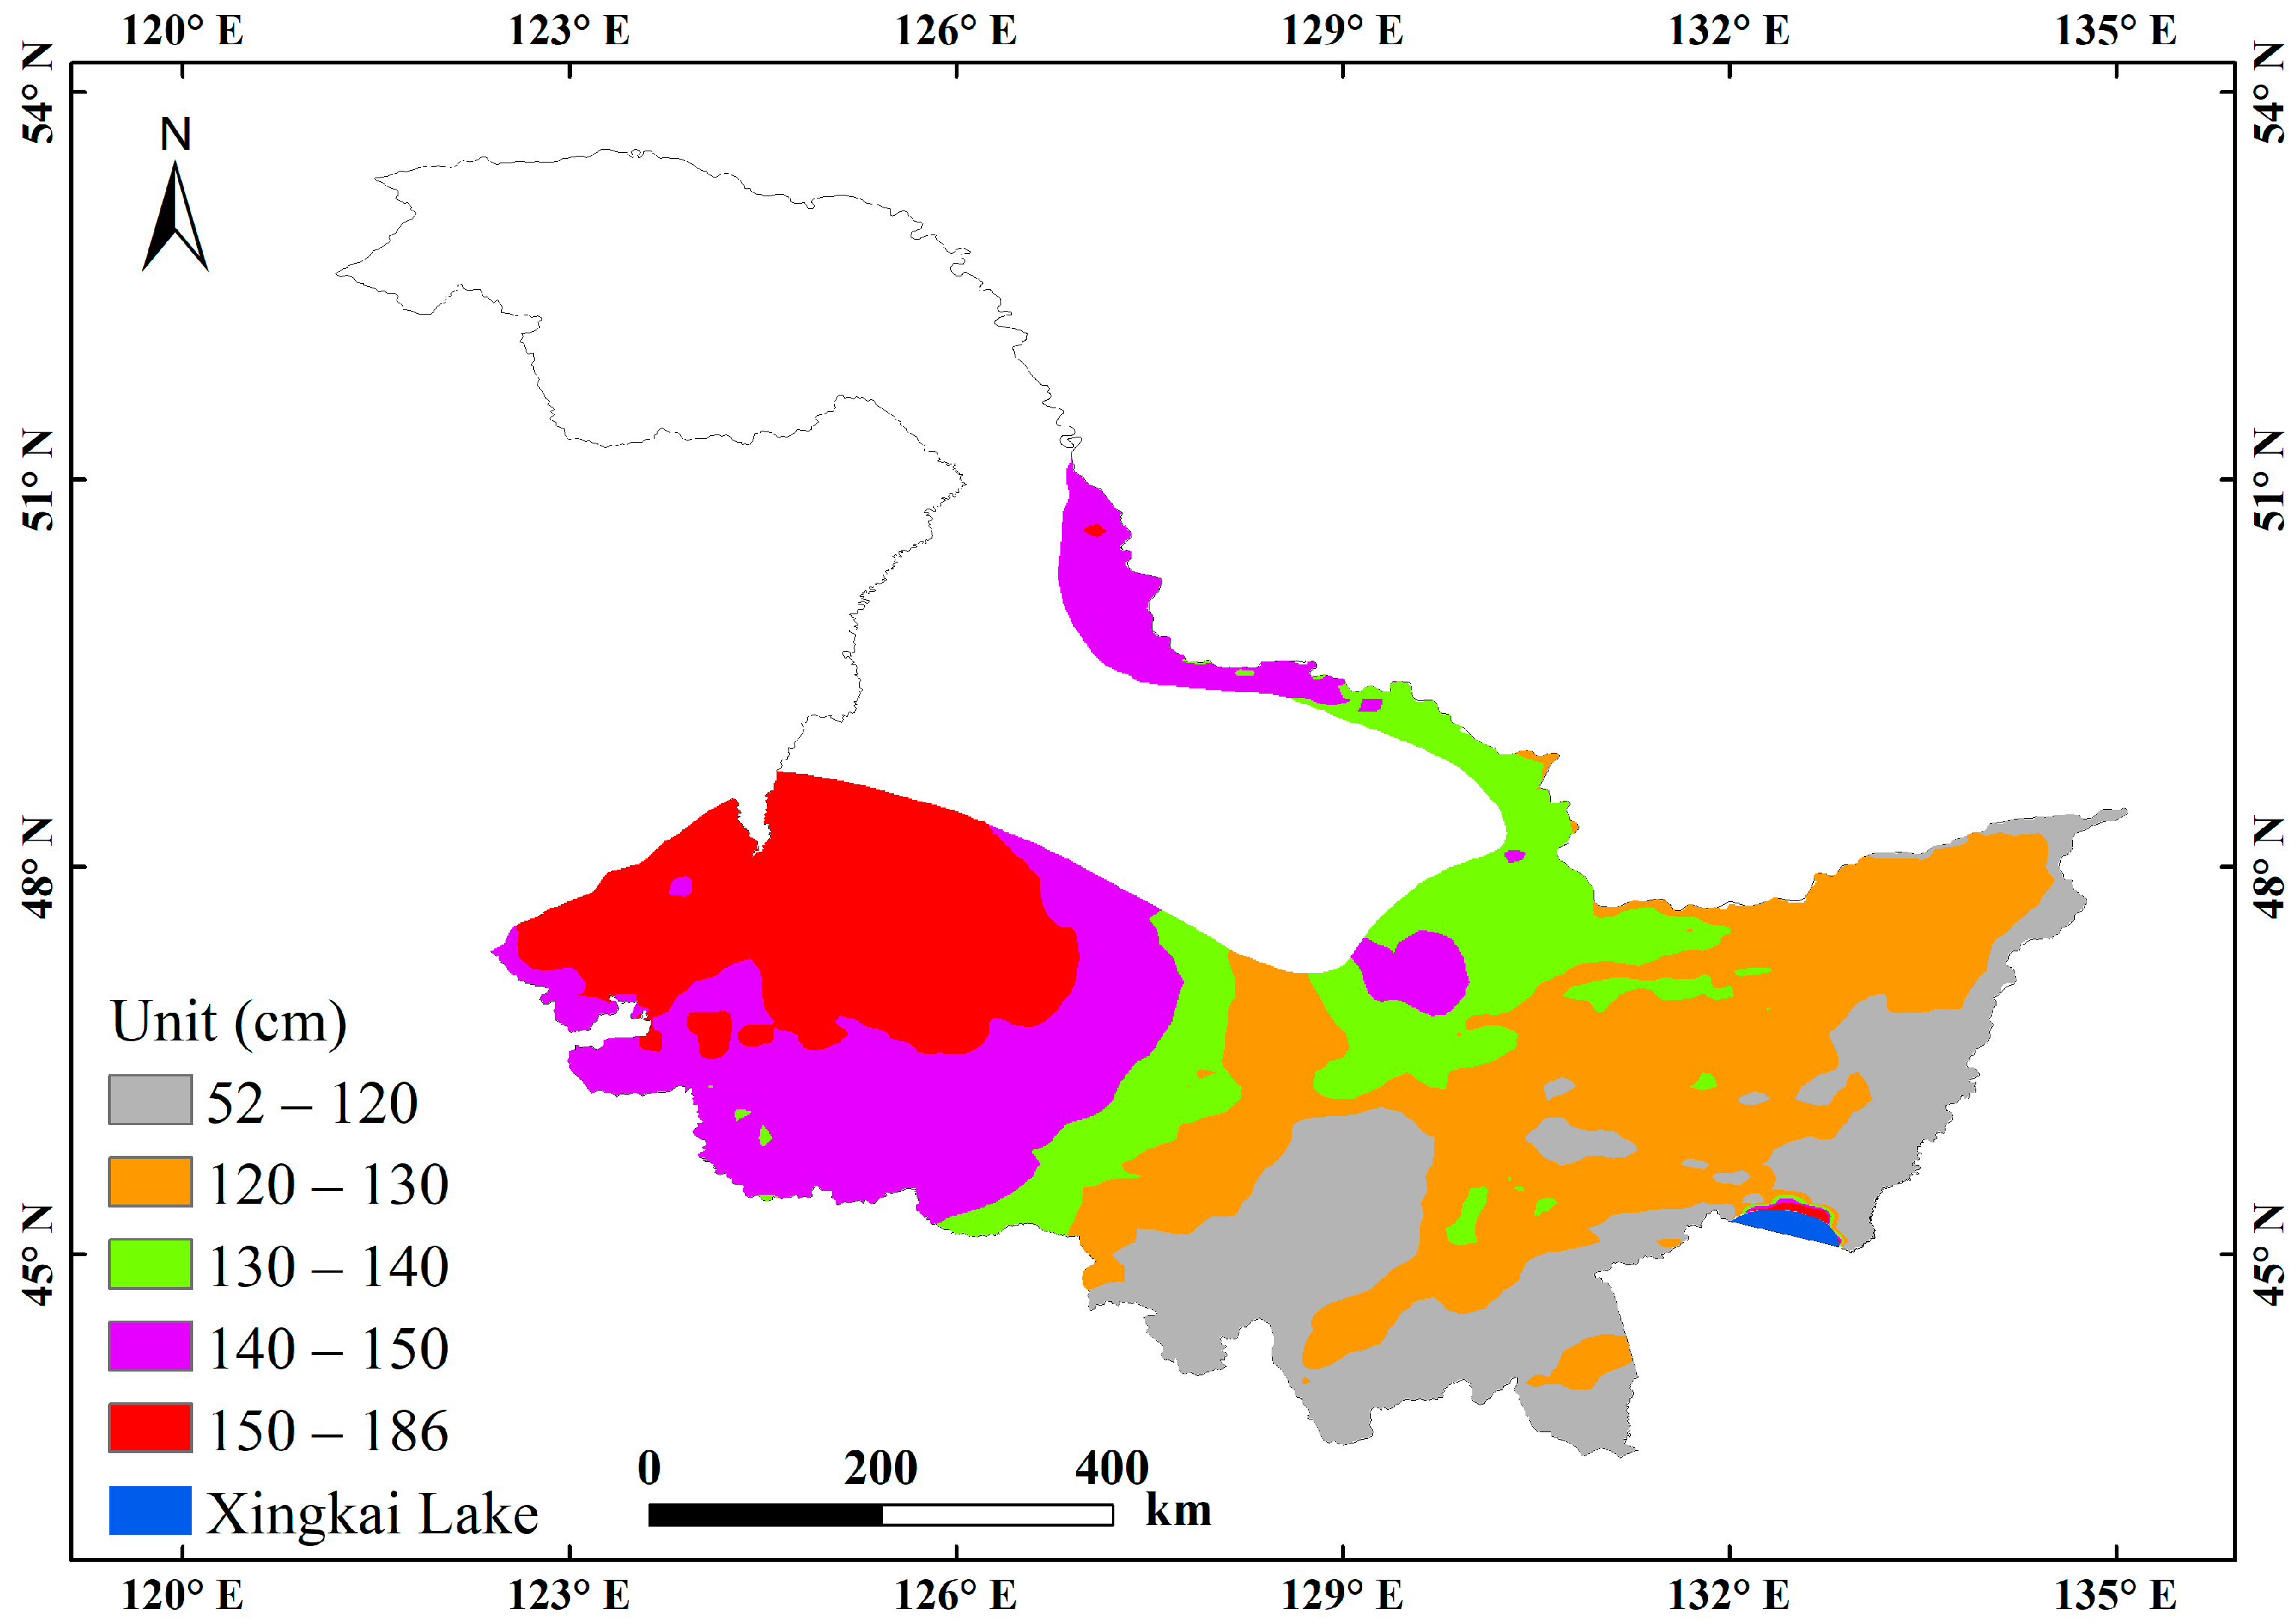
3.3.2. Spatial Distributions of Soil Freeze Depth

Using air temperature and snow depth data obtained from the ERA5-Land hourly reanalysis dataset, we calculated the values of FI, ASD, and SCD from 1950−2021 in Heilongjiang province and then applied Equation (S1) to obtain the spatial distribution status of the soil freeze depth of SFG.
Based on the 30-year baseline period (1981−2010), the spatial distributions of the MSFD of SFG varied greatly (Figure 5). The average MSFD for the entire region was 132 cm, ranging from 52 to 186 cm. The areas at depths of 52–120 cm, 120–130 cm, 130–140 cm, 140–150 cm, and 150–186 cm accounted for approximately 20.66%, 28.68%, 14.19%, 19.86%, and 16.62% of the total area of SFG, respectively. As shown in Figure 5, the higher MSFD was mainly concentrated in the north (e.g., > 140 cm), whereas the lower MSFD was mainly concentrated in the south (e.g., < 120 cm). Overall, the MSFD displayed an increasing trend from southeast to northwest.

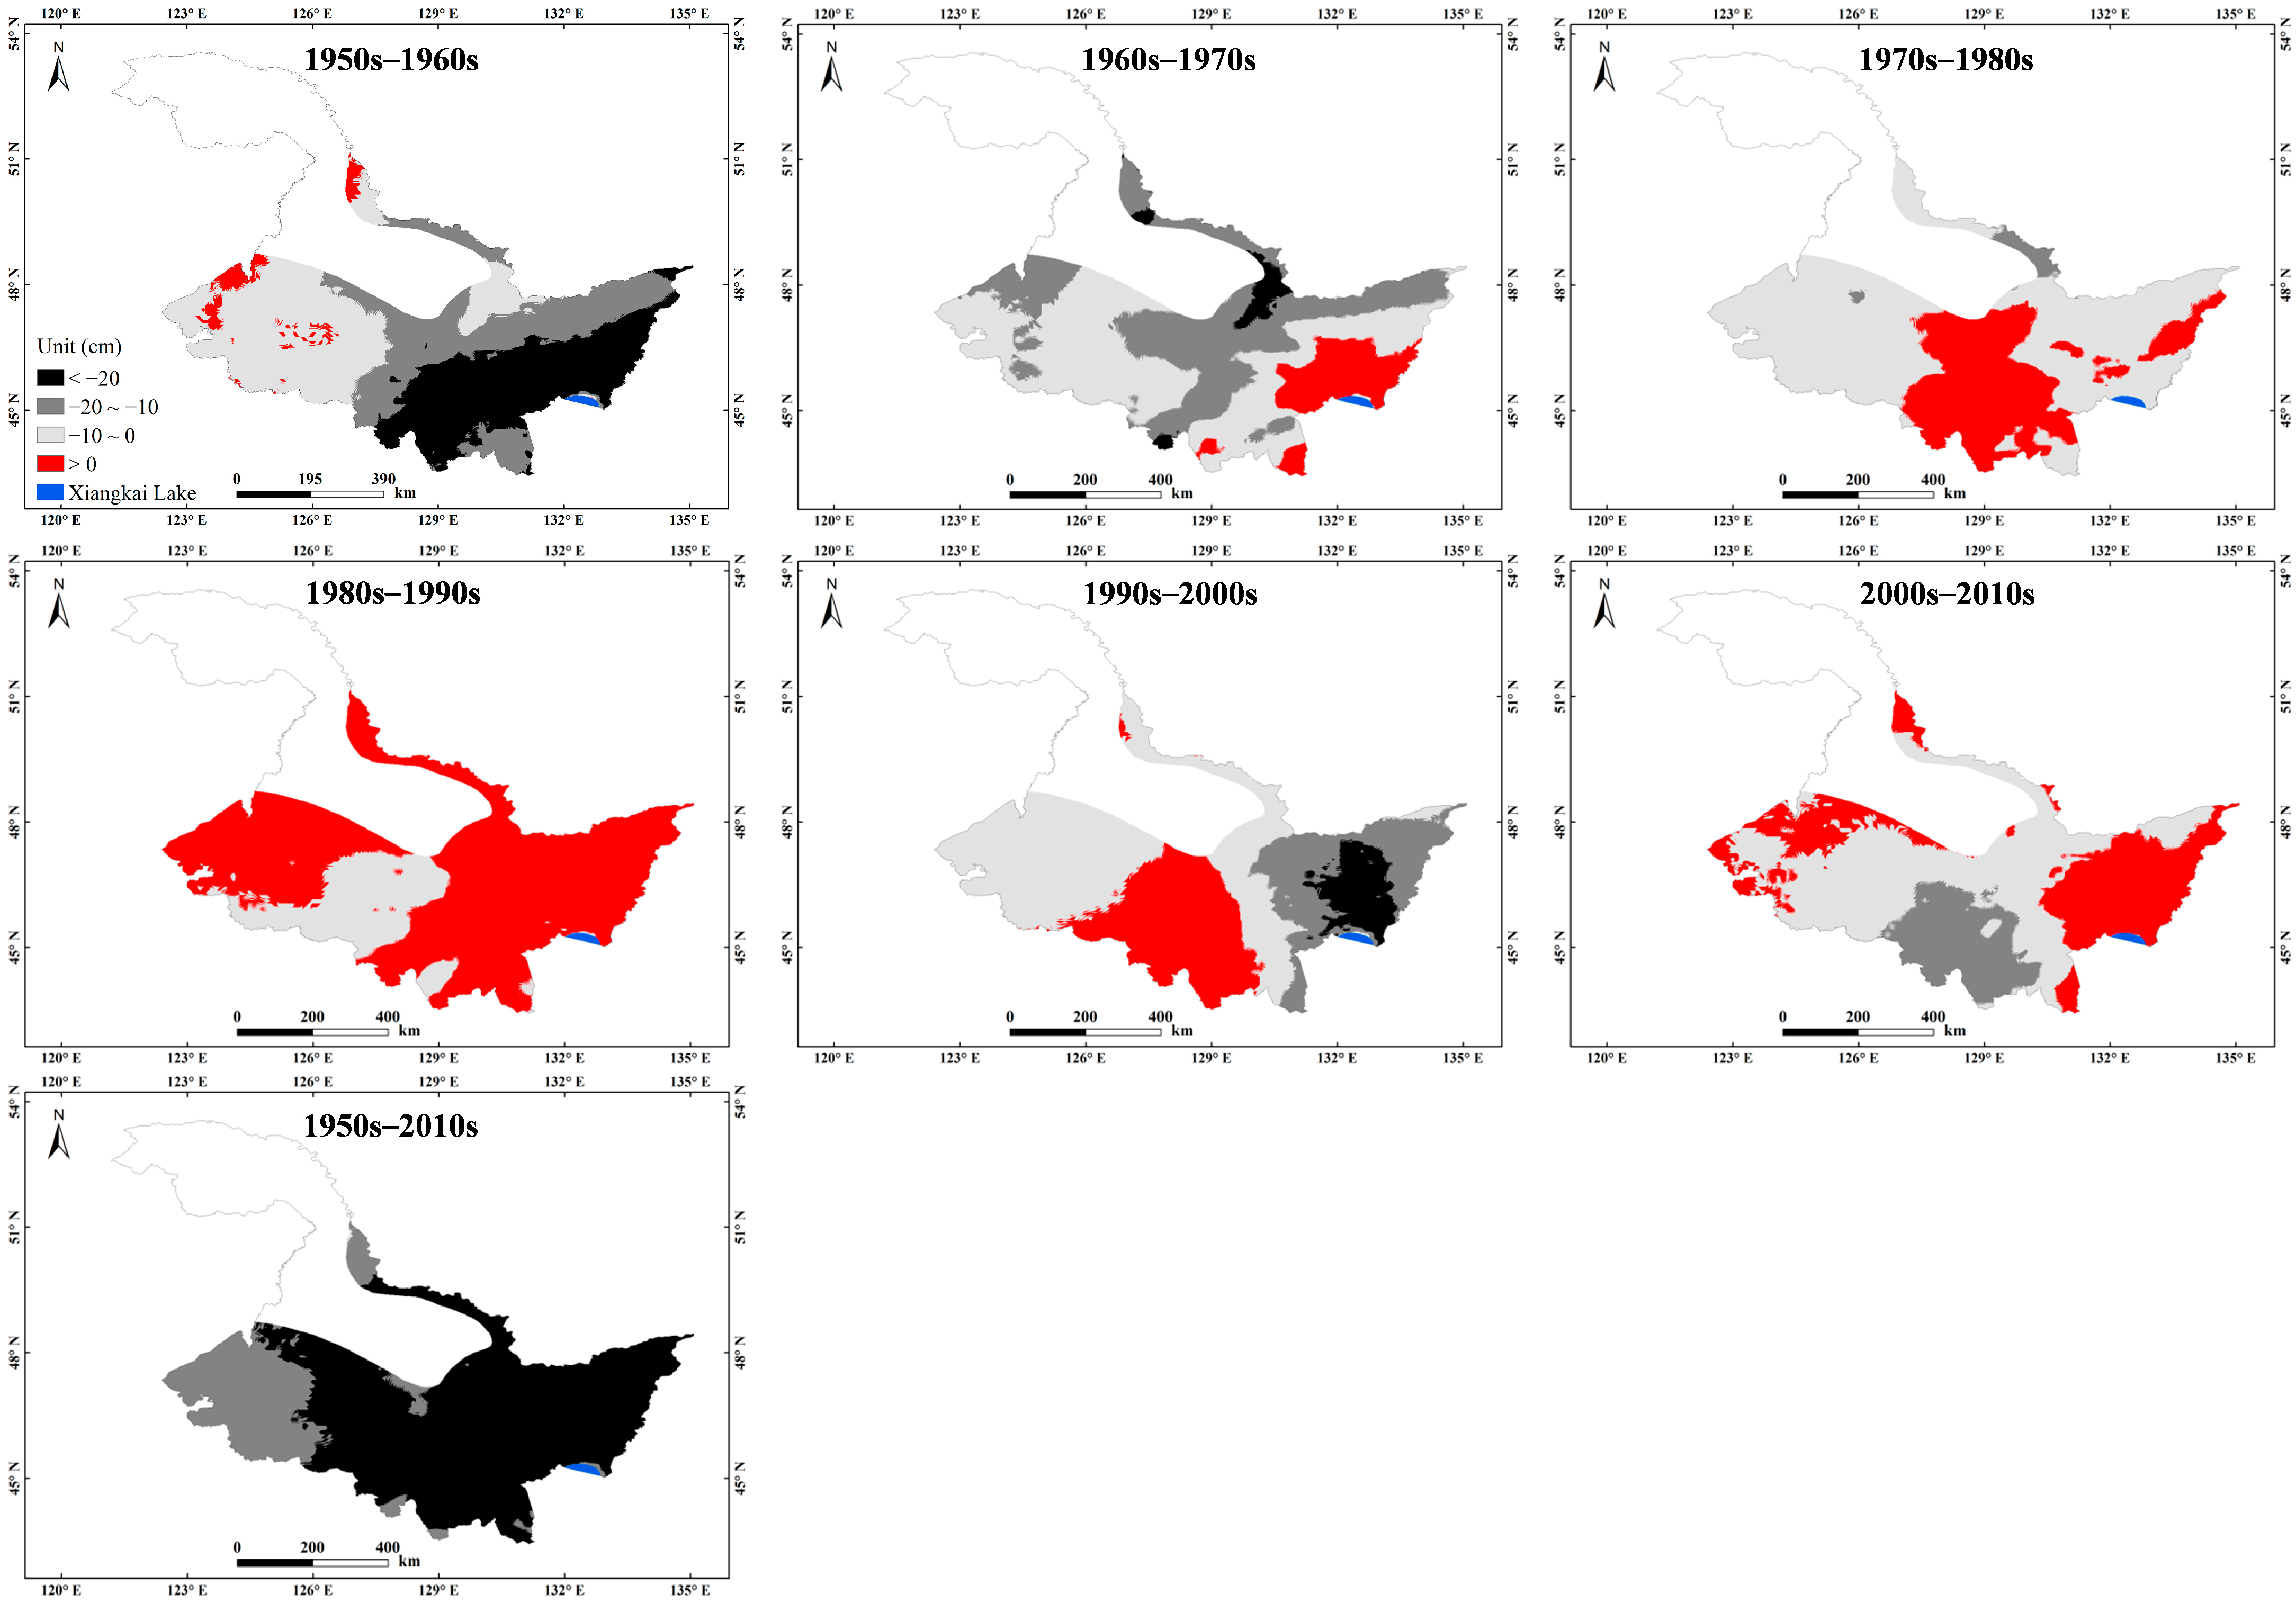
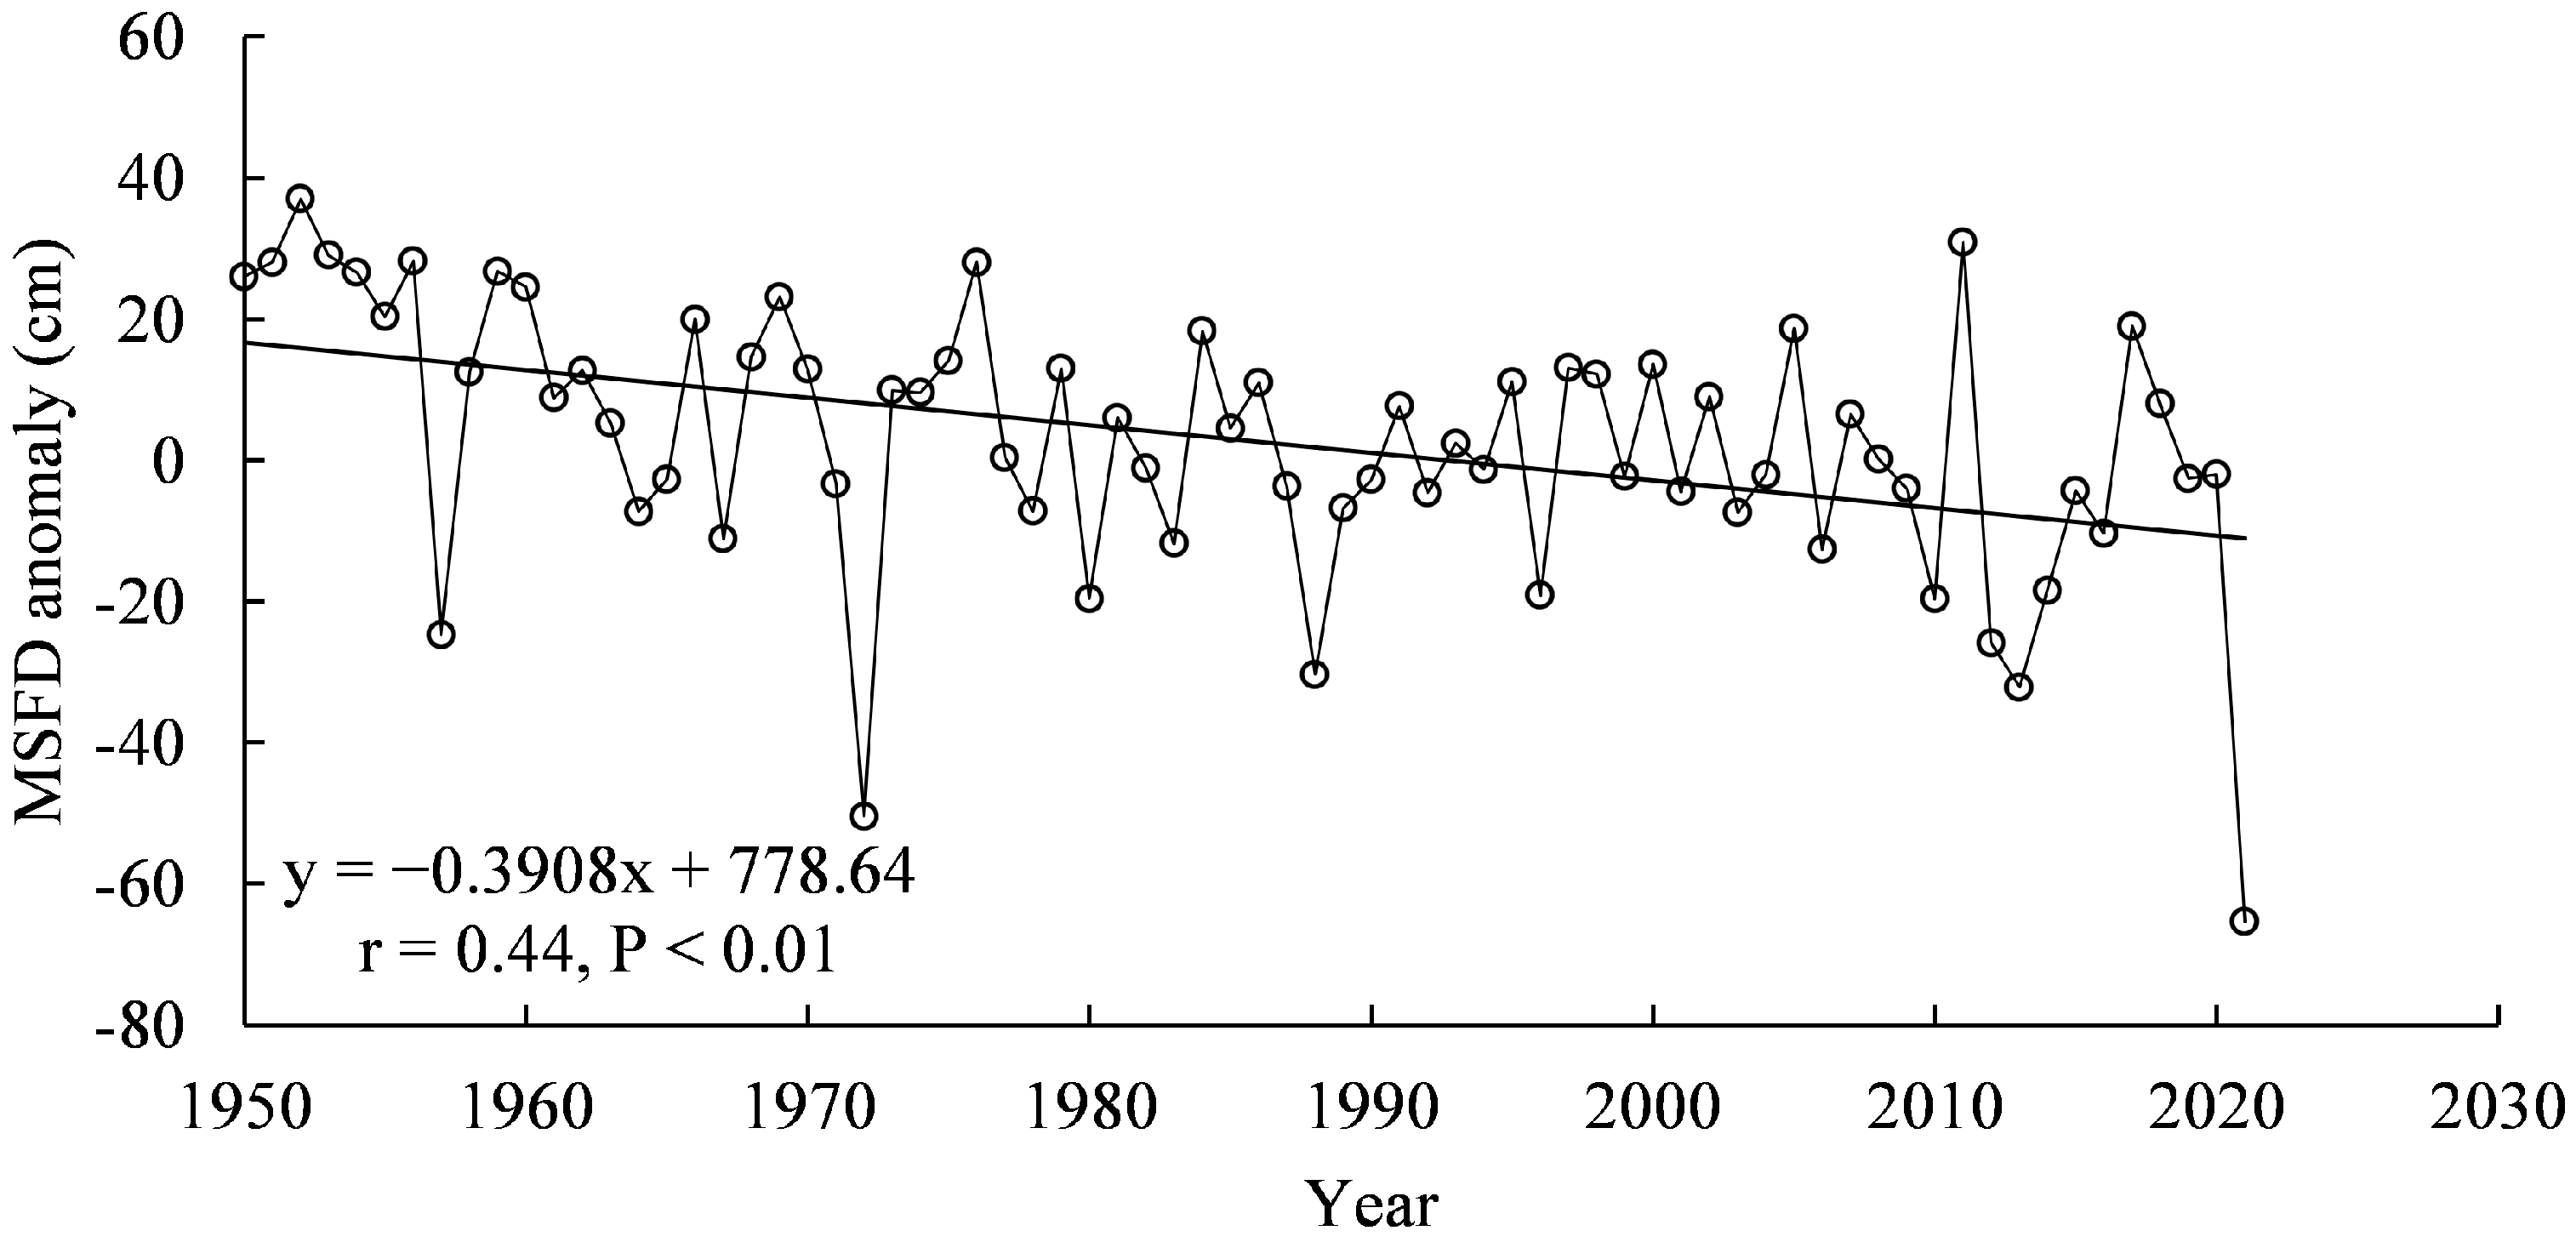
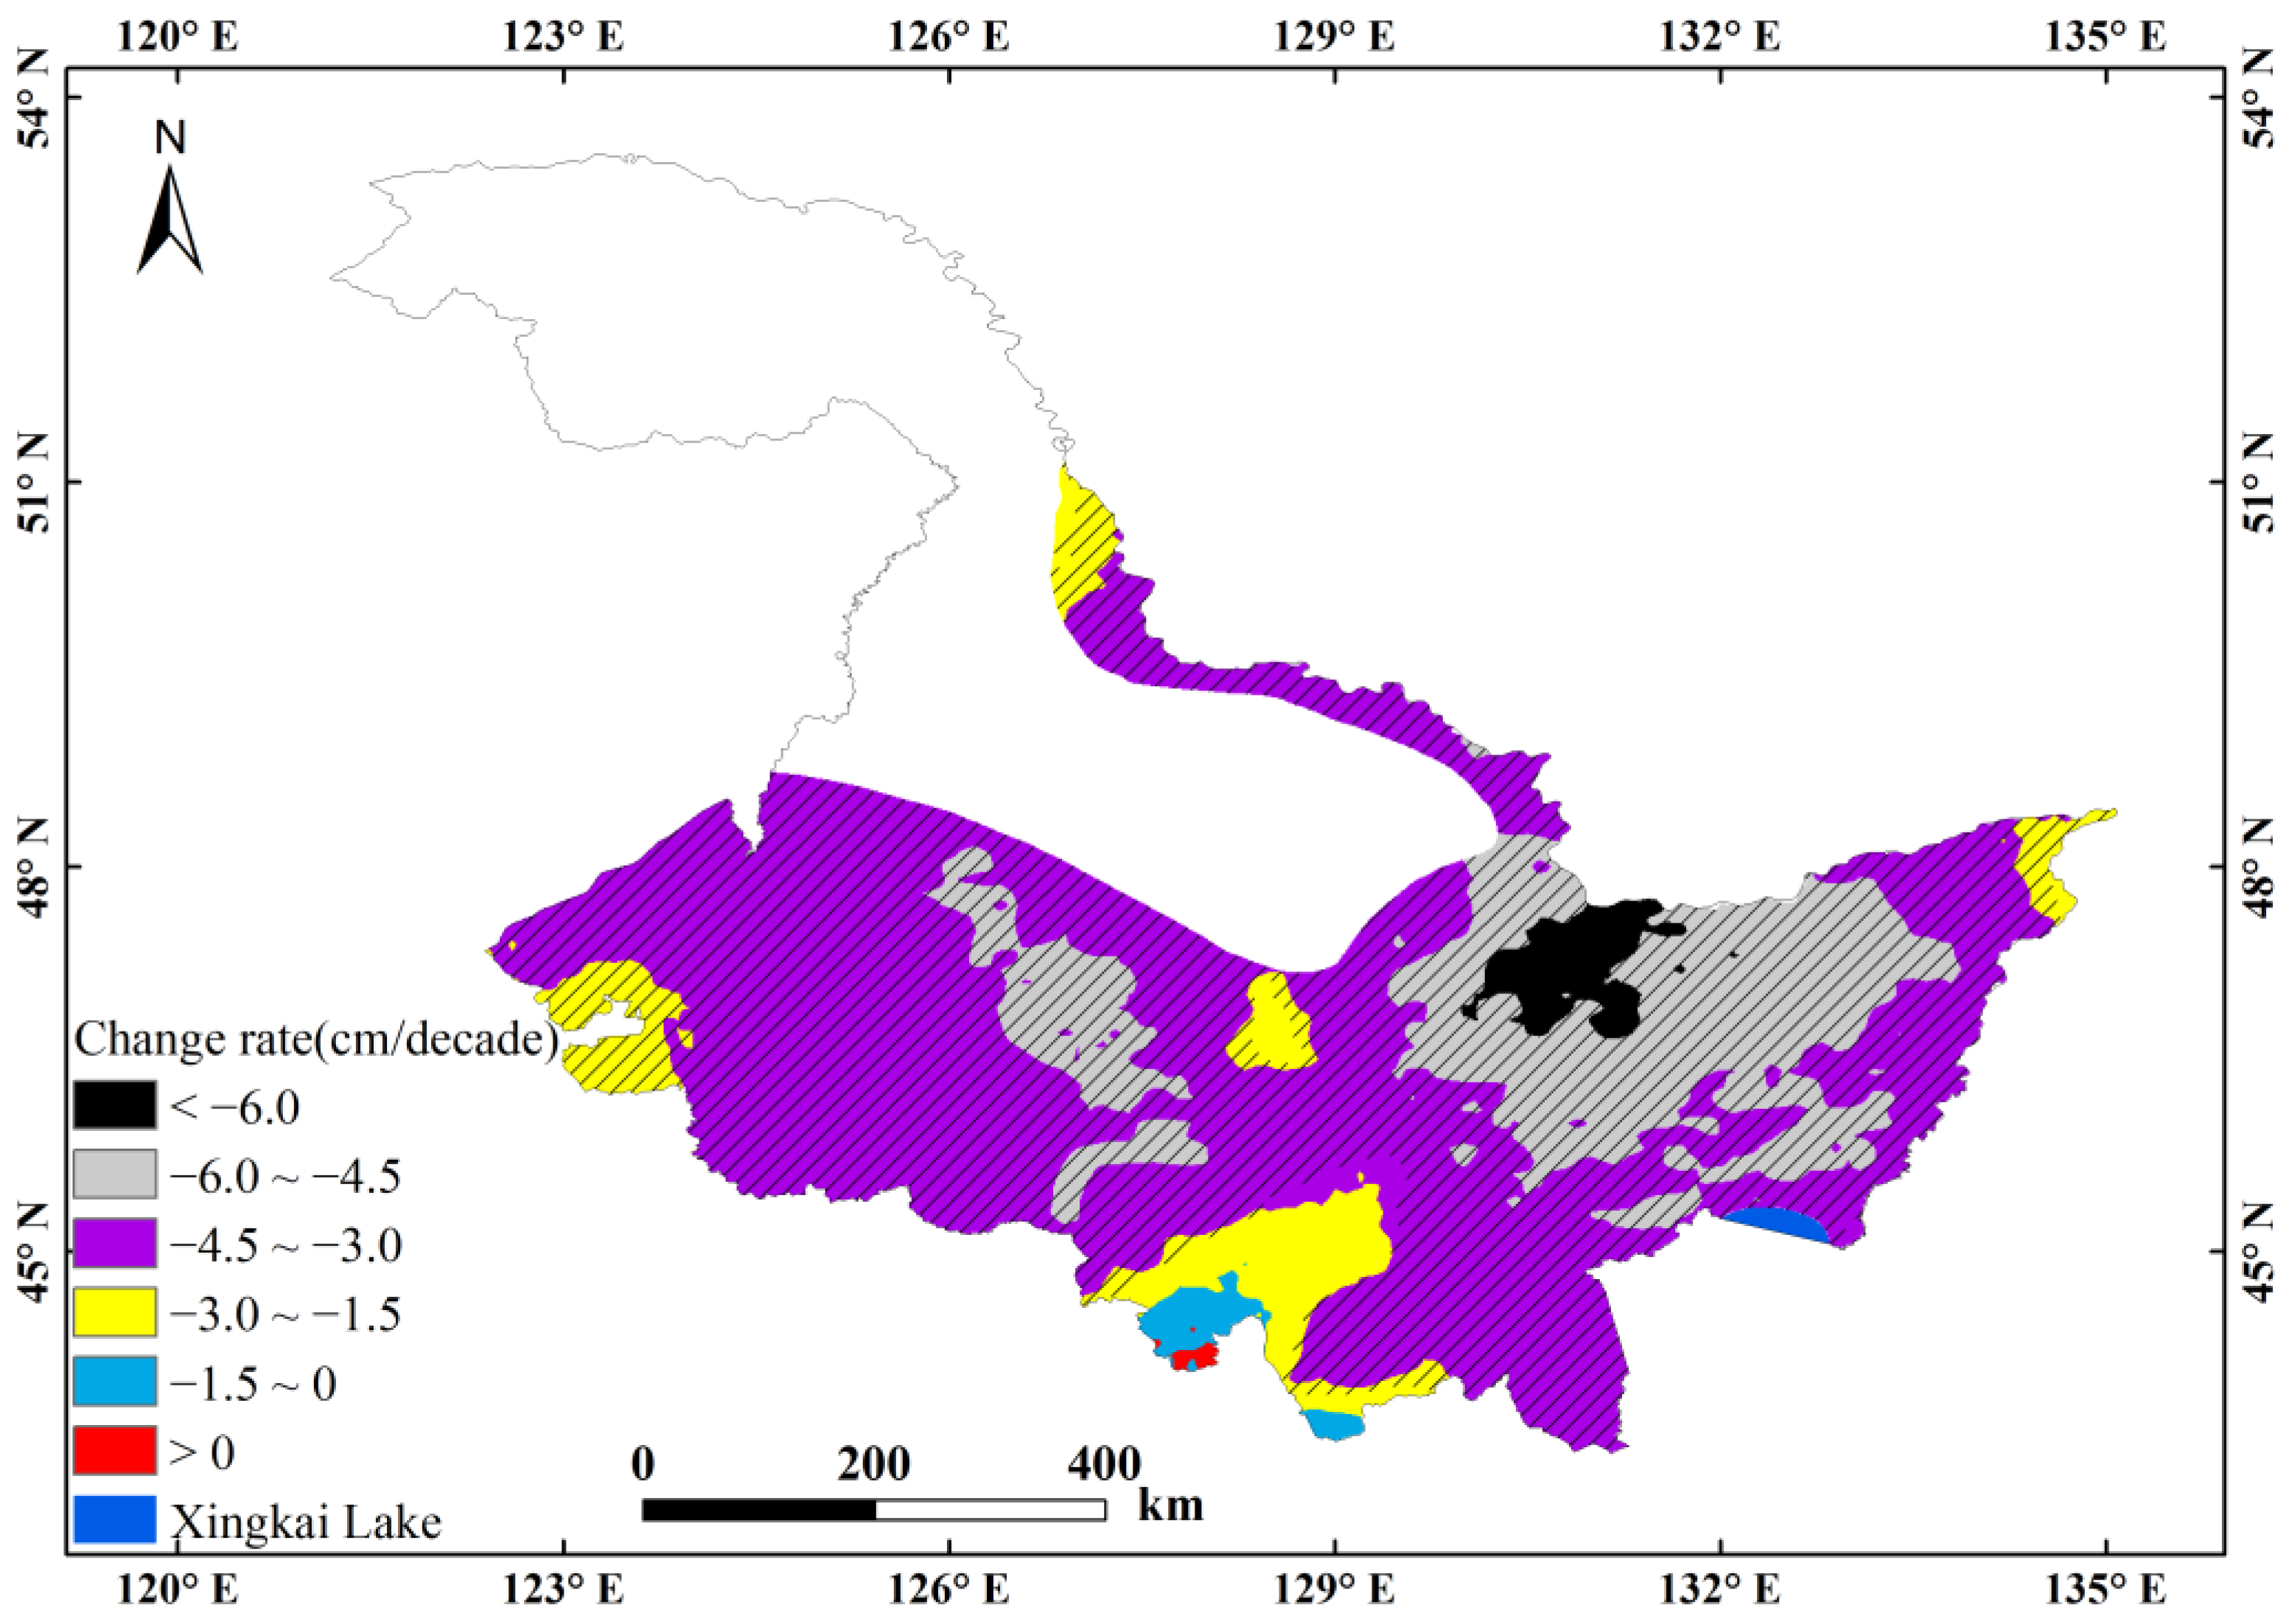
3.3.3. Changes in Soil Freeze Depth

Over the past seven decades, the average MSFD for the entire region reached its maximum (153 cm) in the 1950s, after which it has tended to gradually decrease. From the 1950s to the 2010s, the MSFD greatly decreased by −25 cm, and the area of MSFD that thinned more than −20 cm represented ~72% of the total area of SFG (Figure 6). In addition, increased MSFD was detected, and the area ratio of MSFD thickening increased to 79.4% from the 1980s to the 1990s. Similar findings also applied to MSFD variation for other periods. For example, the area ratio of soil freeze depth thickening exceeded 25% for the periods of the 1970s–1980s, 1990s–2000s, and 2000s–2010s but was only ~12% for the 1960s–1970s (Figure 6).
Figure 7 shows that the MSFD anomaly exhibited a significantly decreasing trend at a rate of −0.39 cm/decade or a net change of −28.14 cm from 1950–2021 (i.e., 72 years). At grid scales, approximately 93.48% of the area displayed a significant decreasing trend in MSFD at the 95% confidence level (Figure 8). The geographic distributions of the decreasing rates in MSFD have varied greatly over the past 72 years, with relatively high decreasing rates (e.g., <−4.5 cm/decade) primarily occurring in the center of the region and relatively low decreasing rates (e.g., −3.0–0 cm/decade) sporadically distributed around the study area.

4. Discussion

4.1. Comparison with the Stefan Solution

The simplified Stefan solution requires relatively few inputs (see Equation (S2) in Supporting Materials) and has high simulation accuracy, and thus has been broadly applied for soil freeze depth estimations at regional, national, and hemispheric scales [8,9,28,29,30,31,32]. However, the simplified Stefan solution does not fully consider the potential impact of changing snow cover conditions on soil freeze depth, which may limit its wide application in areas with substantial snow cover. We therefore emphasize the importance of considering snow cover variables in analyzing and estimating the soil freeze depth of SFG in such areas.
Snow only covers the ground during the cold season, but its changes can significantly affect the soil’s thermal state due to its high albedo, low thermal conductivity, and latent heat of phase changes [34,35,70,71], which then influence soil freeze/thaw processes [11,36,71]. In pan-Arctic regions, snow depth and snow duration can impact permafrost thermal regimes [72], and increasing snow depth greatly promotes the increase in active layer thickness [41]. Conversely, reductions in snow depth decrease soil temperature and active layer thickness [39,40]. Snow cover can cause permafrost degradation in the low Arctic due to a strong insulation effect in winter but can protect permafrost in the high Arctic when the SCD exceeds 330 days [38]. Across the circumpolar north, the influence of SCD on soil temperature was larger than that of snow depth [34]. According to the summary of Zhang (2001) [71], a relatively thin snow cover may cool the soil surface due to high albedo snow causing the soil to absorb less solar radiation, but this cooling effect is very brief if the snow lasts for a short time. Alternatively, relatively thick snow cover can warm the ground by insulating it from coldness, whereas snow cover that lasts until next spring or even summer can cool the ground due to the albedo and latent heat of fusion.
By quantifying the potential influences of driving factors (including air temperature, snow cover, vegetation, and soil properties) on the MSFD variation based on data from the 26 stations, the effect of snow cover on the MSFD was significantly greater than that of air temperature in Heilongjiang, with the relative contributions of ASD and SCD (~56.11%) more than double that of FI (27.20%). This may have been due to relatively thick snow cover combined with relatively long snow cover days. For example, the multi-year mean ASD (1981–2010) was ~7.37 cm (from 2.61 cm to 11.38 cm) based on the 26 stations, which was smaller than that of Russia (>10 cm) but nearly twice the average snow depth of China [47,56]. The multi-year mean SCD was ~103.23 days (from 60.23 days to 134.57 days), and ~73% of stations had a mean of more than 90 days. The relatively strong impact of snow cover on MSFD suggested substantial uncertainty in the MSFD estimations in snowy regions using the simplified Stefan solution, which only considers air temperature as the main input variable. By fitting the three selected variables (i.e., FI, ASD, and SCD), this study provided an empirical algorithm to estimate soil freeze depth. Compared with the commonly used estimation methods (i.e., the simplified Stefan solution), this empirical algorithm achieved superior performance by considering snow cover variables, with the RMSE and MAE of the station average reduced by over 20%. It was thus more suitable to simulate the soil freeze depth in snowy regions.

4.2. Limitations of This Study

In this study, the fitting of the empirical algorithm to estimate soil freeze depth was based on data from 26 stations within and around the SFG region of Heilongjiang province. The uniformity and representativeness of the site distribution undoubtedly affected the accuracy of the fit of the algorithm. More station observations and field survey data should thus be added in the future, and the applicability of this estimation method should be evaluated in other snowy regions [73,74,75,76,77]. In addition, two common snow cover variables, ASD and SCD, were selected and fitted with the air temperature variable (characterized by FI) to build the algorithm and estimate soil freeze depth. In the real world, the effects of snow cover on soil freeze/thaw processes are complex and largely depend on snow cover thickness, timing, duration, density, accumulation characteristics, and melting processes, as well as local environmental and meteorological conditions [71]. Future research should therefore focus on the effects of multiple snow cover parameters on soil freeze depth with greater consideration of local climatic and environmental contexts.
The ERA5-Land reanalysis dataset provides a good data source to study the characteristics of soil freeze depth changes at different time scales (e.g., monthly, annual, and decadal) with high temporal (1 h) and spatial (0.1° × 0.1°) resolutions from 1950 to present [57,58]. Previous studies have suggested that the ERA5-Land reanalysis dataset (for daily air temperature) performed better in East China (including Heilongjiang province) than in West China and the QTP [78]. Following Li et al. (2022), the mean coefficient of determination (R2) of all 26 stations was 0.88, ranging from 0.81 to 0.95. Combined with relatively low RMSE/Mean and MAE/Mean values for the calculated against observed FI (Figure 4a,b), our results further confirm the high performance of air temperature data obtained from ERA5-Land in Heilongjiang province. Compared with the statistical criteria calculated against observed snow depths in China from 1951 to 2009 [48], the RMSE/Mean and MAE/Mean of the corresponding sites in this study were relatively low, which suggests a superior snow depth simulation result in Heilongjiang province using the ERA5-Land reanalysis dataset. Due to the shortage of observational data, the evaluation of LAI and SM data extracted from the ERA5-Land hourly reanalysis dataset was performed by comparing the possible influence of different data products on quantifying the main driving factors of MSFD variations. However, to obtain better estimation and analysis results at spatial scales in the future, the utilization of higher resolution downscaled and remote sensing datasets that combine ground-based observations and field surveys should be considered.

5. Conclusions

Statistics on the relative contributions of potential driving factors to MSFD variations showed that ASD had the greatest effect (42.04%), followed by FI (27.20%) and SCD (11.07%), while SM and LAI had negligible effects (<2%). This suggests that the influence of snow cover on MSFD variations was clearly larger than that of air temperature, possibly caused by relatively thick snow cover combined with relatively long snow cover days in the study area. By considering the three variables (i.e., FI, ASD, and SCD) that contributed more than 10% to MSFD variation, a simple empirical algorithm to estimate soil freeze depth was fitted (1981–2010) and verified (1975–1980 and 2011–2014) using ground station observations. This simple empirical algorithm (considering the snow cover variable) performed better in snowy regions compared to the commonly used Stefan solution, with the MAE and RMSE of the station average reduced by over 20%. Using the ERA5-Land reanalysis dataset (1950−2021) and the simple empirical algorithm, detailed spatiotemporal variations of soil freeze depth were also assessed in the SFG region of Heilongjiang province.
Soil freeze depth may also be affected by other unconsidered regional variables, such as soil organic materials, land use change, soil type, air pollution, and ecological protection activities. Nevertheless, this paper provides a practical empirical algorithm with particular utility in data-scarce regions with relatively substantial snow cover, as it requires fewer inputs and provides useful information from frozen ground depth simulation over a regional scale. The results of this study also underscored the importance of including snow cover variables when analyzing and estimating historical and future soil freeze depth variations in snowy regions.

Supplementary Materials

The following supporting information can be downloaded at: https://www.mdpi.com/article/10.3390/rs14235989/s1.

Author Contributions

Conceptualization, X.W. and R.C.; methodology, X.W. and R.C.; validation, X.W., R.C., C.H., Y.Y., J.L., Z.L. and S.G.; formal analysis, X.W. and R.C.; data curation, C.H., Y.Y., J.L., Z.L. and S.G.; writing—original draft preparation, X.W. and R.C.; funding acquisition, X.W. and R.C. All authors have read and agreed to the published version of the manuscript.

Funding

This work was supported by the National Natural Science Foundation of China (41901084 and 42171145), the National Key Research and Development Program of China (2019YFC1510505), Joint Research Project of Three-River Headwaters National Park, Chinese Academy of Sciences and The People’s Government of Qinghai Province (LHZX-2020-11), and the CAS “Light of West China” Program.

Data Availability Statement

The ERA5-Land hourly reanalysis dataset from the ECMWF used in this study can be accessed online (https://cds.climate.copernicus.eu (accessed on 10 May 2022)). Gridded normalized difference vegetation index (NDVI) data from 1982 to 2010 with 5 km spatial resolution were collected from the National Earth System Science Data Center of the National Science & Technology Infrastructure of China (http://www.geodata.cn (accessed on 15 May 2022)). The soil moisture data for GLDAS Noah Land Surface Model L4 monthly 0.25 × 0.25 degree V2.0 were provided by the Goddard Earth Sciences Data and Information Services Center, which can be accessed online (https://disc.gsfc.nasa.gov (accessed on 15 May 2022)). The Daily Meteorological Dataset of basic meteorological elements of China National Surface Weather Stations provided by the China Meteorological Administration can be accessed online (http://data.cma.cn (accessed on 15 March 2022)).

Acknowledgments

The authors would like to thank all team members at Qilian Alpine Ecology and Hydrology Research Station, Northwest Institute of Eco-Environment and Resources, Chinese Academy of Sciences.

Conflicts of Interest

The authors declare no conflict of interest.

Abbreviations

MSFDannual maximum seasonally frozen depth
SFGseasonally frozen ground
QTPQinghai-Tibetan Plateau
DEMdigital elevation model
FIair freezing index
SCDsnow cover days
ASDaverage snow depth
SMsoil moisture content
LAIleaf area index
RMSEroot mean square error
MAEmean absolute error
NDVInormalized difference vegetation index
GLDASGlobal Land Data Assimilation System

References

  1. Frauenfeld, O.; Zhang, T. An observational 71-year history of seasonally frozen ground changes in the Eurasian high latitudes. Environ. Res. Lett. 2011, 6, 044024. [Google Scholar] [CrossRef] [Green Version]
  2. Zhang, T.; Barry, R.G.; Gilichinsky, D.; Bykhovets, S.S.; Sorokovikov, V.A.; Ye, J. An amplified signal of climatic change in soil temperatures during the last century at Irkutsk, Russia. Clim. Change 2001, 49, 41–76. [Google Scholar] [CrossRef]
  3. Frauenfeld, O.; Zhang, T.; Barry, R.; Gilichinsky, D. Intedecadal changes in seasonal freeze and thaw depths in Russia. J. Geophys. Res. 2004, 109, D05101. [Google Scholar]
  4. Ji, F.; Fan, L.; Andrews, C.; Yao, Y.; Zheng, C. Dynamics of seasonally frozen ground in the Yarlung Zangbo River Basin on the Qinghai-Tibet Plateau: Historical trend and future projection. Environ. Res. Lett. 2020, 15, 104081. [Google Scholar] [CrossRef]
  5. Luo, S.; Fang, X.; Lyu, S.; Jiang, Q.; Wang, J. Interdecadal changes in the freeze depth and period of frozen soil on the Three Rivers Source Region in China from 1960 to 2014. Adv. Meteorol. 2017, 2017, 1–14. [Google Scholar] [CrossRef] [Green Version]
  6. Luo, S.; Wang, J.; Pomeroy, J.W.; Lyu, S. Freeze–thaw changes of seasonally frozen ground on the Tibetan Plateau from 1960 to 2014. J. Clim. 2020, 33, 9427–9446. [Google Scholar] [CrossRef]
  7. Peng, X.; Zhang, T.; Cao, B.; Wang, Q.; Wang, K.; Shao, W.; Guo, H. Changes in freezing-thawing index and soil freeze depth over the Heihe River Basin, western China. Arct. Antarct. Alp. Res. 2016, 48, 161–176. [Google Scholar] [CrossRef] [Green Version]
  8. Peng, X.; Zhang, T.; Frauenfeld, O.W.; Du, R.; Liang, B. Soil freeze depth variability across Eurasia during 1850–2100. Clim. Chang. 2020, 158, 531–549. [Google Scholar] [CrossRef]
  9. Peng, X.; Zhang, T.; Frauenfeld, O.W.; Wang, K.; Cao, B.; Zhong, X.; Su, H.; Mu, C. Response of seasonal soil freeze depth to climate change across China. Cryosphere 2017, 11, 1059–1073. [Google Scholar] [CrossRef] [Green Version]
  10. Wang, X.; Chen, R.; Liu, G.; Yang, Y.; Song, Y.; Liu, J.; Liu, Z.; Han, C.; Liu, X.; Guo, S.; et al. Spatial distributions and temporal variations of the near-surface soil freeze state across China under climate change. Global Planet. Change 2019, 172, 150–158. [Google Scholar] [CrossRef]
  11. Biskaborn, B.K.; Smith, S.L.; Noetzli, J.; Matthes, H.; Vieira, G.; Streletskiy, D.A.; Schoeneich, P.; Romanovsky, V.E.; Lewkowicz, A.G.; Abramov, A.; et al. Permafrost is warming at a global scale. Nat. Commun. 2019, 10, 264. [Google Scholar] [CrossRef]
  12. Cuo, L.; Zhang, Y.; Bohn, T.J.; Zhao, L.; Li, J.; Liu, Q.; Zhou, B. Frozen soil degradation and its effects on surface hydrology in the northern Tibetan Plateau. J. Geophys. Res. Atmos. 2015, 120, 8276–8298. [Google Scholar] [CrossRef] [Green Version]
  13. Mu, C.; Zhang, T.; Wu, Q.; Peng, X.; Cao, B.; Zhang, X.; Cao, B.; Cheng, G. Organic carbon pools in permafrost regions on the Qinghai-Xizang (Tibetan) Plateau. Cryosphere 2015, 9, 479–486. [Google Scholar] [CrossRef] [Green Version]
  14. Zhao, L.; Ping, C.; Yang, D.; Cheng, G.; Ding, Y.; Liu, S. Changes of climate and seasonally frozen ground over the past 30 years in Qinghai–Xizang (Tibetan) Plateau, China. Global Planet. Change 2004, 43, 19–31. [Google Scholar] [CrossRef]
  15. Lai, Y.; Xu, X.; Dong, Y.; Li, S. Present situation and prospect of mechanical research on frozen soils in China. Cold Reg. Sci. Technol. 2013, 87, 6–18. [Google Scholar] [CrossRef]
  16. Turetsky, M.R.; Abbott, B.W.; Jones, M.C.; Anthony, K.W.; Olefeldt, D.; Schuur, E.A.G.; Grosse, G.; Kuhry, P.; Hugelius, G.; Koven, C.; et al. Carbon release through abrupt permafrost thaw. Nat. Geosci. 2020, 13, 138–143. [Google Scholar] [CrossRef]
  17. China Meteorological Administration. The Norm of Surface Meteorological Observation; China Meteorological Press: Beijing, China, 2003; p. 151. [Google Scholar]
  18. Woo, M.K.; Kane, D.L.; Carey, S.K.; Yang, D. Progress in permafrost hydrology in the new millennium. Permafr. Periglac. 2008, 19, 237–254. [Google Scholar] [CrossRef]
  19. Walvoord, M.A.; Kurylyk, B.L. Hydrologic impacts of thawing permafrost—A review. Vadose Zone J. 2016, 15, 1–20. [Google Scholar] [CrossRef] [Green Version]
  20. Gouttevin, I.; Krinner, G.; Ciais, P.; Polcher, J.; Legout, C. Multi-scale validation of a new soil freezing scheme for a land-surface model with physically-based hydrology. Cryosphere 2012, 6, 407–430. [Google Scholar] [CrossRef] [Green Version]
  21. Evans, S.G.; Ge, S. Contrasting hydrogeologic responses to warming in permafrost and seasonally frozen ground hillslopes. Geophys. Res. Lett. 2017, 44, 1803–1813. [Google Scholar] [CrossRef]
  22. Zhang, Y.; Cheng, G.; Li, X.; Jin, H.; Yang, D.; Flerchinger, G.N.; Chang, X.; Bense, V.F.; Han, X.; Liang, J. Influences of frozen ground and climate change on hydrological processes in an alpine watershed: A case study in the upstream area of the Hei’he River, Northwest China. Permafr. Periglac. 2017, 28, 420–432. [Google Scholar] [CrossRef]
  23. Qin, Y.; Chen, J.; Yang, D.; Wang, T. Estimating seasonally frozen ground depth from historical climate data and site measurements using a Bayesian model. Water Resour. Res. 2018, 54, 4361–4375. [Google Scholar] [CrossRef]
  24. Wang, T.; Yang, D.; Fang, B.; Yang, W.; Qin, Y.; Wang, Y. Data-driven mapping of the spatial distribution and potential changes of frozen ground over the Tibetan Plateau. Sci. Total Environ. 2019, 649, 515–525. [Google Scholar] [CrossRef] [PubMed]
  25. Wang, T.; Yang, D.; Qin, Y.; Wang, Y.; Chen, Y.; Gao, B.; Yang, H. Historical and future changes of frozen ground in the upper Yellow River Basin. Global Planet. Change 2018, 162, 199–211. [Google Scholar] [CrossRef]
  26. Stefan, J. Ueber die Theorie der Eisbildung, insbesondere über die Eisbildung im Polarmeere. Ann. Phys. 1891, 278, 269–286. [Google Scholar] [CrossRef] [Green Version]
  27. Jumikis, A.R. Thermal Geotechnics; Rutgers University Press: New Brunswick, NI, USA, 1977. [Google Scholar]
  28. Wang, Q.; Zhang, T.; Peng, X.; Cao, B.; Wu, Q. Changes of soil thermal regimes in the Heihe River Basin over western China. Arct. Antarct. Alp. Res. 2015, 47, 231–241. [Google Scholar] [CrossRef] [Green Version]
  29. Wu, Q.; Hou, Y.; Yun, H.; Liu, Y. Changes in active-layer thickness and near-surface permafrost between 2002 and 2012 in alpine ecosystems, Qinghai–Xizang (Tibet) Plateau, China. Global Planet. Change 2015, 124, 149–155. [Google Scholar] [CrossRef]
  30. Liu, L.; Luo, D.; Wang, L.; Huang, Y.; Chen, F. Variability of soil freeze depth in association with climate change from 1901 to 2016 in the upper Brahmaputra River Basin, Tibetan Plateau. Theor. Appl. Climatol. 2020, 142, 19–28. [Google Scholar] [CrossRef]
  31. Zhang, T.; Frauenfeld, O.W.; Serreze, M.C.; Etringer, A.; Oelke, C.; McCreight, J.; Barry, R.G.; Gilichinsky, D.; Yang, D.; Ye, H.; et al. Spatial and temporal variability in active layer thickness over the Russian Arctic drainage basin. J. Geophys. Res. Atmos. 2005, 110, D16101. [Google Scholar] [CrossRef]
  32. Wang, Q.; Zhang, T. Spatiotemporal variations of maximum seasonal freeze depth in 1950s–2007 over the Heihe River Basin, Northwest China. Sci. Cold Arid Reg. 2014, 6, 0209–0218. [Google Scholar]
  33. Nelson, F.E.; Shiklomanov, N.I.; Mueller, G.R.; Hinkel, K.M.; Walker, D.A.; Bockheim, J.G. Estimating active-Layer thickness over a large region: Kuparuk River Basin, Alaska, U.S.A. Arct. Alp. Res. 1997, 29, 367–378. [Google Scholar] [CrossRef]
  34. Zhang, Y.; Artem, B.S.; Qian, B.; Steven, V.K.; Trevor, C.L. Impacts of snow on soil temperature observed across the circumpolar north. Environ. Res. Lett. 2018, 13, 044012. [Google Scholar] [CrossRef]
  35. Park, H.; Sherstiukov, A.B.; Fedorov, A.N.; Polyakov, I.V.; Walsh, J.E. An observation-based assessment of the influences of air temperature and snow depth on soil temperature in Russia. Environ. Res. Lett. 2014, 9, 064026. [Google Scholar] [CrossRef]
  36. Lawrence, D.M.; Slater, A.G. The contribution of snow condition trends to future ground climate. Clim. Dyn. 2010, 34, 969–981. [Google Scholar] [CrossRef] [Green Version]
  37. Zhang, W.; Shen, Y.; Wang, X.; Kang, S.; Chen, A.A.; Mao, W.; Zhong, X. Snow cover controls seasonally frozen ground regime on the southern edge of Altai Mountains. Agric. For. Meteorol. 2021, 297, 108271. [Google Scholar] [CrossRef]
  38. Wang, Z.; Kim, Y.; Seo, H.; Um, M.-J.; Mao, J. Permafrost response to vegetation greenness variation in the Arctic tundra through positive feedback in surface air temperature and snow cover. Environ. Res. Lett. 2019, 14, 044024. [Google Scholar] [CrossRef]
  39. Osterkamp, T. Causes of warming and thawing permafrost in Alaska. Eos Trans. Amer. Geophys. Union 2007, 88, 522–523. [Google Scholar] [CrossRef] [Green Version]
  40. Park, H.; Walsh, J.; Fedorov, A.N.; Sherstiukov, A.B.; Iijima, Y.; Ohata, T. The influence of climate and hydrological variables on opposite anomaly in active-layer thickness between Eurasian and North American watersheds. Cryosphere 2013, 7, 631–645. [Google Scholar] [CrossRef] [Green Version]
  41. Iijima, Y.; Fedorov, A.N.; Park, H.; Suzuki, K.; Yabuki, H.; Maximov, T.C.; Ohata, T. Abrupt increases in soil temperatures following increased precipitation in a permafrost region, central Lena River basin, Russia. Permafr. Periglac. 2010, 21, 30–41. [Google Scholar] [CrossRef]
  42. Wang, B.; Ran, Y. Diversity of remote sensing-based variable inputs improves the estimation of seasonal maximum freezing depth. Remote Sens. 2021, 13, 4829. [Google Scholar] [CrossRef]
  43. Nelson, F.E.; Outcalt, S.I. A computational method for prediction and regionalization of permafrost. Arct. Alp. Res. 1987, 19, 279–288. [Google Scholar] [CrossRef]
  44. Loranty, M.M.; Abbott, B.W.; Blok, D.; Douglas, T.A.; Epstein, H.E.; Forbes, B.C.; Jones, B.M.; Kholodov, A.L.; Kropp, H.; Malhotra, A.; et al. Reviews and syntheses: Changing ecosystem influences on soil thermal regimes in northern high-latitude permafrost regions. Biogeosciences 2018, 15, 5287–5313. [Google Scholar] [CrossRef]
  45. Snyder, P.K.; Delire, C.; Foley, J.A. Evaluating the influence of different vegetation biomes on the global climate. Clim. Dyn. 2004, 23, 279–302. [Google Scholar] [CrossRef]
  46. Ala-Aho, P.; Autio, A.; Bhattacharjee, J.; Isokangas, E.; Kujala, K.; Marttila, H.; Menberu, M.; Meriö, L.J.; Postila, H.; Rauhala, A.; et al. What conditions favor the influence of seasonally frozen ground on hydrological partitioning? A systematic review. Environ. Res. Lett. 2021, 16, 043008. [Google Scholar] [CrossRef]
  47. Ma, L.; Qin, D. Temporal-spatial characteristics of observed key parameters of snow cover in China during 1957–2009. Sci. Cold Arid Reg. 2012, 4, 0384–0393. [Google Scholar]
  48. Yang, Y.; Chen, R.; Liu, G.; Liu, Z.; Wang, X. Trends and variability in snowmelt in China under climate change. Hydrol. Earth Syst. Sci. 2022, 26, 305–329. [Google Scholar] [CrossRef]
  49. Qi, W.; Feng, L.; Liu, J.; Yang, H. Snow as an important natural reservoir for runoff and soil moisture in Northeast China. J. Geophys. Res. Atmos. 2020, 125, e2020JD033086. [Google Scholar] [CrossRef]
  50. Zhou, Z.; Shi, H.; Fu, Q.; Li, T.; Gan, T.Y.; Liu, S.; Liu, K. Is the cold region in Northeast China still getting warmer under climate change impact? Atmos. Res. 2020, 237, 104864. [Google Scholar] [CrossRef]
  51. Guo, D.; Wang, H. CMIP5 permafrost degradation projection: A comparison among different regions. J. Geophys. Res. Atmos. 2016, 121, 4499–4517. [Google Scholar] [CrossRef]
  52. Xu, S.; Fu, Q.; Li, T.; Meng, F.; Liu, D.; Hou, R.; Li, M.; Li, Q. Spatiotemporal characteristics of the soil freeze-thaw state and its variation under different land use types—A case study in Northeast China. Agric. For. Meteorol. 2022, 312, 108737. [Google Scholar] [CrossRef]
  53. Fu, Q.; Zhou, Z.; Li, T.; Liu, D.; Hou, R.; Cui, S.; Yan, P. Spatiotemporal characteristics of droughts and floods in northeastern China and their impacts on agriculture. Stoch. Environ. Res. Risk Assess. 2018, 32, 2913–2931. [Google Scholar] [CrossRef]
  54. Li, X.; Cheng, G.; Jin, H.; Kang, E.; Che, T.; Jin, R.; Wu, L.; Nan, Z.; Wang, J.; Shen, Y. Cryospheric change in China. Glob. Planet. Change 2008, 62, 210–218. [Google Scholar] [CrossRef]
  55. Zhong, X.; Zhang, T.; Kang, S.; Wang, J. Spatiotemporal variability of snow cover timing and duration over the Eurasian continent during 1966–2012. Sci. Total Environ. 2021, 750, 141670. [Google Scholar] [CrossRef]
  56. Zhong, X.; Zhang, T.; Kang, S.; Wang, K.; Zheng, L.; Hu, Y.; Wang, H. Spatiotemporal variability of snow depth across the Eurasian continent from 1966 to 2012. Cryosphere 2018, 12, 227–245. [Google Scholar] [CrossRef] [Green Version]
  57. Hersbach, H.; Bell, B.; Berrisford, P.; Hirahara, S.; Horányi, A.; Muñoz-Sabater, J.; Nicolas, J.; Peubey, C.; Radu, R.; Schepers, D.; et al. The ERA5 global reanalysis. Q. J. R. Meteorol. Soc. 2020, 146, 1999–2049. [Google Scholar] [CrossRef]
  58. Muñoz-Sabater, J.; Dutra, E.; Agustí-Panareda, A.; Albergel, C.; Arduini, G.; Balsamo, G.; Boussetta, S.; Choulga, M.; Harrigan, S.; Hersbach, H.; et al. ERA5-Land: A state-of-the-art global reanalysis dataset for land applications. Earth Syst. Sci. Data 2021, 13, 4349–4383. [Google Scholar] [CrossRef]
  59. Bi, H.; Ma, J.; Zheng, W.; Zeng, J. Comparison of soil moisture in GLDAS model simulations and in situ observations over the Tibetan Plateau. J. Geophys. Res. Atmos. 2016, 121, 2658–2678. [Google Scholar] [CrossRef] [Green Version]
  60. Cai, J.; Zhang, Y.; Li, Y.; Liang, X.S.; Jiang, T. Analyzing the characteristics of soil moisture using GLDAS Data: A case study in eastern China. Appl. Sci. 2017, 7, 566. [Google Scholar] [CrossRef] [Green Version]
  61. Beck, H.E.; Pan, M.; Miralles, D.G.; Reichle, R.H.; Dorigo, W.A.; Hahn, S.; Sheffield, J.; Karthikeyan, L.; Balsamo, G.; Parinussa, R.M.; et al. Evaluation of 18 satellite- and model-based soil moisture products using in situ measurements from 826 sensors. Hydrol. Earth Syst. Sci. 2021, 25, 17–40. [Google Scholar] [CrossRef]
  62. Rodell, M.; Houser, P.R.; Jambor, U.; Gottschalck, J.; Mitchell, K.; Meng, C.J.; Arsenault, K.; Cosgrove, B.; Radakovich, J.; Bosilovich, M.; et al. The global land data assimilation system. Bull. Am. Meteorol. Soc. 2004, 85, 381–394. [Google Scholar] [CrossRef] [Green Version]
  63. Beaudoing, H.; Rodell, M. NASA/GSFC/HSL, GLDAS Noah Land Surface Model L4 Monthly 0.25 × 0.25 Degree V2.0; Goddard Earth Sciences Data and Information Services Center (GES DISC): Greenbelt, MD, USA, 2019; No. 10.5067/9SQ1B3ZXP2C5. [Google Scholar]
  64. Lai, J.; Zou, Y.; Zhang, J.; Peres-Neto, P.R. Generalizing hierarchical and variation partitioning in multiple regression and canonical analyses using the rdacca.hp R package. Methods Ecol. Evol. 2022, 13, 782–788. [Google Scholar] [CrossRef]
  65. Tao, H.; Song, K.; Liu, G.; Wen, Z.; Wang, Q.; Du, Y.; Lyu, L.; Du, J.; Shang, Y. Songhua River basin’s improving water quality since 2005 based on Landsat observation of water clarity. Environ. Res. 2021, 199, 111299. [Google Scholar] [CrossRef] [PubMed]
  66. Yang, S.; Zhao, W.; Pereira, P. Determinations of environmental factors on interactive soil properties across different land-use types on the Loess Plateau, China. Sci. Total Environ. 2020, 738, 140270. [Google Scholar] [CrossRef] [PubMed]
  67. Chen, Q.; Long, C.; Chen, J.; Cheng, X. Differential response of soil CO2, CH4, and N2O emissions to edaphic properties and microbial attributes following afforestation in central China. Global Change Biol. 2021, 27, 5657–5669. [Google Scholar] [CrossRef] [PubMed]
  68. Sen, P.K. Estimates of the regression coefficient based on Kendall’s Tau. J. Am. Stat. Assoc. 1968, 63, 1379–1389. [Google Scholar] [CrossRef]
  69. Hamed, K.H.; Rao, A.R. A modified Mann-Kendall trend test for autocorrelated data. J. Hydrol. 1998, 204, 182–196. [Google Scholar] [CrossRef]
  70. Goncharova, O.Y.; Matyshak, G.V.; Epstein, H.E.; Sefilian, A.R.; Bobrik, A.A. Influence of snow cover on soil temperatures: Meso- and micro-scale topographic effects (a case study from the northern West Siberia discontinuous permafrost zone). Catena 2019, 183, 104224. [Google Scholar] [CrossRef]
  71. Zhang, T. Influence of the seasonal snow cover on the ground thermal regime: An overview. Rev. Geophys. 2005, 43, RG4002. [Google Scholar] [CrossRef]
  72. Park, H.; Fedorov, A.N.; Zheleznyak, M.N.; Konstantinov, P.Y.; Walsh, J.E. Effect of snow cover on pan-Arctic permafrost thermal regimes. Clim. Dyn. 2015, 44, 2873–2895. [Google Scholar] [CrossRef] [Green Version]
  73. Colombo, N.; Valt, M.; Romano, E.; Salerno, F.; Godone, D.; Cianfarra, P.; Freppaz, M.; Maugeri, M.; Guyennon, N. Long-term trend of snow water equivalent in the Italian Alps. J. Hydrol. 2022, 614, 128532. [Google Scholar] [CrossRef]
  74. Saavedra, F.A.; Kampf, S.K.; Fassnacht, S.R.; Sibold, J.S. Changes in Andes snow cover from MODIS data, 2000–2016. Cryosphere 2018, 12, 1027–1046. [Google Scholar] [CrossRef] [Green Version]
  75. Hammond, J.C.; Saavedra, F.A.; Kampf, S.K. Global snow zone maps and trends in snow persistence 2001–2016. Int. J. Climatol. 2018, 38, 4369–4383. [Google Scholar] [CrossRef]
  76. Lievens, H.; Demuzere, M.; Marshall, H.-P.; Reichle, R.H.; Brucker, L.; Brangers, I.; de Rosnay, P.; Dumont, M.; Girotto, M.; Immerzeel, W.W.; et al. Snow depth variability in the Northern Hemisphere mountains observed from space. Nat. Commun. 2019, 10, 4629. [Google Scholar] [CrossRef] [PubMed]
  77. Guo, H.; Yang, Y.; Zhang, W.; Zhang, C.; Sun, H. Attributing snow cover extent changes over the Northern Hemisphere for the past 65 years. Environ. Res. Commun. 2021, 3, 061001. [Google Scholar] [CrossRef]
  78. Li, H.; Liu, G.; Han, C.-T.; Yang, Y.; Chen, R. Quantifying the trends and variations in the frost-free period and the number of frost days across China under climate change using ERA5-Land Reanalysis Dataset. Remote Sens. 2022, 14, 2400. [Google Scholar] [CrossRef]
Figure 1. Location of Heilongjiang province with the spatial distributions of frozen ground type and 26 meteorological stations. The distribution map of frozen ground was provided by the National Cryosphere Desert Data Center (http://www.ncdc.ac.cn (accessed on 15 May 2022)). The background reflects the altitude. DEM: digital elevation model.
Remotesensing 14 05989 g001
Figure 2. Relative contributions of five variables to MSFD variation for the entire region based on data from 26 stations during the 30-year baseline period (1981–2010). The red bars represent the data of SM and LAI were obtained from ERA5-Land reanalysis dataset. The blue bars represent the data of SM and NDVI were obtained from other data products (see Section 2.2). The negative contribution may suggest that the effect of this variable on MSFD variations can be considered truly unimportant [64].
Remotesensing 14 05989 g002
Figure 3. Comparison of the observed and simulated MSFD values using the (a) multiple linear regression equation (see Equation (S1)) and (b) simplified Stefan solution (see Equation (S2) in Supporting Materials) for all 26 stations during the 10-year validation period (i.e., 1975–1980 and 2011–2014). The black solid line is the 1:1 line.
Remotesensing 14 05989 g003
Figure 4. Statistical criteria of the calculated FI (a,b), SCD (c,d), and ASD (e,f) using the ERA5-Land reanalysis dataset against observed data from 26 meteorological stations in Heilongjiang province. RMSE/Mean and MAE/Mean refer to the ratios of MAE and RMSE to annual mean FI, ASD, and SCD, respectively.
Remotesensing 14 05989 g004
Figure 5. Geographic distribution of the MSFD of SFG in Heilongjiang province during the baseline period (1981–2010).
Remotesensing 14 05989 g005
Figure 6. Changes in the MSFD of SFG over different periods in Heilongjiang province. In the figure, 1950s–1960s refers to the differences in the average MSFD between the 1950s and the 1960s, and the meanings of other labels follow in the same way.
Remotesensing 14 05989 g006
Figure 7. Changes in the MSFD of SFG in Heilongjiang province based on a time series of anomalies (with respect to the mean of the 30-year baseline period, i.e., 1981–2010) from 1950 to 2021.
Remotesensing 14 05989 g007
Figure 8. Geographic distribution of the change rates in the MSFD of SFG in Heilongjiang province from 1950 to 2021. The oblique line indicates where the trend significantly changes at the 95% confidence level.
Remotesensing 14 05989 g008
Publisher’s Note: MDPI stays neutral with regard to jurisdictional claims in published maps and institutional affiliations.

