Abstract
This study provides a multi-disciplinary overview of the seismology and geodetic data with tectonics analysis in order to provide an evaluation of stress trajectories, and probabilistic fault rupture hazard assessment. Based on the different scenarios obtained from the comparison of several overviews and their interpretation, we investigated the kinematics and active tectonics of different structural zones. In this study, the magnitudes and directions of seismic and geodetic strain rates (SSR and GSR) were evaluated using reliable earthquake focal mechanisms and all available GPS data (1999–2015) in the structural subzones of northern Iran, where have experienced more than 14 strong instrumental earthquakes (Mw ≥ 6). In addition, a tectonic stress model was inferred from the Focal Mechanism Stress Inversion (FMSI). The new crustal stress map was proposed by the weighted average analysis of the SSR, GSR, and FMSI. N35.5° E and N104° E were estimated for the Alborz and Talesh mountains, respectively. The numerical analysis of stress regimes confirms the slip partitioning mechanism of oblique shortening on the sub-parallel thrusts and strike-slip faults in the area. Four main stress regime categories were defined, including thrust (49.37%), strike-slip (39.24%), thrust with a strike-slip component (2.53%), normal (1.27%), and unknown faulting (7.59%). Seismic and geodetic moment rates (SMR and GMR) and their comparison were also calculated in order to evaluate the function of these parameters in determining the seismicity arrangement. The ratio of the seismic/geodetic moment rates for the area is ~70.7%. This ratio for the Alborz, western Koppeh-Dagh, north part of Central Iran, South Caspian Basin, and Talesh is ~0.9, 0.3, 11.9, 0.3, and 57.3, respectively, which indicates the most elastic energy has been released in the Talesh and the north part of Central Iran. The comparison of geodetic moment rates in the subzones of the area indicates that geodetic deformation is high in the Central Alborz (networks 8, 9, 17) and western Koppeh-Dagh (networks 5, 13).
1. Introduction
Geomorphological evidence indicates that some continental areas have experienced intense tectonic activity. From a seismic, geodetic, and tectonics viewpoint, it is necessary to consider the possibility of fault rupture hazard assessment in some of these areas with a high human population. Northern Iran is one of these areas which is home to Iran’s capital (Tehran) and more than 23 million people. In this article, we will compare our interpretation of the multidisciplinary data from northern Iran to that from other parts of the world, including the United States [1], Basin and Range [2], the west and south of the Lut block [3], and the NE of the Lut block [4,5].
The destructive earthquakes in northern Iran from 1953 to 2021 have caused about ~168.5 km surface ruptures and ~54,810 human casualties. The fault rupture hazard assessment in this region is not accurate because of no detailed deformation style estimations (distinguishing seismic from aseismic deformation). It is important that the seismicity of a region and its spatial and temporal variations are considered snapshots of ongoing tectonic activities. Therefore, the identification of deformation patterns may provide complementary deductions for more realistic analysis and interpretation of observations.
Destructive earthquakes in the Talesh-Alborz range, the South Caspian Basin, and the northern part of Central Iran indicate strong tectonic activity in the northern Iran region [6,7,8,9,10,11,12,13]. The region with a V-shaped geometry includes the main faults with NW-SE and NE-SW directions in its western and eastern parts, respectively. In these parts, the overall deformation style has been specified by a system of double-verging folds, left-lateral strike-slip, and reverse faults sub-parallel to the range trend [14,15].
Several studies in Iran have presented a distribution of the geodetic deformation [16,17,18] and seismic deformations by the earthquake focal mechanism stress inversion [19,20,21]. Comparing the geodetic and seismic strain rates with tectonics interpretations has provided some information in order to assess aseismic and seismic deformation using uniform grids and non-uniform triangular mesh [16,22,23]. A few studies associated the deformation style of northern Iran [22]. This study addresses magnitudes and azimuths of the principal geodetic and seismic strain rates and discusses their results in terms of the crustal deformation processes and present-day stress map of northern Iran which is a good example of compression-shear ranges word-wide. In this study, all published GPS data (2006–2015), and earthquake slip vectors (1978–2020) are analyzed using more grids. The comparison and combination of these data sets give insights into the present active tectonic pattern [23]. In tectonically active regions where there are mismatches between the earthquake slip vectors and the GPS imply some form of strain partitioning and/or vertical axis rotations have taken place [23,24] and permit understanding of the processes involved. In this study, based on numerical analysis of stress regimes, the deformation style of northern Iran which can be expressed as “Homogenous” and “Partitioned” [25] are determined.
In addition to the ratio of the seismic/geodetic strain rates, this article calculated the ratio of the seismic/geodetic moment rates in order to contribute to the seismicity analysis of the region. Geodetic moment rates can be used to estimate the degree of locking on the fault surface, and its comparison with seismic moment rates provides inferences on the seismogenic potential of active faults in a region [26,27,28,29]. Moreover, this comparison can provide valuable information about earthquake moment production and deformation mechanisms [30].
2. Tectonic Setting and Seismicity
The Alborz-Talesh range of northern Iran (Figure 1a) was formed in a series of tectonic events related to the collision of Eurasia with Central Iran in the Triassic (Cimmerian Orogeny) and the Paleocene collision of Eurasia with Arabia (Laramide orogeny) [31,32,33]. Intra-continental deformation resulting from the convergence of the Eurasian-Arabian plates continues until the present time in an NNE-oriented with a slip rate of ~22 mm/yr [34]. The global positioning system (GPS) (Figure 1b) indicates 5 ± 2 mm/yr of NNE-oriented shortening in the Alborz and 4 ± 2 mm/yr of left-lateral movements [35]. The Kopeh Dagh range, as the eastern continuation of the Alborz-Talesh range, includes Tertiary and Mesozoic sediments, which have been folded during the Oligo-Miocene orogeny [36,37]. The Kopeh Dagh Fault system, with a slip rate of 9.1± 1.3 mm/yr, is characterized as the NW-boundary of the range [38].
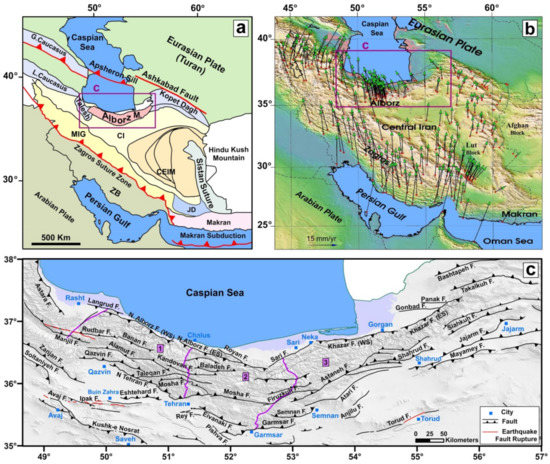
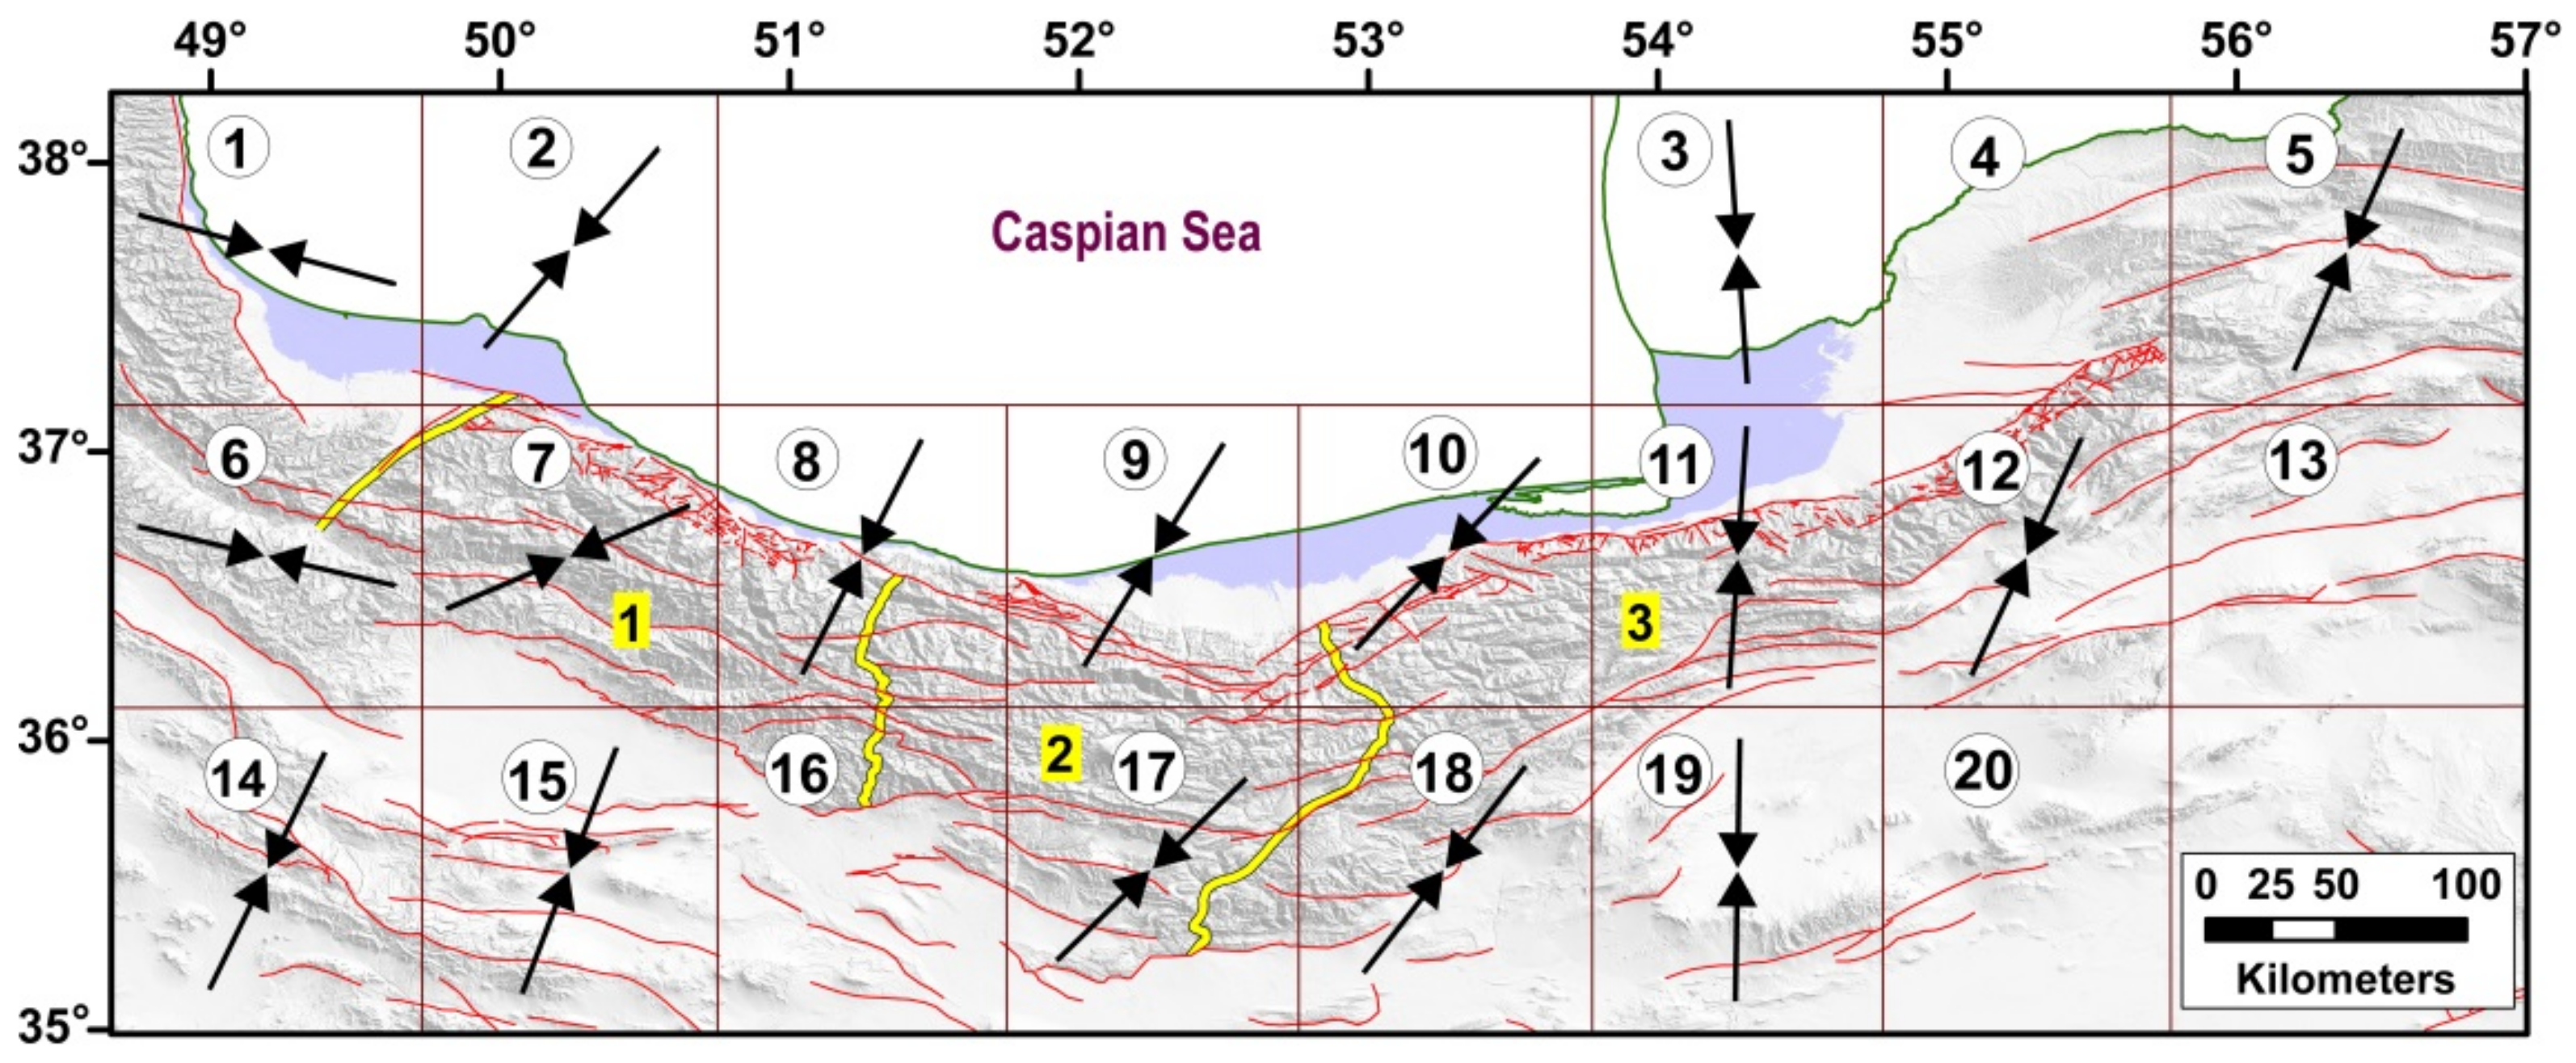
Figure 1.
(a) The regional structure of Arabia-Eurasia collision, and the location of the understudy subzones (Alborz, Talesh, north of Central Iran; purple box) (ZB = Zagros Belt, MIG = Zone of Intruded Granitoides and Metamorphic Rocks, CEIM = Microcontinent of Central-East Iran, CI = Central Iran, and JD = Jazmurian Depression). (b) The GPS velocity field relative to the Eurasian reference frame [18,53]. (c) Active faults in the study area (the faults after [50,54,55]). Numbers 1, 2, and 3 are location of the West Alborz, Central Alborz, and East Alborz, respectively which are separated by purple lines.
The south Caspian basin (SCB) in the west of Kopeh Dagh and the north/northeast of Alborz-Talesh range is noticeable for its thick sedimentary deposits [39]. This basin, as one of the deepest sedimentary basins in the world, contains ~20 km of sedimentary deposits [39]. The thick sediments of the SCB overlie a high-velocity basement that is thinner inside the basin, and thicker around its edges [40]. The basement beneath the basin unusually could be thinned continental crust or thick oceanic crust [41,42]. Earthquakes with depths down to 40 km occur beneath the Caucasus and Talesh mountains of the western margin of the SCB and down to 80 km in the north of the Apsheron Sill at its northern margin [42,43]. The deep earthquakes of the Apsheron sill are the results of subduction and underthrusting of the SCB basement, with the onset of subduction often assumed to correlate with the increase in sediment accumulation at 5.5 Ma [44].
The main active structures of the Alborz-Talesh range with a dominant component of thrust motion surrounded from the south (e.g., North Tehran, Garmsar, Pishva, and Jajarm N-dipping faults) to the north (e.g., Khazar, North Alborz, and Astara SSW-dipping faults), while the left-lateral strike-slip motion with the minor normal and thrust components concentrate within the range, (e.g., Firuzkuh, Mosha, Taleghan, and Rudbar) (Figure 1c). Some researchers have reported that right-lateral strike-slip motion must be available along the northern Talesh mountains [42,45,46] to adopt a part of the Arabia-Eurasia convergence. However, the focal mechanisms of earthquakes have not confirmed the right-lateral strike-slip mechanism.
In the Alborz range, after the Pliocene (3–5 Ma), oblique shortening is partitioned into pure thrust and pure strike-slip [42,47]. The motion of the SCB relative to both Eurasia (10.4 +/− 1.1 mm/yr in direction 333° +/− 5) and central Iran (4.8 +/− 0.8 mm/yr in direction 236° +/− 14) enhances westward underthrusting of the basin beneath the Talesh mountains of Iran and Azerbaijan [38,42,48]. The general wrenching of the belt was dependent on these motions, which in some parts have led to the normal component of some faults (e.g., Sari, Firouzkuh, and Astaneh faults) [49,50].
In the Alborz-Talesh range, in addition to the instrumental earthquakes which have been associated with financial and human losses (e.g., the 1935 Mw 6.8 Kusut, 1953 Mw 6.5 Troud, 1957 Mw 7 Sangchal, 1962 Mw 7.2 Buin-Zahra, 1980 Mw 6.6 Shirabad, 1990 Mw 7.3 Rudbar, 2002 Mw 6.5 Avaj, and 2004 Mw 6.4 Baladeh), a large number of strong historical earthquakes have also reported [7,10,51,52]. The historical sites in Tehran (the capital of Iran), which were situated in the immediate southern foothills of the Central Alborz, have been destroyed by historical earthquakes several times [7,52]. The North Tehran, Rey, and Eivanaki faults (Figure 1c) have been recognized as the sources of historical earthquakes in 1384 AD, 1177 (Ms∼7.2), 855 (Ms∼7.1), 743 (Ms∼7.2), and 312–280 BC (Ms∼7.6) [7,52]. So, Tehran with a population of more than 13 million people can again face a critical seismic hazard.
3. Data and Methodology
The lack of enough seismic or geodetic data in an active area has always been a problem for tectonic interpretation. Using both data sets can usually solve this problem. The patterns obtained as the results of focal mechanism stress inversion (FMSI) revealed many interesting “complications” of the stress field which were not applied along with geodetic and tectonic interpretations in the previous studies in northern Iran.
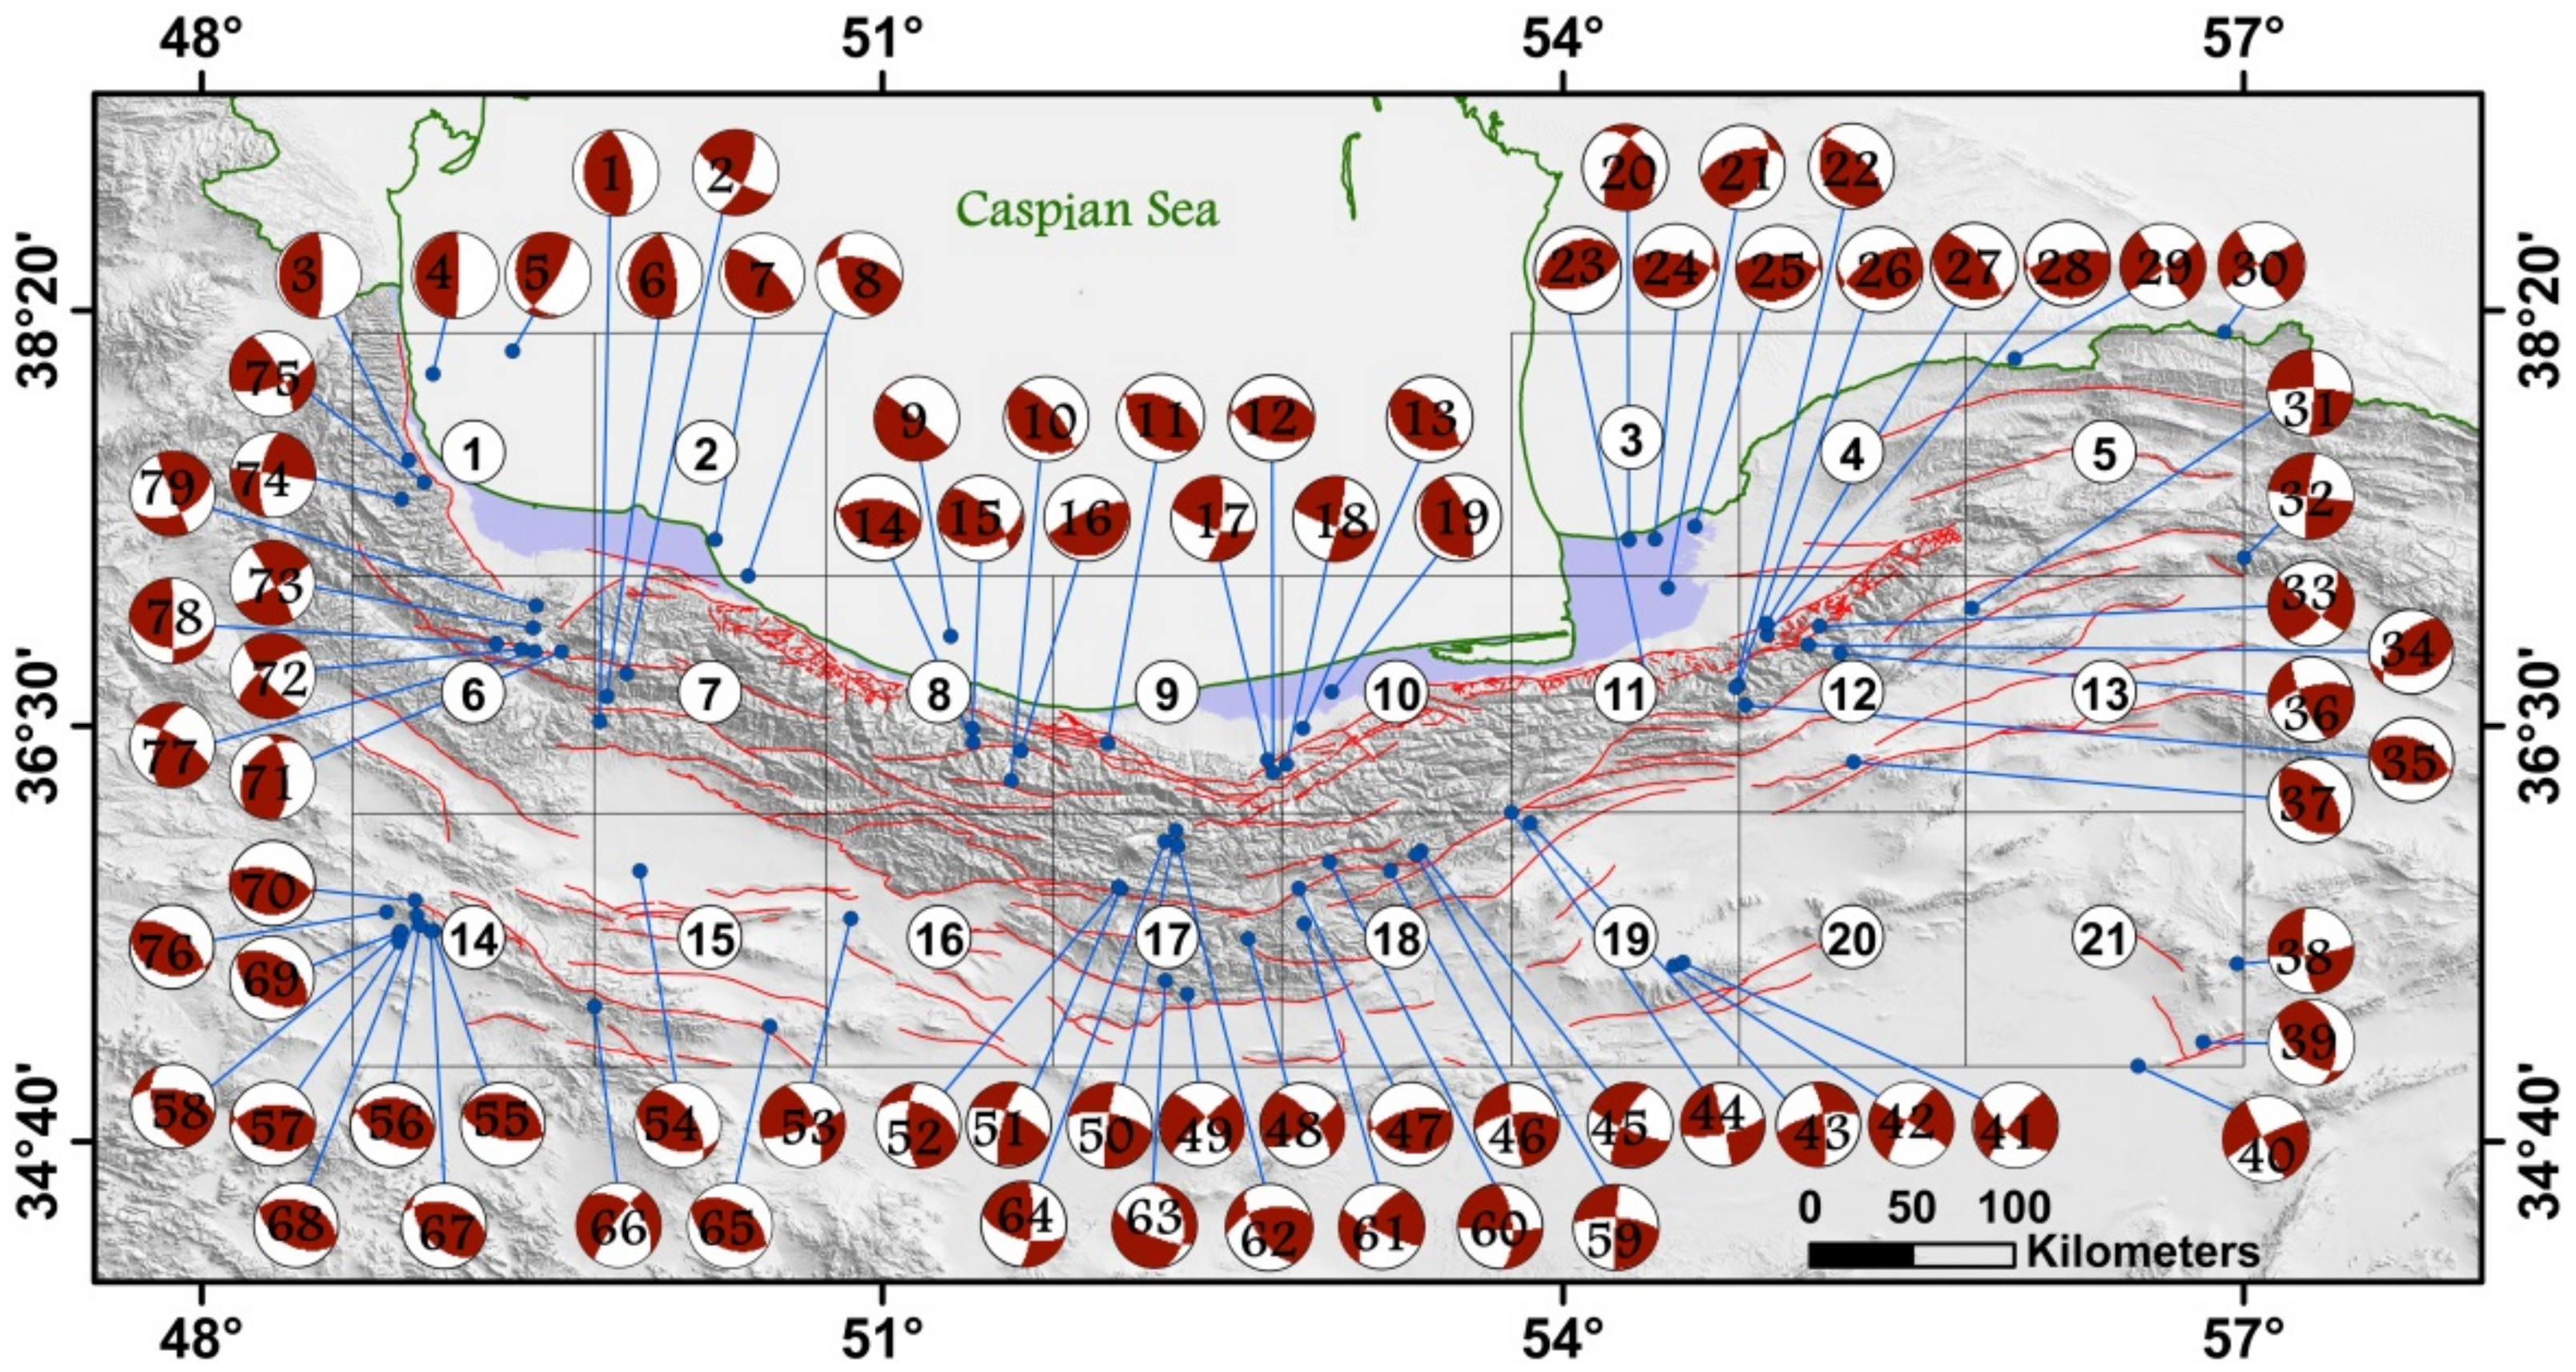
A scattered seismicity pattern influences northern Iran, mostly earthquakes with different magnitudes concentrated within the Alborz-Talesh range (Figure 2 and Table 1). In this study, 79 reliable focal mechanisms (4 ≤ Mw ≤ 7.4) from different catalogs, including GCMT (Global Centroid Moment Tensor); IIEES (International Institute of Earthquake Engineering and Seismology); IRSC (Iranian Seismological Center); ISC (Instrumental Earthquake Catalogue); ZUR_RMT (Zurich Moment Tensors); UPIES (moment tensors, University of Potsdam, Germany), were selected to perform the stress inversions (Figure 2 and Table 1). To do a more complete evaluation of the seismic deformation in the area, using all events, with and without focal mechanism, is also crucial, which can be reflected in local variations of strain and/or originated from the structures already present and reactivated such as weakness areas. For this purpose in this study, all earthquakes were used for calculating the seismic moment rates.
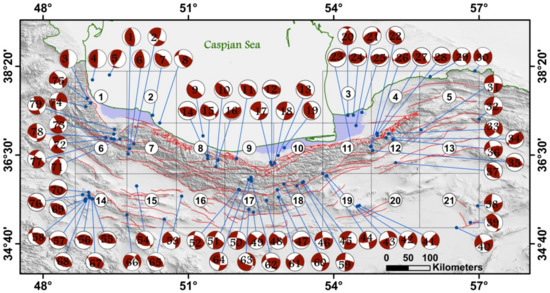
Figure 2.
The earthquake focal mechanisms in northern Iran during 1978–2020 from various catalogues. Labels on the focal mechanism refer to the first column of Table 1. Labels within grids show grid number.

Table 1.
Parameters of the earthquake source are applied to calculate the seismic strain rate (φ, δ, and λ symbols represent strike, dip, and rake angles of the preferred nodal planes, respectively). The first column label refers to the focal mechanisms in Figure 2. Lat. and Long. refer to EHB (Engdahl bulletin), IIEES (International Institute of Earthquake Engineering and Seismology), and IRSC (Iranian Seismological Center). Abbreviations of References label: GCMT (Global Centroid Moment Tensor); ISC (Instrumental Earthquake Catalogue); ZUR_RMT (Zurich Moment Tensors); UPIES (moment tensors, University of Potsdam, Germany).
Comparing the geodetic and seismic moment rates can provide important insights for identifying fault behavior in the tectonically active zone. The analysis of Ward [1] and Pancha et al. [2] for the seismic hazard has been obtained by using the moment rates. According to the hazard analysis objectives, the new information about the moment rates (GMR, SMR) is regarded in comparison with the seismic and geodetic strain rates (GSR, SSR).
More useful information can be obtained on the fault activities and their seismic risks when the moment rates are dependent on the amount of released and accumulated energy. ArcGIS software was used for mapping the seismic and geodetic moment rates. Several interpolation tools were suggested by ArcGIS Spatial Analyst to create surface grids from point data [56], some of which are the Kriging, Spline, and IDW interpolation methods. The Kriging interpolation, as a powerful statistical method [56], was used in this study, which within a specified radius fits a function to a specified number of all points or some points to evaluate the output amount for each location.
3.1. Seismic Strain Rate (SSR)
The seismic strain-rate tensor for each grid of networking performed for the study area is calculated by applying Kostrov’s formulation [57] and the Win-Tensor program [58]. The grids include at least 3 seismic events of the focal mechanism. Although some common earthquakes were used in two grids due to their boundary location, there were no considerable earthquake mechanisms in networks 2, 4, 13, 16, and 20 (Figure 2).
The stress inversion is conducted for deriving principal stress directions. Stress analysis is generally according to the maximum shear stress direction inside the dislocation plane [59]. Fault plane and slip parameters are used for establishing the stress ratio, R, and the stress tensor including the direction of three orthogonal principal stress axes (σ1, σ2, and σ3) (Equation (1)).
In this study, Rotational optimization [58] and Right Dihedron [60] stress inversion methods were used to determine stress tensor. The Right Dihedron method is used for defining the principal stress axes (P, B, and T) [60]. This method follows an iterative inversion procedure [58] by minimizing a misfit function of many different stress tensors through a grid search. In this method, both focal mechanism nodal planes are compared with a stress tensor, and the plane with the smaller value of the misfit is evaluated as the main fault plane. Thus, before the inversion, it is not necessary to determine which nodal plane is the fault plane. Eventually, the final inversion is included only in focal planes with the best fitting using a uniform stress field. The chosen fault planes are then inverted to determine the stress ratio and the principal stress axes [61]. The results are plotted on the projection of an equal-area to let us assess the overall quality of the outcome.
The Right Dihedron method allows for the first estimation of stress ratio R, directions of principal stress, and the first filtering of compatible with fault-slip data [62]. The chosen fault-slip data and initial tensor are applied as a beginning point in the repetitive grid search inversion procedures of the Rotational Optimization method. In addition, it is allowed to restrict the search area during the inversion. Therefore, the whole grid should not be searched [62], which minimizes α as the misfit angle by using the tested stress tensor and favors magnitudes of lower normal stress and higher shear stress on the plane to develop slip [62].
In the following, we have calculated the parameters resulting from focal mechanism stress inversion (FMSI) methods.
3.1.1. Stress Regimes Using FMSI
The parameter of the stress regime (R’) was used according to the determined stress ratio (Equation (1)) in order to demonstrate numerical values of the tectonic stress regime for the study area. The types of regimes considered in different studies [58,63] are as follows:
Normal faulting regimes R′ = R
Regarding a normal tectonic regime, the obtained R′ is in the range of 0–1, while the values in the ranges of 1–2, and 2–3 are for strike-slip and thrust faulting tectonic regimes, respectively. Word Stress Map (WSM) standard was used for calculating stress regimes. TS, SS, NF, TF, NS, and UF symbols are thrust faulting with a strike-slip component, strike-slip faulting, normal faulting, thrust faulting, and normal faulting with a strike-slip component, as well as the unknown regimes, respectively. For each earthquake, these tectonic regimes are obtained based on the Zoback method [64] (Table 2).
Table 2.
The calculated parameters from the stress tensor of the earthquake focal mechanisms.
In this study, the statistical calculation related to the stress regimes indicates 49.37% thrust faulting, 39.24% strike-slip faulting, 2.53% thrust faulting with a strike-slip component, 1.27% normal faulting, and 7.59% unknown faulting (Figure 3). This calculation confirms the slip partitioning mechanism of oblique shortening, which is consistent with previous studies on the active tectonics in the area [42,49,50,65,66,67].
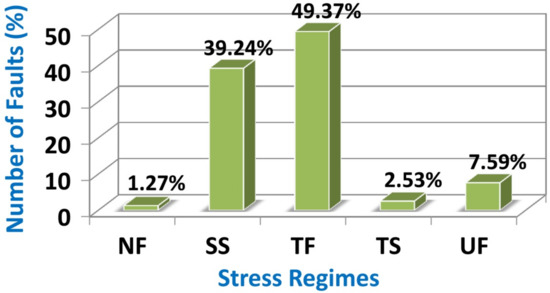
Figure 3.
The statistical evaluation of tectonic stress regimes estimated from the focal mechanisms for the study area (NF, SS, TF, TS, and UF symbols are normal, strike-slip, thrust, thrust with a strike-slip, and unknown faulting, respectively).
3.1.2. Stress Directions Using FMSI
The moment stress axes T, P, and B indicate the maximum extension, maximum shortening, and unbiased axis, respectively (Table 2). In this study, to determine these axes, focal mechanism solutions are applied in the Right Dihedron method [58].
The horizontal stress directions are usually exhibited in accordance with two perpendicular horizontal axes, including Shmin and Shmax, as the minimum and maximum horizontal stress. Lund–Townend and Zoback methods are used for calculating the horizontal axes [68,69]. In this study, the Lund–Townend method, which is utilized in the Win-Tensor program, was applied (Table 2).
Based on the results of stress inversion in this study, no significant difference was obtained between the Right Dihedron and the Rotational Optimization methods. Anyway, the results may be more accurate in the Rotational Optimization method due to adjusting errors (Table 3).
Table 3.
The obtained parameters from the Rotational Optimization method for the networks (nt: the number of used data for the networks, σ1, σ2, σ3: the axes position of the main principal stress, R: the stress value, R′: the stress regime index, and Shmin and Shmax are the azimuths of minimum (compressional) and maximum (extensional) axes for the seismic strain rate, respectively).
The calculation of seismic strain rate is here based on the Kostrov formula [57], already intensively used for example in the Ibero-Maghrebian region [70], Greece [71], Umbria-Marche Apennines [72], central and east Asia [73], and Mediterranean domain [74]. In the Kostrov formula, μ indicates the modulus of shear, V shows the volume of deforming seismic, N is considered as the total number of events in the time period of t, Mnij refers to the element of seismic moment tensor for the events, and Mij is known as the total seismic tensors.
It is noteworthy that μ and V have no effect on directions related to the principal strain axes and only are effective on the strain values [75]. The Aid and Richard’s approach [76] was used for calculating the elements of seismic strain tensor according to focal mechanism inversions (Equation (6)):
ϕ refers to the fault azimuth, and δ and θ are considered as the dip and rake parameters, respectively.
Table 4 and Figure 4 represent the magnitude and direction of the principal axes of seismic strain rates in the study area. The magnitude of seismic strain rates indicates the variable rate of deformation in different grids as well as the dominant state of the deformational regime in terms of the extension or compression.
Table 4.
The azimuths and values of the compressional and extensional axes of SSR in the area.
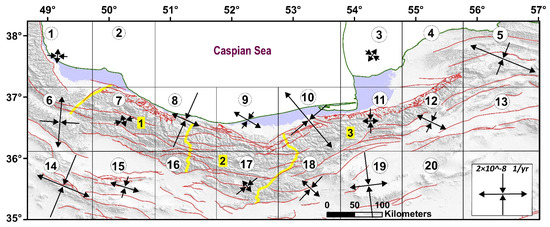
Figure 4.
The direction and the magnitude of principal axes of SSR in the area. Labels within grids show grid number. Numbers 1, 2, and 3 are location of the West Alborz, Central Alborz, and East Alborz, respectively which are separated by yellow lines.
3.2. Geodetic Strain Rate (GSR)
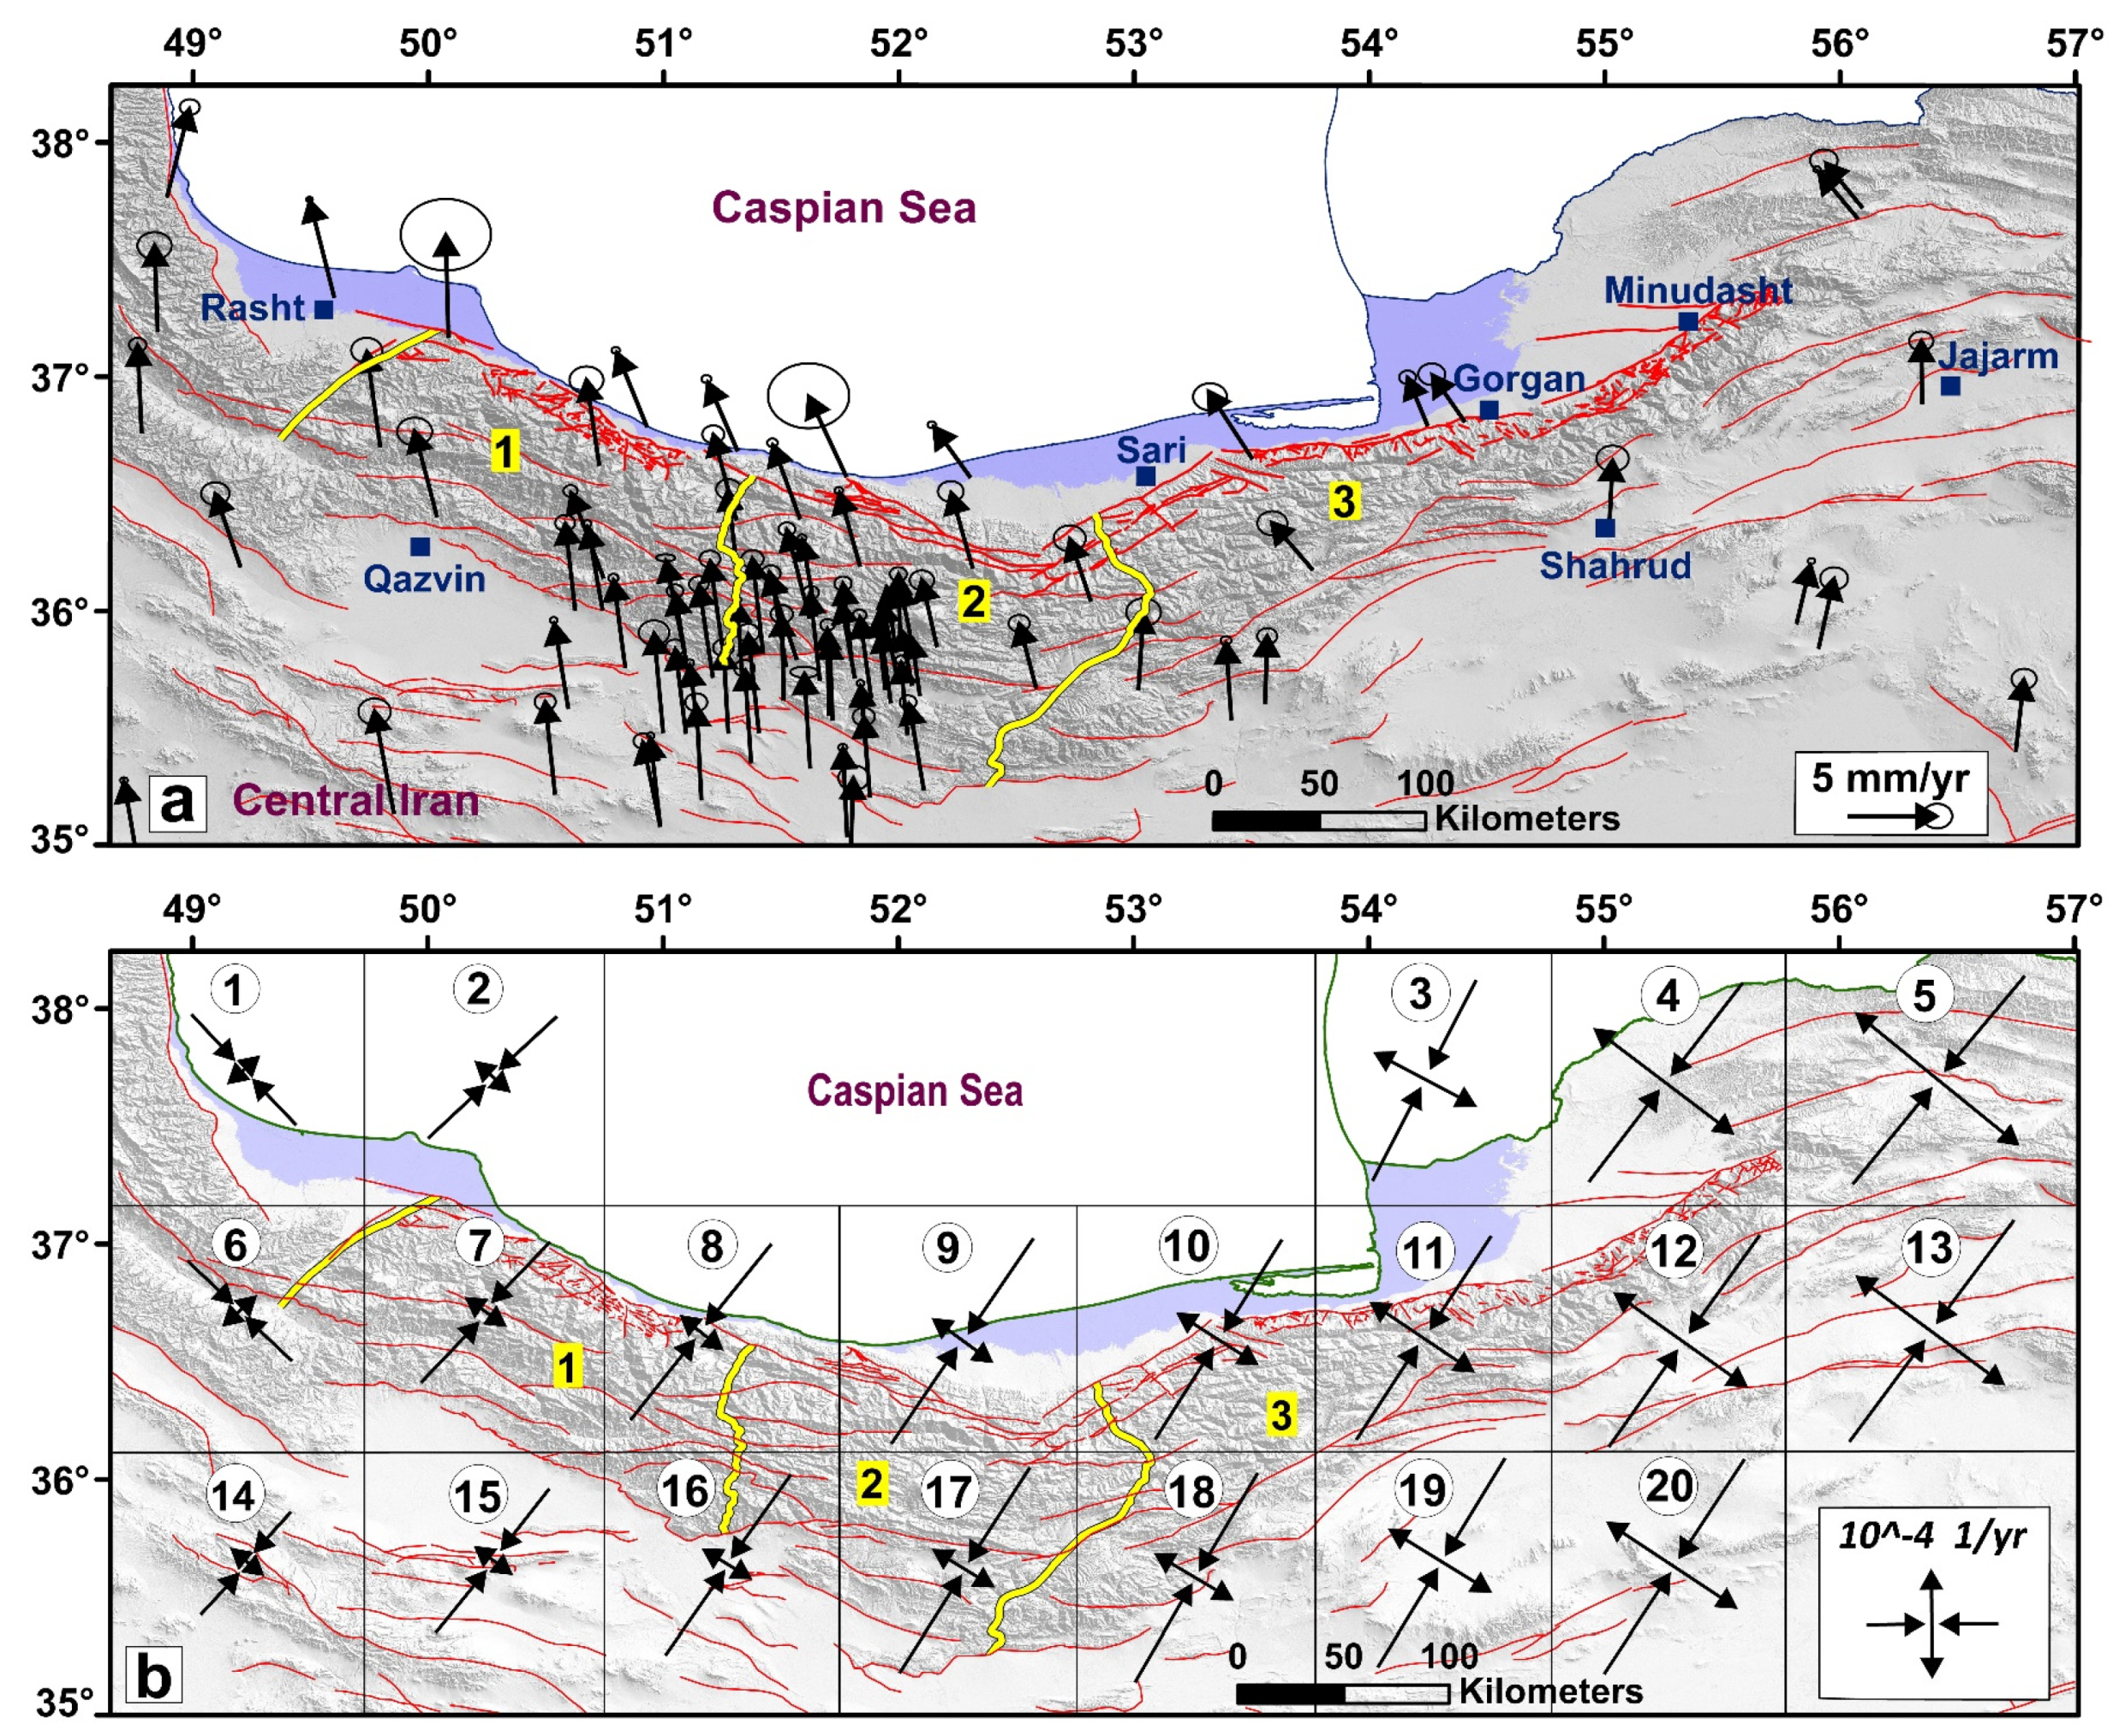
To evaluate the GSR, we combined the reported GPS velocities [18,53] in order to provide the densest velocity field for the area. The GPS velocities [16,29] were collected during 1999–2015 and those are relative to the Eurasian reference frame (Figure 1b and Figure 5a; Table 5).

Figure 5.
(a) The GPS velocity field with their error ellipses in the area which are relative to the Eurasian reference frame. (b) The principal axes of the geodetic strain rate obtained from the GPS velocities. Labels within grids show grid number. Numbers 1, 2, and 3 are location of the West Alborz, Central Alborz, and East Alborz, respectively which are separated by yellow lines.
Table 5.
The GPS velocities used in this paper which are relative to Eurasian reference frame [18,53].
The geodetic strain rate tensor (GSRT) is estimated using three methods are used to [77]: inversion of baseline variations [78], networked (gridded) using either a spherical wavelet-based multiscale approach [79], or interpolation of bi-cubic spline [80], and the triangle [81]. In the gridded method, a functional relation is defined between displacement and position with basic functions to measure an interpolated velocity grid in order to calculate GSRT. Thus, the quality of the outputs is strongly dependent on the quality of the velocity field, which is particularly true for the triangle method. Therefore, an error in the velocity at only one station creates a large error in the GSRT calculated for the triangles adjacent to this station [16]. So, in this study, in order to perform calculations with the least error, the Grid_strain MATLABTM toolbox [82] was used to measure the horizontal geodetic strain rates with the grid pattern from GPS horizontal velocities. The obtained deformation field pattern is a set of the principal components of the strain calculated on a regular grid whose limits and steps can be selected by the user (see [82,83] for both a general description of the implemented method and examples of its application to GPS-based regional-scale analysis of a strain field). The computations in the Grid_strain toolbox are performed using a modified least square method (MLS) [84]. Since our stations are not uniformly distributed, the MLS method works well and produces a more meaningful solution [82].
The strain rates at the center of each cell of a ~100×~100 km square grid (network) were estimated by including 98 Eurasia-fixed GPS velocities (Figure 5a,b). In the MLS approach, the velocity of the close stations contributes more to the solutions, and a more reasonable strain rate field is evaluated for such a heterogeneous tectonic area where different deformation mechanisms and kinematics can be observed. Table 6 and Figure 5 indicate the geodetic strain rate within each grid of the study area.
Table 6.
The min and max horizontal extension values with their azimuths (geodetic strain rates).
3.3. Present Crustal Stress Map of Northern Iran
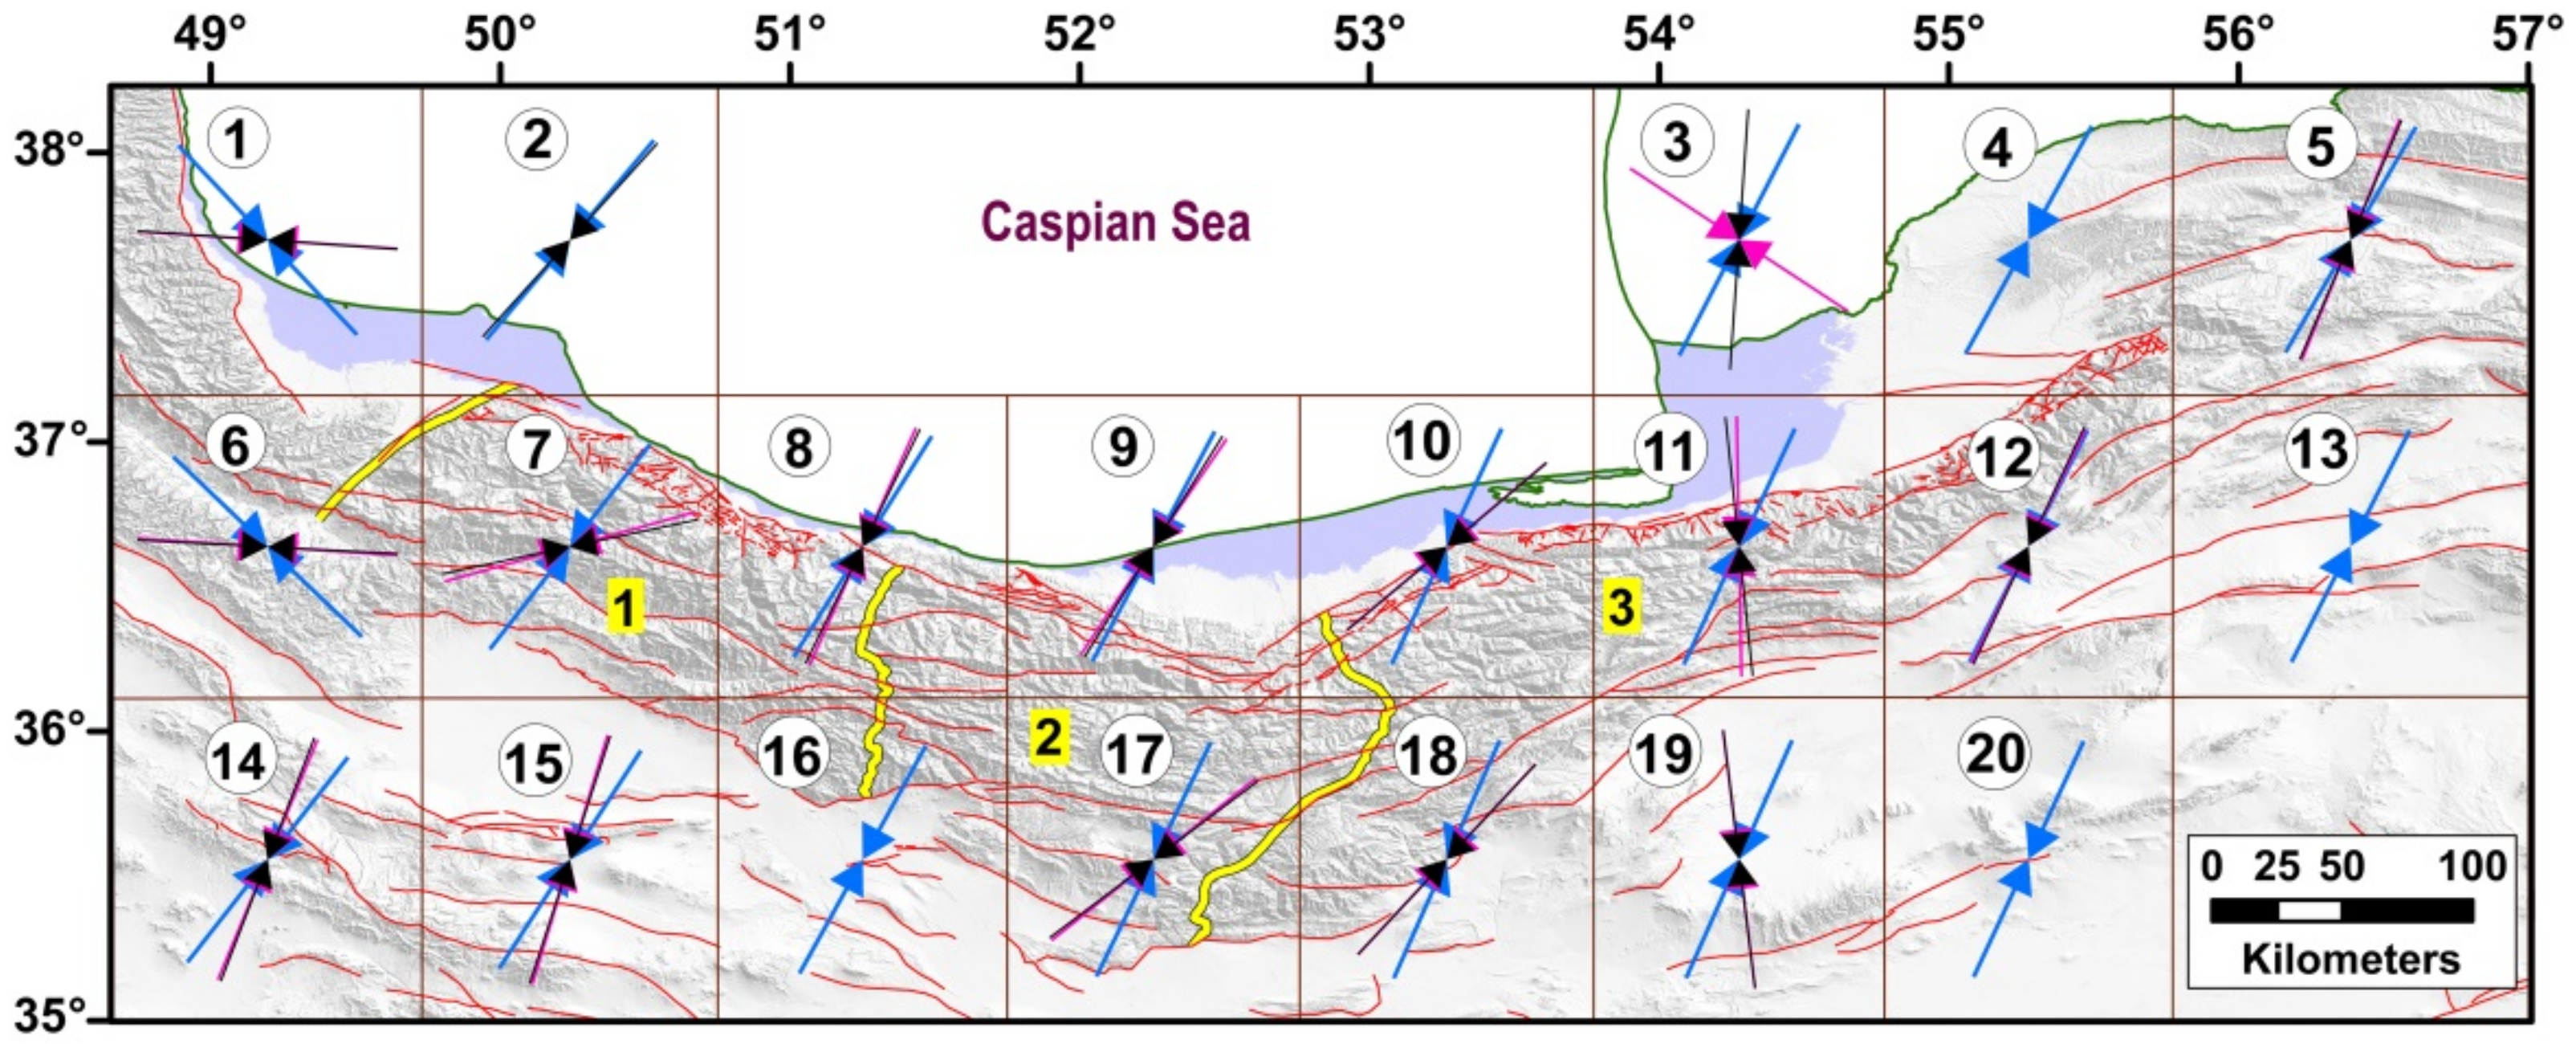
In this section, the output of SSR, FMSI, and GSR were compared to evaluate the relationship between the stress and strain directions. Figure 6 shows the direction of the compressional axes of the three methods for each network.
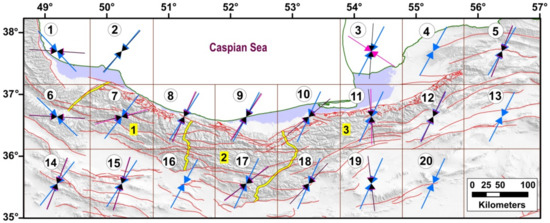
Figure 6.
The compression directions of the principal axes resulted from the geodetic strain rates (blue), stress inversion (black), and seismic strain rates (purple). Labels within grids show grid number. Numbers 1, 2, and 3 are location of the West Alborz, Central Alborz, and East Alborz, respectively which are separated by yellow lines.
Like in the study of Zarifi et al. [22], the Pearson’s correlation coefficient of SSR, FMSI, and GSR were estimated, and accordingly, a new crustal stress field was suggested. The coefficient is determined as the covariance of two variables divided by the product of their standard deviations [85], as shown in Equation (7).
Furthermore, it indicates a measurement for the linear correlation among the two data collections in which the range (p) varies from −1 to +1.
In general, an acceptable correlation was observed between the strain and stress tensors. The results indicated a correlation between FMSI and GSR (p = +0.9), SSR and GSR (p = +0.8), and FMSI and SSR (p = +0.9). In addition, along with the absolute deviation value of each method of analyzing strain/stress tensor, the mean direction of the compression stress (and strain rate) was calculated in each network. Equations (8)–(10) are used for measuring a new stress field in the area.
where | | is the absolute value and “Dev. from mean FMSI” indicates the deviation of the FMSI result in each network from the mean value of the three methods by representing the direction of stress in that network. The maximum weight belongs to the method with the minimum deviation from the mean value and vice versa. Table 7 shows the outputs related to the statistical method, and Figure 7 displays the direction of the weighted average compression stress in the study area.
Table 7.
The weighted average of the maximum horizontal compression axes obtained from the FMSI, SSR, and GSR for the study area.

Figure 7.
The extracted direction of the weighted average of the maximum horizontal compression stress from GSR, SSR, and FMSI. Labels within grids show grid number. Numbers 1, 2, and 3 are location of the West Alborz, Central Alborz, and East Alborz, respectively which are separated by yellow lines.
3.4. Geodetic Moment Rate (GMR)
The geodetic moment, which can be measured using the GPS velocity vector, indicates the cumulative and released energy which occurs in the study area. In this study, the GMR was measured in each grid based on the procedure suggested by Kostrov [57], as shown in Equation (11) where, μ, A, and Hs indicate rigidity, grid area, and seismogenic thickness, respectively. The geodetic monitoring can be quantified into potential seismic activities within the grids by the known values of A, T, μ (3 × 10¹⁰ Pa), and Hs (~25 km) even if the activity is dependent on the hidden faults or the faults with a too slow slip that usually these are not applied for evaluating using seismological techniques.
The outputs (Table 8 and Figure 8) indicate that in some networks, such as 5, 8, 9, and 17, the geodetic moment rates are higher than in others. There are some faults with a history of high seismic activity, such as the eastern segment of the North Alborz, Royan (within the networks 8, 9), Mosha, Garmsar, Eivanaki (within the network 17), and Bashtapeh, Takalkuh (within the network 5) faults.
Table 8.
The maximum principal amount (eigenvalues) of the strain rate tensor, and geodetic moment rates in the area.
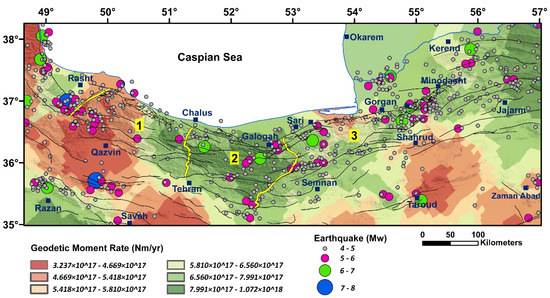
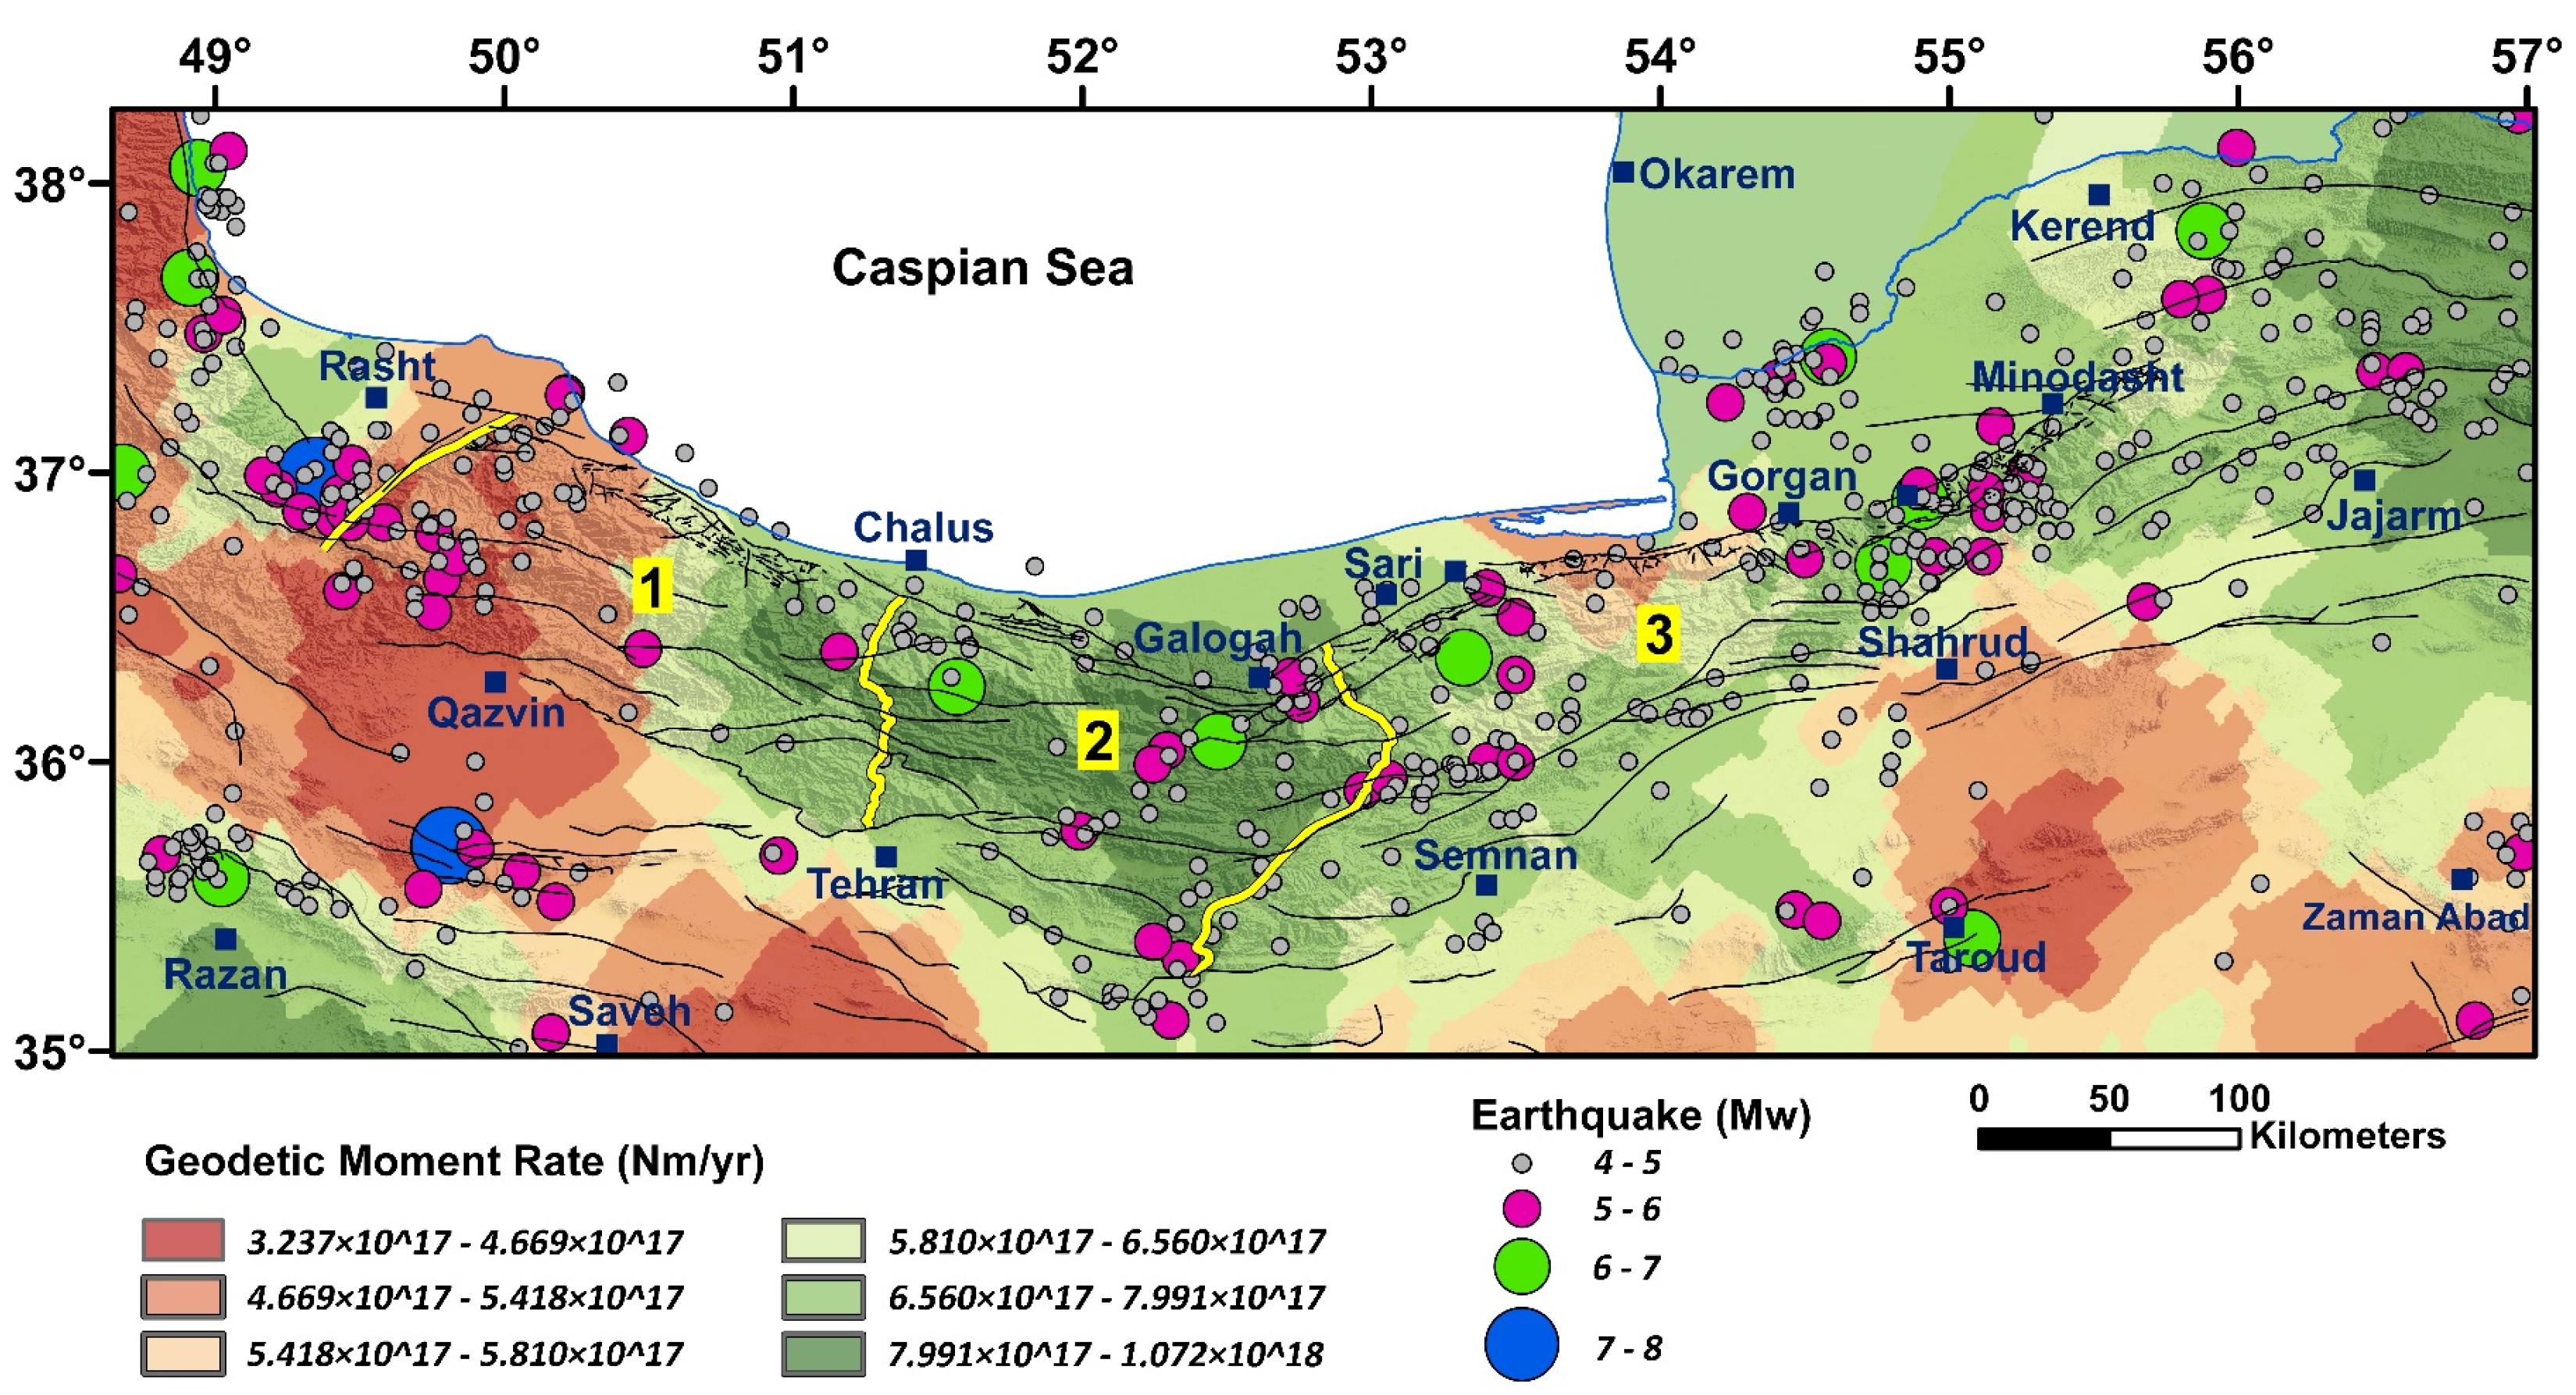
Figure 8.
Zoning map of GMR with the distribution of the earthquakes (1900–2020). Numbers 1, 2, and 3 are location of the West Alborz, Central Alborz, and East Alborz, respectively which are separated by yellow lines.
3.5. Seismic Moment Rate (SMR)
SMR only measures the deformation accommodated by faulting [1]. To estimate it in different parts of the area, all of the earthquakes that occurred from 1900 to 2020 are displayed in Figure 9. Based on the magnitude of earthquakes, the amount of seismic moment for each earthquake is calculated (Equation (12)).
where m indicates magnitude, M0 shows the seismic moment, and C and d are considered constant parameters related to the law suggested by Hanks and Kanamori [86].
LogM0 = Cm + d
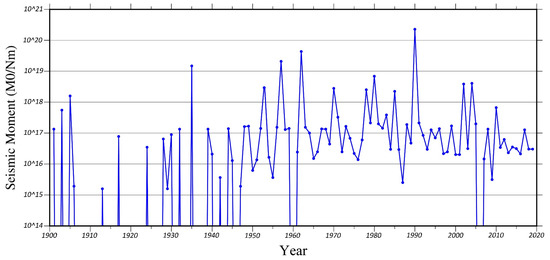
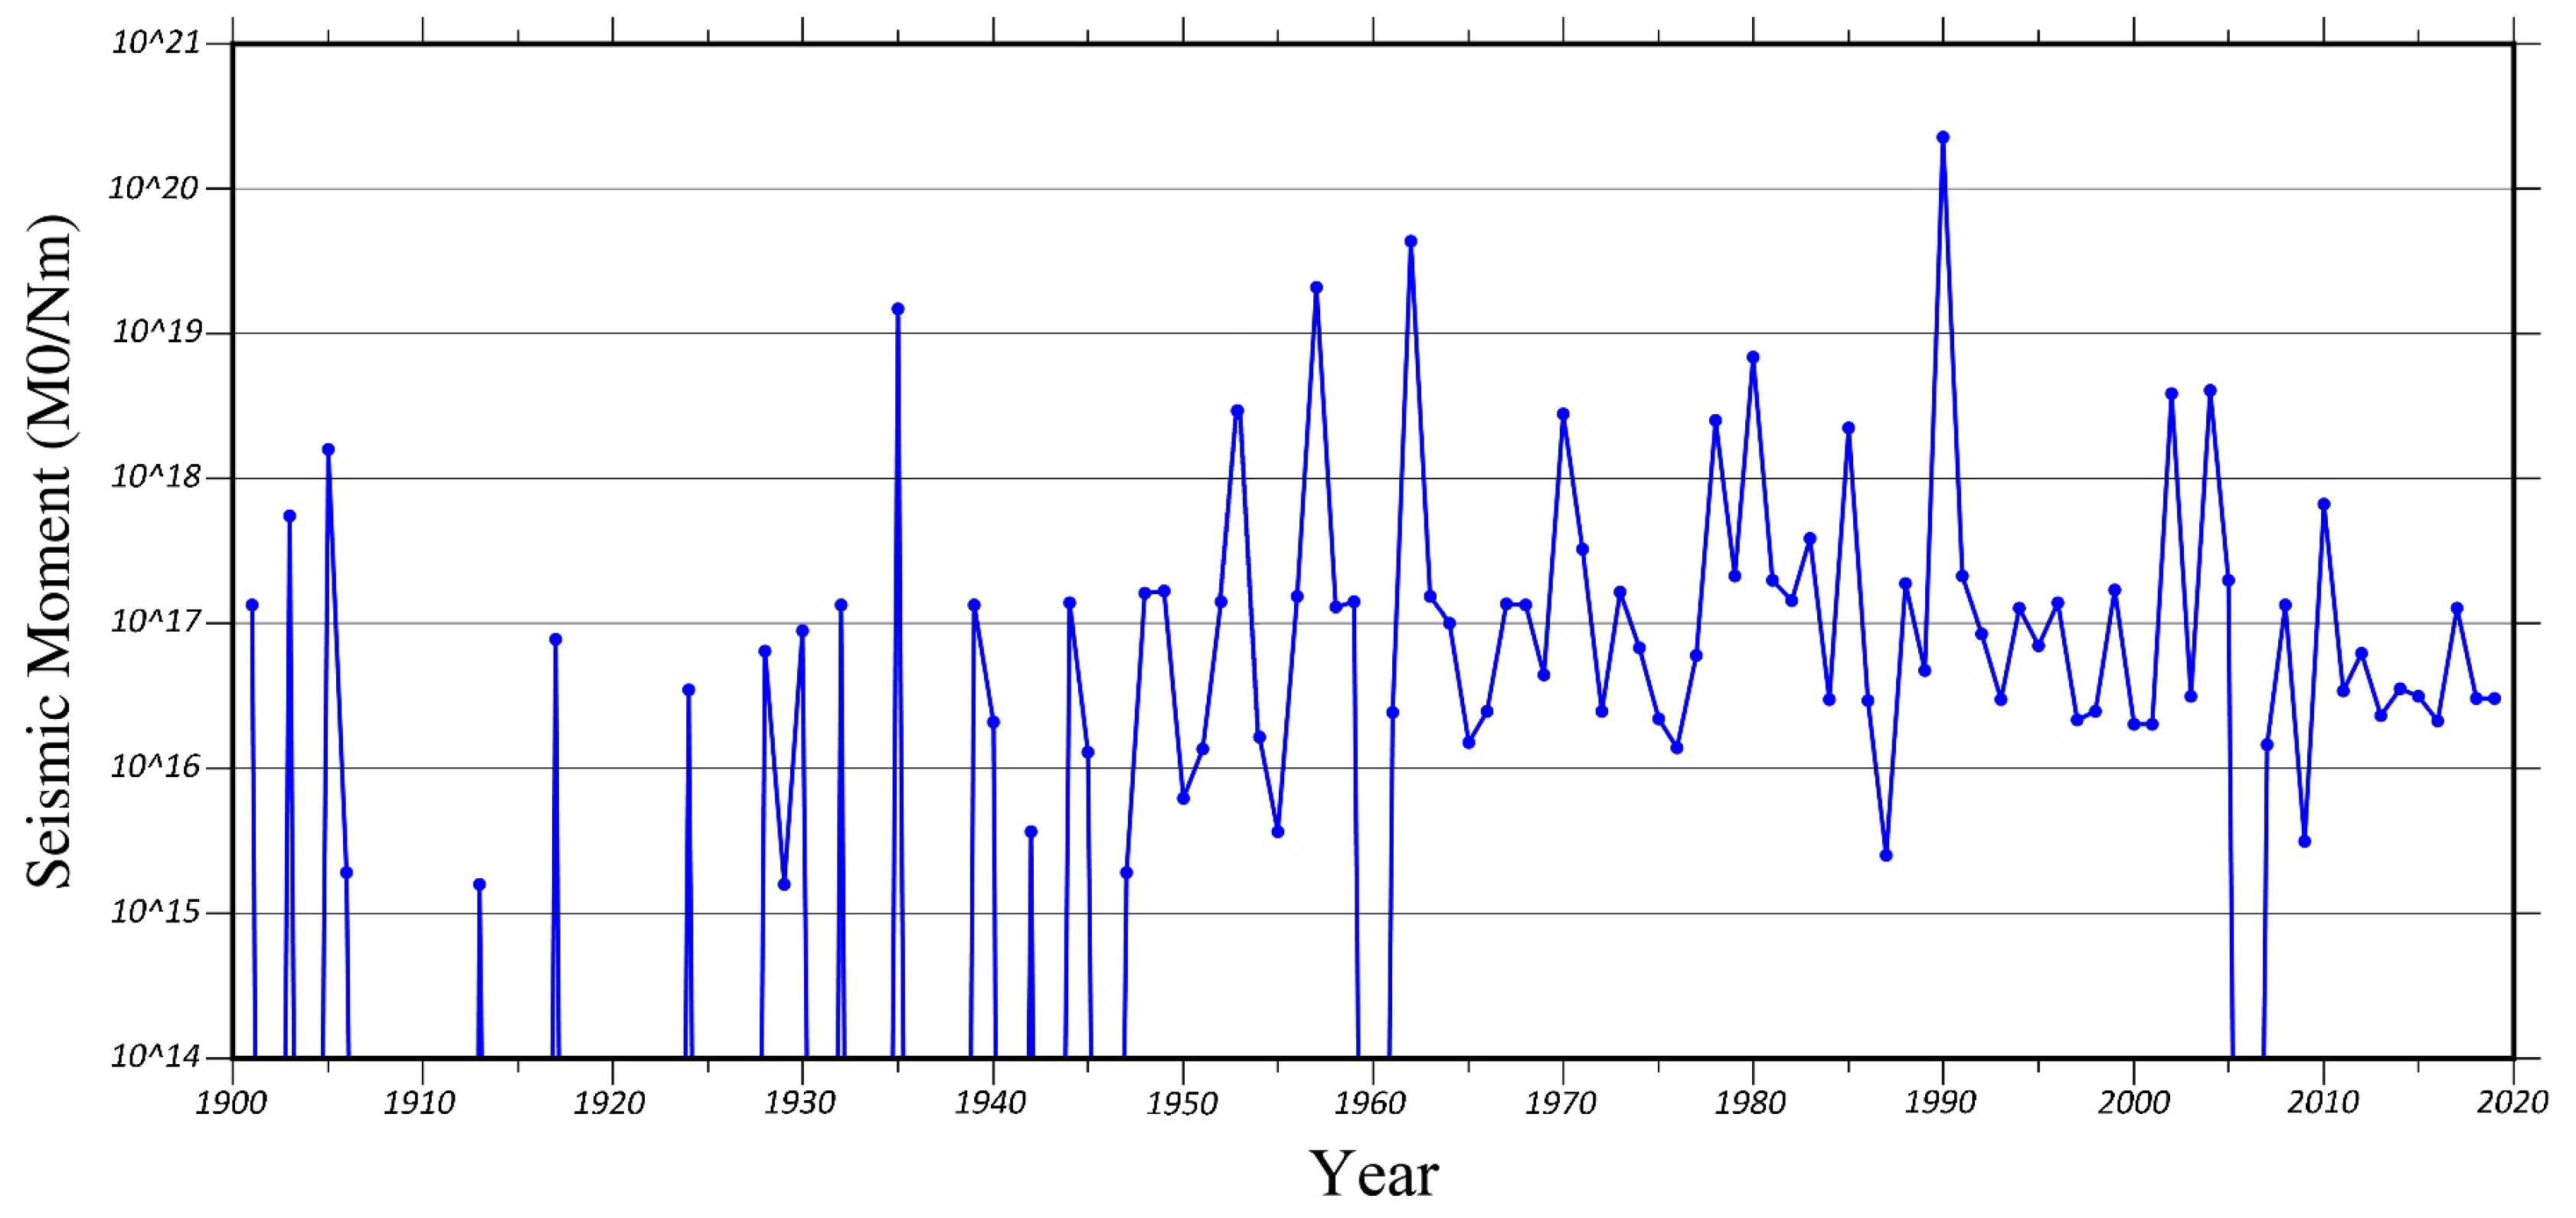
Figure 9.
The seismic moment variation for the area during 1900–2020.
According to the seismic moment calculations (during the catalog years), the maximum amount of released energy occurred in 1990, 1962, 1957, 1935, 1980, 2004, 2002, and 1953 when the main earthquakes happened (Figure 9 and Table 9).
Table 9.
The destructive earthquakes in the study area with high seismic moment (1900–2020).
Using the average seismic moment of earthquakes [1] and the cumulative seismic moment diagram [2] methods, the seismic moment was converted to the seismic moment rate (Table 10).
Table 10.
The seismic moment rate for each networks in the area.
The maximum seismic moment rates are obtained in the networks 6, 15, 17, 20, 10, 1, and 14 (Table 10 and Figure 10), where the main faults are Manjil, Rudbar, Ipak, Eshtehard, Kushk-e-Nosrat, Garmsar, Eivanaki, Mosha, Torud, Khazar, Sari, and Astara faults. Some faults, such as Rudbar, Ipak, Torud, and Sari faults, had a significant contribution to the resulting seismic moment rate.
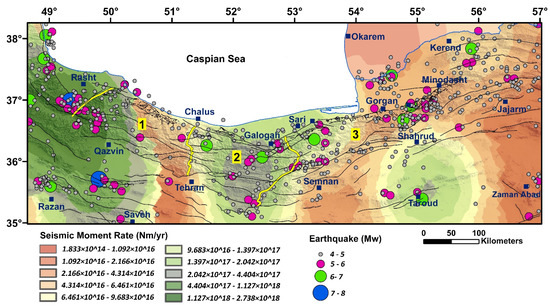
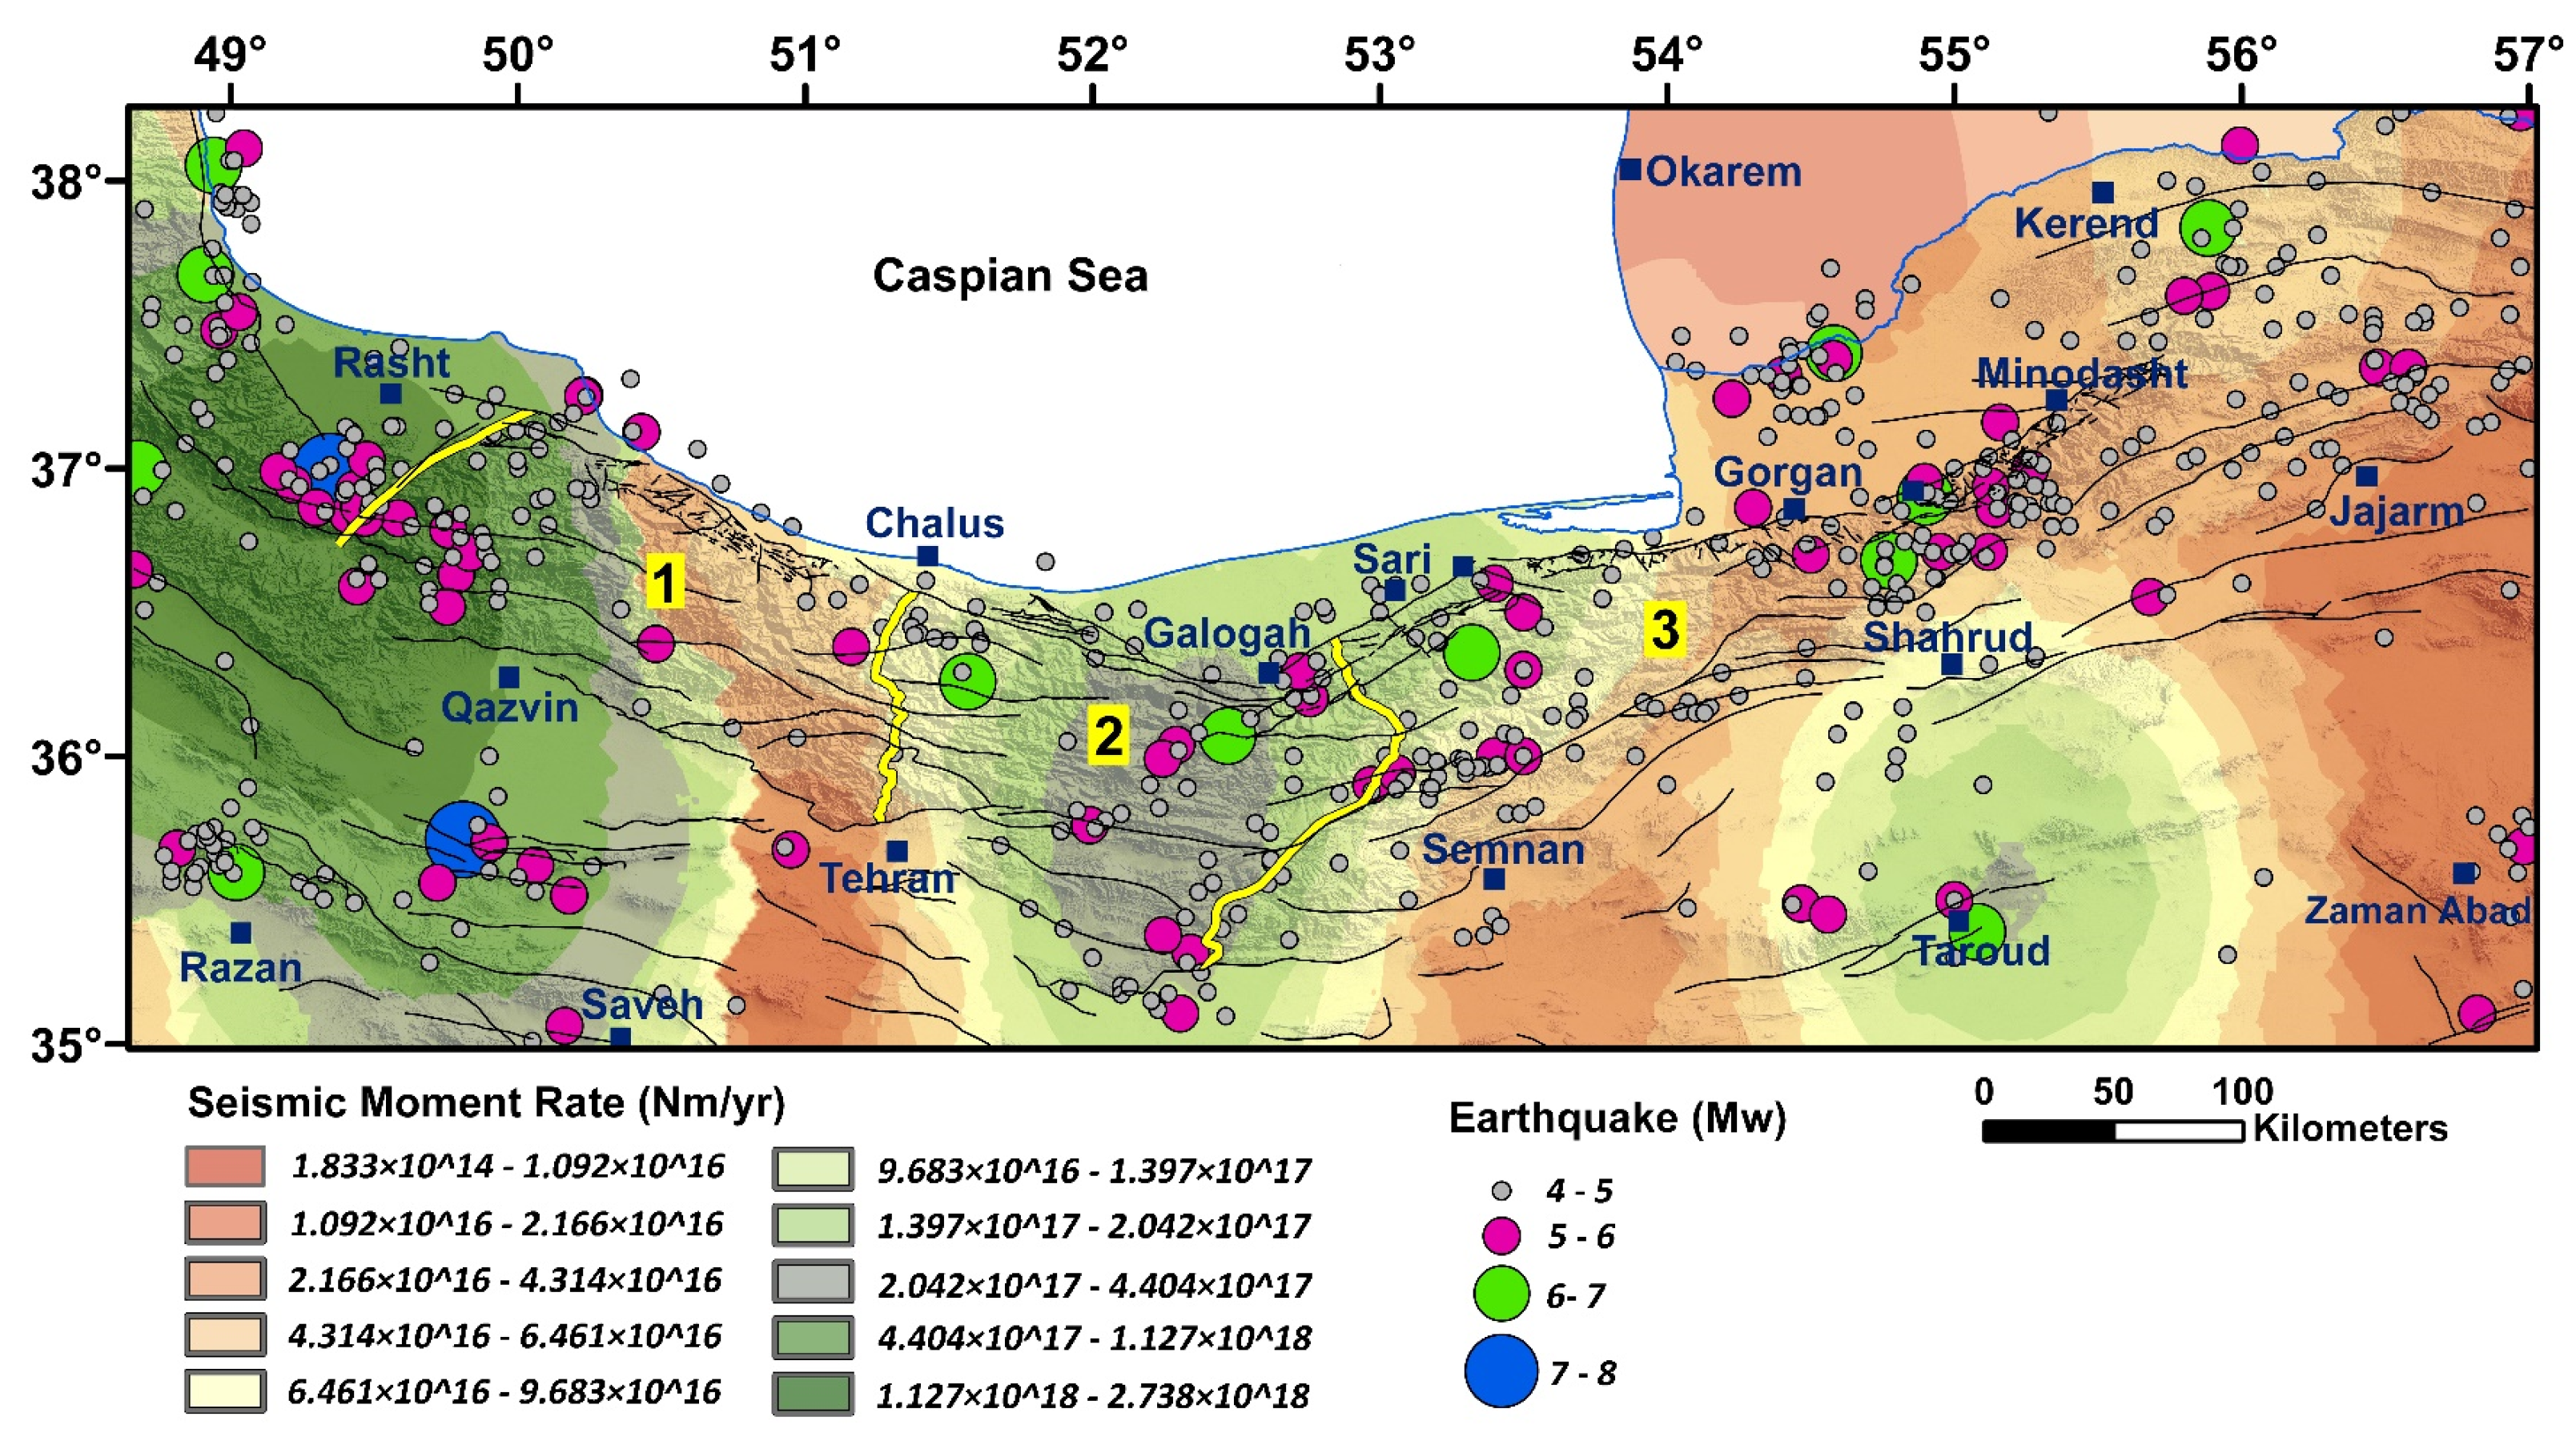
Figure 10.
Zoning map of the SMR with the earthquake distribution (1900–2020). Numbers 1, 2, and 3 are location of the West Alborz, Central Alborz, and East Alborz, respectively which are separated by yellow lines.
4. Results and Discussion
The crustal faults (Figure 1c) with different slip rates in Alborz and its surrounding area have a crucial role in evaluating different seismicity patterns. In the eastern part of the Alborz range, the left lateral strike-slip movement varies from ~2 in the south to ~5 mm/yr in the north of the range, while in the western part, mainly a left-lateral component changes by ~2 mm/yr in the north to ∼1 in the south of the range [87]. Therefore, determining the stress and strain fields resulting from the movement of the earth’s crust in an area can help to better understand the active tectonics [19,88,89]. In this study, a stress map is suggested for northern Iran using a combination of the obtained results from GSR, SSR, and FMSI according to a multi-disciplinary method (Figure 7). The compressional stress directions are approximately WNW-SSE in the Talesh Mountains, and NNE-SSW in the Alborz and its surrounding area (Figure 7), which is in line with the results of previous studies [22]. Directions are the result of the progressive collision of the South Caspian Basin with Central Iran (in the late Miocene; ~6–2 Ma) and the clockwise rotation of the South Caspian Basin [49,90].
The stress directions in most networks are oblique to the faults strike except for NW-SE trending faults in the central Alborz (e.g., the faults within networks 8 and 9) with the reverse dominant components, and E-W trending faults in the east Alborz (e.g., the faults within networks 11 and 19) where are associated with folding [50,91] (Figure 7). Therefore, the current stress in the area usually leads to the shearing and reversing of the rock units along the active faults.
Strike-slip faults with an acute angle related to the stress direction include segments with en-echelon arrays which show the sense of shearing and lateral motion on the fault planes [92,93,94,95,96,97]. In the area, most fault systems (even those with present reverse mechanisms) indicate clear en-echelon segmentation. Some of them, such as the southern margin fault of the eastern Alborz, or Shahrud fault system [98], include the Garmsar, Semnan, Atari, Shahrud, and Jajarm fault segments (Figure 1c), each of which is known as an isolated faults zone.
In northern Iran, a transition zone occurs between Talesh and the western Alborz at ~49°40′E. The differential motions of these subzones, which are accompanied by the strike-slip and reverse faults, are well-established based on the obtained stress directions (Figure 7). Regarding the seismic and geodetic strain rate, higher seismic deformation zones (e.g., the Talesh-Alborz transition zone) are correlated well with the distribution of large earthquakes (e.g., the 1990 Mw 7.3 Rudbar). For seismic hazard assessment, the study area was divided into 21 networks, and the geodetic, seismic strain, and moment rates were calculated to investigate the seismicity pattern.
4.1. Analysis of Geodetic and Seismic Strain Rates
The geodetic strain rate in networks 13, 5, 12, and 20 are larger than the others (Figure 5b). These networks are located in the western Koppeh-Dagh, and eastern Alborz mountains where the main faults are the Jajarm, Siahkuh, Takalkuh, Bashtapeh, Shahrud, and east segment of the Khazar fault (see the name of faults in Figure 1c). The geodetic strain rate is also large in network 9 where the main faults are Royan, the east segment of north Alborz faults [50], and where the 2004 Mw 6.4 Baladeh earthquake occurred [12].
About 168.5 km of surface ruptures have been formed by the four destructive earthquakes, including the 1953 Mw 6.5 Troud, the 1962 Mw 7.2 Buin-Zahra, the 1990 Mw 7.3 Rudbar (label 77 on Figure 2), and the 2002 Mw 6.5 Changureh (label 55 on Figure 2), with more than 53,391 deaths [13,99]. The earthquake of 12 December1953 (Mw 6.5) occurred along the Torud fault within network 20, where the geodetic strain rate is high (Figure 5b). Networks 6, 14, and 15 in the Talesh and NW of Central Iran, which indicate low geodetic strain rates (Figure 2) are included in the other three earthquakes (Buin-Zahra, Rudbar, and Changureh earthquakes). The Rudbar, Avaj (or Kushk-e Nosrat), and Ipak as destructive earthquake faults with Astara and Eshtehard faults are located in these subzones.
Other destructive earthquakes that have not reported their surface rupture are (Table 9): the 1903 Mw 5.9 Anzali (within network 1), the 1978 Mw 6.4 Siahbil (within network 1; label 3 on Figure 2), and the 1980 Mw 6.6 Shirabad (within network 1; label 4 on Figure 2) due to the activity of the Astara fault; the 2004 Mw 6.2 AqQala (within network 11; label 21 on Figure 2) due to the activity of the Gonbad or Khazar faults; the 1905 Mw 6.2 Darram (within network 6), the 1957 Mw 7 Band-e pay (within network 6), and the 2004 Mw 6.4 Baladeh (within network 8; label 10 on Figure 2) due to the activity of the north Alborz and Royan faults; the 1935 Mw 6.8 Kusut (within network 10), the 1985 Mw 6.1 Nomal (Between networks 11 and 12; label 26 on Figure 2), and the 1990 Mw 6 Firuzkouh (within network 18; label 60 on Figure 2) due to the activity of the Astaneh or Firouzkuh faults; the 2010 Mw 5.9 Kuh Zar (within network 19; label 42 on Figure 2) due to the activity of the Torud fault.
The seismic strain rate for each network was estimated using instrumental earthquakes in order to explain most of the seismic strain (Figure 4). In networks 14 and 19 (the northern parts of central Iran), the networks 8 and 10 (the northern parts of the Alborz), the network 5 (the western part of the Koppeh-Dagh), and network 6 (the southern part of the Talesh), where the distribution of the earthquakes indicates shearing and compression, patterns of deformations for small and large earthquakes are observed. Relatively large extensional components of seismic strain rate are evident in these networks (networks 10, 5, 6, 14, and 19), where there are the main left-lateral strike-slip faults such as Sari, Khazar, Rudbar, Avaj (or Kushk-e Nosrat), and Torud faults.
In the study area, the directions of the seismic strain rate are generally coaxial with the geodetic strain rate (Figure 6). This uniformity between the directions of seismic and geodetic strain rates highlights the use of discontinuous or continuous assumptions for calculating the style and direction of the strain rates. In fact, the seismic strain corresponds to discontinuous deformation within a network due to the displacements along faults, while the geodetic strain is computed from continuous deformation. In networks 14, 8, 19, 6, 10, and 5 despite the consistency in directions of the principal stress and strain axes, there is geodetically and seismically a significant relative inconsistency between the magnitudes of the compressional strain rates (Figure 4 and Figure 5b). This discrepancy can be related to the occurrence of large earthquakes, as well as the recurrence interval of earthquakes in this area.
4.2. Analysis of Geodetic and Seismic Moment Rates
In the subzones of northern Iran, the values of the seismic moment rates in the networks 6, 15, 17, 20, and 10, and the geodetic moment rates in the networks 8, 9, 17, 5, and 13 are relatively significant (Figure 11).
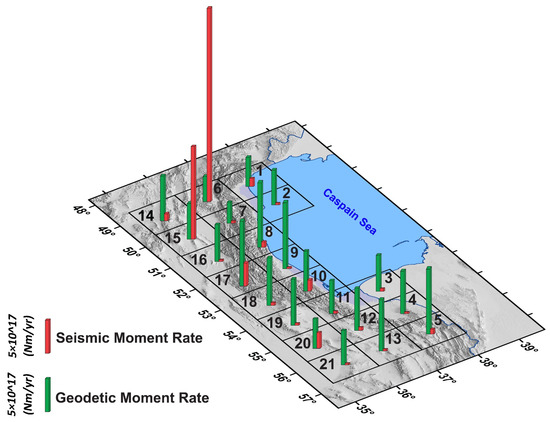
Figure 11.
The seismic and geodetic moment rates in the area.
The ratio of seismic to geodetic moment rate denotes low values for networks 16, 4, 13, 9, and 19, and high values for networks 6, 15, 20, 1, and 17. Network 6 is characterized by higher released energy, which can be interpreted as due to the active faults interaction in the Talesh-Alborz transfer zone. The high released energy in networks 15 and 20 is related to the Ipak and Torud faults in the northern part of the Central Iran subzone. The Astara fault in the Talesh subzone is considered the reason for releasing energy in network 1. Mosha, Eivanaki, and Garmsar faults were significant faults in occurring of the earthquake in the network 17.
The west segment of the Mosha, North Tehran, Taleghan, Gonbad, Siahkuh, Jajarm, Royan, the east segment of the north Alborz, and Atari faults (in Figure 1c) shows a low seismic moment rate (Figure 10). It is noteworthy that geomorphological evidence indicates the high activity for those [65,98,100,101,102,103]. Therefore, they should be considered from a seismic point of view. The seismic/geodetic moment rate is a significant indicator in analyzing to release of more energy [2]. This ratio in the study area with ~0.23 × 10⁶ km2 area is 70.7 which can be compared with the results of the previous studies in the United States [1], Basin and Range [2], the west and south Lut block [3]., and the east and north Lut block [4] (Table 11). The seismic/geodetic moment rate in the area is higher than that of the Basin and Range and the west-south Lut Block where morphotectonic studies emphasize its activity [104,105,106]. The obtained results indicate the Alborz (networks 7, 8, 9, 17, 10, 18, 11, and 12), western Koppeh-Dagh (networks 5, 13), northern part of Central Iran (networks 14, 15, 16, 19, 20, and 21), South Caspian Sea (networks 2, 3, and 4), and Talesh (networks 1 and 6) had, respectively, a portion of 0.9, 0.3, 11.9, 0.3, and 57.3 of the seismic/geodetic moment rates, which shows much of the elastic energy has been released in the Talesh and northern part of Central Iran.
Table 11.
The ratio of the seismic/geodetic moment rates in the different areas [1,2,3].
5. Conclusions
Using the analysis of the GSR, SSR, and FMSI, the N35.5° E and N104° E are the proposed directions of the maximum compressive stress in the Alborz and Talesh, respectively.
The results of FMSI indicate the slip partitioning mechanism of oblique shortening on the subparallel thrusts and strike-slip faults in the area where stress regimes include thrust (49.37%), strike-slip (39.24%), thrust with a strike-slip component (2.53%), normal (1.27%), and unknown (7.59%) faulting.
High GSR belongs to the networks 13, 5, 12, and 20, where the main faults are the Jajarm, Siahkuh, Takalkuh, Bashtapeh, Shahrud, and the eastern segment of the Khazar fault. The GSR is also high in network 9, where the main faults are Royan and the east segment of the north Alborz faults.
Large extensional components of the SSR are rather evident in networks 10, 5, 6, 14, and 19, where there are the main left-lateral strike-slip faults such as Sari, Khazar, Rudbar, Kushk-e Nosrat, and Torud faults.
The significant relative inconsistency geodetically and seismically between the magnitudes of the compressional strain rates in networks 14, 8, 19, 6, 10, and 5 can be attributed to the occurrence of large earthquakes, as well as the recurrence interval of earthquakes in this area.
High SMR are belong to the faults in the Talesh-Alborz transfer zone (such as Rudbar faults), north of central Iran (such as Ipak and Torud faults), Talesh subzone (such as Astara fault), Alborz mountain (such as the eastern segment of the Mosha, Eivanaki, and Garmsar faults), while low SMR is related to the west segment of the Mosha, North Tehran, Taleghan, Gonbad, Siahkuh, Jajarm, Royan, east segment of the north Alborz, and Atari faults within Alborz mountains.
Regarding the seismic and geodetic strain and moment rates, seismic hazard is significant along the western and eastern segments of the north Alborz, Royan, Mosha, and Eivanaki faults.
Author Contributions
Conceptualization, A.R. and R.D.; methodology, A.R.; software, A.R.; validation, R.D.; formal analysis, A.R.; investigation, A.R. and R.D.; resources, R.D.; data curation, A.R. and R.D.; writing—original draft preparation, R.D. and A.R.; writing—review and editing, R.D. and A.R. All authors have read and agreed to the published version of the manuscript.
Funding
This research received no external funding.
Institutional Review Board Statement
Not applicable.
Informed Consent Statement
Not applicable.
Data Availability Statement
Data is contained within the article.
Acknowledgments
This work was supported by International Institute of Earthquake Engineering and Seismology (IIEES). We are grateful to the editor and three anonymous reviewers for their constructive and detailed reviews.
Conflicts of Interest
The authors declare no conflict of interest.
References
- Ward, S.N. On the consistency of earthquake moment rates, geological fault data, and space geodetic strain: The United States. Geophys. J. Int. 1998, 134, 172–186. [Google Scholar] [CrossRef] [Green Version]
- Pancha, A.; Anderson, J.G.; Kreemer, C. Comparison of seismic and geodetic scalar moment rates across the Basin and Range Province. Bull. Seismol. Soc. Am. 2006, 96, 11–32. [Google Scholar] [CrossRef] [Green Version]
- Rashidi, A.; Khatib, M.M.; Nilfouroushan, F.; Derakhshani, R.; Mousavi, S.M.; Kianimehr, H.; Djamour, Y. Strain rate and stress fields in the West and South Lut block, Iran: Insights from the inversion of focal mechanism and geodetic data. Tectonophysics 2019, 766, 94–114. [Google Scholar] [CrossRef]
- Rashidi, A.; Kianimehr, H.; Yamini-Fard, F.; Tatar, M.; Zafarani, H. Present Stress Map and Deformation Distribution in the NE Lut Block, Eastern Iran: Insights from Seismic and Geodetic Strain and Moment Rates. Pure Appl. Geophys. 2022, 1–31. [Google Scholar] [CrossRef]
- Rashidi, A.; Khatib, M.M.; Derakhshani, R. Structural Characteristics and Formation Mechanism of the Earth Fissures as a Geohazard in Birjand, Iran. Appl. Sci. 2022, 12, 4144. [Google Scholar] [CrossRef]
- Ambraseys, N.; Moinfar, A. The sessmicity of Iran: The Torud earthquake of 12th february 1953. Ann. Geophys. 1977, 30, 186–200. [Google Scholar] [CrossRef]
- Ambraseys, N.; Melville, C. A History of Persian Earthquakes; Cambridge University Press: London, UK, 1982. [Google Scholar]
- Berberian, M.; Qorashi, M.; Jackson, J.; Priestley, K.; Wallace, T. The Rudbar-Tarom earthquake of 20 June 1990 in NW Persia: Preliminary field and seismological observations, and its tectonic significance. Bull. Seismol. Soc. Am. 1992, 82, 1726–1755. [Google Scholar] [CrossRef]
- Priestley, K.; Baker, C.; Jackson, J. Implications of earthquake focal mechanism data for the active tectonics of the South Caspian Basin and surrounding regions. Geophys. J. Int. 1994, 118, 111–141. [Google Scholar] [CrossRef]
- Berberian, M.; Yeats, R.S. Contribution of archaeological data to studies of earthquake history in the Iranian Plateau. J. Struct. Geol. 2001, 23, 563–584. [Google Scholar] [CrossRef]
- Walker, R.T.; Bergman, E.; Jackson, J.; Ghorashi, M.; Talebian, M. The 2002 June 22 Changureh (Avaj) earthquake in Qazvin province, northwest Iran: Epicentral relocation, source parameters, surface deformation and geomorphology. Geophys. J. Int. 2005, 160, 707–720. [Google Scholar] [CrossRef] [Green Version]
- Tatar, M.; Jackson, J.; Hatzfeld, D.; Bergman, E. The 2004 May 28 Baladeh earthquake (M w 6.2) in the Alborz, Iran: Overthrusting the South Caspian Basin margin, partitioning of oblique convergence and the seismic hazard of Tehran. Geophys. J. Int. 2007, 170, 249–261. [Google Scholar] [CrossRef] [Green Version]
- Berberian, M. Eaethquakes and coseismic active faulting on the Iranian plateau. Dev. Earth Surf. Processes 2014, 17, 616. [Google Scholar]
- Stöcklin, J. Possible ancient continental margins in Iran. In The Geology of Continental Margins; Burk, C.A., Drake, C.L., Eds.; Springer: Berlin/Heidelberg, Germany, 1974. [Google Scholar] [CrossRef]
- Berberian, M. The southern Caspian: A compressional depression floored by a trapped, modified oceanic crust. Can. J. Earth Sci. 1983, 20, 163–183. [Google Scholar] [CrossRef]
- Masson, F.; Chéry, J.; Hatzfeld, D.; Martinod, J.; Vernant, P.; Tavakoli, F.; Ghafory-Ashtiani, M. Seismic versus aseismic deformation in Iran inferred from earthquakes and geodetic data. Geophys. J. Int. 2005, 160, 217–226. [Google Scholar] [CrossRef]
- Bayer, R.; Chery, J.; Tatar, M.; Vernant, P.; Abbassi, M.; Masson, F.; Nilforoushan, F.; Doerflinger, E.; Regard, V.; Bellier, O. Active deformation in Zagros—Makran transition zone inferred from GPS measurements. Geophys. J. Int. 2006, 165, 373–381. [Google Scholar] [CrossRef] [Green Version]
- Khorrami, F.; Vernant, P.; Masson, F.; Nilfouroushan, F.; Mousavi, Z.; Nankali, H.; Saadat, S.A.; Walpersdorf, A.; Hosseini, S.; Tavakoli, P. An up-to-date crustal deformation map of Iran using integrated campaign-mode and permanent GPS velocities. Geophys. J. Int. 2019, 217, 832–843. [Google Scholar] [CrossRef]
- Gillard, D.; Wyss, M. Comparison of strain and stress tensor orientation: Application to Iran and southern California. J. Geophys. Res. Solid Earth 1995, 100, 22197–22213. [Google Scholar] [CrossRef]
- Lacombe, O.; Mouthereau, F.; Kargar, S.; Meyer, B. Late Cenozoic and modern stress fields in the western Fars (Iran): Implications for the tectonic and kinematic evolution of central Zagros. Tectonics 2006, 25, TC1003. [Google Scholar] [CrossRef] [Green Version]
- Nemati, M.; Hajati, F.J.; Rashidi, A.; Hassanzadeh, R. Seismology of the 2017 Hojedk earthquakes (MN 6.0–6.1), Kerman province, SE Iran. Tectonophysics 2020, 780, 228398. [Google Scholar] [CrossRef]
- Zarifi, Z.; Nilfouroushan, F.; Raeesi, M. Crustal stress map of Iran: Insight from seismic and geodetic computations. Pure Appl. Geophys. 2014, 171, 1219–1236. [Google Scholar] [CrossRef]
- Edey, A.; Allen, M.; Nilfouroushan, F. Kinematic variation within the Fars Arc, eastern Zagros, and the development of fold-and-thrust belt curvature. Tectonics 2020, 39, e2019TC005941. [Google Scholar] [CrossRef]
- Bayasgalan, A.; Jackson, J.; McKenzie, D. Lithosphere rheology and active tectonics in Mongolia: Relations between earthquake source parameters, gravity and GPS measurements. Geophys. J. Int. 2005, 163, 1151–1179. [Google Scholar] [CrossRef] [Green Version]
- Fossen, H.; Tikoff, B.; Teyssier, C. Strain modeling of transpressional and transtensional deformation. Nor. Geol. Tidsskr. 1994, 74, 134–145. [Google Scholar]
- Serpelloni, E.; Vannucci, G.; Anderlini, L.; Bennett, R. Kinematics, seismotectonics and seismic potential of the eastern sector of the European Alps from GPS and seismic deformation data. Tectonophysics 2016, 688, 157–181. [Google Scholar] [CrossRef]
- Lindsey, E.O.; Almeida, R.; Mallick, R.; Hubbard, J.; Bradley, K.; Tsang, L.L.; Liu, Y.; Burgmann, R.; Hill, E.M. Structural control on downdip locking extent of the Himalayan megathrust. J. Geophys. Res. Solid Earth 2018, 123, 5265–5278. [Google Scholar] [CrossRef]
- Sharma, Y.; Pasari, S.; Ching, K.-E.; Dikshit, O.; Kato, T.; Malik, J.N.; Chang, C.-P.; Yen, J.-Y. Spatial distribution of earthquake potential along the Himalayan arc. Tectonophysics 2020, 791, 228556. [Google Scholar] [CrossRef]
- Derakhshani, R.; Eslami, S. A new viewpoint for seismotectonic zoning. Am. J. Environ. Sci. 2011, 7, 212–218. [Google Scholar] [CrossRef]
- Chousianitis, K.; Ganas, A.; Evangelidis, C.P. Strain and rotation rate patterns of mainland Greece from continuous GPS data and comparison between seismic and geodetic moment release. J. Geophys. Res. Solid Earth 2015, 120, 3909–3931. [Google Scholar] [CrossRef]
- Berberian, M.; King, G. Towards a paleogeography and tectonic evolution of Iran. Can. J. Earth Sci. 1981, 18, 210–265. [Google Scholar] [CrossRef]
- Alavi, M. Tectonostratigraphic synthesis and structural style of the Alborz mountain system in northern Iran. J. Geodyn. 1996, 21, 1–33. [Google Scholar] [CrossRef]
- Ghanbarian, M.A.; Yassaghi, A.; Derakhshani, R. Detecting a sinistral transpressional deformation belt in the Zagros. Geosciences 2021, 11, 226. [Google Scholar] [CrossRef]
- Vernant, P.; Nilforoushan, F.; Hatzfeld, D.; Abbassi, M.; Vigny, C.; Masson, F.; Nankali, H.; Martinod, J.; Ashtiani, A.; Bayer, R. Present-day crustal deformation and plate kinematics in the Middle East constrained by GPS measurements in Iran and northern Oman. Geophys. J. Int. 2004, 157, 381–398. [Google Scholar] [CrossRef] [Green Version]
- Vernant, P.; Nilforoushan, F.; Chery, J.; Bayer, R.; Djamour, Y.; Masson, F.; Nankali, H.; Ritz, J.-F.; Sedighi, M.; Tavakoli, F. Deciphering oblique shortening of central Alborz in Iran using geodetic data. Earth Planet. Sci. Lett. 2004, 223, 177–185. [Google Scholar] [CrossRef]
- Stocklin, J. Structural History and Tectonics of Iran: A Review. AAPG Bull. 1968, 52, 1229–1258. [Google Scholar] [CrossRef]
- Lyberis, N.; Manby, G. Oblique to orthogonal convergence across the Turan block in the post-Miocene. AAPG Bull. 1999, 83, 1135–1160. [Google Scholar] [CrossRef]
- Walker, R.T.; Bezmenov, Y.; Begenjev, G.; Carolin, S.; Dodds, N.; Gruetzner, C.; Jackson, J.; Mirzin, R.; Mousavi, Z.; Rhodes, E. Slip-Rate on the Main Köpetdag (Kopeh Dagh) Strike-Slip Fault, Turkmenistan, and the Active Tectonics of the South Caspian. Tectonics 2021, 40, e2021TC006846. [Google Scholar] [CrossRef]
- Brunet, M.-F.; Korotaev, M.V.; Ershov, A.V.; Nikishin, A.M. The South Caspian Basin: A review of its evolution from subsidence modelling. Sediment. Geol. 2003, 156, 119–148. [Google Scholar] [CrossRef]
- Mangino, S.; Priestley, K. The crustal structure of the southern Caspian region. Geophys. J. Int. 1998, 133, 630–648. [Google Scholar] [CrossRef] [Green Version]
- Kadinsky-Cade, K.; Barazangi, M.; Oliver, J.; Isacks, B. Lateral variations of high-frequency seismic wave propagation at regional distances across the Turkish and Iranian plateaus. J. Geophys. Res. Solid Earth 1981, 86, 9377–9396. [Google Scholar] [CrossRef]
- Jackson, J.; Priestley, K.; Allen, M.; Berberian, M. Active tectonics of the south Caspian basin. Geophys. J. Int. 2002, 148, 214–245. [Google Scholar] [CrossRef] [Green Version]
- Aziz Zanjani, A.; Ghods, A.; Sobouti, F.; Bergman, E.; Mortezanejad, G.; Priestley, K.; Madanipour, S.; Rezaeian, M. Seismicity in the western coast of the South Caspian Basin and the Talesh Mountains. Geophys. J. Int. 2013, 195, 799–814. [Google Scholar] [CrossRef] [Green Version]
- Allen, M.B.; Jones, S.; Ismail-Zadeh, A.; Simmons, M.; Anderson, L. Onset of subduction as the cause of rapid Pliocene-Quaternary subsidence in the South Caspian basin. Geology 2002, 30, 775–778. [Google Scholar] [CrossRef]
- Allen, M.; Jackson, J.; Walker, R. Late Cenozoic reorganization of the Arabia-Eurasia collision and the comparison of short-term and long-term deformation rates. Tectonics 2008, 23, TC2008. [Google Scholar] [CrossRef] [Green Version]
- Kaz’min, V.; Verzhbitskii, E. Age and origin of the South Caspian Basin. Oceanology 2011, 51, 131–140. [Google Scholar] [CrossRef]
- Solaymani Azad, S.; Nemati, M.; Abbassi, M.-R.; Foroutan, M.; Hessami, K.; Dominguez, S.; Bolourchi, M.-J.; Shahpasandzadeh, M. Active-couple indentation in geodynamics of NNW Iran: Evidence from synchronous left-and right-lateral co-linear seismogenic faults in western Alborz and Iranian Azerbaijan domains. Tectonophysics 2019, 754, 1–17. [Google Scholar] [CrossRef]
- Rashidi, A.; Kianimehr, H.; Shafieibafti, S.; Mehrabi, A.; Derakhshani, R. Active faults in the west of the Lut block (Central Iran). Geophys. Res. 2021, 22, 70–84. [Google Scholar] [CrossRef]
- Ritz, J.-F.; Nazari, H.; Ghassemi, A.; Salamati, R.; Shafei, A.; Solaymani, S.; Vernant, P. Active transtension inside central Alborz: A new insight into northern Iran–southern Caspian geodynamics. Geology 2006, 34, 477–480. [Google Scholar] [CrossRef] [Green Version]
- Rashidi, A. Geometric and kinematic characteristics of the Khazar and North Alborz Faults: Links to the structural evolution of the North Alborz-South Caspian boundary, Northern Iran. J. Asian Earth Sci. 2021, 213, 104755. [Google Scholar] [CrossRef]
- Tchalenko, J. Seismotectonic framework of the North Tehran fault. Tectonophysics 1975, 29, 411–420. [Google Scholar] [CrossRef]
- Berberian, M.; Yeats, R.S. Patterns of historical earthquake rupture in the Iranian Plateau. Bull. Seismol. Soc. Am. 1999, 89, 120–139. [Google Scholar]
- Raeesi, M.; Zarifi, Z.; Nilfouroushan, F.; Boroujeni, S.A.; Tiampo, K. Quantitative analysis of seismicity in Iran. Pure Appl. Geophys. 2017, 174, 793–833. [Google Scholar] [CrossRef]
- Sheykholeslami, M.R.; Javadi, H.R.; Asadi, M. Iran Fault Map on Provincial Subdivisions; Geological Survey & Mineral Explorations of Iran (GSI): Tehran, Iran, 2013.
- Hessami, K.; Mobayyen, F.; Tabassi, H. The Map of Active Faults of Iran; International Institute of Earthquake Engineering and Seismology: Tehran, Iran, 2013. [Google Scholar]
- Childs, C. Interpolating surfaces in ArcGIS spatial analyst. ArcUser July-Sept. 2004, 3235, 569. [Google Scholar]
- Kostrov, V. Seismic moment and energy of earthquakes, and seismic flow of rock. Izv. Acad. Sci. USSR Phys. Solid Earth 1974, 1, 23–44. [Google Scholar]
- Delvaux, D.; Sperner, B. Stress tensor inversion from fault kinematic indicators and focal mechanism data: The TENSOR program. New Insights Into Struct. Interpret. Model. 2003, 212, 75–100. [Google Scholar]
- Bott, M.H.P. The mechanics of oblique slip faulting. Geol. Mag. 1959, 96, 109–117. [Google Scholar] [CrossRef]
- Angelier, J.t.; Mechler, P. Sur une methode graphique de recherche des contraintes principales egalement utilisables en tectonique et en seismologie: La methode des diedres droits. Bull. Société Géologique Fr. 1977, 7, 1309–1318. [Google Scholar] [CrossRef]
- Gephart, J.W.; Forsyth, D.W. An improved method for determining the regional stress tensor using earthquake focal mechanism data: Application to the San Fernando earthquake sequence. J. Geophys. Res. Solid Earth 1984, 89, 9305–9320. [Google Scholar] [CrossRef]
- Delvaux, D.; Barth, A. African stress pattern from formal inversion of focal mechanism data. Tectonophysics 2010, 482, 105–128. [Google Scholar] [CrossRef]
- Delvaux, D.; Moeys, R.; Stapel, G.; Petit, C.; Levi, K.; Miroshnichenko, A.; Ruzhich, V.; San’kov, V. Paleostress reconstructions and geodynamics of the Baikal region, Central Asia, Part 2. Cenozoic rifting. Tectonophysics 1997, 282, 1–38. [Google Scholar] [CrossRef]
- Zoback, M.L. Stress field constraints on intraplate seismicity in eastern North America. J. Geophys. Res. Solid Earth 1992, 97, 11761–11782. [Google Scholar] [CrossRef] [Green Version]
- Yassaghi, A.; Madanipour, S. Influence of a transverse basement fault on along-strike variations in the geometry of an inverted normal fault: Case study of the Mosha Fault, Central Alborz Range, Iran. J. Struct. Geol. 2008, 30, 1507–1519. [Google Scholar] [CrossRef]
- Shahpasandzadeh, M.; Koyi, H.; Nilfouroushan, F. The significance of switch in convergence direction in the Alborz Mountains, northern Iran: Insights from scaled analogue modeling. Interpretation 2017, 5, SD81–SD98. [Google Scholar] [CrossRef]
- Nazari, H.; Ritz, J.-F.; Burg, J.-P.; Shokri, M.; Haghipour, N.; Vizheh, M.M.; Avagyan, A.; Nashli, H.F.; Ensani, M. Active tectonics along the Khazar fault (Alborz, Iran). J. Asian Earth Sci. 2021, 219, 104893. [Google Scholar] [CrossRef]
- Zoback, M.L. First-and second-order patterns of stress in the lithosphere: The World Stress Map Project. J. Geophys. Res. Solid Earth 1992, 97, 11703–11728. [Google Scholar] [CrossRef]
- Lund, B.; Townend, J. Calculating horizontal stress orientations with full or partial knowledge of the tectonic stress tensor. Geophys. J. Int. 2007, 170, 1328–1335. [Google Scholar] [CrossRef] [Green Version]
- Sparacino, F.; Palano, M.; Peláez, J.A.; Fernández, J. Geodetic deformation versus seismic crustal moment-rates: Insights from the Ibero-Maghrebian region. Remote Sens. 2020, 12, 952. [Google Scholar] [CrossRef] [Green Version]
- Rontogianni, S. Comparison of geodetic and seismic strain rates in Greece by using a uniform processing approach to campaign GPS measurements over the interval 1994–2000. J. Geodyn. 2010, 50, 381–399. [Google Scholar] [CrossRef] [Green Version]
- D’Agostino, N.; Mantenuto, S.; D’Anastasio, E.; Avallone, A.; Barchi, M.; Collettini, C.; Radicioni, F.; Stoppini, A.; Fastellini, G. Contemporary crustal extension in the Umbria–Marche Apennines from regional CGPS networks and comparison between geodetic and seismic deformation. Tectonophysics 2009, 476, 3–12. [Google Scholar] [CrossRef]
- Holt, W.E.; Li, M.; Haines, A. Earthquake strain rates and instantaneous relative motions within central and eastern Asia. Geophys. J. Int. 1995, 122, 569–593. [Google Scholar] [CrossRef] [Green Version]
- Papazachos, C.B.; Kiratzi, A.A. A formulation for reliable estimation of active crustal deformation and its application to central Greece. Geophys. J. Int. 1992, 111, 424–432. [Google Scholar] [CrossRef] [Green Version]
- Bus, Z.; Grenerczy, G.; Tóth, L.; Mónus, P. Active crustal deformation in two seismogenic zones of the Pannonian region—GPS versus seismological observations. Tectonophysics 2009, 474, 343–352. [Google Scholar] [CrossRef]
- Aid, K.; Richards, P. Quantitative Seismology: Theory and Methods; Freeman: San Francisco, CA, USA, 1980. [Google Scholar]
- Masson, F.; Lehujeur, M.; Ziegler, Y.; Doubre, C. Strain rate tensor in Iran from a new GPS velocity field. Geophys. J. Int. 2014, 197, 10–21. [Google Scholar] [CrossRef] [Green Version]
- Spakman, W.; Nyst, M. Inversion of relative motion data for estimates of the velocity gradient field and fault slip. Earth Planet. Sci. Lett. 2002, 203, 577–591. [Google Scholar] [CrossRef]
- Tape, C.; Musé, P.; Simons, M.; Dong, D.; Webb, F. Multiscale estimation of GPS velocity fields. Geophys. J. Int. 2009, 179, 945–971. [Google Scholar] [CrossRef] [Green Version]
- Haines, A.; Jackson, J.; Holt, W.; Agnew, D. Representing Distributed Deformation by Continuous Velocity Fields; Institute of Geological and Nuclear Sciences: Wellington, New Zealand, 1998; Sci. Rept. 98/5. [Google Scholar]
- Frank, F. Deduction of earth strains from survey data. Bull. Seismol. Soc. Am. 1966, 56, 35–42. [Google Scholar] [CrossRef]
- Teza, G.; Pesci, A. grid_strain- user’s guide. Software packages for strain field computation in 2D and 3D environments. Comput. Geosci. 2008, 34, 1142–1153. [Google Scholar] [CrossRef]
- Pesci, A.; Teza, G. Strain rate analysis over the central Apennines from GPS velocities: The development of a new free software. Boll. Geod. E Sci. Affin. 2007, 56, 69–88. [Google Scholar]
- Shen, Z.K.; Jackson, D.D.; Ge, B.X. Crustal deformation across and beyond the Los Angeles basin from geodetic measurements. J. Geophys. Res. Solid Earth 1996, 101, 27957–27980. [Google Scholar] [CrossRef]
- Gibbons, J.D.; Chakraborti, S. Nonparametric Statistical Inference; Springer: Berlin/Heidelberg, Germany, 2011. [Google Scholar]
- Hanks, T.C.; Kanamori, H. A moment magnitude scale. J. Geophys. Res. Solid Earth 1979, 84, 2348–2350. [Google Scholar] [CrossRef]
- Djamour, Y.; Vernant, P.; Bayer, R.; Nankali, H.R.; Ritz, J.-F.; Hinderer, J.; Hatam, Y.; Luck, B.; Le Moigne, N.; Sedighi, M. GPS and gravity constraints on continental deformation in the Alborz mountain range, Iran. Geophys. J. Int. 2010, 183, 1287–1301. [Google Scholar] [CrossRef] [Green Version]
- Wu, Y.; Jiang, Z.; Yang, G.; Wei, W.; Liu, X. Comparison of GPS strain rate computing methods and their reliability. Geophys. J. Int. 2011, 185, 703–717. [Google Scholar] [CrossRef] [Green Version]
- Angelica, C.; Bonforte, A.; Distefano, G.; Serpelloni, E.; Gresta, S. Seismic potential in Italy from integration and comparison of seismic and geodetic strain rates. Tectonophysics 2013, 608, 996–1006. [Google Scholar] [CrossRef]
- Allen, M.; Ghassemi, M.; Shahrabi, M.; Qorashi, M. Accommodation of late Cenozoic oblique shortening in the Alborz range, northern Iran. J. Struct. Geol. 2003, 25, 659–672. [Google Scholar] [CrossRef]
- Ghassemi, M.R. Drainage evolution in response to fold growth in the hanging-wall of the Khazar fault, north-eastern Alborz, Iran. Basin Res. 2005, 17, 425–436. [Google Scholar] [CrossRef]
- Manighetti, I.; Zigone, D.; Campillo, M.; Cotton, F. Self-similarity of the largest-scale segmentation of the faults: Implications for earthquake behavior. Earth Planet. Sci. Lett. 2009, 288, 370–381. [Google Scholar] [CrossRef]
- Manighetti, I.; De Barros, L.; Caulet, C.; Perrin, C.; Cappa, F. Deterministic, self-similar slip and stress heterogeneity on seismogenic faults. Proceedings of AGU Fall Meeting Abstracts, Moscone Convention Center, San Francisco, CA, USA, 9–13 December 2013; p. T53E-07. [Google Scholar]
- Rashidi, A.; Abbassi, M.-R.; Nilfouroushan, F.; Shafiei, S.; Derakhshani, R.; Nemati, M. Morphotectonic and earthquake data analysis of interactional faults in Sabzevaran Area, SE Iran. J. Struct. Geol. 2020, 139, 104147. [Google Scholar] [CrossRef]
- Mehrabi, A.; Pirasteh, S.; Rashidi, A.; Pourkhosravani, M.; Derakhshani, R.; Liu, G.; Mao, W.; Xiang, W. Incorporating Persistent Scatterer Interferometry and Radon Anomaly to Understand the Anar Fault Mechanism and Observing New Evidence of Intensified Activity. Remote Sens. 2021, 13, 2072. [Google Scholar] [CrossRef]
- Rashidi Boshrabadi, A.; Khatib, M.M.; Raeesi, M.; Mousavi, S.M.; Djamour, Y. Geometric-kinematic characteristics of the main faults in the W-SW of the Lut Block (SE Iran). J. Afr. Earth Sci. 2018, 139, 440–462. [Google Scholar] [CrossRef]
- Nemati, M.; Derakhshani, R. Short-term seismicity patterns along the most active faults in Iran. J. Iber. Geol. 2021, 47, 441–459. [Google Scholar] [CrossRef]
- Hollingsworth, J.; Nazari, H.; Ritz, J.F.; Salamati, R.; Talebian, M.; Bahroudi, A.; Walker, R.T.; Rizza, M.; Jackson, J. Active tectonics of the east Alborz mountains, NE Iran: Rupture of the left-lateral Astaneh fault system during the great 856 AD Qumis earthquake. J. Geophys. Res. Solid Earth 2010, 115, B12313. [Google Scholar] [CrossRef] [Green Version]
- NOAA. National Geophysical Data Center/World Data Service (NGDC/WDS): NCEI/WDS Global Significant Earthquake Database. 2020. Available online: https://www.ngdc.noaa.gov/hazel/view/hazards/earthquake/search (accessed on 1 March 2022). [CrossRef]
- Nazari, H.; Ritz, J.-F.; Salamati, R.; Shafei, A.; Ghassemi, A.; Michelot, J.-L.; Massault, M.; Ghorashi, M. Morphological and palaeoseismological analysis along the Taleghan fault (Central Alborz, Iran). Geophys. J. Int. 2009, 178, 1028–1041. [Google Scholar] [CrossRef] [Green Version]
- Abbassi, M.; Farbod, Y. Faulting and folding in quaternary deposits of Tehran’s piedmont (Iran). J. Asian Earth Sci. 2009, 34, 522–531. [Google Scholar] [CrossRef]
- Azad, S.S. Seismic Hazard Assessement for Tehran, Tabriz and Zandjan Cities (NW Iran) Based on Morphotectonics and paleoseismology. Ph.D. Thesis, University of Montpellier, Montpellier, France, 2009. [Google Scholar]
- Javidfakhr, B.; Bellier, O.; Shabanian, E.; Siame, L.; Léanni, L.; Bourlès, D.; Ahmadian, S. Fault kinematics and active tectonics at the southeastern boundary of the eastern Alborz (Abr and Khij fault zones): Geodynamic implications for NNE Iran. J. Geodyn. 2011, 52, 290–303. [Google Scholar] [CrossRef] [Green Version]
- Hashemi, F.; Derakhshani, R.; Bafti, S.S.; Raoof, A. Morphometric dataset of the alluvial fans at the southern part of Nayband fault, Iran. Data Brief 2018, 21, 1756–1763. [Google Scholar] [CrossRef]
- Kermani, A.F.; Derakhshani, R.; Bafti, S.S. Data on morphotectonic indices of Dashtekhak district, Iran. Data Brief 2017, 14, 782–788. [Google Scholar] [CrossRef]
- Rahbar, R.; Shafiei Bafti, S.; Derakhshani, R. Investigation of the tectonic activity of Bazargan Mountain in Iran. Sustain. Dev. Mt. Territ. 2017, 9, 380–386. [Google Scholar] [CrossRef]


Publisher’s Note: MDPI stays neutral with regard to jurisdictional claims in published maps and institutional affiliations. |
© 2022 by the authors. Licensee MDPI, Basel, Switzerland. This article is an open access article distributed under the terms and conditions of the Creative Commons Attribution (CC BY) license (https://creativecommons.org/licenses/by/4.0/).