Abstract
Tracking Ultraviolet Set-up (TUS) on board the Lomonosov satellite measured the UV intensity pulsations in the auroral region. Sixty-four events with pulsations were registered during two measurement periods from 26 December 2016–10 January 2017 and 8–15 November 2017. During both periods, a high-intensity, long-duration, continuous auroral activity (HILDCAA) was detected. Simultaneous measurements in LEO by Lomonosov (DEPRON detector) and Meteor-M2 satellites show the enhanced fluxes of the trapped and precipitated energetic electrons in the region of the Earth’s outer radiation belt during these periods. We found that most of the UV-events correspond to energetic electron (E > 100 keV) precipitation. One can suggest that particles of these and higher energies cause a pulsating emission relatively deep in the atmosphere.
1. Introduction
Aurora is a natural optical phenomenon that occurs in the Earth’s upper atmosphere mostly at the altitudes of approximately 80–250 km. It originates from emissions of atoms and molecules, excited by energetic charged particles precipitating out of the magnetosphere. Aurorae have a wide variety of dynamic characteristics, shapes, time scales, etc. Some of them that have quasiperiodic modulations of the emission intensity (weak emission turning on and off) are called Pulsating aurorae (PsA) [1,2].
PsA mainly appear during the recovery phase of a substorm and look like sporadic luminosity spots with quasiperiodic temporal variations. These fluctuations are often accompanied by fast and complex movements of their bright part, synchronized with their luminosity changes [3]. PsA mostly occur at the equatorward boundary of the auroral oval [4] and in the midnight-morning MLT sector.
The main pulsation periods are usually found to lie in the range from 1 to 20 s. In some cases, the “internal modulation” (faster oscillations of intensity, enclosed in the impulse of the main pulsation) can be observed [5].
There were numerous attempts to classify PsA based on the variety of their characteristics such as shape, size, temporal modulation, spatial stability, etc (see, for example, [6]). One of the recent classifications based on the phenomenology of PsA obtained by all-sky cameras was suggested by [7]. They have introduced three categories of these events: Patchy Aurora (PA), Patchy Pulsating Aurora (PPA), and Amorphous Pulsating Aurora (APA). APAs develop fast both in shape and brightness. PPAs are structured patches which can exist for tens of minutes and pulsate. PA are similar to those of PPAs but do not change their brightness.
The typical altitude of events visible by ground-based all-sky cameras allows for suggesting that they are caused mainly by the precipitating electrons with the energy of 20–40 keV. Satellite observations provide evidence that a pulsating aurora also corresponds to the enhancement of energetic (>100 keV) electron fluxes. A number of studies demonstrate that the cause of these electrons’ precipitation, responsible for pulsating aurora, is the interaction between magnetospheric electrons and electromagnetic VLF/ELF whistler-mode chorus waves [8,9,10]. On the other hand, Ref. [11] demonstrated by simulations that relativistic electron microbursts (REMs) are high-energy parts of pulsating aurora electrons, and they are produced when particles interact with chorus waves. High-energy electrons precipitate deeper in the atmosphere (down to 65 km) and produce high ionization levels [11,12,13,14].
The origin and mechanisms of PsA occurrence are not fully understood yet. In this study, we analyze optical data of the high sensitive telescope TUS on board the Lomonosov satellite together with charged particle detectors of the same spacecraft and METEOR-M2 satellite. Geomagnetic activity during a period of measurements that was responsible for active generation of chorus waves and energetic particle precipitation has been considered.
2. Instruments and Data
The optical data from the Tracking Ultraviolet Set-up (the TUS detector) on board the Lomonosov satellite were used in this study. The satellite had a sun-synchronous orbit with an inclination of 97.3, an altitude of about of 500 km, and a rotation period of ∼94 min. The polar type of the orbit made it possible to register the auroral emissions.
TUS is a highly-sensitive mirror telescope looking into the nadir direction from the altitude of ∼500 km. The area of the mirror is about 2 m and makes it possible to measure faint near-UV (NUV) emission of fast atmospheric processes. A photodetector consists of 256 channels (“pixels”) with a square field of view (FOV) of 10 mrad each (corresponding to the area of km at a typical PsA altitude of 100 km). The total FOV of the detector is . Each pixel is a photoelectron multiplier tube R1463 of Hamamatsu covered by the UFS1 filter transparent in a wavelength range of 240–400 nm. In more detail, this telescope was described in [15].
The events considered in this paper were registered by the TUS telescope in the slowest operation mode (6.6 ms temporal resolution and waveform length of 1.7 s). TUS was operating in this mode during three short periods:
- 26 December 2016–10 January 2017;
- 28 February 2017–21 March 2017;
- 8–15 November 2017.
In total, 10,084 events were registered during these periods, of which 66 were with NUV pulsations (32 during the first period, 2 during the second one, and 32 during the third one).
The events which contain NUV pulsations in the auroral region were selected and described in detail in [16].
It was found out that these 64 events include pulsations in a range of 1–10 Hz and that the typical size of luminous regions is about of 10 km. The pulsation amplitude is about of 10% of the background level. Events are distributed between 55 and 71 of magnetic latitude, which corresponds to a source location in the equatorial magnetosphere between 4 and 9 Earth radii. In addition, 70% of the events occur on L-shells less than 6. This indicates a connection with the structures of the inner magnetosphere, namely the outer radiation belt.
For some events, when it was possible, data of ground-based all-sky cameras were analyzed. In particular, 11 coincidences with the cameras of the THEMIS network were found, and it was shown that, in all cases, an active auroral glow appeared in the region of observation of events by the TUS detector [17]. In addition, two cases of joint observations with all-sky cameras by Polar Geophysical Institute (Apatity, Russia) were analyzed. A total of TUS six events were measured inside the field of view of the ground-based cameras and in all cases a wide region of pulsating auroras was observed [18].
Only two events with NUV pulsations were measured during the second period (March 2017) due to irregular operation of the equipment and the large phase of the moon, which increases the background illumination and lowers the sensitivity of the device. For this reason, we do not consider and do not discuss this period and these events in the current work.
DEPRON data were used to analyze charge particle flux during the first period of measurements since it was functioning at this time. DEPRON is a dosimeter on board the Lomonosov satellite. This instrument consists of two silicon semiconductor detectors and two helium gas discharge thermal neutron counters. The semiconductor detectors operated in amplitude-pulse mode, which allows for registering the flux of charged particles as well as dose rate. The characteristics of the DEPRON instrument can be found in [19]. The DEPRON instrument operated on board the Lomonosov spacecraft from 5 May 2016 till 10 January 2017.
For the second analyzed period, data from the METEOR-M2 satellite were used as well as data of Van Allen Probes.
The satellite METEOR-M2 has a polar sun-synchronous circular orbit with an inclination of 98.8 and an altitude of 825 km. The satellite orbit is located in the prenoon–premidnight sectors of local time. A number of charged particle detectors are installed on board the METEOR-M2, including a horizontal spectrometer MSGI-M (DAS4, 90) and the vertical spectrometer SKL-M (DAS4, 0). These detectors measure electron fluxes with energies in the range of 100 keV–8 MeV. An important feature of the devices arrangement is that the vertical spectrometer is directed approximately along the magnetic field at high latitudes, and it measures mainly precipitating charged particles while the horizontal one—trapped particles. The MSGI-M also contains an electrostatic analyzer measuring electron flux in the energy range from 0.032 keV to 16.64 keV. More details can be found, for example, in [20].
Van Allen Probes (VAP; formerly: Radiation Belt Storm Probes, RBSP) is a NASA project aimed at studying Earth’s radiation belts (http://vanallenprobes.jhuapl.edu/index.php) (accessed on 5 November 2022). This mission consists of two identical satellites (RBSPa and RBSPb), which were launched to a high-elliptical orbit on 30 August 2012. Orbital elements include inclination: 10, orbiting period: 9 h, apogee: 6 R, and perigee: 600–700 km. In November 2017, the VAP spacecraft orbit was in a pre-noon magnetospheric sector, while, in January 2017, in the dusk–midnight magnetospheric sector (http://rbspgway.jhuapl.edu/ExtendedMissionOrbit, accessed on 5 November 2022). VAP satellites payload included several instruments designed to measure energetic particles in the radiation belts: MagEIS that measures electron fluxes from 20 keV to about 4 MeV, and REPT that measures high-energy electrons up to ∼20 MeV. Additionally, electric and magnetic fields and plasma waves which are responsible for particle transport, acceleration, and loss are measured by EFW (Electric Field and Waves) and EMFISIS (Electric and Magnetic Field Instrument Suite and Integrated Science) Suites.
3. Results
Intensive pulsations in the auroral region were studied during two periods of TUS observations: 26 December 2016–10 January 2017 and 8–15 November 2017.
3.1. December 2016–January 2017
The geomagnetic activity during period 19 December 2016–10 January 2017 is shown in Figure 1. One can see the extended period of substorm activations with multiple peaks in the AE index during a prolonged recovery phase of a weak magnetic storm started on 21 December. TUS events are shown by red vertical lines. All of them occur during continuous auroral activity and correspond to the substorm activations.
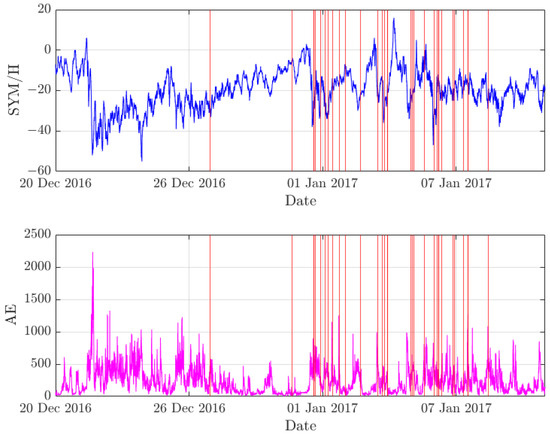
Figure 1.
Geomagnetic activity during end of December 2016–beginning of January 2017. Upper plot demonstrates SYM/H index behavior, lower plot—AE-index. TUS event registrations are shown by red vertical lines.
Comparison with simultaneous measurements of DEPRON instrument on board the Lomonosov spacecraft allows for establishing the relationships between optical emissions and the ORB sporadic fluctuations. Twenty-five joint measurements were found by both instruments. Among these measurements, a significant increase of charged particle fluxes was registered for 15 NUV pulsating events. Two characteristic cases were observed: (1) the position of the event coincides with the maximum of the ORB particle flux (or it is located between the maximum and polar boundary of ORB)—10 measurements, (2) increasing of the charged particle fluxes appears in the region poleward of the high latitude boundary of the ORB and the NUV events coincides with this bump—5 measurements. Examples of these events are demonstrated in Figure 2. The satellite is moving from polar latitudes to equatorial ones. One can see the location of the TUS events during outer radiation belt crossings at the pre-midnight MLTs. Thus, about 60 % of events were measured in close relation with the ORB during periods of high-energy electron fluxes enhancement. For other events, no charged particle flux increasing was observed. Two of them occur at very high latitudes (L > 8), 8 in relatively low latitudes (in the ORB region, but no enhancements of particle flux were measured by DEPRON).

Figure 2.
DEPRON measurements data during two TUS events: 1 January 2017, 06:00:49 UTC; 6 January 2017, 08:24:59 UTC. Vertical lines show the moments of the TUS event registrations.
Wave–particle interaction is one of the basic mechanisms that influences the outer radiation belt dynamics. It can be the source for both acceleration and scattering of the trapped electrons. Frequency spectrum data from the EMFISIS [21] instrument on board the RBSP satellites are presented in Figure 3 during two periods corresponding to the TUS observations. One can see that active chorus wave generation processes were developed during these periods. The TUS events measured at 12:39:14 UTC on 7 January2017 (L-shell of the event is 4.4, MLT = 23.3) and at 10:38:19 UTC on 8 January 2017 (L = 4.9, MLT = 23.1) lie inside these periods. At the moments of the TUS event measurements, RBSP satellites were located approximately in magnetic conjunction with Lomonosov: RBSP-B satellite was at L = 4.55 and MLT = 23.5, while RBSP-A was at L = 5.5, MLT = 23.1. One can see the intensive wave activity with a frequency close to electron gyro frequency f (few kHz, indicated in the figure by the upper white line) during observed TUS events.
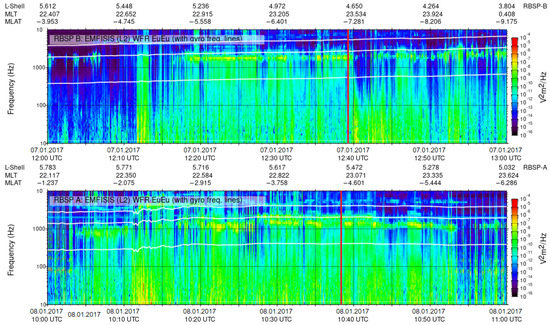
Figure 3.
EMFISIS RBSP data during two TUS event measurements. Upper panel for 7 January 2017 12:39:14 UTC, lower–8 January 2017 10:38:19 UTC. White lines indicated electron gyro frequency f (upper line), 0.5f (middle line), 0.1f (bottom line). Red vertical lines show the moments of TUS event registrations.
3.2. November 2017
Geomagnetic activity during period 6–13 November 2017 is shown in Figure 4. One can see a moderate magnetic storm started on 7 November 2017 with substorm activations and multiple peaks in the AE-index during the recovery phase. All events measured by the TUS telescope were observed during the storm recovery phase and coincide with the period of prolonged auroral activity.

Figure 4.
Geomagnetic activity during November 2017. The upper plot demonstrates SYM/H index behavior, lower plot—AE-index.
The DEPRON detector on-board the Lomonosov satellite was not operational during this period of time. Thus, to analyze the charged particle fluxes, we used the measurements of the METEOR-M2 satellite. Since the METEOR-M2 satellite has a different orbit, the time moments with closest to Lomonosov L-shell and similar MLT were selected. The similar as in the first period relationships between optical pulsations and particle fluxes variations were observed: there exist two types of pulsating aurorae that correspond to precipitation from regions near the outer radiation belt maximum and from the region attached to the high-latitude outer radiation belt boundary. One example is shown in Figure 5. Two types of TUS events were detected during the outer radiation belt crossing by the METEOR-M2 satellite during 09:34–09:48 UTC on 9 November 2017. One can see simultaneous measurements of 100 keV electron fluxes measured by vertical and horizontal detectors (top) as well as auroral electrons precipitation in the energy ranges 0.26 keV and 16 keV (bottom). In addition, 100 keV electrons’ isotropic fluxes are detected from 09:42 till 9:44 UTC. One can see precipitation of energetic electrons at the poleward boundary of the outer radiation belt as well as in the region of the auroral oval. The charged particle flux is practically isotropic here, which demonstrates the existence of precipitating electrons. The first NUV event is located in the region of the ORB, while the second one lies at the higher, auroral latitudes in the region of enhanced 100 keV electrons flux poleward of the ORB. In total, for 17 NUV TUS events, the corresponding almost-simultaneous METEOR-M2 measurements were found. In five cases, high energy (>100 keV) electron precipitation is measured near the ORB maximum, while, in 12 cases, both low energy and high energy electron fluxes enhancements were observed in the region of the auroral oval.
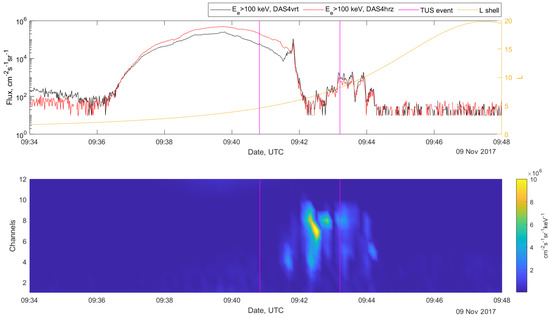
Figure 5.
Comparison of TUS and METEOR-M2 data for two events measured during 9 November 2017. Upper panel: High energy ( keV electron flux measurements by two orthogonal detectors (vertical–vrt and horizontal–hrz). Bottom panel: plasma detector measurements, channel numbers correspond to the following mean energy: 1–0.032 keV; 2–0.065 keV; 3–0.13 keV; 4–0.26 keV; 5–0.52 keV; 6–1.04 keV; 7–2.08 keV; 8–4.16 keV; 9–8.32 keV; 10–16.64 keV. Vertical lines show TUS events position.
The active chorus waves generation started on 7 November, during the geomagnetic storm main phase, and continued during the whole recovery phase (Figure 6). Differences in the satellite orbits in November 2017 (RBSP-A and -B were located in the pre-noon MLT sector, while TUS observations were completed on the post-midnight part of the Lomonosov satellite orbit) do not allow us to find a good match of the position of the measurements (L and MLT) by both satellites. However, the usual region of chorus wave generation during magnetic storm main and recovery phases occupies almost all of the dawn sector (0-6-12 MLT) [20]. High wave activity in the pre-noon region definitely reveals itself in charged particle acceleration and scattering in the whole dawn-side magnetosphere.
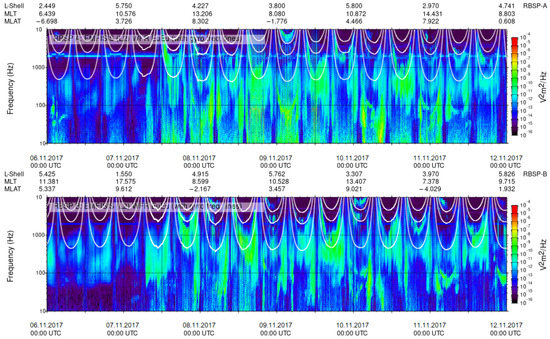
Figure 6.
RBSP E-field measurements by EMFISIS WRF.
4. Discussion
Both periods of the TUS detector’s successful observations correspond to recovery phases of the weak and moderate magnetic storms with prolonged intense substorm activity. Such a phenomenon is called high-intensity, long-duration, continuous auroral activity (HILDCAA) events [22]. HILDCAAs are events with a minimum duration of two days when the AE-index does not not have values below 200 nT for more than 2 h at a time, and a peak AE-index can reach values of around 1000 nT. As demonstrated by [23], these events may be effective in the acceleration of energetic electrons up to relativistic energies. This possibility was studied in detail in [24], and it was shown that HILDCAA events are characterized by enhancements of relativistic electrons flux in three energy ranges ( MeV, MeV, and MeV) compared to the pre-event flux levels. It was also shown that these events are responsible for frequent and intense injections of anisotropic electrons in the energy range of ∼10–100 keV into the magnetosphere which are the source of chorus waves generation and subsequent acceleration of electrons to energies even higher than several MeV.
It was shown that the HILDCAA events correlate with the increasing of magnetospheric relativistic ( MeV) electron fluxes observed at geosynchronous orbit. A delay between flux increase and the onset of the HILDCAAs is about 1.5 days. TUS NUV pulsating events are observed also a few days after the starting of the substorm activity and HILDCAA events, during the weak storm recovery phase with numerous peaks of the AE-index.
From the other hand, transient electron precipitations in the MeV energy range were reported as electron microbursts—an intensive increasing of energetic electron precipitation from magnetosphere in a subsecond time scale. These microbursts were measured by the HILT detector [25] of Solar Anomalous Magnetospheric Particle Explorer (SAMPEX) mission [26]. It was shown that relativistic electron microbursts (REM) are mostly related to the ORB, from L = 3–8. They occur predominantly on the dawn-side, between 0 and 13 MLT [27]. With an increase of geomagnetic activity, the maximum frequency of relativistic microbursts shifts to lower L shells.
L-shell’s distribution of the TUS events [16] is similar to SAMPEX microbursts. In addition, the position relative to the outer radiation belt, found in comparison with DEPRON and METEOR-M2 particle detectors, also resembles electron bursts reported in [27].
The interconnection between pulsating aurorae and REMs was theoretically proposed in [11]. It was shown that pulsating aurora and REM are both products of particle interaction with chorus waves. Lower-band chorus (LBC) bursts correspond to the main modulations of PsA and particle precipitation, while the internal modulations are caused by rising tone elements of LBC.
Recently, a strong correlation between REMs and Patchy Aurora was shown [28]. Patchy Aurora (PA) as well as Patchy Pulsating Aurora (PPA) is a type of PsA in a classification suggested by [7]. These types of aurora are predominantly constrained between 4 and . The similar location and MLT of the TUS events, PA, and PPA was indicated in [16].
A more recent study by [14] reported on observations of electrons precipitation in the energy range from a few hundred keV to a few MeV measured by the European Incoherent Scatter (EISCAT) radar. The precipitation occurred during a weak geomagnetic storm is accompanied by a pulsating aurora. At the same time, the Arase satellite measured intense whistler-mode chorus waves at the conjugate point along geomagnetic field lines. The altitude of ionization associated with PsA was 65 km, and it is one of the lowest regions of aurora ever observed.
Using measurements of electrons from the SAMPEX satellite and observations of the Polar satellite plasma wave instrument, a correlation between REMs and chorus waves with frequencies kHz [29] was found. The comparisons of ground-based observations of PsA made by ultrafast auroral imagers and electric field’s power spectral density measured by magnetospheric satellite Arase showed a direct connection between the structure of PsA and the parameters of chorus waves [30].
To summarize the above, the following general picture is observed. Firstly, long-term geomagnetic activity (HILDCAA event) leads to the active formation of chorus waves in the Earth’s magnetosphere. These waves are related to active pitch–angle scattering and acceleration of electrons up to relativistic energies (up to several MeV) which are well seen a day or so after the start of the substorm. Secondly, there are experimental data showing a good correspondence between chorus waves and the temporal structure of PsA. Thus, NUV pulsations observed by the TUS detector can be originated from energetic particle precipitation during long-term auroral activity and described by mentioned above sequence of processes. Moreover, the recorded microbursts of electrons (SAMPEX results) can also initiate pulsating auroras in the atmosphere at a relatively low depth (up to 60 km). In addition, this should be investigated and measured in the future.
5. Conclusions
The TUS detector on board the Lomonosov satellite measured the pulsations of the NUV glow in the auroral region. During the two measurement periods from 26 December 2016–10 January 2017 and from 8–15 November 2017, 64 events were registered. For both periods, geomagnetic activity has been analyzed, and it was shown that it is characterized by high-intensity, long-duration, continuous auroral activity (HILDCAA) [22,24]. At the same time, data of RBSP satellites demonstrate significant increasing of the chorus waves generation during these periods. Data of charged particle detectors on board the Lomonosov and METEOR-M2 satellites demonstrate that most of the pulsations measured in the near-UV wavelength range occur either at the ORB maximum or in the high latitude region of quasi-trapped energetic electrons appearing as a result of prolonged auroral activity that provides electrons scattering and acceleration due to wave–particle interaction. Energies of measured particles responsible for PsA events exceeded 100 keV. These particles penetrate into the atmosphere and cause a pulsating glow deep in the atmosphere relative to the usual region of PsA (80–250 km).
Author Contributions
Supervision, conceptualization, and writing P.K. and V.K.; Analyses I.Z., A.I., and V.B.; Data Curation K.S. and G.A. All authors have read and agreed to the published version of the manuscript.
Funding
The TUS detector UV pulsations data analyses were supported by the grant from the Russian Science Foundation (project No. 22-62-00010). Analysis of METEOR-M data on charged particle fluxes was supported by the Russian Science Foundation (Project No. 22-62-00048).
Data Availability Statement
The TUS detector data that support the findings of this study are available from the corresponding author, P.K., upon reasonable request. The METEOR-M data are available on the website of SINP MSU Space Monitoring Data Center http://smdc.sinp.msu.ru/ (accessed on 05 November 2022).
Conflicts of Interest
The authors declare no conflict of interest.
Abbreviations
The following abbreviations are used in this manuscript:
| APA | Amorphous Pulsating Aurora |
| EISCAT | European Incoherent Scatter |
| EMFISIS | Electric and Magnetic Field Instrument Suite and Integrated Science |
| FOV | Field of View |
| HILDCAA | High-Intensity, Long-Duration, Continuous AE Activity |
| NUV | Near Ultraviolet |
| ORB | Outer Radiation Belt |
| PA | Patchy Aurora |
| PPA | Patchy Pulsating Aurora |
| PsA | Pulsating Aurora |
| RBSP | Radiation Belt Storm Probes |
| REM | Relativistic Electron Microburst |
| SAMPEX | Solar Anomalous Magnetospheric Particle Explorer |
| SINP | Skobeltsyn Institute of Nuclear Physics |
| TUS | Tracking Ultraviolet Setup |
| VLF | Very Low Frequency |
References
- Johnstone, A. Pulsating aurora. Nature 1978, 274, 119–126. [Google Scholar] [CrossRef]
- Lessard, M.R. A Review of Pulsating Aurora. In Auroral Phenomenology and Magnetospheric Processes: Earth and Other Planets; American Geophysical Union (AGU): Washington, DC, USA, 2012; pp. 55–68. [Google Scholar] [CrossRef]
- Yamamoto, T. On the temporal fluctuations of pulsating auroral luminosity. J. Geophys. Res. Space Phys. 1988, 93, 897–911. [Google Scholar] [CrossRef]
- Duncan, C.; Creutzberg, F.; Gattinger, R.; Harris, F.; Jones, A. Latitudinal and temporal characteristics of pulsating auroras. Can. J. Phys. 2011, 59, 1063–1069. [Google Scholar] [CrossRef]
- Nishiyama, T.; Sakanoi, T.; Miyoshi, Y.; Hampton, D.L.; Katoh, Y.; Kataoka, R.; Okano, S. Multiscale temporal variations of pulsating auroras: On-off pulsation and a few Hz modulation. J. Geophys. Res. (Space Phys.) 2014, 119, 3514–3527. [Google Scholar] [CrossRef]
- Royrvik, O.; Davis, T. Pulsating aurora: Local and global morphology. J. Geophys. Res. 1977, 82, 4720–4740. [Google Scholar] [CrossRef]
- Grono, E.; Donovan, E. Differentiating diffuse auroras based on phenomenology. Ann. Geophys. 2018, 36, 891–898. [Google Scholar] [CrossRef]
- Kasahara, S.; Miyoshi, Y.; Yokota, S.; Mitani, T.; Kasahara, Y.; Matsuda, S.; Kumamoto, A.; Matsuoka, A.; Kazama, Y.; Frey, H.U.; et al. Pulsating aurora from electron scattering by chorus waves. Nature 2018, 554, 337–340. [Google Scholar] [CrossRef]
- Thorne, R.M.; Ni, B.; Tao, X.; Horne, R.B.; Meredith, N.P. Scattering by chorus waves as the dominant cause of diffuse auroral precipitation. Nature 2010, 467, 943–946. [Google Scholar] [CrossRef]
- Nishimura, Y.; Bortnik, J.; Li, W.; Thorne, R.M.; Lyons, L.R.; Angelopoulos, V.; Mende, S.; Bonnell, J.; Le Contel, O.; Cully, C.; et al. Identifying the driver of pulsating aurora. Science 2010, 330, 81–84. [Google Scholar] [CrossRef]
- Miyoshi, Y.; Saito, S.; Kurita, S.; Asamura, K.; Hosokawa, K.; Sakanoi, T.; Mitani, T.; Ogawa, Y.; Oyama, S.; Tsuchiya, F.; et al. Relativistic Electron Microbursts as High-Energy Tail of Pulsating Aurora Electrons. Geophys. Res. Lett. 2020, 47, e90360. [Google Scholar] [CrossRef]
- Tesema, F.; Partamies, N.; Nesse Tyssøy, H.; McKay, D. Observations of precipitation energies during different types of pulsating aurora. Ann. Geophys. 2020, 38, 1191–1202. [Google Scholar] [CrossRef]
- Miyoshi, Y.; Oyama, S.; Saito, S.; Kurita, S.; Fujiwara, H.; Kataoka, R.; Ebihara, Y.; Kletzing, C.; Reeves, G.; Santolik, O.; et al. Energetic electron precipitation associated with pulsating aurora: EISCAT and Van Allen Probe observations. J. Geophys. Res. (Space Phys.) 2015, 120, 2754–2766. [Google Scholar] [CrossRef]
- Miyoshi, Y.; Hosokawa, K.; Kurita, S.; Oyama, S.I.; Ogawa, Y.; Saito, S.; Shinohara, I.; Kero, A.; Turunen, E.; Verronen, P.; et al. Penetration of MeV electrons into the mesosphere accompanying pulsating aurorae. Sci. Rep. 2021, 11, 1–9. [Google Scholar] [CrossRef]
- Klimov, P.A.; Panasyuk, M.I.; Khrenov, B.A.; Garipov, G.K.; Kalmykov, N.N.; Petrov, V.L.; Sharakin, S.A.; Shirokov, A.V.; Yashin, I.V.; Zotov, M.Y.; et al. The TUS Detector of Extreme Energy Cosmic Rays on Board the Lomonosov Satellite. Space Sci. Rev. 2017, 212, 1687–1703. [Google Scholar] [CrossRef]
- Klimov, P.; Sigaeva, K. Fast near-UV radiation pulsations measured by the space telescope TUS in the auroral region. J. Atmos. Sol.-Terr. Phys. 2021, 220, 105672. [Google Scholar] [CrossRef]
- Klimov, P.; Sigaeva, K. UV Pulsations in the Auroral Region According to Measurements on the Lomonosov Satellite. In Problems of Geocosmos—2020; Springer: Berlin/Heidelberg, Germany, 2022; pp. 421–430. [Google Scholar]
- Klimov, P.; Kozelov, B.; Roldugin, A.; Sigaeva, K. Joint Recording of Pulsating Auroras on Board the Lomonosov Satellite and by All-Sky Cameras on the Kola Peninsula. Bull. Russ. Acad. Sci. Phys. 2022, 86, 300–304. [Google Scholar] [CrossRef]
- Benghin, V.V.; Nechaev, O.Y.; Zolotarev, I.A.; Amelyushkin, A.M.; Petrov, V.L.; Panasyuk, M.I.; Yashin, I.V. An experiment in radiation measurement using the depron instrument. Space Sci. Rev. 2018, 214, 1–9. [Google Scholar] [CrossRef]
- Kugusheva, A.; Kalegaev, V.; Vlasova, N.; Petrov, K.; Bazilevskaya, G.; Makhmutov, V. Space–Time Structure of Energetic Electron Precipitations according to the Data of Balloon Observations and Polar Satellite Measurements on 1–6 February 2015. Cosm. Res. 2021, 59, 446–455. [Google Scholar] [CrossRef]
- Kletzing, C.; Kurth, W.; Acuna, M.; MacDowall, R.; Torbert, R.; Averkamp, T.; Bodet, D.; Bounds, S.; Chutter, M.; Connerney, J.; et al. The electric and magnetic field instrument suite and integrated science (EMFISIS) on RBSP. Space Sci. Rev. 2013, 179, 127–181. [Google Scholar] [CrossRef]
- Tsurutani, B.T.; Gonzalez, W.D. The cause of high-intensity long-duration continuous AE activity (HILDCAAs): Interplanetary Alfvén wave trains. Planet. Space Sci. 1987, 35, 405–412. [Google Scholar] [CrossRef]
- Hajra, R.; Tsurutani, B.T.; Echer, E.; Gonzalez, W.D. Relativistic electron acceleration during high-intensity, long-duration, continuous AE activity (HILDCAA) events: Solar cycle phase dependences. Geophys. Res. Lett. 2014, 41, 1876–1881. [Google Scholar] [CrossRef]
- Hajra, R.; Tsurutani, B.T.; Echer, E.; Gonzalez, W.D.; Santolik, O. Relativistic (E > 0.6, >2.0, and >4.0 MeV) electron acceleration at geosynchronous orbit during high-intensity, long-duration, continuous AE activity (HILDCAA) events. Astrophys. J. 2015, 799, 39. [Google Scholar] [CrossRef]
- Klecker, B.; Hovestadt, D.; Scholer, M.; Arbinger, H.; Ertl, M.; Kastele, H.; Kunneth, E.; Laeverenz, P.; Seidenschwang, E.; Blake, J.; et al. HILT: A heavy ion large area proportional counter telescope for solar and anomalous cosmic rays. IEEE Trans. Geosci. Remote Sens. 1993, 31, 542–548. [Google Scholar] [CrossRef]
- Blake, J.; Looper, M.; Baker, D.; Nakamura, R.; Klecker, B.; Hovestadt, D. New high temporal and spatial resolution measurements by SAMPEX of the precipitation of relativistic electrons. Adv. Space Res. 1996, 18, 71–186. [Google Scholar] [CrossRef]
- Douma, E.; Rodger, C.J.; Blum, L.W.; Clilverd, M.A. Occurrence characteristics of relativistic electron microbursts from SAMPEX observations. J. Geophys. Res. Space Phys. 2017, 122, 8096–8107. [Google Scholar] [CrossRef]
- Shumko, M.; Gallardo-Lacourt, B.; Halford, A.J.; Liang, J.; Blum, L.W.; Donovan, E.; Murphy, K.R.; Spanswick, E. A Strong Correlation Between Relativistic Electron Microbursts and Patchy Aurora. Geophys. Res. Lett. 2021, 48, e2021GL094696. [Google Scholar] [CrossRef]
- Lorentzen, K.R.; Blake, J.B.; Inan, U.S.; Bortnik, J. Observations of relativistic electron microbursts in association with VLF chorus. J. Geophys. Res. Space Phys. 2001, 106, 6017–6027. [Google Scholar] [CrossRef]
- Hosokawa, K.; Miyoshi, Y.; Ozaki, M.; Oyama, S.I.; Ogawa, Y.; Kurita, S.; Kasahara, Y.; Kasaba, Y.; Yagitani, S.; Matsuda, S.; et al. Multiple time-scale beats in aurora: Precise orchestration via magnetospheric chorus waves. Sci. Rep. 2020, 10, 3380. [Google Scholar] [CrossRef]
Disclaimer/Publisher’s Note: The statements, opinions and data contained in all publications are solely those of the individual author(s) and contributor(s) and not of MDPI and/or the editor(s). MDPI and/or the editor(s) disclaim responsibility for any injury to people or property resulting from any ideas, methods, instructions or products referred to in the content. |
© 2022 by the authors. Licensee MDPI, Basel, Switzerland. This article is an open access article distributed under the terms and conditions of the Creative Commons Attribution (CC BY) license (https://creativecommons.org/licenses/by/4.0/).