Article

Enhancement of Photovoltaic Power Potential in China from 2010 to 2020: The Contribution of Air Pollution Control Policies

1
Key Laboratory of Regional Ecology and Environmental Change, School of Geography and Information Engineering, China University of Geosciences, Wuhan 430074, China
2
Innovation Academy for Precision Measurement Science and Technology, Chinese Academy of Sciences, Wuhan 430071, China
*
Author to whom correspondence should be addressed.
Remote Sens. 2023, 15(1), 228; https://doi.org/10.3390/rs15010228
Submission received: 6 December 2022 / Revised: 25 December 2022 / Accepted: 29 December 2022 / Published: 31 December 2022

Abstract

:
China is expected to have a total installed photovoltaic capacity of 1300 GW in 2050, accounting for 39% of the national electricity consumption. However, air pollutants consisting of gases and particulates have attenuation effects on the solar radiation reaching the photovoltaic panels. This work purports to assess the influence of air pollutants on the photovoltaic power potential. We calculated the hourly point-of-array irradiance (POAI) in China for 2010–2020 with a spatial resolution of 0.1° × 0.1° using the PV_LIB model and assessed the effect of air pollutants on POAI. The results indicated that the annual average POAI in China for 2010–2020 ranged from 118 to 286 Wm−2. The Air Pollution Control Action Plan (APPCAP) has played a certain role in photovoltaic power potential, and POAI has increased in areas where surface concentrations of air pollutants have declined. Especially in North China, the surface concentrations of CO, NO2, PM10, PM2.5, and SO2 decreased throughout the APPCAP period with −0.446, −4.985, −35.610, −30.700, and −26.251 μgm−3, respectively, corresponding to an increase in POAI of up to 4.917 Wm−2. The surface concentrations of CO, NO2, PM10, PM2.5, and SO2 were negatively correlated with POAI, with correlation coefficients of −0.764, −0.854, −0.204, −0.110, and −0.664, respectively. Surface concentrations of air pollutants (CO, NO2, PM10, PM2.5, and SO2) and clear-sky POAI in 2018 showed a High-Low clustering in Northeast China and North China. This study demonstrates the role of China’s air pollution control policy in enhancing photovoltaic power potential.

1. Introduction

To mitigate the risks and challenges posed by global warming, the 2016 Paris Agreement set a 2 °C goal [1,2,3]. As a renewable and clean energy source, solar photovoltaic power generation has been vigorously developed around the world, with a global installed photovoltaic capacity reaching 843086 MW in 2021 [4]. Photovoltaic power generation, as one of the most promising renewable energy sources, has an irreplaceable role in alleviating the challenge of global warming [5,6,7].
Despite the fact that the photovoltaic industry has great potential, previous studies have shown that factors such as climate change (e.g., solar radiation, temperature, clouds, etc.) [8,9,10], dust [11,12,13], aerosol [14,15], shading [16], and photovoltaic panel installation [17] have certain effects on solar photovoltaic power potential. Crook et al. [9] used the coupled ocean–atmosphere climate models HadGEM1 and HadCM3 to project climate data and then investigated the impact of temperature and solar radiation on concentrated solar power and photovoltaic production in the 21st century. They found that photovoltaic power generation in Europe and China will increase from 2010 to 2080. The production of concentrated solar power in Europe may increase by more than 10% during this time. Jerez et al. [10] assessed climate change impacts on photovoltaic power generation in Europe using the EURO-CORDEX high-resolution climate prediction ensemble and the photovoltaic power generation model. The results show a range of —14% to +2% variation in photovoltaic power generation by the end of the century relative to current climate conditions. Gaetani et al. [18] used the ECHAM5-HAM aerosol climate model and the photovoltaic system performance model to assess changes in photovoltaic energy productivity in Europe and Africa from 2000 to 2030. The results demonstrated that photovoltaic energy productivity was observed to decrease significantly by up to 7% in Eastern Europe and North Africa. Gutiérrez et al. [19] reveal the key role of aerosol forcing on photovoltaic power potential. Gutiérrez et al. [20] coupled aerosol-climate simulation to analyze the effects of aerosols on photovoltaic power generation over the Euro-Mediterranean region. The results show that aerosols cause 16% losses in annual photovoltaic power generation in the Netherlands. In summer, aerosols cause 20% losses in photovoltaic power generation in the African and Syrian-Iraqi regions.
As the leading photovoltaic-producing country, the installed photovoltaic capacity in China has grown from 1022 MW in 2010 to 306403 MW in 2021 [4], firmly ranking first in the world, and is expected to reach 400 GW by 2030 [21]. However, as a high-emitting country, aerosol emissions have caused a 20–25% decrease in POAI in the most polluted areas of China from 2003 to 2014 [22]. In the past decade, China has enacted many policies on pollution reduction [23,24], such as the Air Pollution Prevention and Control Action Plan released in 2013 [25] and the Three-Year Plan of Action to Win the Blue Sky Defense War released in 2018 [26]. Zhang and Yan [27] believe that one of the most direct co-benefits of photovoltaic development is the reduction in air pollution. Photovoltaic power generation plays a role in reducing pollutant emissions [28]. However, different pollutant emissions will also deplete the photovoltaic power potential. Sweerts et al. [29] estimated the loss of photovoltaic power potential in China due to air pollution from 1960 to 2015 using ground station observations of radiation. The results show that the annual average photovoltaic power potential in China declined by 11–15% from 1960 to 2015. However, the 119 radiation stations in China are relatively sparse. By contrast, the popular satellite-derived data provide spatially continuous observations on a global scale. Shi et al. [24] used surface observation data from the Chinese Ecosystem Research Network (CERN) and satellite observation data of CERES_SYN1deg_Ed4.1 to investigate the impacts of air pollution on the brightening of the variable surface in Eastern and Central China since 2013. They found that surface solar radiation in Eastern China shows an increasing trend of 0.70 to 1.16 Wm−2year−1 from 2014 to 2019. The decrease in aerosol radiative effect caused by strict control of air pollution is the dominant reason for the increase in surface solar radiation. Li et al. [22] estimated the impacts of aerosols and clouds on photovoltaic power generation in China from 2003 to 2014 using the PVLIB-Python model and CERES-SYN1deg satellite-derived data. They found that the annual average reduction in aerosol-induced photovoltaic power generation was over 20% in Eastern China. However, the spatial resolution of NASA CERES-SYN1deg is only 1° × 1°, and there are many uncertainties about the accuracy of the satellite data due to satellite variations, sensor calibration [30], and cloud screening [31]. Reanalysis data can fill this gap, such as the ERA5 reanalysis dataset, which can provide data with higher spatiotemporal resolution and is widely used in photovoltaic power potential estimation [32,33]. Otherwise, many recent studies have paid more attention to the effects of aerosols and clouds on photovoltaic power generation [22,24,34]. There are relatively few investigations on the impact of specific pollutants on the photovoltaic power potential.
On this foundation, we calculated the hourly solar radiation intercepted by photovoltaic panels (point-of-array irradiance, POAI) in China from 2010 to 2020 based on the PV_LIB model using ERA5 and ERA5-Land reanalysis data. Meanwhile, we calculated the POAI under both all-sky and clear-sky conditions and analyzed the temporal and spatial distribution of photovoltaic power potential in China. Then, the cloud effect on POAI was obtained using the clear-sky POAI minus the all-sky POAI. Finally, we used the CAQRA dataset to analyze the impact of six atmospheric pollutants on POAI. The results of this study are expected to help us understand the impact of pollution control policies on the potential of photovoltaic power generation in China.

2. Data Materials and Methods

2.1. Study Area

China is located at 3°51′N–53°33′N and 73°29′E–135°04′E, with a land area of about 9.63 million km2. China is a vast country with a complex topography and rich but spatially unevenly distributed solar energy resources. As shown in Figure 1, we have divided mainland China into nine different regions as follows: Northwest China (NWC), Inner Mongolia (IM), Northeast China (NEC), Qinghai-Tibet Plateau (QTP), Loess Plateau (LP), North China (NC), Sichuan Basin and Surrounding Regions (SBS), Middle-lower Yangtze Plain (MYP), Yunnan Plateau and Surrounding Regions (YPS), and Southern China (SC) [35].

2.2. Meteorological Data

The meteorological data utilized in our study are derived from the reanalysis datasets of the European Center for Medium-Range Weather Forecasts (ECMWF): the fifth-generation of European Reanalysis (ERA5) and the land component of the fifth-generation of European Reanalysis (ERA5-Land). ERA5 replaces ERA-Interim having an advanced assimilation system and parametric scheme with higher temporal and spatial resolution. ERA5 provides a great number of global estimates of atmospheric, ocean waves, and land-surface parameters at a frequency of up to 1 h with 0.25° × 0.25° resolution [36]. ERA5-Land is an enhanced global dataset generated from ERA5 land components and synchronized with the monthly updates of ERA5. ERA5-Land provides 50 variables to describe water and energy cycles over the global land surface at an hourly temporal resolution, with an improved spatial resolution of 0.1° × 0.1° relative to ERA5 [37]. The ERA5 and ERA5-Land data used in this study are freely available from the Copernicus Climate Data Store (CDS), and specific information on each variable is given in Table 1.

2.3. Air Pollutant Data

Detailed information on the air pollutant data used in this study is described by Kong et al. [38]. The air pollutants data were obtained from the high-resolution Chinese Air Quality Reanalysis (CAQRA) dataset for the years 2013–2018. CAQRA contains six conventional air pollutants: CO, NO2, O3, PM10, PM2.5, and SO2, with 15 × 15 km spatial resolution. CAQRA is based on the China National Environmental Monitoring Center (CNEMC) assimilation surface observations. Hourly data for CAQRA can be found at https://doi.org/10.11922/sciencedb.00053 accessed on 28 December 2022, monthly and annual average data can be found at https://doi.org/10.11922/sciencedb.00092 accessed on 28 December 2022, and all data can be downloaded for free.

2.4. Elevation Data

The elevation data utilized in our study were obtained from the Global Multi-resolution Terrain Elevation Data (GMTED2010) co-developed by the U.S. Geological Survey (USGS) and the National Geospatial-Intelligence Agency (NGA) [39]. GMTED2010 is available in 30 arc-second, 15 arc-second, and 7.5 arc-second spatial resolutions, the spatial resolution of the data used in this study is 30 arc-seconds. As shown in Table 1, the elevation data will be input into the solar photovoltaic system performance model to calculate the POAI.

3. Methods

3.1. Solar Photovoltaic System Performance Model—PV_LIB

The solar photovoltaic system performance model used in this study is the open-source model PV_LIB developed by Sandia National Laboratories [40]. The meteorological and elevation data were input into the PV_LIB model to calculate the hourly POAI (Wm−2), which was performed by the PV_LIB 1.4 Release version of MATLAB’s PVLIB_Toobox. The model can be found in PV Performance Modeling Collaborative | PV_LIB Toolbox for MatLab (sandia.gov). The detailed information of all the input data for the PV_LIB model in this study is shown in Table 1. In order to unify the spatial resolution, all input data were resampled to 0.1° × 0.1° by using a cubic convolution method. In this study, the POAI was calculated separately for both all-sky and clear-sky conditions, and the cloud effect on POAI was obtained using the clear-sky POAI minus the all-sky POAI. There are three types of tracking systems for photovoltaic panels, including fixed-tilt, one-axis tracking system, and two-axis tracking system. Although tracking systems can improve the efficiency of photovoltaic systems, they also have more complex mechanisms and higher costs [41]. The fixed-tilt system is the most widely used installation method because of its simpler operation and lower cost, and its ability to adapt to different installation environments [42]. In order to adapt to the complex installation situation in China, this study calculated the POAI of the fixed-tilt system. As China is in the Northern hemisphere, we set the photovoltaic panel azimuth to be south (180°). The tilt angle of the panel is approximated as the latitude of the panel location.
POAI is the solar radiation reaching the plane of the photovoltaic array and consists of three main components, which are calculated in the PV_LIB model as follows:
P O A I = E b e a m + E g r o u n d + E s k y
where E b e a m is the POAI beam component, E g r o u n d is the POAI ground reflection component, and E s k y is the POAI sky scattering component.
The POAI beam component ( E b e a m ) is obtained from the direct normal irradiance after an angular transformation and is calculated as follows:
E b e a m = D N I × c o s A O I
where DNI is the direct normal irradiance, the clear-sky and all-sky DNI input to the model are the CDIR and FDIR in Table 1, respectively, and AOI (angle of incidence) is the angle between the solar incident light and the photovoltaic panel.
The AOI is calculated as follows:
A O I = c o s 1 c o s θ Z c o s θ T + s i n θ Z s i n θ T c o s θ A θ A , a r r a y
where θ A and θ Z are the solar azimuth and zenith angles, respectively. θ T and θ A , a r r a y are the tilt angle and azimuth angles of the photovoltaic array, respectively.
The POAI ground reflection component ( E g r o u n d ) is the irradiance that reaches the photovoltaic panel after ground reflection and E g r o u n d is calculated as follows:
E g r o u n d = G H I × a l b e d o × 1 c o s θ T , s u r f 2
where G H I is the global horizontal irradiance, the clear-sky and all-sky G H I of the input model are SSRDC and SSRD in Table 1, respectively, a l b e d o is the surface albedo (FAL in Table 1), and θ T , s u r f is the tilt angle of the photovoltaic panel surface.
The POAI sky scattering component ( E s k y ) is the irradiance that diffuses through the sky and reaches the photovoltaic panel. It is usually divided into three components: the isotropic component, the circum-solar diffuse component, and the horizon brightening component. This study uses an isotropic sky diffuse model [43,44,45] to calculate E s k y as follows:
E s k y = D H I × 1 + c o s θ T 2
where D H I is diffuse horizontal irradiance, the other symbols have the same meaning as above.

3.2. Statistical Method

In this study, two non-parametric methods, the Mann–Kendal trend test (MK) and Sen’s slope method, were used to calculate the spatial and temporal trends of POAI from 2010 to 2020. The Mann–Kendall statistical test is a non-parametric rank-based method for testing the significance of trends [46,47,48]. The Mann–Kendall statistic S for the time series X1, X2, X3, …, and Xk is defined as:
S = m = 1 k 1 n = m + 1 k s g n X n X m
s g n X n X m = 1 , X n X m < 0 0 , X n X m = 0 1 , X n X m > 0
where S is the variance of the statistic, X m and X n are the consecutive data values of the timeseries over time m and n , and k is the amount of data. A positive value of S indicates an increasing trend in the time series, a negative value indicates a decreasing trend, and a zero value indicates no trend.
The variance of S is calculated as follows:
V a r S = k k 1 2 k + 5 / 18
The standardized test statistic Z M K is calculated as follows:
Z M K = S     1 V a r S , S > 0 0 , S = 0 S   +   1 V a r S , S < 0
where a positive value of Z M K indicates an increasing trend, a negative value indicates a decreasing trend, and a zero value indicates no trend. Absolute values of Z M K greater than 1.65, 1.96, and 2.58 indicate that the trend of the time series passed the 90%, 95%, and 99% significance tests, respectively.
Sen’s slope method is a non-parametric procedure for estimating the slope of a trend in data using a linear model [49,50]. The slope Q i is calculated for all data pairs as follows:
Q i = x j x k j k , i = 1 , 2 , N , j > k
where there are n values in the time series, N is the number of slope estimates, and x k and x j are the values of the time series at times k and j . When there is only one set of time series N = n n 1 / 2 ; when there are multiple sets of time series N < n n 1 / 2 .
The Sen’s slope is the median of all slopes Q i and the median Q m e d is calculated as follows:
Q m e d = Q N + 1 2 , i f   N   i s   o d d Q N 2   +   Q N + 2 2 2 , i f   N   i s   e v e n

3.3. Bivariate Mora Index

Bivariate-based spatial autocorrelation has high applicability and effectiveness in describing the spatial association and dependency characteristics of two geographic elements. In this study, the global bivariate Moran Index and the local bivariate Moran Index (bivariate LISA, local indicators of spatial association) were used to explore the spatial association characteristics between POAI and air pollutants. A specific description of the bivariate Moran Index was given in the previous article [51,52]. The calculation process of the global and local bivariate Moran Index is implemented by GeoDa (http://geodacenter.github.io/ accessed on 28 December 2022).

4. Results

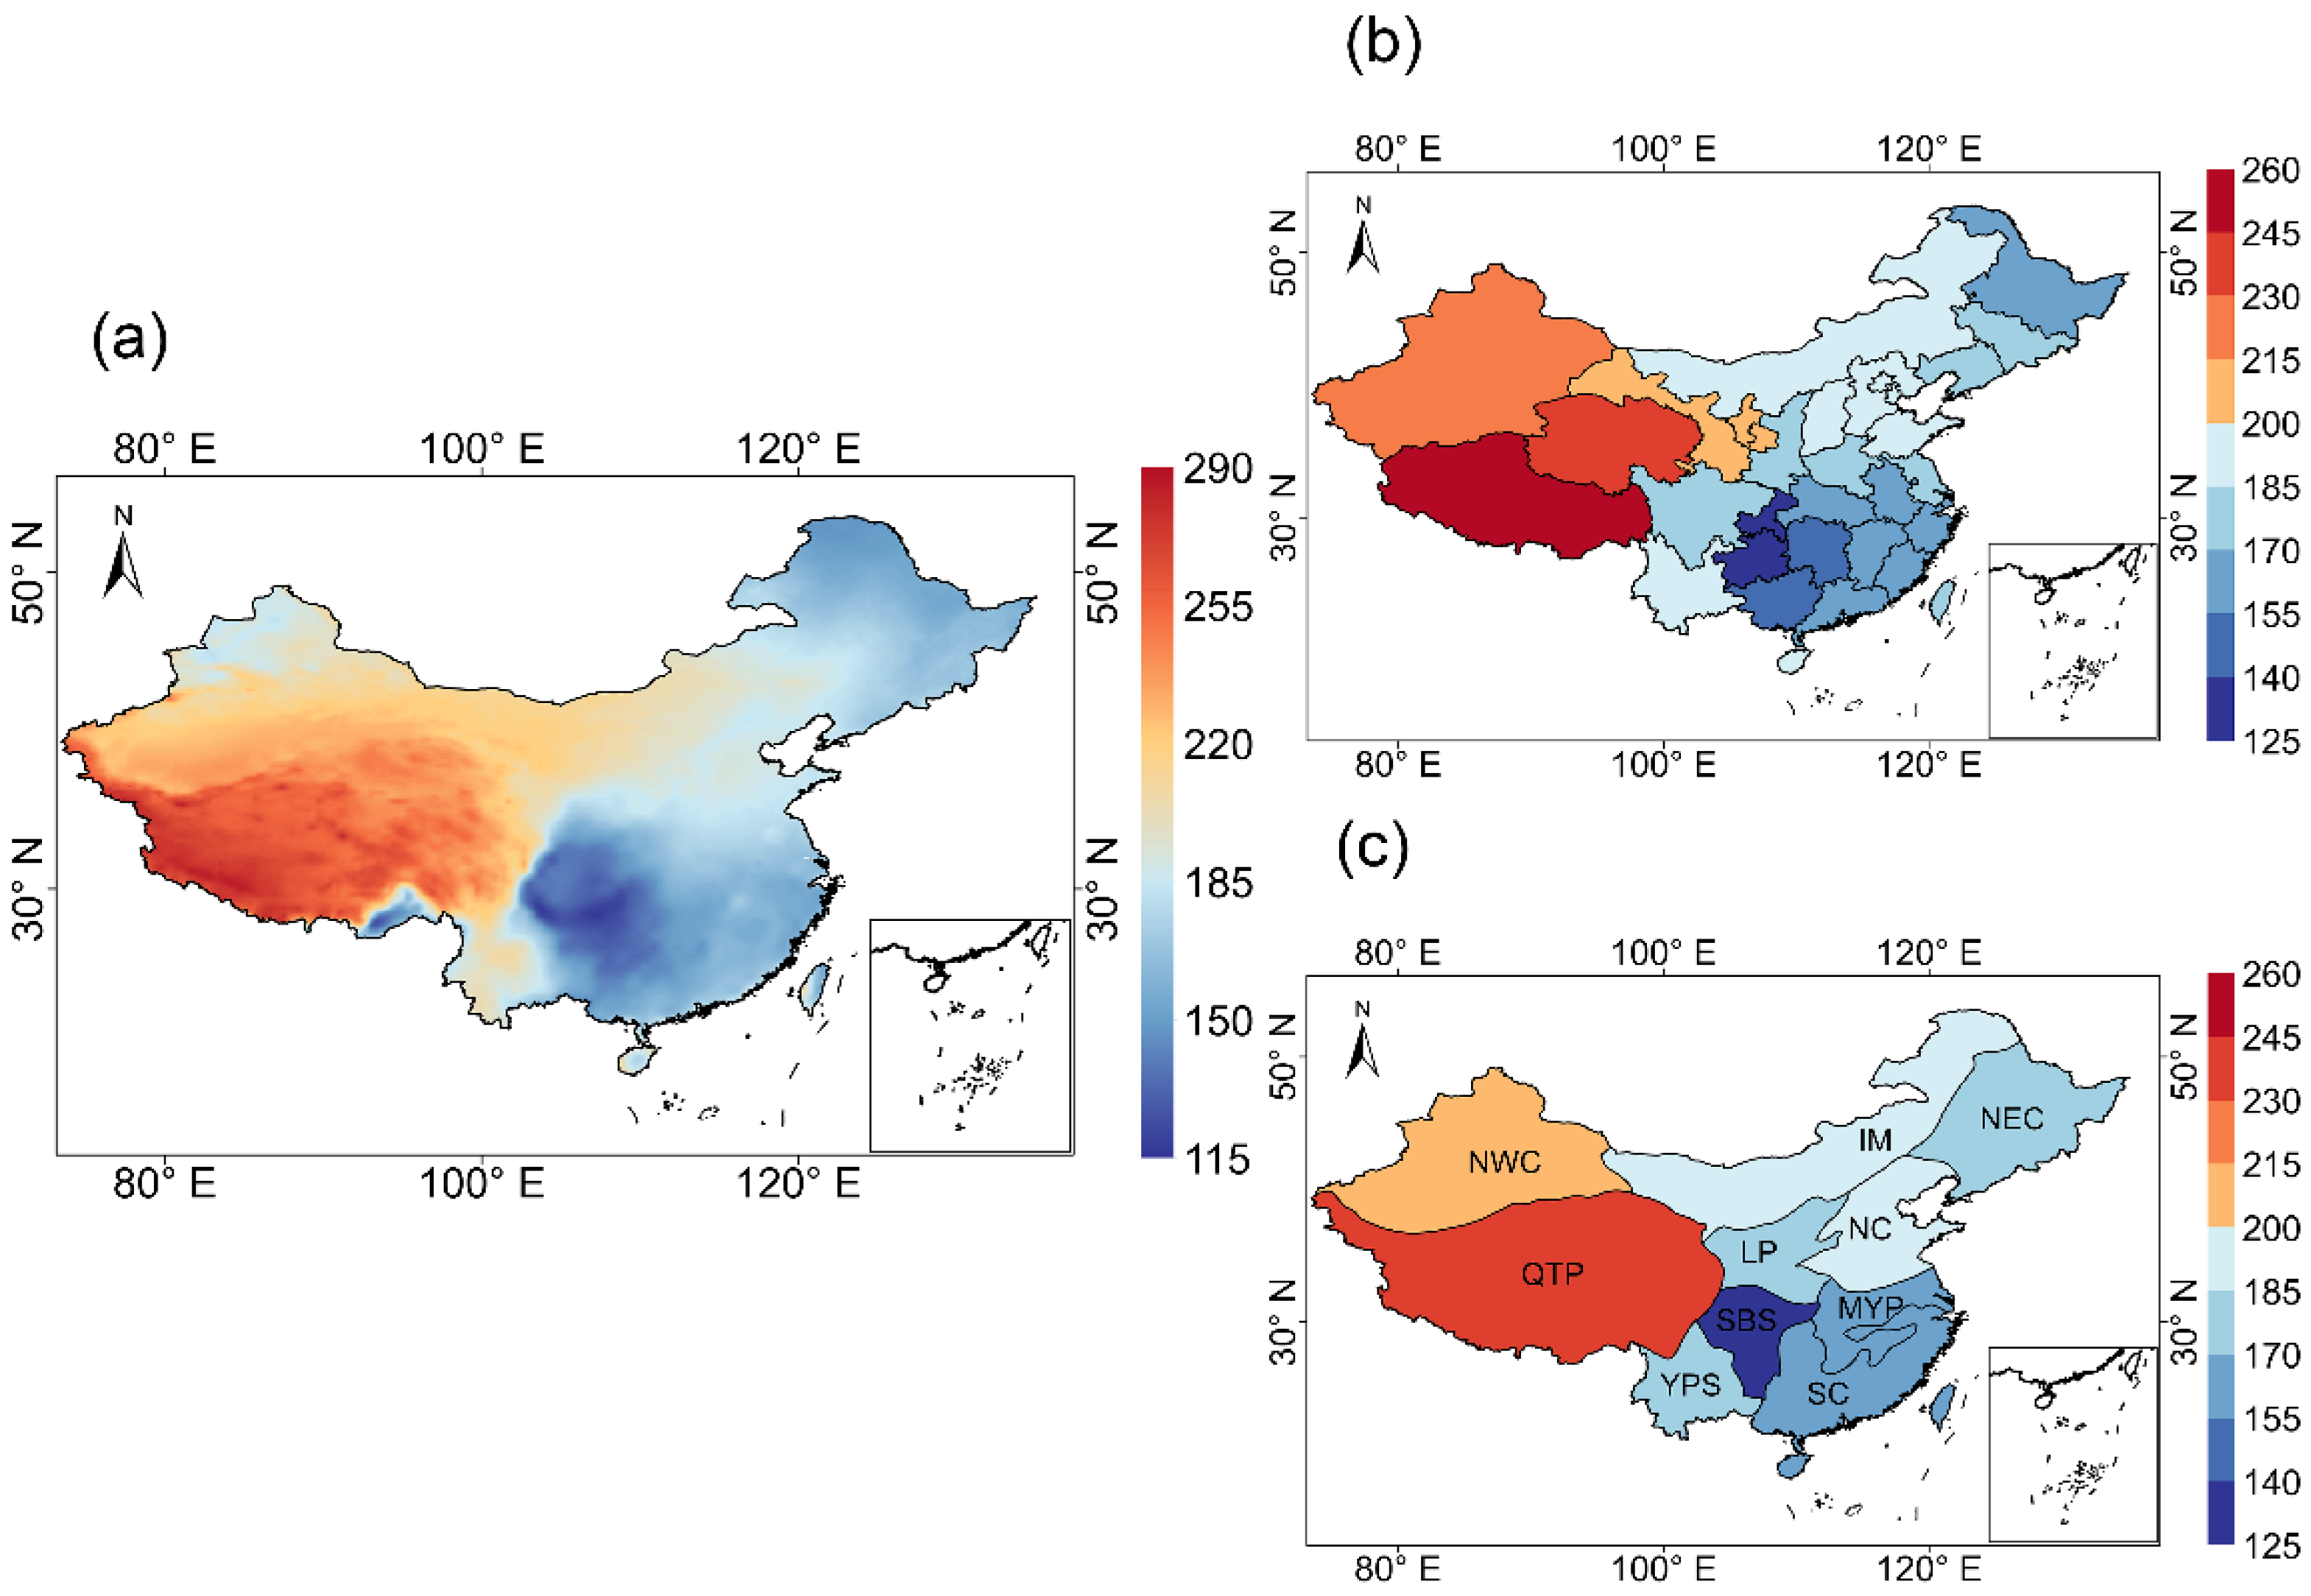
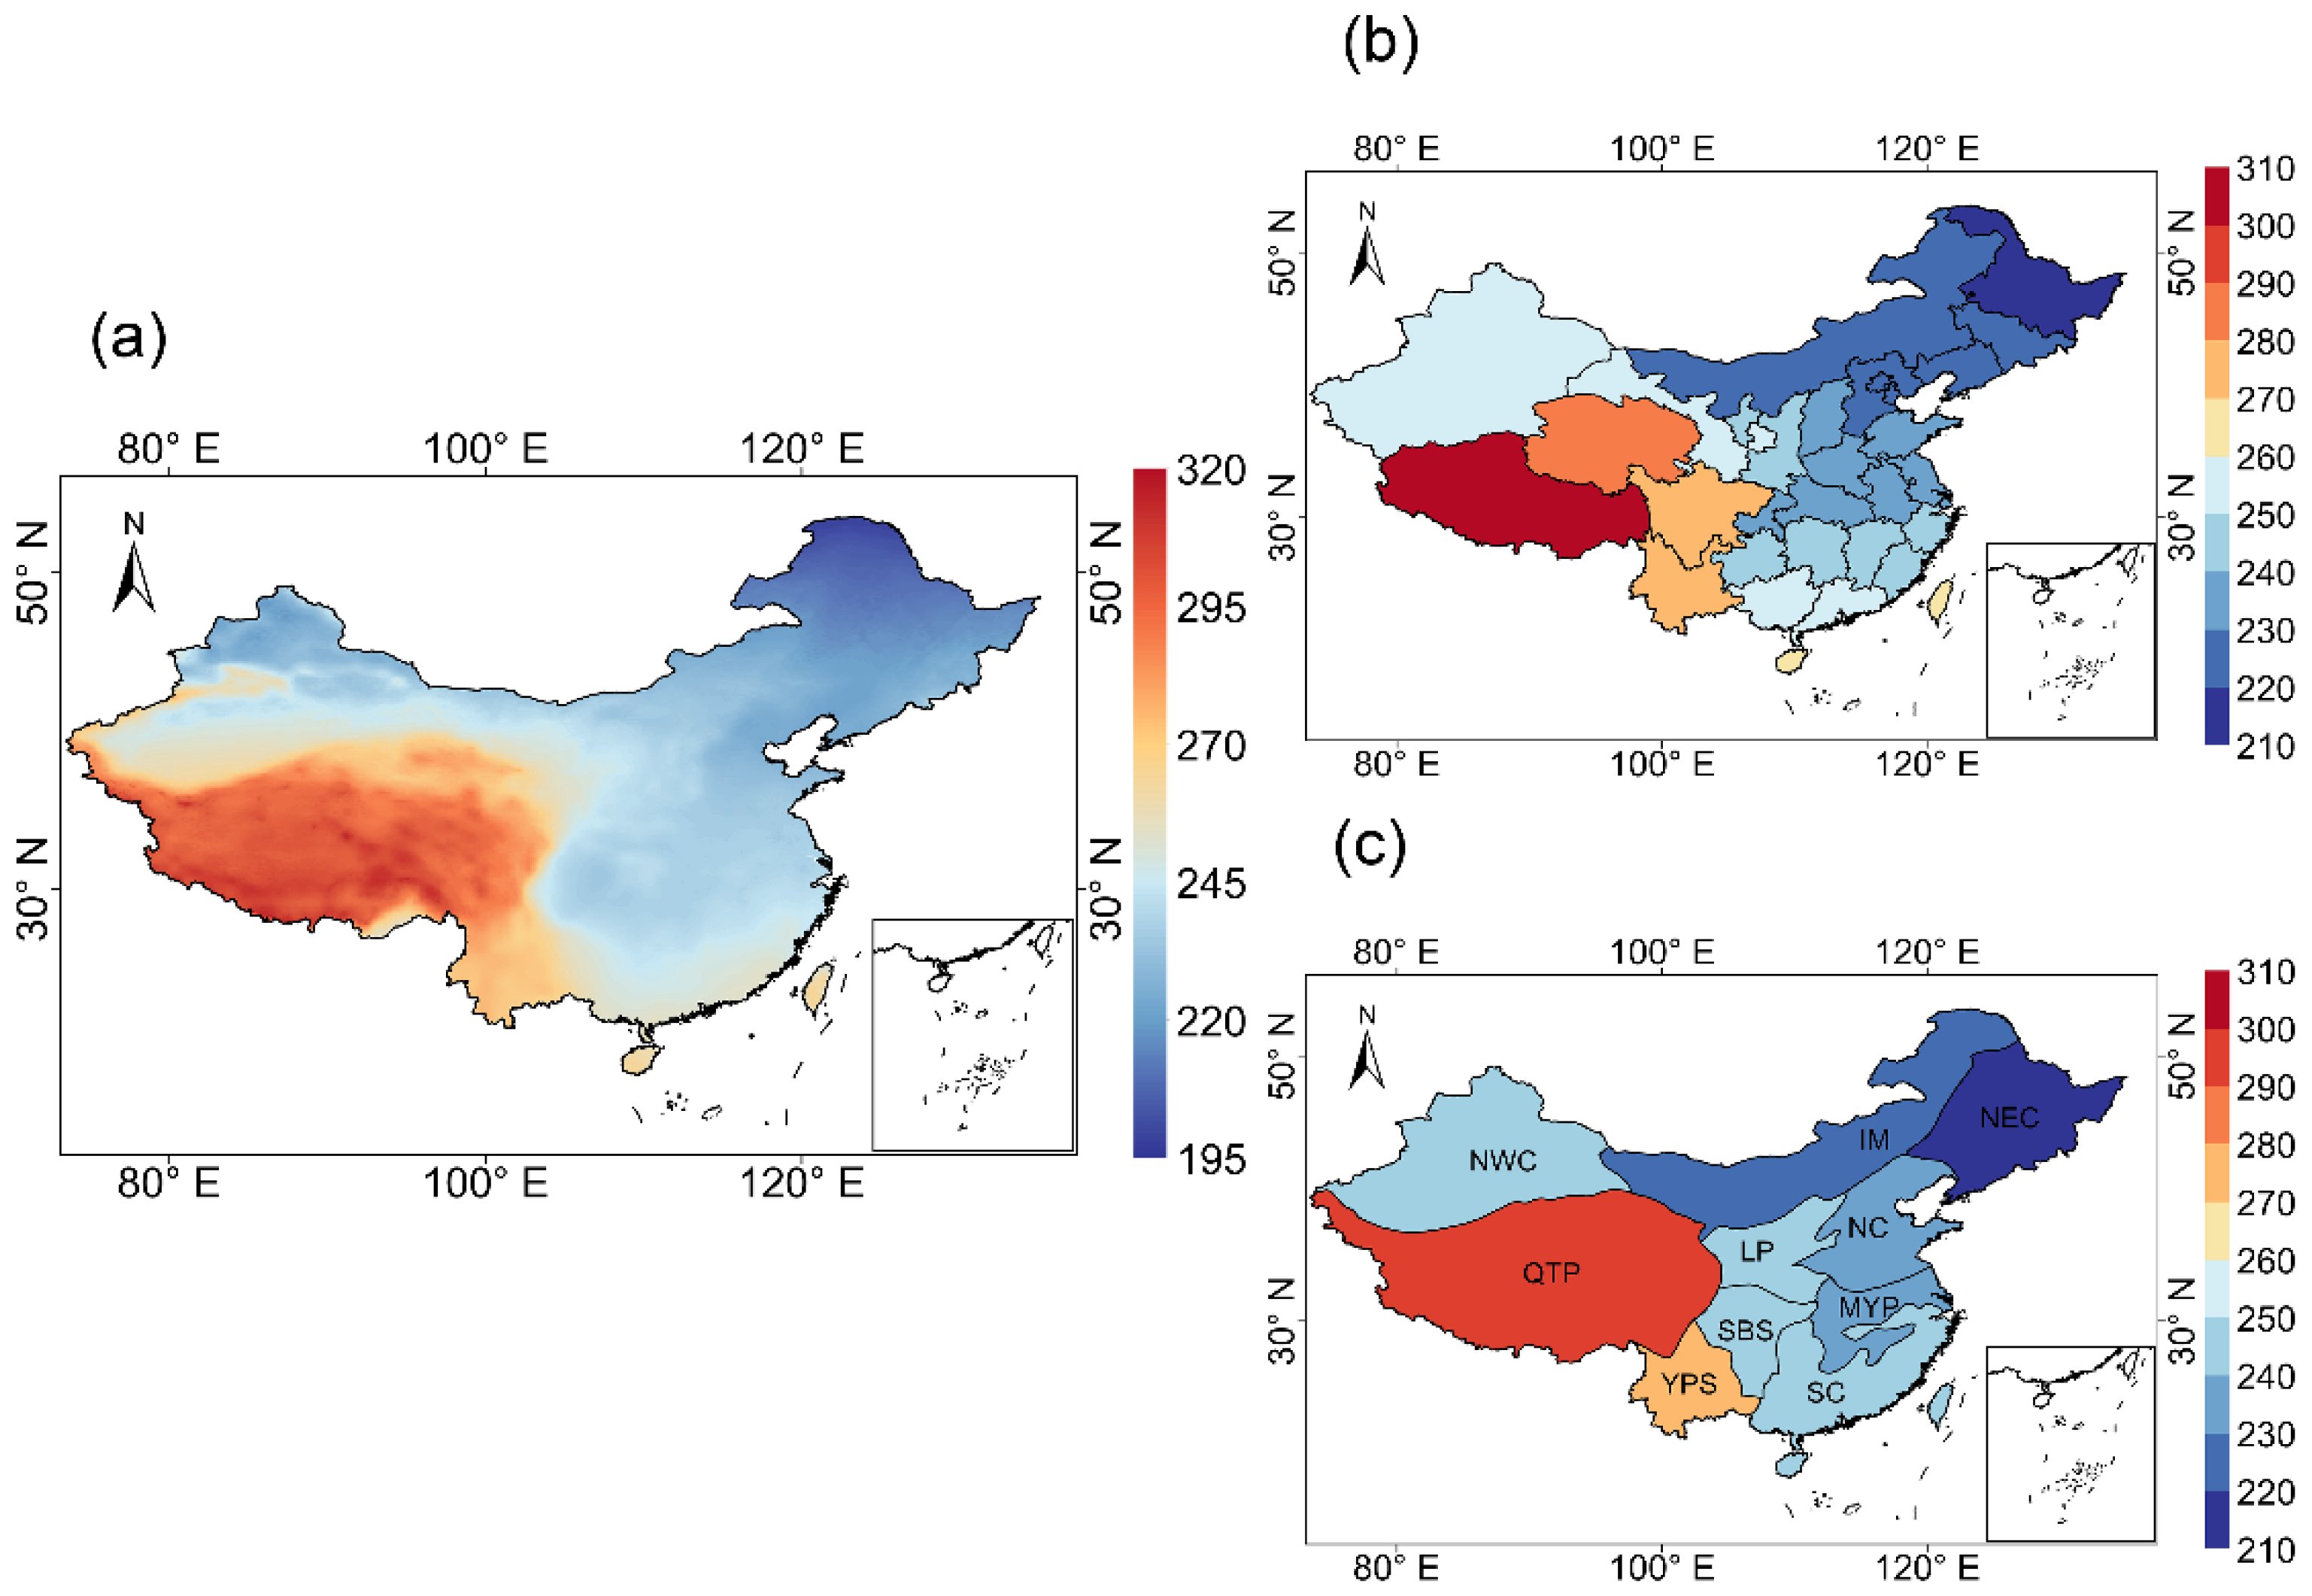
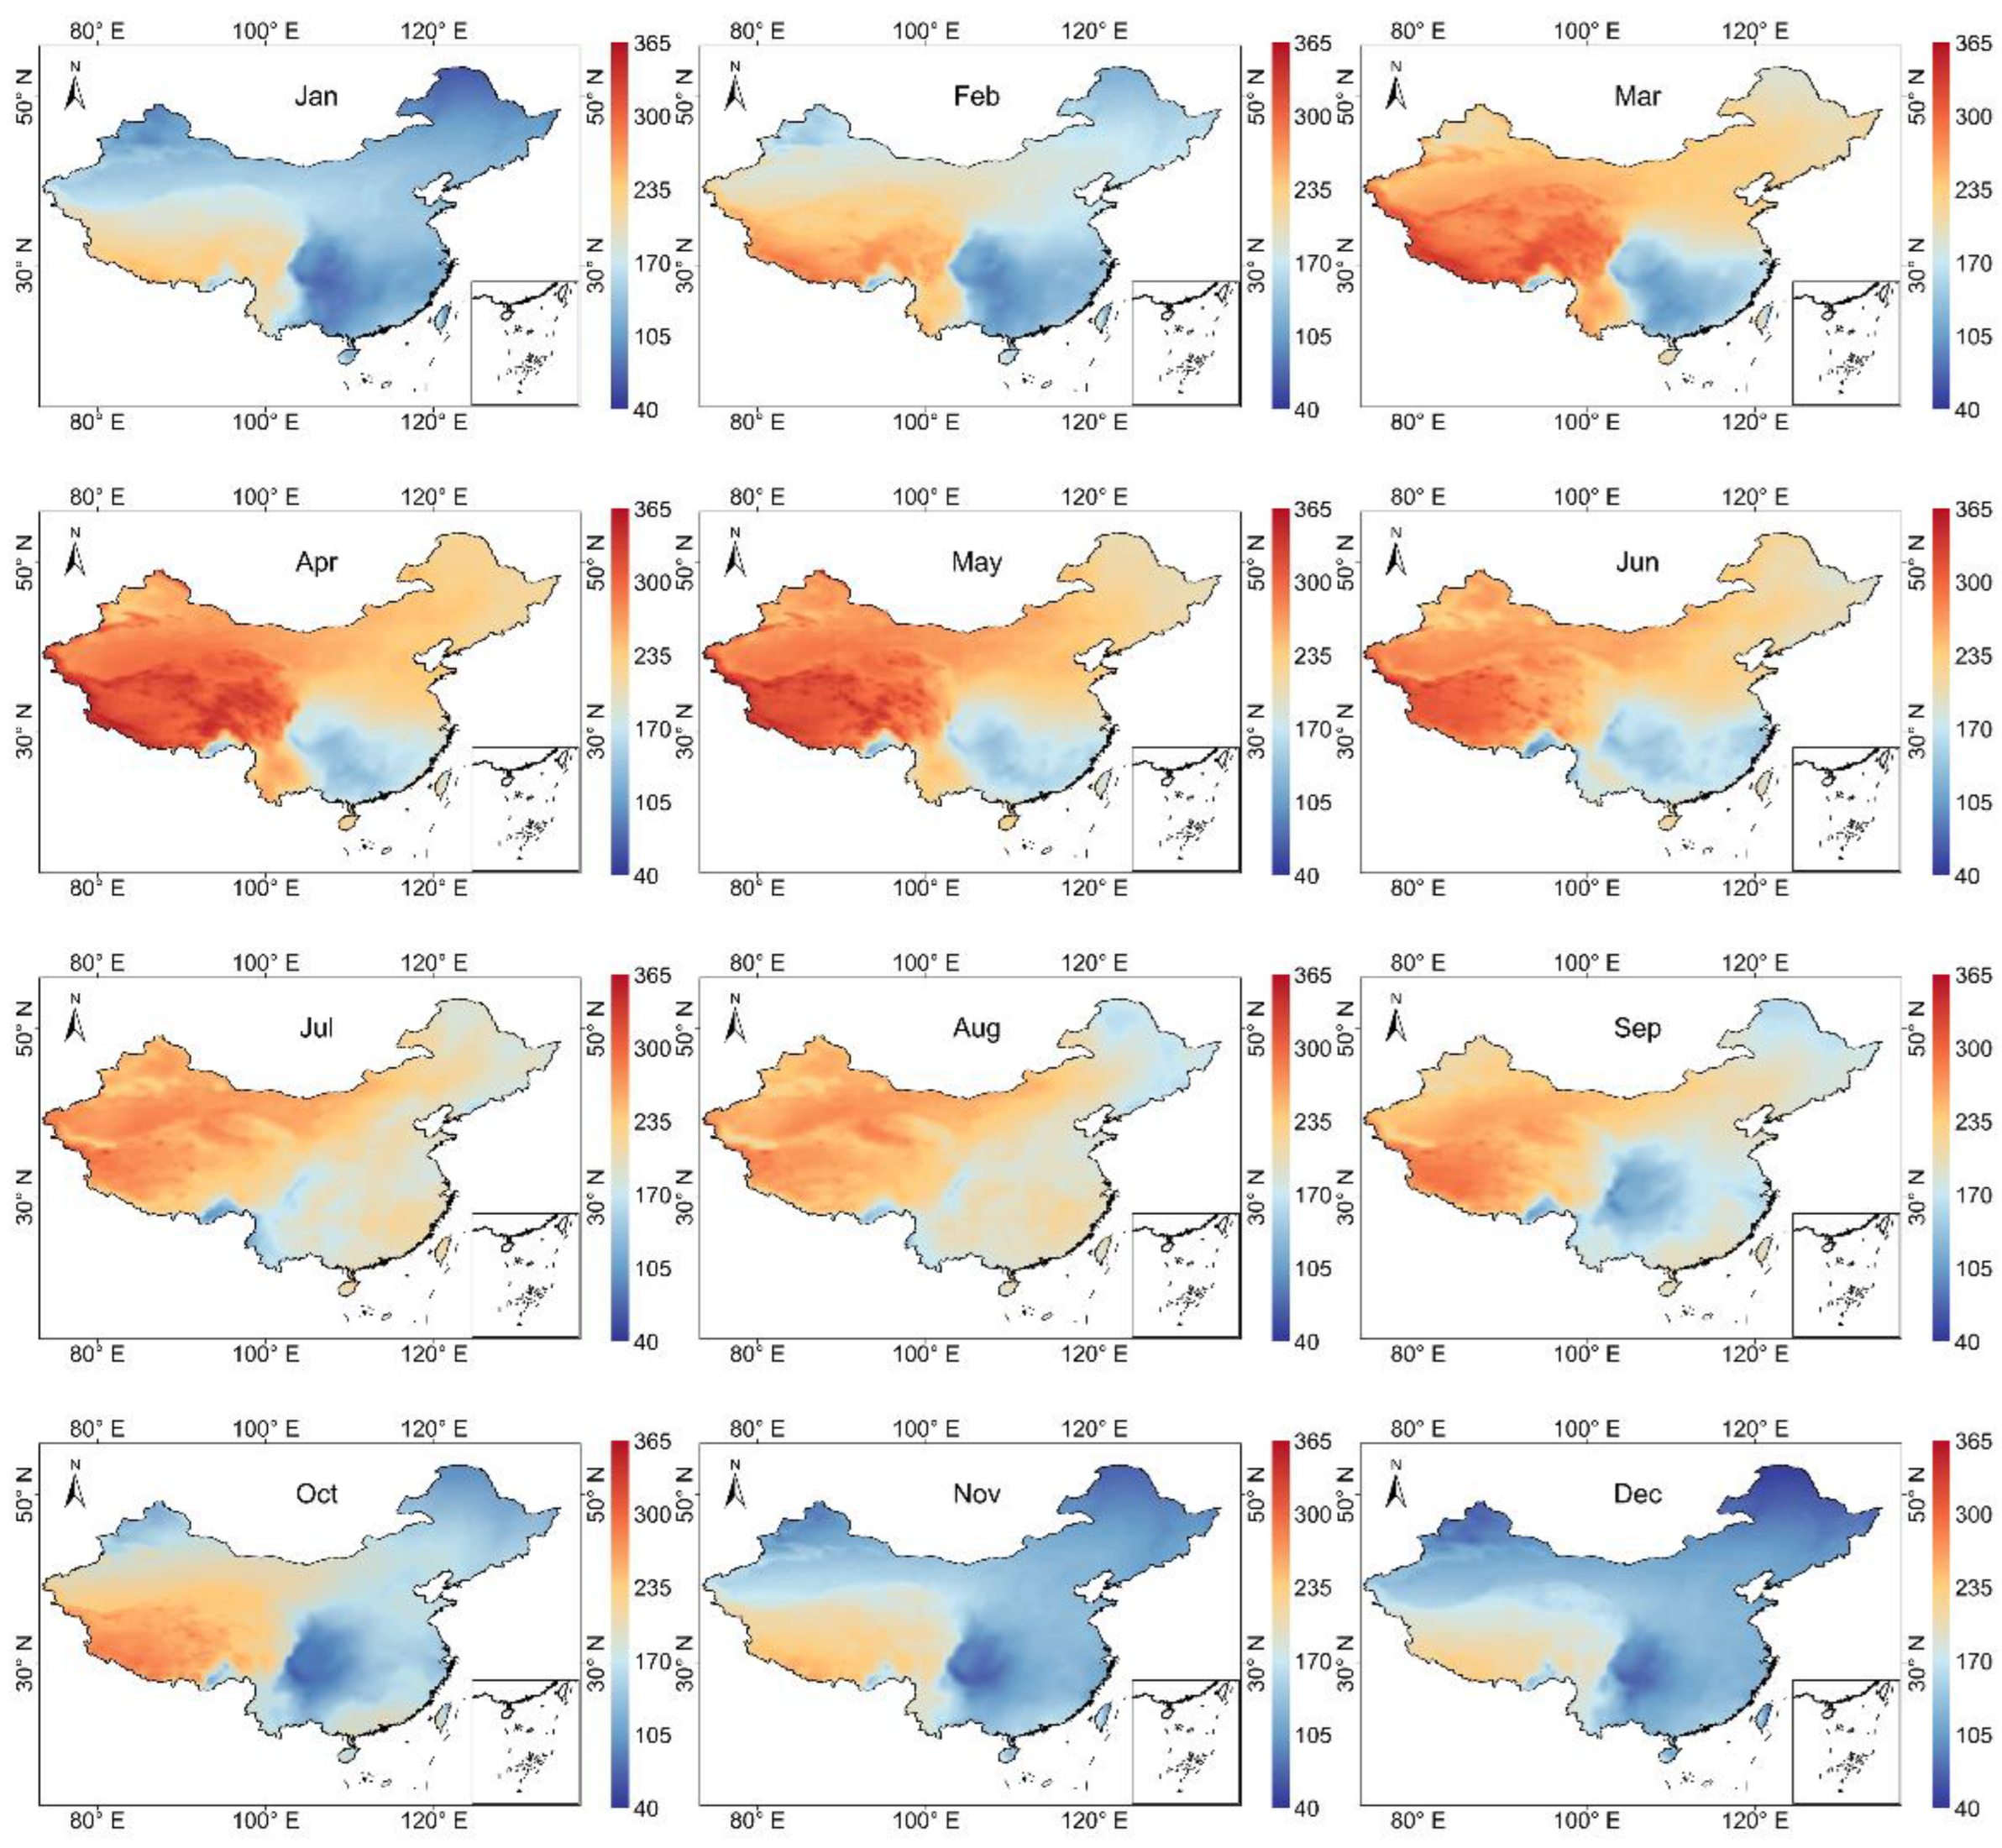
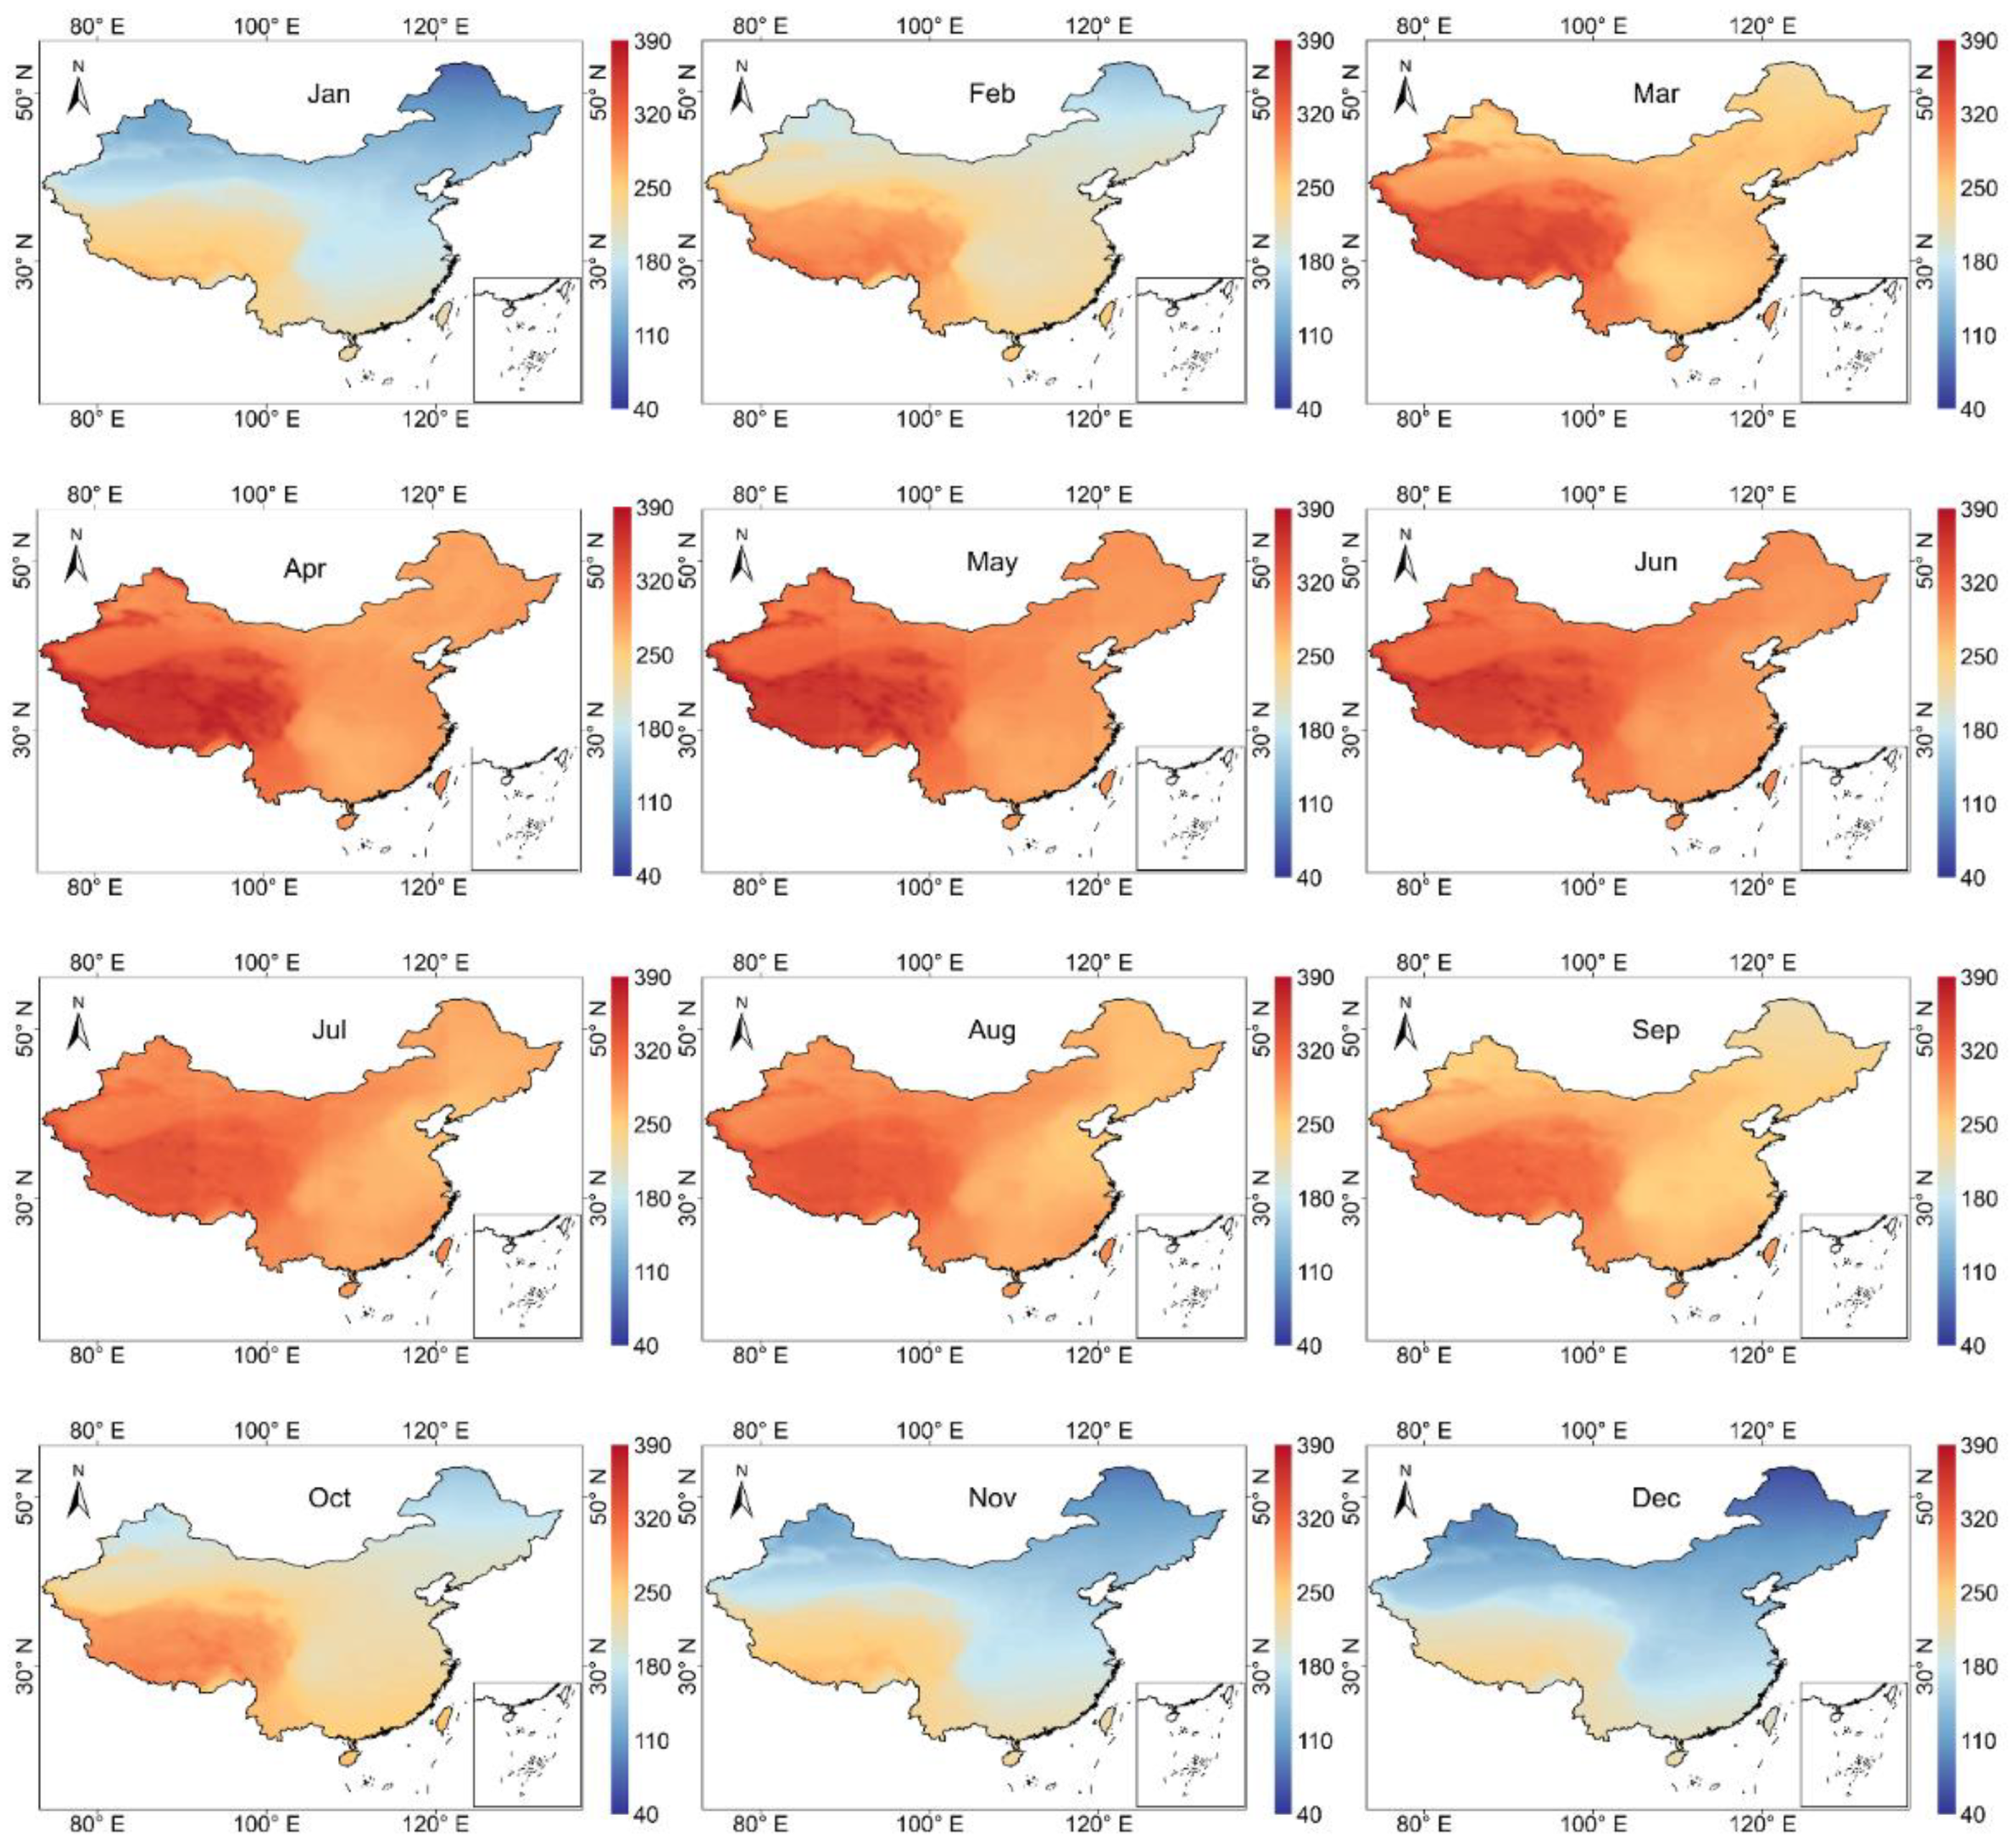
4.1. Photovoltaic Power Potential in China

Figure 2a shows the spatial distribution of the annual average POAI in China from 2010 to 2020. The annual average POAI in China ranged from 118 to 286 Wm−2. The POAI showed a decreasing trend from western to eastern China. Figure 2b,c exhibited the annual average POAI distribution of each province and each geographical subdivision in China, respectively. The highest POAI was found in QTP (245 Wm−2) and Tibetan province (253 Wm−2) due to the high atmospheric transparency, weak radiation attenuation and low anthropogenic emissions on the Qinghai-Tibet Plateau [53]. The POAI was lowest in SBS (135 Wm−2) and Chongqing provinces (134 Wm−2) owing to the strong radiation attenuation effect caused by sufficient water vapor, frequent cloud occurrence, and abundant precipitation there [54].
The spatial distribution of the annual average POAI under clear-sky conditions is shown in Figure 3. The clear-sky POAI ranged from 193 to 321 Wm−2, with the highest values in QTP (295 Wm−2) and Tibet Province (304 Wm−2). However, unlike the all-sky POAI, the lowest clear-sky POAI was in NEC (217 Wm−2) and Heilongjiang Province (211 Wm−2). Northeast China, Northern Xinjiang, and the Northern part of Inner Mongolia are located at higher latitudes, with relatively smaller solar altitude angles, shorter sunshine hours, and less solar radiation received by the surface [35,54]. As shown in Figure 4 and Figure 5, the monthly average values of POAI in China under both all-sky and clear-sky conditions gradually increase from January to May and decrease from June to December. The monthly average POAI values were higher in April (247 Wm−2), May (243 Wm−2), and June (228 Wm−2) but lower in November (148 Wm−2), December (133 Wm−2), and January (147 Wm−2). The monthly average of clear-sky POAI was highest in May (307 Wm−2) and lowest in December (161 Wm−2).
Figure 2, Figure 3, Figure 4 and Figure 5 indicated that clouds have an attenuating effect on solar radiation, and the effect of clouds on POAI was obtained by calculating the difference between clear-sky POAI and all-sky POAI. The attenuation effect of clouds on POAI is higher in summer (24%) than that in winter (19%), which is most obvious in both SBS and MYP regions. The clouds caused a decrease in the annual average POAI of about 21%. The provincial average POAI decreased by about 27%. The provinces where POAI decreased by clouds more were Guizhou (46%) and Chongqing (43%), and less were Xinjiang (13%) and Tibet (17%). Clouds caused an average reduction in POAI of approximately 26% across the geographic divisions, with the strongest attenuation effect of 44% in SBS, followed by 37% in SC, and weaker cloud effects in NWC, IM, and QTP of 13%, 16%, and 17%, respectively.
Figure 6 illustrates the temporal trend of POAI from 2010 to 2020. The results show that the annual average POAI of China declined at a rate of -0.266 Wm−2year−1 from 2010 to 2020. The POAI showed an increasing trend of up to 1.423 Wm−2year−1 in IM, Southeast SC, Northeast NC, Southern NEC, Western NWC, Western QTP, and Western YPS. Among them, POAI showed a significant increasing trend (passed the 90% significance test) in Taiwan Province, Eastern Guangdong Province, Southern Liaoning Province, Northern Inner Mongolia, and Western Xinjiang Province. The decreasing trend of POAI is mainly distributed in Northern NEC, Northern IM, Southern NC, LP, SBS, MYP, Eastern QTP, Eastern YPS, and Northern SC, up to a maximum of -1.859 Wm−2year−1. There was a significant decreasing trend (passed the 90% significance test) in Northwestern NEC, Southern NC, Eastern MYP, Northeastern SC, Northern SBS, Southeastern and Northwestern LP, Eastern QTP, and Northern NWC. In regions such as North China and the Southeast coast, POAI shows an increasing trend, mainly due to the successful implementation of the air pollution policy in China.

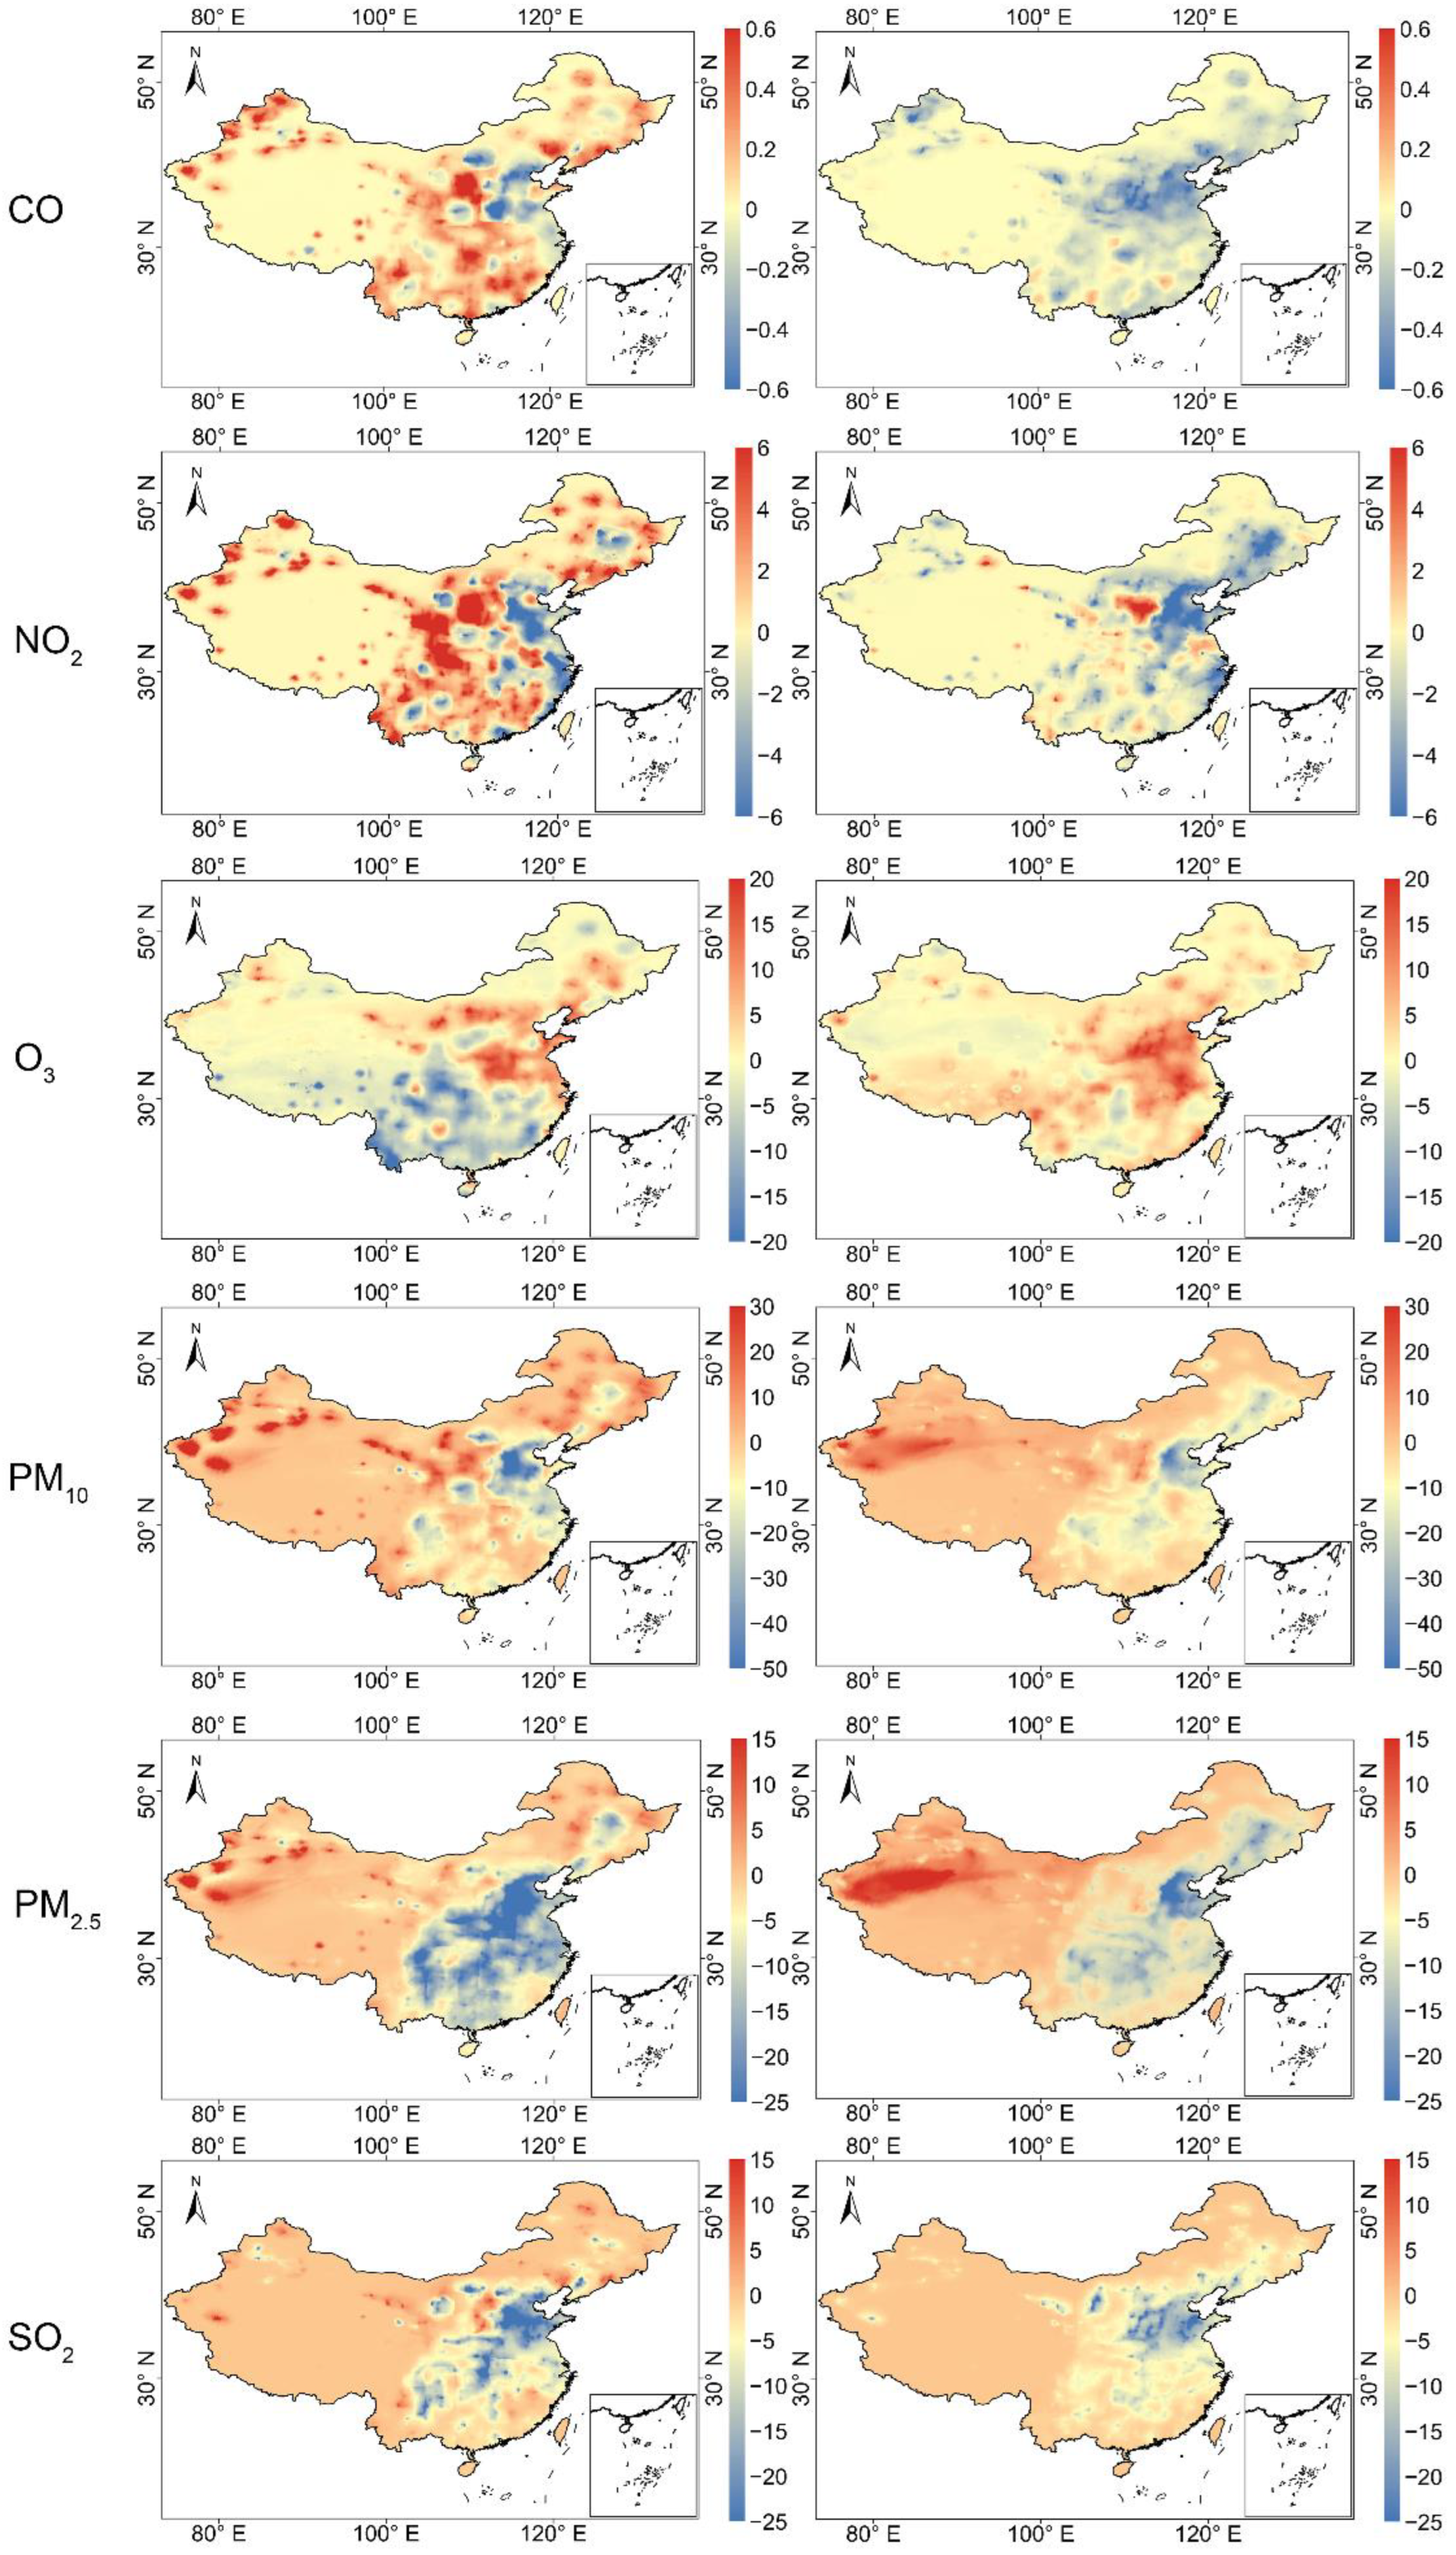
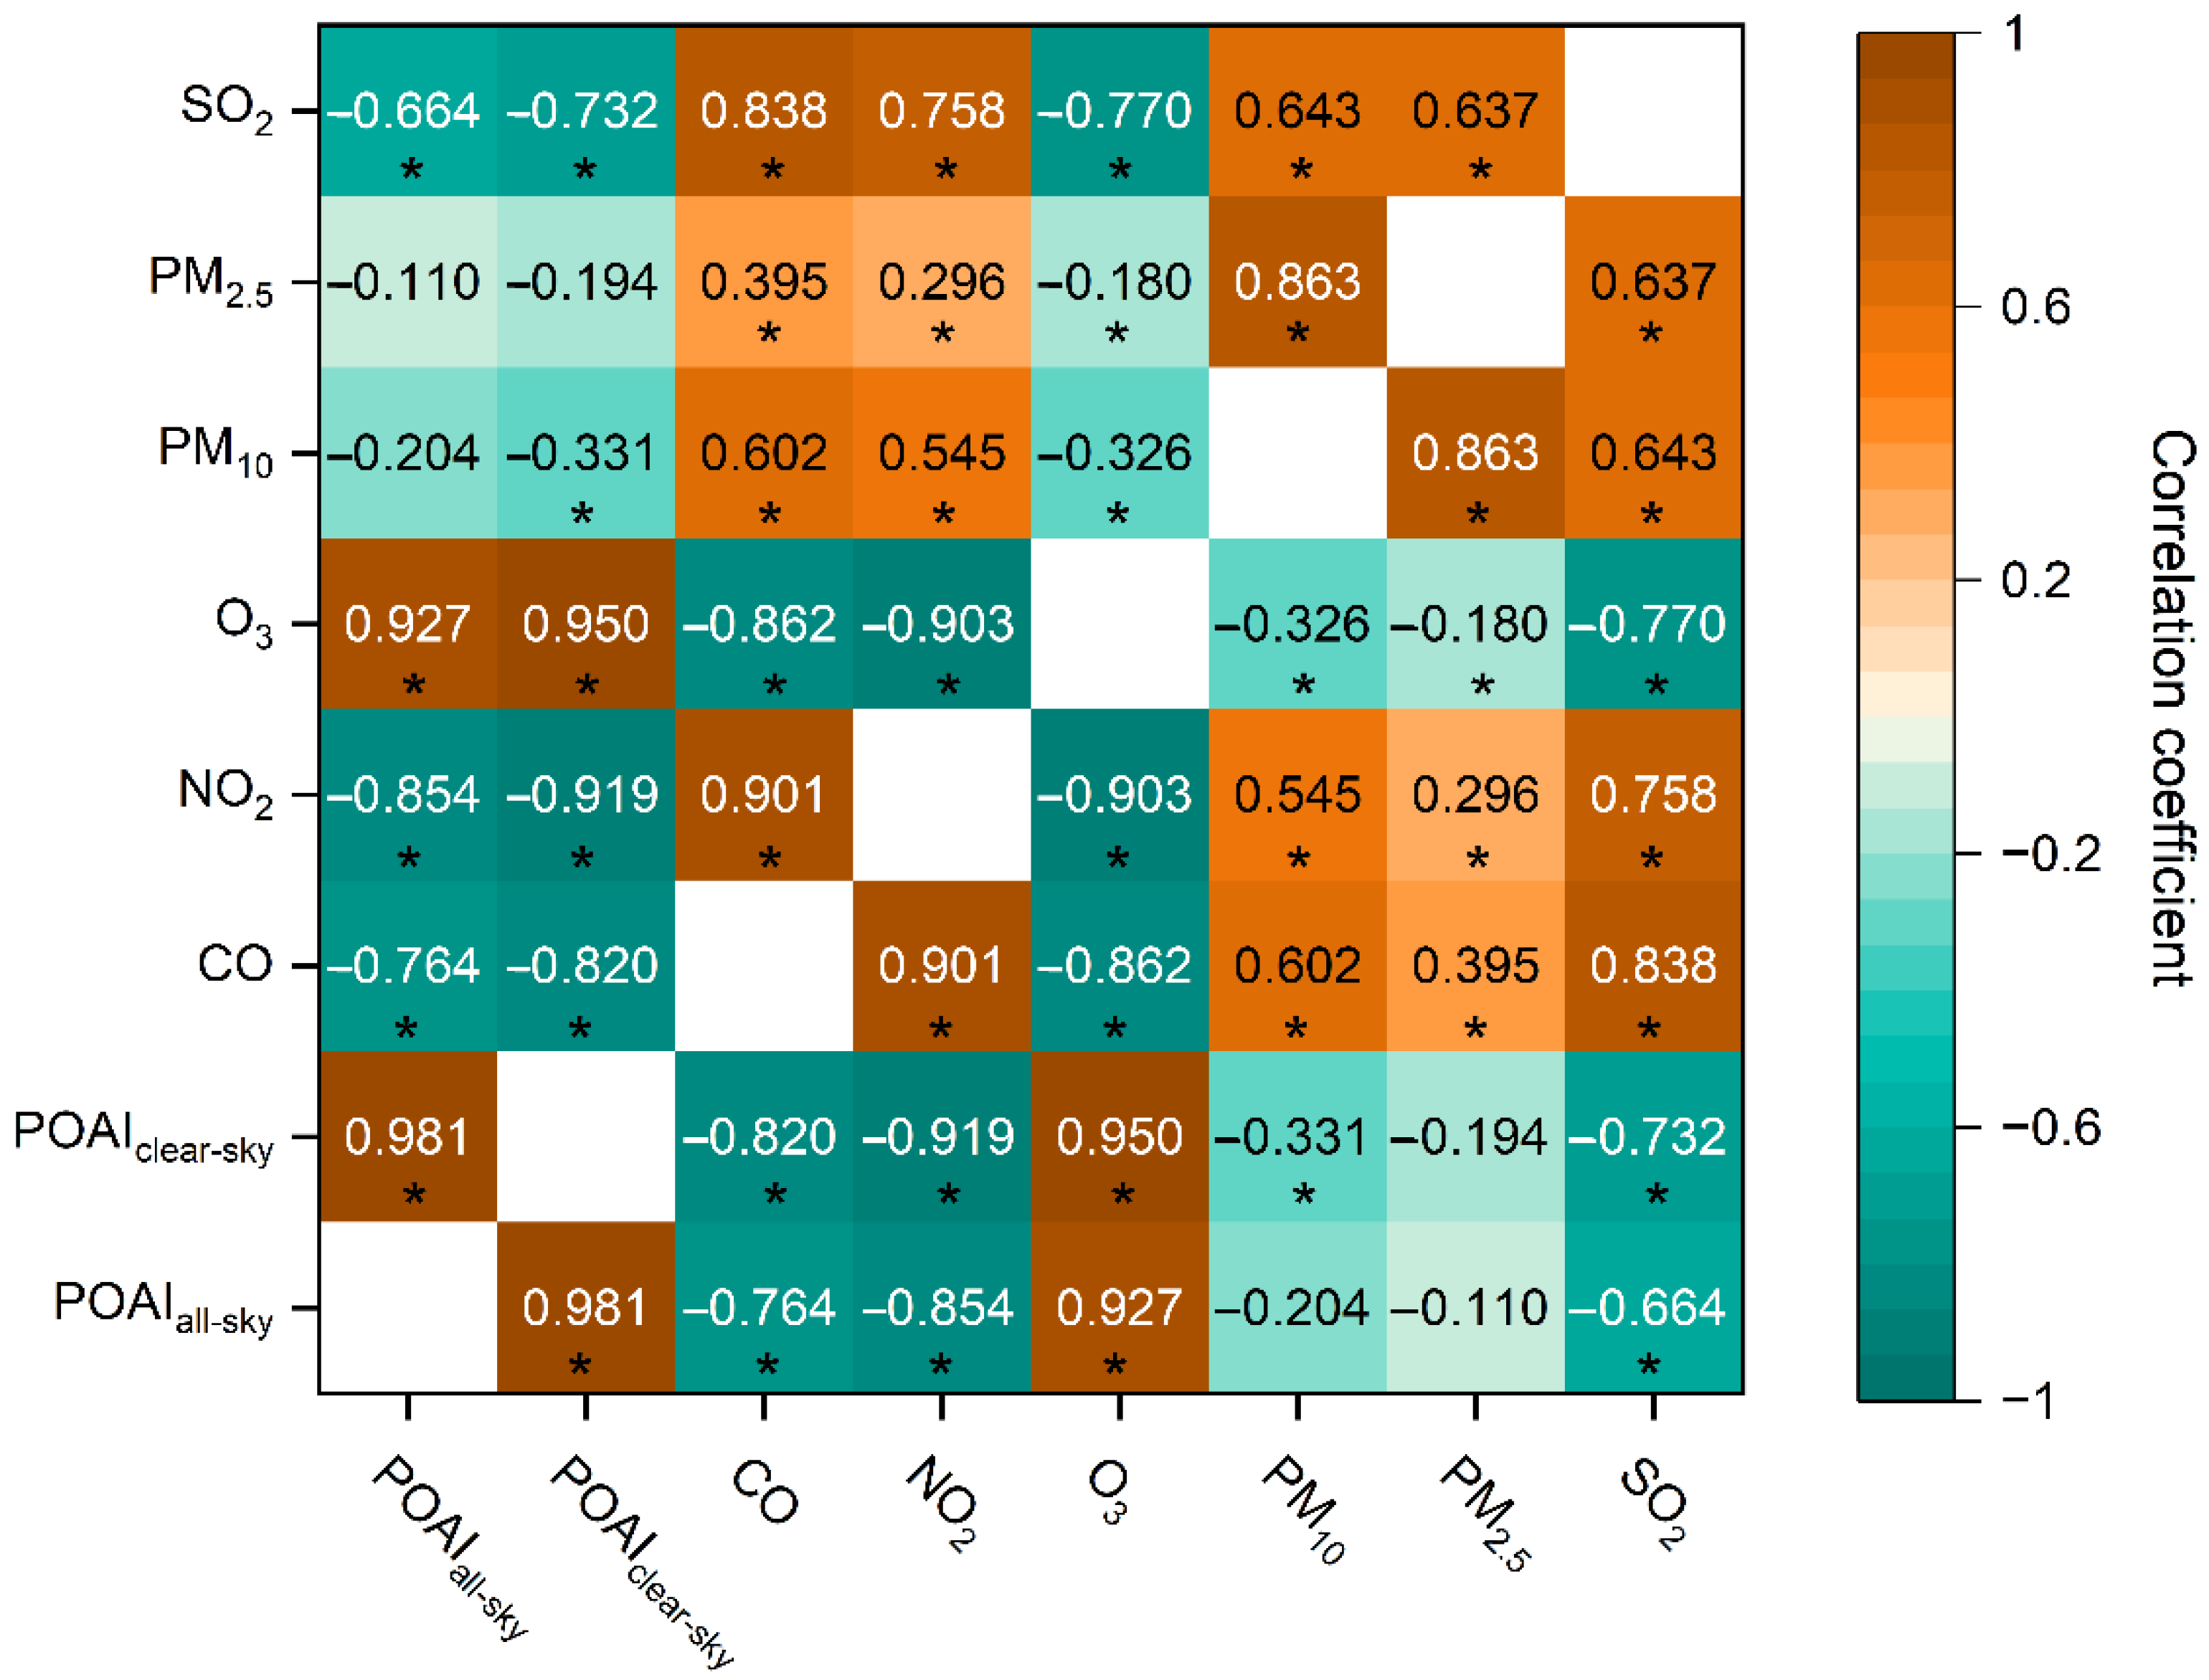
4.2. The Impact of Air Pollutants on Photovoltaic Power Potential

Figure 7 shows the monthly average changes in POAI and six atmospheric pollutants’ surface concentrations in China from 2013 to 2018. There is a decreasing trend in POAI for all-sky and clear-sky conditions in China from 2013 to 2018, with average rates of decline at −0.178 and −0.141 Wm−2month−1, respectively. The surface concentrations of CO, PM10, PM2.5, and SO2 exhibited a decreasing trend during 2013–2018, with average rates of decrease of −0.001, −0.780, −0.224, and −0.077 μgm−3 month−1, respectively. While the surface concentrations of NO2 and O3 showed an overall increasing trend from 2013–2018, with average rates of increase of 0.008 and 0.017 μgm−3 month−1, respectively. The POAI in all-sky and clear-sky conditions showed a decreasing trend during 2013–2016 and a slight recovery in 2016–2018. The surface concentrations of CO showed an increasing trend during 2013–2015 and an increasing trend from 2015 to 2018, while O3 was the opposite. The surface concentrations of NO2 showed an increasing trend from 2013 to 2017 and started to decrease in 2017–2018. The surface concentrations of PM10, PM2.5, and SO2 declined rapidly from 2013 to 2018. The downward trend in surface concentrations of CO, NO2, PM10, PM2.5, and SO2 in these six years is mainly attributed to Chinese emission reduction measures in recent years. In particular, PM10, PM2.5, and SO2, which are the three key elements of the Air Pollution Prevention and Control Action Plan, showed significant decreasing trends in recent years.
The Air Pollution Prevention and Control Action Plan (APPCAP) has been implemented since September 10, 2013. We classify the period before 2013 as PIP (the pre-implementation phase of APPCAP), 2014–2017 as OP (the ongoing phase of APPCAP), and after 2018 as PCP (the post-completion phase of APPCAP). Figure 8 shows the changes in POAI in China during the Air Pollution Control Action Plan. The left column of Figure 8 shows the change in annual mean POAI for OP relative to PIP, and the right column shows the change in annual mean POAI for PCP relative to PIP. The all-sky POAI in OP reveals a significant decrease compared to PIP in Southeast China, with a maximum decrease of −13.843 Wm−2, while in Hainan Province, Taiwan Province, and Northeast China, there is a significant increase of up to 10.484 Wm−2. The clear-sky and all-sky trends are similar, but there is a marked increase in Northwest China up to 3.308 Wm−2, and the significant decrease is still in Southeast China, with a maximum drop of −5.254 Wm−2. The POAI in PCP increased overall relative to PIP, with a significant increase in all-sky POAI in Yunnan and Southeast China, up to 9.330 Wm−2, and a slight decrease in Northeast and Southwest China, with a maximum decrease of −10.758 Wm−2. The clear-sky POAI shows a significant increase in the Tibetan Plateau region of up to 3.753 Wm−2 and a slight decrease in the Northeast and Northern Xinjiang, with a maximum decrease of −3.542 Wm−2. Figure 9 shows the variations in the six air pollutants’ surface concentrations in China during the APPCAP period. The implementation of the APPCAP has been very successful. NC is the largest and most dynamic economic region in China, with developed industry and more serious pollution emissions. The surface concentrations of CO, NO2, PM10, PM2.5, and SO2 have decreased significantly in NC during the APPCAP period, −0.446, −4.985, −35.610, −30.700, and −26.251 μgm−3, respectively, while POAI has increased in NC area up to 4.917 Wm−2. Therefore, we find that POAI increases in areas where the surface concentration of air pollutants decreases. The implementation of an emission reduction plan can reduce the emission of air pollutants, thus providing a certain improvement to the solar photovoltaic power potential. The implementation of the emission reduction plan enhances more photovoltaic power potential in areas with high pollution emissions.
As shown in Figure 10, the surface concentrations of CO, NO2, PM10, PM2.5, and SO2 are negatively correlated with POAI, with correlation coefficients of −0.764, −0.854, −0.204, −0.110 and −0.664, respectively. O3 surface concentrations are positively correlated with POAI with a correlation coefficient of 0.927. Surface concentrations of atmospheric pollutants are more strongly correlated with clear-sky POAI, with O3 being the most strongly correlated with POAI and PM2.5 being the least correlated with POAI. Table 2 shows the global bivariate Moran index of air pollutant concentration and clear-sky POAI from 2013 to 2018. The O3 surface concentration is significantly positively spatially correlated with the clear-sky POAI, while the CO, NO2, PM10, PM2.5, and SO2 surface concentrations are significantly negatively spatially correlated with clear-sky POAI. The above results are consistent with the results in Figure 10.
In this study, the bivariate local Moran indices of surface concentrations among six atmospheric pollutants and clear-sky POAI were calculated as an example for 2018, and the results are shown in Figure 11. The HH (High-High) and LL (Low-Low) clusters represent positive correlations between surface concentrations of air pollutants and clear-sky POAI, while the HL (High-Low) and LH (Low-High) clusters represent negative correlations between surface concentrations of air pollutants and clear-sky POAI. Surface concentrations of CO, NO2, PM10, PM2.5, and SO2 with respect to clear-sky POAI show an HL clustering in Central and Southern NEC, Central NC, Central IM, Central SBS, and Northern MYP, where high air pollutant surface concentration values are surrounded by low clear-sky POAI values. These areas have a high level of industrial development and are densely populated with many vehicles, and the relatively high level of industrial pollution and anthropogenic emissions makes the POAI low. It means that in regions where socio-economic development plays a dominant role, the reduction of air pollutant emissions can contribute to enhancing photovoltaic power potential. The LH clustering is in QTP and parts of YPS, where the land is sparsely populated, the industry is less developed, emissions are lower, air pollution is not as severe as in the east, and photovoltaic power potential is higher. As for HH clustering, it is found in the Eastern and Western parts of YPS. The surface concentration of air pollutants is relatively high in these places due to more developed industries. However, these places are mainly influenced by natural factors. The lower latitude makes solar resources abundant while being located in the Yunnan-Guizhou plateau; the high atmospheric transmittance and the weakened solar radiation led to higher POAI. The Northern NWC, Northern IM, and Northern NEC are clustered in LL, where clear-sky POAI is mainly influenced by latitude, and the surface concentration of atmospheric pollutants is not high in these areas. The difference is that O3 and clear-sky POAI show HL clustering in NC and a small part of Central IM, LH clustering in the southwest part of YPS, and LL clustering in Northern NWC, Northern IM, the central part of SBS, and NEC. The surface concentration of O3 and clear-sky POAI are HH clustering on the Tibetan Plateau due to the attenuating effect of O3 mainly on UV radiation; however, UV radiation is only a small fraction of solar radiation. Therefore, the higher O3 surface concentration of QTP does not cause a large attenuation of POAI. The above bivariate spatial correlation results coincide with the results in Figure 2 and Figure 10, and Table 2 in the previous sections of this paper. As Figure 9 shows, the photovoltaic power potential is low in areas with high concentrations of atmospheric pollutants and increases as atmospheric pollutant emissions are reduced (Figure 8 and Figure 9).

5. Conclusions

In this study, the hourly POAI under clear-sky and all-sky conditions in China during 2010–2020 was estimated with a spatial resolution of 0.1° × 0.1° using the PV_LIB model. Then, the spatial and temporal distribution of all-sky and clear-sky POAI in China from 2010 to 2020 was investigated. Finally, the effect of air pollutants on POAI was revealed using the Air Quality Reanalysis dataset.
The POAI in China exhibits a decreasing spatial distribution trend from west to east between 118 and 286 Wm−2. The POAI was relatively higher in April, May, and June but lower in November, December, and January. The annual average POAI in China from 2010 to 2020 shows a decreasing trend, with average rates of decline of -0.266 Wm−2year−1. The POAI shows an increasing trend of up to 1.423 Wm−2year−1 in IM, Southeastern SC, Northeastern NC, Southern NEC, Western NWC, Western QTP, and Western YPS. The annual average POAI caused by clouds decreased by about 21%, and the provincial average POAI decreased by about 27%. The attenuation effect of clouds on POAI is higher in summer (24%) than that in winter (19%). The cloud had the strongest attenuation effect on POAI at SBS, with 44%.
The implementation of the Air Pollution Prevention and Control Action Plan has played a certain role in enhancing the photovoltaic power potential. For example, in the industrially developed areas, such as North China, CO, NO2, PM10, PM2.5, and SO2 surface concentrations showed significant decreases during the Air Pollution Prevention and Control Action Plan period of −0.446, −4.985, −35.610, −30.700, and −26.251 μgm−3, corresponding to an increase in POAI of up to 4.917 Wm−2, respectively. The surface concentrations of CO, NO2, PM10, PM2.5, and SO2 were spatially negatively correlated with POAI, with correlation coefficients of −0.764, −0.854, −0.204, −0.110, and −0.664, respectively. The surface concentrations of air pollutants (CO, NO2, PM10, PM2.5, and SO2) and clear-sky POAI show a HL clustering in Central and Southern NEC, NC, Central IM, Central SBS, and Northern MYP. Photovoltaic power potential is lower in areas with higher concentrations of atmospheric pollutants, and as air pollutant emissions decrease, photovoltaic power potential in these areas will increase. With the development of the photovoltaic industry, thermal power generation will gradually be replaced, and emissions from burning fossil fuels will be reduced. The reduction in surface concentrations of air pollutants will, in turn, have a positive effect on photovoltaic power potential, creating a virtuous circle. The results of this study show the distribution of photovoltaic power potential in China and preliminarily explore the impact of atmospheric pollutants on photovoltaic power potential. However, this study lacks an internal rationale for the impact of atmospheric pollutants on photovoltaic power potential, and we will conduct further research on this in the future.

Author Contributions

Y.Z. and W.Q. designed the research; Y.Z. performed the experiments and analyzed the data; Y.Z. wrote the manuscript; W.Q., L.W., C.Y., X.S. and J.W. revised the manuscript. All authors have read and agreed to the published version of the manuscript.

Funding

This work was financially supported by the National Natural Science Foundation of China (No. 42001016).

Data Availability Statement

The data presented in this study are available on request from the corresponding author. The ERA5-land (ERA5 hourly data on single levels from 1959 to present (copernicus.eu), last access: 25 March 2021), ERA5-single (ERA5-Land hourly data from 1950 to present (copernicus.eu), last access: 9 September 2021), and high-resolution Chinese Air Quality Reanalysis (CAQRA) (https://doi.org/10.11922/sciencedb.00092, last access: 29 May 2022) data used in this study are freely available.

Acknowledgments

We would like to thank the European Centre for Medium-Range Weather Forecasts for providing the ERA5 and ERA5-Land datasets, the U.S. Geological Survey (USGS) and the National Geospatial-Intelligence Agency (NGA) for providing the GMTED2010 dataset, and Kong, Lei for providing the high-resolution Chinese Air Quality Reanalysis (CAQRA) dataset.

Conflicts of Interest

The authors declare no conflict of interest.

References

  1. UNFCCC. The Paris Agreement. Available online: http://unfccc.int/files/essential_background/convention/application/pdf/english_paris_agreement.pdf (accessed on 11 August 2022).
  2. Li, Y.; Kalnay, E.; Motesharrei, S.; Rivas, J.; Kucharski, F.; Kirk-Davidoff, D.; Bach, E.; Zeng, N. Climate model shows large-scale wind and solar farms in the Sahara increase rain and vegetation. Science 2018, 361, 1019–1022. [Google Scholar] [CrossRef] [Green Version]
  3. Welsby, D.; Price, J.; Pye, S.; Ekins, P. Unextractable fossil fuels in a 1.5 °C world. Nature 2021, 597, 230–234. [Google Scholar] [CrossRef] [PubMed]
  4. IRENA. Renewable Capacity Statistics 2022; The International Renewable Energy Agency: Dhabi, Abu, 2022. [Google Scholar]
  5. Aman, M.M.; Solangi, K.H.; Hossain, M.S.; Badarudin, A.; Jasmon, G.B.; Mokhlis, H.; Bakar, A.H.A.; Kazi, S.N. A review of Safety, Health and Environmental (SHE) issues of solar energy system. Renew. Sustain. Energy Rev. 2015, 41, 1190–1204. [Google Scholar] [CrossRef]
  6. Sobri, S.; Koohi-Kamali, S.; Rahim, N.A. Solar photovoltaic generation forecasting methods: A review. Energy Convers. Manag. 2018, 156, 459–497. [Google Scholar] [CrossRef]
  7. Tawalbeh, M.; Al-Othman, A.; Kafiah, F.; Abdelsalam, E.; Almomani, F.; Alkasrawi, M. Environmental impacts of solar photovoltaic systems: A critical review of recent progress and future outlook. Sci. Total Environ. 2021, 759, 143528. [Google Scholar] [CrossRef]
  8. Wild, M.; Folini, D.; Henschel, F.; Fischer, N.; Müller, B. Projections of long-term changes in solar radiation based on CMIP5 climate models and their influence on energy yields of photovoltaic systems. Sol. Energy 2015, 116, 12–24. [Google Scholar] [CrossRef] [Green Version]
  9. Crook, J.A.; Jones, L.A.; Forster, P.M.; Crook, R. Climate change impacts on future photovoltaic and concentrated solar power energy output. Energy Environ. Sci. 2011, 4, 3101–3109. [Google Scholar] [CrossRef]
  10. Jerez, S.; Tobin, I.; Vautard, R.; Montávez, J.P.; López-Romero, J.M.; Thais, F.; Bartok, B.; Christensen, O.B.; Colette, A.; Déqué, M.; et al. The impact of climate change on photovoltaic power generation in Europe. Nat. Commun. 2015, 6, 10014. [Google Scholar] [CrossRef] [Green Version]
  11. Hachicha, A.A.; Al-Sawafta, I.; Said, Z. Impact of dust on the performance of solar photovoltaic (PV) systems under United Arab Emirates weather conditions. Renew. Energy 2019, 141, 287–297. [Google Scholar] [CrossRef]
  12. Jiang, H.; Lu, L.; Sun, K. Experimental investigation of the impact of airborne dust deposition on the performance of solar photovoltaic (PV) modules. Atmos. Environ. 2011, 45, 4299–4304. [Google Scholar] [CrossRef]
  13. Ramli, M.A.M.; Prasetyono, E.; Wicaksana, R.W.; Windarko, N.A.; Sedraoui, K.; Al-Turki, Y.A. On the investigation of photovoltaic output power reduction due to dust accumulation and weather conditions. Renew. Energy 2016, 99, 836–844. [Google Scholar] [CrossRef]
  14. Ghosh, S.; Yadav, V.K.; Mukherjee, V.; Yadav, P. Evaluation of relative impact of aerosols on photovoltaic cells through combined Shannon’s entropy and Data Envelopment Analysis (DEA). Renew. Energy 2017, 105, 344–353. [Google Scholar] [CrossRef]
  15. Li, X.; Mauzerall, D.L.; Bergin, M.H. Global reduction of solar power generation efficiency due to aerosols and panel soiling. Nat. Sustain. 2020, 3, 720–727. [Google Scholar] [CrossRef]
  16. Woyte, A.; Nijs, J.; Belmans, R. Partial shadowing of photovoltaic arrays with different system configurations: Literature review and field test results. Sol. Energy 2003, 74, 217–233. [Google Scholar] [CrossRef]
  17. Topić, D.; Knežević, G.; Fekete, K. The mathematical model for finding an optimal PV system configuration for the given installation area providing a maximal lifetime profit. Sol. Energy 2017, 144, 750–757. [Google Scholar] [CrossRef]
  18. Gaetani, M.; Huld, T.; Vignati, E.; Monforti-Ferrario, F.; Dosio, A.; Raes, F. The near future availability of photovoltaic energy in Europe and Africa in climate-aerosol modeling experiments. Renew. Sustain. Energy Rev. 2014, 38, 706–716. [Google Scholar] [CrossRef]
  19. Gutiérrez, C.; Somot, S.; Nabat, P.; Mallet, M.; Corre, L.; Van Meijgaard, E.; Perpiñán, O.; Gaertner, M.Á. Future evolution of surface solar radiation and photovoltaic potential in Europe: Investigating the role of aerosols. Environ. Res. Lett. 2020, 15, 034035. [Google Scholar] [CrossRef]
  20. Gutiérrez, C.; Somot, S.; Nabat, P.; Mallet, M.; Gaertner, M.Á.; Perpiñán, O. Impact of aerosols on the spatiotemporal variability of photovoltaic energy production in the Euro-Mediterranean area. Sol. Energy 2018, 174, 1142–1152. [Google Scholar] [CrossRef]
  21. Sun, H.; Zhi, Q.; Wang, Y.; Yao, Q.; Su, J. China’s solar photovoltaic industry development: The status quo, problems and approaches. Appl. Energy 2014, 118, 221–230. [Google Scholar] [CrossRef]
  22. Li, X.; Wagner, F.; Peng, W.; Yang, J.; Mauzerall, D.L. Reduction of solar photovoltaic resources due to air pollution in China. Proc. Natl. Acad. Sci. USA 2017, 114, 11867–11872. [Google Scholar] [CrossRef]
  23. Gao, J.; Yuan, Z.; Liu, X.; Xia, X.; Huang, X.; Dong, Z. Improving air pollution control policy in China—A perspective based on cost–benefit analysis. Sci. Total Environ. 2016, 543, 307–314. [Google Scholar] [CrossRef] [PubMed]
  24. Shi, H.; Zhang, J.; Zhao, B.; Xia, X.; Hu, B.; Chen, H.; Wei, J.; Liu, M.; Bian, Y.; Fu, D.; et al. Surface brightening in eastern and central China since the implementation of the Clean Air Action in 2013: Causes and implications. Geophys. Res. Lett. 2021, 48, e2020GL091105. [Google Scholar] [CrossRef]
  25. The State Council of the People’s Republic of China. Action Plan on Air Pollution Prevention and Control. Available online: http://www.gov.cn/zwgk/2013-09/12/content_2486773.htm (accessed on 11 August 2022).
  26. The State Council of the People’s Republic of China. Three-Year Plan of Action to Win the Blue Sky Defense War. Available online: http://www.gov.cn/zhengce/content/2018-07/03/content_5303158.htm (accessed on 11 August 2022).
  27. Zhang, H.; Yan, J. Co-benefits of renewable energy development: A brighter sky brings greater renewable power. Joule 2022, 6, 1142–1144. [Google Scholar] [CrossRef]
  28. Abel, D.; Holloway, T.; Harkey, M.; Rrushaj, A.; Brinkman, G.; Duran, P.; Janssen, M.; Denholm, P. Potential air quality benefits from increased solar photovoltaic electricity generation in the eastern United States. Atmos. Environ. 2018, 175, 65–74. [Google Scholar] [CrossRef]
  29. Sweerts, B.; Pfenninger, S.; Yang, S.; Folini, D.; Van der Zwaan, B.; Wild, M. Estimation of losses in solar energy production from air pollution in China since 1960 using surface radiation data. Nat. Energy 2019, 4, 657–663. [Google Scholar] [CrossRef]
  30. Wu, J.; Fang, H.; Qin, W.; Wang, L.; Song, Y.; Su, X.; Zhang, Y. Constructing High-Resolution (10 km) Daily Diffuse Solar Radiation Dataset across China during 1982–2020 through Ensemble Model. Remote Sens. 2022, 14, 3695. [Google Scholar] [CrossRef]
  31. Qin, W.; Wang, L.; Gueymard, C.A.; Bilal, M.; Lin, A.; Wei, J.; Zhang, M.; Yang, X. Constructing a gridded direct normal irradiance dataset in China during 1981–2014. Renew. Sustain. Energy Rev. 2020, 131, 110004. [Google Scholar]
  32. Neher, I.; Crewell, S.; Meilinger, S.; Pfeifroth, U.; Trentmann, J. Photovoltaic power potential in West Africa using long-term satellite data. Atmos. Chem. Phys. 2020, 20, 12871–12888. [Google Scholar] [CrossRef]
  33. Ramirez Camargo, L.; Schmidt, J. Simulation of multi-annual time series of solar photovoltaic power: Is the ERA5-land reanalysis the next big step? Sustain. Energy Technol. Assess. 2020, 42, 100829. [Google Scholar] [CrossRef]
  34. Zhang, L.; Zhang, Y.; Yi, X.; Yang, Y.; Zhao, M.; Zhou, J. Seasonal variations of the impact of urban aerosol pollution on distributed solar photovoltaic generation of nine megacities in China. Urban Clim. 2020, 34, 100723. [Google Scholar] [CrossRef]
  35. Fang, H.; Qin, W.; Wang, L.; Zhang, M.; Yang, X. Solar brightening/dimming over China’s mainland: Effects of atmospheric aerosols, anthropogenic emissions, and meteorological conditions. Remote Sens. 2020, 13, 88. [Google Scholar] [CrossRef]
  36. Hersbach, H.; Bell, B.; Berrisford, P.; Hirahara, S.; Horányi, A.; Muñoz-Sabater, J.; Nicolas, J.; Peubey, C.; Radu, R.; Schepers, D.; et al. The ERA5 global reanalysis. Q. J. R. Meteorol. Soc. 2020, 146, 1999–2049. [Google Scholar] [CrossRef]
  37. Muñoz-Sabater, J.; Dutra, E.; Agustí-Panareda, A.; Albergel, C.; Arduini, G.; Balsamo, G.; Boussetta, S.; Choulga, M.; Harrigan, S.; Hersbach, H.; et al. ERA5-Land: A state-of-the-art global reanalysis dataset for land applications. Earth Syst. Sci. Data 2021, 13, 4349–4383. [Google Scholar] [CrossRef]
  38. Kong, L.; Tang, X.; Zhu, J.; Wang, Z.; Li, J.; Wu, H.; Wu, Q.; Chen, H.; Zhu, L.; Wang, W.; et al. A 6-year-long (2013–2018) high-resolution air quality reanalysis dataset in China based on the assimilation of surface observations from CNEMC. Earth Syst. Sci. Data 2021, 13, 529–570. [Google Scholar] [CrossRef]
  39. Danielson, J.J.; Gesch, D.B. Global Multi-Resolution Terrain Elevation Data 2010 (GMTED2010); US Department of the Interior, US Geological Survey: Washington, DC, USA, 2011. [Google Scholar]
  40. Stein, J.S.; Holmgren, W.F.; Forbess, J.; Hansen, C.W. PVLIB: Open source photovoltaic performance modeling functions for Matlab and Python. In Proceedings of the 2016 IEEE 43rd Photovoltaic Specialists Conference, Portland, OR, USA, 5–10 June 2016; pp. 3425–3430. [Google Scholar]
  41. Awasthi, A.; Shukla, A.K.; SR, M.M.; Dondariya, C.; Shukla, K.N.; Porwal, D.; Richhariya, G. Review on sun tracking technology in solar PV system. Energy Rep. 2020, 6, 392–405. [Google Scholar] [CrossRef]
  42. Qiu, T.; Wang, L.; Lu, Y.; Zhang, M.; Qin, W.; Wang, S.; Wang, L. Potential assessment of photovoltaic power generation in China. Renew. Sustain. Energy Rev. 2022, 154, 111900. [Google Scholar] [CrossRef]
  43. Hottel, H.C.; Woertz, B.B. The performance of flat plate solar heat collectors. Trans. ASME (Am. Soc. Mech. Eng.) 1942, 64, 91. [Google Scholar] [CrossRef]
  44. Loutzenhiser, P.G.; Manz, H.; Felsmann, C.; Strachan, P.A.; Frank, T.; Maxwell, G.M. Empirical validation of models to compute solar irradiance on inclined surfaces for building energy simulation. Sol. Energy 2007, 81, 254–267. [Google Scholar] [CrossRef] [Green Version]
  45. Kamphuis, N.R.; Gueymard, C.A.; Holtzapple, M.T.; Duggleby, A.T.; Annamalai, K. Perspectives on the origin, derivation, meaning, and significance of the isotropic sky model. Sol. Energy 2020, 201, 8–12. [Google Scholar] [CrossRef]
  46. Kendall, M.G. Rank Correlation Methods; Charles Griffin and Company: London, UK, 1948. [Google Scholar]
  47. Mann, H.B. Nonparametric tests against trend. Econometrica 1945, 13, 245–259. [Google Scholar] [CrossRef]
  48. Cao, S.; Zhang, S.; Gao, C.; Yan, Y.; Bao, J.; Su, L.; Liu, M.; Peng, N.; Liu, M. A long-term analysis of atmospheric black carbon MERRA-2 concentration over China during 1980–2019. Atmos. Environ. 2021, 264, 118662. [Google Scholar] [CrossRef]
  49. Sen, P.K. Estimates of the Regression Coefficient Based on Kendall’s Tau. J. Am. Stat. Assoc. 1968, 63, 1379–1389. [Google Scholar] [CrossRef]
  50. Hu, M.; Wang, Y.; Wang, S.; Jiao, M.; Huang, G.; Xia, B. Spatial-temporal heterogeneity of air pollution and its relationship with meteorological factors in the Pearl River Delta, China. Atmos. Environ. 2021, 254, 118415. [Google Scholar] [CrossRef]
  51. Anselin, L.; Syabri, I.; Smirnov, O. Visualizing multivariate spatial correlation with dynamically linked windows. In Proceedings of the New Tools for Spatial Data Analysis: Proceedings of the Specialist Meeting; Center for Spatially Integrated Social Science (CSISS), University of California: Santa Barbara, CA, USA, 2002. [Google Scholar]
  52. Yang, D.; Ye, C.; Wang, X.; Lu, D.; Xu, J.; Yang, H. Global distribution and evolvement of urbanization and PM2.5 (1998–2015). Atmos. Environ. 2018, 182, 171–178. [Google Scholar] [CrossRef]
  53. Yu, L.; Zhang, M.; Wang, L.; Qin, W.; Lu, Y.; Li, J. Clear-sky solar radiation changes over arid and semi-arid areas in China and their determining factors during 2001–2015. Atmos. Environ. 2020, 223, 117198. [Google Scholar] [CrossRef]
  54. Zhang, Y.; Ren, J.; Pu, Y.; Wang, P. Solar energy potential assessment: A framework to integrate geographic, technological, and economic indices for a potential analysis. Renew. Energy 2020, 149, 577–586. [Google Scholar] [CrossRef]
Figure 1. Topographical features and geographical region of China.
Remotesensing 15 00228 g001
Figure 2. Annual average spatial distribution of POAI (Wm−2) in China from 2010 to 2020. (a) is the annual average spatial distribution of POAI. (b) the same as (a) but for each province. (c) the same as (a) but for each geographical region.
Remotesensing 15 00228 g002
Figure 3. Annual average spatial distribution of POAI (Wm−2) under clear-sky conditions in China from 2010 to 2020. (a) is the total annual average spatial distribution of clear-sky POAI. (b) the same as (a) but for each province. (c) the same as (a) but for each geographical region.
Remotesensing 15 00228 g003
Figure 4. Spatial distribution of total monthly mean POAI (Wm−2) in China from 2010 to 2020.
Remotesensing 15 00228 g004
Figure 5. Spatial distribution of the total monthly mean POAI (Wm−2) under clear-sky conditions in China from 2010 to 2020.
Remotesensing 15 00228 g005
Figure 6. POAI trends in China from 2010 to 2020. The shaded part is where the Mann–Kendal trend test passed the 90% significance test.
Remotesensing 15 00228 g006
Figure 7. The temporal trends of POAI (Wm−2) and surface concentrations in six air pollutants (μgm−3) in China from 2013 to 2018.
Remotesensing 15 00228 g007
Figure 8. POAI (Wm−2) variation in China during the Air Pollution Prevention and Control Action Plan. The left column is the value of POAI in the OP phase minus the value in the PIP phase, and the right column is the value of POAI in the PCP phase minus the value in the OP phase.
Remotesensing 15 00228 g008
Figure 9. The variations in surface concentrations of six air pollutants (μgm−3) in China during the Air Pollution Prevention and Control Action Plan. The left column is the surface concentration of air pollutants in the OP phase minus the value in the PIP phase, and the right column is the surface concentration of air pollutants in the PCP phase minus the value in the OP phase.
Remotesensing 15 00228 g009
Figure 10. Correlation coefficients between POAI and surface concentrations of six air pollutants. The symbol * indicates that it passed the 95% significance test.
Remotesensing 15 00228 g010
Figure 11. Bivariate LISA clustering of surface concentrations of six air pollutants and clear-sky POAI in 2018. The results passed the 95% significance test, and the white areas are the non-significant areas.
Remotesensing 15 00228 g011
Table 1. Summary of input data for the PV_LIB model.
NameAbbreviationUnitResolutionData Sets
Clear-sky direct solar radiation at surfaceCDIRJm−20.25° × 0.25°, hourlyERA5 hourly data on single levels from 1979 to present
(ERA5 hourly data on single levels from 1959 to present (copernicus.eu))
Total sky direct solar radiation at surfaceFDIRJm−2
Surface solar radiation downward, clear skySSRDCJm−2
Surface solar radiation downwardsSSRDJm−20.1° × 0.1°, hourlyERA5-Land hourly data from 1981 to present
(ERA5-Land hourly data from 1950 to present (copernicus.eu))
2m temperatureTK
Forecast albedoFALNone
Surface pressureSPPa
ElevationDEMm30 arc-secondsGMTED2010
Table 2. The global bivariate Moran Index of clear-sky POAI and surface concentrations of six air pollutants.
Air Pollutants201320142015201620172018
CO−0.363−0.396−0.434−0.44−0.435−0.421
NO2−0.374−0.410−0.431−0.42−0.407−0.407
O30.8540.8270.7820.7820.7570.784
PM10−0.387−0.436−0.454−0.419−0.429−0.401
PM2.5−0.409−0.447−0.472−0.433−0.451−0.387
SO2−0.377−0.425−0.447−0.423−0.428−0.469
Disclaimer/Publisher’s Note: The statements, opinions and data contained in all publications are solely those of the individual author(s) and contributor(s) and not of MDPI and/or the editor(s). MDPI and/or the editor(s) disclaim responsibility for any injury to people or property resulting from any ideas, methods, instructions or products referred to in the content.

