Abstract
Continued climate warming and precipitation fluctuations are expected to further affect aboveground net primary productivity (ANPP) across alpine grasslands, with associated implications for ecosystem functions. The spatial and temporal variability of ANPP in Tibetan Plateau (TP) grasslands and its response to temperature and precipitation were investigated in this study, based on the ANPP estimated by means of ensemble analysis of multiple machine learning models. First, the response of the spatial distribution of ANPP to variations in the precipitation gradient was nonlinear and showed an S-shaped growth pattern, which could be divided into four stages (stationary, rapid growth, slower growth, and saturation) corresponding to arid (mean annual precipitation (MAP) < 250 mm), semiarid (250 mm < MAP < 450 mm), semihumid (450 mm < MAP < 650 mm) and humid (MAP > 650 mm) precipitation regimes, respectively. Second, regional precipitation regimes affected the sensitivity of ANPP’s interannual variability to temperature and precipitation; ANPP is more sensitive to temperature in wetter areas than in dryer areas of the TP region. The results of our study suggest that in the region of Tibetan Plateau, the response of grassland ANPP variation to climate was constrained by the background precipitation regimes.
1. Introduction
Ongoing global warming and changing rainfall patterns are expected to have critical and profound consequences for terrestrial ecosystems [1,2,3]. Grassland is one of the most widespread ecosystems on Earth (covering about 20% of land globally) and is important to the global carbon and hydrological cycles [4] and regional grazing economies. In addition, grasslands are particularly sensitive to climate change [5,6]. Their responses to climate perturbations may have significant and long-term implications for regional and even global food security and have received extensive attention and research [7,8,9,10].
Aboveground net primary productivity (ANPP) is one of the most important processes in terrestrial ecosystems, providing the energy base and material substrate for almost all heterotrophic organisms and connecting to nutrient cycling, energy flow, and carbon cycling [11]. Changes in ANPP thus have implications for the function of the entire ecosystem and stability and value of ecosystem services derived from production. Understanding the relationship between changes in ANPP and climate fluctuations is critical for predicting the growth responses of grassland ecosystems under the global dynamics of the environment [12,13]. Wang et al. [14] suggested that warming has stimulated carbon fluxes in grassland ecosystems in the past four decades, and ANPP has increased by 7.6%. Meanwhile, some studies have noted that there is obvious spatial heterogeneity in the response of vegetation productivity to global warming [3,15]. Such heterogeneity is also supported by and Bai et al. [16] and Li et al. [17]; their studies indicated that the sensitivity of grassland ANPP to temperature varies dramatically in different regions, and this variation may be due to different climate conditions, vegetation communities and soil textures. The sensitivity of ANPP to climatic factors, defined as the variation in ANPP per unit of climatic change, is key to understanding vegetation dynamics and predicting the responses of vegetation to future climate change. However, this sensitivity of grassland ANPP to climate factors, especially its regional variability, is still poorly understood [12,18,19].
It is generally believed that water has a good promoting effect on grassland production, and a positive correlation between ANPP and mean annual precipitation (MAP) has been found in many studies [7,20,21]. However, other studies have shown that variations in grassland ANPP are not always consistent with the changes in MAP [22]. Yang et al. [23] indicated that the increasing trend of ANPP with MAP gradually levels off in humid regions. Bai et al. [16] showed that the response of ANPP to precipitation is unimodal along an aridity index, peaking in the arid and semiarid median region. From these results, it can be argued that precipitation can clearly influence grassland ANPP, but there may be diverse responses of ANPP to precipitation in different regions. Therefore, we ask the following questions: how does the sensitivity of grassland ANPP respond to precipitation regimes? What are the underlying mechanisms of this varied response of ANPP to precipitation?
There are many approaches for investigating ecosystem responses to climate change, such as long-term monitoring, environmentally controlled field experiments, and ecological prediction models [5,12,18,24]. However, site investigations and controlled experiments are always costly in terms of money, personnel, and time. Some regions are even inaccessible to personnel wishing to conduct experimental investigations. In addition, Wang et al. [14] indicated that the stimulatory effect of warming on ANPP observed in short-term studies of grasslands disappears in longer-term experiments. Thus, a critical limitation in exploring this relationship is the lack of long-term ANPP data [12,20,25]. Model simulation is a good way to provide long-term temporal information, and several studies have analyzed the temporal and spatial variations in ANPP and their associated climatic conditions. Exploring the relationship between ANPP and precipitation along climatic gradients is a critically important method for understanding how altered precipitation patterns may affect ecosystem processes [26].
The Tibetan Plateau (TP) is the highest and largest plateau on Earth, with an average elevation of approx. 4000 m. Therefore, the climate of the TP is cold, with an average annual temperature below 0 °C [27], and the TP is thus considered the world’s third pole. The TP region has been experiencing extreme warming over the past four decades, with the annual temperature (MAT) increasing at a rate of 0.39 °C per decade [28], affecting vegetation growth. The growth of alpine vegetation in this region is considered highly sensitive to temperature and precipitation changes [29]. One important question in the TP region is how climate patterns affect grassland ANPP, considering global warming and the uncertainty of future changes in precipitation patterns. To elucidate the spatial–temporal variation in grassland productivity in response to climate change across the TP region, the spatiotemporal rasterized ANPP (from 2000 to 2018) is estimated via ensemble analysis of multiple machine learning models. Then, we examine the spatial and temporal variations in ANPP over the Tibetan Plateau region and their sensitivity to temperature and precipitation variations, and discuss the potential underlying mechanisms.
2. Materials and Methods
2.1. Datasets and Data Processing
2.1.1. In Situ ANPP Measurements
The in situ measurements of ANPP were assessed using the harvested peak aboveground biomass (AGB) accumulation over the growing season [30]. In 2005–2016, when the grassland biomass reached its maximum (approximately in mid-August), field surveys were conducted. At each survey spot (30 m × 30 m), three separate subplots (1 m × 1 m) were sampled. All of the plants within each subplot were collected, and then desiccated in the laboratory using a 65 °C oven until the mass remained constant. Finally, the AGB value of the sample site was simply obtained by taking the average of the dry weights of the three subplots. In addition, according to the landcover map [31], the sample sites distributed in the grassland ecosystems were selected. We ultimately obtained ANPP data for 355 sites, covering all types of grassland in this region, with a variability of ANPP ranging from 9.80 to 670.90 g m−2 y−1 (Figure 1). The variable coefficient of ANPP was 78.45%, and there were large differences between the sites.
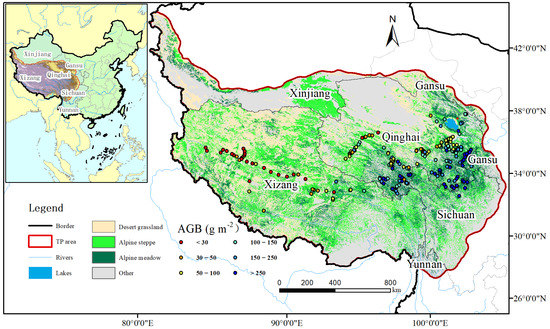
Figure 1.
The geographic coverage of the grassland in the Tibetan Plateau (TP) region, with the 355 in situ measurements of ANPP.
2.1.2. Climate Data
For spatial ANPP estimation in the TP region and further analysis, the gridded meteorological data were constructed. Based on the ground-based observations from the National Meteorological Information Center (NMIC) of the China Meteorological Administration (753 stations) and the Daily Global Historical Climatology Network-Daily (GHCN-D) (345 stations), the spatial climate data were interpolated using the ANUSPLIN software, include 8-day precipitation and temperature maps at 1 km resolution from 2000 to 2018. Then, the MAP and MAT data were calculated. For the regional application in Tibetan Plateau’s grasslands, the spatial data were extracted using a tool (Extract by mask) in ArcGIS (ArcGIS 10.2) software. More information about the rasterized meteorological datasets is available in [32].
2.1.3. Remote Sensing Data
The MODIS VI products (MOD13Q1, V006) (http://earthdata.nasa.gov/, accessed on 11 May 2023), including the 16-day normalized difference vegetation index (NDVI) and enhanced vegetation index (EVI) at a 250 m resolution, were used to estimate ANPP in the whole region. The average of the growing season for the TP area in each study year (2000–2018) was calculated using 16-day NDVI and EVI data, denoted as the growing season NDVI (GSN) and growing season EVI (GSE), respectively. Digital elevation model (DEM) data were obtained from Shuttle Radar Topography Mission (SRTM) imagery (version 004, 90 m). To be consistent with the existing climate data, the DEM, GSN and GSE were resampled at 1 km resolution. In additional, using ArcGIS software (ESRI, Redlands, CA, USA), the slope data were calculated from the resampled DEM.
2.2. Regional ANPP Estimation Method
2.2.1. Machine Learning Methods
The grassland ANPP estimation models were constructed by machine learning (ML) algorithms based on the survey data and their corresponding GSE, GSN, MAT, MAP, DEM, slope, longitude, and latitude values. Four ML algorithms were selected to construct ANPP estimation models: artificial neural network (ANN) [33], cubist [30], random forest (RF) [27] and support vector machine (SVM) [30]. All of the ML models were trained and tested using R3.5.2, with its packages neuralnet (https://CRAN.R-project.org/package=neuralnet, accessed on 11 May 2023), e1071 (https://CRAN.R-project.org/package=e1071, accessed on 11 May 2023), Cubist (https://CRAN.R-project.org/package=Cubist, accessed on 11 May 2023), randomForest (https://CRAN.R-project.org/package=randomForest, accessed on 11 May 2023), rgdal (https://CRAN.R-project.org/package=rgdal, accessed on 11 May 2023), raster (https://CRAN.R-project.org/package=raster, accessed on 11 May 2023) and sp (https://CRAN.R-project.org/package=sp, accessed on 11 May 2023). An evaluation of each model was performed by means of ten-fold cross-validation. Meanwhile, the best-first variable search method was applied to select the best combination of input variables [34].
2.2.2. Ensemble Analysis
Ensemble analysis is considered as a tool to reduce the uncertainty of the results and increase the robustness of the estimation model [30]. Bayesian model averaging (BMA) ensemble analysis was used in this study to combine the different outputs, and the blended value of the four ML estimation results was calculated. When different estimation models produce comparable model accuracy but different results, ensemble analysis can be used to combine these outputs and then produce more exact and robust estimates.
2.2.3. Accuracy Assessment
The model performance was then evaluated based on coefficient of determination (R2) and root mean squared error (RMSE). The closer the R2 is to 1, the better the fitting effect of the model, and the lower the value of RMES, indicating a higher accuracy of the estimation model.
where is the measured data, is the simulated value, n is the number of sample points, and i represents the i-th sample.
2.3. Climate Response Analysis of ANPP
2.3.1. Spatial Variation Analysis
The predicted ANPP for the TP region from 2000 to 2018 was averaged to characterize the spatial patterns of ANPP. Then, to investigate the response of ANPP spatial variation to temperature and precipitation, the average ANPP was also calculated based on temperature (each bin was 0.5 °C) and precipitation (each bin was 50 mm). The dynamics of ANPP under precipitation gradients were also calculated.
2.3.2. Temporal Change Analysis
We analyzed the response of interannual variations in ANPP to climate change. Then, multiple linear regression was used to calculate the interannual sensitivity (i.e., regression coefficient) of grassland ANPP to the variability in temperature and precipitation from 2000 to 2018. The sensitivity of ANPP interannual variations to temperature (or precipitation) was defined as the coefficient of temperature (or precipitation) of the multiple linear regression for each pixel. For a temperature slope of 1 g m−2 °C−1, the grassland ANPP was considered to increase by 1 gm−2 when the temperature increases by 1 °C. Similarly, a precipitation slope of 1 g m−2 mm−1 indicated that for every 1 mm increase in precipitation, the grassland ANPP increased by 1 g m−2.
3. Results
3.1. Performance of the ANPP Estimation Models
Comparable results were obtained for the four ML models (ANN, cubist, RF and SVM), with r from 0.81 to 0.87 for the training data and r from 0.77 to 0.84 for testing data (Table 1). The ML models based on the selected input variables performed slightly better than the ML models using all 10 variables as the input. Of the four ML algorithms, the best results were obtained for the cubist model based on GSE, GSN, MAP and DEM (training data: R2 = 0.76, RMSE = 69.56 g m−2; testing data: r = 0.71, RMSE = 76.99 g m−2).

Table 1.
Performance of AGB estimation models in the TP grassland.
In order to obtain a better result, the ANPP results estimated from the four different ML models were used in BMA ensemble analysis. The results showed that ensemble analysis produced higher r (0.88) and lower RMSE (73.54 g m−2) values compared to each single ANPP estimation model (Figure 2). The two combinations fit very closely to the 1:1 line, which suggested that the predicted values were strongly in agreement with the measured values.
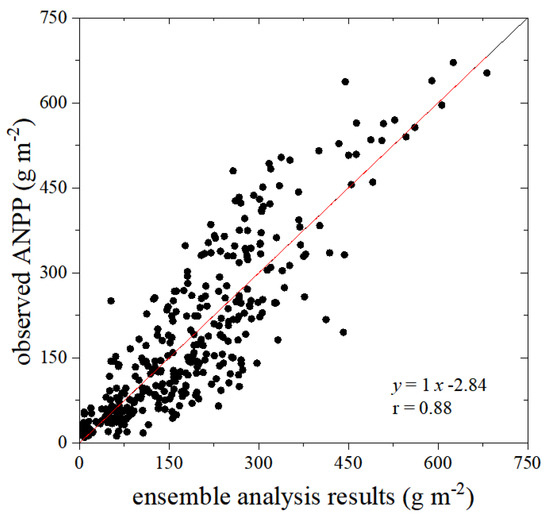
Figure 2.
Comparison of observed and predicted values from the ensemble analysis method.
3.2. Spatial–Temporal Variations in Grassland ANPP
The spatial patterns of the ANPP of the TP grasslands exhibited apparent heterogeneity, decreasing from the southeast to the northwest (Figure 3a). The distribution was comparable to the pattern obtained from the in situ observations (Figure 1), but included more details that were impossible to obtain from the limited measurements in the field. Specifically, some areas in the northwestern TP showed lower ANPP (<30 g m−2 y−1). This is reasonable, considering the higher elevation and overall frigid climate in this region. The central parts of the TP have a relatively high ANPP (30–150 g m−2 y−1). The highest ANPP (>150 g m−2 y−1) were found in the eastern areas, which is consistent with this region being the primary pastoral agricultural area of the TP.
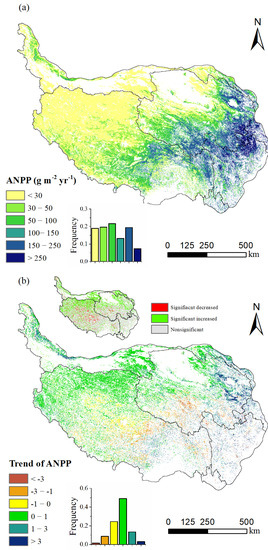
Figure 3.
(a) Spatial distribution pattern of ANPP, and (b) temporal change trend (2000–2018) of ANPP in Tibetan Plateau grassland.
The annual ANPP of alpine grassland fluctuates from year to year in the TP region, but most areas (approximately 65.56% of the grassland total area) appear to demonstrate an upward trend from 2000 to 2018 (Figure 3b). Approximately 30% of the grassland had a significant (p < 0.05) increasing trend; these areas were mainly located in eastern and northeastern Qinghai and northern Tibet. On the other hand, some grasslands showed a significant decreasing trend (approximately 7.45% of the grassland), and these areas were mainly located in southern Qinghai and central Tibet, and the decreasing rates were mostly between 0 and 1 g m−2 y−1.
3.3. Effects of Climate Factors on Spatial Variation in ANPP
With respect to spatial variation, the ANPP of alpine grassland in the TP region increased positively with MAP along the precipitation gradient, and the shape of the relationship between ANPP and precipitation was similar to an S-shaped growth curve, as shown in Figure 4. It can be easily seen that the fitted S-shaped growth curve (the red curve in Figure 4) better characterizes the ANPP pattern under the precipitation gradient than the linearly fitted curve (dotted line in Figure 4). Meanwhile, the maximum (155.67 g m−2 y−1) and minimum (21.67) values of the S-shaped growth curve fitting function also correspond well to the maximum and minimum values of the ANPP statistically under the precipitation gradient.
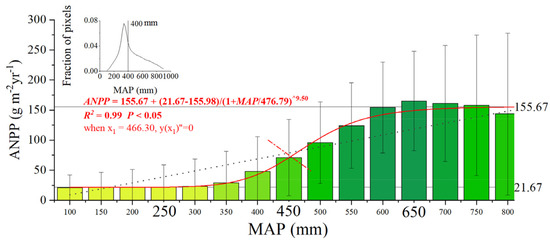
Figure 4.
Spatial changes in ANPP along a precipitation gradient in the Tibetan Plateau.
According to the description of this S-shaped growth curve (logistic function) fit (the red curve in Figure 4), the response of ANPP to precipitation could be divided into four stages: stationary, rapid growth, slower growth, and saturation. First, when the MAP was less than 250 mm, the ANPP of grassland was in a stable stage and basically remained at approximately 21.67 g m−2 y−1. Then, when the MAP was between 250 and 450 mm, grassland ANPP increased with increasing MAP, and the growth rate showed an upward trend. However, 466.30 mm was a tipping point. When the MAP was greater than this point, ANPP still increased with increasing MAP, but the growth rate showed a downward trend. Then, grassland ANPP reached its peak at a MAP of 650 mm. Above 650 mm, a slight decrease was observed in ANPP with increasing MAP, and ANPP no longer responded to precipitation changes.
To further understand the effect of the interaction of precipitation and temperature conditions on the ANPP distribution, the mean ANPP values were calculated using MAT and MAP (Figure 5). The interaction defines a multidimensional response surface where the ANPP response to temperature and precipitation approximates a ridge, with the largest ANPP occurring over the averaged levels of MAT and MAP. More specifically, the larger values of ANPP (>180 g m−2 y−1) occurred mainly in the area where MAP exceeded 600 mm and MAT was greater than 1 °C. In the arid region (MAP < 200 mm), when the MAT was less than −4 °C, the ANPP was less than 30 g m−2 y−1. In the cold region (MAT < −4 °C), when the MAP was less than 400 mm, the ANPP was less than 30 g m−2 y−1.
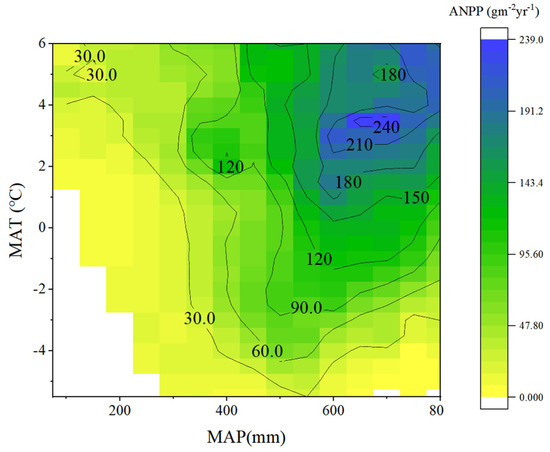
Figure 5.
ANPP variation in precipitation–temperature two-dimensional space.
3.4. Spatial Distribution of the Sensitivity of ANPP Interannual Variations to Temperature and Precipitation
The sensitivity of ANPP to temperature in grasslands on the TP, obtained by means of regression analysis, in most areas was positive (approximately 66% of the grassland in the TP region) (Figure 6). Among them, in approximately 18% of these areas, the sensitivity to temperature was greater than 12 g m−2 y−1 °C−1, suggested that an increase in MAT of 1 °C corresponded to an ANPP increase of at least 12 g m−2 each year. These pixels were mostly located in the eastern part, and precipitation was relatively favorable. Much less negative temperature sensitivity was observed than for those pixels that exhibited the expected promotion with climate warming; these observations occurred in a few parts of the central Tibet area and accounted for only approximately 4.4% of the grassland.
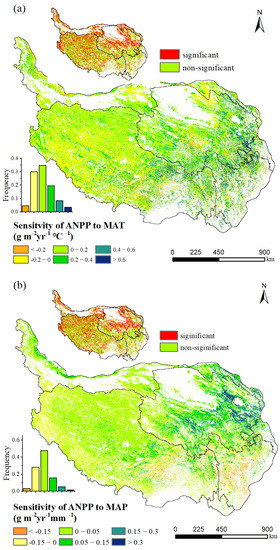
Figure 6.
The sensitivity of ANPP inter-annual variations to (a) temperature and (b) precipitation.
Most grassland ANPP showed positive sensitivity to precipitation over the TP region (Figure 6b). In particular, most of Qinghai Province, located on the northeastern TP, has a precipitation sensitivity of more than 0.15 g m−2 y−1 mm−1, representing an increase in ANPP of 0.15 g m−2 y−1 for every 1 mm increase in MAP. In addition, increased precipitation may promote ANPP on the northwestern edge of the Tibetan Plateau and in a few parts in the center of Tibet, with an increase in ANPP of 0.15 g m−2 y−1 for every 1 mm increase in MAP. In total, approximately 69% of the TP grassland area exhibited positive sensitivity to precipitation, and among its pixels, 23% were significant. On the other hand, negative sensitivity of precipitation was observed in 31% of the whole grassland region, occurring mostly in parts of southern Tibet and Sichuan Province and the southwestern edge of Tibet. There are relatively abundant precipitation conditions in these regions, but the inter-annual variations in precipitation over the past 20 years have a downward trend.
As we observed along the precipitation gradient, ANPP was more sensitive to inter-annual changes in MAT in the humid area (i.e., the region with relatively higher multi-year averages of precipitation) (Figure 7). The temperature sensitivity of ANPP generally increased from the area with less precipitation (100 mm MAP, temperature sensitivity: 1.10 g m−2 y−1 °C−1) to the wetter area (700 mm MAP, temperature sensitivity: 6.54 g m−2 y−1 °C−1). However, when the MAP was greater than 700 mm, the temperature sensitivity decreased slightly. In total, an increase in the long-term average MAP of 50 mm corresponded to an increase in the temperature sensitivity of 3.04 g m−2 y−1 °C−1 within the areas with MAP ranging from 100 to 800 mm, and the rate of increase in the temperature sensitivity was 0.01 g m−2 y−1 °C−1 mm−1.
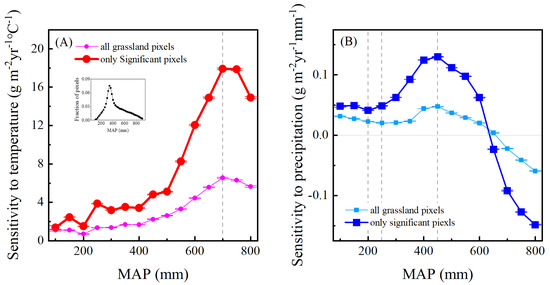
Figure 7.
The sensitivity of ANPP interannual variations along the precipitation gradient.
The spatial variations in sensitivity to precipitation indicated remarkably different patterns. Under the precipitation gradient, the precipitation sensitivity of ANPP showed greater fluctuations and even negative values in areas where the MAP was greater than 650 mm. Spatially, the precipitation sensitivity of ANPP was generally low in the arid area (MAP from 100 to 250 mm). Then, as the MAP increased from 250 to 450 mm, precipitation sensitivity increased. The precipitation sensitivity reached its peak at 450 mm (about 0.05 g m−2 y−1 mm−1), and then decreased again. For an MAP greater than 700 mm, the precipitation sensitivity was negative and increased with increasing precipitation.
4. Discussion
4.1. Grassland ANPP Estimation on the Tibetan Plateau Based on Remote Sensing
In this study, the grassland ANPP in the Tibetan Plateau estimated by four ML models and ensemble analysis was 73.23 g m−2, within the range of the estimated values by previous studies (40~80 g m−2) (Table 2). Using the NDVI time series dataset for the period 1982–2006, the AGB in the TP grassland was estimated by [35], with a mean density of 74.11 g m−2. This was closest to the results obtained in our study, followed by the estimated results from [23]. The inter-annual dynamics of AGB in the grassland of the TP region revealed an upward trend in the past 20 years [22,36]. This was also in agreement with our findings, indicating an increasing trend in the temporal variation in AGB in this area.
Table 2.
Comparison of AGB estimates of grasslands on the Tibetan Plateau from different studies.
4.2. Spatial–Temporal Variation in Grassland ANPP and the Climate Effect
A positive relationship between ANPP and MAP was observed in the alpine grassland of the TP region (Figure 4), which was consistent with previous studies [21,40], suggesting that the precipitation increase is beneficial to the grassland growth. However, in our study, the response of the spatial distribution of ANPP to changes in precipitation was nonlinear, and a growth curve (‘S-shaped curve’, Figure 4) fit well to describe the relationship between ANPP and MAP along the precipitation gradient. The changes in ANPP could be divided into four phases based on the logistic fitting curve: stationary, rapid growth, slower growth, and saturation, corresponding to different precipitation conditions. Specifically, in areas with MAP less than 250 mm, the adaptation of vegetation to such extreme environments creates high resistance over time [24]. Then, affected by the high resistance and environmental factors, the increase in precipitation failed to make a major contribution to vegetation productivity.
In semiarid regions, precipitation has a more evident contribution to ANPP, and ANPP shows an exponential increase with increasing MAP [41]. Thus, the ANPP reached its maximum rate of increase with MAP at the semiarid–semihumid boundary. However, subsequently, this rate gradually decreased in the semihumid areas. Ref. [26] inferred that this is due to increased competition between vegetation individuals as the density of vegetation increases. Based on the theory of demographic processes, ANPP increases in response to increasing precipitation by increasing both the growth of individuals and the number of new individuals colonizing bare ground. In semiarid regions, vegetation is sparse, and when rainfall increases, vegetation can increase productivity through outward expansion. In contrast, in the semihumid and humid regions, the grassland density is higher, which limits the population growth of vegetation. In addition, nutrient leaching is also considered to be an important factor in the limited productivity response to precipitation in the wettest areas [42]. Therefore, ANPP can even decrease with increased precipitation in humid regions.
Increasing temperature has been recognized as the major determinant of production improvement in alpine grassland ecosystems in the last few decades [27,29,43]. However, the interannual variations in ANPP are not completely consistent with the temperature (Figure 6a). For example, in the southwestern part of the Tibetan Plateau and central Tibet, the increase in temperature has not been reflected in the ANPP over the last 20 years. Quan et al. [44] suggested that water conditions can affect the response of grassland to temperature on the TP through field manipulation experiments. Our results showed that the sensitivity of ANPP to temperature in arid regions is obviously lower than that in subhumid and humid regions (Figure 7). In the arid areas southwest of the TP, vegetation growth is mainly limited by soil moisture, and thus, productivity is less sensitive to temperature. In addition, some arid areas with high temperatures could even diminish water availability through increasing evapotranspiration, and thus even reducing grassland productivity. Along the precipitation gradient, in general, the temperature sensitivity increases with increasing precipitation. Especially in the subhumid zone, the effect of the restriction of water availability on vegetation growth is weakened, and grassland vegetation can make fuller use of solar and thermal resources. However, when precipitation exceeded a certain level, both temperature sensitivity and precipitation sensitivity show a decreasing trend with increasing precipitation, and precipitation sensitivity even shows a negative value. We suggest that a larger amount of precipitation would no longer promote the growth of vegetation, but may instead reduce the soil permeability, change the soil nutrients, and inhibit the growth of vegetation [13].
Under the precipitation gradient, the sensitivity of ANPP interannual variations to precipitation exhibits almost the same dynamic patterns as those of the sensitivity of ANPP spatial variation to precipitation. The precipitation sensitivity is hump-shaped (unimodal), peaking when precipitation is 450 mm, which is near the tipping point (Figure 4) of the S-shaped response in spatial variation. Ref. [42] suggested that the location of this peak is related to regional optimum precipitation conditions. This may be the result of the long-term adaptation of the ecosystem, creating complexity for ecosystem functions and structures and their responses to climate characteristics. The patterns of ANPP sensitivity in this study also indicated the way that grassland vegetation utilizes climatic resources, minimizes climatic risks, and maximizes climatic benefits. In the arid area (i.e., MAP < 200 mm), with higher risk of drought, the precipitation sensitivity is lower and there is little variability, thus reducing the loss of productivity by drought, which is a mode of conservation for grassland resources. In contrast, in wetter areas (i.e., MAP > 600 mm) with lower risk of drought, and plants may have advanced to become more temperature sensitivity of ANPP to maximize the thermal benefit, contributing to the development of vegetation communities.
5. Conclusions
The effects of MAP on the spatiotemporal variations in ANPP of TP grassland was quantified in this study. We conclude that there was an “S-cover” relationship between MAP and ANPP for the entire TP grassland. In addition, sensitivity analysis of the interannual variation of ANPP indicates that temperature has a good promotion effect on Tibetan grasslands; ANPP interannual variation is more sensitive to temperature in wetter areas than in dryer areas of the TP region. Meanwhile, the sensitivity of ANPP’s interannual variation to precipitation also had similar spatial characteristics, showing a single-peaked pattern, with an increase and then a decrease with increasing precipitation. The sensitivity of grassland ANPP to precipitation was greater in the semiarid and semihumid zones, and precipitation changes in this region more significantly impacted grassland productivity. The results of this study imply that the response of grassland production to temperature and precipitation across the TP region was determined by background climate conditions.
Author Contributions
Methodology, N.Z.; Validation, N.Z.; Resources, H.H.; Data curation, X.R.; Writing—original draft, N.Z.; Visualization, Z.N.; Supervision, H.H. and L.Z. All authors have read and agreed to the published version of the manuscript.
Funding
This research was financially supported by the Special Project on National Science and Technology Basic Resources Investigation of China (2021FY100705), the National Natural Science Foundation of China (42030509), the National Key Research and Development Program of China (2019YFE0126500), and the Research Development Fund Project of Zhejiang Agriculture and Forestry University School (2020FR084).
Data Availability Statement
Data available upon request to the authors.
Conflicts of Interest
The Authors declare no conflict of interest.
References
- Friedlingstein, P.; Jones, M.W.; O’Sullivan, M.; Andrew, R.M.; Hauck, J.; Peters, G.P.; Peters, W.; Pongratz, J.; Sitch, S.; Le Quéré, C.; et al. Global Carbon Budget 2019. Earth Syst. Sci. Data 2019, 11, 1783–1838. [Google Scholar] [CrossRef]
- Reichstein, M.; Bahn, M.; Ciais, P.; Frank, D.; Mahecha, M.D.; Seneviratne, S.I.; Zscheischler, J.; Beer, C.; Buchmann, N.; Frank, D.C.; et al. Climate extremes and the carbon cycle. Nature 2013, 500, 287–295. [Google Scholar] [CrossRef] [PubMed]
- Seddon, A.W.R.; Macias-Fauria, M.; Long, P.R.; Benz, D.; Willis, K.J. Sensitivity of global terrestrial ecosystems to climate variability. Nature 2016, 531, 229–232. [Google Scholar] [CrossRef]
- Scurlock, J.M.O.; Johnson, K.; Olson, R.J. Estimating net primary productivity from grassland biomass dynamics measurements. Glob. Chang. Biol. 2002, 8, 736–753. [Google Scholar] [CrossRef]
- Hoover, D.L.; Knapp, A.K.; Smith, M.D. Resistance and resilience of a grassland ecosystem to climate extremes. Ecology 2014, 95, 2646–2656. [Google Scholar] [CrossRef]
- Huang, L.; He, B.; Chen, A.; Wang, H.; Liu, J.; Lű, A.; Chen, Z. Drought dominates the interannual variability in global terrestrial net primary production by controlling semi-arid ecosystems. Sci. Rep. 2016, 6, 24639. [Google Scholar] [CrossRef]
- Bai, Y.; Wu, J.; Xing, Q.; Pan, Q.; Huang, J.; Yang, D.; Han, X. Primary Production and Rain Use Efficiency across a Precipitation Gradient on the Mongolia Plateau. Ecology 2008, 89, 2140–2153. [Google Scholar] [CrossRef]
- Felton, A.J.; Slette, I.J.; Smith, M.D.; Knapp, A.K. Precipitation amount and event size interact to reduce ecosystem functioning during dry years in a mesic grassland. Glob. Chang. Biol. 2020, 26, 658–668. [Google Scholar] [CrossRef]
- Piao, S.; Wang, X.; Wang, K.; Li, X.; Bastos, A.; Canadell, J.G.; Ciais, P.; Friedlingstein, P.; Sitch, S. Interannual variation of terrestrial carbon cycle: Issues and perspectives. Glob. Chang. Biol. 2020, 26, 300–318. [Google Scholar] [CrossRef]
- Xu, Z.; Hou, Y.; Zhang, L.; Liu, T.; Zhou, G. Ecosystem responses to warming and watering in typical and desert steppes. Sci. Rep. 2016, 6, 34801. [Google Scholar] [CrossRef] [PubMed]
- Piao, S.; Fang, J.; He, J. Variations in Vegetation Net Primary Production in the Qinghai-Xizang Plateau, China, from 1982 to 1999. Clim. Chang. 2006, 74, 253–267. [Google Scholar] [CrossRef]
- Knapp, A.K.; Smith, M.D. Variation among biomes in temporal dynamics of aboveground primary production. Science 2001, 291, 481–484. [Google Scholar] [CrossRef]
- Zhang, T.; Yu, G.; Chen, Z.; Hu, Z.; Jiao, C.; Yang, M.; Fu, Z.; Zhang, W.; Han, L.; Fan, M.; et al. Patterns and controls of vegetation productivity and precipitation-use efficiency across Eurasian grasslands. Sci. Total Environ. 2020, 741, 140204. [Google Scholar] [CrossRef] [PubMed]
- Wang, N.; Quesada, B.; Xia, L.L.; Butterbach-Bahl, K.; Goodale, C.L.; Kiese, R. Effects of climate warming on carbon fluxes in grasslands—A global meta-analysis. Glob. Chang. Biol. 2019, 25, 1839–1851. [Google Scholar] [CrossRef]
- Song, J.; Wan, S.; Piao, S.; Knapp, A.K.; Classen, A.T.; Vicca, S.; Ciais, P.; Hovenden, M.J.; Leuzinger, S.; Beier, C.; et al. A meta-analysis of 1119 manipulative experiments on terrestrial carbon-cycling responses to global change. Nat. Ecol. Evol. 2019, 3, 1309–1320. [Google Scholar] [CrossRef]
- Bai, J.; Shi, H.; Yu, Q.; Xie, Z.Y.; Li, L.H.; Luo, G.P.; Jin, N.; Li, J. Satellite-observed vegetation stability in response to changes in climate and total water storage in Central Asia. Sci. Total Environ. 2019, 659, 862–871. [Google Scholar] [CrossRef]
- Li, L.; Zhang, Y.; Wu, J.; Li, S.; Zhang, B.; Zu, J.; Zhang, H.; Ding, M.; Paudel, B. Increasing sensitivity of alpine grasslands to climate variability along an elevational gradient on the Qinghai-Tibet Plateau. Sci. Total Environ. 2019, 678, 21–29. [Google Scholar] [CrossRef]
- Griffin-Nolan, R.J.; Blumenthal, D.M.; Collins, S.L.; Farkas, T.E.; Hoffman, A.M.; Mueller, K.E.; Ocheltree, T.W.; Smith, M.D.; Whitney, K.D.; Knapp, A.K. Shifts in plant functional composition following long-term drought in grasslands. J. Ecol. 2019, 107, 2133–2148. [Google Scholar] [CrossRef]
- Ma, Q.H.; Liu, X.D.; Li, Y.B.; Li, L.; Yu, H.Y.; Qi, M.; Zhou, G.S.; Xu, Z.Z. Nitrogen deposition magnifies the sensitivity of desert steppe plant communities to large changes in precipitation. J. Ecol. 2020, 108, 598–610. [Google Scholar] [CrossRef]
- Fang, J.; Piao, S.; Tang, Z.; Peng, C.; Ji, W. Interannual Variability in Net Primary Production and Precipitation. Science 2001, 293, 1723. [Google Scholar] [CrossRef]
- Sala, O.E.; Parton, W.J.; Joyce, L.A.; Lauenroth, W.K. Primary Production of the Central Grassland Region of the United States. Ecology 1988, 69, 40–45. [Google Scholar] [CrossRef]
- Mao, D.H.; Wang, Z.M.; Li, L.; Ma, W.H. Spatiotemporal dynamics of grassland aboveground net primary productivity and its association with climatic pattern and changes in Northern China. Ecol. Indic. 2014, 41, 40–48. [Google Scholar] [CrossRef]
- Yang, Y.H.; Fang, J.Y.; Pan, Y.D.; Ji, C.J. Aboveground biomass in Tibetan grasslands. J. Arid. Environ. 2009, 73, 91–95. [Google Scholar] [CrossRef]
- Gao, J.B.; Zhang, L.L.; Tang, Z.; Wu, S.H. A synthesis of ecosystem aboveground productivity and its process variables under simulated drought stress. J. Ecol. 2019, 107, 2519–2531. [Google Scholar] [CrossRef]
- Knapp, A.K.; Ciais, P.; Smith, M.D. Reconciling inconsistencies in precipitation–productivity relationships: Implications for climate change. New Phytol. 2017, 214, 41–47. [Google Scholar] [CrossRef]
- Hu, Z.; Guo, Q.; Li, S.; Piao, S.; Knapp, A.K.; Ciais, P.; Li, X.; Yu, G. Shifts in the dynamics of productivity signal ecosystem state transitions at the biome-scale. Ecol. Lett. 2018, 21, 1457–1466. [Google Scholar] [CrossRef]
- Zeng, N.; Ren, X.; He, H.; Zhang, L.; Zhao, D.; Ge, R.; Li, P.; Niu, Z. Estimating grassland aboveground biomass on the Tibetan Plateau using a random forest algorithm. Ecol. Indic. 2019, 102, 479–487. [Google Scholar] [CrossRef]
- Deng, H.; Pepin, N.C.; Chen, Y. Changes of snowfall under warming in the Tibetan Plateau. J. Geophys. Res. 2017, 122, 7323–7341. [Google Scholar] [CrossRef]
- Zhang, Y.; Wei, Q.I.; Zhou, C.; Ding, M.; Liu, L.; Gao, J.; Bai, W.; Wang, Z.; Zheng, D. Spatial and temporal variability in the net primary production (NPP) of alpine grassland on Tibetan Plateau from 1982 to 2009. Acta Geogr. Sin. 2014, 24, 1197–1211. [Google Scholar] [CrossRef]
- Zeng, N.; Ren, X.; He, H.; Zhang, L.; Li, P.; Niu, Z. Estimating the grassland aboveground biomass in the Three-River Headwater Region of China using machine learning and Bayesian model averaging. Environ. Res. Lett. 2021, 16, 114020. [Google Scholar] [CrossRef]
- Wu, B.; Qian, J.; Zeng, Y. Land cover atlas of the People’s Republic of China (1:1000,000). In SinoMaps; The Xinhua News Agency: Beijing, China, 2017. [Google Scholar]
- Wang, J.; Ju, W.; Hui, Y.; Ya, L.; He, H. An interpolated temperature and precipitation dataset at 1-km grid resolution in China (2000–2012). China Sci. Data 2017, 1, 88–95. [Google Scholar]
- Zeng, N.; Ren, X.; He, H.; Zhang, L.; Li, P.; Li, Z.; Zhang, L. Aboveground biomass of grassland in the Three-River Headwaters Region based on neural network. Res. Environ. Sci. 2017, 30, 59–66. [Google Scholar]
- Kohavi, R.; John, G.H. Wrappers for feature subset selection. Artif. Intell. 1997, 97, 273–324. [Google Scholar] [CrossRef]
- Ma, W.H.; Fang, J.Y.; Yang, Y.H.; Anwar, M. Biomass carbon stocks and their changes in northern China’s grasslands during 1982–2006. Sci. China Life Sci. 2010, 53, 841–850. [Google Scholar] [CrossRef]
- Zhang, L.; Zhou, G.; Ji, Y.; Bai, Y. Spatiotemporal dynamic simulation of grassland carbon storage in China. Sci. China Earth Sci. 2016, 59, 1946–1958. [Google Scholar] [CrossRef]
- Xu, B.; Yang, X.C.; Tao, W.G.; Qin, Z.H.; Liu, H.Q.; Miao, J.M.; Bi, Y.Y. MODIS-based remote sensing monitoring of grass production in China. Int. J. Remote Sens. 2008, 29, 5313–5327. [Google Scholar] [CrossRef]
- Yu, H. Grassland Change and Its Response to Climate on the Tibetan Plateau; Lanzhou University: Lanzhou, China, 2013. [Google Scholar]
- Xia, J.Z.; Ma, M.N.; Liang, T.G.; Wu, C.Y.; Yang, Y.H.; Zhang, L.; Zhang, Y.J.; Yuan, W.P. Estimates of grassland biomass and turnover time on the Tibetan Plateau. Environ. Res. Lett. 2018, 13, 014020. [Google Scholar] [CrossRef]
- Briggs, J.M.; Knapp, A.K. Interannual Variability in Primary Production in Tallgrass Prairie: Climate, Soil Moisture, Topographic Position, and Fire as Determinants of Aboveground Biomass. Am. J. Bot. 1995, 82, 1024–1030. [Google Scholar] [CrossRef]
- Guo, Q.; Hu, Z.; Li, S.; Li, X.; Sun, X.; Yu, G. Spatial variations in aboveground net primary productivity along a climate gradient in Eurasian temperate grassland: Effects of mean annual precipitation and its seasonal distribution. Glob. Chang. Biol. 2012, 18, 3624–3631. [Google Scholar] [CrossRef]
- Zhu, K.; Chiariello, N.R.; Tobeck, T.; Fukami, T.; Field, C.B. Nonlinear, interacting responses to climate limit grassland production under global change. Proc. Natl. Acad. Sci. USA 2016, 113, 10589. [Google Scholar] [CrossRef] [PubMed]
- Piao, S.; Fang, J.; Zhou, L.; Guo, Q.; Henderson, M.; Ji, W.; Li, Y.; Tao, S. Interannual variations of monthly and seasonal normalized difference vegetation index (NDVI) in China from 1982 to 1999. J. Geophys. Res. Atmos. 2003, 108, 4401. [Google Scholar] [CrossRef]
- Quan, Q.; Tian, D.; Luo, Y.; Zhang, F.; Niu, S. Water scaling of ecosystem carbon cycle feedback to climate warming. Sci. Adv. 2019, 5, eaav1131. [Google Scholar] [CrossRef] [PubMed]


Disclaimer/Publisher’s Note: The statements, opinions and data contained in all publications are solely those of the individual author(s) and contributor(s) and not of MDPI and/or the editor(s). MDPI and/or the editor(s) disclaim responsibility for any injury to people or property resulting from any ideas, methods, instructions or products referred to in the content. |
© 2023 by the authors. Licensee MDPI, Basel, Switzerland. This article is an open access article distributed under the terms and conditions of the Creative Commons Attribution (CC BY) license (https://creativecommons.org/licenses/by/4.0/).