Article

First Experience with Zhuhai-1 Hyperspectral Data for Urban Dominant Tree Species Classification in Shenzhen, China

1
State Key Laboratory of Urban and Regional Ecology, Research Center for Eco-Environmental Sciences, Chinese Academy of Sciences, Beijing 100085, China
2
Shenzhen Ecological and Environmental Monitoring Center of Guangdong Province, Shenzhen 518049, China
3
Guangdong Greater Bay Area, Change and Comprehensive Treatment of Regional Ecology and Environment, National Observation and Research Station, Shenzhen 518049, China
4
State Environmental Protection Scientific Observation and Research Station for Ecology and Environment of Rapid Urbanization Region, Shenzhen 518049, China
5
University of Chinese Academy of Sciences, Beijing 100049, China
6
Beijing-Tianjin-Hebei Urban Megaregion National Observation and Research Station for Eco-Environmental Change, Research Center for Eco-Environmental Sciences, Chinese Academy of Sciences, Beijing 100085, China
*
Author to whom correspondence should be addressed.
Remote Sens. 2023, 15(12), 3179; https://doi.org/10.3390/rs15123179
Submission received: 26 May 2023 / Revised: 14 June 2023 / Accepted: 16 June 2023 / Published: 19 June 2023
(This article belongs to the Section Urban Remote Sensing)

Abstract

:
An accurate spatial distribution map of the urban dominant tree species is crucial for evaluating the ecosystem service value of urban forests and formulating urban sustainable development strategies. Spaceborne hyperspectral remote sensing has been utilized to distinguish tree species, but these hyperspectral data have a low spatial resolution (pixel size ≥ 30 m), which limits their ability to differentiate tree species in urban areas characterized by fragmented patches and robust spatial heterogeneity. Zhuhai-1 is a new hyperspectral satellite sensor with a higher spatial resolution of 10 m. This study aimed to evaluate the potential of Zhuhai-1 hyperspectral imagery for classifying the urban dominant tree species. We first extracted 32 reflectance bands and 18 vegetation indices from Zhuhai-1 hyperspectral data. We then used the random forest classifier to differentiate 28 dominant tree species in Shenzhen based on these hyperspectral features. Finally, we analyzed the effects of the classification paradigm, classifier, and species number on the classification accuracy. We found that combining the hyperspectral reflectance bands and vegetation indices could effectively distinguish the 28 dominant tree species in Shenzhen, obtaining an overall accuracy of 76.8%. Sensitivity analysis results indicated that the pixel-based classification paradigm was slightly superior to the object-based paradigm. The random forest classifier proved to be the optimal classifier for distinguishing tree species using Zhuhai-1 hyperspectral imagery. Moreover, reducing the species number could slowly improve the classification accuracy. These findings suggest that Zhuhai-1 hyperspectral data can identify the urban dominant tree species with accuracy and holds potential for application in other cities.

1. Introduction

Urban forests play a significant part in the urban ecosystem, supplying various ecosystem services such as fixing CO2 and releasing O2, lowering urban air temperatures, mitigating urban air pollution, isolating noise, alleviating urban floods, and providing habitats for animals [1,2,3,4]. However, there are significant differences in ecosystem service functions among different tree species [5]. The accurate evaluation of the ecosystem service effect of urban forests depends on accurate information regarding tree species composition and spatial distribution, which is also the premise of quantitative monitoring and effective evaluation of urban green quantity, biomass, and carbon stock [6,7,8,9,10,11,12]. In addition, tree species diversity is a vital parameter to characterize urban ecosystems [13]. Accurately understanding the spatial patterns of the urban dominant tree species is crucial in better evaluating the ecosystem service value of urban dominant trees, improving urban environments, and formulating urban sustainable development strategies.
The traditional method of urban dominant tree species classification is to sample randomly in the city and then investigate the tree species. This method always takes a long time and has a high cost, making it hard to implement in large areas. Remote sensing can obtain the ground surface characteristics in large regions accurately and quickly, which provides a good opportunity for the timely and low-cost classification of the urban dominant tree species. Earlier research utilized multispectral remote sensing imagery such as Landsat, Sentinel-2, SPOT, WorldView, and Quickbird to distinguish the urban dominant tree species [14,15,16,17,18]. For example, Gavier-Pizarro et al. extracted the NDVI and the brightness, greenness, and wetness components of the Tasseled Cap Transformation from Landsat data to map the spatial pattern of glossy privet in an urban area of Argentina, obtaining an overall accuracy of 84% [19]. Poortinga et al. extracted a series of vegetation indices from Landsat and Sentinel-2 data to map rubber, palm oil, and mangrove, achieving an overall accuracy of 84% [20]. Pu et al. extracted a great deal of spectral and textural features from sunlit WorldView-2 imagery to identify seven urban tree species in the city of Tampa, FL, USA, using an object-based method, achieving an overall accuracy of 67.2% [18]. Nevertheless, because of inadequate spectral information in multispectral data, tree species classification accuracy is restricted.
Hyperspectral remote sensing imagery has notable advantages in classifying various species due to its fine spectral resolution, which enables the accurate detection of small spectral differences among various ground objects. Several studies have previously used airborne hyperspectral imagery to distinguish tree species, yielding high classification accuracy [21,22,23,24]. However, the cost of obtaining airborne hyperspectral imagery is relatively high, and airborne hyperspectral data can not be obtained in many areas because of the policy of banning flights in airspace. Meanwhile, several types of spaceborne hyperspectral data (for example, HJ-1A, Hyperion, GF-5, and PRISMA) have also been used to classify tree species [25,26,27,28]. However, these hyperspectral data have a low spatial resolution (pixel size ≥ 30 m) and are not suitable for tree species classification in urban regions, where green patches are fragmented and spatially heterogeneous.
Zhuhai-1 is a new hyperspectral satellite launched by China in 2018. It is equipped with an innovative hyperspectral sensor with 32 spectral bands, which is significantly more than those of multispectral sensors. The spatial resolution of Zhuhai-1 imagery is 10 m [29], finer than other hyperspectral satellite data (pixel size ≥ 30 m). The high spatial resolution combined with the high spectral bands provided by Zhuhai-1 are expected to offer useful information for ecology applications. Zhuhai-1 hyperspectral data has proved beneficial in various applications, including land cover classification, vegetation parameter estimation, and water quality parameter estimation with positive outcomes [30,31,32]. However, no attempt has been made to use Zhuhai-1 hyperspectral data to identify the urban dominant tree species.
In this research, the new hyperspectral satellite Zhuhai-1 data was used to differentiate the urban dominant tree species for the first time. Firstly, we carried out field investigation and identification of the dominant tree species. Next, we extracted hyperspectral features from Zhuhai-1 hyperspectral data. Then, we used these features to differentiate the dominant tree species in urban areas. Following that, we examined how the classification paradigm, classifier, and species number impacted the classification accuracy. We tested this approach in Shenzhen, Guangdong Province, China, where there were 28 dominant tree species. The specific purpose was to evaluate the effectiveness of the new hyperspectral satellite Zhuhai-1 in classifying the urban dominant tree species and to identify the optimal classification paradigm and classifier.

2. Materials and Methods

2.1. Study Region

The study region was situated in Shenzhen City, Guangdong Province, southern China (113°45′44″E–114°37′21″E, 22°26′59″N–22°51′49″N; Figure 1a–c) and belongs to the subtropical marine climate zone [33]. The area is about 1997 km2, and the highest elevation is 943.7 m. The forest coverage of this study site was 55.56% in 2017 [34], and the forest is classified as a subtropical evergreen broadleaf forest.

2.2. Zhuhai-1 Hyperspectral Remote Sensing Data

The Zhuhai-1 Orbita Hyper Spectral satellite equipped with a hyperspectral sensor was launched on 26 April 2018 by Zhuhai Orbita Aerospace Technology Co., Ltd. (Zhuhai, China). The satellite flies at 500 km altitude and captures hyperspectral images at a spatial resolution of 10 m. Zhuhai-1 data has 32 spectral bands; the detailed band information is shown in Table 1. In this research, we used four cloudless Zhuhai-1 hyperspectral images from October 1 and 16, 2019 to classify the urban dominant tree species. The weather was sunny and cloudless when the data were obtained.

2.3. Land Cover Data

Qian et al. [34] obtained a land cover distribution map of Shenzhen in 2017 by utilizing high-resolution remote sensing data from SPOT 6 with a spatial resolution of 1.5 m. They classified the land cover types in Shenzhen into eight types, which were tree, grass, water, bare soil, building, road, construction, and impervious surface. The land cover type data had a classification accuracy of 88.67% with a corresponding kappa coefficient of 0.86 [34]. In this research, we classified tree species in the tree area of Shenzhen. Therefore, we extracted urban forest area from the land cover classification results of Qian et al. [34]. The forest area in Shenzhen is shown in Figure 1c.

2.4. Field Investigation Data

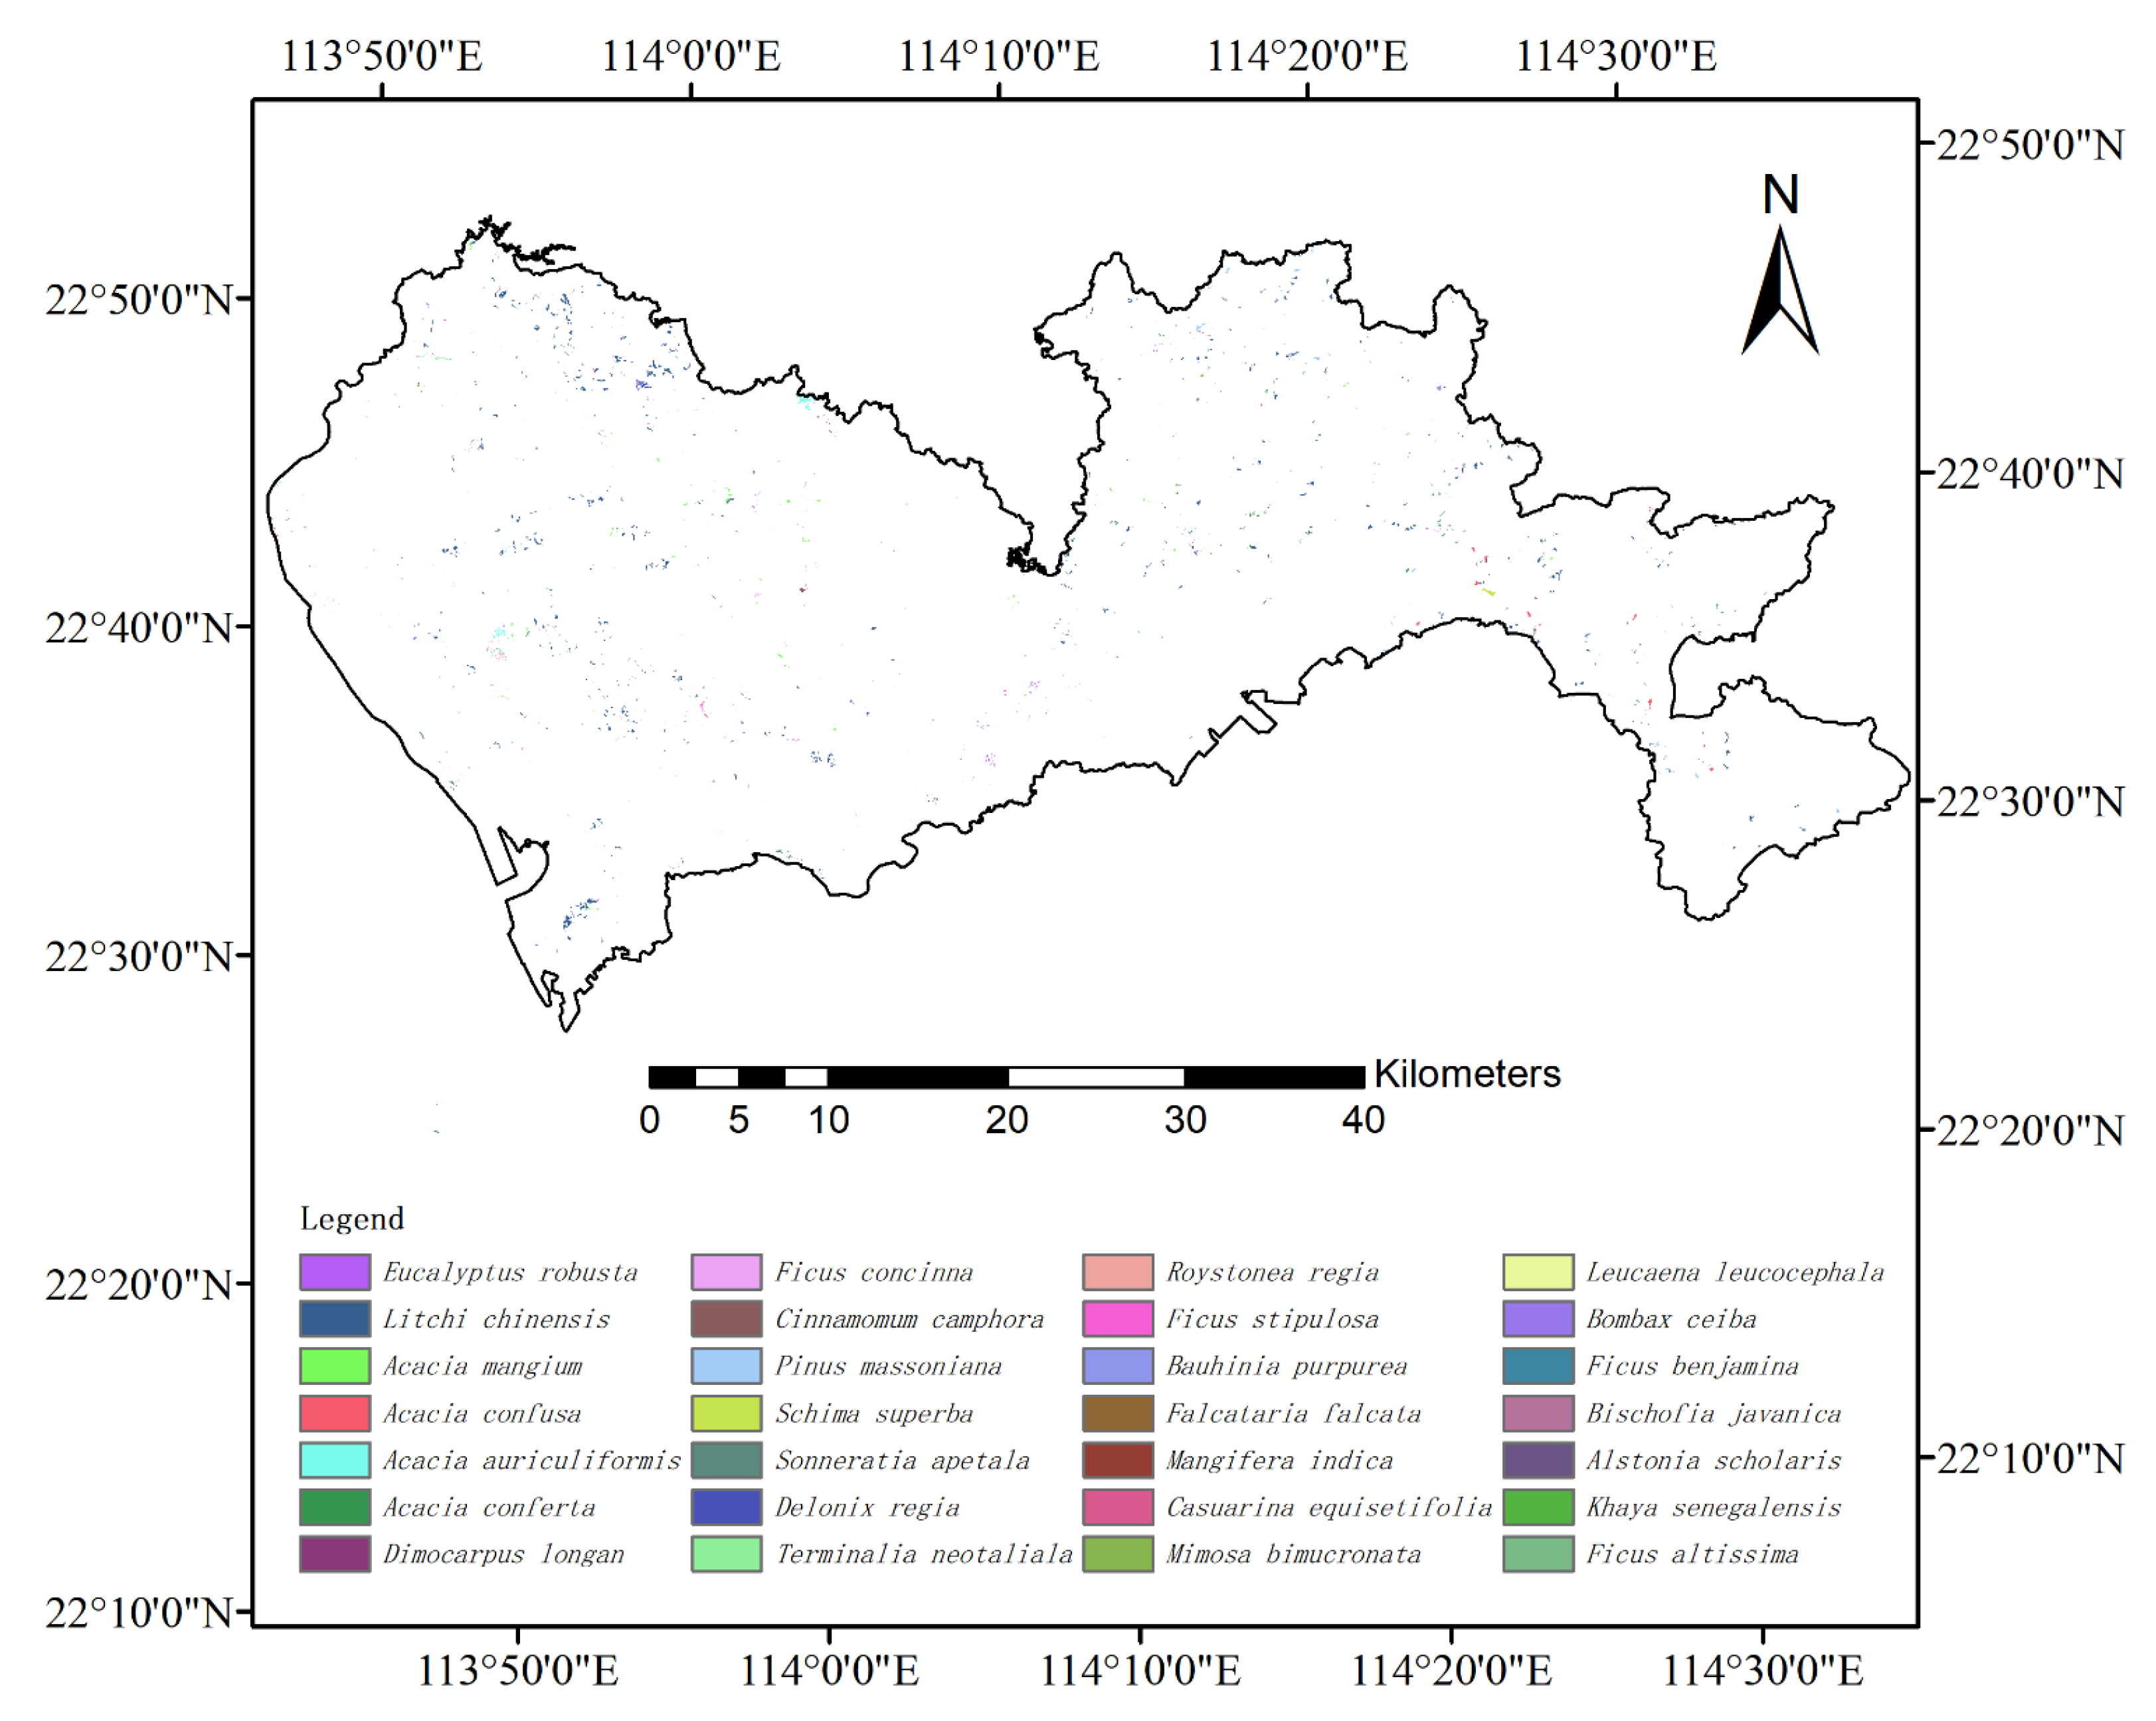
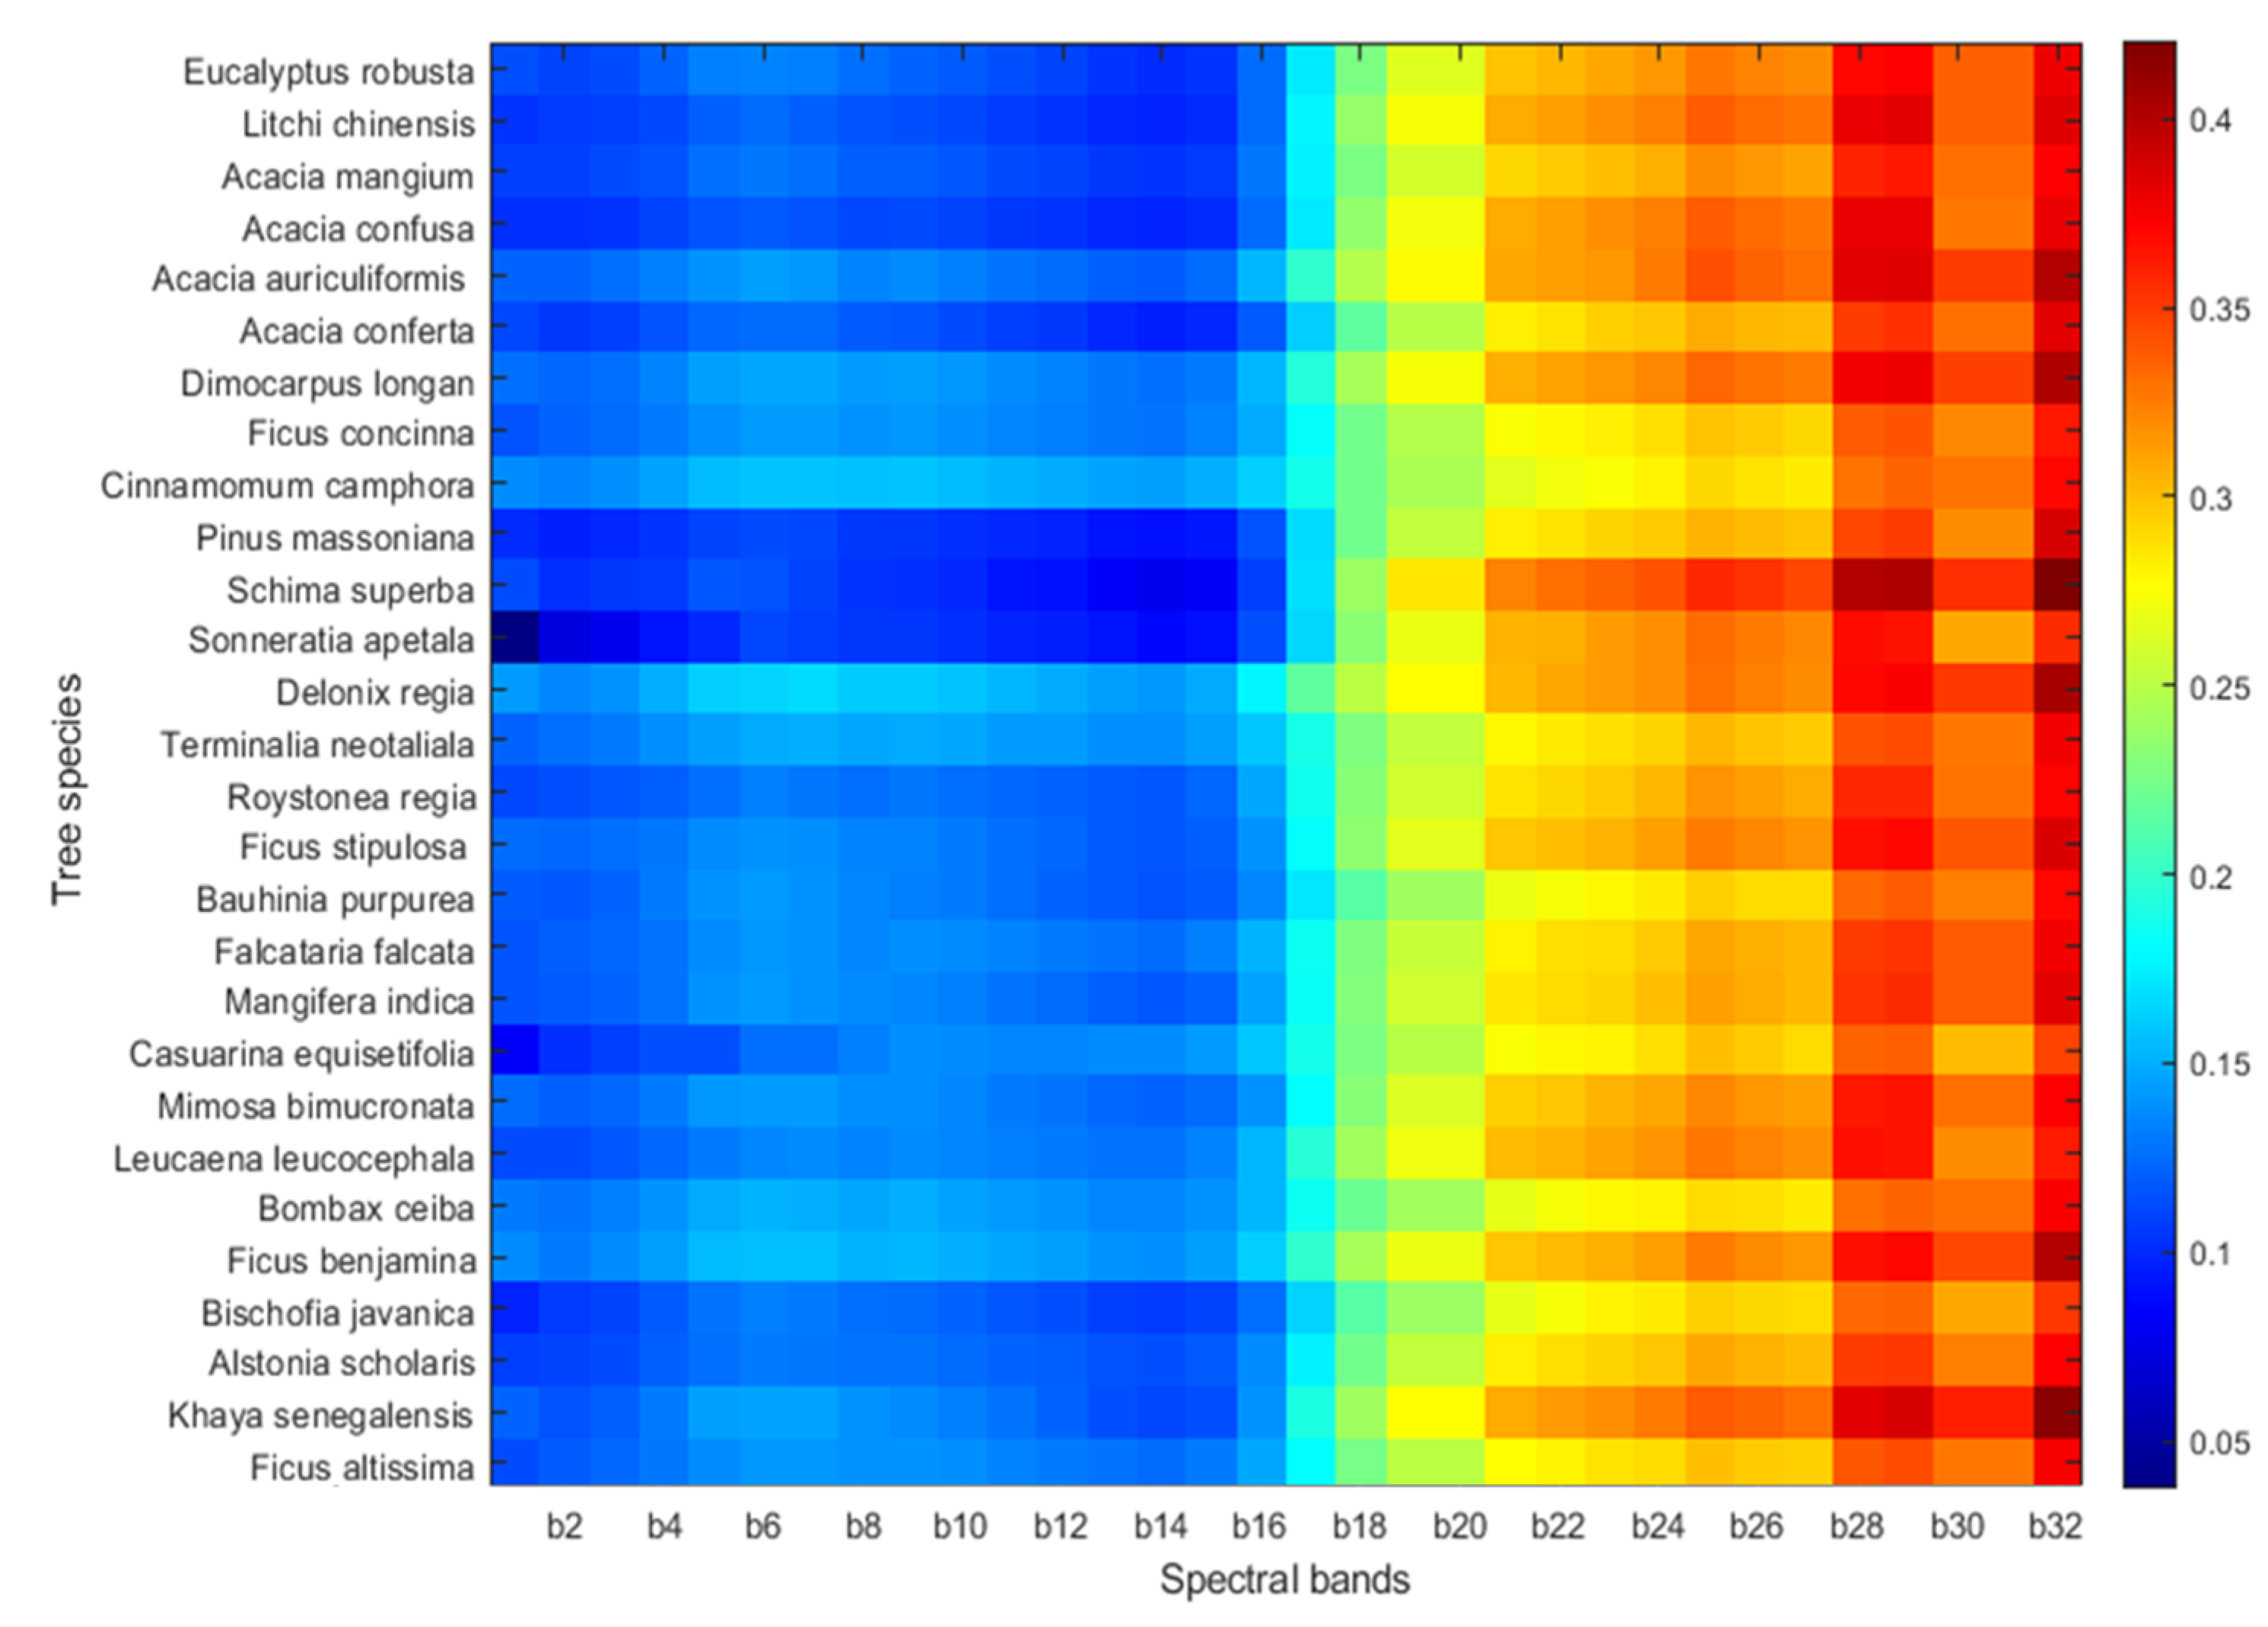
In order to collect field investigation data, we carried out field investigations in July 2018 and July 2019. We selected 4823 patches from the urban forest areas of the study region, and then the dominant tree species of each patch were visually identified in the field by plant ecologists. A high-precision Global Positioning System (GPS) was used to measure the geographical coordinates of each patch. The field investigation results showed that there were 28 main dominant tree species in Shenzhen, which were Eucalyptus robusta, Litchi chinensis, Acacia mangium, Acacia confuse, Acacia auriculiformis, Acacia conferta, Dimocarpus longan, Ficus concinna, Cinnamomum camphora, Pinus massoniana, Schima superba, Sonneratia apetala, Delonix regia, Terminalia neotaliala, Roystonea regia, Ficus stipulosa, Bauhinia purpurea, Falcataria falcata, Mangifera indica, Casuarina equisetifolia, Mimosa bimucronata, Leucaena leucocephala, Bombax ceiba, Ficus benjamina, Bischofia javanica, Alstonia scholaris, Khaya senegalensis, and Ficus altissima from greatest to least. Figure 2 displays the spatial distribution of all field samples, covering a total of 101,384 pixels of the Zhuhai-1 hyperspectral imagery, which was about 10.14 km2 in area. The average spectral reflectance for the 28 main tree species can be observed in Figure 3. The forested areas of the southern part had relatively few field samples because the forests in this area are continuously and widely distributed and densely grown, making it difficult for people to enter these areas for field investigation. Although the number of field samples in the southern forested areas was relatively small, the dominant tree species in these areas were relatively simple and basically consistent with the surrounding areas.

2.5. Methods

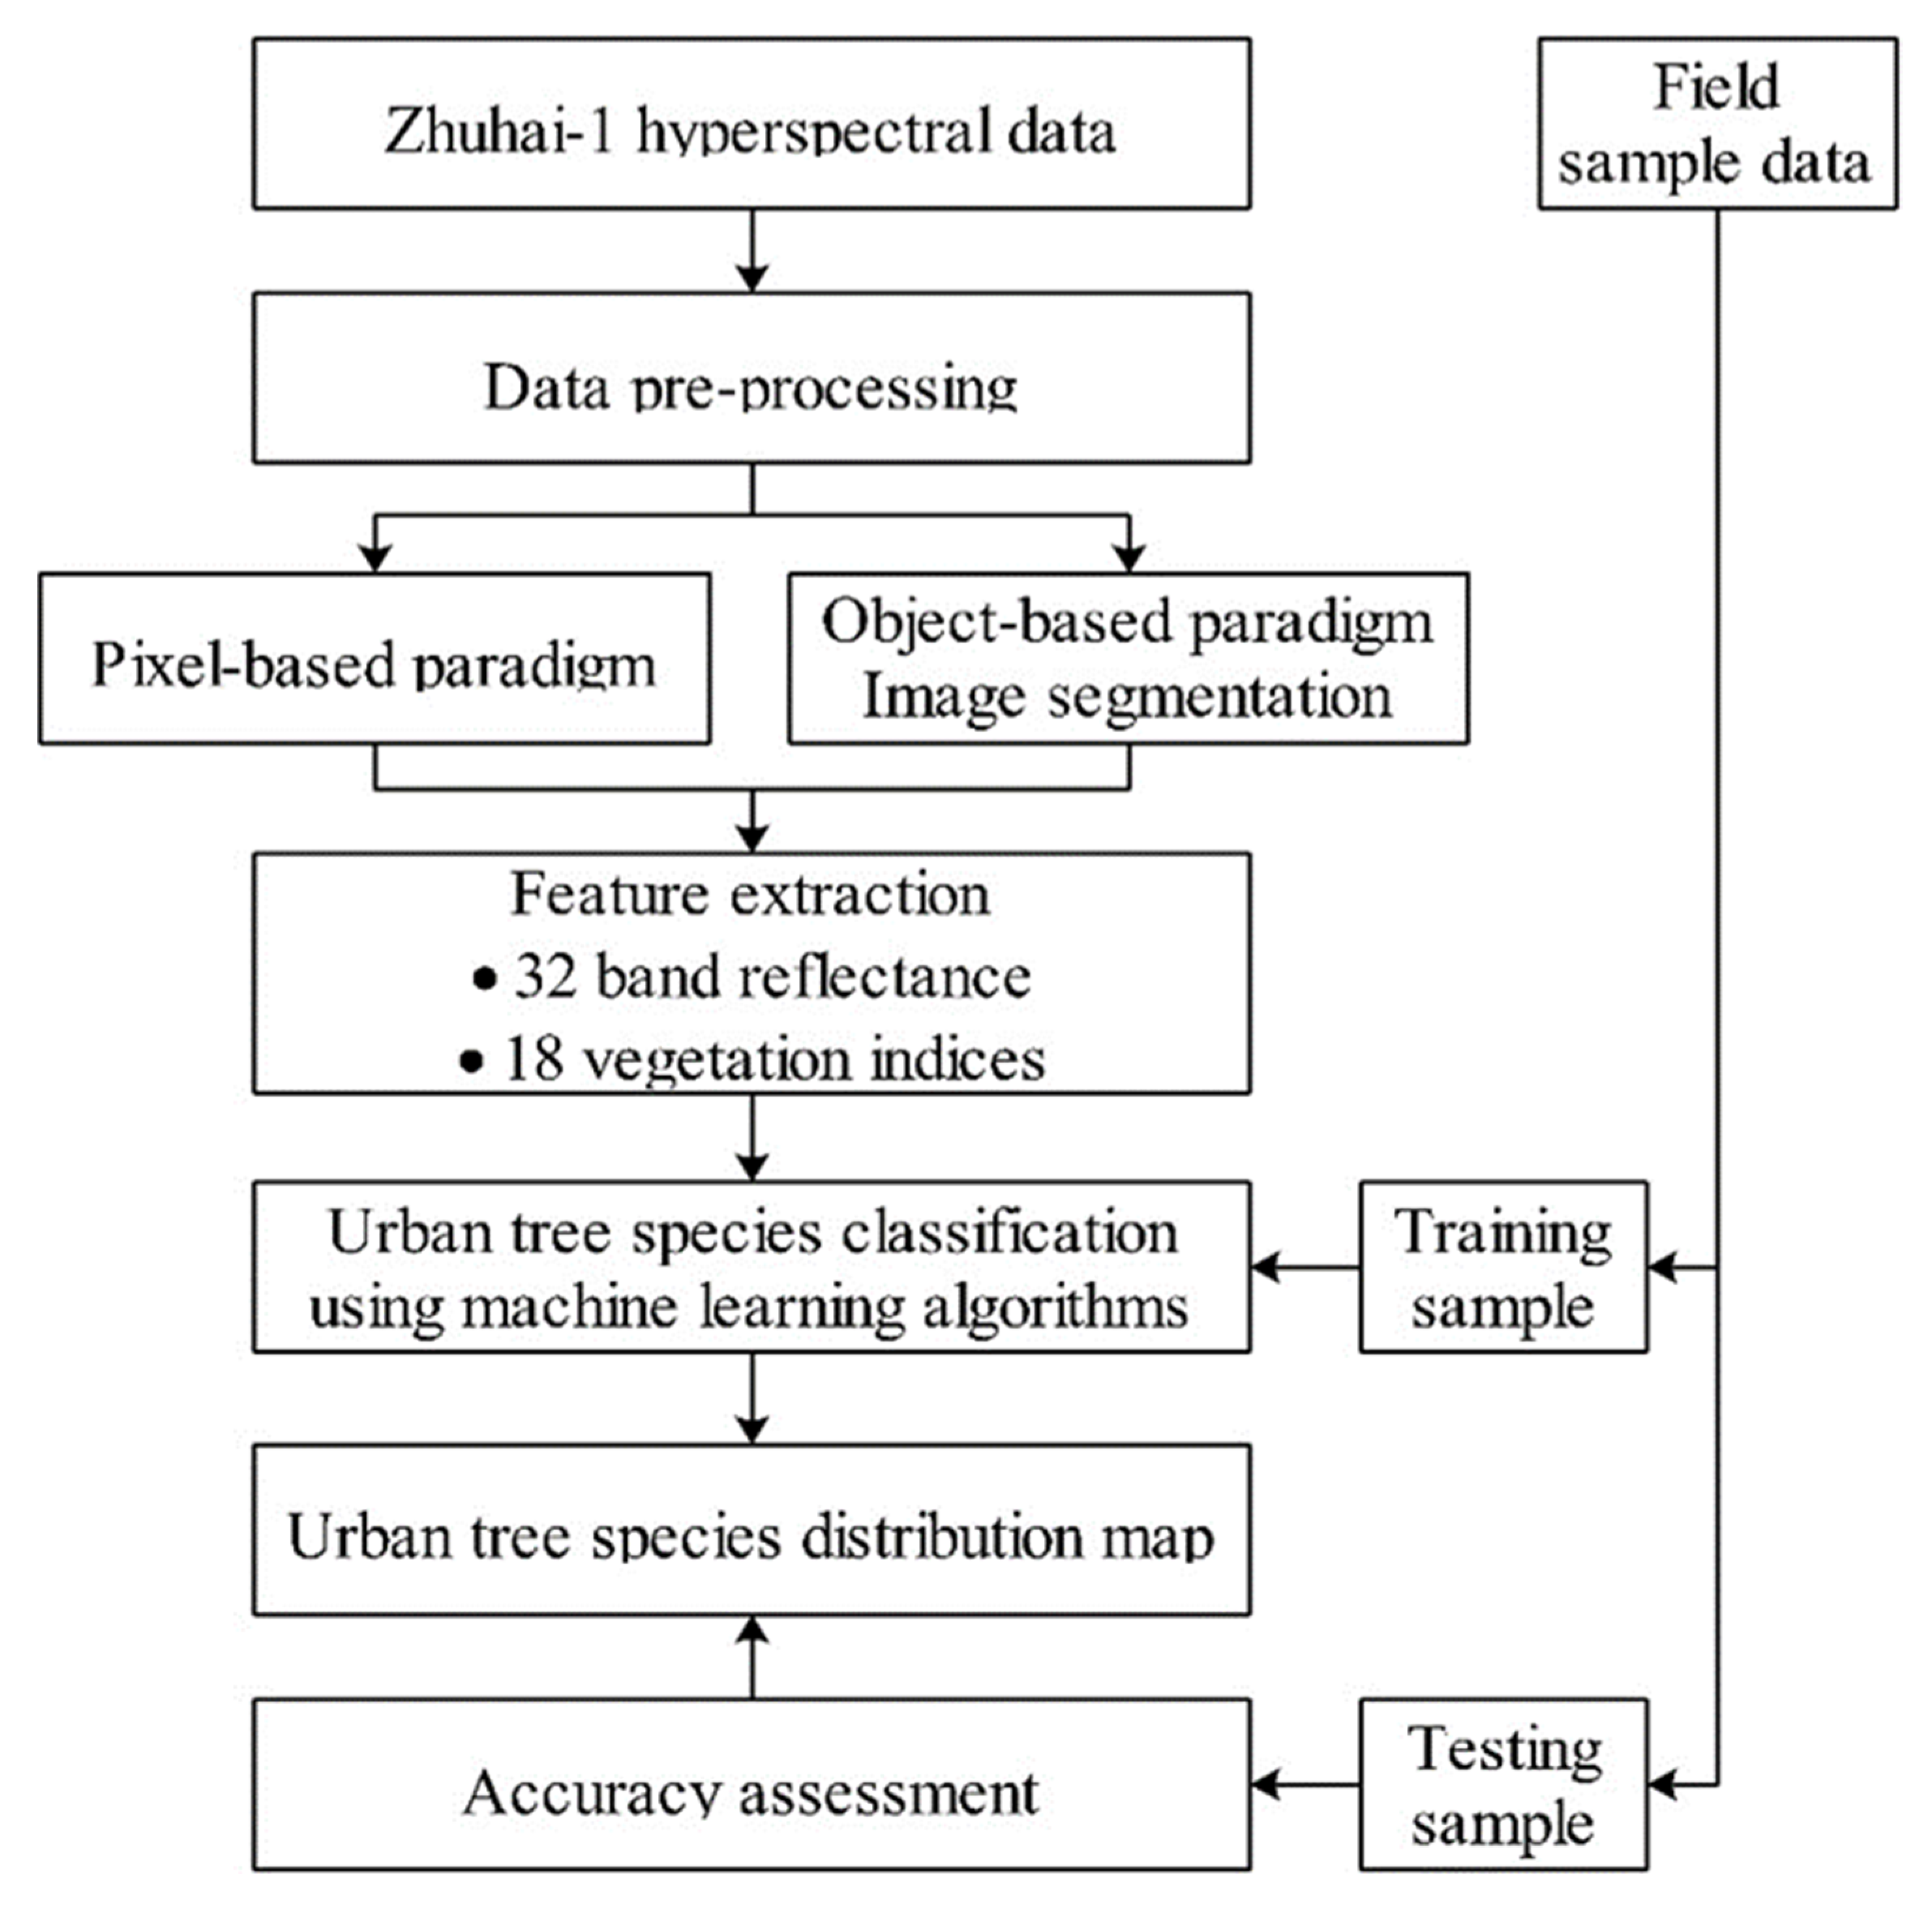
This study employed machine learning algorithms to classify the urban dominant tree species at both the pixel and object levels using Zhuhai-1 hyperspectral data. Figure 4 illustrates the process flowchart, which comprises five steps: (1) preprocessing raw hyperspectral data; (2) segmenting images; (3) extracting hyperspectral features; (4) classifying the urban dominant tree species using machine learning methods; and (5) evaluation of classification accuracy. Finally, the optimal classification model was employed to produce a spatial distribution map of the dominant tree species.

2.5.1. Data Preprocessing

To obtain the hyperspectral reflectance bands, we preprocessed the Zhuhai-1 hyperspectral remote sensing data using ENVI 5.3 software. At first, we transformed the Zhuhai-1 hyperspectral digital value into radiance at the atmosphere’s top using the standard radiometric calibration formula and coefficients provided by the data producer [35]. Next, we used the FLAASH atmospheric correction module embedded in ENVI 5.3 software, in which the tropical atmospheric model and the urban aerosol model were the key input parameters, to carry out atmospheric correction of the hyperspectral data to obtain the surface reflectance [36]. Then, we used the seamless mosaic tool to mosaic the four hyperspectral images that covered the study area. Finally, we used a polygon of Shenzhen City as the mask to extract the hyperspectral data. After the above data preprocessing, we obtained 32 reflectance bands from the Zhuhai-1 hyperspectral data in the entire study region.

2.5.2. Image Segmentation

We used two classification paradigms to classify tree species: pixel- and object-based paradigms. For the object-based tree species classification, image segmentation was first carried out on the hyperspectral data. We used the multiresolution segmentation method embedded in Trimble eCognition Developer 9.5.1 to produce objects from the Zhuhai-1 hyperspectral images [37]. Multiresolution segmentation method refers to the generation of image objects with minimum heterogeneity and maximum homogeneity at any scale on the premise of minimizing the loss of image information [37,38]. Its key parameters include the scale and compactness/smoothness weight [37]. Thirty-two bands of Zhuhai-1 hyperspectral data were used as input. We tested the parameters based on experience and visually evaluated the segmentation results. As a result, we set the scale as 10 and the compactness/smoothness weight as 0.5/0.5.

2.5.3. Hyperspectral Feature Extraction

For each pixel and object, 50 features were extracted from the Zhuhai-1 hyperspectral data, including 32 spectral reflectance bands and 18 vegetation indices. At the pixel level, the 32 spectral reflectance bands were obtained directly from the preprocessed hyperspectral image. The 18 vegetation indices of each pixel were calculated using ENVI 5.3 software [33]. These vegetation indices can characterize the structural and physiological features of trees and have demonstrated effectiveness in the classification of tree species [39,40,41]. Table 2 lists the vegetation indices and their formulas used in this study. At the object level, 32 reflectance bands and 18 vegetation indices were determined according to the average value of all pixels in each object.

2.5.4. Tree Species Classification

A random forest classifier was used to classify the urban dominant tree species in this study. The random forest classifier was proposed by Leo Breiman [59]. It contains multiple decision trees, and the mode of categories obtained by all the decision trees determines the category of the classification. The random forest classifier has strong robustness and can deal with multiple collinear relationships well. Two parameters (ntree and mtry) were necessary for modeling; these were set to 500 and 7, respectively, according to Immitzer et al. [17,60] Because of its high classification accuracy, the random forest classifier has been successfully used in tree species classification [26,61,62,63,64]. In this study, we input 32 hyperspectral reflectance bands and 18 vegetation indices into the random forest classifier to classify the urban dominant tree species and identify important features. We randomly selected 70% of the field samples of each tree species to train the random forest classifier and then used the remaining 30% of the field samples for verification purposes.

2.5.5. Accuracy Assessment

To evaluate the accuracy of tree species classification, we utilized the confusion matrix method (Table 3), which is a widely accepted technique in assessing classification accuracy [33,65,66]. The accuracy metrics include user accuracy, producer accuracy, overall accuracy, and the kappa coefficient [67]. The calculation methods of producer accuracy and user accuracy are shown in Table 3. The overall accuracy is determined by the proportion of correctly classified pixels or objects to the total number of pixels or objects; its calculation method is shown in Equation (1). The kappa coefficient is a statistical measure of the agreement or reliability of the classification outcomes; its calculation is shown in Equations (2) and (3). For specifics regarding the calculation approaches for user accuracy, producer accuracy, overall accuracy, and the kappa coefficient, please refer to Qin et al. [33,68].
O A = a + e + i r
p e = o × l + p × m + q × n r × r
k = O A p e 1 p e

3. Results

3.1. Feature Importance

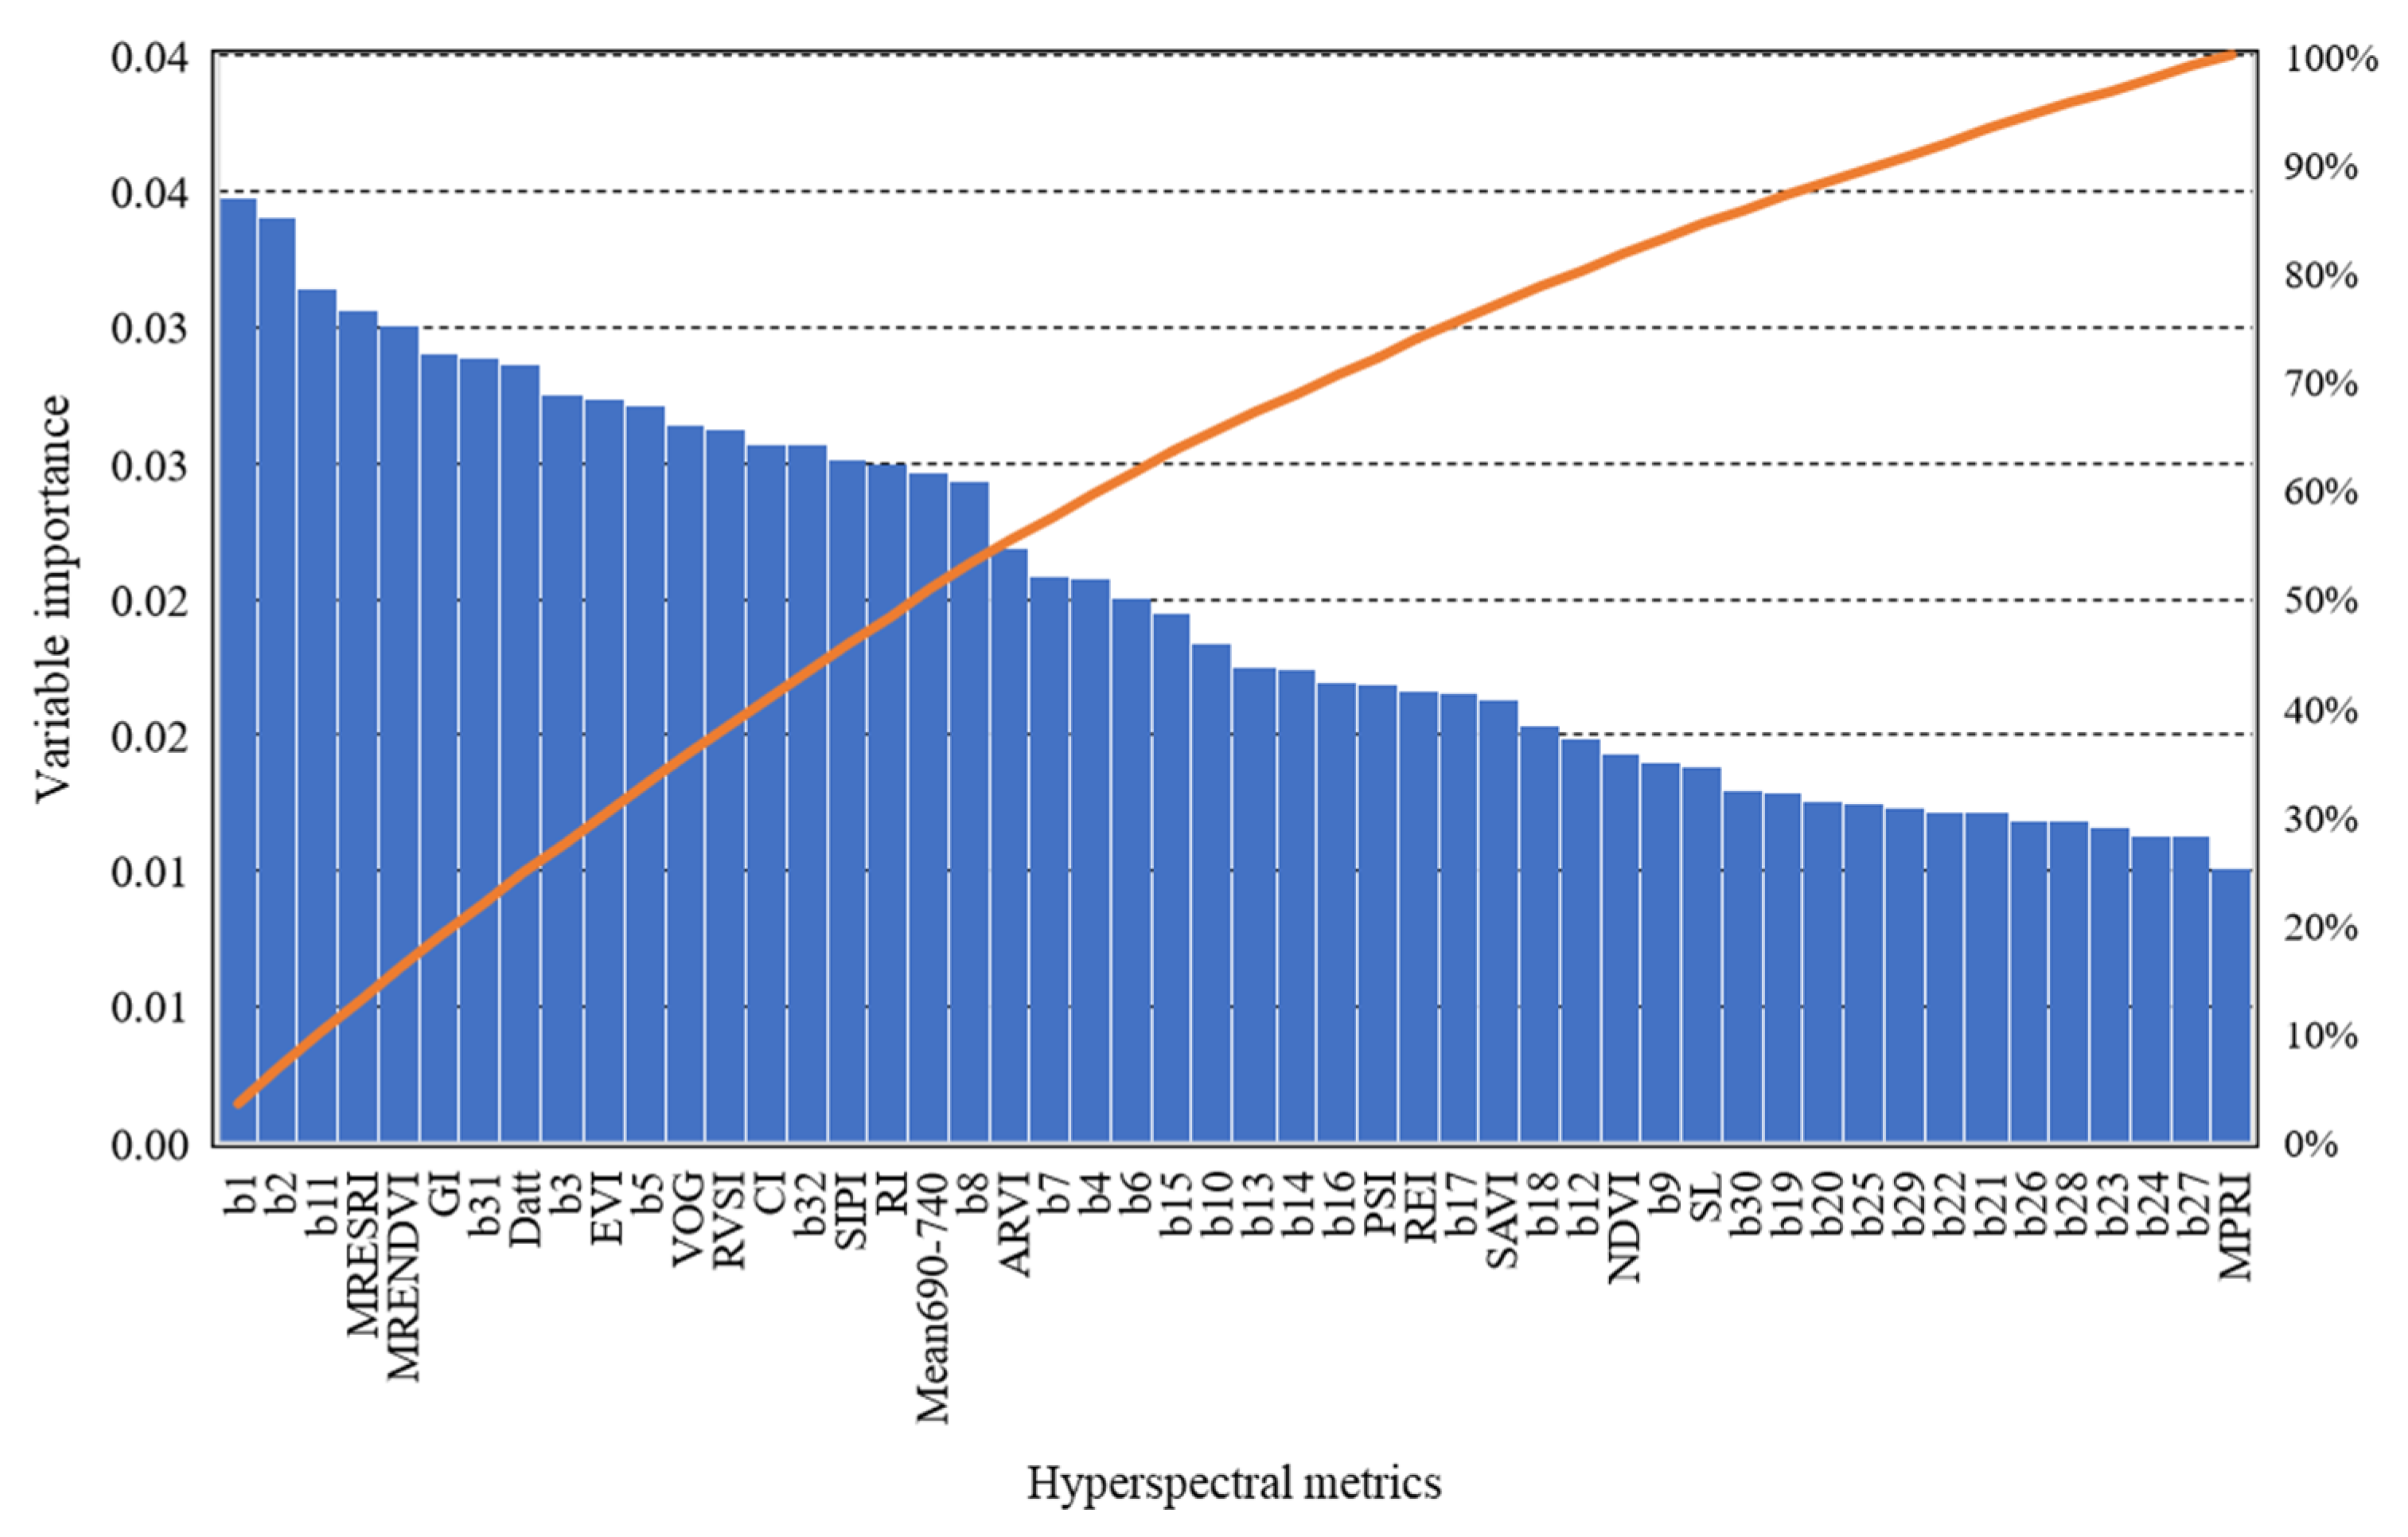
Figure 5 displays the variable importance of all 50 hyperspectral features for classifying the urban dominant tree species using the random forest classifier. The three most important features were hyperspectral reflectance, which were b1, b2, and b11, respectively. Among the hyperspectral vegetation indices, MRESRI held the most significance, followed by MRENDVI and GI. The total percentage of variable importance for the first 18 features was over 50%, and that of the first 30 features was over 70%. Among the top 18 important features, 7 features were hyperspectral reflectance bands and 11 features were hyperspectral vegetation indices. Among the 30 most important features, 14 features were hyperspectral vegetation indices and 16 features were hyperspectral reflectance. In general, the contributions of the hyperspectral reflectance bands and vegetation indices to the tree species classification were similar.

3.2. Pixel-Based Tree Species Classification Using the RF Classifier

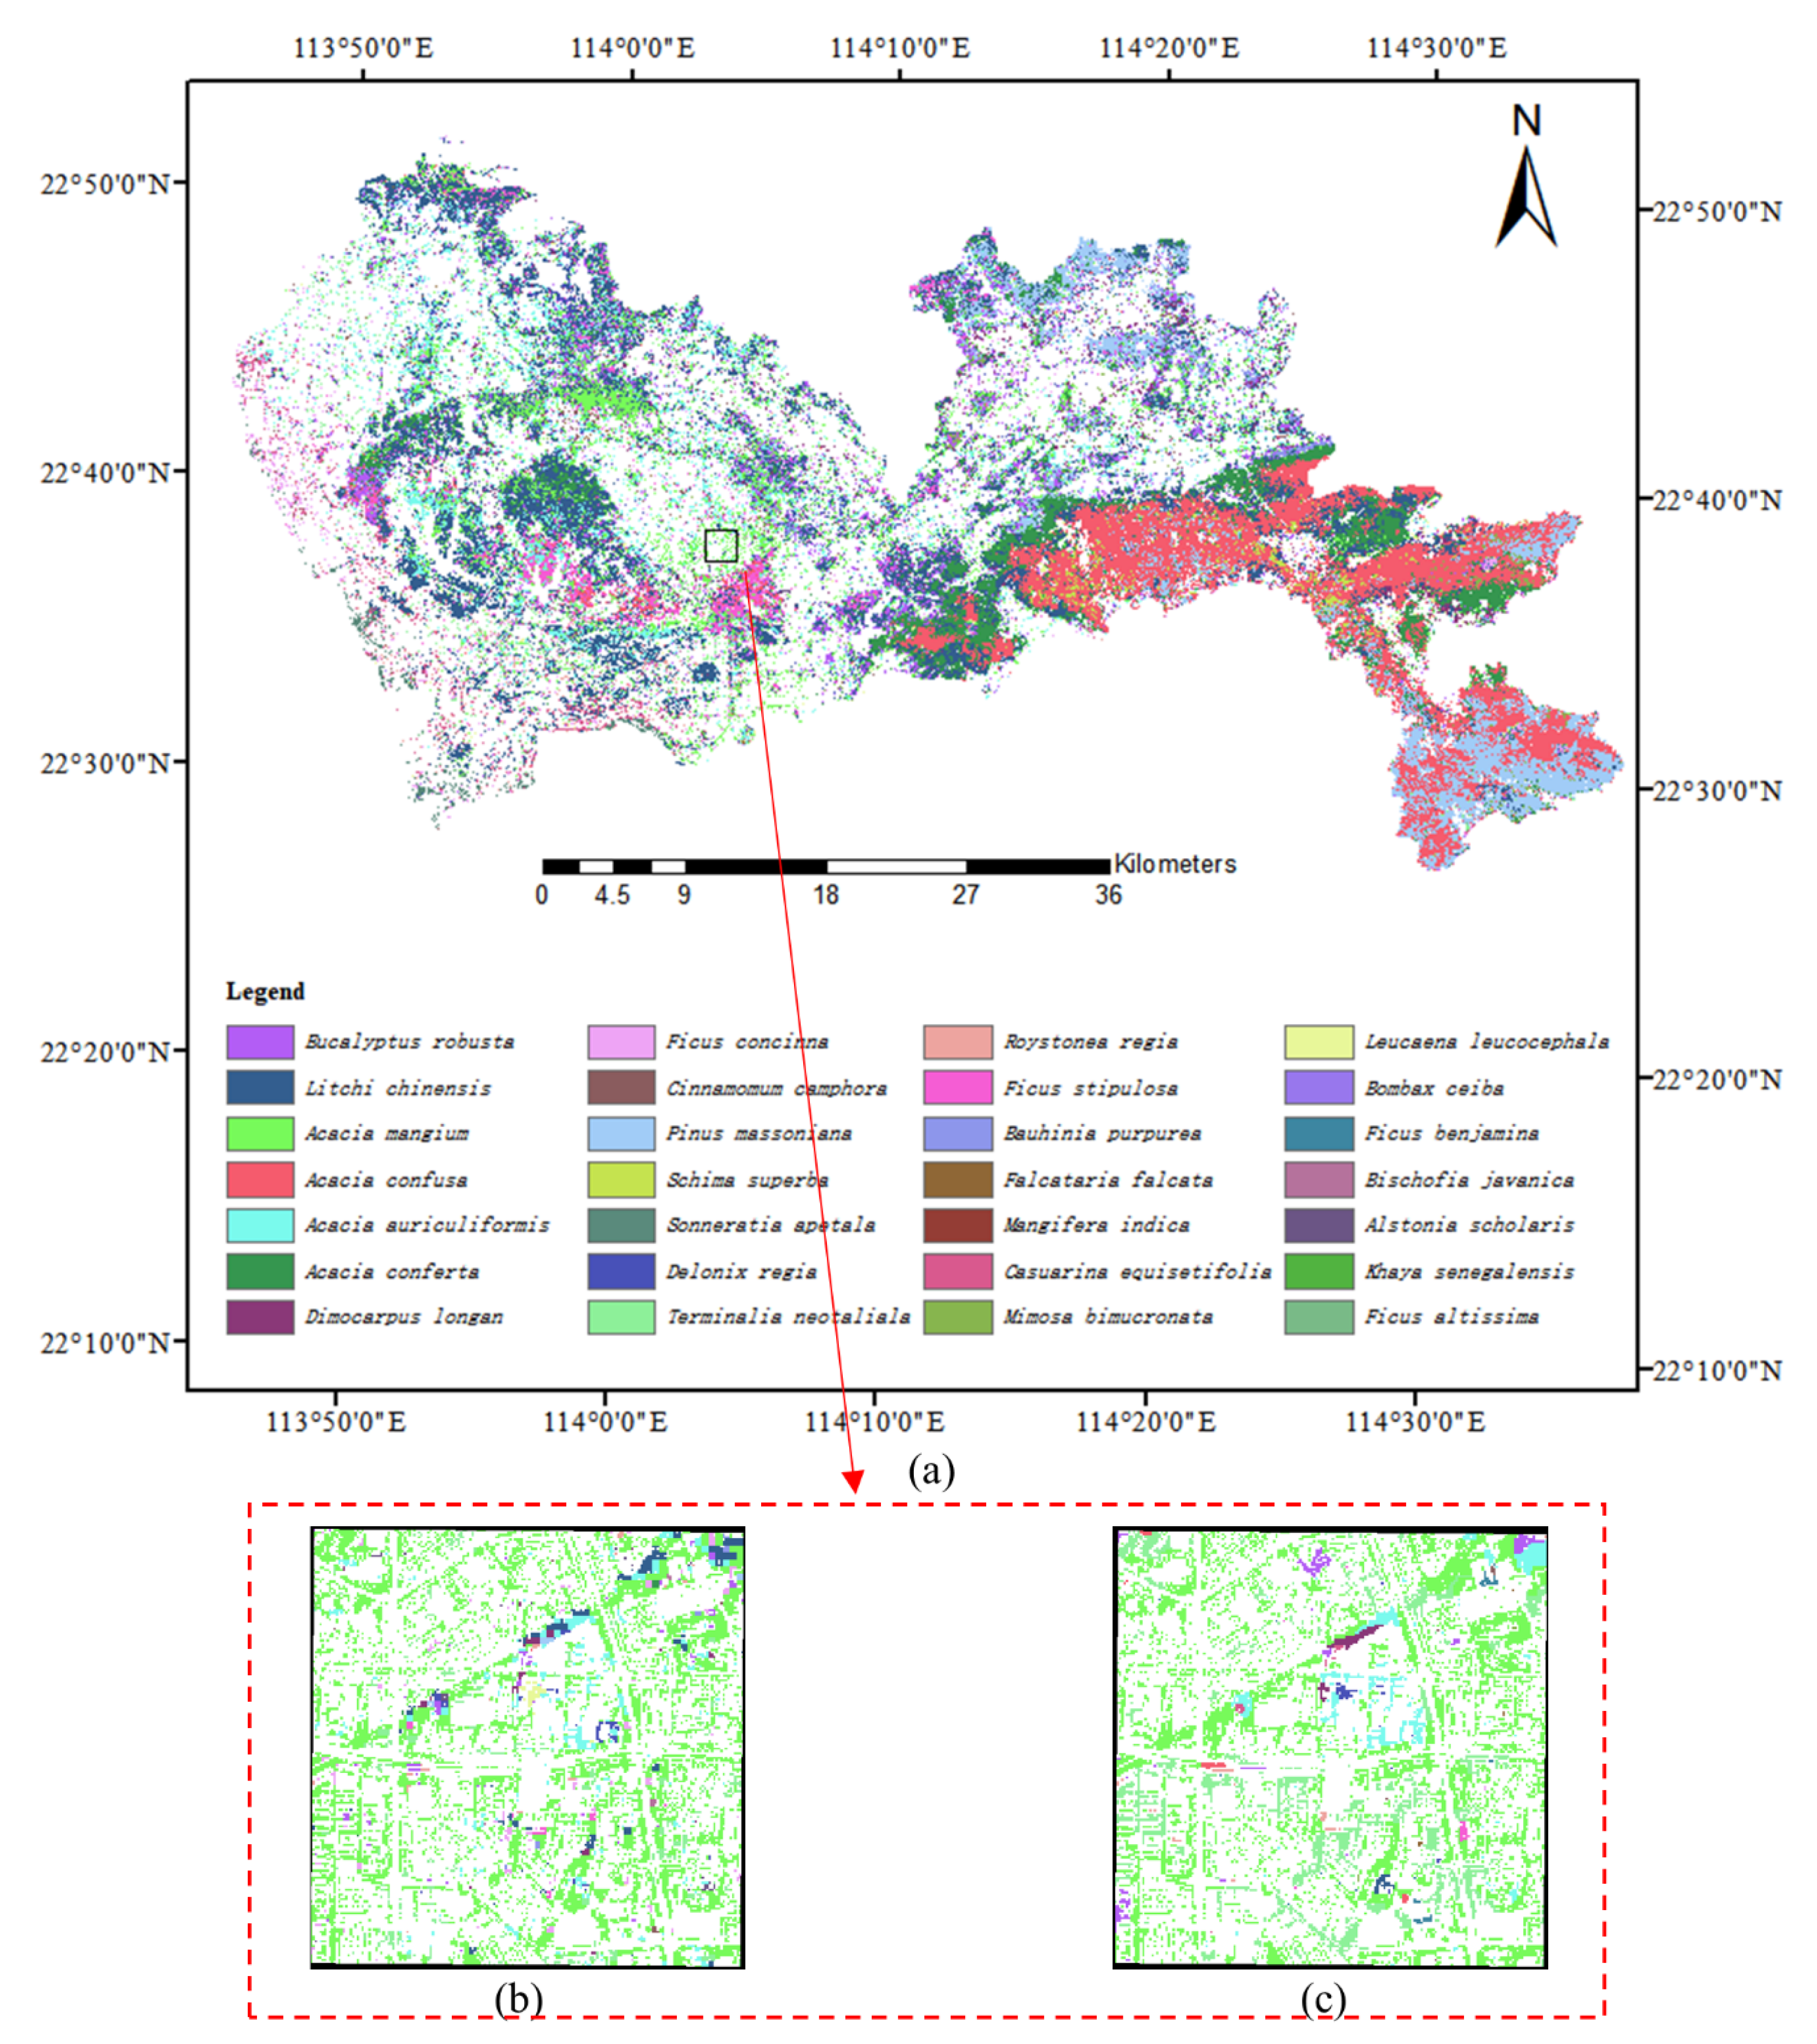
Table 4 shows the classification accuracy of 28 main species based on three feature sets, namely the hyperspectral reflectance bands, the vegetation indices, and a combination of both. All three feature sets resulted in satisfactory classification results. The classification accuracy of the 32 hyperspectral reflectance bands (OA = 76.5% and kappa = 0.75) was slightly higher than that of the 18 vegetation indices (OA = 75.6% and kappa = 0.74). Combining the reflectance bands with vegetation indices could marginally enhance the classification accuracy (overall accuracy = 76.8% and kappa = 0.75). The pixel-based tree species classification results using the random forest classifier derived from all hyperspectral features are presented in Figure 6a. Although the user accuracy across all tree species was well-balanced, the producer accuracy was largely inconsistent. All results from the classification accuracy assessment using all hyperspectral features are shown in Table 5. The most accurately classified tree species were Schima superba, Sonneratia apetala, Terminalia neotaliala, Mangifera indica, Bischofia javanica, Alstonia scholaris, and Khaya senegalensis, with producer and user accuracies exceeding 80%.

3.3. Pixel- vs. Object-Based Classification Results

We implemented object-based classification by utilizing the random forest classifier and all hyperspectral features to investigate whether it could improve the tree species classification accuracy. We found that the pixel-based paradigm (OA = 76.8% and kappa 0.75) was slightly superior to the object-based paradigm (OA = 76.5% and kappa = 0.74). Therefore, when using Zhuhai-1 hyperspectral data to distinguish the urban dominant tree species, the pixel-based classification paradigm was slightly better than object-based classification paradigm. Since there were no obvious differences between our pixel- and object-based classification results, only the pixel-based tree species classification results for the entire study area are displayed in Figure 6a. To show the detailed differences between the two results, we chose a small area of the study region (2 km × 2 km) to compare the pixel-based classification results (Figure 6b) and object-based classification results (Figure 6c), and the results showed that the main difference was that pixel-based classification result had more noise points.

3.4. Performance Comparison among the Four Classifiers

In order to explore whether different classifiers affected the accuracy of tree species differentiation, we employed the random forest, support vector machine, Bayes, and K-nearest neighbor classifiers to classify tree species based on all hyperspectral features. The results indicated that the RF classifier achieved the highest classification accuracy, followed by KNN (OA = 62.3% and kappa = 0.60), Bayes (OA = 61.4% and kappa = 0.59), and SVM (OA = 43.2% and kappa = 0.38) when distinguishing the urban dominant tree species using Zhuhai-1 hyperspectral data. Therefore, the RF classifier was the recommended classifier for urban dominant tree species classification.

3.5. Effect of Species Number on Tree Species Classification

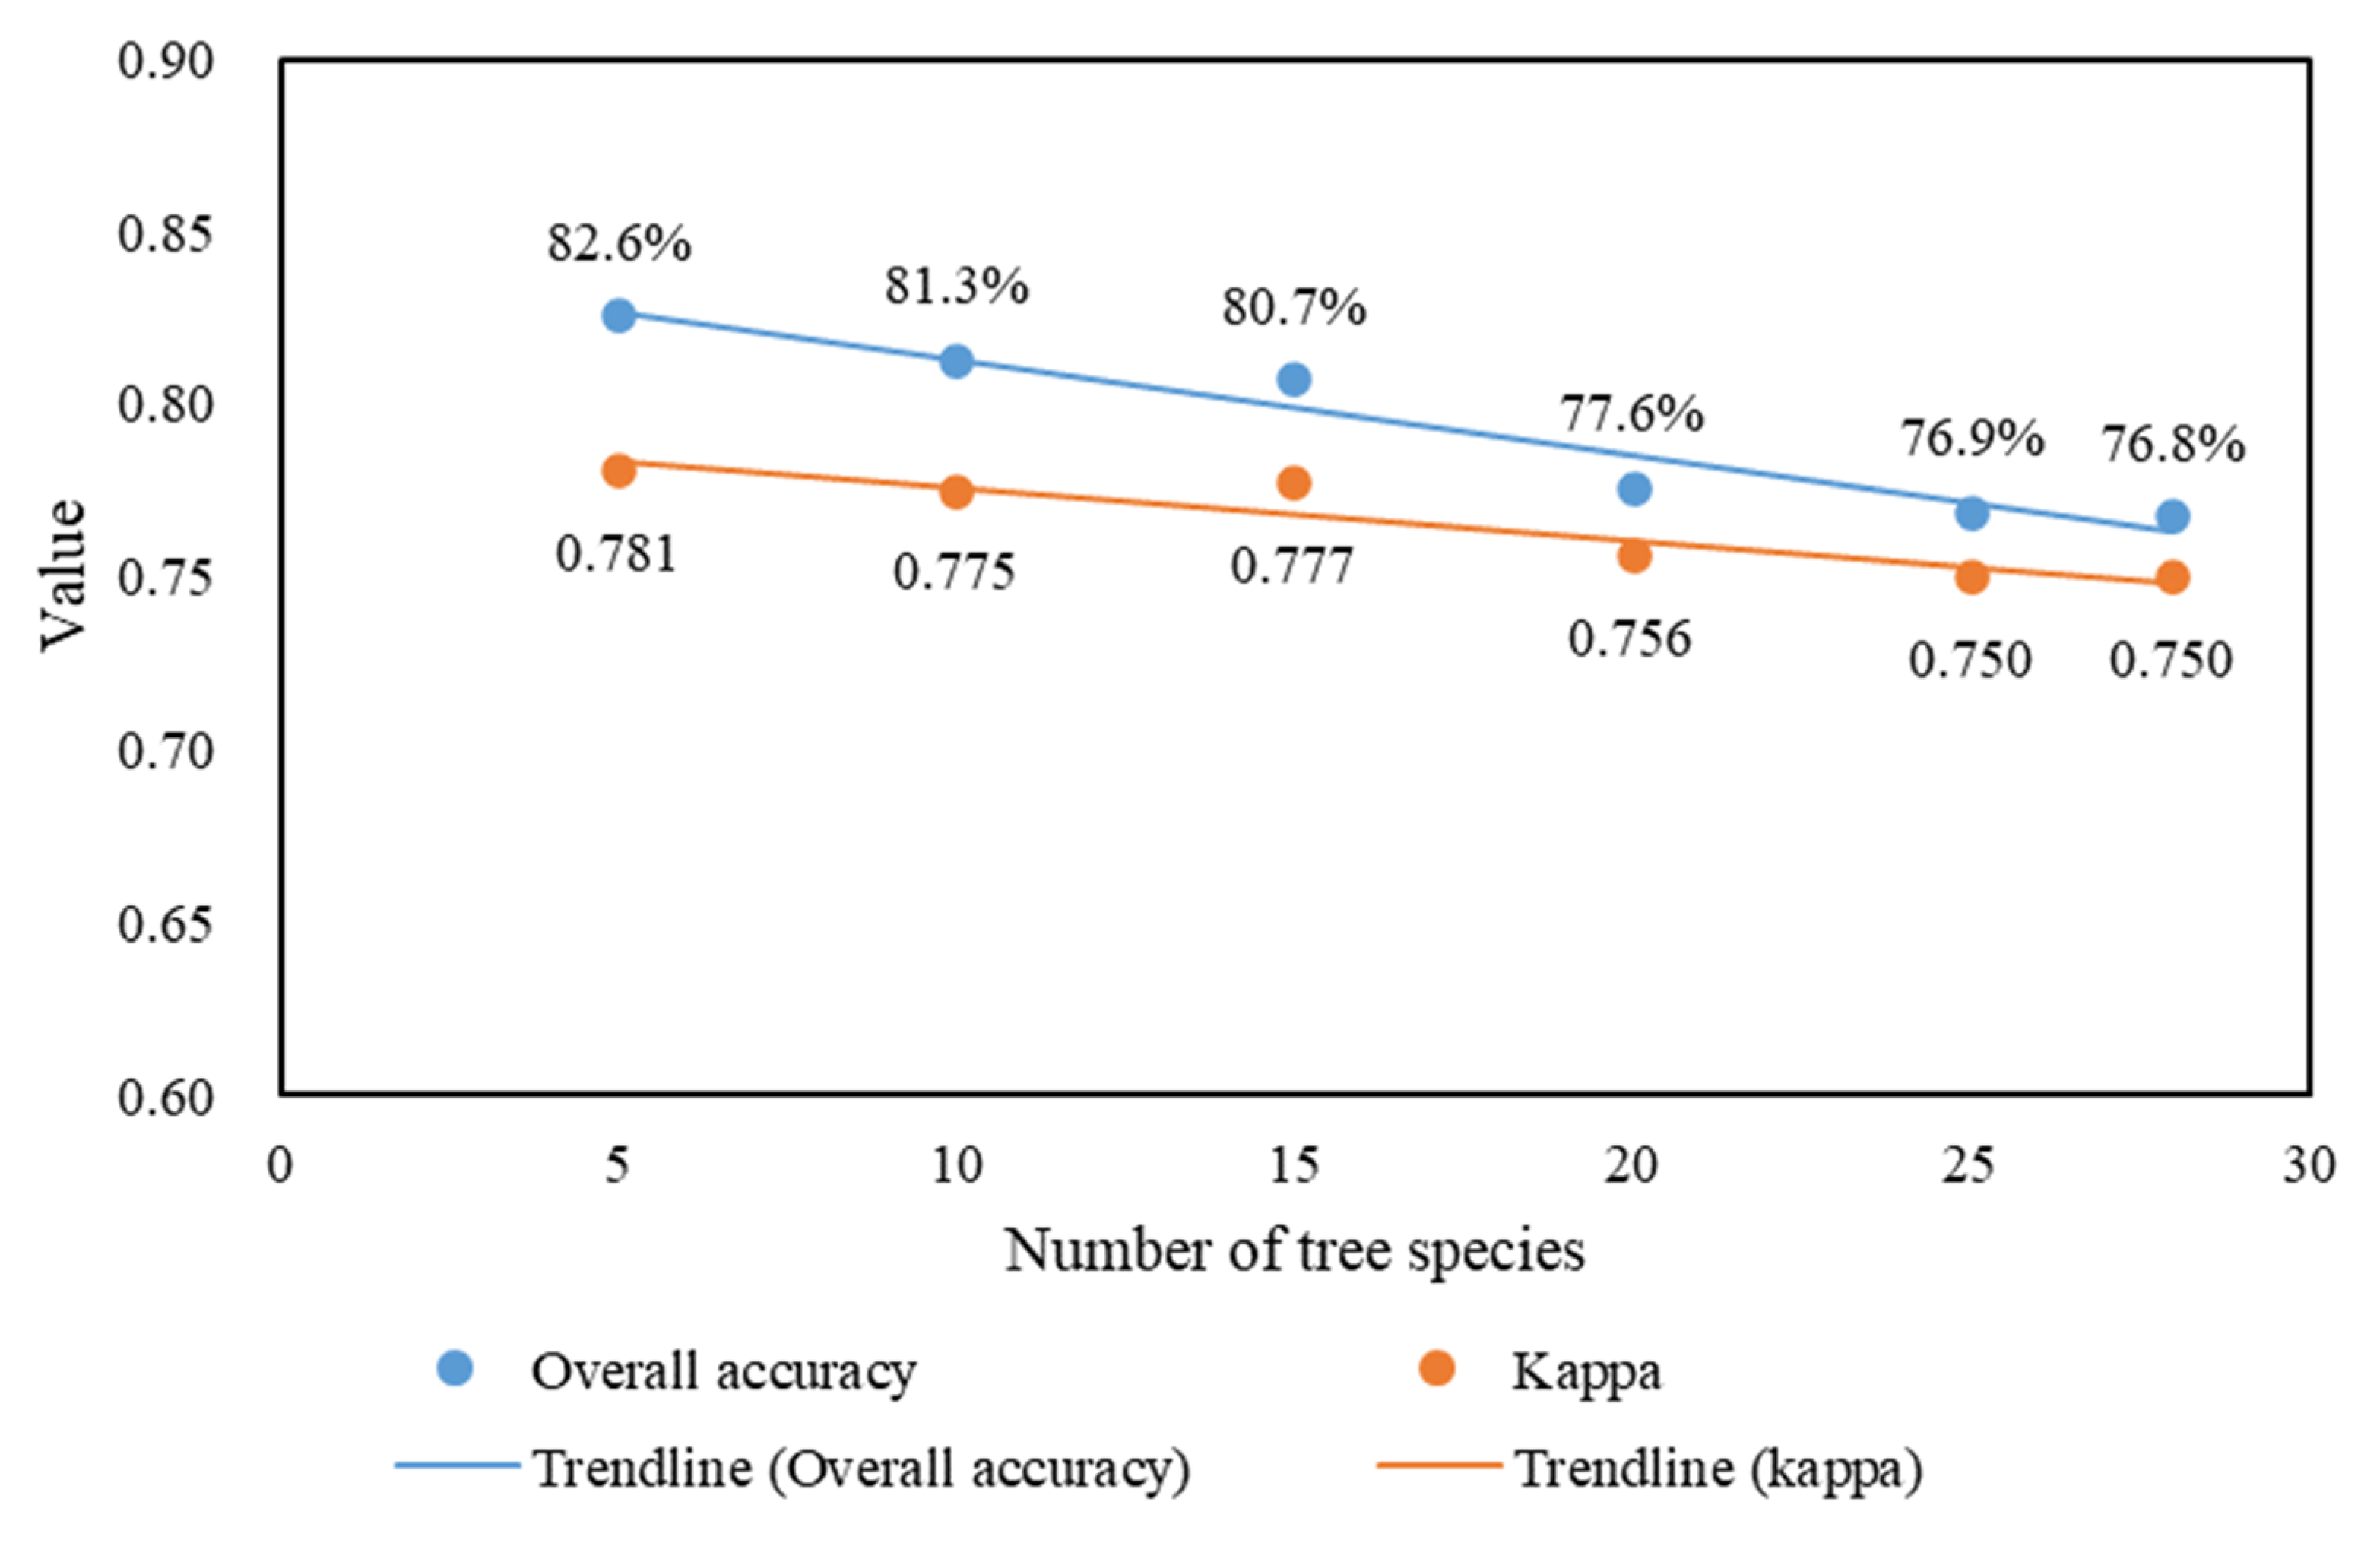
To investigate the impact of species number on tree species classification accuracy, we evaluated the classification accuracy using all hyperspectral features with the species number ranging from 5 to 28. We selected 5, 10, 15, 20, 25, and 28 tree species for classification according to the list of tree species sorted from greatest to least obtained in the field investigation (Section 2.4). We used the training samples of the selected tree species for classification, and then used the verification samples of these tree species to evaluate the accuracy. Therefore, we did not delete the pixels dominated by the eliminated species during the classification process. The relationship between the classification accuracy and species number is illustrated in Figure 7. We found that as the species number increased from 5 to 28, the classification accuracy decreased slowly. However, when the species number increased from 15 to 20, the classification accuracy decreased obviously. The overall accuracy was 82.6% when there were five tree species, while it decreased to only 76.8% when there were 28 tree species.

4. Discussion

4.1. Performance of Zhuhai-1 Hyperspectral Data in Urban Dominant Tree Species Classification

This research first assessed the capability of the new hyperspectral satellite Zhuhai-1 imagery to differentiate the urban dominant tree species, achieving a satisfactory classification accuracy of 76.8%. It outperformed the previous studies employing multispectral satellite data such as that from Sentinel-2, Landsat, and Ziyuan-3 [17,66,69,70,71]. The higher spectral resolution and additional spectral bands of the Zhuhai-1 imagery make it more suitable for distinguishing tree species in regions with abundant species. The higher spatial resolution of the Zhuhai-1 hyperspectral data compared to other hyperspectral satellite data such as HyspIRI (30 m), Hyperion (30 m), HJ-1A (100 m), PRISMA (30 m) returns better results in accurately classifying tree species in heterogeneous and fragmented regions [25,26,28,72]. The classification result was worse than in several existing studies [27,73,74,75,76]. The main reason was that there were more tree species in this research, which aggravated the difficulty of tree species differentiation. This was verified in our sensitivity analysis of the effect of the species number on classification accuracy (Section 3.5). In addition, several studies used airborne or UAV hyperspectral data to classify tree species and obtained a higher classification accuracy than this research [23,33]. This was mainly due to the fact that airborne or UAV hyperspectral data have a higher spatial resolution and spectral resolution that are more capable of distinguishing tree species.
By comparing the performance of the Zhuhai-1 hyperspectral reflectance bands and vegetation indices in tree species differentiation, we found that there were no obvious differences between them, and the former was slightly better than the latter. This means that the reflectance bands of the Zhuhai-1 hyperspectral data contained enough information to distinguish the urban dominant tree species. However, several studies found that vegetation indices performed better than reflectance bands in distinguishing tree species [37,77]. This may have been due to the fact that the remote sensing data they used contained limited spectral bands (less than 10 bands), which were not enough to distinguish diverse tree species, so it was necessary to extract vegetation index that combined information from multiple bands to provide supplementary information for tree species classification. It may also have been due to the different spatial resolutions of the remote sensing images used in the different studies.

4.2. Effect of Different Classification Paradigms on Classification Accuracy

By comparing the classification accuracies obtained by the object- and pixel-based methods, we observed that their classification results had a subtle difference, and the pixel-based method was slightly better. Although several existing studies align with our findings [17,78], more studies have reported that the object-based method was more effective than the pixel-based method in classification [60,74,79]. This was because these studies used images with a very high spatial resolution (with pixel sizes of about 1 m to distinguish tree species) in which each tree crown covered many pixels. In these cases, the object-based method could better express the crown characteristics and obtain better tree species classification results. In this research, the Zhuhai-1 hyperspectral data had a spatial resolution equivalent to 10 m, which is quite similar to the size of a tree crown. Hence, the pixel-based method had the ability to deliver a more precise description of crown features when compared to the object-based method. Consequently, when utilizing the Zhuhai-1 hyperspectral data, the pixel-based method was better suited for the differentiation of the urban dominant tree species.

4.3. Effect of Different Classifiers on Classification Accuracy

In this study, we compared four machine learning methods; i.e., SVM, RF, k-NN, and Bayes, in classifying the urban dominant tree species. Our analysis revealed that the RF outperformed the other three classification methods. The results were in agreement with those found by earlier researchers [27,61,80,81]. The RF classifier can balance errors in the case of unbalanced data sets, so it can obtain better classification results than other classifiers. In urban areas, there are a variety of tree species and significant quantitative differences among species, which lead to an imbalance in the training sample sets. Therefore, the RF classifier is more suitable to distinguish the urban dominant tree species when using Zhuhai-1 hyperspectral data. Several studies reported that SVM performed better than RF in classification, which may have been due to the small number of samples [73,82].

4.4. Limitations and Future Research Prospects

There are obvious differences in ecological service function among different tree species. Based on the spatial distribution map of the urban dominant tree species obtained in this study, the ecological services of urban dominant trees can be evaluated more accurately. The urban dominant tree species classification results obtained by this study were satisfactory but not extremely high. One of the main limitations was the spectral similarity of the 28 dominant tree species, which posed a great challenge in the classification of tree species. In addition, although the spatial resolution of the Zhuhai-1 hyperspectral data is significantly finer than that of Landsat-like sensors, the presence of mixture pixels introduced challenges to the classification of tree species, and this needs to be solved in the future. Furthermore, all of the tree species in this study region were subtropical broad-leaved forests with luxuriant tree growth and high morphological similarity, which increased the difficulty of tree species classification.
Further efforts should be made to enhance the classification accuracy. Diverse tree species exhibit notable disparities in their phenological characteristics, which subsequently enhances their spectral distinctiveness. The potential of multitemporal Zhuhai-1 hyperspectral data covering the key phenological periods in urban dominant tree species mapping needs to be further explored. In addition to the spectral information provided by Zhuhai-1 hyperspectral data, it is imperative to examine whether incorporating topography, climate, and vertical structure information can enhance the accuracy of tree species classification. More artificial intelligence techniques should also be considered for fine tree species classification. In addition, it is also vital to verify the effectiveness of Zhuhai-1 hyperspectral data in urban dominant tree species classification across more extensive regions.

5. Conclusions

This research assessed the effectiveness of data from the new hyperspectral satellite Zhuhai-1 in mapping the urban dominant tree species in Shenzhen, southern China. We extracted 32 reflectance bands and 18 vegetation indices from the Zhuhai-1 hyperspectral data and then input them into four classifiers to distinguish 28 dominant tree species in urban areas at the pixel and object levels. The results demonstrated that the Zhuhai-1 hyperspectral data could effectively distinguish the 28 dominant tree species in urban areas, obtaining an OA of 76.8% and a kappa coefficient of 0.75. The hyperspectral reflectance bands and vegetation indices contributed to the tree species classification similarly. The sensitivity analysis results suggested that the pixel-based approach marginally outperformed the object-based approach in classifying the urban dominant tree species using the Zhuhai-1 hyperspectral data, and the RF classifier demonstrated the best results among all classifiers tested. Moreover, reducing the species number could improve the classification accuracy. These findings provide a framework for urban dominant tree species classification using Zhuhai-1 hyperspectral imagery, and the urban dominant tree species map generated in this study holds potential for a wide range of practical applications.

Author Contributions

Conceptualization, H.Q. and W.Z.; methodology, H.Q., Y.Y. and Y.Q.; software, W.W.; validation, H.Q., Y.Y. and Y.Q.; formal analysis, W.W.; investigation, H.Q., Y.Y., W.W. and X.X.; writing—original draft preparation, H.Q. and Y.Y.; writing—review and editing, W.W., X.X. and W.Z.; funding acquisition, H.Q. and W.Z. All authors have read and agreed to the published version of the manuscript.

Funding

This research was funded by the National Key Research and Development Program of China (grant number 2022YFF1301101); the National Natural Science Foundation of China (grant numbers 32101292); the Research Center for Eco-Environmental Sciences, Chinese Academy of Sciences (grant number RCEES-TDZ-2021-9); and the Shenzhen Ecological and Environmental Monitoring Center of Guangdong Province (grant numbers SZDL2023000962, GXZX-20210521SZGK, and 0733-22201076).

Data Availability Statement

Not applicable.

Acknowledgments

Not applicable.

Conflicts of Interest

The authors declare no conflict of interest.

References

  1. Moody, R.; Geron, N.; Healy, M.; Rogan, J.; Martin, D. Modeling the spatial distribution of the current and future ecosystem services of urban tree planting in Chicopee and Fall River, Massachusetts. Urban For. Urban Green. 2021, 66, 127403. [Google Scholar] [CrossRef]
  2. Bodnaruk, E.W.; Kroll, C.N.; Yang, Y.; Hirabayashi, S.; Nowak, D.J.; Endreny, T.A. Where to plant urban trees? A spatially explicit methodology to explore ecosystem service tradeoffs. Landsc. Urban Plan. 2017, 157, 457–467. [Google Scholar] [CrossRef] [Green Version]
  3. Palliwoda, J.; Banzhaf, E.; Priess, J.A. How do the green components of urban green infrastructure influence the use of ecosystem services? Examples from Leipzig, Germany. Landsc. Ecol. 2020, 35, 1127–1142. [Google Scholar] [CrossRef] [Green Version]
  4. Cimburova, Z.; Berghauser Pont, M. Location matters. A systematic review of spatial contextual factors mediating ecosystem services of urban trees. Ecosyst. Serv. 2021, 50, 101296. [Google Scholar] [CrossRef]
  5. Kang, J.; Hirabayashi, S.; Shibata, S. Urban Forest Ecosystem Services Vary with Land Use and Species: A Case Study of Kyoto City. Forests 2022, 13, 67. [Google Scholar] [CrossRef]
  6. Escobedo, F.J.; Nowak, D.J. Spatial heterogeneity and air pollution removal by an urban forest. Landsc. Urban Plan. 2009, 90, 102–110. [Google Scholar] [CrossRef]
  7. McCarthy, H.R.; Pataki, D.E. Drivers of variability in water use of native and non-native urban trees in the greater Los Angeles area. Urban Ecosyst. 2010, 13, 393–414. [Google Scholar] [CrossRef] [Green Version]
  8. McPherson, E.G.; Simpson, J.R.; Xiao, Q.; Wu, C. Million trees Los Angeles canopy cover and benefit assessment. Landsc. Urban Plan. 2011, 99, 40–50. [Google Scholar] [CrossRef]
  9. Simpson, J.R. Improved estimates of tree-shade effects on residential energy use. Energy Build. 2002, 34, 1067–1076. [Google Scholar] [CrossRef]
  10. Choudhury, M.A.M.; Marcheggiani, E.; Despini, F.; Costanzini, S.; Rossi, P.; Galli, A.; Teggi, S. Urban tree species identification and carbon stock mapping for urban green planning and management. Forests 2020, 11, 1226. [Google Scholar] [CrossRef]
  11. Liang, H.; Li, W.; Zhang, Q.; Zhu, W.; Chen, D.; Liu, J.; Shu, T. Using unmanned aerial vehicle data to assess the three-dimension green quantity of urban green space: A case study in Shanghai, China. Landsc. Urban Plan. 2017, 164, 81–90. [Google Scholar] [CrossRef]
  12. Fassnacht, F.E.; Mangold, D.; Schäfer, J.; Immitzer, M.; Kattenborn, T.; Koch, B.; Latifi, H. Estimating stand density, biomass and tree species from very high resolution stereo-imagery–towards an all-in-one sensor for forestry applications? For. Int. J. For. Res. 2017, 90, 613–631. [Google Scholar] [CrossRef] [Green Version]
  13. Borges, E.R.; Dexter, K.G.; Pyles, M.V.; Bueno, M.L.; Santos, R.M.d.; Fontes, M.A.L.; Carvalho, F.A. The interaction of land-use history and tree species diversity in driving variation in the aboveground biomass of urban versus non-urban tropical forests. Ecol. Indic. 2021, 129, 107915. [Google Scholar] [CrossRef]
  14. Kganyago, M.; Odindi, J.; Adjorlolo, C.; Mhangara, P. Evaluating the capability of Landsat 8 OLI and SPOT 6 for discriminating invasive alien species in the African Savanna landscape. Int. J. Appl. Earth Obs. Geoinf. 2018, 67, 10–19. [Google Scholar] [CrossRef]
  15. Liu, H.; An, H.; Zhang, Y. Analysis of WorldView-2 band importance in tree species classification based on recursive feature elimination. Curr. Sci. 2018, 115, 1366–1374. [Google Scholar] [CrossRef]
  16. Salovaara, K.J.; Thessler, S.; Malik, R.N.; Tuomisto, H. Classification of Amazonian primary rain forest vegetation using Landsat ETM+ satellite imagery. Remote Sens. Environ. 2005, 97, 39–51. [Google Scholar] [CrossRef]
  17. Immitzer, M.; Vuolo, F.; Atzberger, C. First Experience with Sentinel-2 Data for Crop and Tree Species Classifications in Central Europe. Remote Sens. 2016, 8, 166. [Google Scholar] [CrossRef]
  18. Pu, R.; Landry, S. A comparative analysis of high spatial resolution IKONOS and WorldView-2 imagery for mapping urban tree species. Remote Sens. Environ. 2012, 124, 516–533. [Google Scholar] [CrossRef]
  19. Gavier-Pizarro, G.I.; Kuemmerle, T.; Hoyos, L.E.; Stewart, S.I.; Huebner, C.D.; Keuler, N.S.; Radeloff, V.C. Monitoring the invasion of an exotic tree (Ligustrum lucidum) from 1983 to 2006 with Landsat TM/ETM+ satellite data and Support Vector Machines in Córdoba, Argentina. Remote Sens. Environ. 2012, 122, 134–145. [Google Scholar] [CrossRef] [Green Version]
  20. Poortinga, A.; Tenneson, K.; Shapiro, A.; Nquyen, Q.; San Aung, K.; Chishtie, F.; Saah, D. Mapping Plantations in Myanmar by Fusing Landsat-8, Sentinel-2 and Sentinel-1 Data along with Systematic Error Quantification. Remote Sens. 2019, 11, 831. [Google Scholar] [CrossRef] [Green Version]
  21. Maschler, J.; Atzberger, C.; Immitzer, M. Individual tree crown segmentation and classification of 13 tree species using airborne hyperspectral data. Remote Sens. 2018, 10, 1218. [Google Scholar] [CrossRef] [Green Version]
  22. Richter, R.; Reu, B.; Wirth, C.; Doktor, D.; Vohland, M. The use of airborne hyperspectral data for tree species classification in a species-rich Central European forest area. Int. J. Appl. Earth Obs. Geoinf. 2016, 52, 464–474. [Google Scholar] [CrossRef]
  23. Dian, Y.; Li, Z.; Pang, Y. Spectral and Texture Features Combined for Forest Tree species Classification with Airborne Hyperspectral Imagery. J. Indian Soc. Remote Sens. 2015, 43, 101–107. [Google Scholar] [CrossRef]
  24. Raczko, E.; Zagajewski, B. Comparison of support vector machine, random forest and neural network classifiers for tree species classification on airborne hyperspectral APEX images. Eur. J. Remote Sens. 2017, 50, 144–154. [Google Scholar] [CrossRef] [Green Version]
  25. Vangi, E.; D’Amico, G.; Francini, S.; Giannetti, F.; Lasserre, B.; Marchetti, M.; Chirici, G. The New Hyperspectral Satellite PRISMA: Imagery for Forest Types Discrimination. Sensors 2021, 21, 1182. [Google Scholar] [CrossRef]
  26. Lim, J.; Kim, K.-M.; Jin, R. Tree Species Classification Using Hyperion and Sentinel-2 Data with Machine Learning in South Korea and China. ISPRS Int. J. Geo-Inf. 2019, 8, 150. [Google Scholar] [CrossRef] [Green Version]
  27. Wan, L.; Lin, Y.; Zhang, H.; Wang, F.; Liu, M.; Lin, H. GF-5 Hyperspectral Data for Species Mapping of Mangrove in Mai Po, Hong Kong. Remote Sens. 2020, 12, 656. [Google Scholar] [CrossRef] [Green Version]
  28. Wang, X.; Ren, H. DBMF: A Novel Method for Tree Species Fusion Classification Based on Multi-Source Images. Forests 2021, 13, 33. [Google Scholar] [CrossRef]
  29. Jiang, Y.; Wang, J.; Zhang, L.; Zhang, G.; Li, X.; Wu, J. Geometric Processing and Accuracy Verification of Zhuhai-1 Hyperspectral Satellites. Remote Sens. 2019, 11, 996. [Google Scholar] [CrossRef] [Green Version]
  30. Tu, C.; Li, P.; Li, Z.; Wang, H.; Yin, S.; Li, D.; Zhu, Q.; Chang, M.; Liu, J.; Wang, G. Synergetic Classification of Coastal Wetlands over the Yellow River Delta with GF-3 Full-Polarization SAR and Zhuhai-1 OHS Hyperspectral Remote Sensing. Remote Sens. 2021, 13, 4444. [Google Scholar] [CrossRef]
  31. Feng, X.; Shao, Z.; Huang, X.; He, L.; Lv, X.; Zhuang, Q. Integrating Zhuhai-1 Hyperspectral Imagery with Sentinel-2 Multispectral Imagery to Improve High-Resolution Impervious Surface Area Mapping. IEEE J. Sel. Top. Appl. Earth Obs. Remote Sens. 2022, 15, 2410–2424. [Google Scholar] [CrossRef]
  32. Zhang, Y.; Yang, J.; Du, L. Analyzing the Effects of Hyperspectral ZhuHai-1 Band Combinations on LAI Estimation Based on the PROSAIL Model. Sensors 2021, 21, 1869. [Google Scholar] [CrossRef] [PubMed]
  33. Qin, H.; Zhou, W.; Yao, Y.; Wang, W. Individual tree segmentation and tree species classification in subtropical broadleaf forests using UAV-based LiDAR, hyperspectral, and ultrahigh-resolution RGB data. Remote Sens. Environ. 2022, 280, 113143. [Google Scholar] [CrossRef]
  34. Qian, Y.; Zhou, W.; Pickett, S.T.A.; Yu, W.; Xiong, D.; Wang, W.; Jing, C. Integrating structure and function: Mapping the hierarchical spatial heterogeneity of urban landscapes. Ecol. Process. 2020, 9, 59. [Google Scholar] [CrossRef]
  35. Pu, R.; Landry, S.; Zhang, J. Evaluation of Atmospheric Correction Methods in Identifying Urban Tree Species with WorldView-2 Imagery. IEEE J. Sel. Top. Appl. Earth Obs. Remote Sens. 2015, 8, 1886–1897. [Google Scholar] [CrossRef]
  36. Sanchez-Azofeifa, A.; Rivard, B.; Wright, J.; Feng, J.-L.; Li, P.; Chong, M.M.; Bohlman, S.A. Estimation of the Distribution of Tabebuia guayacan (Bignoniaceae) Using High-Resolution Remote Sensing Imagery. Sensors 2011, 11, 3831–3851. [Google Scholar] [CrossRef] [PubMed]
  37. Li, D.; Ke, Y.; Gong, H.; Li, X. Object-Based Urban Tree Species Classification Using Bi-Temporal WorldView-2 and WorldView-3 Images. Remote Sens. 2015, 7, 16917–16937. [Google Scholar] [CrossRef] [Green Version]
  38. Mbaabu, P.R.; Hussin, Y.A.; Weir, M.; Gilani, H. Quantification of carbon stock to understand two different forest management regimes in Kayar Khola watershed, Chitwan, Nepal. J. Indian Soc. Remote Sens. 2014, 42, 745–754. [Google Scholar] [CrossRef]
  39. Clark, M.L.; Kilham, N.E. Mapping of land cover in northern California with simulated hyperspectral satellite imagery. ISPRS J. Photogramm. Remote Sens. 2016, 119, 228–245. [Google Scholar] [CrossRef]
  40. Brabant, C.; Alvarez-Vanhard, E.; Laribi, A.; Morin, G.; Kim Thanh, N.; Thomas, A.; Houet, T. Comparison of Hyperspectral Techniques for Urban Tree Diversity Classification. Remote Sens. 2019, 11, 1269. [Google Scholar] [CrossRef] [Green Version]
  41. Clark, M.L.; Roberts, D.A. Species-Level Differences in Hyperspectral Metrics among Tropical Rainforest Trees as Determined by a Tree-Based Classifier. Remote Sens. 2012, 4, 1820–1855. [Google Scholar] [CrossRef] [Green Version]
  42. Rouse, J.; Haas, R.; Schell, J.; Deering, D. Monitoring vegetation systems in the Great plains with ERTS. NASA Spec. Publ. 1974, 351, 309–317. [Google Scholar]
  43. Sturari, M.; Frontoni, E.; Pierdicca, R.; Mancini, A.; Malinverni, E.S.; Tassetti, A.N.; Zingaretti, P. Integrating elevation data and multispectral high-resolution images for an improved hybrid Land Use/Land Cover mapping. Eur. J. Remote Sens. 2017, 50, 1–17. [Google Scholar] [CrossRef]
  44. Huete, A.R. A soil-adjusted vegetation index (SAVI). Remote Sens. Environ. 1988, 25, 295–309. [Google Scholar] [CrossRef]
  45. Kaufman, Y.J.; Tanre, D. Atmospherically resistant vegetation index (ARVI) for EOS-MODIS. IEEE Trans. Geosci. Remote Sens. 1992, 30, 261–270. [Google Scholar] [CrossRef]
  46. Huete, A.; Didan, K.; Miura, T.; Rodriguez, E.P.; Gao, X.; Ferreira, L.G. Overview of the radiometric and biophysical performance of the MODIS vegetation indices. Remote Sens. Environ. 2002, 83, 195–213. [Google Scholar] [CrossRef]
  47. Sims, D.A.; Gamon, J.A. Relationships between leaf pigment content and spectral reflectance across a wide range of species, leaf structures and developmental stages. Remote Sens. Environ. 2002, 81, 337–354. [Google Scholar] [CrossRef]
  48. Ballester, C.; Brinkhoff, J.; Quayle, W.C.; Hornbuckle, J. Monitoring the effects of water stress in cotton using the green red vegetation index and red edge ratio. Remote Sens. 2019, 11, 873. [Google Scholar] [CrossRef] [Green Version]
  49. Vogelmann, T. Plant tissue optics. Annu. Rev. Plant Biol. 1993, 44, 231–251. [Google Scholar] [CrossRef]
  50. Coops, N.C.; Stone, C.; Merton, R.; Chisholm, L. Assessing eucalypt foliar health with field-based spectra and high spatial resolution hyperspectral imagery. In Proceedings of the IEEE International Geoscience & Remote Sensing Symposium, Sydney, Australia, 9–13 July 2001; pp. 603–605. [Google Scholar]
  51. Datt, B. A new reflectance index for remote sensing of chlorophyll content in higher plants: Tests using Eucalyptus leaves. J. Plant Physiol. 1999, 154, 30–36. [Google Scholar] [CrossRef]
  52. Steele, M.R.; Gitelson, A.A.; Rundquist, D.C.; Merzlyak, M.N. Nondestructive estimation of anthocyanin content in Grapevine leaves. Am. J. Enol. Vitic. 2009, 60, 87–92. [Google Scholar] [CrossRef]
  53. Raper, T.B. Effectiveness of Crop Reflectance Sensors on Detection of Cotton (Gossypium hirsutum L.) Growth and Nitrogen Status; Mississippi State University: Lee Boulevard, MS, USA, 2011. [Google Scholar]
  54. Zarco-Tejada, P.J.; Hornero, A.; Beck, P.S.A.; Kattenborn, T.; Kempeneers, P.; Hernandez-Clemente, R. Chlorophyll content estimation in an open-canopy conifer forest with Sentinel-2A and hyperspectral imagery in the context of forest decline. Remote Sens. Environ. 2019, 223, 320–335. [Google Scholar] [CrossRef] [PubMed]
  55. Carter, G.A.; Miller, R.L. Early detection of plant stress by digital imaging within narrow stress-sensitive wavebands. Remote Sens. Environ. 1994, 50, 295–302. [Google Scholar] [CrossRef]
  56. Merton, R. Monitoring community hysteresis using spectral shift analysis and the red-edge vegetation stress index. In Proceedings of the Seventh Annual JPL Airborne Earth Science Workshop, Pasadena, CA, USA, 12–16 January 1998; pp. 12–16. [Google Scholar]
  57. Kankare, V.; Joensuu, M.; Vauhkonen, J.; Holopainen, M.; Tanhuanpää, T.; Vastaranta, M.; Hyyppä, J.; Hyyppä, H.; Alho, P.; Rikala, J.; et al. Estimation of the Timber Quality of Scots Pine with Terrestrial Laser Scanning. Forests 2014, 5, 1879–1895. [Google Scholar] [CrossRef] [Green Version]
  58. Mõttus, M.; Takala, T. A forestry GIS-based study on evaluating the potential of imaging spectroscopy in mapping forest land fertility. Int. J. Appl. Earth Obs. Geoinf. 2014, 33, 302–311. [Google Scholar] [CrossRef]
  59. Breiman, L. Random forests. Mach. Learn. 2001, 45, 5–32. [Google Scholar] [CrossRef] [Green Version]
  60. Immitzer, M.; Atzberger, C.; Koukal, T. Tree Species Classification with Random Forest Using Very High Spatial Resolution 8-Band WorldView-2 Satellite Data. Remote Sens. 2012, 4, 2661–2693. [Google Scholar] [CrossRef] [Green Version]
  61. Varin, M.; Chalghaf, B.; Joanisse, G. Object-Based Approach Using Very High Spatial Resolution 16-Band WorldView-3 and LiDAR Data for Tree Species Classification in a Broadleaf Forest in Quebec, Canada. Remote Sens. 2020, 12, 3092. [Google Scholar] [CrossRef]
  62. Scholl, V.M.; Cattau, M.E.; Joseph, M.B.; Balch, J.K. Integrating National Ecological Observatory Network (NEON) Airborne Remote Sensing and In-Situ Data for Optimal Tree Species Classification. Remote Sens. 2020, 12, 1414. [Google Scholar] [CrossRef]
  63. Yan, S.; Jing, L.; Wang, H. A New Individual Tree Species Recognition Method Based on a Convolutional Neural Network and High-Spatial Resolution Remote Sensing Imagery. Remote Sens. 2021, 13, 479. [Google Scholar] [CrossRef]
  64. Plakman, V.; Janssen, T.; Brouwer, N.; Veraverbeke, S. Mapping Species at an Individual-Tree Scale in a Temperate Forest, Using Sentinel-2 Images, Airborne Laser Scanning Data, and Random Forest Classification. Remote Sens. 2020, 12, 3710. [Google Scholar] [CrossRef]
  65. Puertas, O.L.; Brenning, A.; Meza, F.J. Balancing misclassification errors of land cover classification maps using support vector machines and Landsat imagery in the Maipo river basin (Central Chile, 1975–2010). Remote Sens. Environ. 2013, 137, 112–123. [Google Scholar] [CrossRef]
  66. Chiang, S.-H.; Valdez, M. Tree Species Classification by Integrating Satellite Imagery and Topographic Variables Using Maximum Entropy Method in a Mongolian Forest. Forests 2019, 10, 961. [Google Scholar] [CrossRef] [Green Version]
  67. Li, Y.; Li, Y.; Qureshi, S.; Kappas, M.; Hubacek, K. On the relationship between landscape ecological patterns and water quality across gradient zones of rapid urbanization in coastal China. Ecol. Model. 2015, 318, 100–108. [Google Scholar] [CrossRef]
  68. Qin, H.; Zhou, W.; Zhao, W. Airborne small-footprint full-waveform LiDAR data for urban land cover classification. Front. Environ. Sci. 2022, 10, 972960. [Google Scholar] [CrossRef]
  69. Dong, C.; Zhao, G.; Meng, Y.; Li, B.; Peng, B. The Effect of Topographic Correction on Forest Tree Species Classification Accuracy. Remote Sens. 2020, 12, 787. [Google Scholar] [CrossRef] [Green Version]
  70. Wessel, M.; Brandmeier, M.; Tiede, D. Evaluation of Different Machine Learning Algorithms for Scalable Classification of Tree Types and Tree Species Based on Sentinel-2 Data. Remote Sens. 2018, 10, 1419. [Google Scholar] [CrossRef] [Green Version]
  71. Xie, Z.; Chen, Y.; Lu, D.; Li, G.; Chen, E. Classification of Land Cover, Forest, and Tree Species Classes with ZiYuan-3 Multispectral and Stereo Data. Remote Sens. 2019, 11, 164. [Google Scholar] [CrossRef] [Green Version]
  72. Clark, M.L.; Buck-Diaz, J.; Evens, J. Mapping of forest alliances with simulated multi-seasonal hyperspectral satellite imagery. Remote Sens. Environ. 2018, 210, 490–507. [Google Scholar] [CrossRef]
  73. Sheeren, D.; Fauvel, M.; Josipovic, V.; Lopes, M.; Planque, C.; Willm, J.; Dejoux, J.-F. Tree Species Classification in Temperate Forests Using Formosat-2 Satellite Image Time Series. Remote Sens. 2016, 8, 734. [Google Scholar] [CrossRef] [Green Version]
  74. Deur, M.; Gasparovic, M.; Balenovic, I. An Evaluation of Pixel- and Object-Based Tree Species Classification in Mixed Deciduous Forests Using Pansharpened Very High Spatial Resolution Satellite Imagery. Remote Sens. 2021, 13, 1868. [Google Scholar] [CrossRef]
  75. Illarionova, S.; Trekin, A.; Ignatiev, V.; Oseledets, I. Neural-Based Hierarchical Approach for Detailed Dominant Forest Species Classification by Multispectral Satellite Imagery. IEEE J. Sel. Top. Appl. Earth Obs. Remote Sens. 2021, 14, 1810–1820. [Google Scholar] [CrossRef]
  76. Sun, C.; Li, J.; Liu, Y.; Liu, Y.; Liu, R. Plant species classification in salt marshes using phenological parameters derived from Sentinel-2 pixel-differential time-series. Remote Sens. Environ. 2021, 256, 112320. [Google Scholar] [CrossRef]
  77. Yan, J.; Zhou, W.; Han, L.; Qian, Y. Mapping vegetation functional types in urban areas with WorldView-2 imagery: Integrating object-based classification with phenology. Urban For. Urban Green. 2018, 31, 230–240. [Google Scholar] [CrossRef]
  78. Duro, D.C.; Franklin, S.E.; Dubé, M.G. A comparison of pixel-based and object-based image analysis with selected machine learning algorithms for the classification of agricultural landscapes using SPOT-5 HRG imagery. Remote Sens. Environ. 2012, 118, 259–272. [Google Scholar] [CrossRef]
  79. Heumann, B.W. An Object-Based Classification of Mangroves Using a Hybrid Decision Tree-Support Vector Machine Approach. Remote Sens. 2011, 3, 2440–2460. [Google Scholar] [CrossRef] [Green Version]
  80. Jiang, Y.; Zhang, L.; Yan, M.; Qi, J.; Fu, T.; Fan, S.; Chen, B. High-Resolution Mangrove Forests Classification with Machine Learning Using Worldview and UAV Hyperspectral Data. Remote Sens. 2021, 13, 1529. [Google Scholar] [CrossRef]
  81. Deur, M.; Gasparovic, M.; Balenovic, I. Tree Species Classification in Mixed Deciduous Forests Using Very High Spatial Resolution Satellite Imagery and Machine Learning Methods. Remote Sens. 2020, 12, 3926. [Google Scholar] [CrossRef]
  82. Foody, G.M. Status of land cover classification accuracy assessment. Remote Sens. Environ. 2002, 80, 185–201. [Google Scholar] [CrossRef]
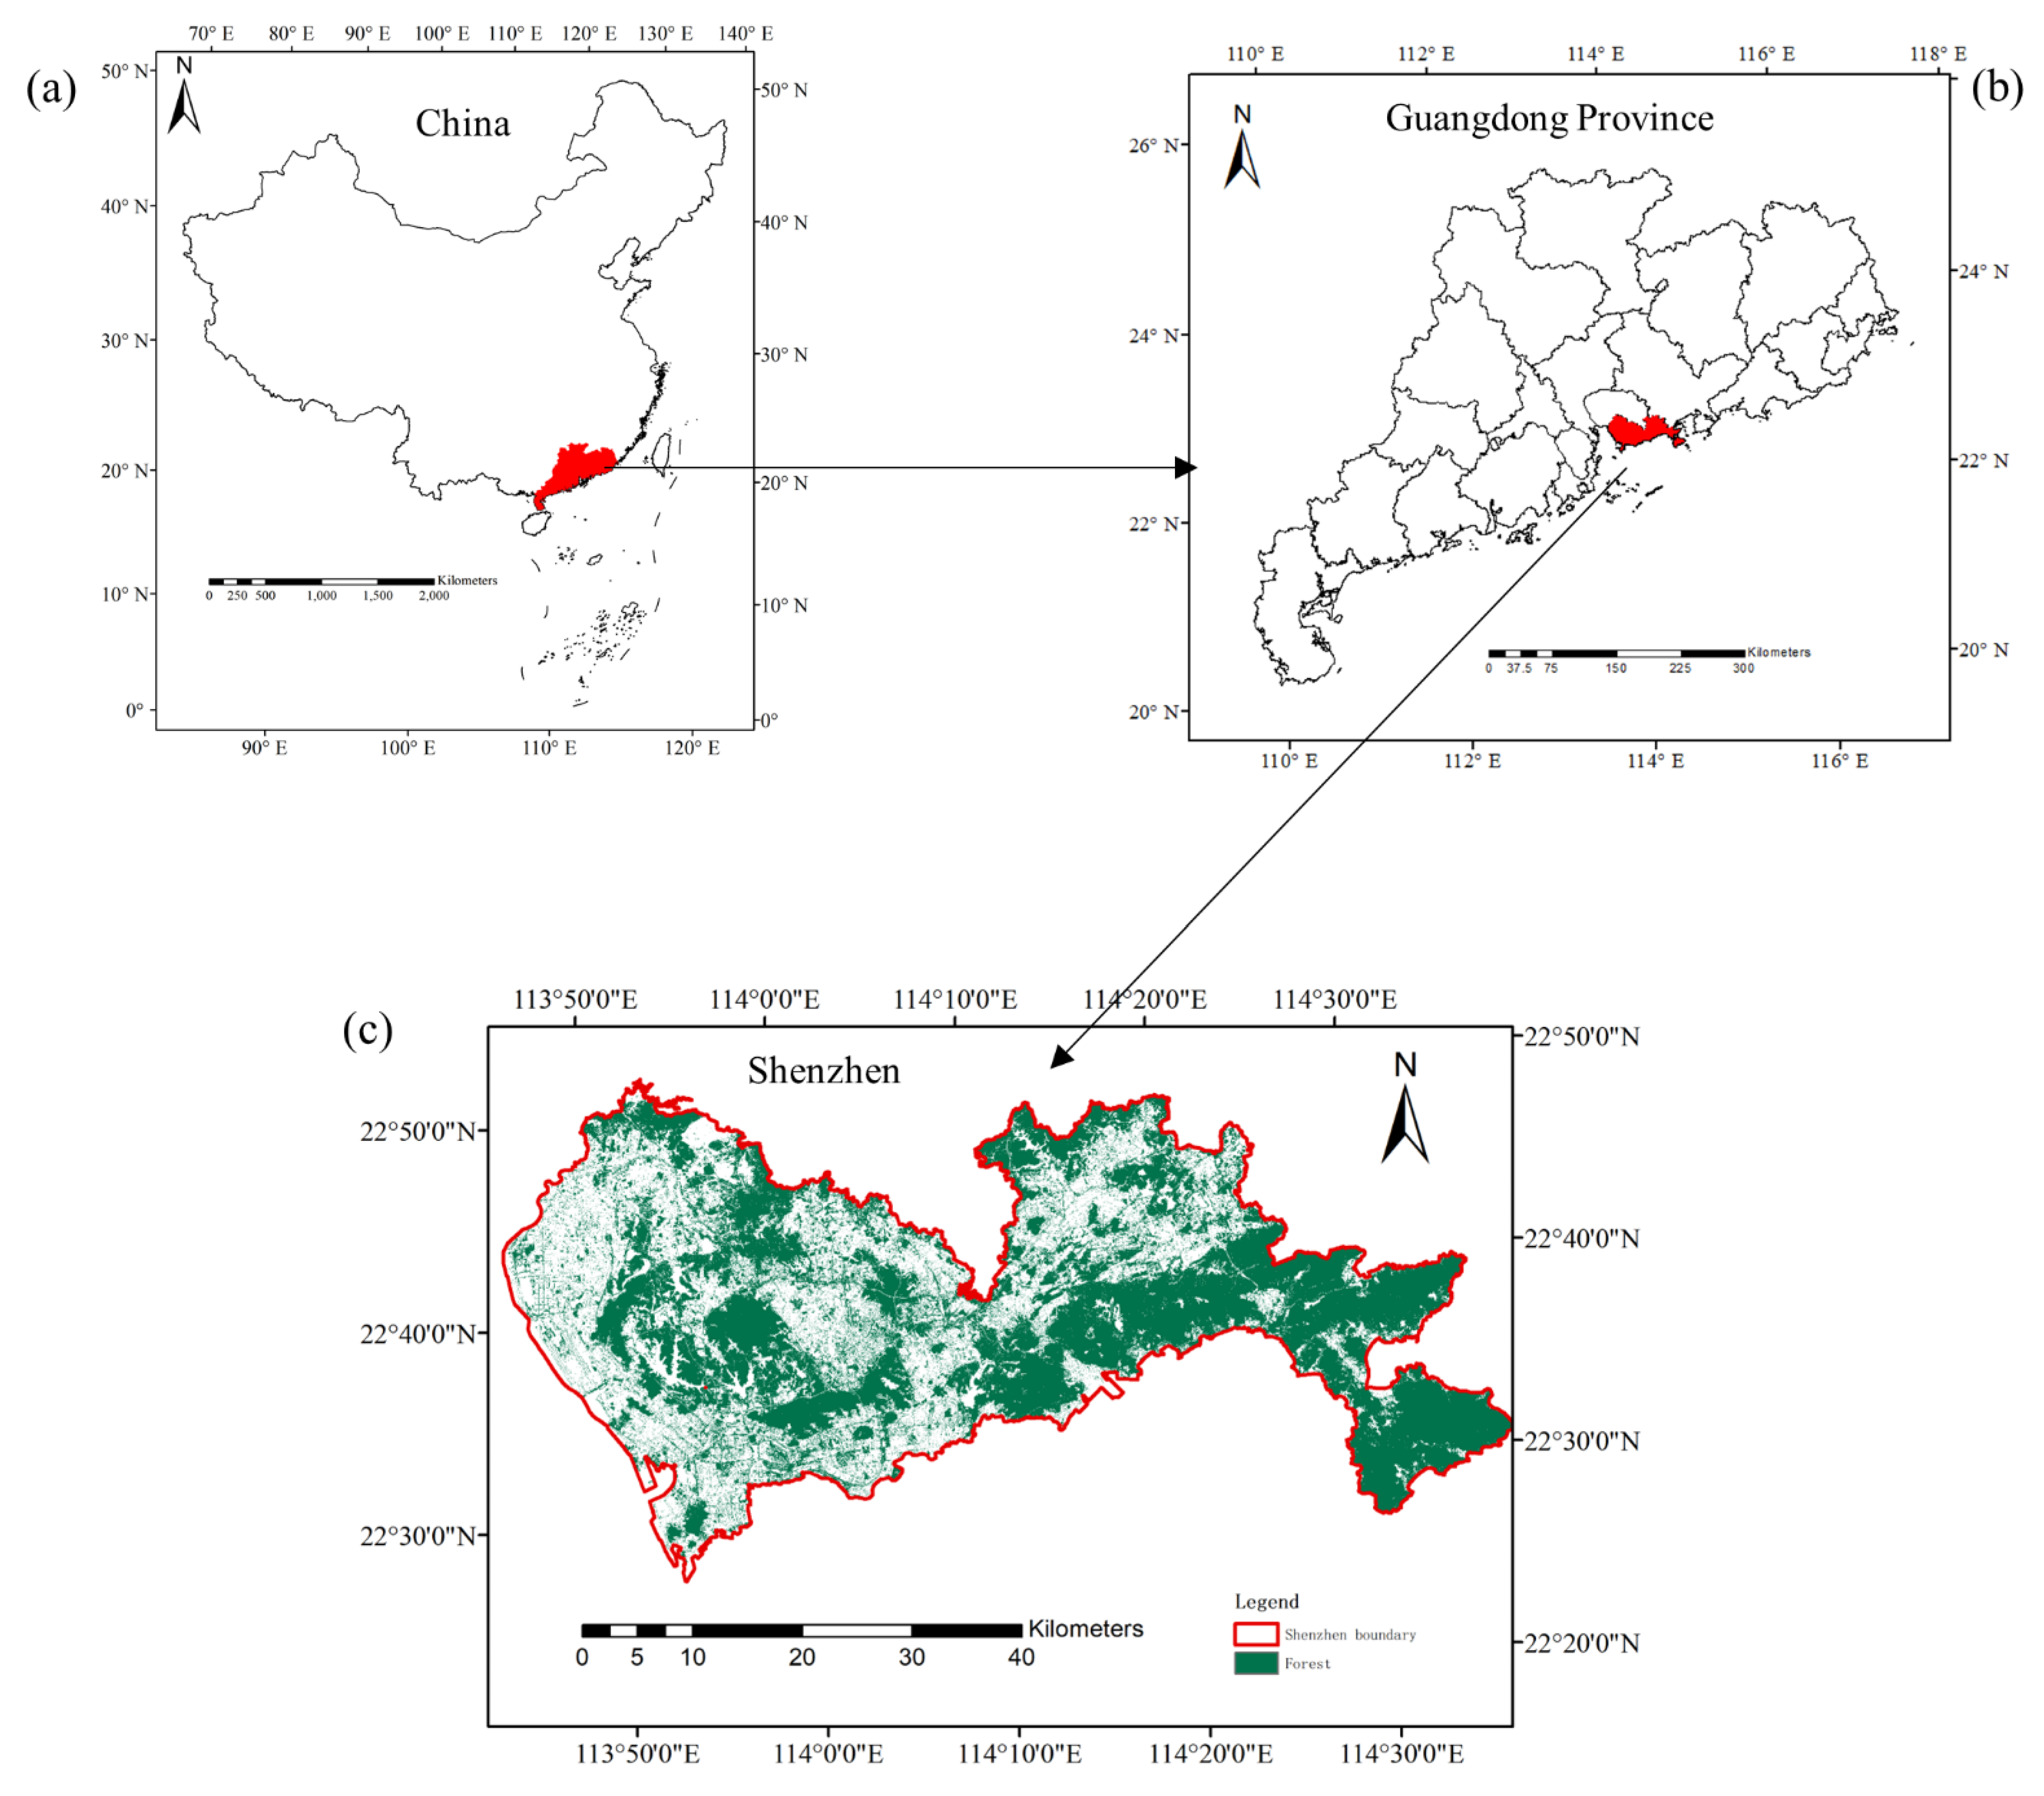
Figure 1. The study area located in Shenzhen, southern China.
Remotesensing 15 03179 g001
Figure 2. Field samples used in this study.
Remotesensing 15 03179 g002
Figure 3. Average reflectance according to spectral bands for 28 main tree species.
Remotesensing 15 03179 g003
Figure 4. The flowchart for urban dominant tree species classification using Zhuhai-1 hyperspectral data.
Remotesensing 15 03179 g004
Figure 5. The variable importance of all hyperspectral features for classification of tree species using the random forest classifier.
Remotesensing 15 03179 g005
Figure 6. (a) Pixel-based tree species classification results for the entire study area derived from all hyperspectral features using the RF classifier; (b) detailed pixel-based tree species classification results for the area in the black box in (a); (c) detailed object-based tree species classification results for the area in the black box in (a).
Remotesensing 15 03179 g006
Figure 7. The relationship between the species number and classification accuracy.
Remotesensing 15 03179 g007
Table 1. Detailed spectral information of Zhuhai-1 hyperspectral imagery.
Band No.Central Wavelength
(nm)
Band No.Central Wavelength
(nm)
146617716
248018730
350019746
452020760
553621776
655022790
756623806
858024820
959625836
1061026850
1162627866
1264028880
1365629896
1467030910
1568631926
1670032940
Table 2. Hyperspectral vegetation indices and their formulas.
Information TypesMetricsFormulaReferences
Leaf area and canopy structureNormalized Difference Vegetation Index (NDVI) NDVI = ρ 790 ρ 670 ρ 790 + ρ 670 [42]
Soil Adjusted Vegetation Index [43] SAVI = 1.5 × ( ρ 790 ρ 670 ) ρ 790 + ρ 670 + 0.5 [44]
Atmospherically Resistant Vegetation Index (ARVI) ARVI = ρ 790 2 × ρ 670 + ρ 480 ρ 790 + 2 × ρ 670 ρ 480 [45]
Enhanced Vegetation Index (EVI) EVI = 2.5 × ρ 806 ρ 670 1 + ρ 806 + 6 × ρ 670 7.5 × ρ 480 [46]
Modified Red Edge Normalized Difference Vegetation Index (MRENDVI) MRENDVI = ρ 746 ρ 700 ρ 746 + ρ 700 2 × ρ 466 1 [47]
Modified Red Edge Simple Ratio Index (MRESRI) MRESRI = ρ 746 ρ 466 ρ 746 + ρ 466 [48]
Vogelmann Red Edge Index (VOG) VOG = ρ 746 ρ 716 [49]
Mean Value of Red Edge (Mean686–749) Mean 686 746 = i = 686 i = 746 ρ i n [46,50]
Slope Location of Red Edge (SL) SL = ρ 746 ρ 686 60 [50]
Leaf and canopy pigmentsDatt Chlorophyll Content Index (Datt) Datt = ρ 850 ρ 716 ρ 850 ρ 686 [51]
Chlorophyll Index (CI) CI = ρ 760 ρ 700 1 [52]
Red Edge Index (REI) REI = ρ 806 ρ 716 1 [53]
Green Index (GI) GI = ρ 806 ρ 550 1 [54]
Plant stressPlant Stress Index (PSI) PSI = ρ 700 ρ 760 [55]
Ratio Index (RI) RI = ρ 596 ρ 760 [55]
Red Edge Vegetation Pressure Index (RVSI) RVSI = ρ 716 + ρ 746 2 ρ 730 [56]
Light energy utilization efficiencyStructure Insensitive Pigment Index [57] SIPI = ρ 806 ρ 466 ρ 806 + ρ 686 [54]
Modified Photochemical Reflectance Index (MPRI) MPRI = ρ 520 ρ 536 ρ 520 + ρ 536 [58]
Table 3. An example of the confusion matrix of the tree species classification results.
Predicted TypesABCSumProducer Accuracy
Observed Types
Aabcl a l
Bdefm e m
Cghin i n
Sumopqr
User accuracy a o e p i q
Table 4. The classification results of 28 tree species in Shenzhen based on three feature sets.
FeaturesOverall AccuracyKappa
32 reflectance bands76.5%0.75
18 vegetation indices75.6%0.74
32 reflectance bands + 18 vegetation indices76.8%0.75
Table 5. Classification accuracy of 28 tree species using the RF classifier based on 50 hyperspectral metrics.
Tree SpeciesProducer AccuracyUser Accuracy
Eucalyptus robusta74.3%68.0%
Litchi chinensis82.4%68.8%
Acacia mangium77.2%78.8%
Acacia confusa70.0%85.5%
Acacia auriculiformis93.2%70.3%
Acacia conferta74.3%82.9%
Dimocarpus longan74.7%72.0%
Ficus concinna71.4%77.5%
Cinnamomum camphora63.4%89.9%
Pinus massoniana87.8%76.6%
Schima superba93.3%97.9%
Sonneratia apetala96.2%94.7%
Delonix regia92.6%75.8%
Terminalia neotaliala84.5%86.3%
Roystonea regia72.9%66.2%
Ficus stipulosa79.5%67.8%
Bauhinia purpurea91.4%74.7%
Falcataria falcata2.6%83.3%
Mangifera indica92.9%100%
Casuarina equisetifolia79.5%70.5%
Mimosa bimucronata48.0%92.3%
Leucaena leucocephala73.2%74.5%
Bombax ceiba50.0%100%
Ficus benjamina73.3%78.6%
Bischofia javanica100%84.2%
Alstonia scholaris84.0%80.8%
Khaya senegalensis90.0%100%
Ficus altissima73.7%93.3%
Overall Accuracy76.8%
Kappa0.75
Disclaimer/Publisher’s Note: The statements, opinions and data contained in all publications are solely those of the individual author(s) and contributor(s) and not of MDPI and/or the editor(s). MDPI and/or the editor(s) disclaim responsibility for any injury to people or property resulting from any ideas, methods, instructions or products referred to in the content.