Article

Snow Cover and Climate Change and Their Coupling Effects on Runoff in the Keriya River Basin during 2001–2020

1
School of Geographic Sciences, Xinyang Normal University, Xinyang 464000, China
2
Xinyang Key Laboratory of Climate Change and Environmental Evolution, Xinyang Normal University, Xinyang 464000, China
3
State Key Laboratory of Desert and Oasis Ecology, Xinjiang Institute of Ecology and Geography, Chinese Academy of Sciences, Urumqi 830011, China
4
Information Center (Hydrology Monitor and Forecast Center), Ministry of Water Resources, Beijing 100053, China
*
Author to whom correspondence should be addressed.
Remote Sens. 2023, 15(13), 3435; https://doi.org/10.3390/rs15133435
Submission received: 22 May 2023 / Revised: 29 June 2023 / Accepted: 5 July 2023 / Published: 6 July 2023
(This article belongs to the Special Issue Remote Sensing of Cryosphere and Related Processes)

Abstract

:
As a significant component of the cryosphere, snow cover plays a crucial role in modulating atmospheric circulation and regional hydrological equilibrium. Therefore, studying the dynamics of snow cover and its response to climate change is of great significance for regional water resource management and disaster prevention. In this study, reanalysis climate datasets and a new MODIS snow cover extent product over China were used to analyze the characteristics of climate change and spatiotemporal variations in snow cover in the Keriya River Basin (KRB). Furthermore, the effects of climate factors on snow cover and their coupling effects on runoff were quantitatively evaluated by adopting partial least squares regression (PLSR) method and structural equation modeling (SEM), respectively. Our findings demonstrated the following: (1) Air temperature and precipitation of KRB showed a significant increase at rates of 0.24 °C/decade and 14.21 mm/decade, respectively, while the wind speed did not change significantly. (2) The snow cover frequency (SCF) in the KRB presented the distribution characteristics of “low in the north and high in the south”. The intra-annual variation of snow cover percentage (SCP) of KRB displayed a single peak (in winter), double peaks (in spring and autumn), and stability (SCP > 75%), whose boundary elevations were 4000 m and 6000 m, respectively. The annual, summer, and winter SCP in the KRB declined, while the spring and autumn SCP experienced a trend showing an insignificant increase during the hydrological years of 2001–2020. Additionally, both the annual and seasonal SCF (except autumn) will be further increased in more than 50% of the KRB, according to estimates. (3) Annual and winter SCF were controlled by precipitation, of which the former showed a mainly negative response, while the latter showed a mainly positive response, accounting for 43.1% and 76.16% of the KRB, respectively. Air temperature controlled SCF changes in 45% of regions in spring, summer, and autumn, mainly showing negative effects. Wind speed contributed to SCF changes in the range of 11.23% to 26.54% across annual and seasonal scales. (4) Climate factors and snow cover mainly affect annual runoff through direct influences, and the total effect was as follows: precipitation (0.609) > air temperature (−0.122) > SCP (0.09).

1. Introduction

Snow cover, as an indispensable constituent of the cryosphere, plays a highly important role within the global and regional climate system, exerting an essential impact on surface radiation balance, energy balance, and hydrological partitioning [1,2,3,4]. Concurrent with the relentless warming of the global climate, the Northern Hemisphere is experiencing a pronounced decline in snow cover [5,6], which profoundly impacts the regional water cycle [7,8]. Inland rivers situated in the arid and semi-arid regions of northwest China predominantly rely on the runoff derived from the thawing of adjacent alpine mountain snowpacks [9]. Changes in the total and seasonal runoff distributions caused by snow cover changes will affect social and economic development in the middle and lower reaches [10,11,12]. Therefore, studying the influence of snow cover dynamics and climate change on runoff to inform decisions about the scientific management and planning of water resources in Northwest arid areas has become imperative [13,14].
The conventional method for monitoring snow cover involves the collection of snow cover data from meteorological stations or observation sites. However, this approach suffers from spatial inhomogeneity due to the uneven distribution of the stations, primarily concentrated in low-altitude regions [15,16,17,18]. In remote alpine areas, the complex terrain and challenging environmental conditions impede field monitoring efforts [19]. Nevertheless, recent advancements in remote sensing technology have unlocked new opportunities for snow cover research. Remote sensing data offer the advantages of wide broad coverage, frequent updating, and high spatial resolution, which compensates for the limitations of ground-based monitoring data [20,21]. Currently, various remote sensing data are leveraged for snow cover research, including the moderate resolution imaging spectroradiometer (MODIS), advanced very high resolution radiometer (AVHRR), scanning multichannel microwave radiometer (SMMR), and other related products [22,23,24]. Among these products, MODIS snow cover products have emerged as the mainstream data of remote sensing snow cover products due to their high spatiotemporal resolutions. Additionally, they have been widely adopted in the study of snow cover changes across regions of varying scales [25,26,27]. For instance, Zou et al. [28] employed MOD10A2 and MYD10A2 snow cover products to explore the variation of snow cover in Northern Xinjiang, Qinghai-Tibet Plateau, and Northeast China. Their study revealed an insignificant increasing trend in snow cover areas and snow depths from 2001 to 2020. Thapa et al. [29] combined three different 8 day composite snow products, including MOD10A2, MYD10A2, and MOYDGL06, to analyze the variation trend of snow cover in the Karakoram region. They discovered a negligible decline in snow cover areas from 2003 to 2018. However, despite the widespread utilization of MODIS data in snow cover research, the accuracy of MODIS data can be affected by factors such as cloud cover and land cover. Therefore, a daily cloud-gap-filled MODIS snow cover extent product produced by Hao et al. [30], which comprehensively considered the impact of land cover and cloud on original MODIS snow cover data, was selected as the main data source for the present study. A detailed explanation of these data can be seen in Section 2.2.1.
Snow cover, as an exceedingly responsive component of the cryosphere, is profoundly influenced by climate change and is regarded as a vital indicator of global climate change [31]. Unveiling the response of snow cover to climate change has emerged as a primary focus within snow cover research, garnering extensive attention from the scholarly community. For instance, Du et al. [32] conducted an analysis of the relationship between snow cover frequency (SCF) and climate factors in the Qilian Mountains from 2000 to 2020. They suggested that the SCF was dominated by precipitation rather than air temperature, with precipitation playing a positive role. However, Hussain et al. [33] investigated the impact of climate factors on snow cover area within the Gilgit River Basin from 2001 to 2015 and reported a negative correlation between snow cover area and air temperature, while precipitation exhibited no evident relationship. In recent years, the focus of scholars has predominantly centered around the influence of air temperature and precipitation on snow cover, often neglecting the potential effect of wind speed. Although certain researchers have discussed the potential impact of wind speed on snow cover [34,35,36], the majority of these discussions lie within the realm of qualitative studies, with few quantitative analyses conducted on the impact of wind speed on snow cover [37]. Moreover, regarding research methods, most researchers mainly applied the Pearson correlation method to investigate the influence of climate factors on snow cover. However, this kind of method ignores the interactions among various climate factors, which subsequently affects the accuracy of the results derived from the analysis. In contrast, partial least squares regression (PLSR) represents a new multivariate statistical data analysis method capable of eliminating the multiple correlations among independent variables [38], which enables one to clarify the degree of influence of different climate factors on snow cover change.
The Keriya River, a typical inland river in the arid region, stands as the largest river and primary water source for the Yutian Oasis. The alpine mountains contribute crucial meltwater, which serves as the principal supply for the Keriya River and represents a valuable resource for the survival and development of the downstream regions [39]. Although most of the glaciers within the Keriya River Basin (KRB) exhibited stability, there existed a slight trend of total area reduction [40]. In contrast, the snow cover area experienced a trend depicting a slight increase [41]. From 1957 to 2017, the KRB witnessed an increase in runoff depth at a rate of 4.27 mm/decade, which was mainly affected by air temperature and precipitation [41,42]. Recent studies concerning the KRB only focus on the changes in snow cover or runoff, with few conducting quantitative and systematic analyses regarding the relationship between climate, snow cover, and runoff. Structural equation modeling (SEM) can comprehensively analyze the relationship between various variables, allowing one to quantify the direct and indirect effects of climate and snow cover on runoff.
The research objectives of this study were as follows: (1) to reveal the variation characteristics of climate and snow cover in KRB based on reanalysis climate datasets and the new MODIS snow cover extent product over China, (2) to analyze the influence of different climate factors (air temperature, precipitation, and wind speed) on SCF at the pixel scale by adopting PLSR method, and (3) to discuss the interplay between snow cover, climate factors, and their collective influence on runoff through the application of structural equation modeling (SEM). The results of this paper could facilitate a better understanding the spatiotemporal variation of snow cover in the KRB and its influencing mechanism and clarify the regional water cycle process. Furthermore, this study is of great significance to the utilization and management of water resources in the context of climate change.

2. Materials and Methods
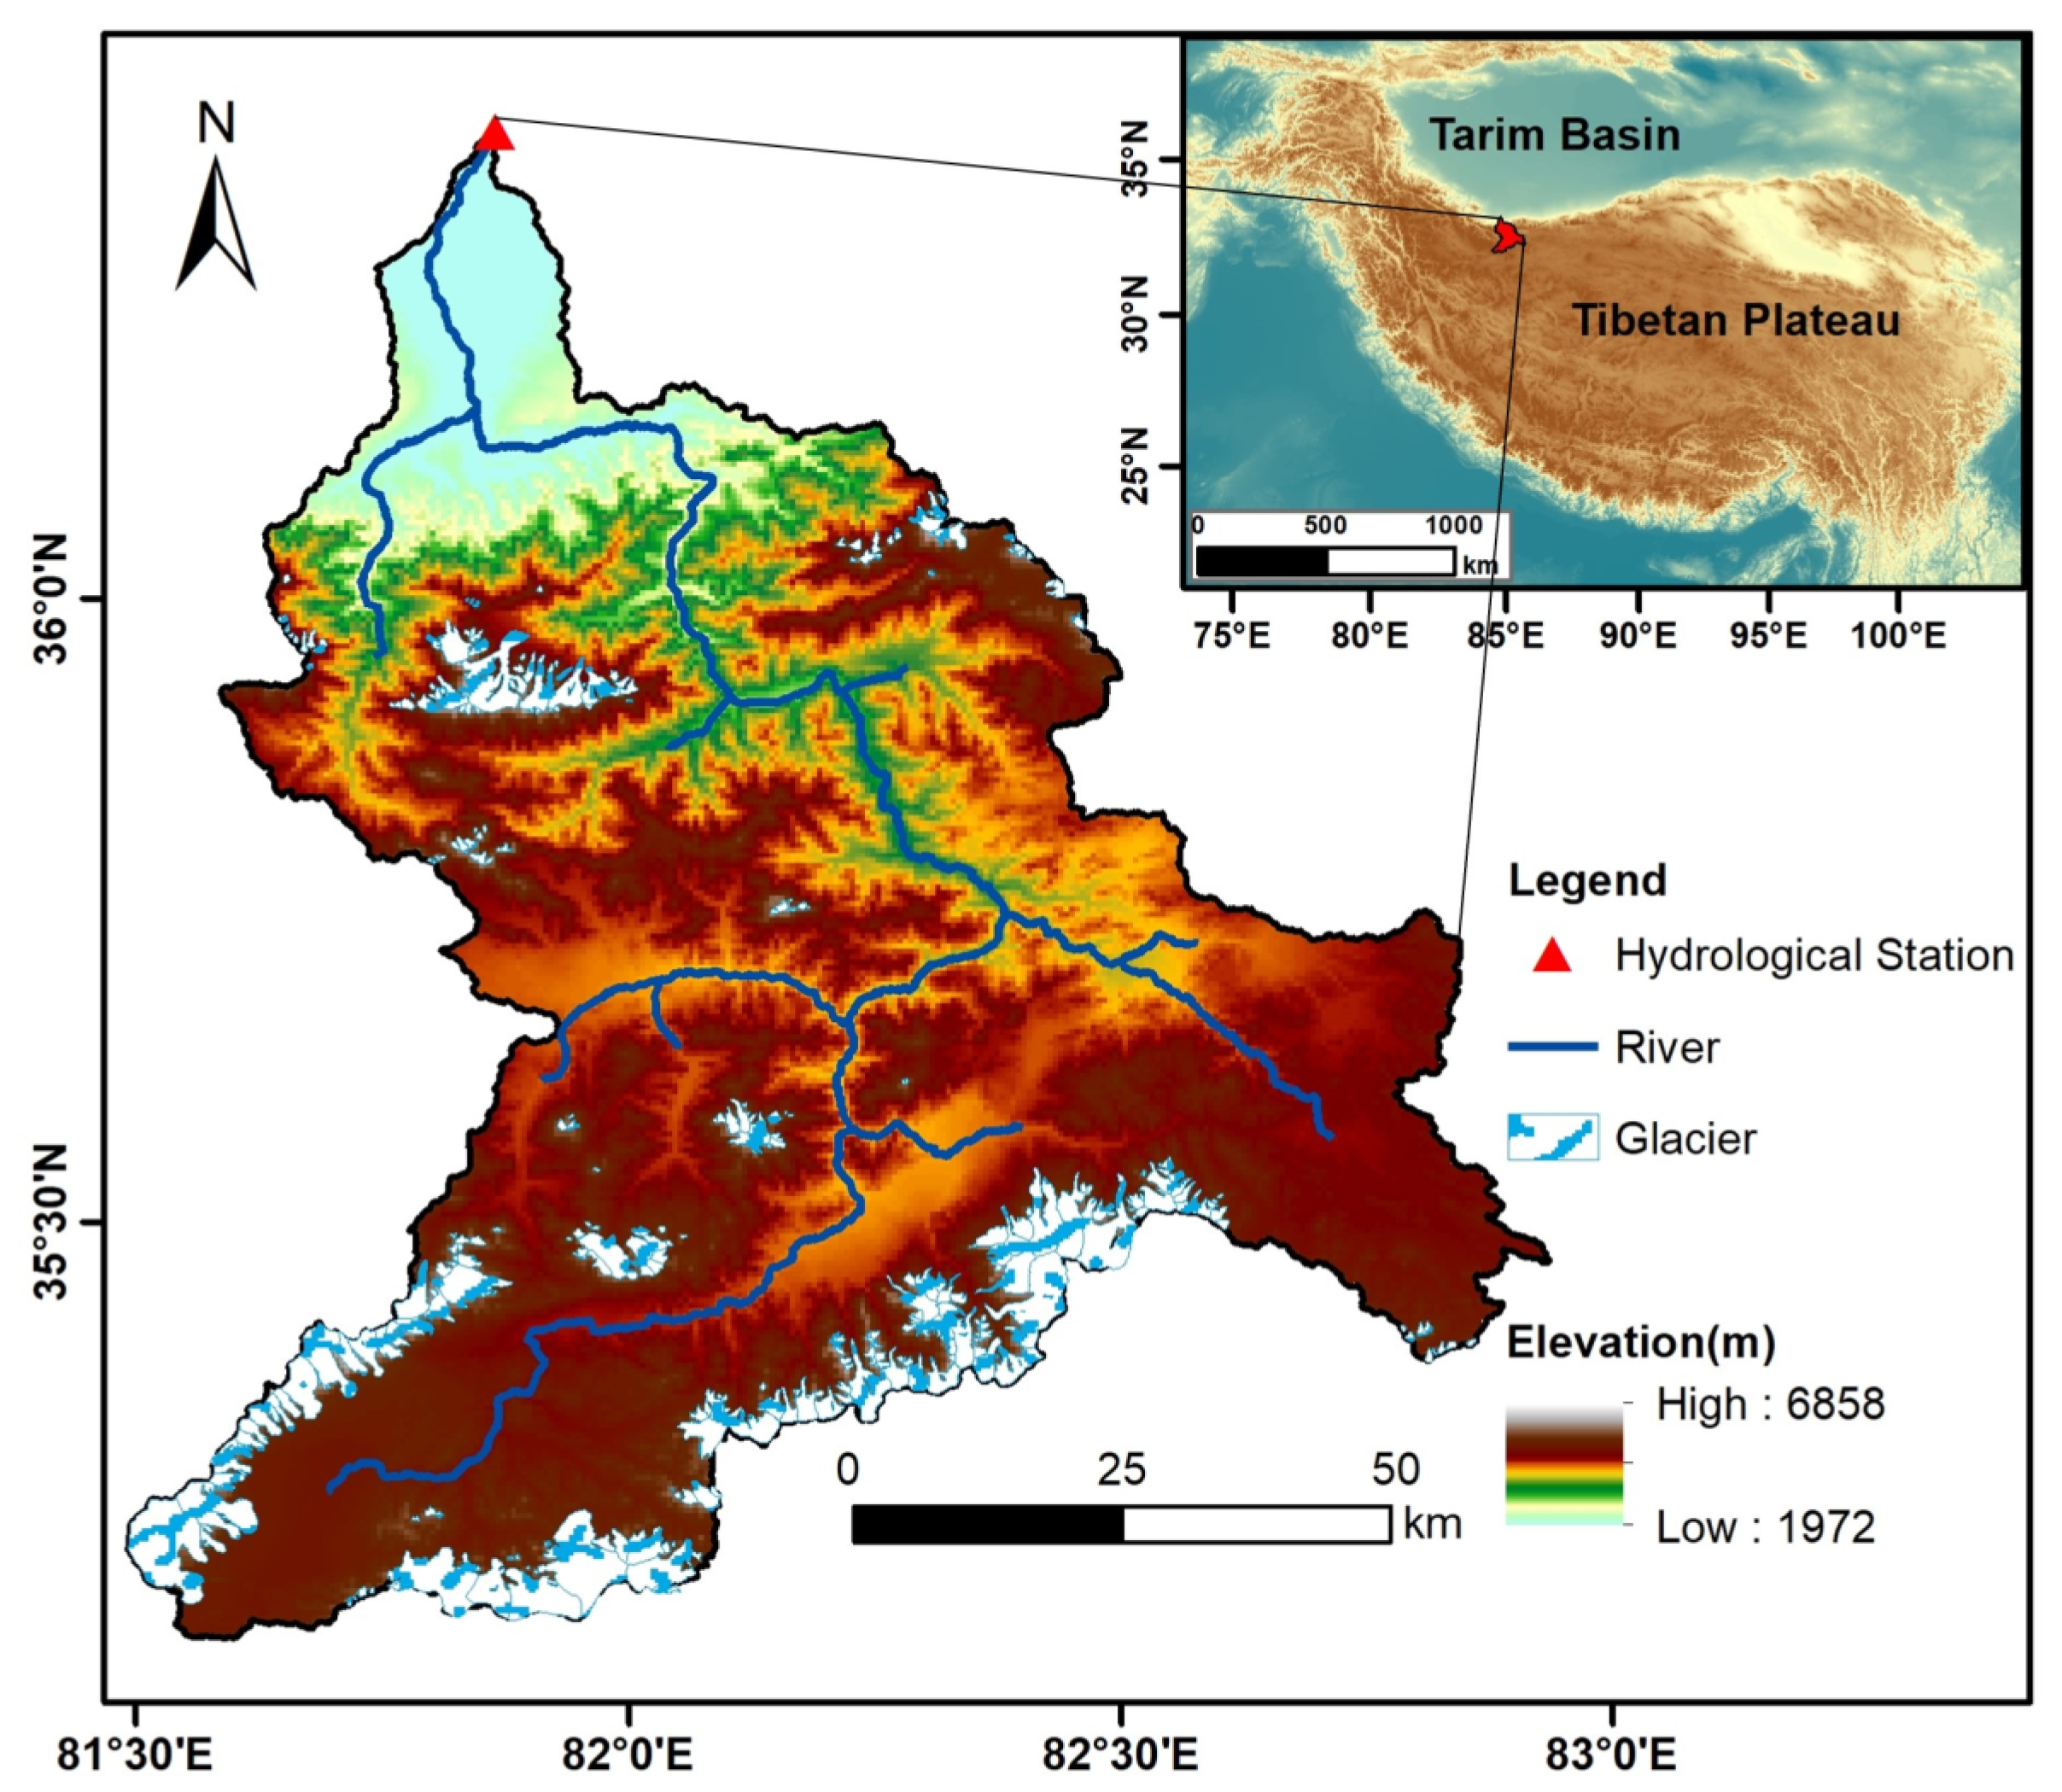
2.1. Study Area

The Keriya River, originating from the Guliya Ice Cap in the West Kunlun Mountains, holds the distinction of being the largest river coursing through Yutian County in Xinjiang Uygur Autonomous Region (Figure 1). The KRB exhibits a distinctive topographical gradient, with higher elevations situated in the southern region and lower elevations in the north. The KRB, controlled by Keriya Hydrological Station (36°45′N, 81°48′E), spans a geographical range from 35°11′ to 36°27′N and 81°27′ to 82°50′E with an altitude of 1972–6858 m and an expansive area of approximately 8350.25 km2. The glacier-covered region in the source region of the KRB spans 682 km2, approximately constituting 8.2% of the total basin area. Characterized by a warm temperate arid desert climate, the KRB experiences an average annual evaporation of 1922 mm (as observed by the Keriya Hydrological Station), an average annual air temperature of 9.6 °C, and an average annual precipitation of 129.7 mm. The average annual runoff depth of the KRB is 91.3 mm, with glacier and snow meltwater contributing to 47.3% of the total runoff, which is one of the important sources of replenishment for the KRB.

2.2. Data Sources

2.2.1. Snow Cover Dataset

The new MODIS snow cover extent product over China was obtained from the National Tibetan Plateau Data Center (http://data.tpdc.ac.cn/ (accessed on 1 October 2022)). This dataset offered a daily temporal resolution and a spatial resolution of 500 m for the period spanning from 2000 to 2020. The creation of this dataset involved the utilization of the MODIS reflectivity product MOD/MYD09GA, incorporating a snow-discriminant decision tree algorithm for diverse surface types. Furthermore, a vacancy-filling algorithm, such as a spatiotemporal interpolation algorithm for the hidden Markov random field model, was employed to complete the cloud removal within the dataset. The overall accuracy of the dataset exceeds 93%, with omission error and commission error values constrained within 10% [30,43], thus affirming the reliability and suitability of the dataset for snow cover research. In this study, the dataset was extracted according to the hydrological year (HY) scale (from 1 September to 31 August of the following year), enabling an analysis of the spatiotemporal variation characteristics of snow cover within the KRB from 2001 to 2020.

2.2.2. Climate and Runoff Data

The observation data regarding air temperature, precipitation, and wind speed from 2000 to 2020 were obtained from meteorological and hydrological stations positioned within the KRB and its surrounding areas. The monthly runoff data was sourced from the Keriya Hydrological Station.
The 1-km monthly mean temperature dataset for China was obtained from the National Tibetan Plateau Data Center (http://data.tpdc.ac.cn/ (accessed on 5 January 2023)). This dataset encompasses a temporal resolution of monthly intervals, a spatial resolution of 1 km, and a time series spanning from 1960 to 2020. The dataset underwent spatial downscaling from CRU TS v4.02 using WorldClim datasets, employing the Delta downscaling method. Its accuracy was verified against 496 national weather stations, confirming its high reliability [44,45,46,47,48]. We further evaluated its applicability to the KRB by using the observed air temperature data at stations and found that the correlation coefficients of both were above 0.97, which proved the reliability of the datasets.
The precipitation data utilized in this study was sourced from ERA5-Land monthly averaged data provided by European Centre for Medium-Range Weather Forecasts (https://cds.climate.copernicus.eu/ (accessed on 5 January 2023)). This dataset demonstrates a temporal resolution of monthly intervals, a spatial resolution of 0.1°, and a time series spanning from 1960 to 2020. ERA5-Land is derived by replaying the land component of the European Centre for Medium-Range Weather Forecasts ERA5 climate reanalysis, there providing an accurate description of the historical climate conditions [49]. Here, the accuracy of this dataset was analyzed based on the observed monthly precipitation data of different stations, and we found that the correlation coefficients were above 0.64 at the significance level of 0.05, indicating that this dataset could sufficiently reflect the real precipitation situation in the KRB.
The wind speed data adopted in this study were obtained from the High Asia Refined (HAR) analysis version 2 dataset (https://www.klima.tu-berlin.de/ (accessed on 8 January 2023)). This dataset offers a temporal resolution of monthly intervals, a spatial resolution of 10 km, and a time series spanning from 1980 to 2020. The HAR v2 dataset was generated through the application of the Weather Research and Forecasting model (WRF) version 4.1 to dynamically downscale the ERA5 reanalysis data, which is widely utilized for research purposes [50]. The accuracy of this dataset was analyzed based on the observed wind speed data from different stations, and the average correlation coefficient reached 0.50, meeting the needs of this study.
To align with the spatial resolution of the snow cover data, a statistical downscaling method was employed to reduce the spatial resolution of the three climate reanalysis datasets to 500 m. Subsequently, the data were divided according to the hydrological year scale.

2.2.3. Digital Elevation Model (DEM)

The DEM employed in this study possesses a spatial resolution of 90 m, which was provided by the Shuttle Radar Topography Mission (http://srtm.csi.cgiar.org (accessed on 1 October 2022)). To match the spatial resolution of the snow cover data, the DEM was resampled to 500 m by using a bilinear interpolation method. Subsequently, aspect and slope were calculated based on the DEM. Table 1 presents the zonal division results of elevation, aspect, and slope.

2.3. Methods

2.3.1. Snow Cover Indices

Snow cover percentage (SCP) and snow cover frequency (SCF), regarded as two commonly used snow cover indices, hold substantial significance in investigating the spatiotemporal variation of snow cover. SCP is defined as the percentage of snow cover within the basin. The formula is as follows:
S C P = S A × 100 %
where S represents the snow cover area within the KRB, and A represents the total area of the KRB.
SCF is defined as the proportion of days with snow cover on a pixel within the basin to the total number of days. The formula is as follows:
S C F = D s D × 100 %
where Ds represents the number of days with snow cover in a specific pixel, and D represents the total number of days in a year (or a season).

2.3.2. Time-Series Analysis

Sen’s slope method, a nonparametric statistical approach, was adopted to estimate increasing or decreasing trend changes within time series [51]. The Mann–Kendall trend test, a quantitative analysis tool, was used to assess the significance of the changing trends in the time series, while the Mann–Kendall mutation test was applied to identify the position of mutation points within the time series [52,53]. Typically, the combination of Sen’s slope method and the Mann–Kendall trend test allows for the evaluation of trend characteristics and the rates, which is why they are widely applied in hydro-climatic studies [54]. In this study, these methods were used to analyze changing trends and mutation points in snow cover and climate factors in time series.
The Hurst exponent, often determined via R/S analysis, is an effective method for the prediction of future change trends according to the long-term dependence or persistence of time series [55]. In this study, the Hurst exponent was adopted to analyze and predict the future change trends of SCF at each pixel.

2.3.3. Partial Least Squares Regression (PLSR)

PLSR is a comprehensive analysis method that combines principal component analysis, canonical correlation analysis, and multiple linear regression analysis. It possesses the advantages of these three methods and can eliminate multiple correlations among independent variables [38]. PLSR can be divided into univariate PLSR and multivariate PLSR. Since this study only involved a single dependent variable, univariate PLSR was adopted to explore the response of snow cover change to climate change.
Firstly, both the snow cover and climate data were standardized. F0 represents the standardized variable of snow cover data (dependent variable), and E0 represents the standardized matrix of the set of air temperature, precipitation, and wind speed data. A component u1 was extracted from F0, satisfying u 1 = F 0 c 1 , where c1 represents the first axis of F0. Similarly, component t1 was extracted from E0, satisfying t 1 = E 0 w 1 , where w1 represents the first axis of E0. Following the principles of principal component analysis and canonical correlation analysis, the following can be obtained:
w 1 = E 0 T F 0 / E 0 T F 0
Next, the regression equations for E0 and F0 with respect to t1 are obtained, respectively.
E 0 = t 1 p 1 T + E 1
F 0 = t 1 r 1 + F 1
where p1 and r1 represent regression coefficients, and E1 and F1 represent residual matrices of the regression equation. Subsequently, components t1, t2, …, tm were successively extracted from component th using the same approach. The regression equation for F0 with respect to th can be obtained using the formula:
F 0 = r 1 t 1 + r 2 t 2 + + r m t m + F m
When x j * = E 0 j and y * = F 0 , the following formula can be obtained:
y ^ * = α 1 x 1 * + α 2 x 2 * + + α p x p *
The regression coefficient of x j * is expressed as follows:
α j = h = 1 m r h w h j *
where w h j * represents the jth component of w h * . If xj contributes significantly to the construction of th, the coefficient of xj in the regression model will be larger. In this study, PLSR was applied to examine the influence of climate factors on SCF at each pixel.

2.3.4. Structural Equation Modeling (SEM)

SEM allows for the representation of complex direct and indirect causal relationships among multiple variables. It involves the establishment of a specific model based on existing theoretical knowledge, encompassing both the measurement model and the structural model for the hypothesized causal relationship among observed variables [56]. Path analysis, which is considered a special case in SEM, refers to the situation where all variables are directly available, resulting in the existence of only the structural model [57]. This approach not only enables the determination of the total effect of independent variables on the dependent variable but also observes the mutual effect between the independent variables and further divides the total influence into direct and indirect effects. In this study, SEM was employed to investigate the extent to which snow cover and climate elements affect runoff.

3. Results

3.1. Characteristics of Climate Change in the KRB

In this study, the average annual values of climate reanalysis data were extracted based on the hydrological year. Subsequently, Sen’s slope method and the Mann–Kendall trend and mutation test were employed to analyze the trends and mutation characteristics of air temperature and precipitation in the KRB from 1961 to 2020, as well as wind speed from 1981 to 2020 (Figure 2).
From 1961 to 2020, there was a significant increase in air temperature and precipitation, with rates of 0.24 °C/decade and 14.21 mm/decade, respectively (both passing the significance level of 0.001). These findings aligned with the climate change trend observed in Xinjiang over the past 60 years [58]. The average annual air temperature was −7.3 °C, reaching a maximum value of −5.9 °C in 2007 (Figure 2(a1)). As shown in Figure 2(a2), the mutation year for air temperature occurred in 1996. Prior to the mutation year, the average annual air temperature demonstrated a fluctuating trend, which continued to rise after the mutation year and exceeded the significance level of 0.05 after 2001. The average annual precipitation was 431.9 mm, with a maximum value of 516.3 mm in 2016 (Figure 2(b1)). As depicted in Figure 2(b2), the variation trend of annual precipitation can be roughly divided into three stages: an increase during 1961–1965, a decrease during 1965–1973, and another increase during 1973–2020. There was a mutation year in 1986, followed by a significant increase after 1989. From 1981 to 2020, the average annual wind speed was 5.0 m/s, reaching a maximum value of 5.5 m/s in 1988 (Figure 2(c1)). As can be seen from Figure 2(c2), the average annual wind speed indicated a slight overall upward trend, with a significant increase from 1985 to 1990. However, the changing trend during the remaining periods was insignificant (without an abrupt change point).

3.2. Characteristics of Snow Cover Change in the KRB

3.2.1. Spatial Distribution Characteristics of Snow Cover

Figure 3 illustrates the spatial distribution characteristics of the average annual SCF in the KRB across 20 hydrological years. The SCF exhibited lower values within the low elevation area in the northern part of the KRB, while higher SCF values were observed within the high elevation area in the southern part. This spatial pattern demonstrated a positive correlation between SCF and elevation.
To study the distribution characteristics of SCP across different terrains in the KRB, regional statistics for SCP were conducted based on elevation, aspect, and slope (Figure 4).
The impact of elevation on SCP is presented in Figure 4a. With the increase in elevation, the SCP in the KRB increased from 4.46% to 93.22%. The SCP exhibited a gradual increase at an elevation below 5000 m, while a more rapid increase was observed above 5000 m. This may be due to the higher temperature in low-elevation areas compared to high-elevation areas, which hindered the formation of stable snow cover.
Figure 4b shows the distribution of SCP across various aspects. The SCP exhibited distinct patterns among different aspects. Specifically, the SCP values exceeded 35% in the north, northeast, and east aspects, with the highest SCP (38.12%) observed in the northeast aspect. In contrast, the SCP values were relatively low in the south, southwest, and west aspect, with the lowest SCP observed in the south aspect at only 28.78%. This difference can be attributed to the increased solar radiation received by the south-facing region, leading to more rapid snow melting compared to other regions.
Figure 4c depicts the relationship between SCP and slope. The SCP demonstrated an initial increase followed by a decrease as slope values increased, with a distinct boundary observed at 15 degrees. The highest SCP value, reaching 37.07%, was observed within the 10–15 degree zone. SCP values were relatively low at about 30% in the 0–5 degree and above 30 degree zones. This pattern can be attributed to the flatter terrain in the downstream areas of the KRB, particularly at lower elevations, where higher temperatures prevailed. When the slope exceeded 30 degrees, the terrain became steeper and more susceptible to avalanches [59].

3.2.2. Intra-Annual Variation of Snow Cover

This study extracted the annual average daily SCP for the KRB and different elevation zones over a period of 20 hydrological years. As shown in Figure 5a, the accumulation of snow cover in the KRB initiated in September, gradually increasing until it reached its peak in mid-October. Between November and December, the SCP experienced a slight decrease and was relatively low due to low precipitation. Subsequently, the SCP exhibited a fluctuating upward trend, with a maximum value of 49.68% observed in mid-April. As the air temperature increased, the SCP began to decline rapidly from June, reaching a minimum of 13% in early August. Overall, the SCP exhibited two peak periods, one in autumn and the other in spring. The inter-annual fluctuation of SCP was slight in summer but extensive in other seasons.
The intra-annual variation of SCP at different elevation zones can be divided into three types (Figure 5b). (1) Below 4000 m, the SCP demonstrated a unimodal trend, with the peak value mainly concentrated in late-winter and early-spring. Below 3500 m, the peak value of SCP appeared in February, while it appeared in March for elevations between 3500 m and 4000 m. As the elevation increased, the peak value of SCP tended to be delayed. (2) The SCP between 4000 m and 6000 m exhibited bimodal variation characteristics, with the peaks occurring in autumn and spring, respectively. The autumn peak period, except for the 4500–5000 m zone in late-September, generally appeared in mid-October across other elevation zones. In the spring peak period, each elevation zone had a different peak period, ranging from early-March to early-June. With the increase in elevation, the peak time of SCP was further delayed, the peak value increased, and the duration of the snow accumulation period lengthened. (3) The SCP above 6000 m remained relatively stable, with the SCP values exceeding 75%. This zone was characterized by perennial snow and glaciers, which were less affected by seasonal changes.

3.2.3. Interannual Variation of Snow Cover

This study employed Sen’s slope method and the Mann–Kendall methods to assess the interannual variation of SCP in the KRB across 20 hydrological years between 2001 and 2020 considering both annual and four-season time scales (Figure 6). Overall, the trends observed for SCP on both the annual and seasonal scales did not exhibit the statistical significance level of 0.05, and no evident mutation year was identified. In terms of annual scale, the SCP demonstrated a decrease at a rate of −1.17%/decade, with an average annual SCP of 34.09%. The SCP was higher in 2003 and 2019, reaching 43.05% and 45.02%, respectively. Prior to 2014, the UF values were greater than 0 in most years, whereas after 2014, the UF values were less than 0. Thus, based on a division at 2014, the average annual SCP displayed an increasing trend followed by a decreasing trend. Regarding the four-season time scale, the highest average seasonal SCP was observed in spring (42.95%), while the lowest was recorded in summer (24.72%). The change rate of SCP in summer was the highest, reaching −2.13%.
The spatial variation trend of the annual and seasonal SCF in the KRB during the study period was investigated by applying Sen’s slope method (in the left column of Figure 7). The significance of the variation trend was analyzed in conjunction with the Mann–Kendall trend test (in the middle column of Figure 7). In addition, the Hurst exponent was adopted to predict the future variation trends (in the right column of Figure 7). The results indicated that the trends observed for the annual and seasonal SCF in the KRB from 2001 to 2020 were dominated by insignificant changes. Regions exhibiting a decreasing trend of SCF accounted for more than 50% of the total area in the annual, spring, summer, and winter seasons. Specifically, the areas with a decreasing trend of SCF in annual, spring, and winter were mainly concentrated in the northern, central, and southwestern regions of the KRB, while they were mainly located in the southern regions in summer. On the other hand, SCF in autumn displayed a primarily increasing trend, accounting for 38.24% of the total area of the basin, with 4.04% of the area showing a significant increase (significant at the 0.05 level), mainly distributed in the central area of the basin. In terms of future change trends, both the annual and seasonal SCF (except autumn) are expected to increase, with more than 45% of the regions displaying a reversal in the past change trend.

4. Discussion

4.1. Response of Snow Cover Change to Climate Change

Considering the multiple correlations among air temperature, precipitation, and wind speed, PLSR method was used to investigate the influence of different climate factors on SCF. By comparing the maximum of absolute value of PLSR coefficients on each pixel, the main controlling factors of SCF in each pixel of the KRB across 20 hydrological years (from 2001 to 2020) were obtained (Figure 8). On an annual scale, precipitation emerged as the main factor affecting the SCF, with a mainly negative influence, accounting for 43.10% of the total area. In contrast, SCF in winter was mainly positively affected by precipitation, accounting for 76.16% of the area. During spring, summer, and autumn, air temperature controlled SCF in over 45% of the KRB, with a dominant negative influence. Among these seasons, autumn accounted for the largest proportion (60.93%). The influence of wind speed on annual and seasonal SCF accounted for 11.23% to 26.54%, primarily exerting a positive effect on the annual and spring scales while having a negative influence during summer, autumn, and winter.
In both annual and seasonal scales, air temperature exerted a predominantly negative influence on SCF due to the snow cover’s susceptibility to air temperature changes. An increase in air temperature directly led to the snow melting. The influence of precipitation on SCF varied across the four seasons. In spring, autumn, and winter, precipitation mainly demonstrated a positive effect on SCF, possibly because most of the precipitation occurred as solid snow, facilitating snow accumulation. However, in annual and summer scales, precipitation had a negative effect on SCF, particularly in the high elevation areas in the southern part of the KRB. These regions contained a large amount of eternal snow, where additional snowfall did not contribute to increased SCF. Instead, excessive snow accumulation can lead to a decrease in the SCF due to snow avalanches [60]. In addition to air temperature and precipitation, wind speed also played a role in influencing SCF. In the annual and spring scales, wind speed exhibited a positive effect on SCF. It redistributed snow cover within the KRB, resulting in a more uniform spatial distribution. Conversely, wind speed had a negative impact on SCF in summer, autumn, and winter, mainly observed in the high elevation areas. This could be due to the persistently subzero air temperatures and arid conditions in these regions. Under the influence of wind speed, snow cover sublimation was significant, and the wind speed could also promote the occurrence of snow drifts and avalanches [61]. Combining three kinds of climate data, this study focuses on the effects of climate change on SCF. However, terrain also plays an important role in snow cover change. In the future, we will continue to examine the influencing factors of snow cover and attempt to analyze the elevation effect of snow cover change on climate response [62].

4.2. Effect of Snow Cover and Climate on Runoff

In this study, SEM was employed to analyze the impact of air temperature, precipitation, and SCP on runoff from 2001 to 2020. The results indicated the total effect, direct effect, and indirect effect of these three factors on runoff at the annual scale (Figure 9). In terms of the total effect, the standardized regression coefficients of the effect for air temperature, precipitation, and snow cover on runoff were −0.122, 0.609, and 0.09, respectively. Precipitation emerged as the major driver of runoff.
The direct effect of air temperature on runoff exhibited a magnitude of −0.197. This can be due to the consistently low average annual air temperature in the KRB, where the majority of areas experienced temperatures below 0 °C. The increase in air temperature had a limited effect on snow melt, but it resulted in higher evaporation rates, leading to a decrease in the runoff. Both precipitation and SCP had a direct positive effect on runoff, with the effect coefficients of 0.663 and 0.113, respectively. Wang et al. [63] found that the annual runoff of the Keriya River was negatively correlated with air temperature and positively correlated with precipitation, which was consistent with the findings of this study.
Regarding the indirect effects, the indirect effect coefficients of air temperature and SCP on runoff through precipitation were relatively significant, measuring 0.123 and −0.107, respectively. However, it is worth noting that the indirect effect coefficients of air temperature, precipitation, and SCP on runoff were all smaller than the direct effect coefficients, indicating that the three factors mainly exerted direct effects on runoff. Due to the temporal extent of the MODIS snow cover data, this study only analyzed the impact of SCP and climate factors on runoff across 20 hydrological years. In the future, it would be beneficial to incorporate observational data from meteorological stations to supplement the snow cover data. This would enable an analysis of the effect mechanism on runoff at longer time scales, facilitating a deeper understanding of the water cycle processes of the KRB.

5. Conclusions

In this study, reanalysis climate datasets were used to analyze the characteristics of climate change in the KRB. The spatiotemporal distributions of snow cover in the KRB during 20 hydrological years from 2001 to 2020 were analyzed utilizing a new MODIS snow cover extent product over China. The response of snow cover change to climate factors was evaluated using PLSR. Furthermore, the study delved into the impact of snow cover and climate factors on annual runoff by employing SEM. The findings from the present study can be summarized as follows:
(1)
There was a significant increase in air temperature and precipitation, with rates of 0.24 °C/decade and 14.21 mm/decade, and the mutation year occurred in 1996 and 1986, respectively. However, wind speed did not change significantly.
(2)
In terms of spatial distribution, the SCF in the KRB presented “low in the north and high in the south” distribution characteristics. The SCP in the KRB demonstrated an elevation-dependent increase, with the highest values observed in the north aspect and in the 10–15 degrees slope zone. Regarding the intra-annual variation, the SCP within the KRB demonstrated distinctive patterns, including a single peak in winter, double peaks in both spring and autumn, and a consistent high value (SCP > 75%) with turning elevations of 4000 m and 6000 m, respectively. Moreover, the peak SCP values showed a delayed trend with increasing elevation. In terms of temporal change, the SCP in the KRB decreased annually and in summer and winter; however, it increased in spring and autumn between 2001 and 2020. More than 50% of the KRB experienced a decreasing trend for annual, spring, summer, and winter SCF, whereas 38.24% of the areas showed an increasing trend in autumn. In addition to autumn, annual and seasonal SCF is estimated to show an upward trend in the future, accounting for more than 50% of the KRB.
(3)
The annual SCF was mainly negatively affected by precipitation, while in winter, it was mainly positively affected by precipitation, accounting for 43.1% and 76.16% of the area, respectively. The spring, summer, and autumn SCF changes in more than 45% of KRB were controlled by air temperature, exerting a predominantly negative influence. Annually and during spring, the impact of wind speed on SCF was mainly positive; however, it negative in summer, autumn, and winter, with the area controlled by wind speed ranging from 11.23% to 26.54%.
(4)
The total effect of climate factors and SCP on the annual runoff in the KRB was as follows: precipitation (0.609) > air temperature (−0.122) > SCP (0.09). Climate factors and SCP mainly exerted a direct effect on the changes in annual runoff.

Author Contributions

Conceptualization, W.Y. and Y.W.; methodology, W.Y. and X.M.; software, M.L.; validation, J.Y. and Y.T.; formal analysis, S.L.; data curation, Y.W.; writing—original draft preparation, W.Y. and Y.W.; writing—review and editing, W.Y.; supervision, X.M. All authors have read and agreed to the published version of the manuscript.

Funding

This research was funded by the Open Project of Key Laboratory, Xinjiang Uygur Autonomous Region (2023D04073), the Natural Science Foundation of Henan (232300421250, 222300420522), the Key Scientific Research Project in Colleges and Universities of Henan Province (22A170019), the Nanhu Scholars Program for Young Scholars of XYNU, and the Scientific Research Foundation of Graduate School of Xinyang Normal University (2022KYJJ017).

Data Availability Statement

Not applicable.

Acknowledgments

We would like to express our sincere thanks to the anonymous reviewers.

Conflicts of Interest

The authors declare no conflict of interest.

References

  1. Li, Y.; Chen, Y.; Li, Z. Climate and topographic controls on snow phenology dynamics in the Tienshan Mountains, Central Asia. Atmos. Res. 2020, 236, 104813. [Google Scholar] [CrossRef]
  2. Qin, D.; Liu, S.; Li, P. Snow cover distribution, variability, and response to climate change in western China. J. Clim. 2006, 19, 1820–1833. [Google Scholar] [CrossRef]
  3. Qin, D.; Zhou, B.; Xiao, C. Progress in studies of cryospheric changes and their impacts on climate of China. J. Meteorol. Res. 2014, 28, 732–746. [Google Scholar] [CrossRef]
  4. Yan, J.; Wei, R.; Wang, J.; Niu, J.; Ji, S.; Lu, S.; Li, X. Study on spatial-temporal varations of snow cover days and its indicating climatic significance in the Middle and Lower Reaches of Yangtze River for the psat 50 years. J. Xinyang Norm. Univ. Nat. Sci. Ed. 2022, 35, 92–96. [Google Scholar] [CrossRef]
  5. Xiao, X.; Zhang, T.; Zhong, X.; Li, X. Spatiotemporal variation of snow depth in the Northern Hemisphere from 1992 to 2016. Remote Sens. 2020, 12, 2728. [Google Scholar] [CrossRef]
  6. Wang, Y.; Huang, X.; Liang, H.; Sun, Y.; Feng, Q.; Liang, T. Tracking snow variations in the Northern Hemisphere using multi-source remote sensing data (2000–2015). Remote Sens. 2018, 10, 136. [Google Scholar] [CrossRef] [Green Version]
  7. López-Moreno, J.I.; Beniston, M.; García-Ruiz, J.M. Environmental change and water management in the Pyrenees: Facts and future perspectives for Mediterranean mountains. Glob. Planet. Chang. 2008, 61, 300–312. [Google Scholar] [CrossRef] [Green Version]
  8. Stone, R.S.; Dutton, E.G.; Harris, J.M.; Longenecker, D. Earlier spring snowmelt in northern Alaska as an indicator of climate change. J. Geophys. Res. Atmos. 2002, 107, ACL 10-1–ACL 10-13. [Google Scholar] [CrossRef]
  9. Shao, Y.; Dong, Z.; Meng, J.; Wu, S.; Li, Y.; Zhu, S.; Zhang, Q.; Zheng, Z. Analysis of Runoff Variation and Future Trends in a Changing Environment: Case Study for Shiyanghe River Basin, Northwest China. Sustainability 2023, 15, 2173. [Google Scholar] [CrossRef]
  10. Pulliainen, J.; Luojus, K.; Derksen, C.; Mudryk, L.; Lemmetyinen, J.; Salminen, M.; Ikonen, J.; Takala, M.; Cohen, J.; Smolander, T.; et al. Patterns and trends of Northern Hemisphere snow mass from 1980 to 2018. Nature 2020, 581, 294–298. [Google Scholar] [CrossRef]
  11. Pulliainen, J. Mapping of snow water equivalent and snow depth in boreal and sub-arctic zones by assimilating space-borne microwave radiometer data and ground-based observations. Remote Sens. Environ. 2006, 101, 257–269. [Google Scholar] [CrossRef]
  12. Zhang, Y.; Li, B.; Zheng, D. A discussion on the boundary and area of the Tibetan Plateau in China. Geogr. Res. 2002, 21, 1–8. [Google Scholar] [CrossRef]
  13. Seidel, F.C.; Rittger, K.; Skiles, S.M.; Molotch, N.P.; Painter, T.H. Case study of spatial and temporal variability of snow cover, grain size, albedo and radiative forcing in the Sierra Nevada and Rocky Mountain snowpack derived from imaging spectroscopy. Cryosphere 2016, 10, 1229–1244. [Google Scholar] [CrossRef] [Green Version]
  14. Zhao, G.; Han, Y.; Liu, W.; Zhang, R.; Meng, J.; Zeng, X. Spatial-temporal variations of extreme temperature events in Xinjiang from 1961 to 2016. J. Xinyang Norm. Univ. (Nat. Sci. Ed.) 2021, 34, 248–254. [Google Scholar] [CrossRef]
  15. Tan, X.; Wu, Z.; Mu, X.; Gao, P.; Zhao, G.; Sun, W.; Gu, C. Spatiotemporal changes in snow cover over China during 1960–2013. Atmos. Res. 2019, 218, 183–194. [Google Scholar] [CrossRef]
  16. Huang, X.; Liu, C.; Zheng, Z.; Wang, Y.; Li, X.; Liang, T. Snow cover variations across China from 1951–2018. Cryosphere Discuss. 2020, preprint. [Google Scholar] [CrossRef]
  17. Peng, S.; Piao, S.; Ciais, P.; Fang, J.; Wang, X. Change in winter snow depth and its impacts on vegetation in China. Glob. Chang. Biol. 2010, 16, 3004–3013. [Google Scholar] [CrossRef]
  18. Liu, M.; Ma, J.; Wang, L.; Lu, S.; Yan, J.; Liu, J.; He, Z.; Cui, Y. Spatial and temporal varations of shallow ground temperature in the Huaihe River Source and its response to recent global warming hiatus. J. Xinyang Norm. Univ. (Nat. Sci. Ed.) 2023, 36, 180–185. [Google Scholar] [CrossRef]
  19. Chen, W.; Ding, J.; Wang, J.; Zhang, J.; Zhang, Z. Temporal and spatial variability in snow cover over the Xinjiang Uygur Autonomous Region, China, from 2001 to 2015. PeerJ 2020, 8, e8861. [Google Scholar] [CrossRef] [Green Version]
  20. Zhang, G.; Xie, H.; Yao, T.; Liang, T.; Kang, S. Snow cover dynamics of four lake basins over Tibetan Plateau using time series MODIS data (2001–2010). Water Resour. Res. 2012, 48, W10529. [Google Scholar] [CrossRef]
  21. Chen, Y.; Zhou, S.; Zhu, M.; Wu, L. Correlation analysis of vegetation cover change and its driving factors in Henan province. J. Xinyang Norm. Univ. (Nat. Sci. Ed.) 2021, 34, 401–407. [Google Scholar] [CrossRef]
  22. Hall, D.K.; Riggs, G.A.; Salomonson, V.V.; DiGirolamo, N.E.; Bayr, K.J. MODIS snow-cover products. Remote Sens. Environ. 2002, 83, 181–194. [Google Scholar] [CrossRef] [Green Version]
  23. Kalluri, S.; Cao, C.; Heidinger, A.; Ignatov, A.; Key, J.; Smith, T. The advanced very high resolution radiometer: Contributing to earth observations for over 40 years. Bull. Am. Meteorol. Soc. 2021, 102, E351–E366. [Google Scholar] [CrossRef]
  24. Venäläinen, P.; Luojus, K.; Lemmetyinen, J.; Pulliainen, J.; Moisander, M.; Takala, M. Impact of dynamic snow density on GlobSnow snow water equivalent retrieval accuracy. Cryosphere 2021, 15, 2969–2981. [Google Scholar] [CrossRef]
  25. Saavedra, F.A.; Kampf, S.K.; Fassnacht, S.R.; Sibold, J.S. Changes in Andes snow cover from MODIS data, 2000–2016. Cryosphere 2018, 12, 1027–1046. [Google Scholar] [CrossRef] [Green Version]
  26. Liang, T.G.; Huang, X.D.; Wu, C.X.; Liu, X.Y.; Li, W.L.; Guo, Z.G.; Ren, J.Z. An application of MODIS data to snow cover monitoring in a pastoral area: A case study in Northern Xinjiang, China. Remote Sens. Environ. 2008, 112, 1514–1526. [Google Scholar] [CrossRef]
  27. Pu, Z.; Xu, L.; Salomonson, V.V. MODIS/Terra observed seasonal variations of snow cover over the Tibetan Plateau. Geophys. Res. Lett. 2007, 34, L06706. [Google Scholar] [CrossRef] [Green Version]
  28. Zou, Y.; Sun, P.; Ma, Z.; Lv, Y.; Zhang, Q. Snow Cover in the Three Stable Snow Cover Areas of China and Spatio-Temporal Patterns of the Future. Remote Sens. 2022, 14, 3098. [Google Scholar] [CrossRef]
  29. Thapa, A.; Muhammad, S. Contemporary snow changes in the karakoram region attributed to improved MODIS data between 2003 and 2018. Water 2020, 12, 2681. [Google Scholar] [CrossRef]
  30. Hao, X.; Huang, G.; Zheng, Z.; Sun, X.; Ji, W.; Zhao, H.; Wang, J.; Li, H.; Wang, X. Development and validation of a new MODIS snow-cover-extent product over China. Hydrol. Earth Syst. Sci. 2022, 26, 1937–1952. [Google Scholar] [CrossRef]
  31. Rupp, D.E.; Mote, P.W.; Bindoff, N.L.; Stott, P.A.; Robinson, D.A. Detection and Attribution of Observed Changes in Northern Hemisphere Spring Snow Cover. J. Clim. 2013, 26, 6904–6914. [Google Scholar] [CrossRef]
  32. Du, W.; Kang, S.; Qian, L.; Jiang, Y.; Sun, W.; Chen, J.; Xu, Z.; Sun, W.; Qin, X.; Chai, X. Spatiotemporal variation of snow cover frequency in the Qilian Mountains (northwestern China) during 2000–2020 and associated circulation mechanisms. Remote Sens. 2022, 14, 2823. [Google Scholar] [CrossRef]
  33. Hussain, D.; Kuo, C.-Y.; Hameed, A.; Tseng, K.-H.; Jan, B.; Abbas, N.; Kao, H.-C.; Lan, W.-H.; Imani, M. Spaceborne satellite for snow cover and hydrological characteristic of the Gilgit river basin, Hindukush–Karakoram mountains, Pakistan. Sensors 2019, 19, 531. [Google Scholar] [CrossRef] [PubMed] [Green Version]
  34. VyshnevskiI, V.I.; Donich, O.A. Snow cover in the Ukrainian Carpathians. Acta Hydrol. Slovaca 2021, 22, 284–293. [Google Scholar] [CrossRef]
  35. Shi, M.; Yuan, Z.; Hong, X.; Liu, S. Spatiotemporal Variation of Snow Cover and Its Response to Climate Change in the Source Region of the Yangtze River, China. Atmosphere 2022, 13, 1161. [Google Scholar] [CrossRef]
  36. Ban, C.; Xu, Z.; Zuo, D.; Liu, X.; Zhang, R.; Wang, J. Vertical influence of temperature and precipitation on snow cover variability in the Yarlung Zangbo River basin, China. Int. J. Climatol. 2021, 41, 1148–1161. [Google Scholar] [CrossRef]
  37. Dharpure, J.K.; Patel, A.; Goswami, A.; Kulkarni, A.V.; Snehmani. Spatiotemporal snow cover characterization and its linkage with climate change over the Chenab river basin, western Himalayas. GIsci. Remote. Sens. 2020, 57, 882–906. [Google Scholar] [CrossRef]
  38. Geladi, P.; Kowalski, B.R. Partial least-squares regression: A tutorial. Anal. Chim. Acta 1986, 185, 1–17. [Google Scholar] [CrossRef]
  39. Zubaida, M.; Xia, J.; Polat, M.; Zhang, R. Land use and landscape pattern changes in the middle reaches of the Keriya River. Acta Ecol. Sin. 2019, 39, 2322–2330. [Google Scholar] [CrossRef]
  40. Xu, J.; Liu, S.; Zhang, S.; Shangguan, D. Glaciers fluctuations in the Karamilan-Keriya River Watershed in the past 30 years. J. Glaciol. Geocryol. 2006, 28, 312–318. [Google Scholar]
  41. Ma, X.; Yan, W.; Zhao, C.; Kundzewicz, Z.W. Snow-cover area and runoff variation under climate change in the West Kunlun Mountains. Water 2019, 11, 2246. [Google Scholar] [CrossRef] [Green Version]
  42. Ling, H.; Zhang, Q.; Shi, W.; Xu, H. Runoff variation law and its response to climate change in the headstream area of the Keriya River basin, Xinjiang. J. Earth. Sci. 2011, 22, 780–791. [Google Scholar] [CrossRef]
  43. Hao, X. A New MODIS Snow Cover Extent Product over China (2000–2020); National Tibetan Plateau Data Center: Lanzhou, China, 2021. [Google Scholar] [CrossRef]
  44. Peng, S. 1-km Monthly Mean Temperature Dataset for China (1901–2021); National Tibetan Plateau Data Center: Lanzhou, China, 2020. [Google Scholar] [CrossRef]
  45. Peng, S.; Gang, C.; Cao, Y.; Chen, Y. Assessment of climate change trends over the Loess Plateau in China from 1901 to 2100. Int. J. Climatol. 2018, 38, 2250–2264. [Google Scholar] [CrossRef]
  46. Peng, S.; Ding, Y.; Wen, Z.; Chen, Y.; Cao, Y.; Ren, J. Spatiotemporal change and trend analysis of potential evapotranspiration over the Loess Plateau of China during 2011–2100. Agric. For. Meteorol. 2017, 233, 183–194. [Google Scholar] [CrossRef] [Green Version]
  47. Ding, Y.; Peng, S. Spatiotemporal trends and attribution of drought across China from 1901–2100. Sustainability 2020, 12, 477. [Google Scholar] [CrossRef] [Green Version]
  48. Peng, S.; Ding, Y.; Liu, W.; Li, Z. 1 km monthly temperature and precipitation dataset for China from 1901 to 2017. Earth Syst. Sci. Data 2019, 11, 1931–1946. [Google Scholar] [CrossRef] [Green Version]
  49. Muñoz Sabater, J. ERA5-Land monthly data from 1950 to present: Copernicus Climate Change Service (C3S) Climate Data Store (CDS). 2019. Available online: https://cds.climate.copernicus.eu/cdsapp#!/dataset/reanalysis-era5-land-monthly-means?tab=overview (accessed on 21 May 2023).
  50. Wang, X.; Tolksdorf, V.; Otto, M.; Scherer, D. WRF-based dynamical downscaling of ERA5 reanalysis data for High Mountain Asia: Towards a new version of the High Asia Refined analysis. Int. J. Climatol. 2021, 41, 743–762. [Google Scholar] [CrossRef]
  51. Salmi, T.; Määttä, A.; Anttila, P.; Ruoho-Airola, T.; Amnell, T. Detecting trends of annual values of atmospheric pollutants by the Mann-Kendall test and Sen’s slope estimates. In The Excel Template Application MAKESENS; Finnish Meteorological Institute: Helsinki, Finland, 2002. [Google Scholar]
  52. Mann, H.B. Nonparametric tests against trend. Econometrica 1945, 13, 245–259. [Google Scholar] [CrossRef]
  53. Kendall, M.G. Rank Correlation Methods, 4th ed.; Charles Griffin: London, UK, 1975; ISBN 0195208374. [Google Scholar]
  54. Gocic, M.; Trajkovic, S. Analysis of changes in meteorological variables using Mann-Kendall and Sen’s slope estimator statistical tests in Serbia. Glob. Planet. Chang. 2013, 100, 172–182. [Google Scholar] [CrossRef]
  55. Hurst, H.E. Long-term storage capacity of reservoirs. Trans. Am. Soc. Civ. Eng. 1951, 116, 770–799. [Google Scholar] [CrossRef]
  56. Blunch, N. Introduction to Structural Equation Modeling Using IBM SPSS Statistics and AMOS; Sage Publications Inc.: Thousand Oaks, CA, USA, 2012. [Google Scholar]
  57. Lei, P.W.; Wu, Q. Introduction to structural equation modeling: Issues and practical considerations. Educ. Meas. Issues Pract. 2007, 26, 33–43. [Google Scholar] [CrossRef]
  58. Chen, Y.; Li, Z.; Xu, J.; Shen, Y.; Xing, X.; Xie, T.; Li, Z.; Yang, L.; Xi, H.; Zhu, C.; et al. Changes and protection suggestions in water resources and ecological environment in arid region of Northwest China. Bull. Chin. Acad. Sci. 2023, 38, 385–393. [Google Scholar] [CrossRef]
  59. Schweizer, J.; Jamieson, J.B. Snow cover properties for skier triggering of avalanches. Cold Reg. Sci. Technol. 2001, 33, 207–221. [Google Scholar] [CrossRef]
  60. Wu, S.; Zhang, X.; Du, J.; Zhou, X.; Tuo, Y.; Li, R.; Duan, Z. The vertical influence of temperature and precipitation on snow cover variability in the Central Tianshan Mountains, Northwest China. Hydrol. Process. 2019, 33, 1686–1697. [Google Scholar] [CrossRef] [Green Version]
  61. Zhang, C.; Mou, N.; Niu, J.; Zhang, L.; Liu, F. Spatio-Temporal Variation Characteristics of Snow Depth and Snow Cover Days over the Tibetan Plateau. Water 2021, 13, 307. [Google Scholar] [CrossRef]
  62. Morán-Tejeda, E.; López-Moreno, J.I.; Beniston, M. The changing roles of temperature and precipitation on snowpack variability in Switzerland as a function of altitude. Geophys. Res. Lett. 2013, 40, 2131–2136. [Google Scholar] [CrossRef] [Green Version]
  63. Wang, D.; Shi, Q.; Dong, D.; Chen, C. Response of runoff volume change to climate in the Keriya River in Xinjiang. Arid Zone Res. 2018, 35, 1271–1279. [Google Scholar] [CrossRef]
Figure 1. Location and topography of the KRB.
Remotesensing 15 03435 g001
Figure 2. Mann–Kendall trend (a1,b1,c1) and mutation test (a2,b2,c2) of average annual air temperature (a1,a2), precipitation (b1,b2), and wind speed (c1,c2) in the KRB. The dotted lines in the right column figures represent critical Zc values at the significance level of 0.05.
Remotesensing 15 03435 g002
Figure 3. Spatial distribution of annual average SCF in the KRB from 2001 to 2020.
Remotesensing 15 03435 g003
Figure 4. SCP distribution at different elevations (a), aspects (b), and slopes (c) in the KRB from 2001 to 2020.
Remotesensing 15 03435 g004
Figure 5. Intra-annual variation of SCP in KRB from 2001 to 2020 at basin scale (a) and different elevation zones (b).
Remotesensing 15 03435 g005
Figure 6. Mann–Kendall trend (in the left column) and mutation test (in the right column) of average SCP in the KRB from 2001 to 2020 at different time scales: annual (a1,a2), spring (b1,b2), summer (c1,c2), autumn (d1,d2), and winter (e1,e2). The dotted lines in the right column figures represent critical Zc values at a significance level of 0.05.
Remotesensing 15 03435 g006
Figure 7. Spatial distribution of SCF variation trends (in the left column), significance (in the middle column), and future changes (in the right column) in the KRB from 2001 to 2020 at different time scales: annual (a1,a2,a3), spring (b1,b2,b3), summer (c1,c2,c3), autumn (d1,d2,d3), and winter (e1,e2,e3).
Remotesensing 15 03435 g007
Figure 8. Influencing factors of SCF in the KRB from 2001 to 2020 at different time scales: annual (a), spring (b), summer (c), autumn (d), and winter (e).
Remotesensing 15 03435 g008
Figure 9. Effects of air temperature, precipitation, and SCP on runoff in the KRB from 2001 to 2020.
Remotesensing 15 03435 g009
Table 1. Zonal features extracted from DEM of the KRB.
Elevation (m)Area (km2)AspectArea (km2)Slope (°)Area (km2)
≤2500145.75North (N)1427.75≤52088.75
2500–3000281.75Northeast (NE)1119.505–102039.00
3000–3500324.5East (E)801.7510–151713.00
3500–4000357.75Southeast (SE)920.7515–201263.25
4000–4500692.75South (S)1050.0020–25772.00
4500–50002129.25Southwest (SW)818.0025–30348.50
5000–55002815.00West (W)891.75>30125.75
5500–60001271.50Northwest (NW)1320.75
>6000332.00
Disclaimer/Publisher’s Note: The statements, opinions and data contained in all publications are solely those of the individual author(s) and contributor(s) and not of MDPI and/or the editor(s). MDPI and/or the editor(s) disclaim responsibility for any injury to people or property resulting from any ideas, methods, instructions or products referred to in the content.

