Abstract
The semantic segmentation of point clouds is a crucial undertaking in 3D reconstruction and holds great importance. However, achieving precise semantic segmentation represents a significant hurdle. In this paper, we present BEMF-Net, an efficient method for large-scale environments. It starts with an effective feature extraction method. Unlike images, 3D data comprise not only geometric relations but also texture information. To accurately depict the scene, it is crucial to take into account the impacts of texture and geometry on the task, and incorporate modifications to improve feature description. Additionally, we present a multi-scale feature fusion technique that effectively promotes the interaction between features at different resolutions. The approach mitigates the problem of the smoothing of detailed information caused by downsampling mechanisms, while ensuring the integrity of features across different layers, allowing a more comprehensive representation of the point cloud. We confirmed the effectiveness of this method by testing it on benchmark datasets such as S3DIS, SensatUrban, and Toronto3D.
1. Introduction
With the advancement of science and technology in recent years, 3D data have played an increasingly important role in intelligent analysis and simulation. Point clouds, an important segment of visual data, are obtained by 3D sensors from either individual objects or entire scenes. Point clouds also represent the digital mapping of the real world, providing a comprehensive understanding of the state of a large and complex environment. This has led to a significant shift in focus to 3D point clouds in areas such as smart cities [1,2,3,4,5], autonomous driving [6,7,8], and land monitoring [9,10,11]. The challenge, however, is that point clouds exist in the form of discrete point collections, making their effective processing a complex task.
Semantic segmentation is crucial for both upstream and downstream tasks related to point clouds [12,13,14]. Directly acquired point cloud data lack auxiliary information, so categorizing each point and providing semantic information is necessary for the effective performance of the subsequent relative tasks. Currently, image semantic segmentation [15], change detection [16,17,18], and classification [19] have achieved significant success due to the improvement of deep learning. These achievements have spurred research towards the effective application of deep learning to point cloud tasks [20], which has become an important research direction.
As point cloud deep learning research progresses, related tasks have yielded certain outcomes, leading to numerous novel methods [21,22,23,24]. In 2017, PointNet [25] involved a direct approach to handling point clouds. After that, Pointnet++ [26] utilized a methodology capable of perceiving local information. RandLA-Net [27] used the U-Net structure and random sampling strategy to address large-scale scene applications by examining the point cloud information at different scales. Since then, a large number of methods have been proposed [28,29,30], mainly aimed at acquiring more comprehensive features and enhancing local information by constructing geometric neighborhood relationship maps to improve experimental results. Although these approaches have proven to be crucial in boosting the feature description capability for point cloud semantic segmentation, they still face a number of challenges.
Firstly, accurately describing point cloud information is the core problem of scene understanding. One way to achieve this is to create a geometric neighborhood relationship graph. However, this approach [31] also has its limitations. Geometric relationships created simply by finding the K-nearest neighbors in Euclidean space may not accurately capture local relationships. Local regions in a scene frequently display similar geometric patterns, making it difficult to effectively distinguish between them using a geometric relationship. Therefore, we propose the dilated bilateral block (DBB), which generates multiple feature spaces by incorporating additional information and exploits the differences between these spaces to improve feature representativeness. Image semantic segmentation is commonly achieved through color, while point clouds also carry texture information. This study enhances local information by establishing texture relationships, and precise segmentation is achievable in areas with a dense distribution of various semantic categories through the difference between the initial and offset spatial attributes.
Secondly, the effective utilization of information across varying scales is critical to solving the problem of accurately segmenting large-scale scenes. The encoder–decoder architecture adopts an inverted pyramid structure, allowing the integration of features at different scales. The downsampling process enables the acquisition of several point cloud segments with varying densities. Additionally, it is evident that the point cloud becomes less dense as it is sampled at lower layers. The use of these point clouds enables the perception of neighborhood states through varying receptive fields. Subsequently, the upsampling structure combines this information to provide a comprehensive description at multiple scales. Several methods [32,33,34,35] have been proposed to enhance this framework for more efficient usage. However, the existing methods tend to fuse information layer by layer. The sequence fusion method leads to the omission of a considerable number of intricate details in sparser point clouds and hinders cross-scale information exchange, thereby diminishing the veracity of features. To address the aforementioned issues, we introduced the U-Fusion module, which incorporates a symmetrical structure of progressive aggregation and divergence. The purpose of progressive aggregation is to reduce the feature gap as the fusion proceeds and to prevent feature information from becoming blurred during multiscale fusion. Furthermore, in order to guarantee the exchange of information between different scales and maintain the integrity of the data, we adopted a gradual divergence approach to achieve this goal.
In summary, our main contributions are as follows:
- We propose the dilated bilateral block (DBB) module, which allows the fine-grained learning of point clouds and optimizes the understanding of their local relationships. The module enriches the neighborhood representation by constructing local texture relations. In addition, it uses the differences in the neighborhood space to effectively differentiate semantic class boundaries.
- We designed a novel U-Fusion module, which facilitates the exchange of information from point clouds at multiple resolutions and ensures the effective utilization of features at each resolution.
- We proposed BEMF-Net for the task of semantic segmentation of large-scale point cloud scenes and achieved excellent results on all public benchmark datasets.
2. Related Work
2.1. Semantic Segmentation on Point Cloud
As deep learning research on point clouds progresses, there are numerous new methods [36,37,38,39,40] that have achieved excellent performances on semantic segmentation. Currently, there are three primary methods for semantically segmenting point clouds: projection-based, voxel-based, and point-based. Projection-based approaches [41] rely on a virtual camera to project the point cloud as a set of images into multiple viewpoints, then perform semantic segmentation through 2D image deep learning, and finally re-project the image segmentation results onto the point cloud. Voxel-based techniques [39] require the point cloud to be converted into voxels, and the points within each voxel block share the same semantic segmentation result. Both methods dilute the intricacies of geometric structural information within the point cloud data structure, leading to a reduction in its descriptive capacity. Point-based methods [42,43,44] do not require data type conversion for the point cloud and directly use points as input. PointNet [25] achieves this by using multilayer perceptrons (MLPs) to learn features, and a max-pooling layer for global feature extraction. PointNet++ [26] addresses the issue of insufficient local information by introducing the concept of neighborhood balls. Most of the methods are implemented through MLPs or graph convolution, while KPConv [33] involves a different approach by proposing kernel point convolution, a type of convolution suitable for 3D data. PCT [45] introduces a transformer module to achieve the interaction between global and local information.
2.2. Point Cloud Feature Extraction
The increasing research focus on point clouds has shifted the focus of feature extraction from individual points to local regions. In contrast to point-based methods, the present current advanced approaches [43,46,47] accentuate the extraction of valuable insights from local connections, typically established by spatial proximity. DGCNN [48] attains the successful depiction of local information by utilizing the Euclidean distance to seek out the K-nearest points and establish edge relationships upon these points. SCF-Net [44] introduces the polar coordinate space to represent point clouds, aiming to overcome the problem of orientation sensitivity of certain objects. However, current methods lack sufficient localized information extraction. RandLa-Net [27] incorporates multi-resolution characteristics, which provide unique descriptions of local information at different resolutions, expanding the perceptual field through fusion. BAAFNet [32] uses both geometric relationships and semantic associations, leveraging bilateral information to mutually enhance and offer a boost to local contextual information. These methods independently process extensive information using their respective approaches, enabling the information to be effectively exploited. In this work, inspired by the feature learning of image vision, we introduce texture information into the encoding process to enrich the local description. Furthermore, we effectively distinguish semantic category edges using differences in different neighborhood spaces.
2.3. Multi-Scale Feature Fusion
The U-Net framework is frequently implemented in image processing tasks. The inverted pyramid architecture enables the acquisition of features at diverse resolutions, which capture diverse neighborhoods depending on the resolution. Hence, several studies have been undertaken to effectively fuse information at multiple scales. Res-UNet [49] applies residual concatenation instead of the sub-modules of the original structure. DenseUNet [50] interconnects each layer with the following layers. UNet++ [51] also adopted a similar approach to improve skip-connection processing.
In 2D images, there are several methods working on fusing the multi-scale information of point cloud. PointNet++ [26] achieves this through interpolative fusion. BAAFNet [32] involves a feature fusion module that uses an adaptive strategy to fuse features at different scales. ResDLPS-Net [35] presents a method for pairwise aggregation to effectively extract appropriate the neighborhood information. Meanwhile, MFA [34] utilizes dense skin connections to improve feature retention at the current resolution. Although these methods have produced satisfactory outcomes in real-world applications, they have overlooked the presence of potential hidden risks. Fine-grained segmentation is highly dependent on fully comprehending local information. The conventional U-Net approach only facilitates the information interaction between neighboring layers, with no regard for the impact of information at other resolutions. In contrast, our U-Fusion module not only explores the efficient utilization of multi-scale information but also facilitates the interaction of features at various resolutions to eliminate any possible perceptual blind spots.
3. Methodology
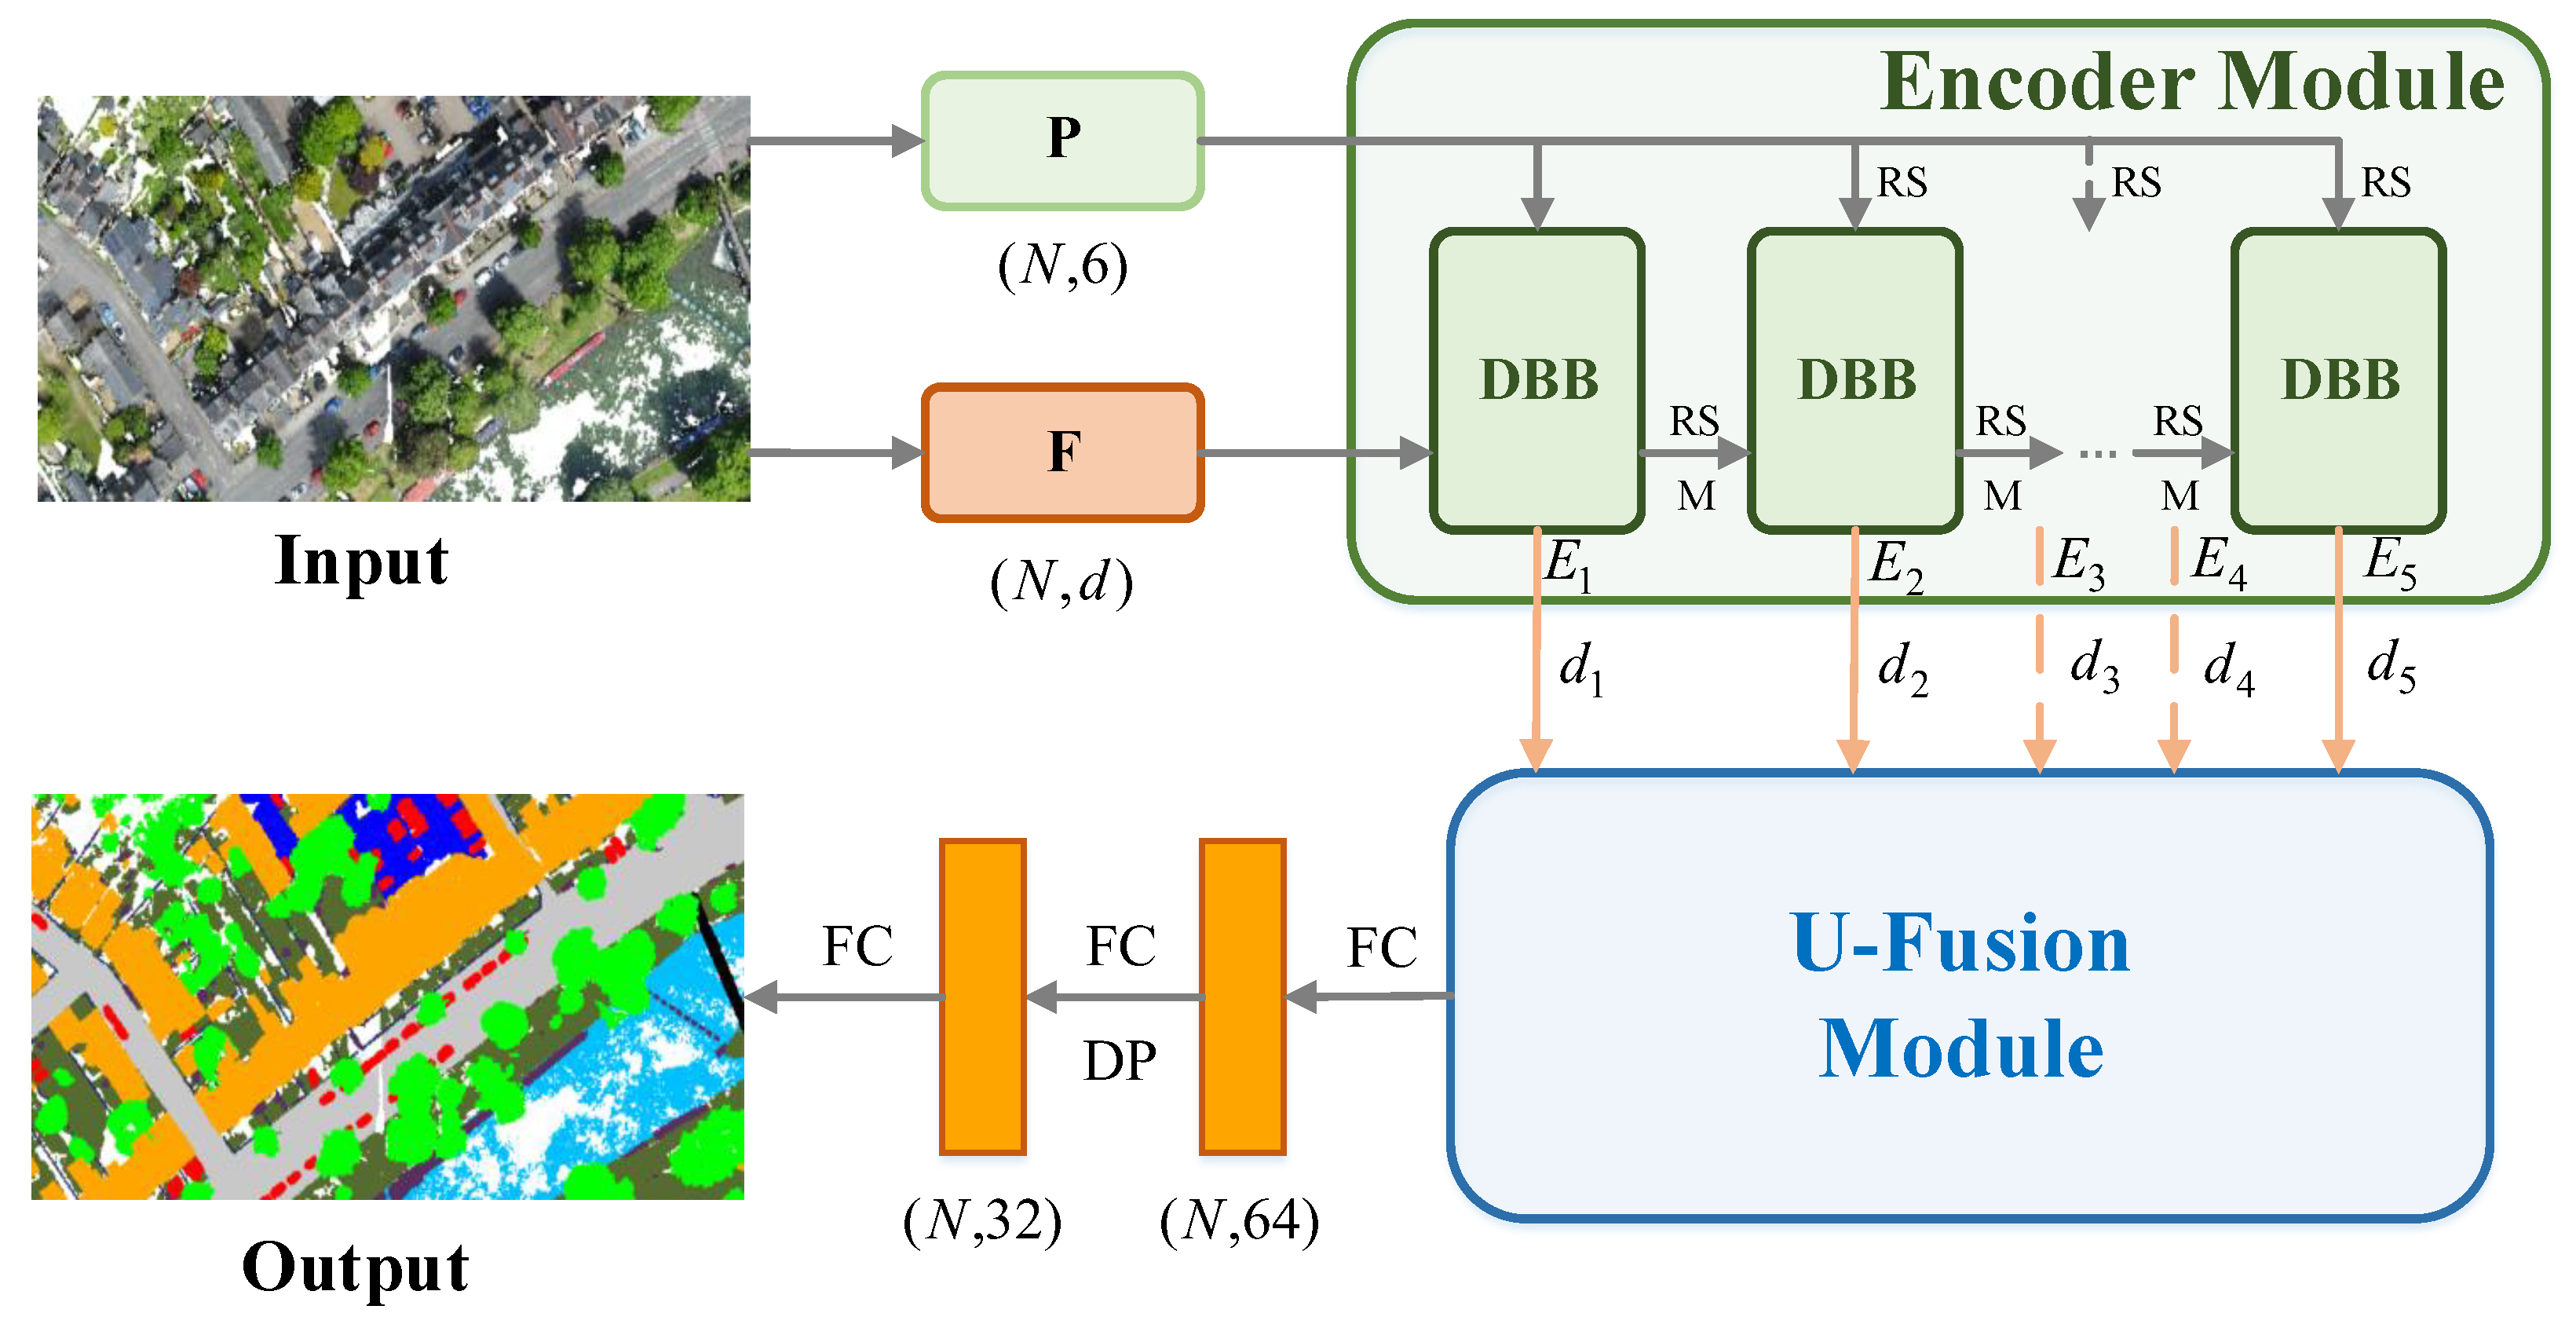
In 2D image semantic segmentation, the color information of each pixel is often utilized for feature representation and semantic discrimination. Similarly, in 3D point cloud semantic segmentation, we think color information, a semantic representation form for each point, can enhance the accuracy and robustness of semantic segmentation with proper handling and utilization. For the scene point cloud, we take the spatial coordinates and color information of each point as the raw input . Firstly, we use a fully connected (FC) layer to perform feature extraction on P to obtain an initial semantic feature . Then, and are jointly input into five consecutive encoders for feature encoding, which yields the encoding features . Subsequently, a U-Fusion module is employed to facilitate feature interactions across multi-scales and layer-wise feature decoding. Finally, three FC layers are used to predict final semantic labels from final decoding features, where is the number of object categories.
3.1. Encoder Module
The encoder module consists of five successive dilated bilateral blocks (DBBs), each of which includes two bilateral local aggregation (BLA) modules, as illustrated in Figure 1. For each encoder layer, serves as the guidance information to enhance and fuse with . Afterward, random sampling (RS) is performed to reduce the resolution of the point cloud, and then we use an MLP to transform the feature into the specified dimension (the detail settings are shown in the caption of Figure 1), and finally obtain the input for the next layer of the encoder. Following the encoding process through several encoders, the final encoded features will comprise a discriminative, spatially aware feature representation. At this stage, each feature will cover a broader receptive field, making it more global compared to the initial one.

Figure 1.
The overall architecture of our network, is coined BEMF-Net, for large-scale point cloud segmentation. M denotes MLP, and represent the dimensions of , which are .
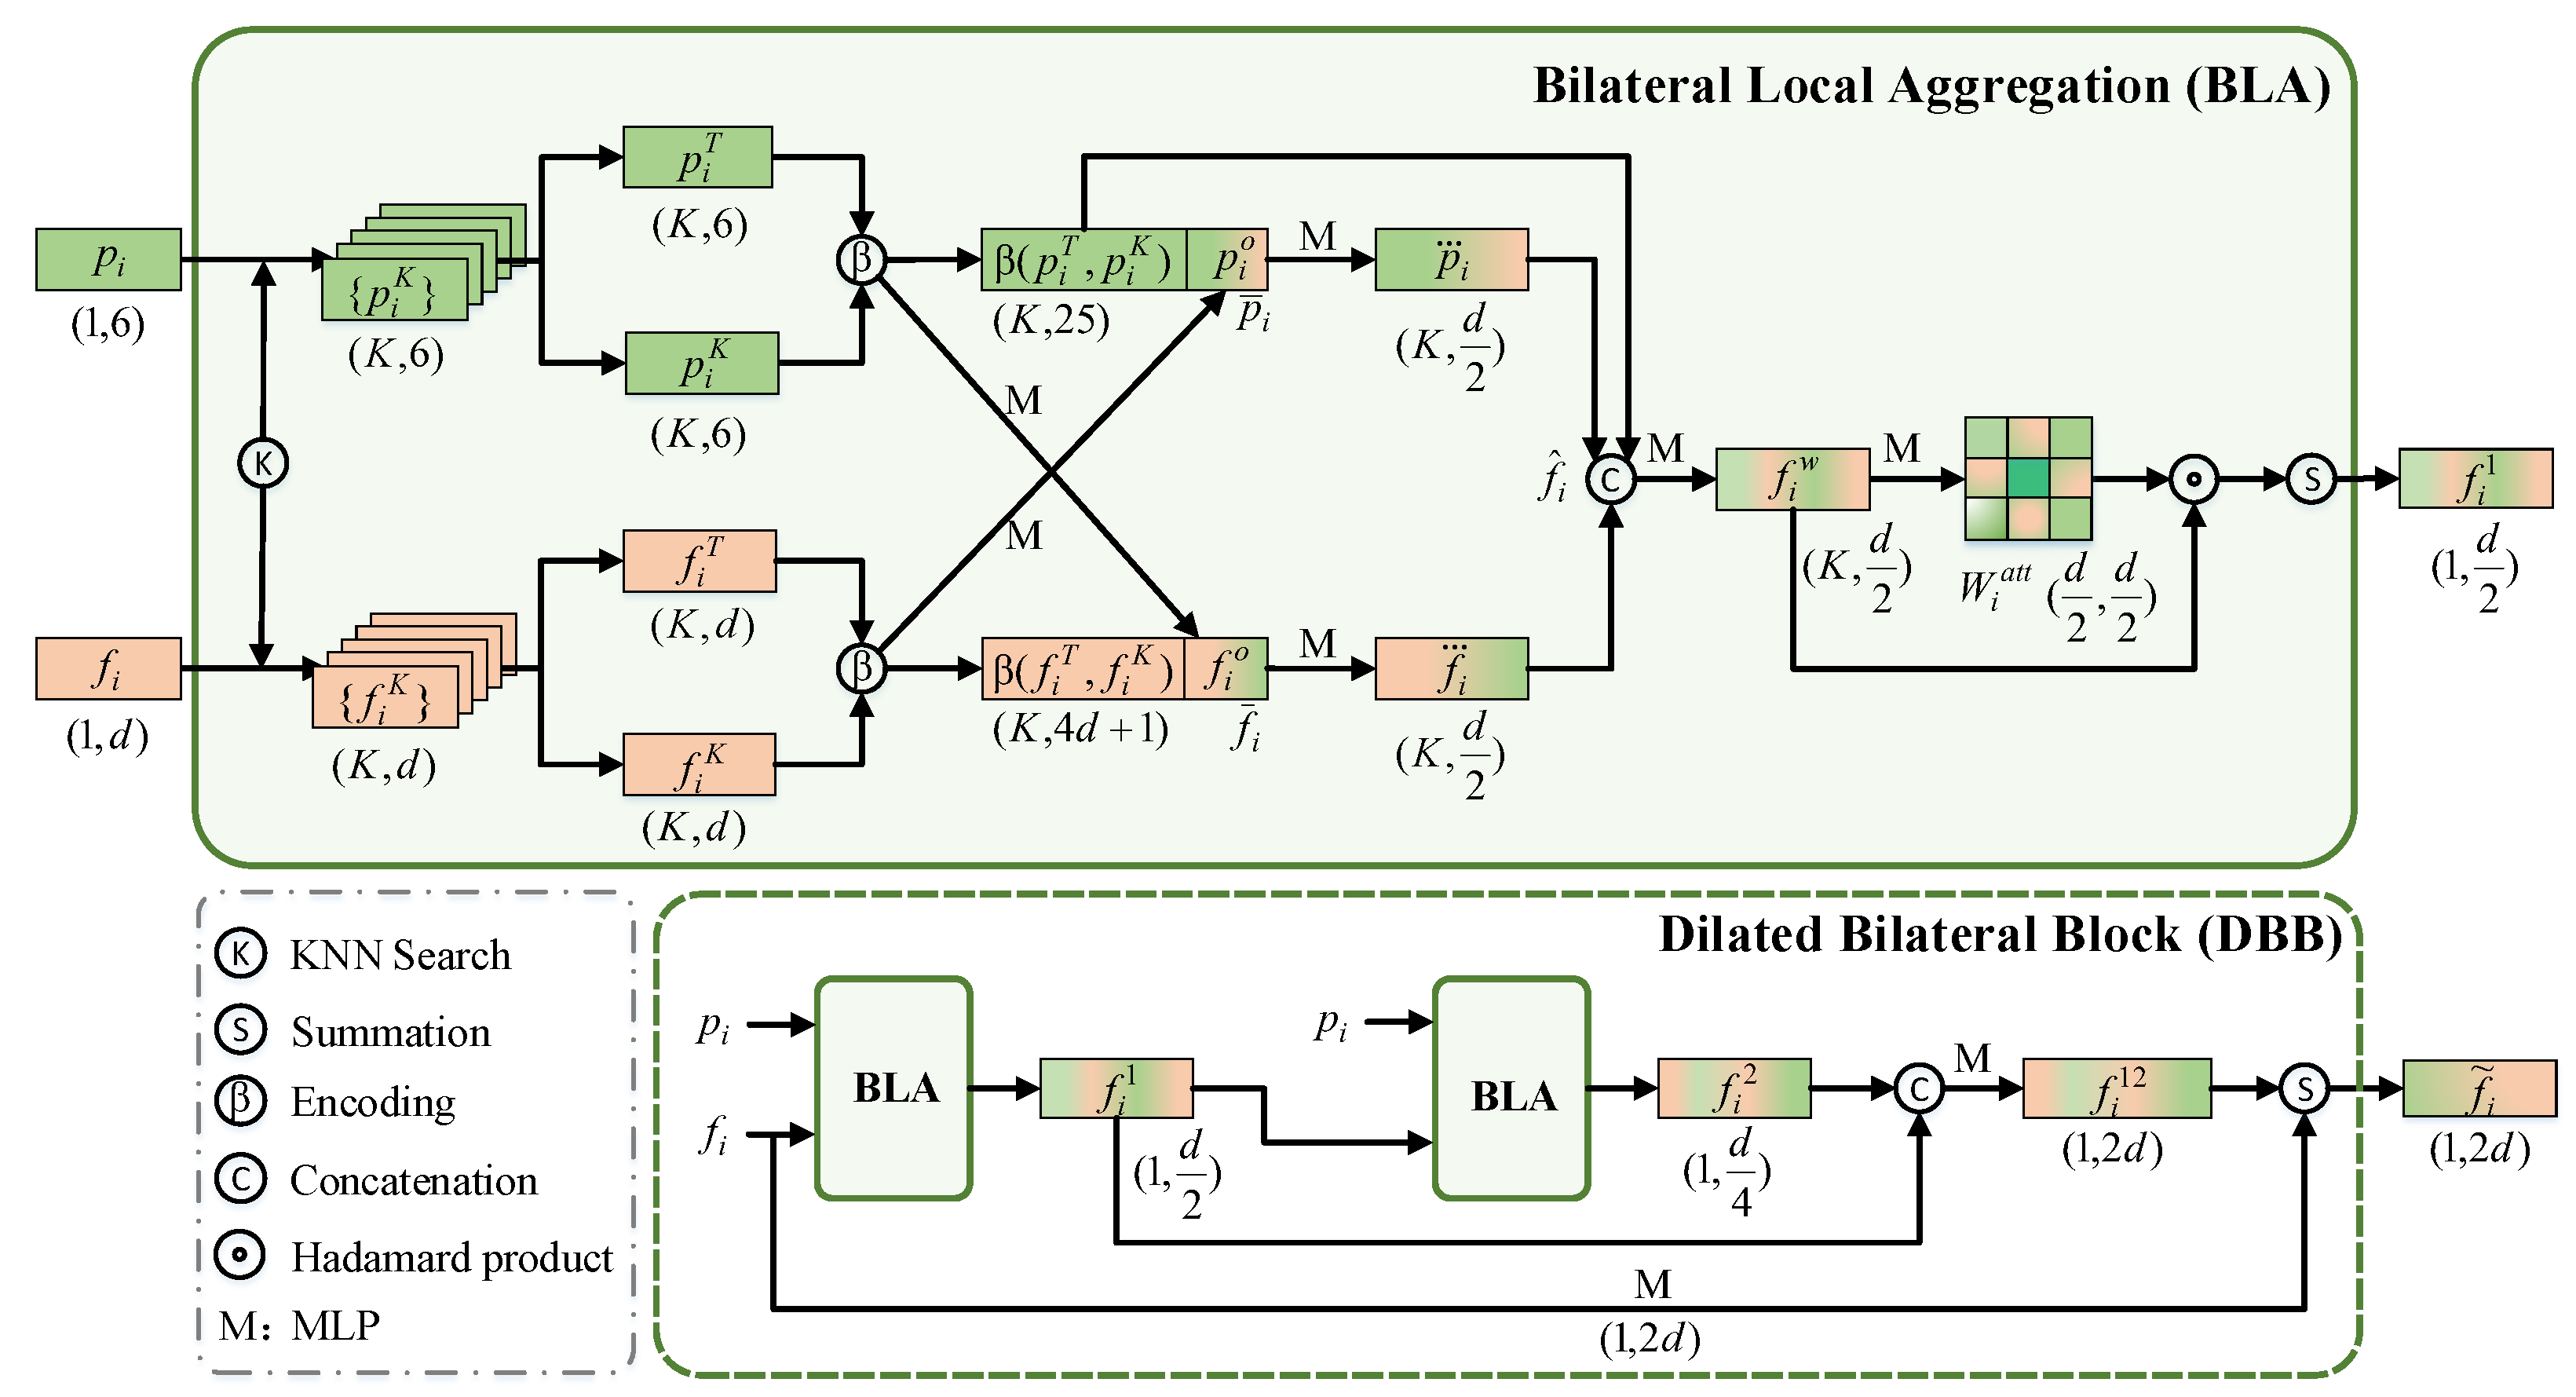
3.1.1. Bilateral Local Aggregation
Given the point cloud and semantic features , as shown in Figure 2, we first perform the K-nearest neighbor (KNN) clustering for each point of the point cloud and its corresponding semantic feature . This allows us to obtain the information of neighboring points and their corresponding features within a certain range of point . Similarly, following the encoding approach of RandLA-Net [27], we employ relative position encoding to and its corresponding semantic feature based on the neighborhood relationships to capture the local geometric relationships around each point, as follows:
where , are implemented for aligning , with the dimension of the neighborhood features. In this case, means expanding the point quantity dimension to K. is the concatenation operation. is a scalar computation operator, which is similar to the Euclidean distance. In particular, we first calculate the sum of the squares of the differences of all components in the feature space, and then its square root is later computed as a measure of distance in the feature space.

Figure 2.
The proposed dilated bilateral block (DBB) with bilateral local aggregation (BLA).
However, the features obtained after relative position encoding may exhibit some ambiguity. This arises because KNN is a simple clustering algorithm, and in cases where there are multiple classes in the boundary region, it usually results in feature inconsistency for points, making it challenging to distinguish between different semantic categories. To address this issue, we update each point’s coordinate-color encoding feature and semantic encoding feature interactively to obtain two offsets and by using a linear layer (e.g., an MLP layer), and their corresponding neighborhood features. These offsets are then concatenated with the previous encoding features to generate , . This prevents features from being confined to a single feature space, mitigating errors and making the feature representation more distinctive and representative, as follows:
As mentioned before, pixel-level segmentation in 2D primarily relies on color information. Therefore, we assume that the primordial coordinates and color information can provide supervisory guidance for point cloud semantic segmentation. To prevent information redundancy caused by the continuous encoding of features, we once again concatenate the relative position encoding features with the bilateral features . This results in a multifaceted feature representation that takes into account geometry, color, semantics, and the primordial information of the point cloud:
Due to the abundance of information contained in multifaceted features , we employ a straightforward attention mechanism to enable the network to automatically select highly representative information while discarding irrelevant features. This results in a more comprehensive and highly representative bilateral local aggregation enhanced feature :
where is the softmax activation function and ∘ is the element-wise product. aggregates the features of K points by summation, thereby reducing the quantity dimension to a single point.
3.1.2. Dilated Bilateral Block
As previously noted, our dilated bilateral block (DBB) consists of two BLA modules, and is designed to further expand the neighborhood of features to capture a wider range of semantic information. However, there is a potential risk of losing the original information when expanding the perception region. To avoid this, inspired by ResDLPS-Net [35], we concatenate the outputs of the two blocks and update them through an MLP layer. Next, the input feature is also updated through an MLP layer and then summed with the prior fused output features, finally yielding the encoded feature :
In summary, the DBB module has the capability to learn a more comprehensive feature space in the context of semantic segmentation tasks. This representation not only adjusts and integrates coordinates, colors, and semantic information, but also encapsulates certain geometric structural details. As a result, it yields a comprehensive and distinctive encoded feature that effectively improves the accuracy and stability of semantic segmentation.
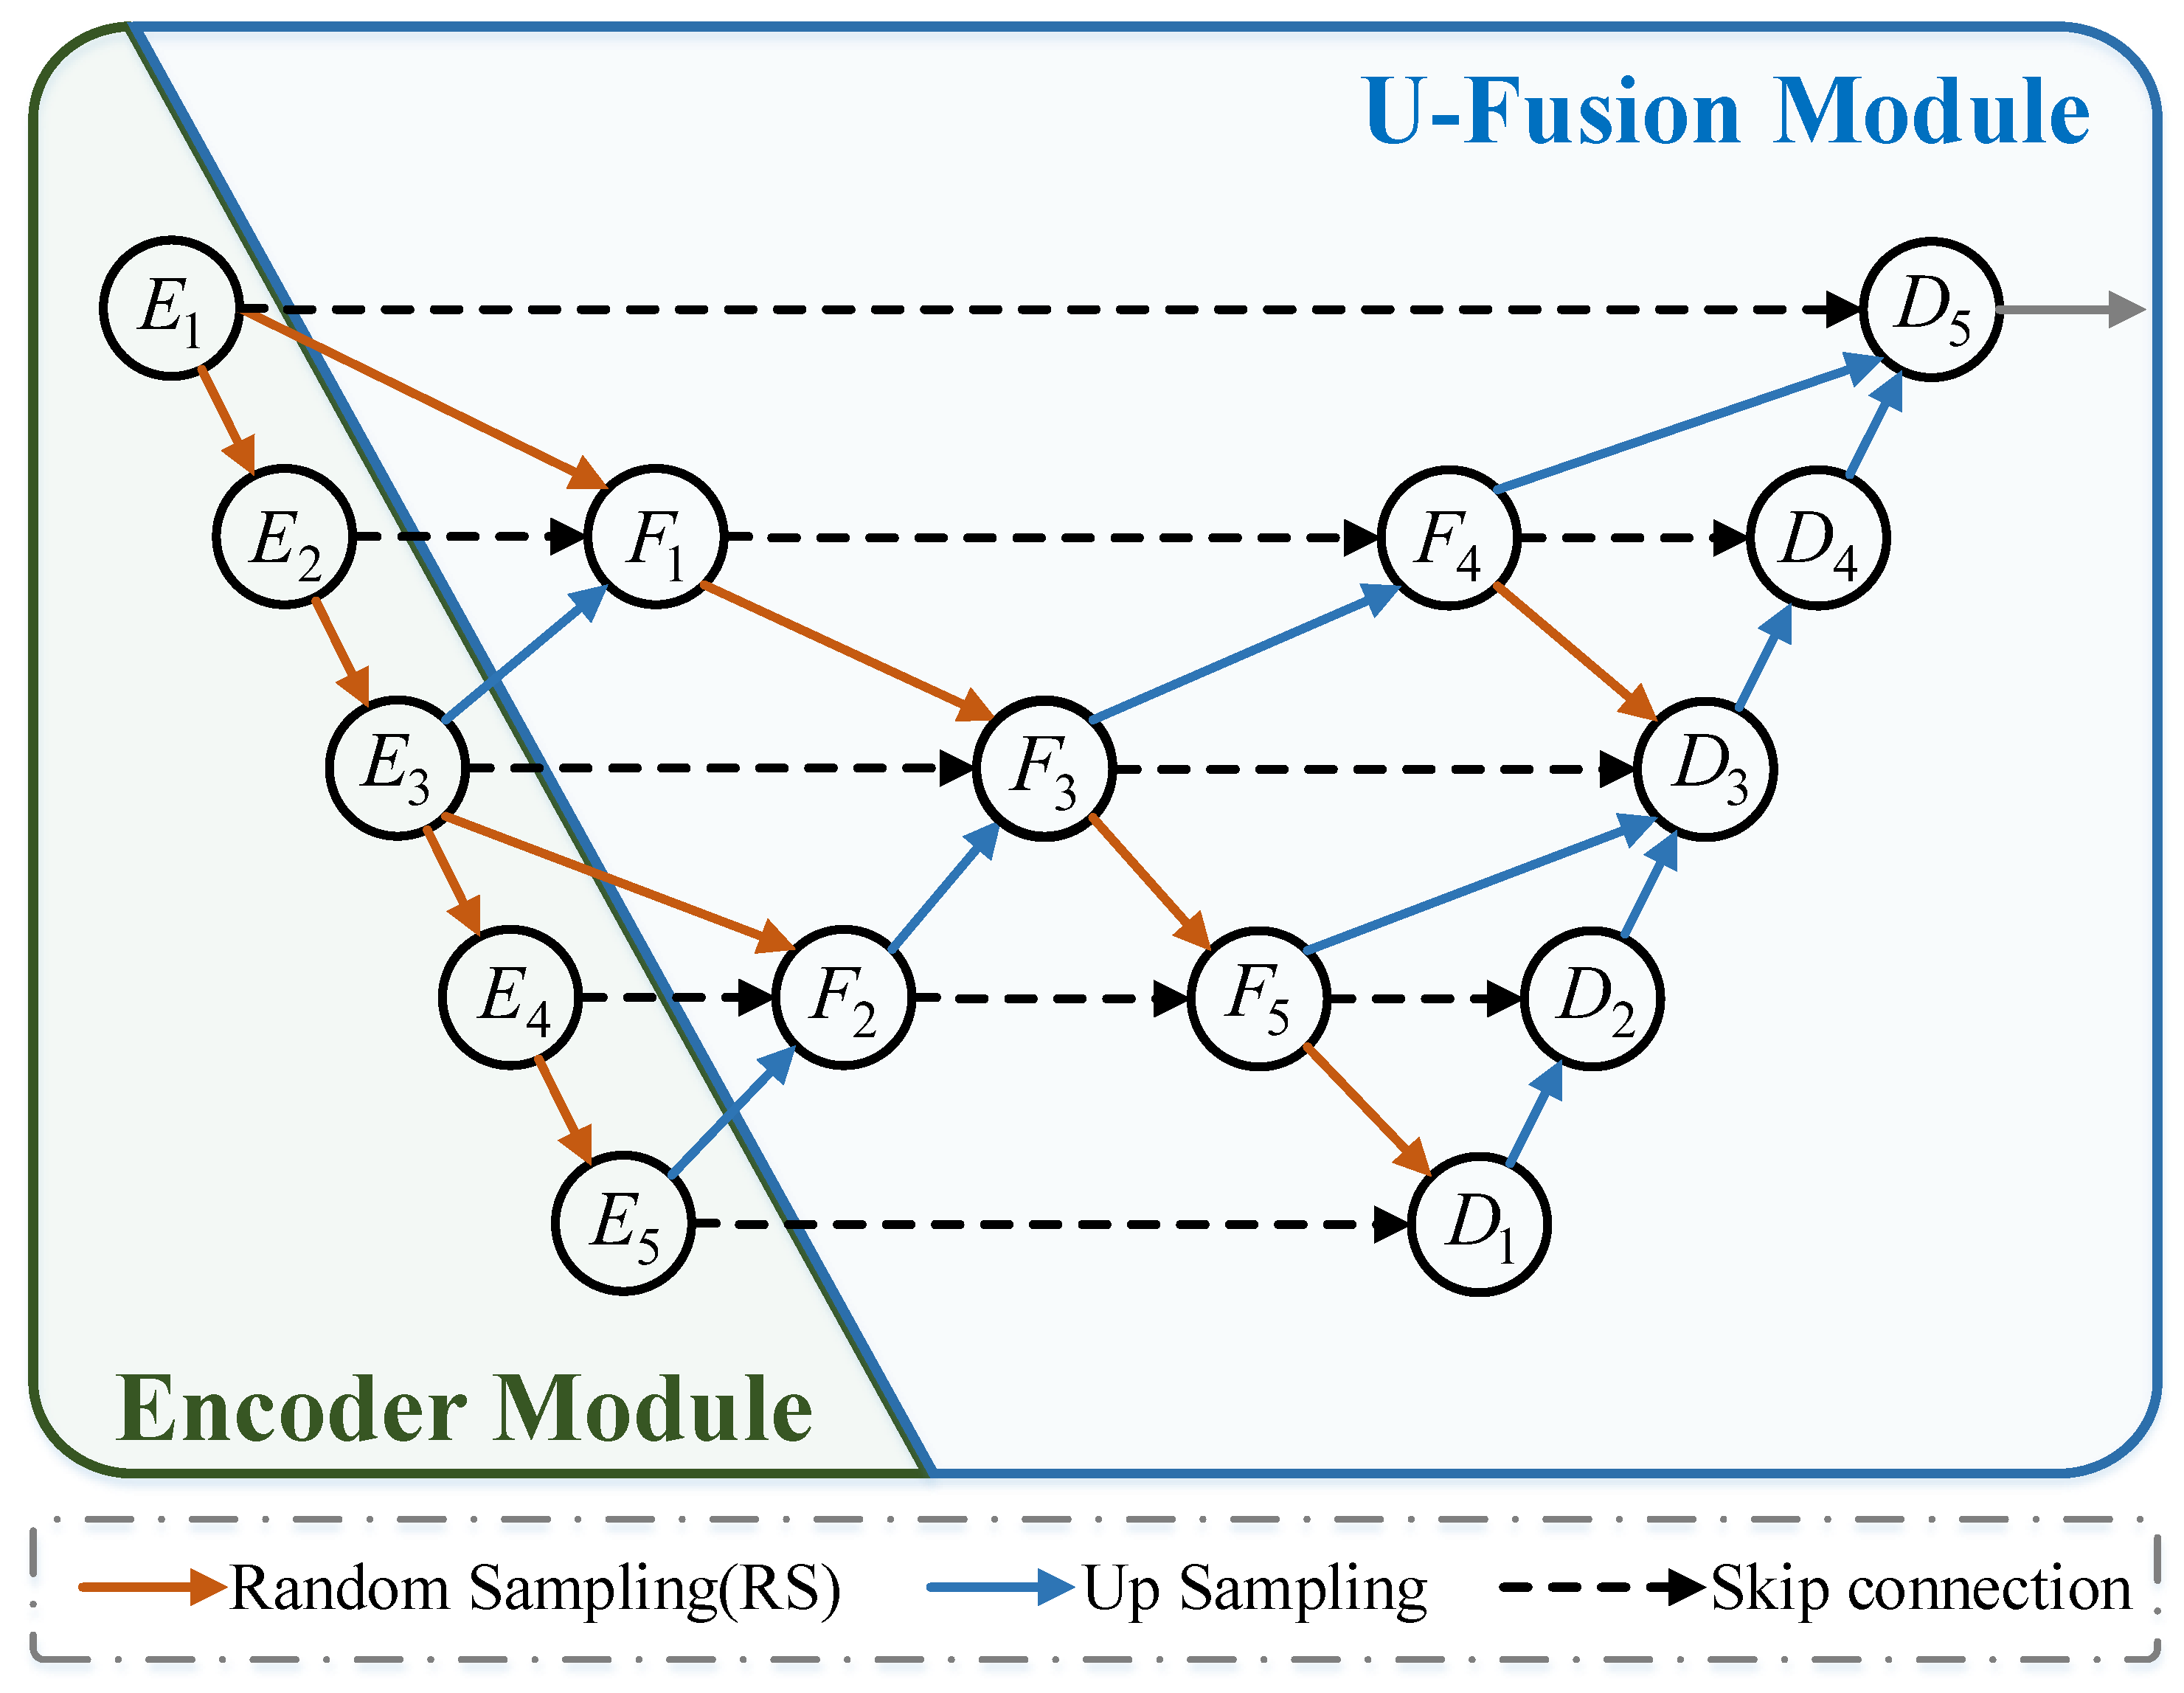
3.2. U-Fusion Module
The traditional U-Net [52] architecture typically consists of three components: encoders, decoders, and skip connections that link the features of each encoder and decoder layer. However, this simple form of skip connection is often inadequate for large-scale semantic segmentation. Considering outdoor urban scenes as an example, they typically contain semantic categories at multi-scales, such as large-scale objects like buildings and roads, and small-scale objects like cars and bicycles. In scene-level semantic segmentation, solely relying on the traditional U-Net architecture lacks the capability for feature interactions between different scales. Consequently, during the encoding process, it always results in an enlarged receptive field while losing a considerable amount of local and fine-grained details.
To address the aforementioned problems, we propose the U-Fusion module. This module innovatively combines encoding features from different layers, with a central focus on identifying the anchor layer (or intermediate layer). It integrates feature information from the local layer, global layer (adjacent upper and lower layer relative to the anchor layer), and the current anchor layer. This integration enables the anchor layer to access feature information from multi-scale receptive fields. Additionally, note that the dimensions for features at the same layer are the same.
We hope that the fused information will possess both global and local characteristics, resulting in comprehensive and extensive fused features. In this study, we selected the second and fourth layers, which are relatively intermediate, as anchor layers to obtain the fused features and , as illustrated in Figure 3. After the initial fusion, to further enhance and deepen the fused features, we once again fuse , with the features from the third layer of the encoder. This final fusion yields the fused encoder features , encompassing information from all scales, as follows:
where is random sampling, which is used to downsample the point cloud to a given size, thereby sparsifying the point cloud. represents interpolation sampling, which is used to upsample the point cloud to a specified quantity, primarily to restore the resolution of the point cloud. denotes a convolution operation.

Figure 3.
The illustration of our U-Fusion module.
Similarly, in the decoding stage, we split the previously generated fusion encoder features in an order that is symmetrical to the previous fusion process and concatenate them with the corresponding decoder layers. This ensures that each decoder layer can access scale-specific feature information, preventing performance degradation due to information loss during the encoding process.
For each decoder layer, we first apply or to align the resolution of points in the concatenated features and then use a transformation layer to reduce the feature dimension as follows:
where is the transpose convolution operation.
In summary, after feature compensation through the U-Fusion module, each decoder layer no longer solely relies on the feature information from its same-scale layer, in contrast to the traditional U-Net architecture. By fusing and compensating for multi-scale features, the final decoder features have robust scale-awareness. They can effectively recognize global semantic feature information while preserving fine-grained geometric details at a more local scale. With the help of these decoder features, the accuracy and robustness of our network during semantic segmentation tasks is significantly improved.
4. Experiments
In this section, we demonstrate the effectiveness of the proposed BEMF-Net through various benchmark datasets. First, we introduce the evaluation metrics used in the experiments, as well as the parameter settings and hardware configurations. Next, we provide a brief description of each dataset to aid in understanding their properties. Finally, we show the performance of BEMF-Net on different datasets, comparing it with state-of-the-art networks. We also present ablation studies on different modules to demonstrate the contribution of each individual module.
4.1. Experiment Settings
For each dataset, we used the coordinates and color information of points as inputs. The datasets mainly consist of two types of large-scale scene point cloud datasets: outdoor and indoor. Comprehensive experiments were conducted on both types of datasets; detailed quantitative results and qualitative visualization prove the generalization capability of BEMF-Net.
Evaluation Metrics. For all experiment datasets, we employed the same evaluation metrics: overall accuracy (OA), intersection over union (IoU), and mean intersection over union (mIoU):
where is the true positive case, is the true negative case, is the false positive case, and is the false negative case.
Loss function. Like most point cloud segmentation tasks, we chose weighted cross-entropy as the loss function for all experiments, as follows:
where , and are the ground truth and predicted class labels, respectively, is the ratio of the number of point clouds about category to the overall point cloud.
Configuration setting. For the parameter settings, we followed the configuration of RandLA-Net [27]. The number of neighbors for the K-nearest neighbor (KNN) search was set to 16, and the size and stride of the convolution kernel were both [1, 1]. The initial learning rate was 0.01, with a decrease every epoch, for a total of 100 epochs. All experiments were run on an Ubuntu system, using a single NVIDIA RTX 3090 GPU for training and inference, and the architecture implemented in the experiments was the TensorFlow framework.
4.2. Dataset Description
The SensatUrban [53] is a large-scale urban scene point cloud dataset constructed using UAV-based photogrammetry. The dataset was collected across several cities in the UK, covering approximately 7.6 square kilometers of scenes and containing over 3 billion points with semantic annotations. The entire point cloud is manually classified into thirteen object classes, including ground, vegetation, buildings, walls, bridges, parking lots, cars, bicycles, etc., covering most of the semantic categories commonly encountered in real-world urban areas. The multi-scale characteristics of the dataset serve to validate the robustness and effectiveness of the network. The entire point cloud dataset was divided into 34 tiles for training and testing purposes, and we followed the official partitioning method to ensure fair comparisons.
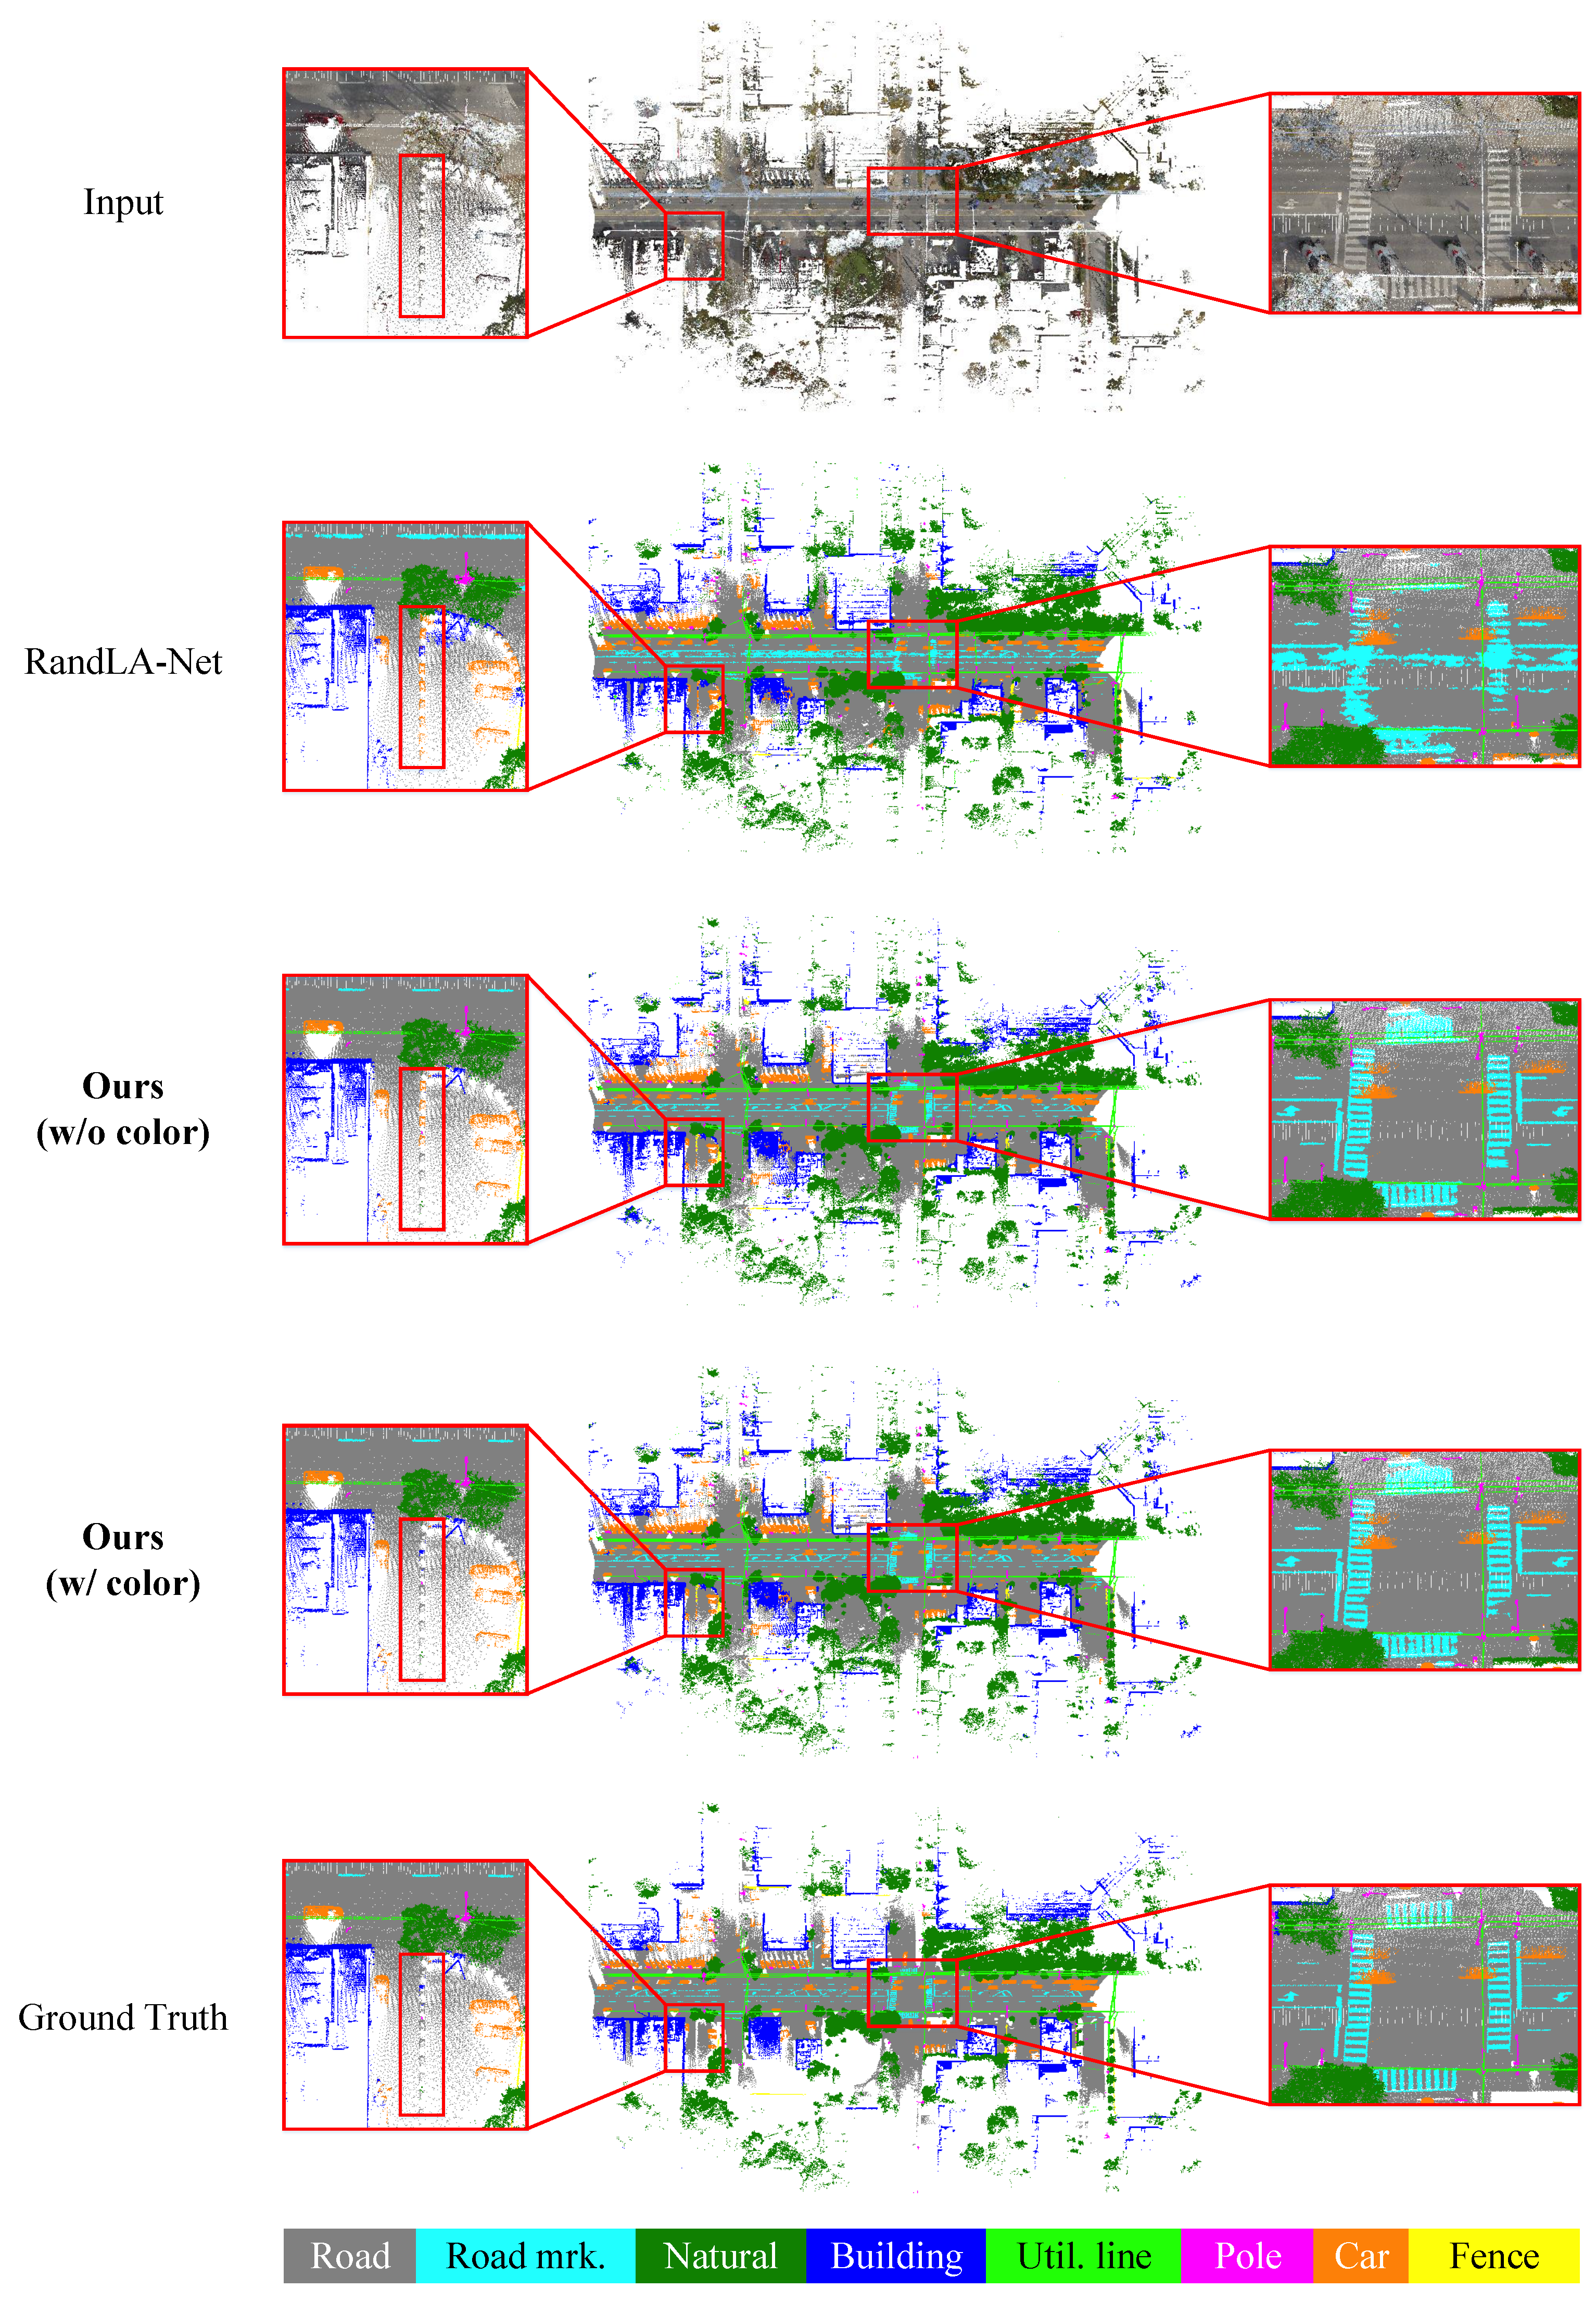
The Toronto3D [54] was, as its name suggests, collected on a street in Toronto, Canada. It comprises approximately 78.3 million points annotated in eight semantic categories: roads, road markings, nature, buildings, utility lines, poles, cars, and fences. This dataset was acquired using a vehicle-mounted LiDAR system and is considered a standard city street scene dataset. The dataset was divided into four blocks: L001, L002, L003, and L004. Following the official partitioning method, we used L002 as the test set, while the rest were used as the training set. The ratio of the number of points of the test set to that of the training set is approximately 1:7.
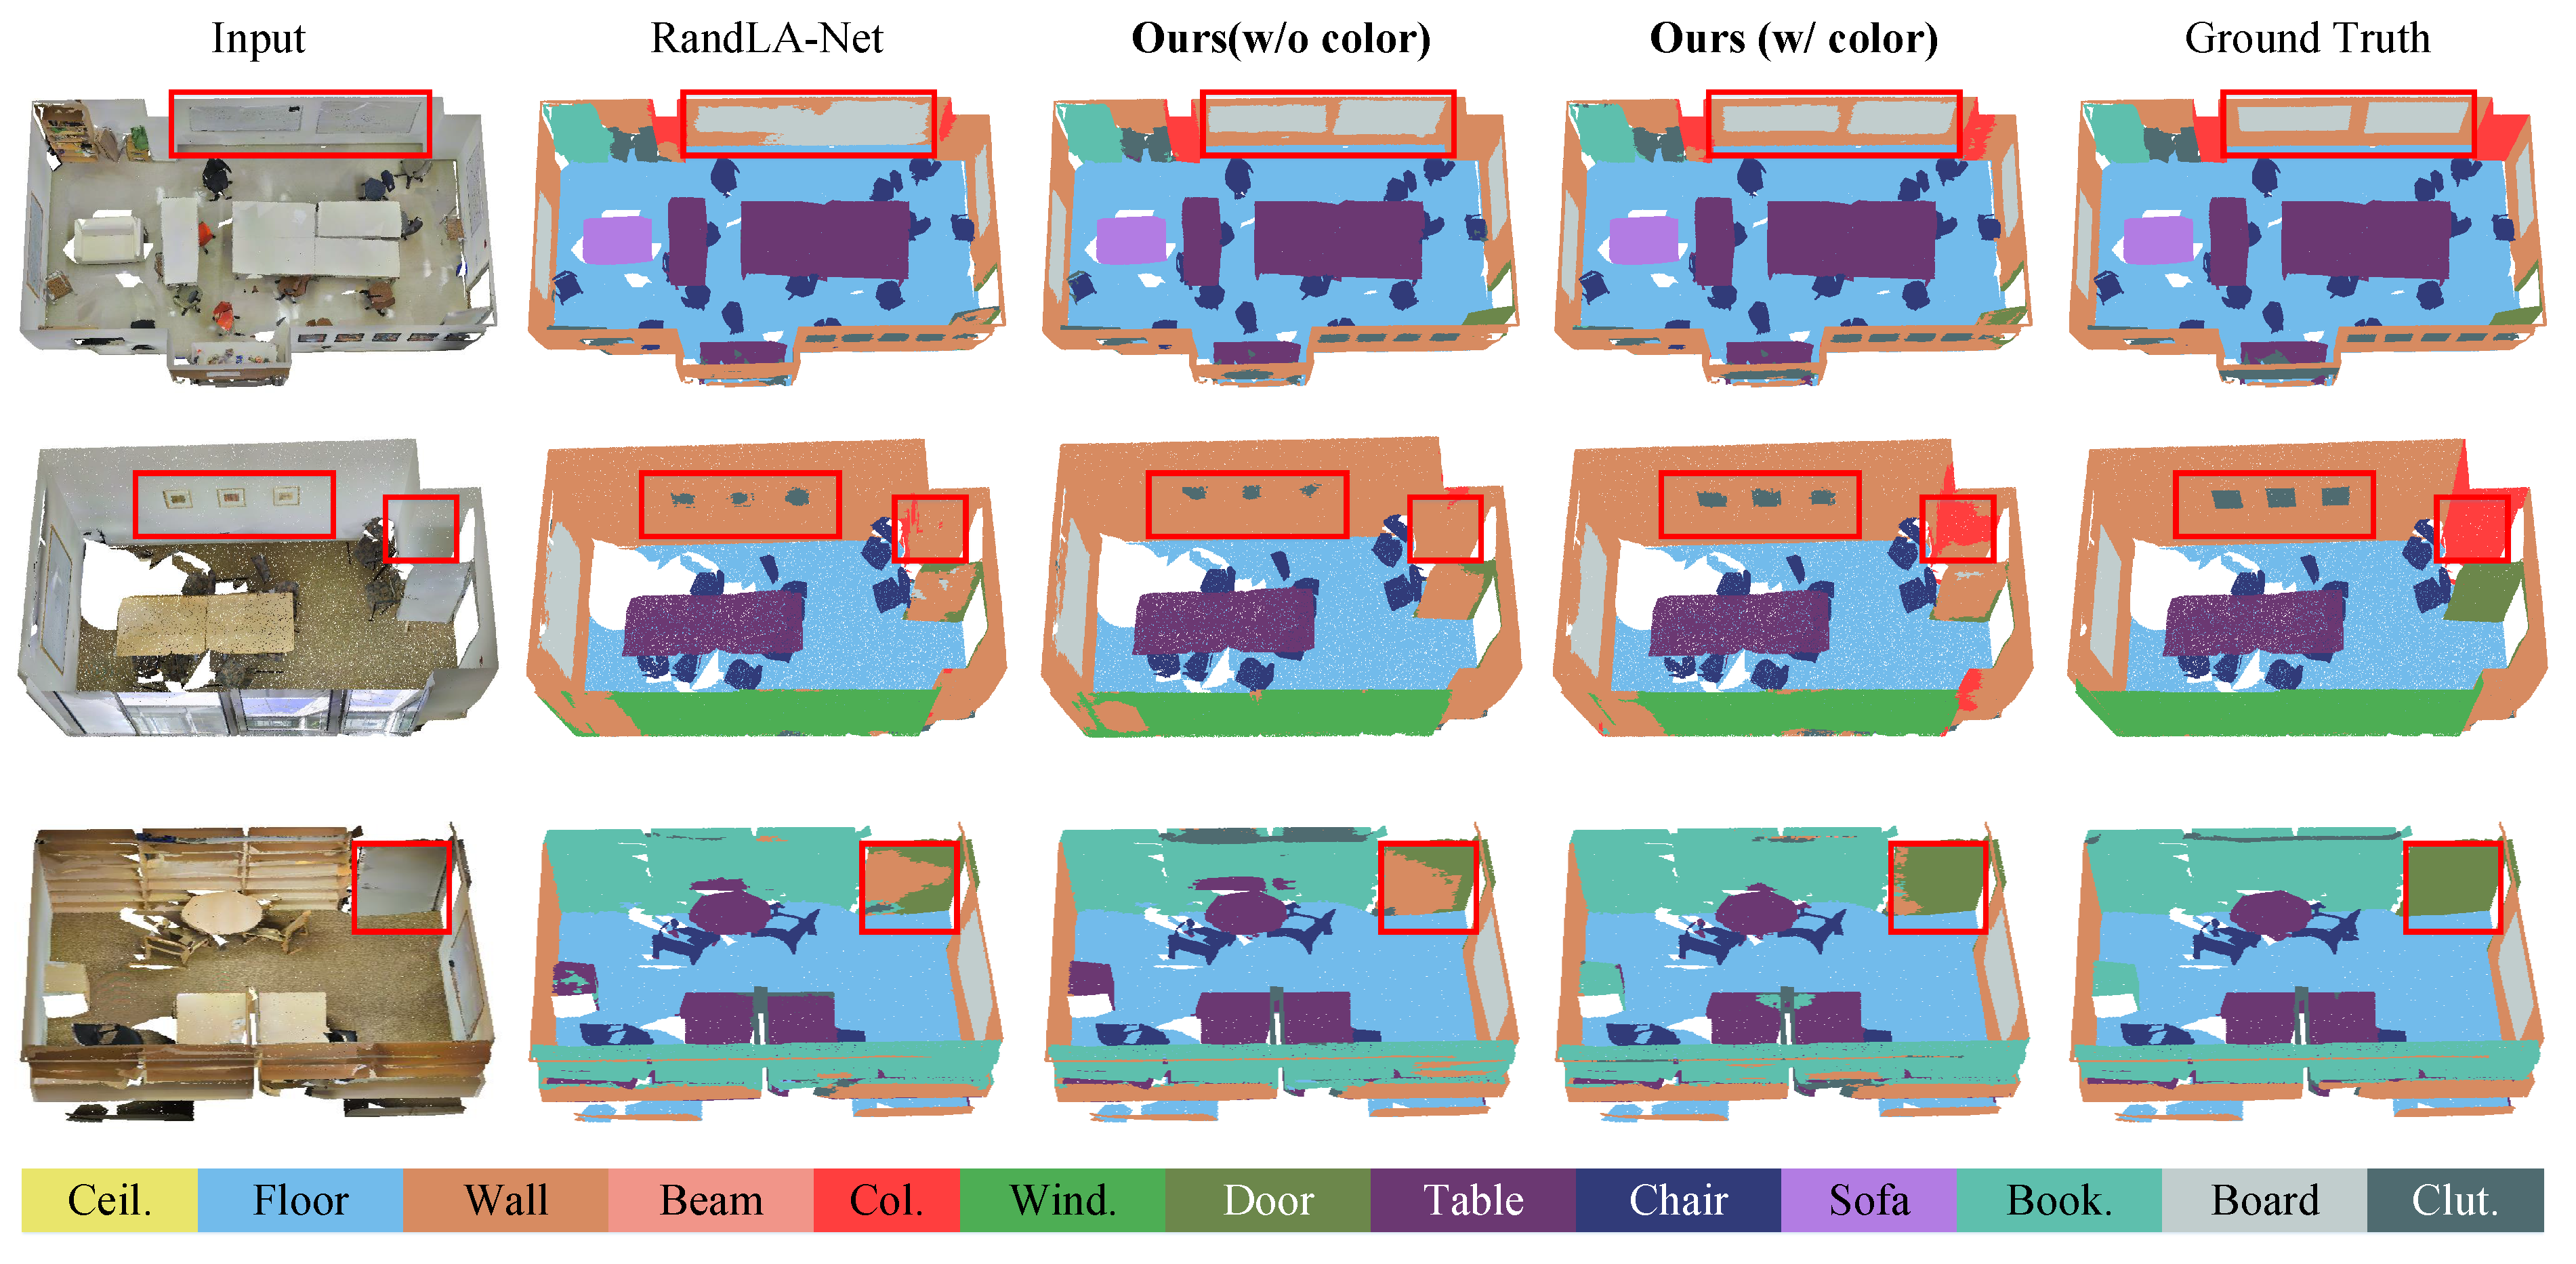
The Stanford Large-Scale 3D Indoor Spaces (S3DIS) [38] is one of the prominent indoor datasets, captured using Matterport scanners. The dataset is divided into 6 areas, covering a total area of 6000 square meters, including 272 rooms. It consists mainly of thirteen common indoor object categories: ceilings, floors, walls, beams, columns, windows, doors, tables, chairs, sofas, bookshelves, and clutter. In this study, we chose Area 5 as the test set, while Areas 1–4 and 6 served as the training set to assess the generalization ability of our network in indoor scenes.
4.3. Experiment Result and Analysis
In this section, we elaborate on the experimental results of BEMF-Net on three datasets: SensatUrban, Toronto3D, and S3DIS. The segmentation accuracy for each single class in the datasets is fully compared and illustrated. Overall, the extensive experiments were sufficient to demonstrate the effectiveness and robustness of our proposed method for the task of semantic segmentation of a large-scale point cloud.
4.3.1. Evaluation on SensatUrban
Table 1 quantitatively demonstrates the leading position of our method on SensatUrban and establishes a new state-of-the-art (SoTA). To elucidate the impact of the different input information on the network and to demonstrate fairness in subsequent comparisons, we present our numerical results for two different types of input. The first type only uses the spatial coordinates of the points as input (w/o color), while the second type uses both the coordinates and colors of the points as input information (w/ color). Our method (w/ color) outperforms the baseline RandLA-Net [27] with an improvement of and in terms of OA and mIOU, respectively. Particularly noteworthy is its outstanding performance in categories such as railways and footpaths, highlighting the significant improvement of our method in detecting small-scale objects compared to most existing approaches. In addition, our method (w/o color) still achieves great performances on SensatUrban. With a advantage over the previous state-of-the-art method NeiEA-Net in terms of mIoU, our approach achieved higher accuracy on individual categories such as bridges, parking lots, and bicycles. Analyzed from the perspective of feature information, these categories of objects tend to rely more on positional information for classification, with color information potentially leading to misleading results. However, regardless of whether color information is used as input, the excellent comparative results demonstrate the superiority of our network. Overall, for urban scenes like SensatUrban, incorporating color information remains a favorable choice.

Table 1.
Quantitative comparison results on SensatUrban (%). The best results are presented in bold, and the second-best results are underlined.
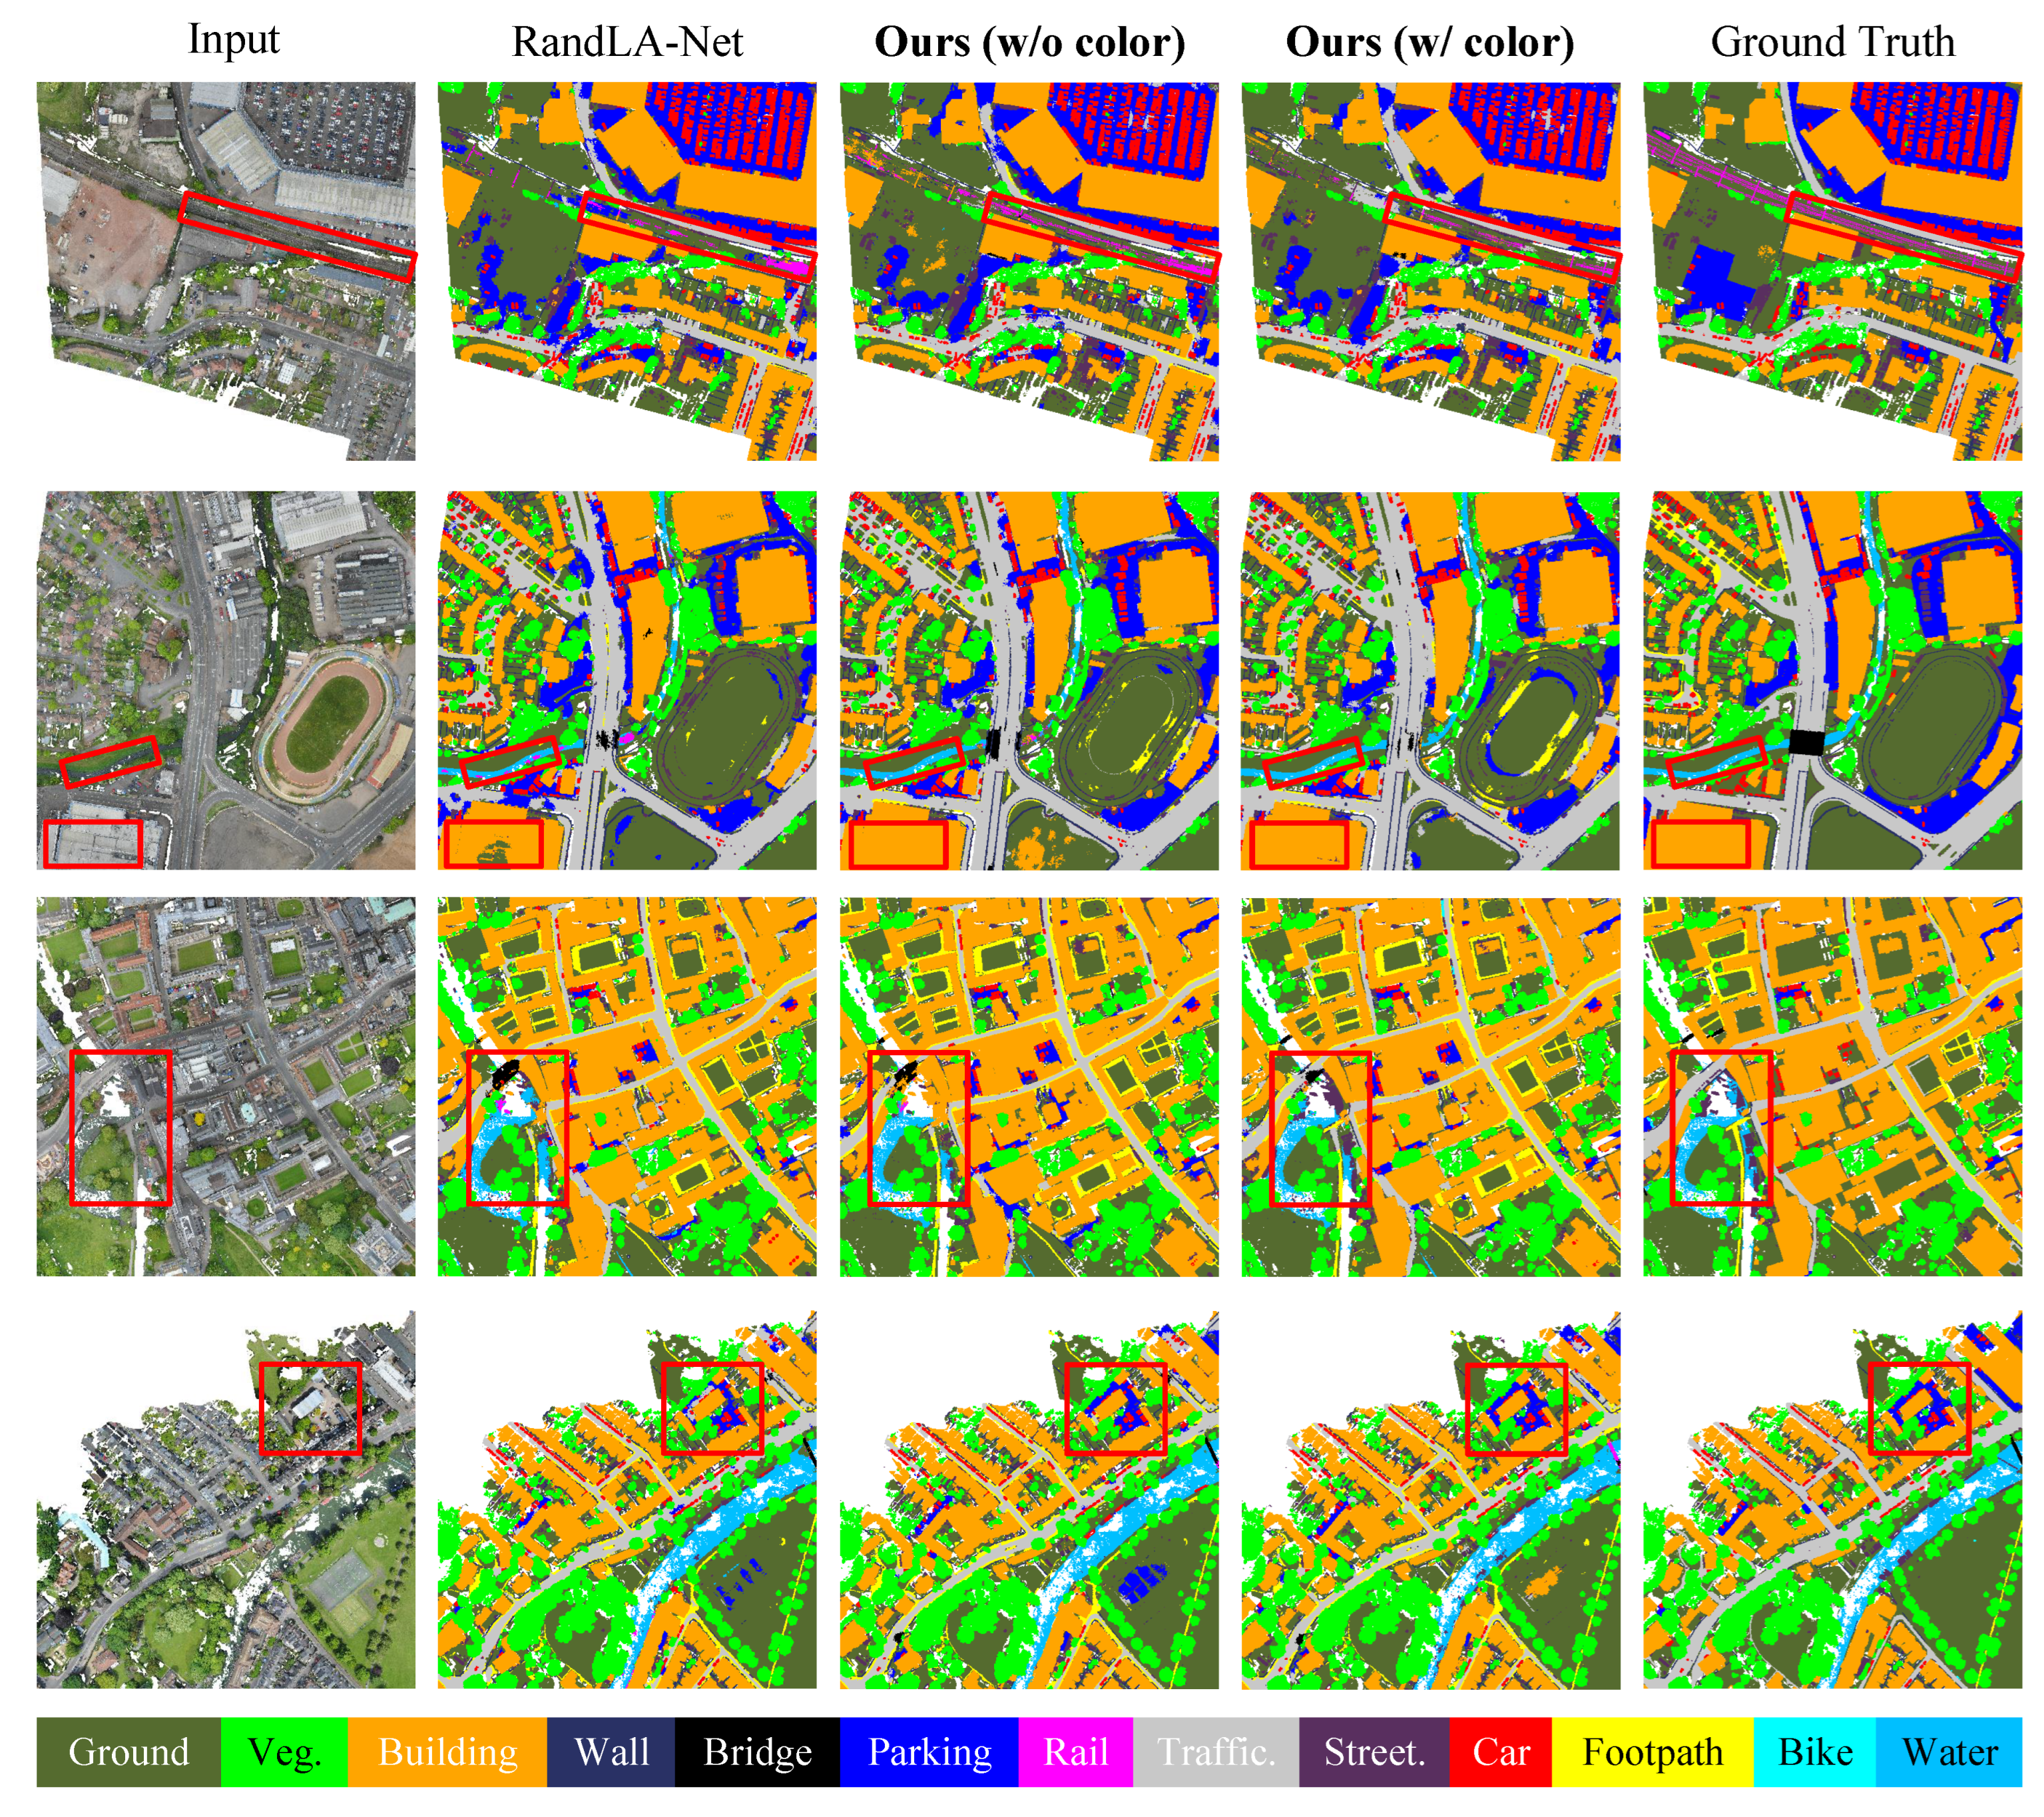
The visualizations in Figure 4 further illustrate the excellent improvements of BEMF-Net in segmenting large-scale objects such as buildings and parking lots compared to the baseline RandLA-Net. Moreover, our method exhibits a strong recognition capability for small-scale objects such as cargo on rivers and railways. This clearly demonstrates the ability of our method to perceive multi-scale objects in large scenes and the robustness of its segmentation task.

Figure 4.
Visual comparison of RandLA-Net and our method on SensatUrban.
4.3.2. Evaluation on Toronto3D
To validate the effectiveness of BEMF-Net in city street scenes, we conducted experiments on Toronto3D. Similarly, we provide the experimental results for two models (w/o and w/ color) to ensure the fairness and persuasiveness of the experiments. As shown in Table 2, our method retains a competitive advantage over most existing approaches, achieving an improvement of in OA over the baseline. For individual categories, we achieve the highest segmentation accuracy in the nature and car categories, demonstrating the success of our method in this respect. When analyzing our two models, we find that the use of color leads to improved accuracy compared to solely relying on coordinates. For instance, notable improvements are observed in the segmentation of poles and cars. This suggests that Toronto3D is effective in the overall and individual segmentation results upon the inclusion of color information. In contrast to the SensatUrban dataset, where the addition of color information led to a significant decline in accuracy for certain individual classes, this suggests that the effectiveness of incorporating color information varies across different datasets. This, in turn, prompts our consideration for future work on how to better leverage color information.
Table 2.
Quantitative comparison results on Toronto3D (%). The best results are presented in bold, and the second-best results are underlined.
Qualitative visualizations in Figure 5 highlight the excellent performance of our approach. In particular, there is a noticeable improvement in the delineation of road contours, even in scenarios with multiple overlapping objects in close proximity, indicating the effectiveness of BEMF-Net in scenarios where traditional single-space feature encoding may introduce ambiguities.

Figure 5.
Visual comparison of RandLA-Net and our method on Toronto3D.
4.3.3. Evaluation on S3DIS
Initially, our network modules were designed for outdoor scenes, but we believe that BEMF-Net also possesses some degree of generalization for indoor environments. Therefore, we conducted validation experiments on the mainstream indoor segmentation dataset, S3DIS. As mentioned earlier in the methodology, indoor scenes often contain objects that are spatially very close, making it difficult to distinguish them using only spatial coordinates. Therefore, we used color information as a complement and constructed a bilateral feature space.
Table 3 demonstrates our comparative results, creating a new SoTA compared to current point-based algorithms. From the comparisons, it is evident that both of our proposed models have shown improvements in the overall evaluation metrics such as OA and mIoU, thus confirming our initial hypotheses. When comparing the segmentation accuracy of individual objects, a notable improvement is observed in most categories, indicating the effectiveness of color in the context of S3DIS and similar indoor scenes. The additional provision of color information in densely distributed objects can efficiently enhance the discriminative capabilities of the segmentation network. We also achieved excellent results in the wall, chair, bookshelf, board, and clutter categories.
Table 3.
Quantitative comparison results on S3DIS (Area5) (%). The best results are presented in bold, and the second-best results are underlined.
As shown in Figure 6, where we showcase the segmentation results for several rooms, it can be seen that BEMF-Net performs exceptionally well when there are walls and other objects present on the same surface, such as blackboards on walls or doors near bookshelves. This confirms that, even in indoor environments where object scales do not vary significantly, there are still objects with similar colors and geometries that are challenging in terms of recognition. Thanks to our proposed bilateral encoding approach, our method does not rely solely on a single feature space for semantic representation. The integration of semantic information from multiple feature spaces effectively aids indoor semantic segmentation tasks, improving the segmentation recognition accuracy and robustness across all scenes.

Figure 6.
Visual comparison of RandLA-Net and our method on S3DIS.
4.4. Ablation Studies
To elucidate the individual contribution and effectiveness of each core module we designed, we conducted ablation experiments separately for the bilateral local aggregation (BLA), dilated bilateral block (DBB), and U-Fusion modules. Since SensatUrban requires online submission, and Toronto3D has fewer test blocks, we selected S3DIS as the test dataset for conducting the ablation experiments. The descriptions of different ablation models are given below:
Our baseline model is designed based on RandLA-Net [27], so all ablation experiments are conducted according to the structure of RandLA-Net for combination and comparison.
- : Replace RandLA-Net’s local spatial encoding and attentive pooling modules with our BLA module. This is intended to validate the effectiveness of the proposed encoder and the enhancement provided by the inclusion of multifaceted reinforced features including coordinates, colors, and semantics for the segmentation task.
- : Replace RandLA-Net’s dilated residual block with our proposed DBB. This aims to demonstrate the effectiveness of the multi-receptive field space provided by dense connections for feature representation.
- : Embed the interlayer multi-scale fusion module U-Fusion into RandLA-Net to illustrate the advantages of multi-scale feature fusion over the single-scale feature connections of the traditional U-Net.
- : Remove multi-scale features from the complete network structure to demonstrate the importance of multi-scale information.
- : Remove DBB from the entire network structure to demonstrate the effectiveness of dense connections.
- : Remove BLA from the full network to highlight the effectiveness of bilateral features.
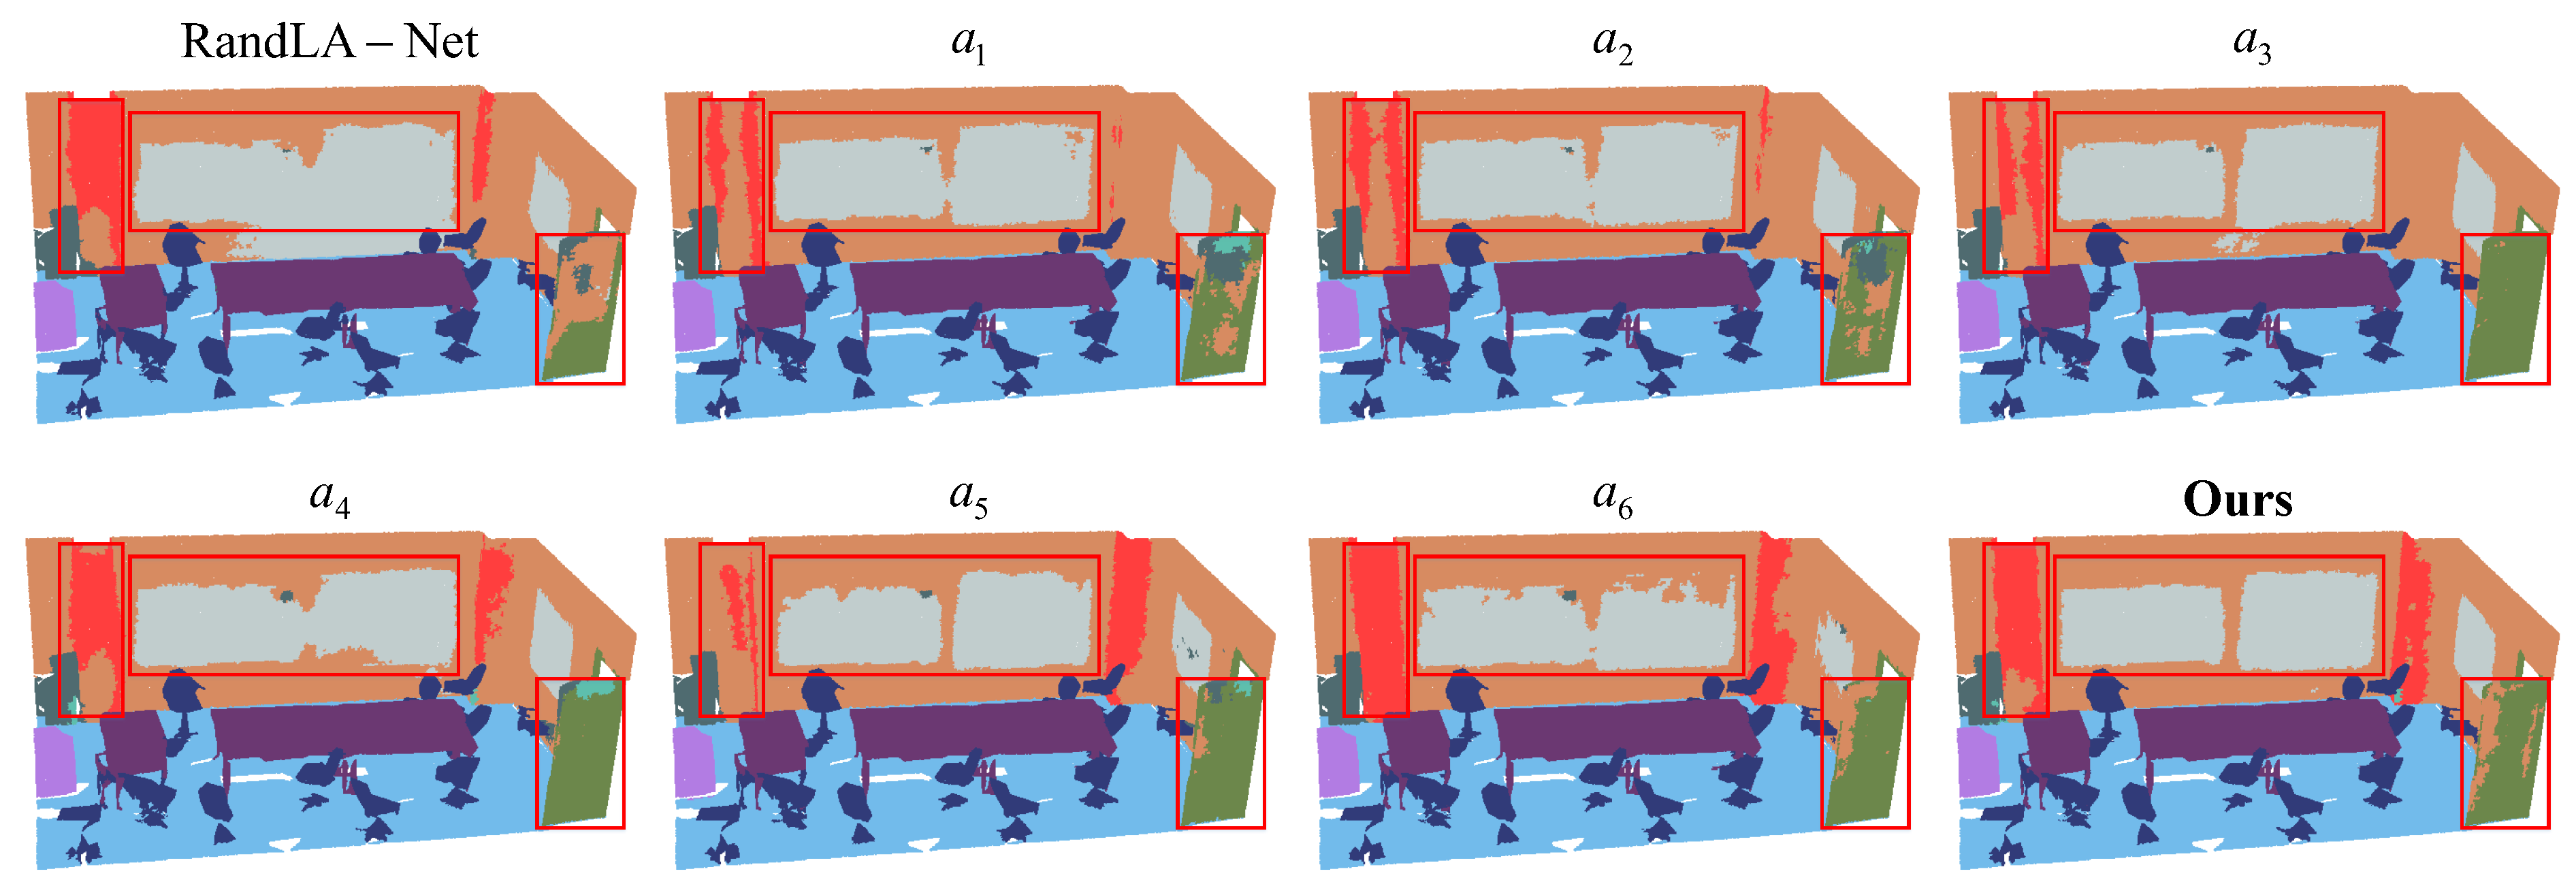
All evaluation metrics are consistent with the experiments. We chose mIoU for the overall performance assessment, and detailed results and visualization are shown in Table 4 and Figure 7. It is evident that our full model achieves the best performance. Analyzed from the perspective of individual module contributions, the numerical results from indicate that the most significant effect comes from our U-Fusion model, leading to an improvement in mIoU of almost compared to the baseline. Additionally, from model , it is evident that the removal of the U-Fusion module significantly decreases the accuracy, highlighting the critical importance of multi-scale feature information for the semantic segmentation of large-scale point clouds. This effectively demonstrates the indispensability of our designed multi-scale feature fusion module, U-Fusion, to the network.
Table 4.
Ablation study of BEMF-Net core modules.

Figure 7.
Visual comparison of different variants on S3DIS.
Moreover, the comparison of segmentation accuracy between , , and with the baseline also reflects the accuracy improvement achieved by our designed encoding module and multi-scale fusion module for the segmentation task. Conversely, , , and elaborate on the roles between the modules, demonstrating the interdependence of our designed modules, which effectively cooperate with each other to improve the effectiveness of semantic segmentation.
In addition, our proposed U-Fusion module effectively addresses the problem of multi-scale perception in large scenes, and can be easily transferred to other networks as a plug-and-play module and applied to various visual tasks.
5. Discussion
5.1. Discussion on Hyperparameter
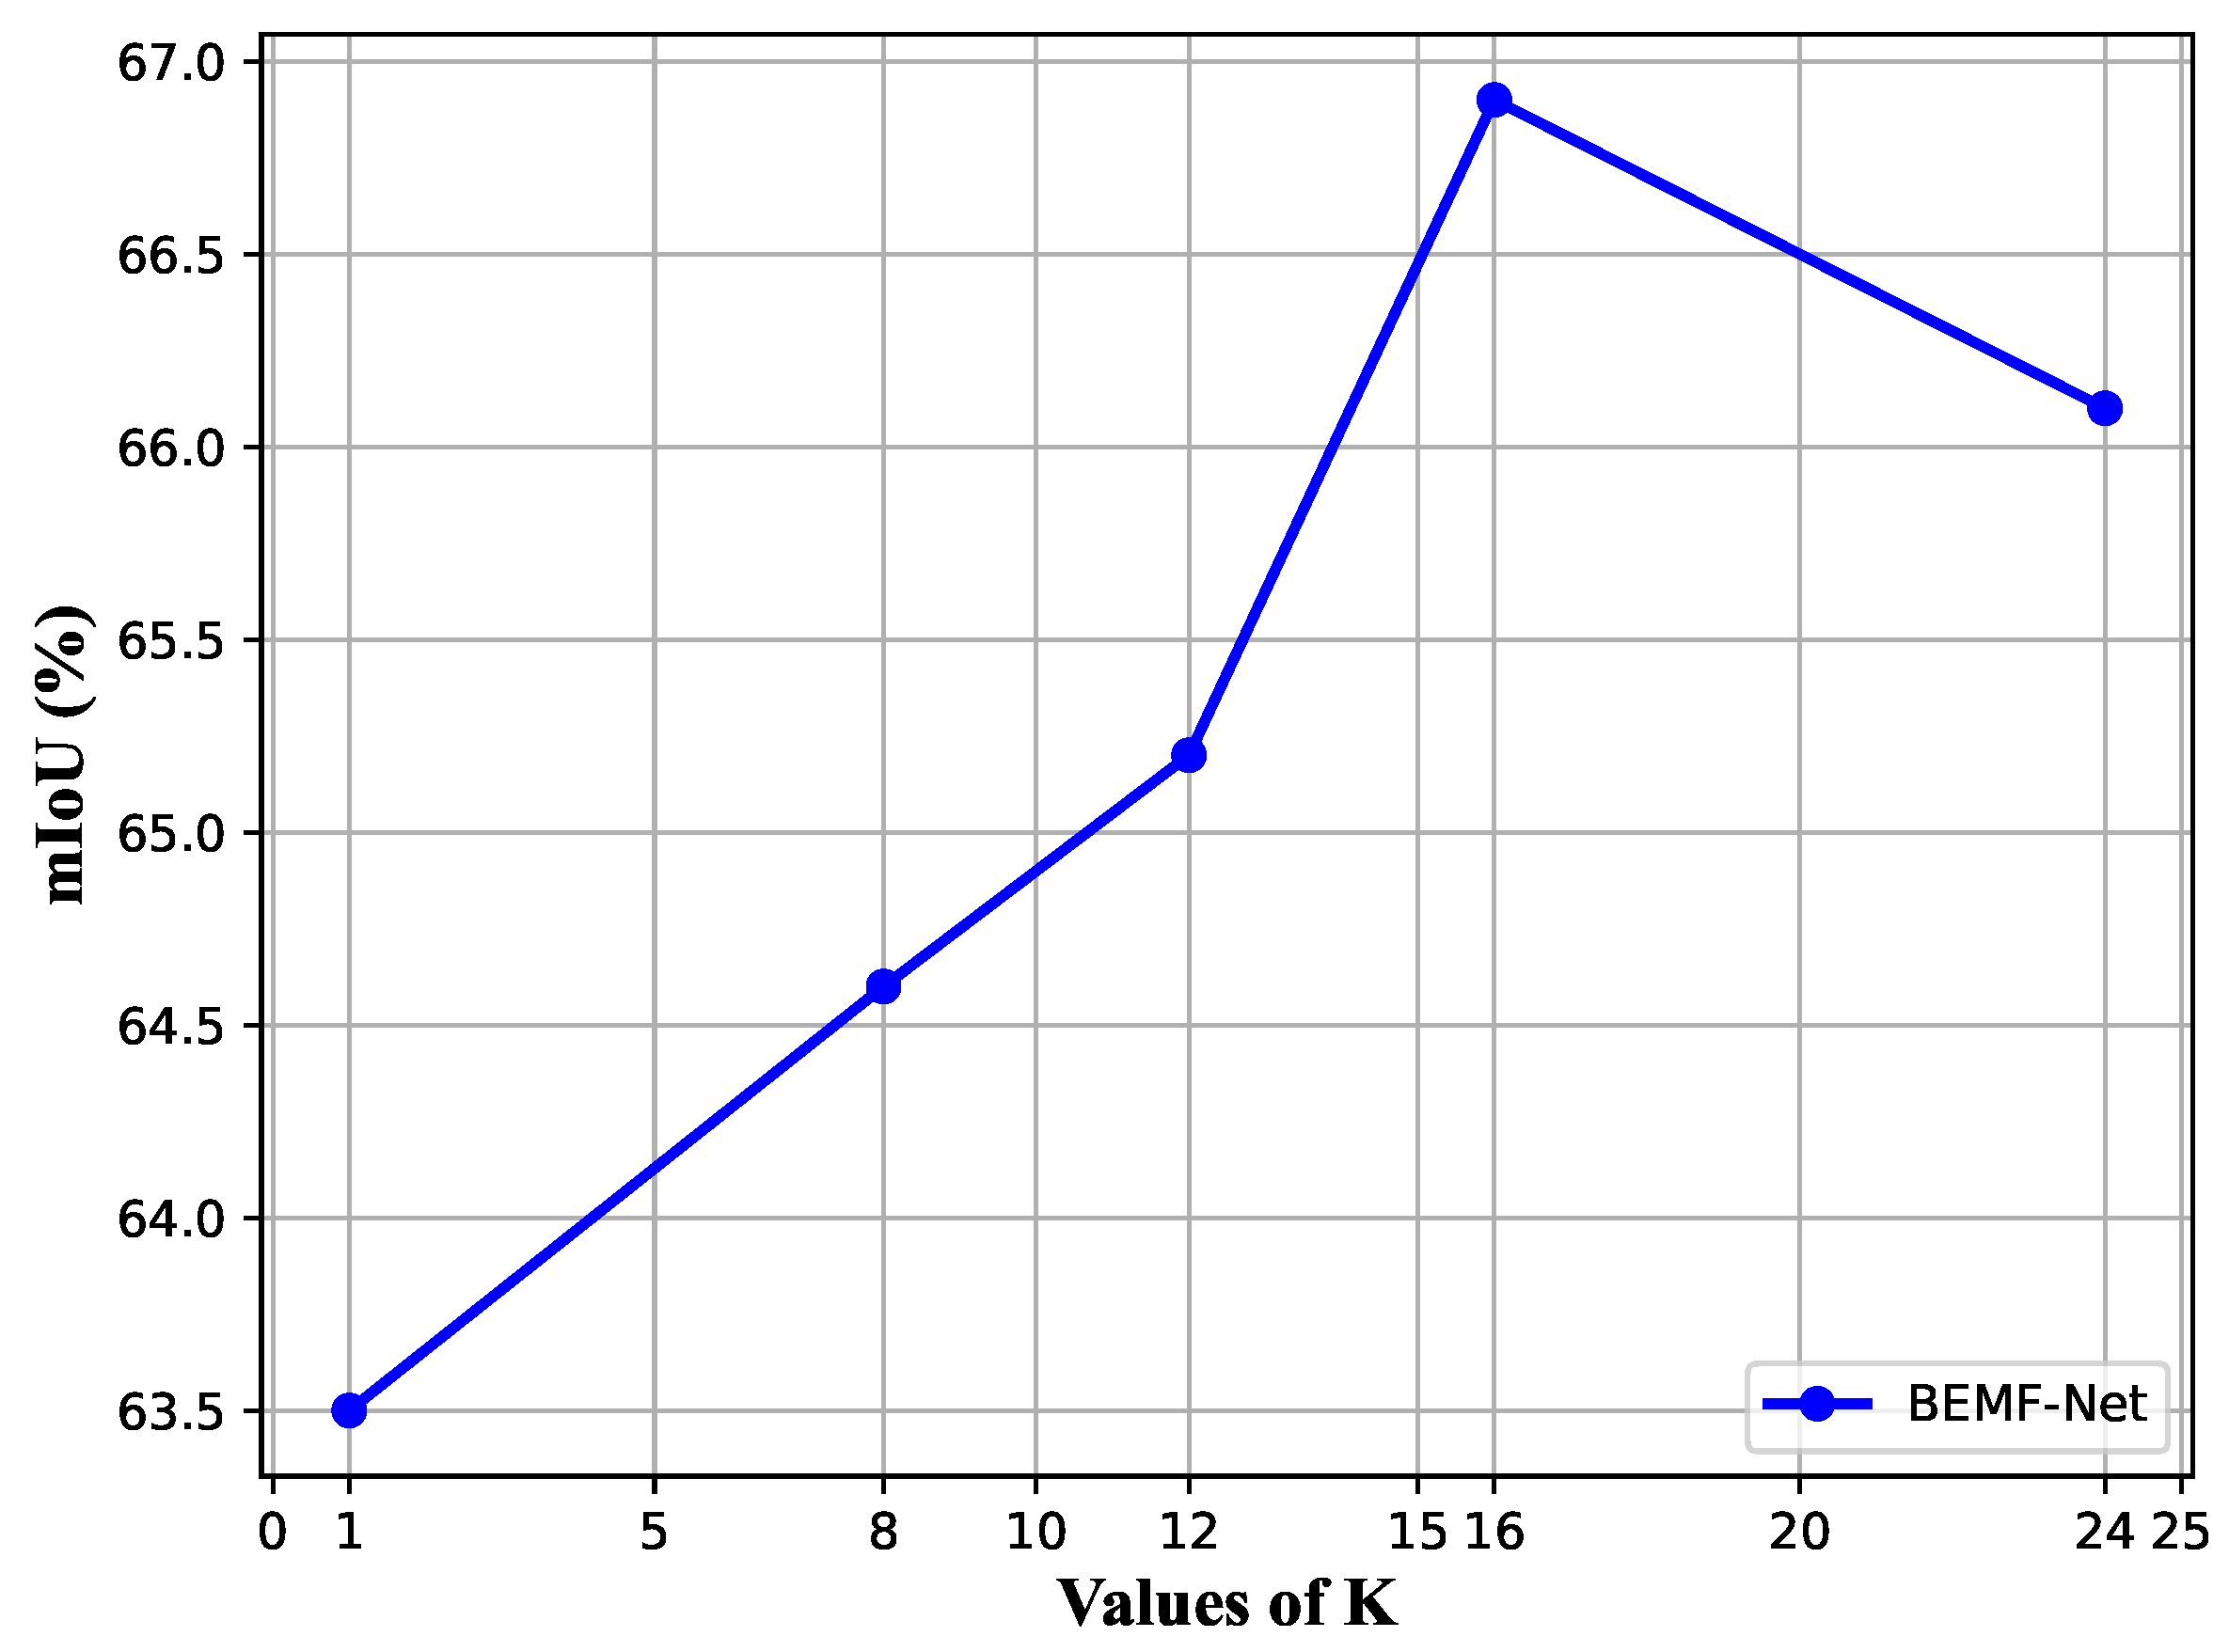
In this section, we primarily analyze the main influencing hyperparameters. Since our neighborhood construction algorithm is implemented through KNN, the choice of the number of neighbors in KNN has a significant impact on the type of neighborhood relationships we construct. We conducted tests with different K values on the S3DIS dataset, and the experimental results are shown in Figure 8.

Figure 8.
mIoU vs. K on validation split of S3DIS.
We further investigated how the variation of K affects the segmentation results and found that the accuracy of segmentation rapidly increases with the increment in K. This is because the expansion of the neighborhood provides a broader range of semantic information and geometric correlations, thus ensuring greater semantic consistency within the local region. However, when K reaches a certain threshold, the performance starts to decline. This is typically due to the possibility of excessive local spatial information causing some information blurring, as previously mentioned, when multiple objects exist within a small space. Additionally, as K increases, the time required for neighborhood construction and feature extraction increases significantly, which is highly undesirable for processing data in large-scale scenes. In other words, it leads to a substantial increase in time and memory consumption, with only minimal improvements in segmentation results.
5.2. Discussion on Loss Function
In this section, we present experiments and discussions on the common weighted cross-entropy (WCE) loss in semantic segmentation. Specifically, we experimented with two different weighting computation methods for WCE; the first one is , which is also the default weighting method of WCE, while the second is , denoted by . is the ratio of the number of point clouds about the category to the total point cloud.
The experimental results for the S3DIS dataset are shown in Table 5. It can be seen that the choice of weighting computation method for either type of loss does not significantly affect the overall performance, but the combination of the two losses () does lead to a slight improvement in accuracy compared to using either method alone. Since most segmentation algorithms currently only employ a single type of loss function for training and evaluation, for the sake of fairness, we used only , which is also used in RandLA-Net [27], as our loss function in the experiments for comparison with other algorithms. Furthermore, the improvement in accuracy resulting from the combined loss provides us with some potential directions for future research. For example, it is worth further investigating how to design a reasonable and effective loss function tailored to the network architecture and how to apply the loss function across multiple layers.
Table 5.
Ablation study about the loss function in our methods.
5.3. Discussion on Computational Efficiency
As shown in Table 6, we reported the inference speed and the number of parameters of the model on the S3DIS dataset. It can be observed that our method has slightly fewer parameters compared to BAF-LAC, and its speed is similar to LEARD-Net. However, in terms of segmentation performance, it shows a slight improvement compared to both of these algorithms, and it achieves a increase in mIoU compared to RandLA-Net.
Table 6.
The number of parameters and computational efficiency on S3DIS.
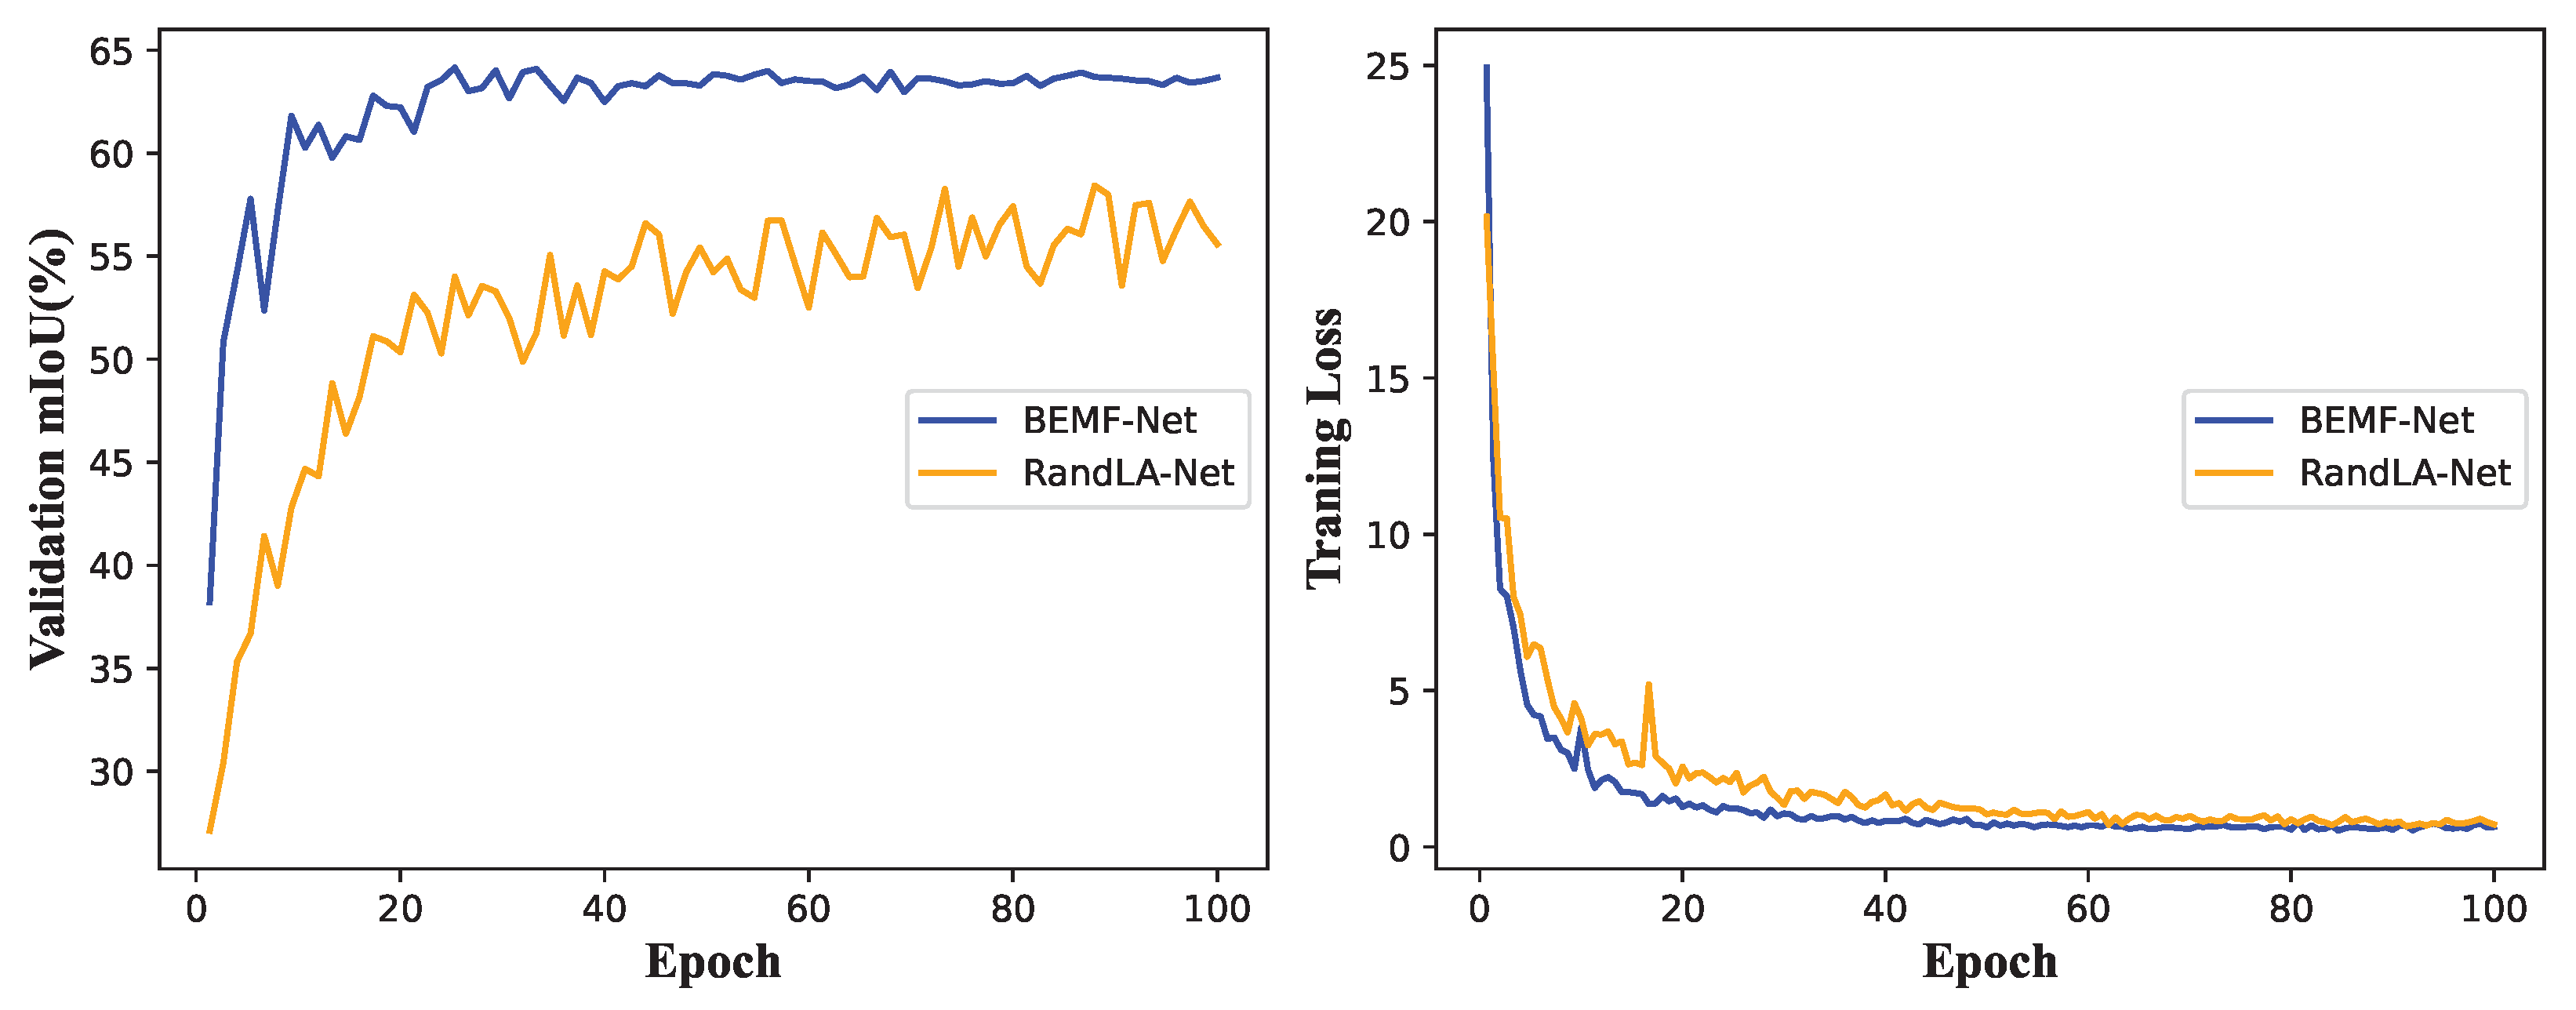
5.4. Learning Process of Our Methods
To provide a more intuitive depiction of the actual performance of our BEMF-Net during the learning process, we visually present the curves of loss and mIoU in Figure 9. We describe the training process of RandLA-Net and our method on the S3DIS dataset. The figure shows that our method converges faster compared to RandLA-Net, with the loss tending to stabilize around the 40th epoch. In addition, the mIoU reaches its peak around the 60th epoch and remains relatively stable in the subsequent training, without significant fluctuations.

Figure 9.
Validation mIoU and training loss curves of RandLA-Net and our method on S3DIS.
6. Conclusions
Semantic segmentation techniques allow a better understanding of the scene environment, thereby extracting valuable information from 3D data that can be used to simulate the real world. In this paper, we proposed a novel model, called BEMF-Net, designed for the semantic segmentation of large-scale point clouds. This method encompasses two significant contributions. Firstly, we presented the DBB module, which integrates texture information to supplement the description of neighbor spaces and improve the perception of local details. Our encoding process systematically exploits differences in the neighboring spaces to achieve the accurate segmentation of semantic class boundaries. Additionally, we introduced the U-Fusion module, which is based on the traditional skip connection. This component circumvents issues caused by feature smoothing from sampling mechanisms, enabling the integration of multi-scale data and maintaining the integrity of information across different layers. Notably, we achieved excellent results for several benchmark datasets such as S3DIS and SensatUrban, and our performance on the Toronto3D benchmark was on par with state-of-the-art methods. Finally, we conducted ablation experiments to demonstrate the effectiveness of each proposed module.
The following conclusions were drawn from the above work:
- Enhancing the network’s ability to describe the point cloud is possible by adding extra data, such as color information. The simultaneous use of geometry and color data can help distinguish semantic class boundaries.
- Effective utilization of features at different resolutions is essential to improve scene understanding. Ablation tests show that the proposed U-Fusion method is sensitive to feature changes and provides positive feedback.
- This methodology can effectively function in three separate urban environments: SensatUrban, Toronto3D, and S3DIS. SensatUrban pertains to capturing large-scale outdoor urban scenes through the means of UAVs, while Toronto3D entails localized urban scenes captured by radar mounted on vehicles. S3DIS encompasses indoor scene data. This showcases the ability to address data variability to a certain extent.
- Real-world point cloud data are commonly obtained by radar or UAVs, which often leads to inherent problems such as noise and incomplete data. In the future, we will focus on overcoming these challenges and achieving accurate point cloud segmentation, especially in regions characterized by low data quality.
Author Contributions
Conceptualization, H.J., S.Y. and Z.L.; methodology, H.J. and S.Y.; software, H.J., Z.J. and J.Z.; validation, H.J., Z.J., J.Z. and S.Y.; writing—original draft preparation, H.J., S.G. and G.L.; writing—review and editing, H.J. and S.Z.; supervision, S.Z., Z.L. and Z.X.; project administration, Z.L. and Z.X. All authors have read and agreed to the published version of the manuscript.
Funding
This research was funded by the National Key Research and Development Program of China (No. 2022YFB3904100), and the Open Research Project of The Hubei Key Laboratory of Intelligent Geo-Information Processing (No. KLIGIP-2023-B10).
Data Availability Statement
Publicly available datasets were analyzed in this study. The SensatUrban dataset can be found here (http://point-cloud-analysis.cs.ox.ac.uk/ (accessed on 1 October 2023)). The S3DIS dataset was obtained based on the Stanford Large-Scale 3D Indoor Spaces Dataset by Matterport Camera (https://cvgl.stanford.edu/resources.html (accessed on 1 October 2023)). The Toronto3D dataset can be found here: (https://github.com/WeikaiTan/Toronto-3D (accessed on 1 October 2023)).
Acknowledgments
The authors would like to thank the editor and reviewers for their constructive comments, which contributed greatly to the improvement of this work.
Conflicts of Interest
The authors declare no conflict of interest.
References
- Yang, G.; Xue, F.; Zhang, Q.; Xie, K.; Fu, C.W.; Huang, H. UrbanBIS: A Large-Scale Benchmark for Fine-Grained Urban Building Instance Segmentation. In Proceedings of the ACM SIGGRAPH Conference Proceedings, Los Angeles, CA, USA, 6–10 August 2023. [Google Scholar] [CrossRef]
- Marsocci, V.; Coletta, V.; Ravanelli, R.; Scardapane, S.; Crespi, M. New trends in urban change detection: Detecting 3D changes from bitemporal optical images. In Proceedings of the EGU General Assembly, Vienna, Austria, 24–28 April 2023. [Google Scholar] [CrossRef]
- Wang, L.; Huang, Y.; Shan, J.; He, L. MSNet: Multi-Scale Convolutional Network for Point Cloud Classification. Remote Sens. 2018, 10, 612. [Google Scholar] [CrossRef]
- Shao, J.; Zhang, W.; Shen, A.; Mellado, N.; Cai, S.; Luo, L.; Wang, N.; Yan, G.; Zhou, G. Seed point set-based building roof extraction from airborne LiDAR point clouds using a top-down strategy. Autom. Constr. 2021, 126, 103660. [Google Scholar] [CrossRef]
- Zheng, Q.; Zhao, P.; Li, Y.; Wang, H.; Yang, Y. Spectrum interference-based two-level data augmentation method in deep learning for automatic modulation classification. Neural Comput. Appl. 2021, 33, 7723–7745. [Google Scholar] [CrossRef]
- Li, Z.; Chen, Z.; Li, A.; Fang, L.; Jiang, Q.; Liu, X.; Jiang, J. Unsupervised Domain Adaptation For Monocular 3D Object Detection Via Self-Training. In Proceedings of the European Conference on Computer Vision (ECCV), Tel Aviv, Israel, 23–27 October 2022; pp. 245–262. [Google Scholar] [CrossRef]
- Chen, X.; Ma, H.; Wan, J.; Li, B.; Xia, T. Multi-view 3D Object Detection Network for Autonomous Driving. In Proceedings of the IEEE Conference on Computer Vision and Pattern Recognition (CVPR), Honolulu, HI, USA, 21–26 July 2017; pp. 6526–6534. [Google Scholar] [CrossRef]
- Lang, A.H.; Vora, S.; Caesar, H.; Zhou, L.; Yang, J.; Beijbom, O. PointPillars: Fast Encoders for Object Detection From Point Clouds. In Proceedings of the IEEE Conference on Computer Vision and Pattern Recognition (CVPR), Long Beach, CA, USA, 15–20 June 2019; pp. 12689–12697. [Google Scholar] [CrossRef]
- Xie, X.; Liu, Y.; Xu, Y.; He, Z.; Chen, X.; Zheng, X.; Xie, Z. Building Function Recognition Using the Semi-Supervised Classification. Appl. Sci. 2022, 12, 9900. [Google Scholar] [CrossRef]
- Yongyang, X.; Shuai, J.; Zhanlong, C.; Xuejing, X.; Sheng, H.; Zhong, X. Application of a graph convolutional network with visual and semantic features to classify urban scenes. Int. J. Geogr. Inf. Sci. 2022, 36, 2009–2034. [Google Scholar] [CrossRef]
- Jaboyedoff, M.; Oppikofer, T.; Abellán, A.; Derron, M.H.; Loye, A.; Metzger, R.; Pedrazzini, A. Use of LIDAR in landslide investigations: A review. Nat. Hazards 2012, 61, 5–28. [Google Scholar] [CrossRef]
- Rim, B.; Lee, A.; Hong, M. Semantic Segmentation of Large-Scale Outdoor Point Clouds by Encoder–Decoder Shared MLPs with Multiple Losses. Remote Sens. 2021, 13, 3121. [Google Scholar] [CrossRef]
- Yang, S.; Li, Q.; Li, W.; Li, X.; Liu, A.A. Dual-Level Representation Enhancement on Characteristic and Context for Image-Text Retrieval. IEEE Trans. Circuits Syst. Video Technol. 2022, 32, 8037–8050. [Google Scholar] [CrossRef]
- Li, W.; Wang, Y.; Su, Y.; Li, X.; Liu, A.A.; Zhang, Y. Multi-Scale Fine-Grained Alignments for Image and Sentence Matching. IEEE Trans. Multimed. 2023, 25, 543–556. [Google Scholar] [CrossRef]
- Chen, Z.; Yang, B.; Ma, A.; Peng, M.; Li, H.; Chen, T.; Chen, C.; Dong, Z. Joint alignment of the distribution in input and feature space for cross-domain aerial image semantic segmentation. Int. J. Appl. Earth Obs. Geoinf. 2022, 115, 103107. [Google Scholar] [CrossRef]
- de Gélis, I.; Lefèvre, S.; Corpetti, T. Change Detection in Urban Point Clouds: An Experimental Comparison with Simulated 3D Datasets. Remote Sens. 2021, 13, 2629. [Google Scholar] [CrossRef]
- Marsocci, V.; Coletta, V.; Ravanelli, R.; Scardapane, S.; Crespi, M. Inferring 3D change detection from bitemporal optical images. ISPRS J. Photogramm. Remote Sens. 2023, 196, 325–339. [Google Scholar] [CrossRef]
- Chen, J.; Wang, Q.; Peng, W.; Xu, H.; Li, X.; Xu, W. Disparity-Based Multiscale Fusion Network for Transportation Detection. IEEE Trans. Intell. Transp. Syst. 2022, 23, 18855–18863. [Google Scholar] [CrossRef]
- Zhang, Y.; Chen, G.; Myint, S.W.; Zhou, Y.; Hay, G.J.; Vukomanovic, J.; Meentemeyer, R.K. UrbanWatch: A 1-meter resolution land cover and land use database for 22 major cities in the United States. Remote Sens. Environ. 2022, 278, 113106. [Google Scholar] [CrossRef]
- Wu, W.; Xie, Z.; Xu, Y.; Zeng, Z.; Wan, J. Point Projection Network: A Multi-View-Based Point Completion Network with Encoder-Decoder Architecture. Remote Sens. 2021, 13, 4917. [Google Scholar] [CrossRef]
- Qin, N.; Hu, X.; Wang, P.; Shan, J.; Li, Y. Semantic Labeling of ALS Point Cloud via Learning Voxel and Pixel Representations. IEEE Geosci. Remote Sens. Lett. 2020, 17, 859–863. [Google Scholar] [CrossRef]
- Han, X.; Dong, Z.; Yang, B. A point-based deep learning network for semantic segmentation of MLS point clouds. ISPRS J. Photogramm. Remote Sens. 2021, 175, 199–214. [Google Scholar] [CrossRef]
- Poursaeed, O.; Jiang, T.; Qiao, H.; Xu, N.; Kim, V.G. Self-Supervised Learning of Point Clouds via Orientation Estimation. In Proceedings of the International Conference on 3D Vision (3DV), Virtual Event, 25–28 November 2020; pp. 1018–1028. [Google Scholar] [CrossRef]
- Liu, Z.; Zhao, Y.; Zhan, S.; Liu, Y.; Chen, R.; He, Y. PCDNF: Revisiting Learning-based Point Cloud Denoising via Joint Normal Filtering. IEEE Trans. Vis. Comput. Graph. 2023, 1–18. [Google Scholar] [CrossRef]
- Charles, R.Q.; Su, H.; Kaichun, M.; Guibas, L.J. PointNet: Deep Learning on Point Sets for 3D Classification and Segmentation. In Proceedings of the IEEE Conference on Computer Vision and Pattern Recognition (CVPR), Honolulu, HI, USA, 21–26 July 2017; pp. 77–85. [Google Scholar] [CrossRef]
- Qi, C.R.; Yi, L.; Su, H.; Guibas, L.J. PointNet++: Deep Hierarchical Feature Learning on Point Sets in a Metric Space. In Proceedings of the Advances in Neural Information Processing Systems (NeurIPS), Long Beach, CA, USA, 4–9 December 2017; Volume 30, pp. 5105–5114. [Google Scholar]
- Hu, Q.; Yang, B.; Xie, L.; Rosa, S.; Guo, Y.; Wang, Z.; Trigoni, N.; Markham, A. RandLA-Net: Efficient Semantic Segmentation of Large-Scale Point Clouds. In Proceedings of the IEEE Conference on Computer Vision and Pattern Recognition (CVPR), Seattle, WA, USA, 13–19 June 2020; pp. 11105–11114. [Google Scholar] [CrossRef]
- Shuai, H.; Xu, X.; Liu, Q. Backward Attentive Fusing Network With Local Aggregation Classifier for 3D Point Cloud Semantic Segmentation. IEEE Trans. Image Process. 2021, 30, 4973–4984. [Google Scholar] [CrossRef]
- Li, F.; Zhou, Z.; Xiao, J.; Chen, R.; Lehtomäki, M.; Elberink, S.O.; Vosselman, G.; Hyyppä, J.; Chen, Y.; Kukko, A. Instance-Aware Semantic Segmentation of Road Furniture in Mobile Laser Scanning Data. IEEE Trans. Intell. Transp. Syst. 2022, 23, 17516–17529. [Google Scholar] [CrossRef]
- Shen, S.; Xia, Y.; Eich, A.; Xu, Y.; Yang, B.; Stilla, U. SegTrans: Semantic Segmentation With Transfer Learning for MLS Point Clouds. IEEE Geosci. Remote Sens. Lett. 2023, 20, 1–5. [Google Scholar] [CrossRef]
- Atik, M.E.; Duran, Z. Selection of Relevant Geometric Features Using Filter-Based Algorithms for Point Cloud Semantic Segmentation. Electronics 2022, 11, 3310. [Google Scholar] [CrossRef]
- Qiu, S.; Anwar, S.; Barnes, N. Semantic Segmentation for Real Point Cloud Scenes via Bilateral Augmentation and Adaptive Fusion. In Proceedings of the IEEE Conference on Computer Vision and Pattern Recognition (CVPR), Nashville, TN, USA, 20–25 June 2021; pp. 1757–1767. [Google Scholar] [CrossRef]
- Thomas, H.; Qi, C.R.; Deschaud, J.E.; Marcotegui, B.; Goulette, F.; Guibas, L. KPConv: Flexible and Deformable Convolution for Point Clouds. In Proceedings of the 2019 IEEE/CVF International Conference on Computer Vision (ICCV), Seoul, Republic of Korea, 27 October–2 November 2019; pp. 6410–6419. [Google Scholar] [CrossRef]
- Chen, J.; Zhao, Y.; Meng, C.; Liu, Y. Multi-Feature Aggregation for Semantic Segmentation of an Urban Scene Point Cloud. Remote Sens. 2022, 14, 5134. [Google Scholar] [CrossRef]
- Du, J.; Cai, G.; Wang, Z.; Huang, S.; Su, J.; Marcato Junior, J.; Smit, J.; Li, J. ResDLPS-Net: Joint residual-dense optimization for large-scale point cloud semantic segmentation. ISPRS J. Photogramm. Remote Sens. 2021, 182, 37–51. [Google Scholar] [CrossRef]
- Wang, L.; Huang, Y.; Hou, Y.; Zhang, S.; Shan, J. Graph Attention Convolution for Point Cloud Semantic Segmentation. In Proceedings of the IEEE Conference on Computer Vision and Pattern Recognition (CVPR), Long Beach, CA, USA, 15–20 June 2019; pp. 10288–10297. [Google Scholar] [CrossRef]
- Ku, T.; Veltkamp, R.C.; Boom, B.; Duque-Arias, D.; Velasco-Forero, S.; Deschaud, J.E.; Goulette, F.; Marcotegui, B.; Ortega, S.; Trujillo, A.; et al. SHREC 2020: 3D point cloud semantic segmentation for street scenes. Comput. Graph. 2020, 93, 13–24. [Google Scholar] [CrossRef]
- Armeni, I.; Sener, O.; Zamir, A.R.; Jiang, H.; Brilakis, I.; Fischer, M.; Savarese, S. 3D Semantic Parsing of Large-Scale Indoor Spaces. In Proceedings of the IEEE Conference on Computer Vision and Pattern Recognition (CVPR), Las Vegas, NV, USA, 26 June–1 July 2016; pp. 1534–1543. [Google Scholar] [CrossRef]
- Tchapmi, L.; Choy, C.; Armeni, I.; Gwak, J.; Savarese, S. SEGCloud: Semantic Segmentation of 3D Point Clouds. In Proceedings of the International Conference on 3D Vision (3DV), Qingdao, China, 10–12 October 2017; pp. 537–547. [Google Scholar] [CrossRef]
- Liu, H.; Yuan, H.; Hou, J.; Hamzaoui, R.; Gao, W. PUFA-GAN: A Frequency-Aware Generative Adversarial Network for 3D Point Cloud Upsampling. IEEE Trans. Image Process. 2022, 31, 7389–7402. [Google Scholar] [CrossRef]
- Guo, Y.; Wang, H.; Hu, Q.; Liu, H.; Liu, L.; Bennamoun, M. Deep Learning for 3D Point Clouds: A Survey. IEEE Trans. Pattern Anal. Mach. Intell. 2021, 43, 4338–4364. [Google Scholar] [CrossRef] [PubMed]
- Li, Y.; Bu, R.; Sun, M.; Wu, W.; Di, X.; Chen, B. PointCNN: Convolution On X-Transformed Points. Adv. Neural Inf. Process. Syst. (NeurIPS) 2018, 31. [Google Scholar]
- Li, Y.; Ma, L.; Zhong, Z.; Cao, D.; Li, J. TGNet: Geometric Graph CNN on 3-D Point Cloud Segmentation. IEEE Trans. Geosci. Remote Sens. 2020, 58, 3588–3600. [Google Scholar] [CrossRef]
- Fan, S.; Dong, Q.; Zhu, F.; Lv, Y.; Ye, P.; Wang, F.Y. SCF-Net: Learning Spatial Contextual Features for Large-Scale Point Cloud Segmentation. In Proceedings of the IEEE Conference on Computer Vision and Pattern Recognition (CVPR), Nashville, TN, USA, 20–25 June 2021; pp. 14499–14508. [Google Scholar] [CrossRef]
- Guo, M.H.; Cai, J.X.; Liu, Z.N.; Mu, T.J.; Martin, R.R.; Hu, S.M. PCT: Point cloud transformer. Comput. Vis. Media 2021, 7, 187–199. [Google Scholar] [CrossRef]
- Zeng, Z.; Xu, Y.; Xie, Z.; Tang, W.; Wan, J.; Wu, W. LEARD-Net: Semantic segmentation for large-scale point cloud scene. Int. J. Appl. Earth Obs. Geoinf. 2022, 112, 102953. [Google Scholar] [CrossRef]
- Landrieu, L.; Simonovsky, M. Large-Scale Point Cloud Semantic Segmentation with Superpoint Graphs. In Proceedings of the IEEE Conference on Computer Vision and Pattern Recognition (CVPR), Salt Lake City, UT, USA, 18–22 June 2018; pp. 4558–4567. [Google Scholar] [CrossRef]
- Wang, Y.; Sun, Y.; Liu, Z.; Sarma, S.E.; Bronstein, M.M.; Solomon, J.M. Dynamic Graph CNN for Learning on Point Clouds. ACM Trans. Graph. 2019, 38, 1–12. [Google Scholar] [CrossRef]
- Xiao, X.; Lian, S.; Luo, Z.; Li, S. Weighted Res-UNet for High-Quality Retina Vessel Segmentation. In Proceedings of the International Conference on Information Technology in Medicine and Education (ITME), Hangzhou, China, 19–21 October 2018; pp. 327–331. [Google Scholar] [CrossRef]
- Cao, Y.; Liu, S.; Peng, Y.; Li, J. DenseUNet: Densely connected UNet for electron microscopy image segmentation. IET Image Process. 2020, 14, 2682–2689. [Google Scholar] [CrossRef]
- Zhou, Z.; Siddiquee, M.M.R.; Tajbakhsh, N.; Liang, J. UNet++: Redesigning Skip Connections to Exploit Multiscale Features in Image Segmentation. IEEE Trans. Med. Imaging 2020, 39, 1856–1867. [Google Scholar] [CrossRef] [PubMed]
- Ronneberger, O.; Fischer, P.; Brox, T. U-Net: Convolutional Networks for Biomedical Image Segmentation. In Proceedings of the International Conference on Medical Image Computing and Computer Assisted Intervention (MICCAI), Munich, Germany, 5–9 October 2015; pp. 234–241. [Google Scholar] [CrossRef]
- Hu, Q.; Yang, B.; Khalid, S.; Xiao, W.; Trigoni, N.; Markham, A. Towards Semantic Segmentation of Urban-Scale 3D Point Clouds: A Dataset, Benchmarks and Challenges. In Proceedings of the IEEE Conference on Computer Vision and Pattern Recognition (CVPR), Nashville, TN, USA, 20–25 June 2021; pp. 4975–4985. [Google Scholar] [CrossRef]
- Tan, W.; Qin, N.; Ma, L.; Li, Y.; Du, J.; Cai, G.; Yang, K.; Li, J. Toronto-3D: A Large-scale Mobile LiDAR Dataset for Semantic Segmentation of Urban Roadways. In Proceedings of the IEEE Conference on Computer Vision and Pattern Recognition (CVPR), Seattle, WA, USA, 13–19 June 2020; pp. 797–806. [Google Scholar] [CrossRef]
- Tatarchenko, M.; Park, J.; Koltun, V.; Zhou, Q.Y. Tangent Convolutions for Dense Prediction in 3D. In Proceedings of the IEEE Conference on Computer Vision and Pattern Recognition (CVPR), Salt Lake City, UT, USA, 18–23 June 2018; pp. 3887–3896. [Google Scholar] [CrossRef]
- Graham, B.; Engelcke, M.; Maaten, L.v.d. 3D Semantic Segmentation with Submanifold Sparse Convolutional Networks. In Proceedings of the IEEE Conference on Computer Vision and Pattern Recognition (CVPR), Salt Lake City, UT, USA, 18–22 June 2018; pp. 9224–9232. [Google Scholar] [CrossRef]
- Yang, Z.; Ye, Q.; Stoter, J.; Nan, L. Enriching Point Clouds with Implicit Representations for 3D Classification and Segmentation. Remote Sens. 2023, 15, 61. [Google Scholar] [CrossRef]
- Xu, Y.; Tang, W.; Zeng, Z.; Wu, W.; Wan, J.; Guo, H.; Xie, Z. NeiEA-NET: Semantic segmentation of large-scale point cloud scene via neighbor enhancement and aggregation. Int. J. Appl. Earth Obs. Geoinf. 2023, 119, 103285. [Google Scholar] [CrossRef]
- Ma, L.; Li, Y.; Li, J.; Tan, W.; Yu, Y.; Chapman, M.A. Multi-Scale Point-Wise Convolutional Neural Networks for 3D Object Segmentation From LiDAR Point Clouds in Large-Scale Environments. IEEE Trans. Intell. Transp. Syst. 2021, 22, 821–836. [Google Scholar] [CrossRef]
- Zeng, Z.; Xu, Y.; Xie, Z.; Wan, J.; Wu, W.; Dai, W. RG-GCN: A Random Graph Based on Graph Convolution Network for Point Cloud Semantic Segmentation. Remote Sens. 2022, 14, 4055. [Google Scholar] [CrossRef]
- Jiang, T.; Sun, J.; Liu, S.; Zhang, X.; Wu, Q.; Wang, Y. Hierarchical semantic segmentation of urban scene point clouds via group proposal and graph attention network. Int. J. Appl. Earth Obs. Geoinf. 2021, 105, 102626. [Google Scholar] [CrossRef]
- Chen, J.; Kakillioglu, B.; Velipasalar, S. Background-Aware 3-D Point Cloud Segmentation With Dynamic Point Feature Aggregation. IEEE Trans. Geosci. Remote Sens. 2022, 60, 1–12. [Google Scholar] [CrossRef]
- Du, Z.; Ye, H.; Cao, F. A Novel Local-Global Graph Convolutional Method for Point Cloud Semantic Segmentation. IEEE Trans. Neural Netw. Learn. Syst. 2022, 1–15. [Google Scholar] [CrossRef]
Disclaimer/Publisher’s Note: The statements, opinions and data contained in all publications are solely those of the individual author(s) and contributor(s) and not of MDPI and/or the editor(s). MDPI and/or the editor(s) disclaim responsibility for any injury to people or property resulting from any ideas, methods, instructions or products referred to in the content. |
© 2023 by the authors. Licensee MDPI, Basel, Switzerland. This article is an open access article distributed under the terms and conditions of the Creative Commons Attribution (CC BY) license (https://creativecommons.org/licenses/by/4.0/).