Abstract
The present study aimed to investigate atmospheric optical characteristics over the Gorky and Cheboksary Reservoirs and their multi-scale temporal variations to obtain the background characteristics and to identify events involving the transfer of absorbing aerosol to the studied region in 2022–2023. The region is located at a considerable distance (500 km) from the nearest AERONET station; therefore, previous atmospheric data were not available. As a solution, the in situ self-measured aerosol optical depth (AOD) and Angström exponent, as well as satellite products (MAIAC and CALIPSO) for MODIS data, were used. This allowed us to set background values of an AOD of 0.11 at a wavelength of 500 nm and an Angström exponent of 1.2, against their maximum values of 0.38 and 2.5, respectively. To explain these variations, the registered conditions and the microstructure of the dust aerosol over the studied region are presented. For days with background values, the analysis of the particle size distribution data did not show a predominance of any particle size. The optical properties of a smoke aerosol in an atmospheric column are described, and an analysis of the dynamics of particle size variability is presented. A comparative analysis of the optical characteristics of atmospheric aerosol over the Gorky and Cheboksary Reservoirs using in situ and MODIS products was carried out.
1. Introduction
A large number of scientific papers and national programs are devoted to creating regional observation systems for the study of the ecological state of freshwater reservoirs. All these studies are aimed at obtaining reliable information and studying trends in water quality changes, in addition to the influence of anthropogenic and biogenic factors on these trends. Various natural phenomena, such as forest fires, dust storms, and volcanic eruptions, as well as the development of various technological processes, lead to an increase in the amount of harmful substances entering the atmosphere. The most common toxic substances polluting the atmosphere are carbon monoxide, sulfur dioxide, nitrogen oxides, hydrocarbons, and dust [1]. Currently, there are more than 1800 harmful substances polluting the air environment [2].
During the period from 1995 to 2003, a large array of data on gas emissions into the atmosphere was obtained for the Volga River basin [2,3]. An analysis of the data obtained during this period showed that the total mass of gas emissions into the atmosphere in the Volga basin decreased by 2.0 million tons: from 9.1 million tons in 1995 to 7.1 million tons in 2003. Despite this positive trend of atmosphere purification, the concept of reducing diffuse pollution in the area of the Volga River was created in 2017–2019. This concept includes an analysis both of hydrological data on pollutants and of atmospheric pollution parameters in the framework of the federal priority project “Improvement of the Volga” [3]. Modern measurements of the optical characteristics of waters at a certain set of hydrometeorological posts no longer respond to all available requests, although they still remain important elements of aquatic ecosystems. With the advent and successful operation of high-resolution ocean color satellite sensors, it has become possible to monitor water quality and near-surface processes on different spatial and temporal scales for water bodies of almost any size. The use of this opportunity for the reservoirs of the Russian Federation is especially relevant due to the increased attention currently paid to environmental protection. The use of remote sensing data has led to the development of new effective ship and satellite methods for operational monitoring of the water quality of such eutrophic reservoirs as the Gorky Reservoir. The peculiarity of this reservoir is its relatively small size (in terms of satellite resolution) and frequent overlap of clouds in the study area: per year, ~25% sunny days, ~25% cloudy days, and the remaining 50% cloudy days with precipitation; https://anyroad.ru/city/weather/sunnydays (accessed on 20 November 2023).
To study aerosol optical characteristics and the sources of aerosol activity for many regions, data from the international AERONET network are commonly analyzed [4], but their use is impossible for the studied region: the nearest station in this network to the west is Moscow_MSU_MO (55°N; 37°E), and the nearest to the east is Yekaterinburg (57°N; 59°E). They are located at a distance of 400 km and 1050 km away from the studied region, respectively. The main aerosol characteristic determining the integral (in the atmospheric column) attenuation of optical radiation is the aerosol optical depth, for which the spectral characteristics depend on the size and refractive index of aerosol particles. Studies of the atmospheric aerosol content over the middle strip of the territory of Russia—in particular, over the region of Nizhny Novgorod—were not carried out until 2016 [5]. Therefore, it is necessary to conduct studies using an SPM handheld sun photometer to evaluate variations in the optical characteristics of the atmosphere above the reservoir at different time scales—from a day to a year.
For an objective assessment of the state of small water areas and the procedure of atmospheric correction based on remote sensing data, it is necessary to conduct a comparative analysis of satellite data with the results of in situ measurements of the main atmospheric aerosol characteristics. The atmospheric correction procedure can be carried out only taking into account the aerosol components of the atmosphere, which affect many physical and chemical processes and are among the climate-forming and environmental factors. The Gorky and Cheboksary Reservoirs is exposed to various aerosol impacts, depending on the proximity and intensity of the aerosol activity source (for example, forest fires, emissions from production) and wind direction. For example, when registering a southwesterly wind, two types of aerosols are most likely to be registered: anthropogenic aerosols, since the chemical industry city Dzerzhinsk is located in this area, and, with more intense wind, dust aerosols from the Sahara Desert and the Karakum Desert, the sands of which can be transported hundreds or thousands of kilometers. The obtained results are regional but important, for example, for testing standard algorithms of atmospheric correction of satellite images of eutrophic waters. In [6], we showed the errors in determining aerosol optical properties using standard atmospheric correction algorithms (ac(779, 865) and ac(865, 1012) of NASA [7], MUMM [8], L2W of ESA [9]). In particular, for all of them, the water-leaving reflectance in near-infrared bands was underestimated, and its significant part was mistaken for aerosol radiance, which led to an incorrect estimation of the aerosol optical depth. Subsequently, using collected atmospheric data and Sentinel-3 images of the Gorky Reservoir covering various stages of cyanobacterial bloom during the summer season, we proposed an original solution [10]. It became obvious that for the studied region, the quality of regional atmospheric correction depends on taking into account the absorbing and scattering aerosol properties, as well as an assessment of the size of aerosol particles. The latter directly correlates with ecology; therefore, research regarding ecological assessment is no less an important and relevant task than atmospheric correction. The purpose of this work is to analyze the annual data array of optical characteristics of the aerosol, to obtain background characteristics, and to identify events involving the transfer of absorbing aerosol to the region of the Gorky and Cheboksary Reservoirs.
2. Materials and Methods
2.1. Study Area
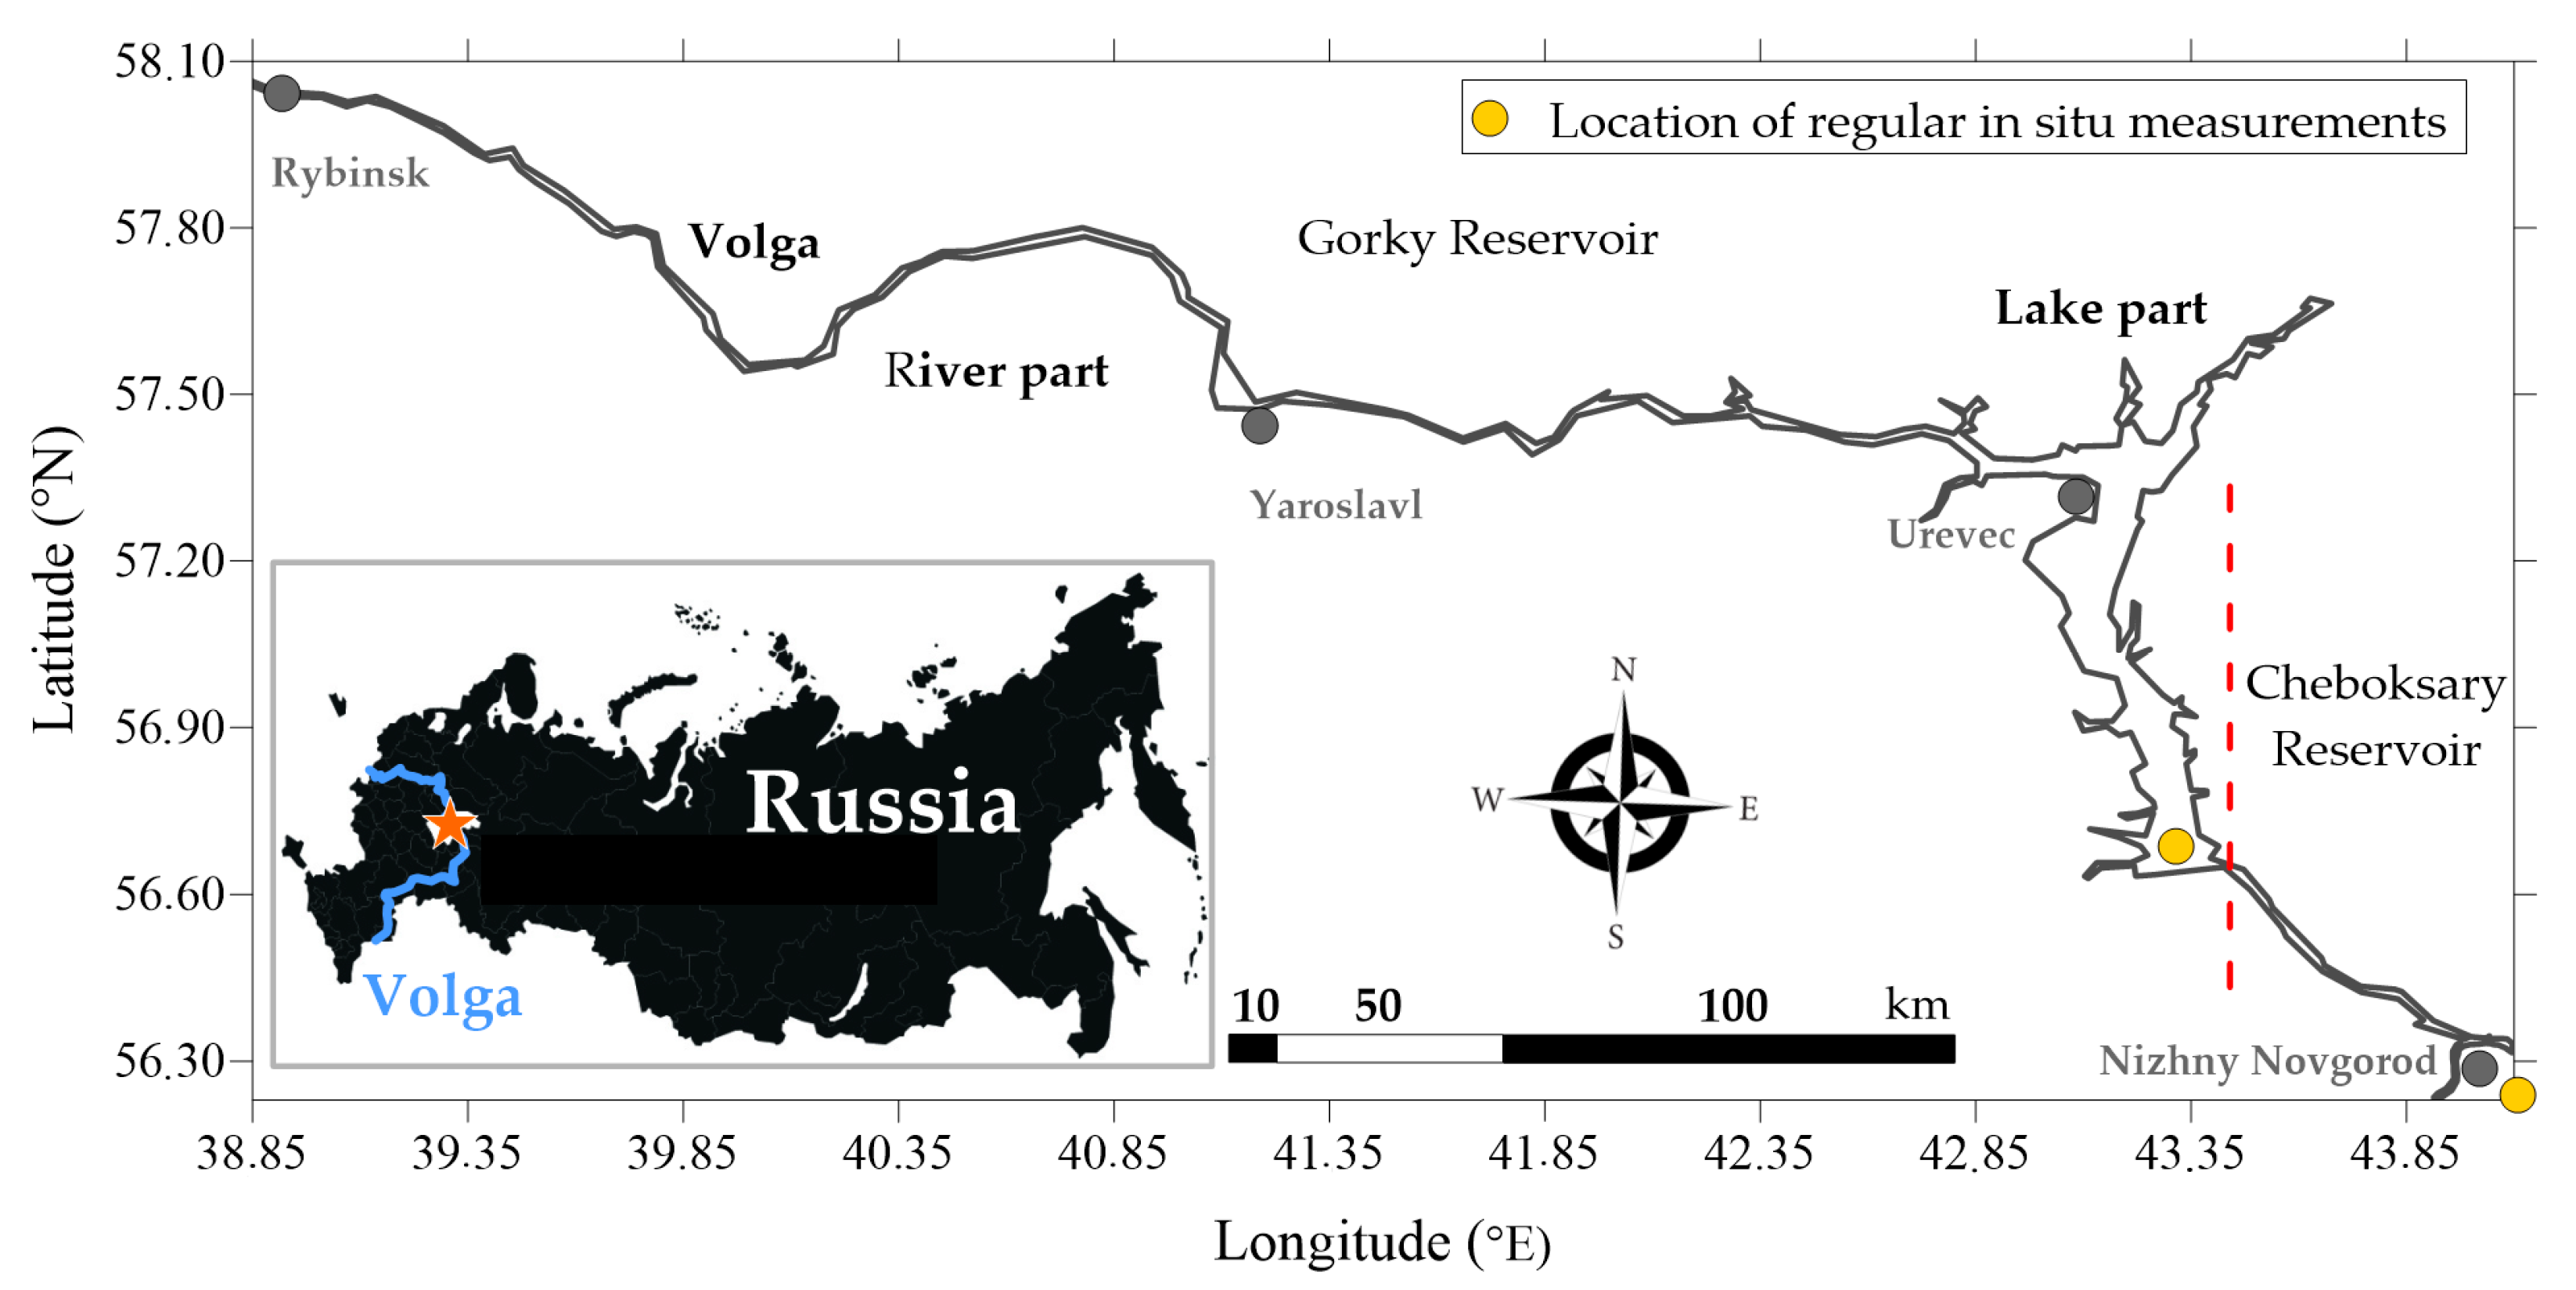
The Volga River is the main waterway of central Russia and the longest European river (3530 km), consisting of 10 reservoirs. One of them is the Gorky Reservoir belonging to the upper Volga (Figure 1). This reservoir has a length of 427 km, a volume of 8.71 km3, and an area of 1590 km2. The average and maximum depths are 3.65 m and 26.6 m, respectively. The last 100 km forms a lake, with a hydroelectric power station at its end. The Cheboksary reservoir is located next to the Gorky Reservoir, belonging to the middle Volga. At its beginning there is the city of Nizhny Novgorod, where measurements were also conducted.

Figure 1.
A map of the Gorky Reservoir.
2.2. Aerosol Measurements
The data on the state of the atmosphere over the Gorky Reservoir represent in situ measurements, made using an SPM sun photometer (Figure 2a), of the attenuation of direct sun radiation. These measurements were conducted from aboard the research vessel “Geophysicist” (Figure 2b). Some additional measurements were performed in the city of Nizhny Novgorod, which is located 50 km from the reservoir. All measurements were carried out with a frequency of 30–60 min at solar altitudes of more than 15 degrees with any possibility of observation outside the clouds.
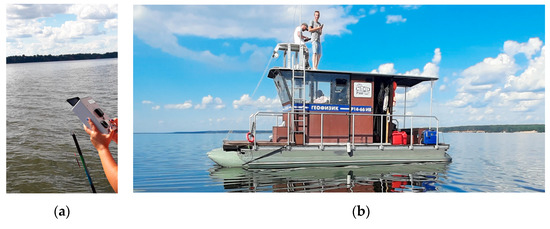
Figure 2.
(a) SPM sun photometer and (b) the research vessel “Geophysicist”.
Spectral measurements were used to determine the aerosol optical depth AOD() ( is the wavelength), the atmospheric moisture content parameter , the Ångström parameters and , and the contributions of the two components of the AOD, which are conditioned by the coarse and fine aerosol contents. The SPM photometer registered signals coming from the Sun in a cloudless sky in 10 spectral channels: 339 nm, 373 nm, 439 nm, 499 nm, 673 nm, 871 nm, 939 nm, 1044 nm, 1555 nm, and 2139 nm [11].
The SPM photometer has an advantage in the spectral range and the number of measuring channels (filters) compared to AERONET sun photometers (Microtops of Cimel production). The SPM photometer is constructed on a modern element base, and the photoelectric optoelectronic circuit is similar to that of the stationary SP-9 photometer, which takes measurements in normal mode. The SPM photometer has a built-in software interface with a computer and is equipped with software that allows for restoration of the AOD and the total tangible water content.
The AOD at a wavelength of nm (AOD(500)) and the small (submicron or fine) () and large () aerosol fractions were also obtained from SPM photometer measurements. It is well known that AOD (where is the wavelength), and the contribution of the fine aerosol fraction to the total value almost vanishes at wavelengths greater than 1 µm, i.e., only the coarse aerosol can be estimated. Measurements of were used in this paper to calculate the coarse fraction of the total value of AOD(500) for the study period [12,13].
The Ångström index () is the name of the exponent in the formula for the dependence of the AOD on the wavelength [14]:
where is the standard (reference) wavelength.
Currently, various aerosol fractions, i.e., the distributions of aerosol particles depending on their size, are widely studied [14]. The coarse fraction (0.6–10 microns) falls into the range of near-zero values of the Ångström index. The situation is more complicated with the fine fraction of aerosol (0.1–0.6 microns), since the Ångström index varies with the range of the maximum of the size distribution function within this interval. The presence of large aerosol particles in the atmosphere can be determined from the variability of α440-870: the lower it is, the larger the particles that can be detected in the atmosphere over the studied region [15].
2.3. Satellite Data
The Multi-Angle Implementation of Atmospheric Correction (MAIAC) data as a satellite product were analyzed along with the results of AOD measurements made using a sun photometer. MAIAC is capable of producing AOD measurements over inland, coastal, and open ocean waters [16], including the amount of absorption and scattering by suspended aerosol particles in the entire column of the atmosphere. Currently, MAIAC is the only algorithm that provides high-quality information on aerosols with a spatial resolution of 1 km, including small-scale urban pollution, smoke from active fires (including small local ones), and dust storms. Specialized smoke and dust detection by MAIAC helps to capture and accurately type aerosols for most active fires, which are often recognized as clouds in standard algorithms of atmospheric correction. Due to the high spatial resolution of 1 km and reliable cloud detection, MAIAC provides data in conditions of partial clouds, when standard products with coarse resolution cannot provide reliable information about the optical characteristics of the atmospheric layer. According to MODIS and MAIAC data, the AOD values are a combined signal of the Terra and Aqua satellites—information which is provided in close to real time [17,18,19,20]. For the Gorky Reservoir, the overpass time usually was about 11 AM.
Dust aerosol transfer events can be analyzed using MODIS/Aqua data, namely, dust loading or ADS (AIRS Dust Score) parameter values calculated based on the results of atmospheric sounding in the infrared and microwave ranges. According to MODIS data, the dust loading of the atmosphere over the studied region is determined from several tests that compare the values of the radiation spectral radiance in separate channels for the same satellite image pixel. The Atmospheric InfraRed Sounder (AIRS) is an instrument on board the second polar–orbital platform of the Earth observation system (EOS) Aqua. In combination with the Advanced Microwave Sensing Device (AMSU), AIRS is an innovative group of visible, infrared, and microwave sensors for sensing the atmosphere. The EOSDIS platform presents satellite images by layers. The satellite image layer obtained while taking into account the ADS parameter reliably shows the presence of aerosols in the Earth’s atmosphere both over the land and over the ocean. The spectral radiance measured in dust-sensitive channels is compared with the radiance measured in non-dust-sensitive channels. If the ADS is higher than 380 W/m2*sr*µm, then the probability of the presence of dust aerosol in the atmosphere is close to 100%. The difference in spectral radiance between several pairs of channels is marked as color pixels from yellow (minimum) to brown-orange (maximum), which correspond to low and high dust aerosol concentration values. Pixels with the maximum difference in spectral radiance (ADS = 500 W/m2*sr*µm) are colored brown, which indicates the maximum dust aerosol loading of the atmosphere over the studied region. Thus, color pixels provide a qualitative representation of the presence of dust in the atmosphere, as well as an indication of where large dust storms may form and which areas may be affected by them. Pixels where the ADS is less than 360 W/m2*sr*µm are not displayed as dusty. The resolution of the satellite image in pseudo-colors, on which the dust loading is displayed, is 2 km.
For the Gorky Reservoir region, as well as for the entire Nizhny Novgorod region, the sources of aerosol transport can be analyzed using the results of modeling the back trajectories of airflow movement using the HYSPLIT software package v5.2.0 (an integrated hybrid Lagrangian trajectory model for a single particle developed by the Air Resources Laboratory (ARL), http://ready.arl.noaa.gov/HYSPLIT.php (accessed on 10 November 2023). Based on the results of airflow transfer using the HYSPLIT model, the advantage of the western air mass transfer to the studied region was determined.
3. Results and Discussion
Since 2022, SPM photometer monitoring of aerosol optical characteristics for the studied region has been conducted on a continuous basis; thus, the background characteristics of atmospheric aerosols for the Gorky and Cheboksary Reservoirs were obtained. For the research period 2016–2017, the background values were considered as AOD(500) = 0.18 and = 1.45. However, regular measurements, not only summer ones, showed that the background values for the studied region are lower—namely, AOD(500) = 0.11 and = 1.2. An analysis of the particle size distribution data did not show a predominance of any particular particle size for background days (large over small or small over large).
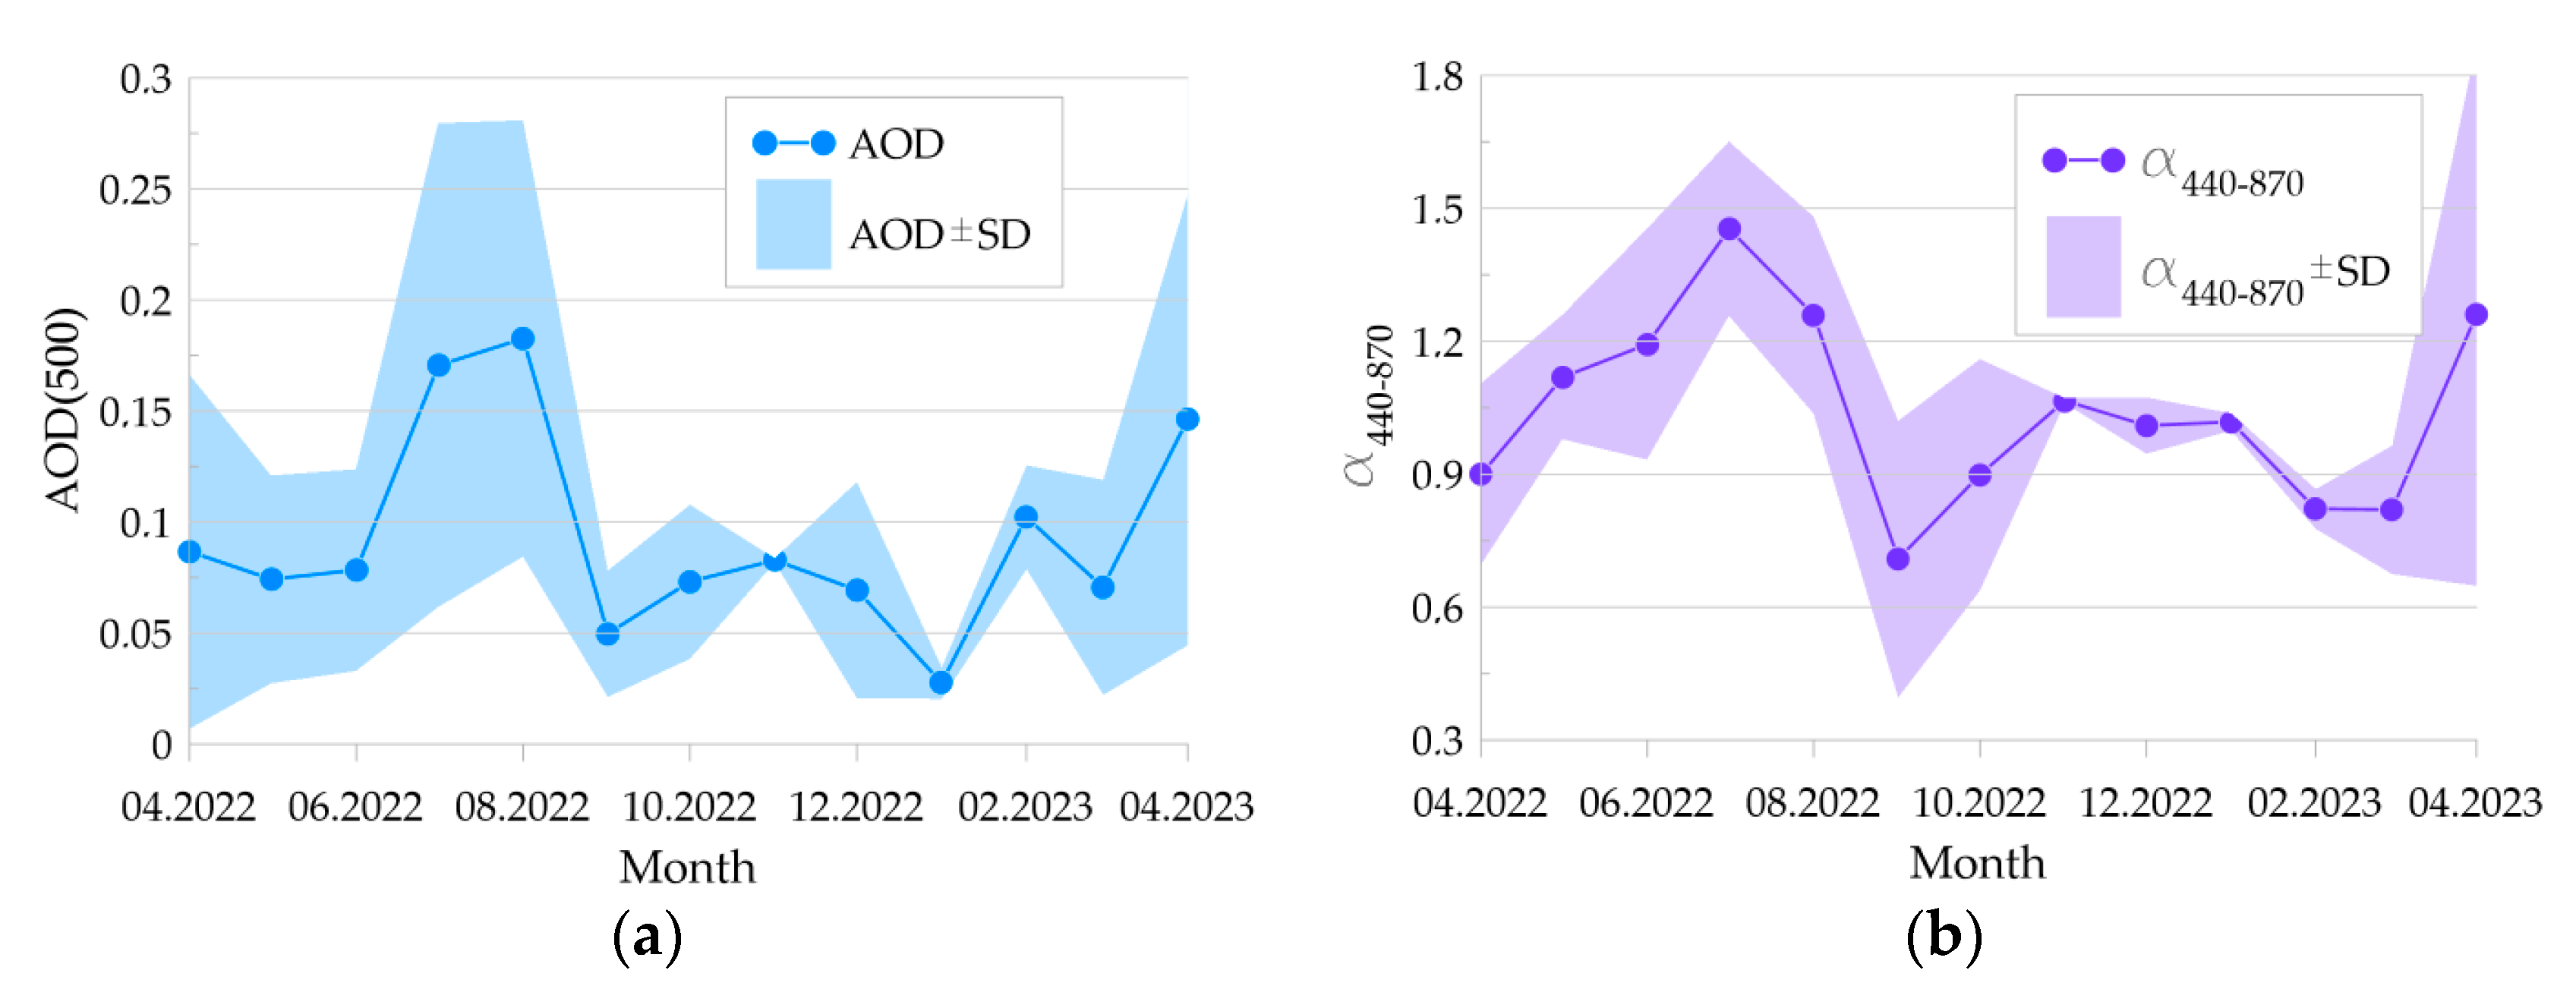
The activity periods of dust and smoke aerosols were determined during a year of regular measurements. It is known that these two types of aerosols are characterized by a high AOD (more than two times higher than the monthly average). As can be seen from the monthly distribution of the AOD, high values of AOD(500) were recorded for April, July, and August 2022, as well as for April 2023 (Figure 3a). As is known, a large number of forest fires are registered in the Nizhny Novgorod region in the summer, which can cause atmosphere turbidity and, accordingly, increased values of the main optical characteristics of atmospheric aerosols during this period. To determine the maximum effect of aerosols, it is necessary to investigate both the interannual and daily variability of aerosol optical characteristics.
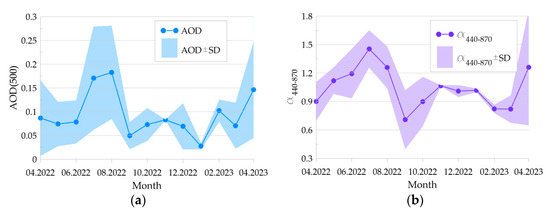
Figure 3.
Month-to-month variations in (a) AOD with standard deviation (SD) at a wavelength of 500 nm and (b) Angström parameters with SD.
Figure 3b shows the variability of the Ångström parameter. As can be seen, the lowest values were observed for the study period in September 2022, as well as in February and March 2023. It is interesting to note that in September 2022, low AOD values were also observed, which means that the overall distribution of the AOD during this period was determined by large particles but in very small quantities. The results of contribution analysis of the coarse fraction for the average daily values in September ranged from 27% (3 September 2022) to 50% (4 September 2022). No regular measurements took place in February (only one full day on 7 February 2023). However, there were seven measurement days in March, and no high AOD values were observed during this period (the maximum value, AOD(500) = 0.15, was obtained on 23 March 2023). The results of analysis of the contribution of coarse particles to the total distribution of the AOD in March ranged from 20% (23 March 2023) to 57% (22 March 2023).
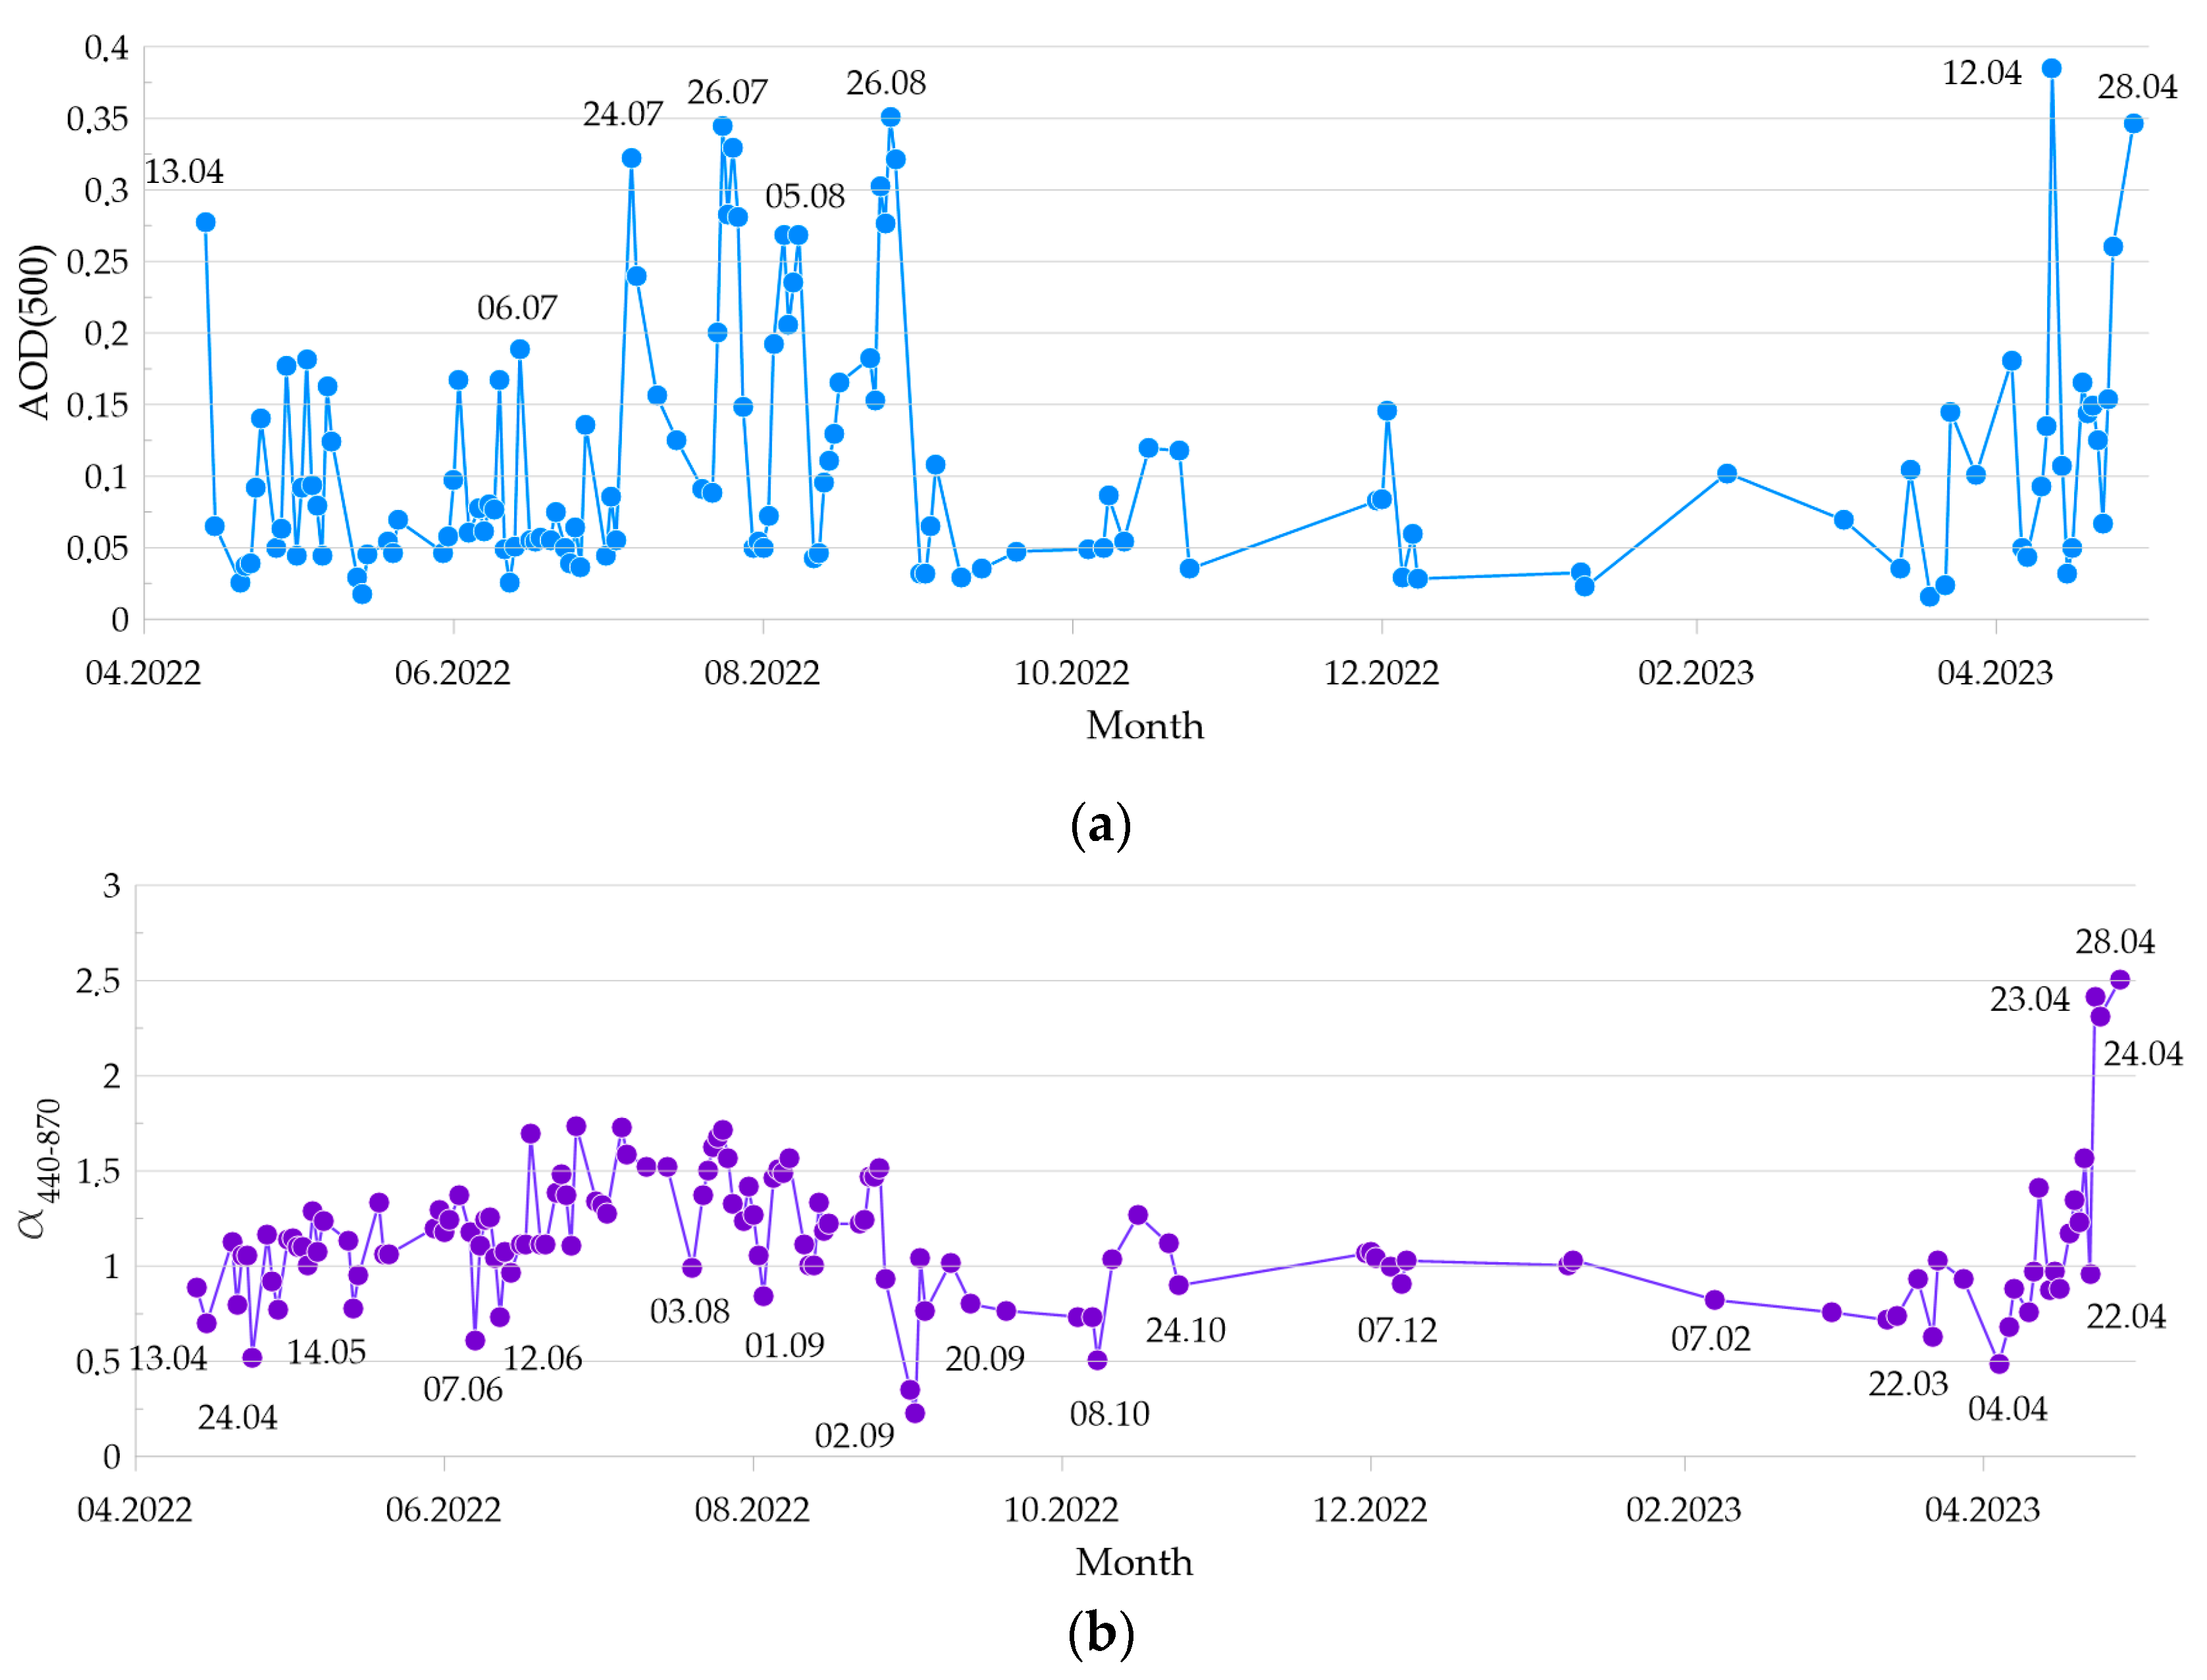
Figure 4a shows that the maximum values of the aerosol optical depth were observed on 13 April 2022; on 6, 7, and 24–27 July 2022; on 5–8 and 24–27 August 2022; and on 12 and 24–28 April 2023. Basically, the increase in AOD is not a one-day event (short-term), but periodic; this may be a consequence of both intense dust transport and a large-scale forest fire, which, in this case, was a source of aerosol from biomass burning (smoke aerosol).
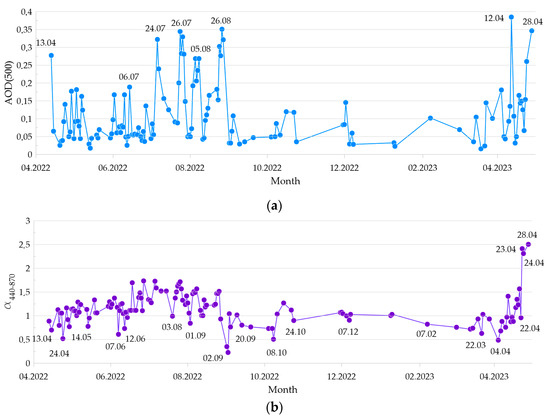
Figure 4.
Day-to-day variations in (a) AOD at a wavelength of 500 nm and (b) Angström parameters.
To determine the aerosol activity source, the satellite data for each day with increased full-scale values of the optical characteristics of atmospheric aerosol were analyzed.
As can be seen in Figure 4a for 13 April 2022, the average daily value of AOD(500) = 0.28 was the maximum for the entire spring period in 2022. The results of modeling the back trajectories of the movement of air flows for this day, performed using the HYSPLIT software package, showed the movement of dust aerosol at an altitude of 3 km from the Karakum side [21]. This means that the increase in the aerosol optical depth on 13 April 2022 was due to the presence of dust aerosol in the atmosphere over the studied region.
The summer period of 2022 was marked by a large number of days with a high AOD (exceeding the average annual values by more than two times) registered over the entire spectral range. An analysis of satellite data and back trajectory modeling data showed that the increase in AOD occurred in most cases due to the presence of smoke in the aerosol atmosphere from forest fires localized to the east of the Gorky Reservoir.
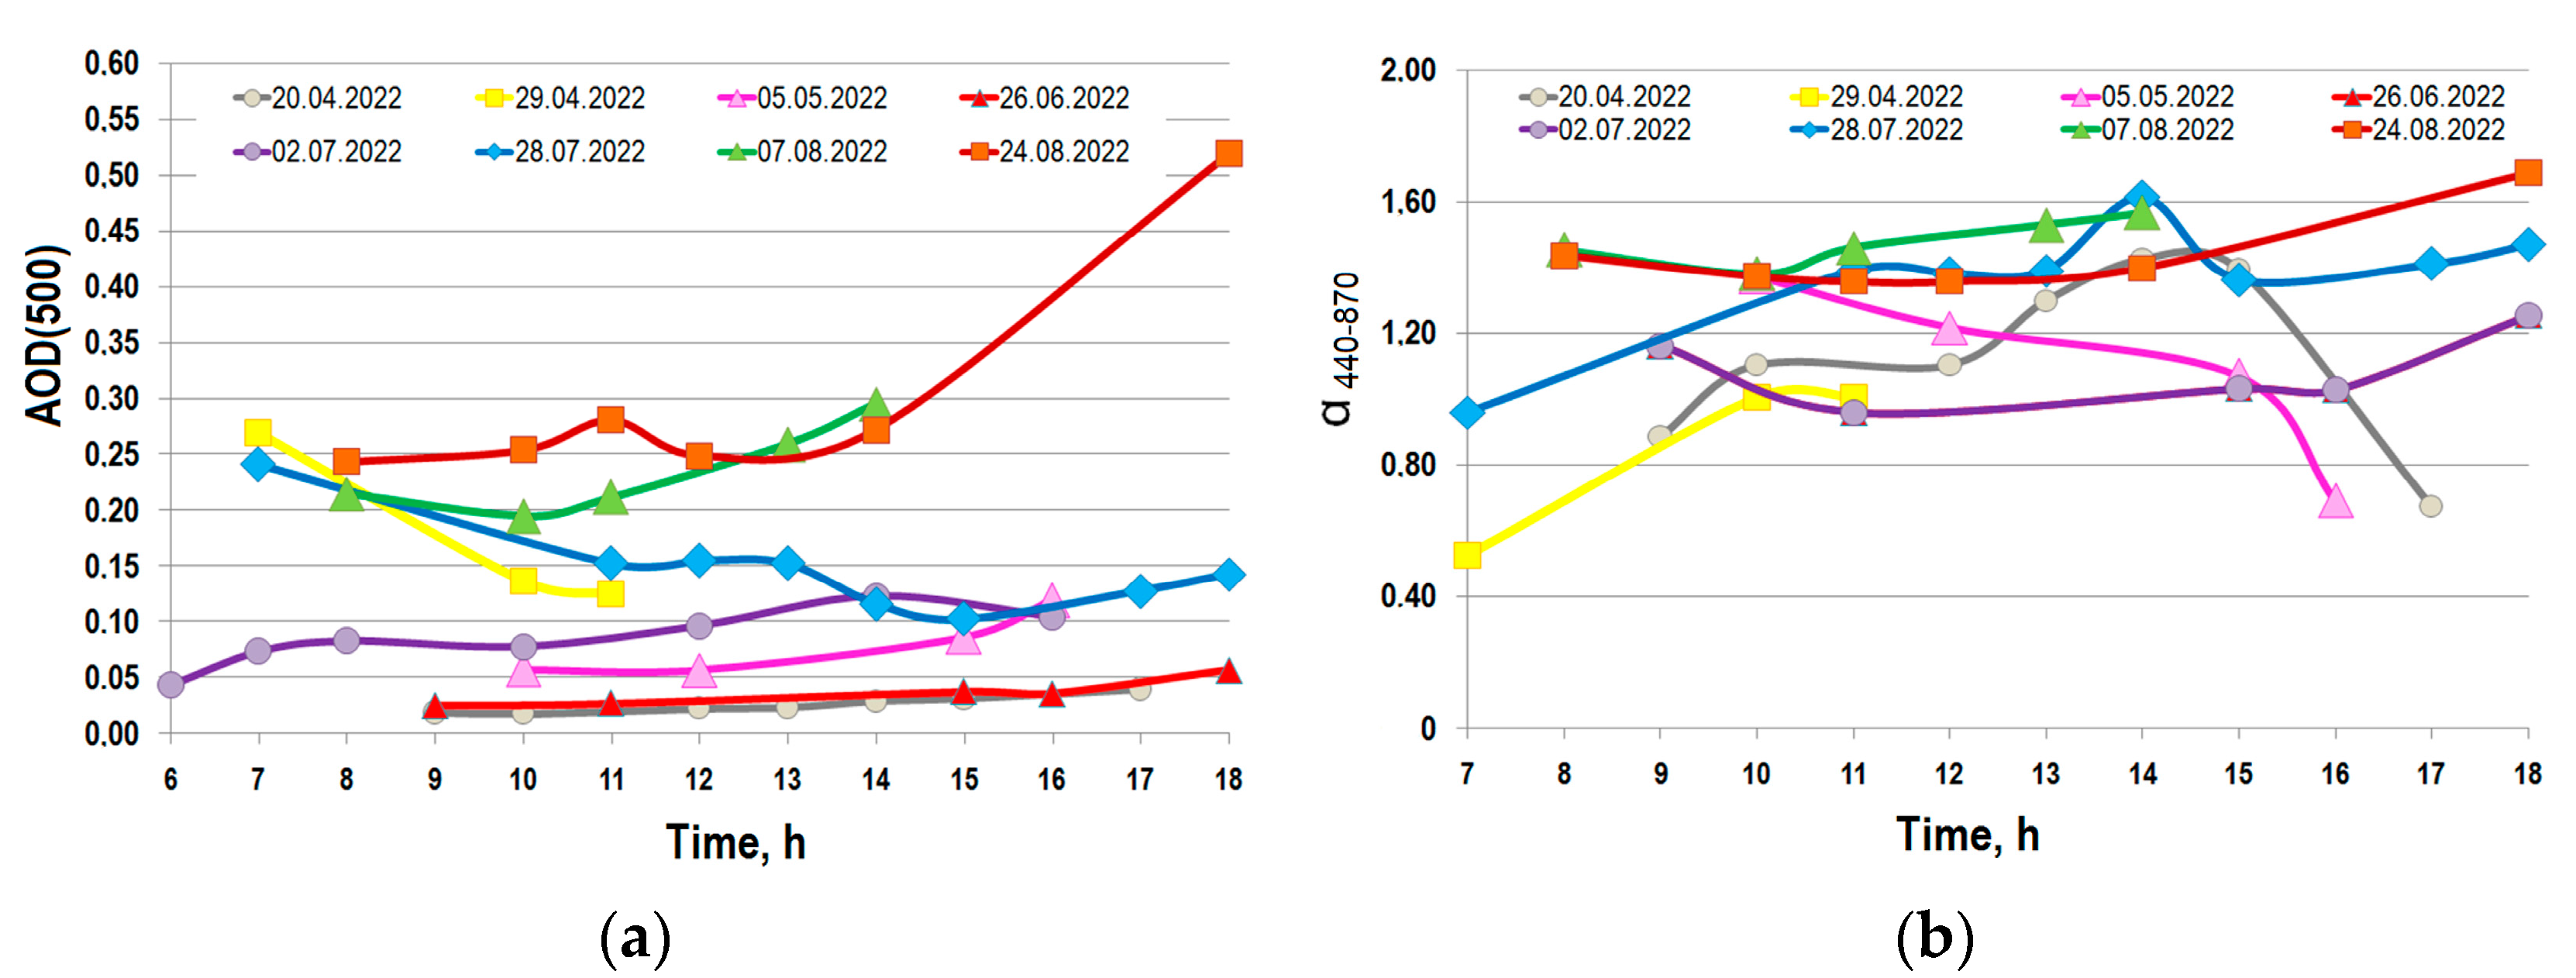
An analysis of the daily variability of atmospheric transparency showed a wide variety of estimates, obtained even when studying well-defined types of aerosols. For example, in [19,20,21,22], it was shown that the daily variability in the AOD of dust aerosol over various observation stations is relatively small (<±5%). On the other hand, there are data on more significant variations in the AOD of dust aerosols during the day (more than 10%) in all seasons [22]. In this work, the criterion for the variability of the daily course was an increase in AOD(500) per day by 1.5–2 times, which corresponds to an increase in the minimum value per day by 50% or more (Figure 5a). As a result of sampling, eight dates were obtained: 20 April 2022, 29 April 2022, 5 May 2022, 26 June 2022, 2 July 2022, 28 July 2022, 7 August 2022, and 24 August 2022. For four days, the AOD(500) values were lower than the background value (AOD(500) = 0.11). As can be seen in Figure 5b, for the four days included in the sample, a strong variability of daily values was observed, and their average daily values also exceeded the background AOD(500) by more than two times. It is worth noting that all the dates when strong daily variability was observed refer to the spring–summer period when both dust aerosol and smoke aerosol transport events were recorded.
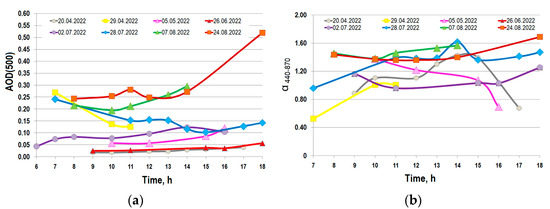
Figure 5.
Hour-to-hour variations of (a) AOD at a wavelength of 500 nm and (b) Angström parameters.
For the obtained eight dates, the daily variability of the Ångström parameter was also analyzed (Figure 5b). Relatively low background values of ( = 1.2) were observed for three days (20 April, 29 April, and 5 May) and indicated the presence of coarse particles in the atmosphere on these days. However, the strong AOD variability was not accompanied by daily variability for the entire sample. For example, the maximum variability of for August 7 was 16%, and for August 24, the deviation in the Ångström parameter values for the day was slightly less than 20%. The maximum variability of the daily values of was observed on April 20 and amounted to 53%, and the average daily value of = 1.125 was only 6%. The value of AOD(500) for this day changed by 54%, while the average daily value obtained for April 20 was four times less than the background value—namely, AOD(500) = 0.026. Such a low AOD at all wavelengths and values of close to the background ones indicate a clean atmosphere over the studied region, consisting equally of a small number of both coarse and fine particles. The analysis of airflow movement performed using the HYSPLIT software package showed the presence of a transfer from the northern direction. The CALIPSO data for 20 April 2022, according to the definition of the preferred aerosol type, did not show the presence of any particular aerosol, which also confirms the state of a very clean atmosphere without aerosol loading on that day. In contrast to the seasonal nature of the AOD variability, the Ångström parameter took both high and low (<1) values throughout the year (Figure 4b). The maximum values (exceeding the annual average by two times) for the entire study period were observed from 23 to 28 April 2023 (with a maximum value of = 2.5 for 28 April 2023). Analysis of the Ångström parameter data for this period showed the presence of a coarse suspension on these days from 11% to 22%, which means that the high values of are due to a large amount of fine suspension.
The average daily value of AOD(500) of 0.39 obtained on 12.04.2023 was the maximum for the entire studied measurement period. The maximum AOD value for this day was received at 14:00 (AOD(500) = 0.45). Concurrently with AOD measurements, we took photographs of the state of the sky and horizon for each series of measurements. An analysis of the photographs for 20 April 2022 at 11:55 (a day with a clean atmosphere) and for 12 April 2023 at 11:38 (a day with maximum aerosol loading) was performed (Figure 6). The main conditions for comparing the photographs were (1) an absence of clouds near the sun; (2) one measurement season and close dates (beginning, middle, or end of the month); and (3) close measurement times (the same zenith angle of the sun). Figure 6a,b show the cases of a pure atmosphere (20 April 2022) and the case of a coarse aerosol (12 April 2023). In contrast to the case with a clean atmosphere, where the blue color of the sky becomes more saturated towards the horizon, the horizon acquires a dirty whitish hue if large particles are present in the atmosphere.
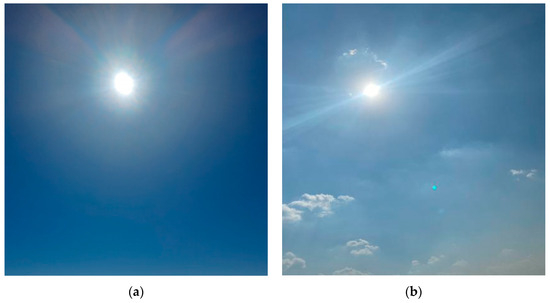
Figure 6.
Photos of the sky state: (a) for 20 April 2022 at 11:55; (b) for 12 April 2023 at 11:38.
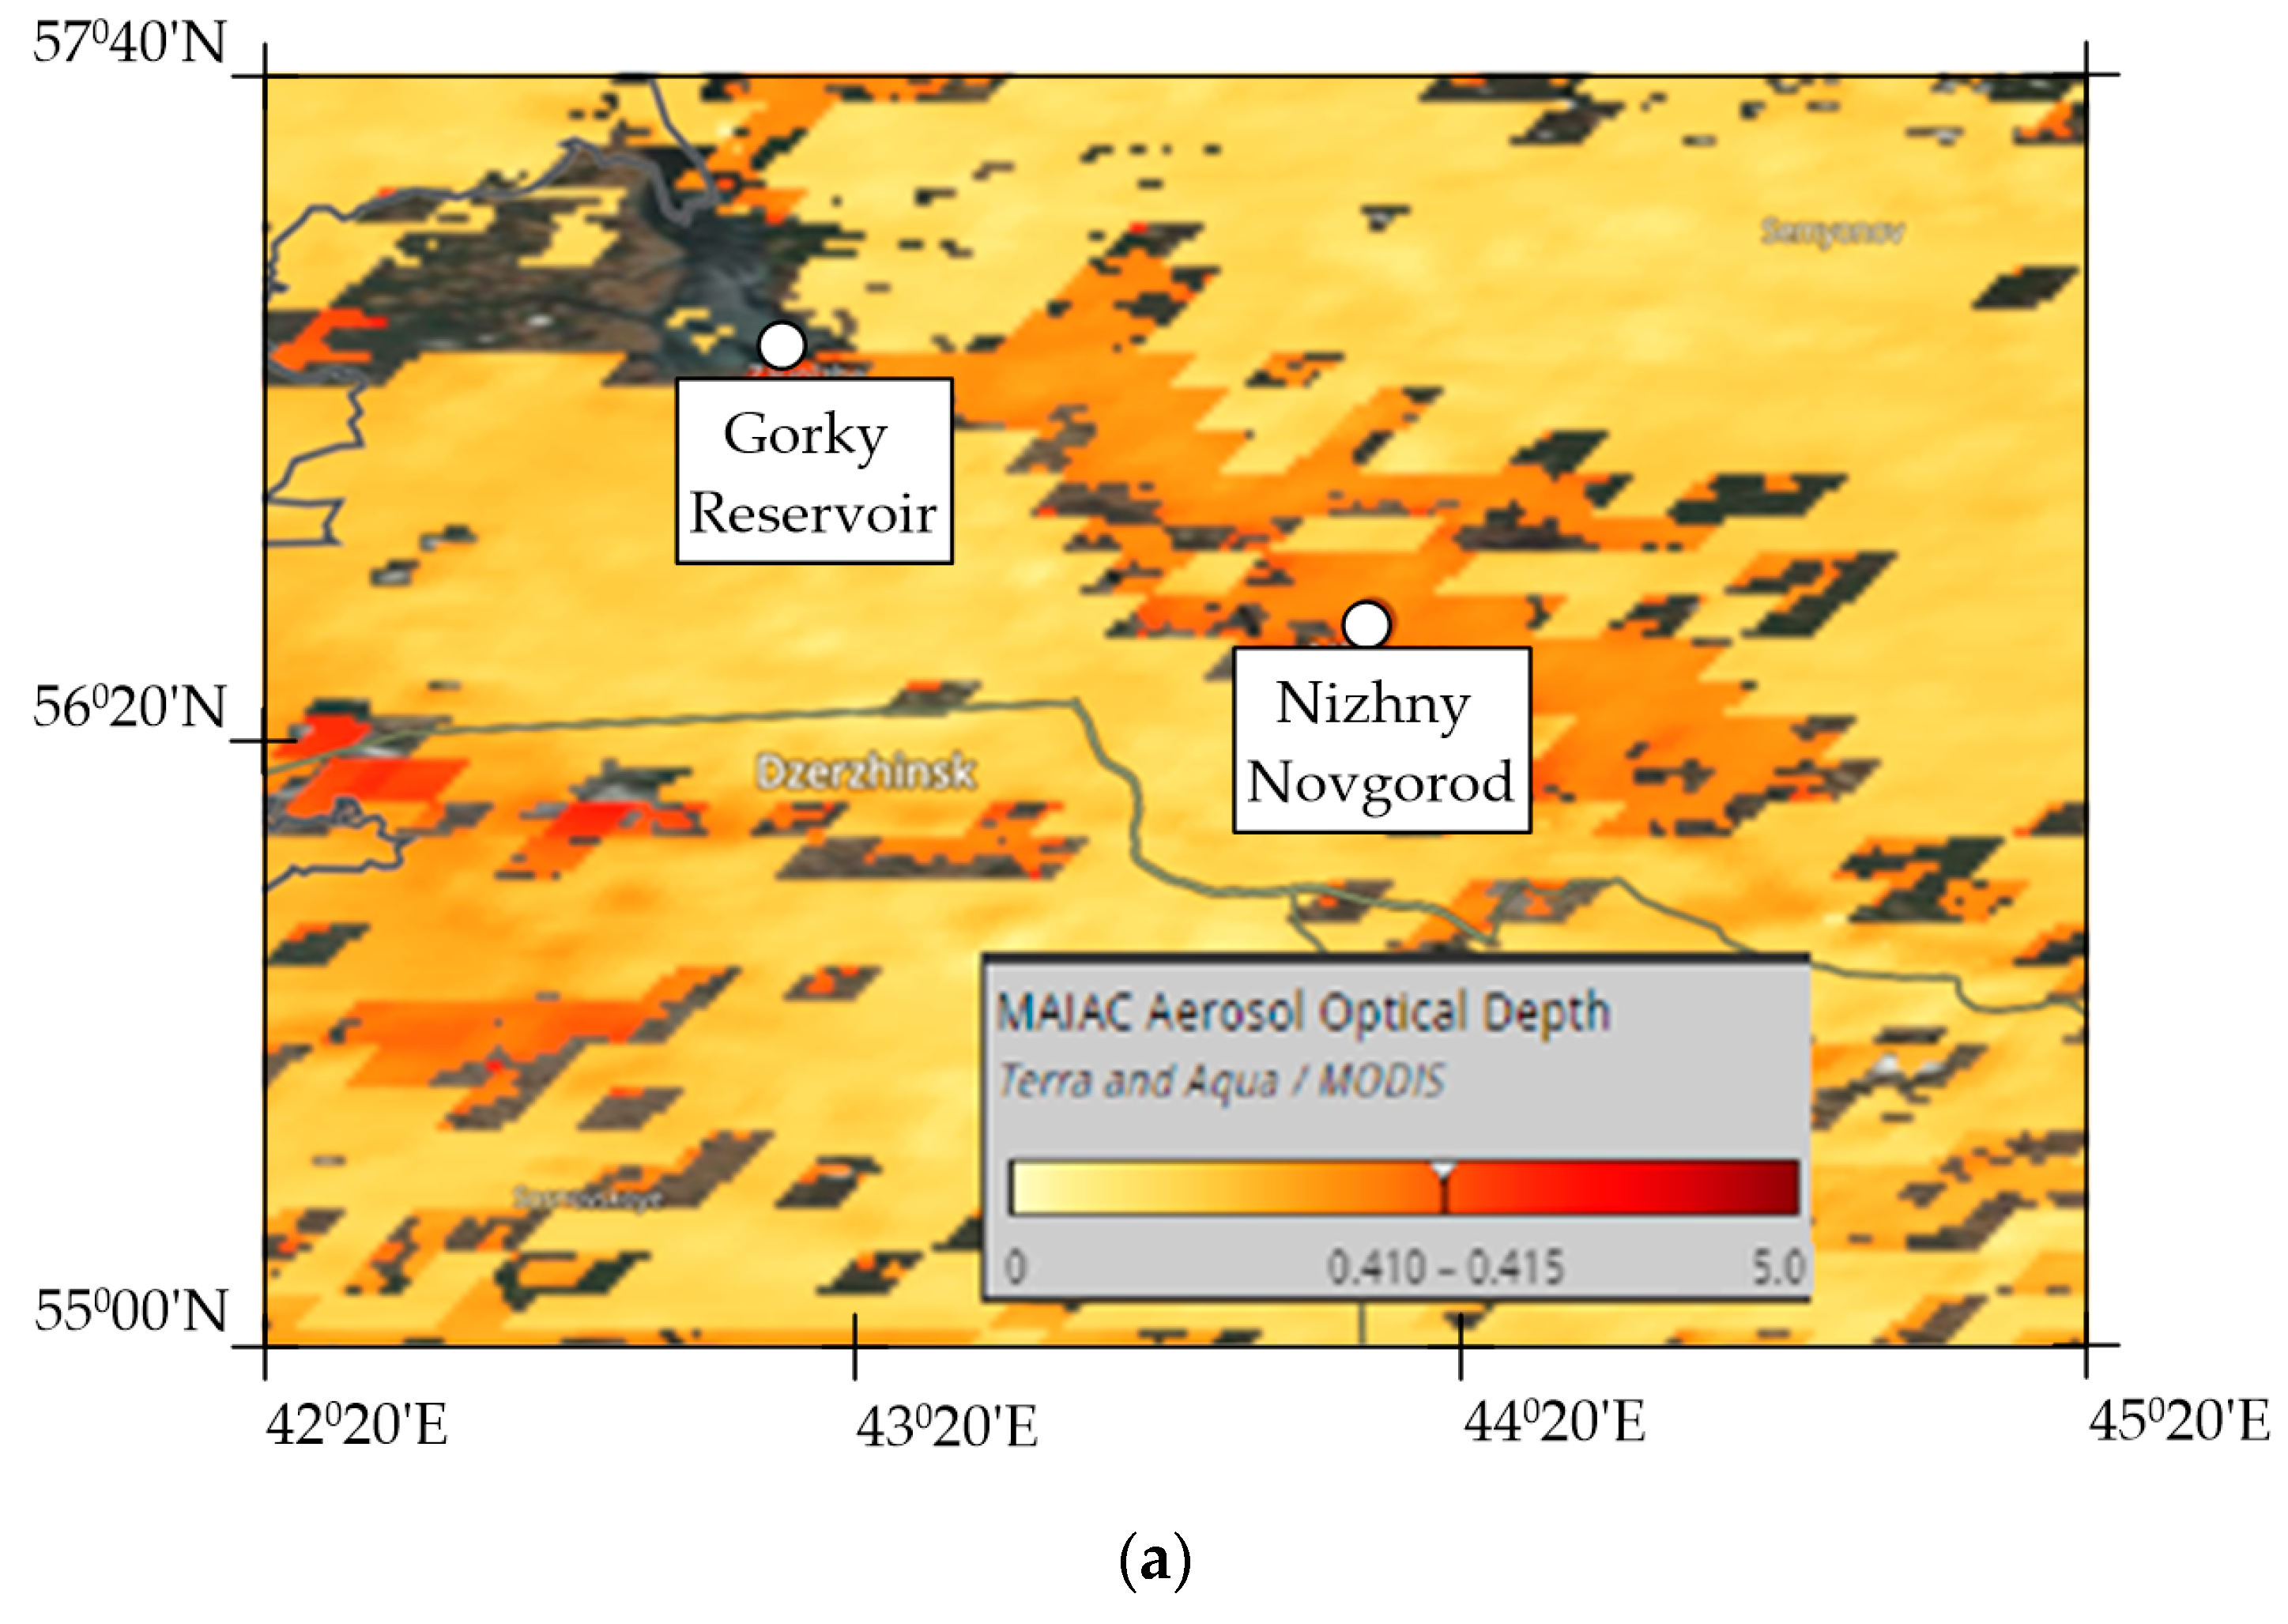
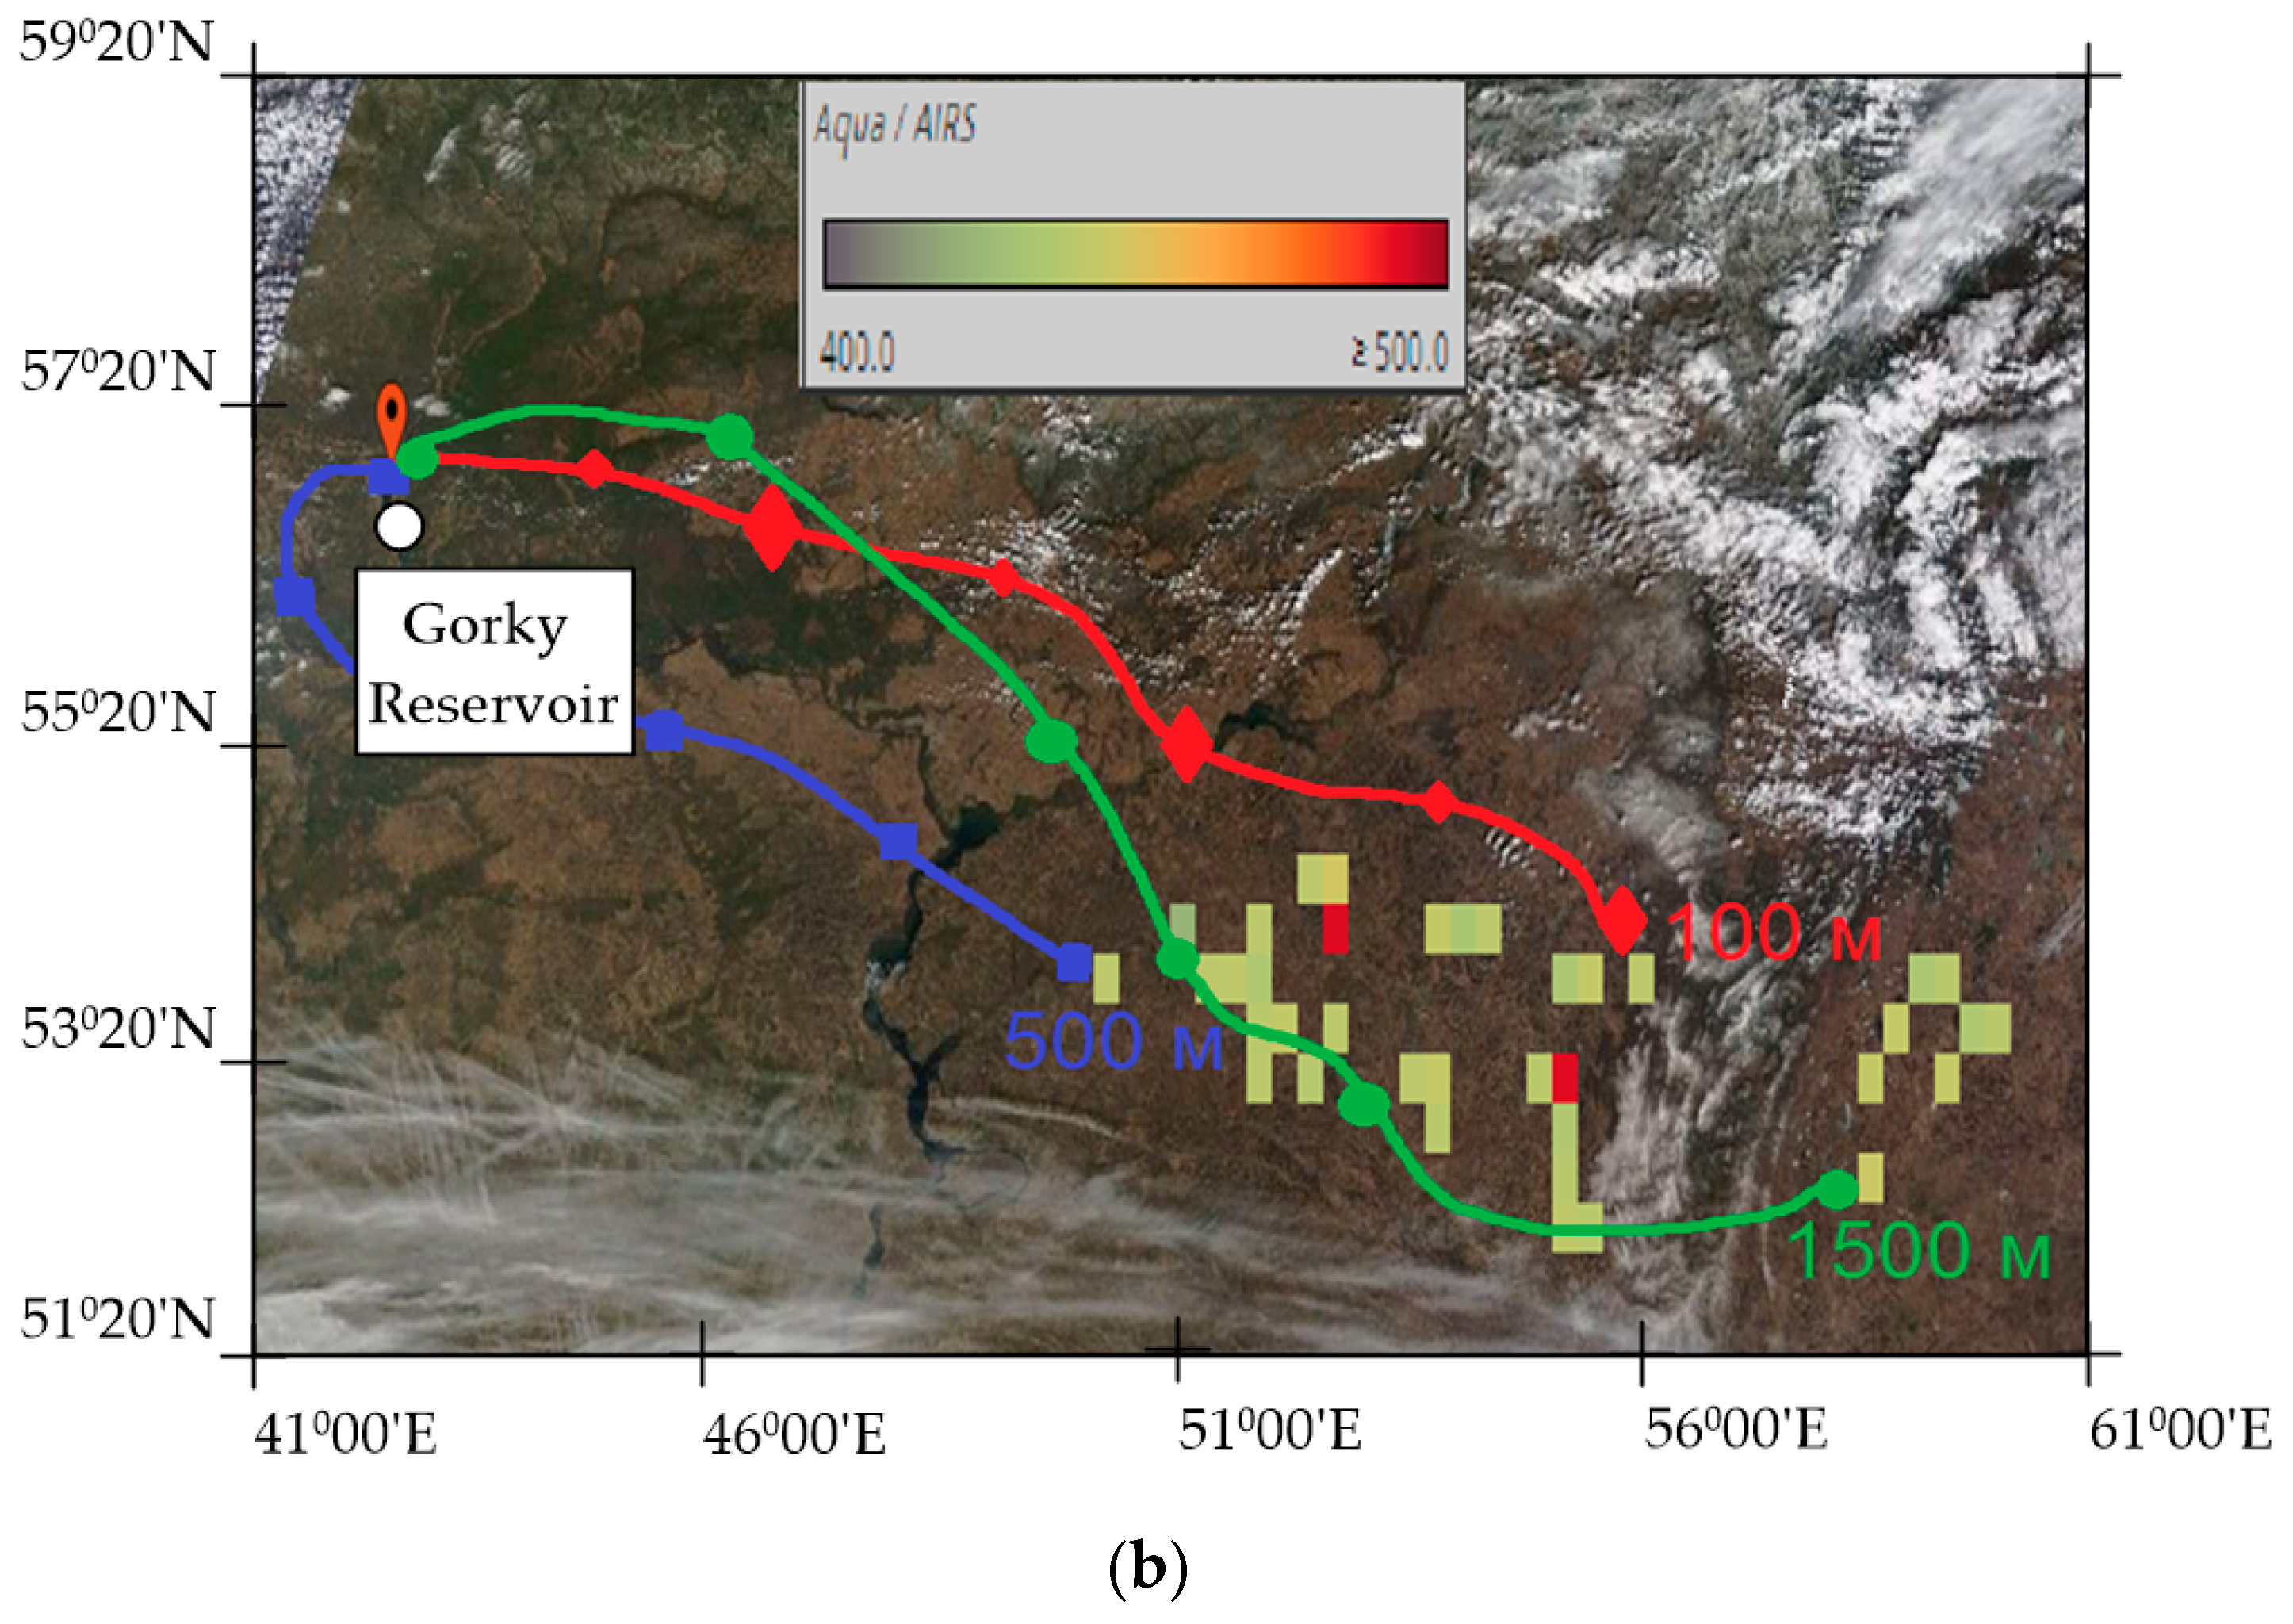
MAIAC data also showed high AOD values ranging from 0.410 to 0.415 both over the Gorky Reservoir and over Nizhny Novgorod (Figure 7a). Using the HYSPLIT software package, a simulation of the back trajectories of airflow movement was performed; the time when the maximum values of AOD were obtained (14:00) was chosen as the simulation start time. As can be seen from Figure 7b, the transfer area coincides with the area where the AIRS MODIS Aqua algorithms identified an area of dust presence; thus, the optical characteristics obtained for this date can be typified as dust aerosol over the Nizhny Novgorod region.
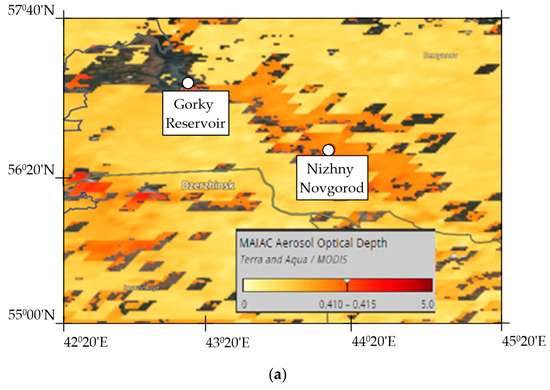

Figure 7.
(a) MAIAC satellite aerosol optical depth data and (b) results of HYSPLIT five-day back trajectory modeling based on MODIS satellite images and dust loading AIRS Dust Score parameter data for 12 April 2023.
An analysis of the contribution of coarse and fine aerosols to the total distribution of AOD(500) showed that the high values were due to a large number of small particles (the coarse fraction was 20% of the total distribution of the AOD), which was also confirmed by the values of the Ångström parameter (= 1.41). For 12 April 2023, the CALYPSO satellite was 200 km east of the Gorky reservoir. An analysis of these satellite data is worthwhile, despite the lack of data directly over the studied area, because the transfer of air flows was on this day from the east.
As can be seen from Figure 8, aerosols of polluted dust, as well as dust, smoke, and polluted continental aerosol, were detected in the largest amount over the CALIPSO fly trajectory area. This also confirms that the presence of dust aerosol over the Gorky Reservoir region led to an increase in AOD in the entire spectrum range.
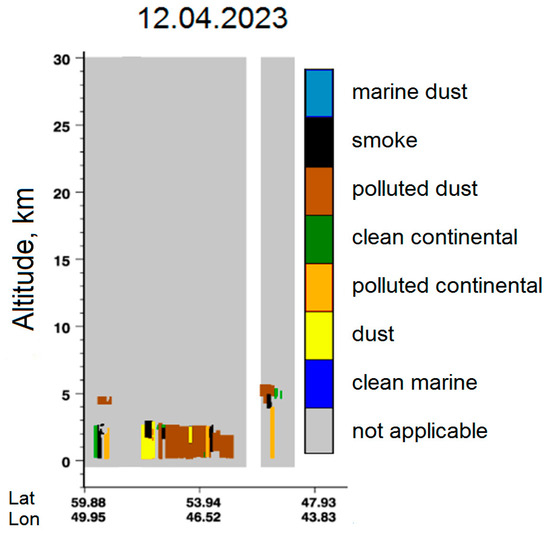
Figure 8.
Analysis of CALIPSO satellite data to determine the type of aerosol for 12 April 2023.
High AOD and values were also obtained at the end of April 2023. An analysis of modeling data and satellite data to determine the source of aerosol activity that affected the variability of the AOD during this period revealed neither dust transport nor intense fires, the smoke from which could move into the atmosphere of the studied region. However, the MAIAC data confirmed elevated (relative to background) AOD values, with values that were very close to the in situ measurements (Figure 9).
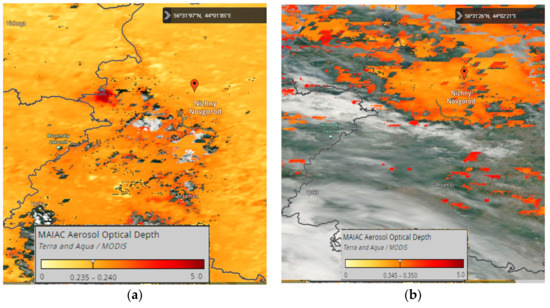
Figure 9.
MAIAC data on aerosol optical depth for (a) 24 August 2022; (b) 28 August 2022.
In the figure, the markers correspond to the coordinates where measurements were performed on those days, namely, on 24 April 2023 (56.31965N; 44.01846E) and 28 April 2023 (56.31626N; 44.02212E). The scale shows the range of AOD values that were obtained as a result of satellite measurements for the points with the given coordinates.
A statistical analysis of the number of days when the AOD was increased relative to the monthly average values showed 19 such days out of 131. Increased AOD values were observed when aerosols of smoke and dust were recorded in the atmosphere over the studied region, but cases of removal and anthropogenic aerosols were also obtained, as well as several cases where the aerosol activity source was not determined.
4. Conclusions
This paper presented the results of photometric measurements, MODIS data, and an analysis of aerosol optical depth for the period from April 2022 to April 2023 over the Gorky Reservoir and the Nizhny Novgorod region. The aerosol optical depth values were obtained for all sunny days to determine their background value, as well as to obtain the optical characteristics of dust and smoke aerosols over the region. Based on the results obtained for April 2022–2023 via measurements and satellite data, cases of dust transfer on 13 April 2022 and 14 April 2023 and the presence of smoke aerosol in the atmosphere over the studied region in the summer of 2022 were revealed.
The analysis also revealed cases with the presence of desert dust over the Gorky Reservoir using the in situ measured AOD, Angström exponent, and satellite (MAIAC and CALIPSO) data. This finding is essential for the development of atmospheric correction algorithms for remote sensing data over highly productive waters in the Gorky Reservoir. In addition, desert dust could directly influence the surface water temperature in freshwater lakes (causing a decrease due to dust radiative effects or even a noticeable increase) and the absolute atmospheric humidity over inland water areas [23].
Author Contributions
Conceptualization, D.K. and A.M.; validation, D.K. and A.M.; data curation, A.M.; writing—original draft preparation, D.K.; writing—review and editing, D.K. and A.M., project administration, A.M. All authors have read and agreed to the published version of the manuscript.
Funding
This research was funded by the Federal Academic Leadership Program “Priority-2030” of Lobachevsky State University of Nizhny Novgorod (theme No. N-468-99_2021-2023) regarding to environmental assessments over the Gorky Reservoir of the upper Volga and by grant of Russian Science Foundation, 23-17-00071, https://rscf.ru/en/project/23-17-00071/ (accessed on 15 August 2023), regarding to investigation of variations of aerosol parameters to create regional atmospheric correction algorithms and bio-optical models for the Cheboksary Reservoir of the middle Volga.
Data Availability Statement
The in situ data presented in this study are available on request from the corresponding author. The used satellite data is open-access data.
Acknowledgments
The authors express their gratitude to Sakerin S.M. and Kabanov D.M. for providing the SPM photometer and its software and also to George Leshchev for in situ measurements.
Conflicts of Interest
The authors declare no conflict of interest or state.
References
- Mamatalieva, F.T.; Smailov, E.A. Results of coal research in order to reduce emissions of pollutants. Bulletin of Osh State University. Chemistry. Biology. Geogr. 2023, 1, 41–45. [Google Scholar]
- Kaplan, A.L. Natural, Technogenic Environmental Safety at Industrial and Household Facilitiesc; TSU: Togliatti, Russia, 2010; 172 p. [Google Scholar]
- Koposov, E.V.; Paleev, A.V.; Sobol, S.V.; Vinogradova, T.P.; Kashchenko, O.V.; Kataeva, I.V.; Vinogradov, M.A. Environmentally Safe, Sustainable Development of the Volga Basin: Aspects of International Scientific Cooperation; NNGASU: Nizhny Novgorod, Russia, 2008; 178 p. [Google Scholar]
- Holben, B.N.; Eck, T.F.; Slutsker, I.; Tanré, D.; Buis, J.P.; Setzer, A.; Vermote, E.; Reagan, J.A.; Kaufman, Y.J.; Nakajima, T.; et al. Aeronet—A Federated Instrument Network and Data Archive for Aerosol Characterization. Remote Sens. Environ. 1998, 66, 1–16. [Google Scholar] [CrossRef]
- Kalinskaya, D.V.; Molkov, A.A.; Aleskerova, A.A. Investigation of optical characteristics over the Gorky reservoir in the summer seasons of 2016 and 2017. Mod. Probl. Remote Sens. Earth Space 2019, 16, 216–222. [Google Scholar] [CrossRef]
- Molkov, A.; Fedorov, S.; Pelevin, V. Toward Atmospheric Correction Algorithms for Sentinel-3/OLCI Images of Productive Waters. Remote Sens. 2022, 14, 3663. [Google Scholar] [CrossRef]
- Gordon, H.R.; Wang, M. Retrieval of water-leaving radiance and aerosol optical thickness over the oceans with SeaWiFS: A preliminary algorithm. Appl. Opt. 1994, 33, 443–452. [Google Scholar] [CrossRef] [PubMed]
- Ruddick, K.G.; Ovidio, F.; Rijkeboer, M. Atmospheric correction of SeaWiFS imagery for turbid coastal and inland waters. Appl. Opt. 2000, 39, 897–912. [Google Scholar] [CrossRef] [PubMed]
- The European Space Agency. Available online: https://sentinel.esa.int/web/sentinel/technical-guides/sentinel-3-olci/level-2/ocean-processing (accessed on 29 October 2023).
- Fedorov, S.; Molkov, A.; Kalinskaya, D. Aerosol Optical Properties above Productive Waters of Gorky Reservoir for Atmospheric Correction of Sentinel-3/OLCI Images. Remote Sens. 2022, 14, 6130. [Google Scholar] [CrossRef]
- Sakerin, S.M.; Kabanov, D.M.; Rostov, A.P.; Turchinovich, S.A.; Knyazev, V.V. Sun photometers for measuring spectral air transparency in stationary and mobile conditions. Atmos. Ocean. Opt. 2013, 26, 352–356. [Google Scholar] [CrossRef]
- Sakerin, S.M.; Kabanov, D.M. Fine and coarse components of atmospheric aerosol optical depth in maritime and Polar regions. Atmos. Ocean. 2015, 28, 510–517. [Google Scholar] [CrossRef]
- Sakerin, S.M.; Kabanov, D.M. Correlations between the parameters of Ångström formula and aerosol optical depth of the atmosphere in the wavelength range from 1 to 4 μm. Atmos. Ocean. Opt. 2007, 20, 200–206. [Google Scholar]
- Kaskaoutis, D.G.; Kambezidis, H.D.; Hatzianastassiou, N.; Kosmopoulos, P.G.; Badarinath, K.V.S. Aerosol climatology: Dependence of the Ångström exponent on wavelength over four AERONET sites. Atmos. Chem. Phys. Discuss. 2007, 7, 7347–7397. [Google Scholar]
- Kondratiev, K.Y.; Pozdnyakov, D.V. Aerosol Models of the Atmosphere. Aerozol’nye Modeli Atmosfery; Nauka: Moscow, Russia, 1981; 102 p. [Google Scholar]
- Lyapustin, A.; Wang, Y. MODIS Multi-Angle Implementation of Atmospheric Correction (MAIAC) Data User’s Guide. 2018. Available online: https://lpdaac.usgs.gov/documents/110/MCD19_User_Guide_V6.pdf (accessed on 15 August 2023).
- Lyapustin, A.; Wang, Y. MAIAC-multi-angle implementation of atmospheric correction for MODIS. AGU Spring Meet. Abstr. 2007, 2007, A51B-05. [Google Scholar]
- Krasnoshchekov, K.V.; Yakubailik, O.E. Assessment of atmospheric air quality by satellite data. In Proceedings of the Conference Regional Problems of the Remote Sensing of the Earth, Krasnoyarsk, Russia, 29 September–2 October 2020; Siberian Federal University: Krasnoyarsk, Russia, 2020; pp. 236–239. [Google Scholar]
- Holben, B.N.; Tanre, D.; Smirnov, A. An emerging ground-based aerosol climatology: Aerosol Optical Depth from AERONET. J. Geophys. Res. 2001, 106, 12067–12097. [Google Scholar] [CrossRef]
- Kaufman, Y.J.; Holben, B.N.; Tanre, D. Will aerosol measurements from Terra and Aqua polar orbiting satellites represent the daily aerosol abundance and properties. Geophys. Res. Lett. 2000, 27, 3861–3864. [Google Scholar] [CrossRef]
- Kalinskaya, D.V.; Molkov, A.A. Research of the Main Optical Characteristics Spatiotemporal Variability of Atmospheric Aerosol over the Gorky Reservoir. In Proceedings of the IGARSS 2022–2022 IEEE International Geoscience and Remote Sensing Symposium, Kuala Lumpur, Malaysia, 17–22 July 2022; IEEE: Piscataway, NJ, USA, 2022; pp. 6510–6513. [Google Scholar]
- Wang, J.; Xia, X.; Wang, P. Diurnal variability of dust aerosol optical depth and Ångström exponent over dust source regions in China. Geophys. Res. Lett. 2004, 31, L08107. [Google Scholar] [CrossRef]
- Kishcha, P.; Lechinsky, Y.; Starobinets, B. Impact of a Severe Dust Event on Diurnal Behavior of Surface Water Temperature in Subtropical Lake Kinneret. Remote Sens. 2023, 15, 5297. [Google Scholar] [CrossRef]


Disclaimer/Publisher’s Note: The statements, opinions and data contained in all publications are solely those of the individual author(s) and contributor(s) and not of MDPI and/or the editor(s). MDPI and/or the editor(s) disclaim responsibility for any injury to people or property resulting from any ideas, methods, instructions or products referred to in the content. |
© 2023 by the authors. Licensee MDPI, Basel, Switzerland. This article is an open access article distributed under the terms and conditions of the Creative Commons Attribution (CC BY) license (https://creativecommons.org/licenses/by/4.0/).