
Detecting, Analyzing, and Predicting Land Use/Land Cover (LULC) Changes in Arid Regions Using Landsat Images, CA-Markov Hybrid Model, and GIS Techniques

 ,
,  , ,
, ,  , ,
, ,  and
and
Abstract
:1. Introduction
2. Materials and Methods
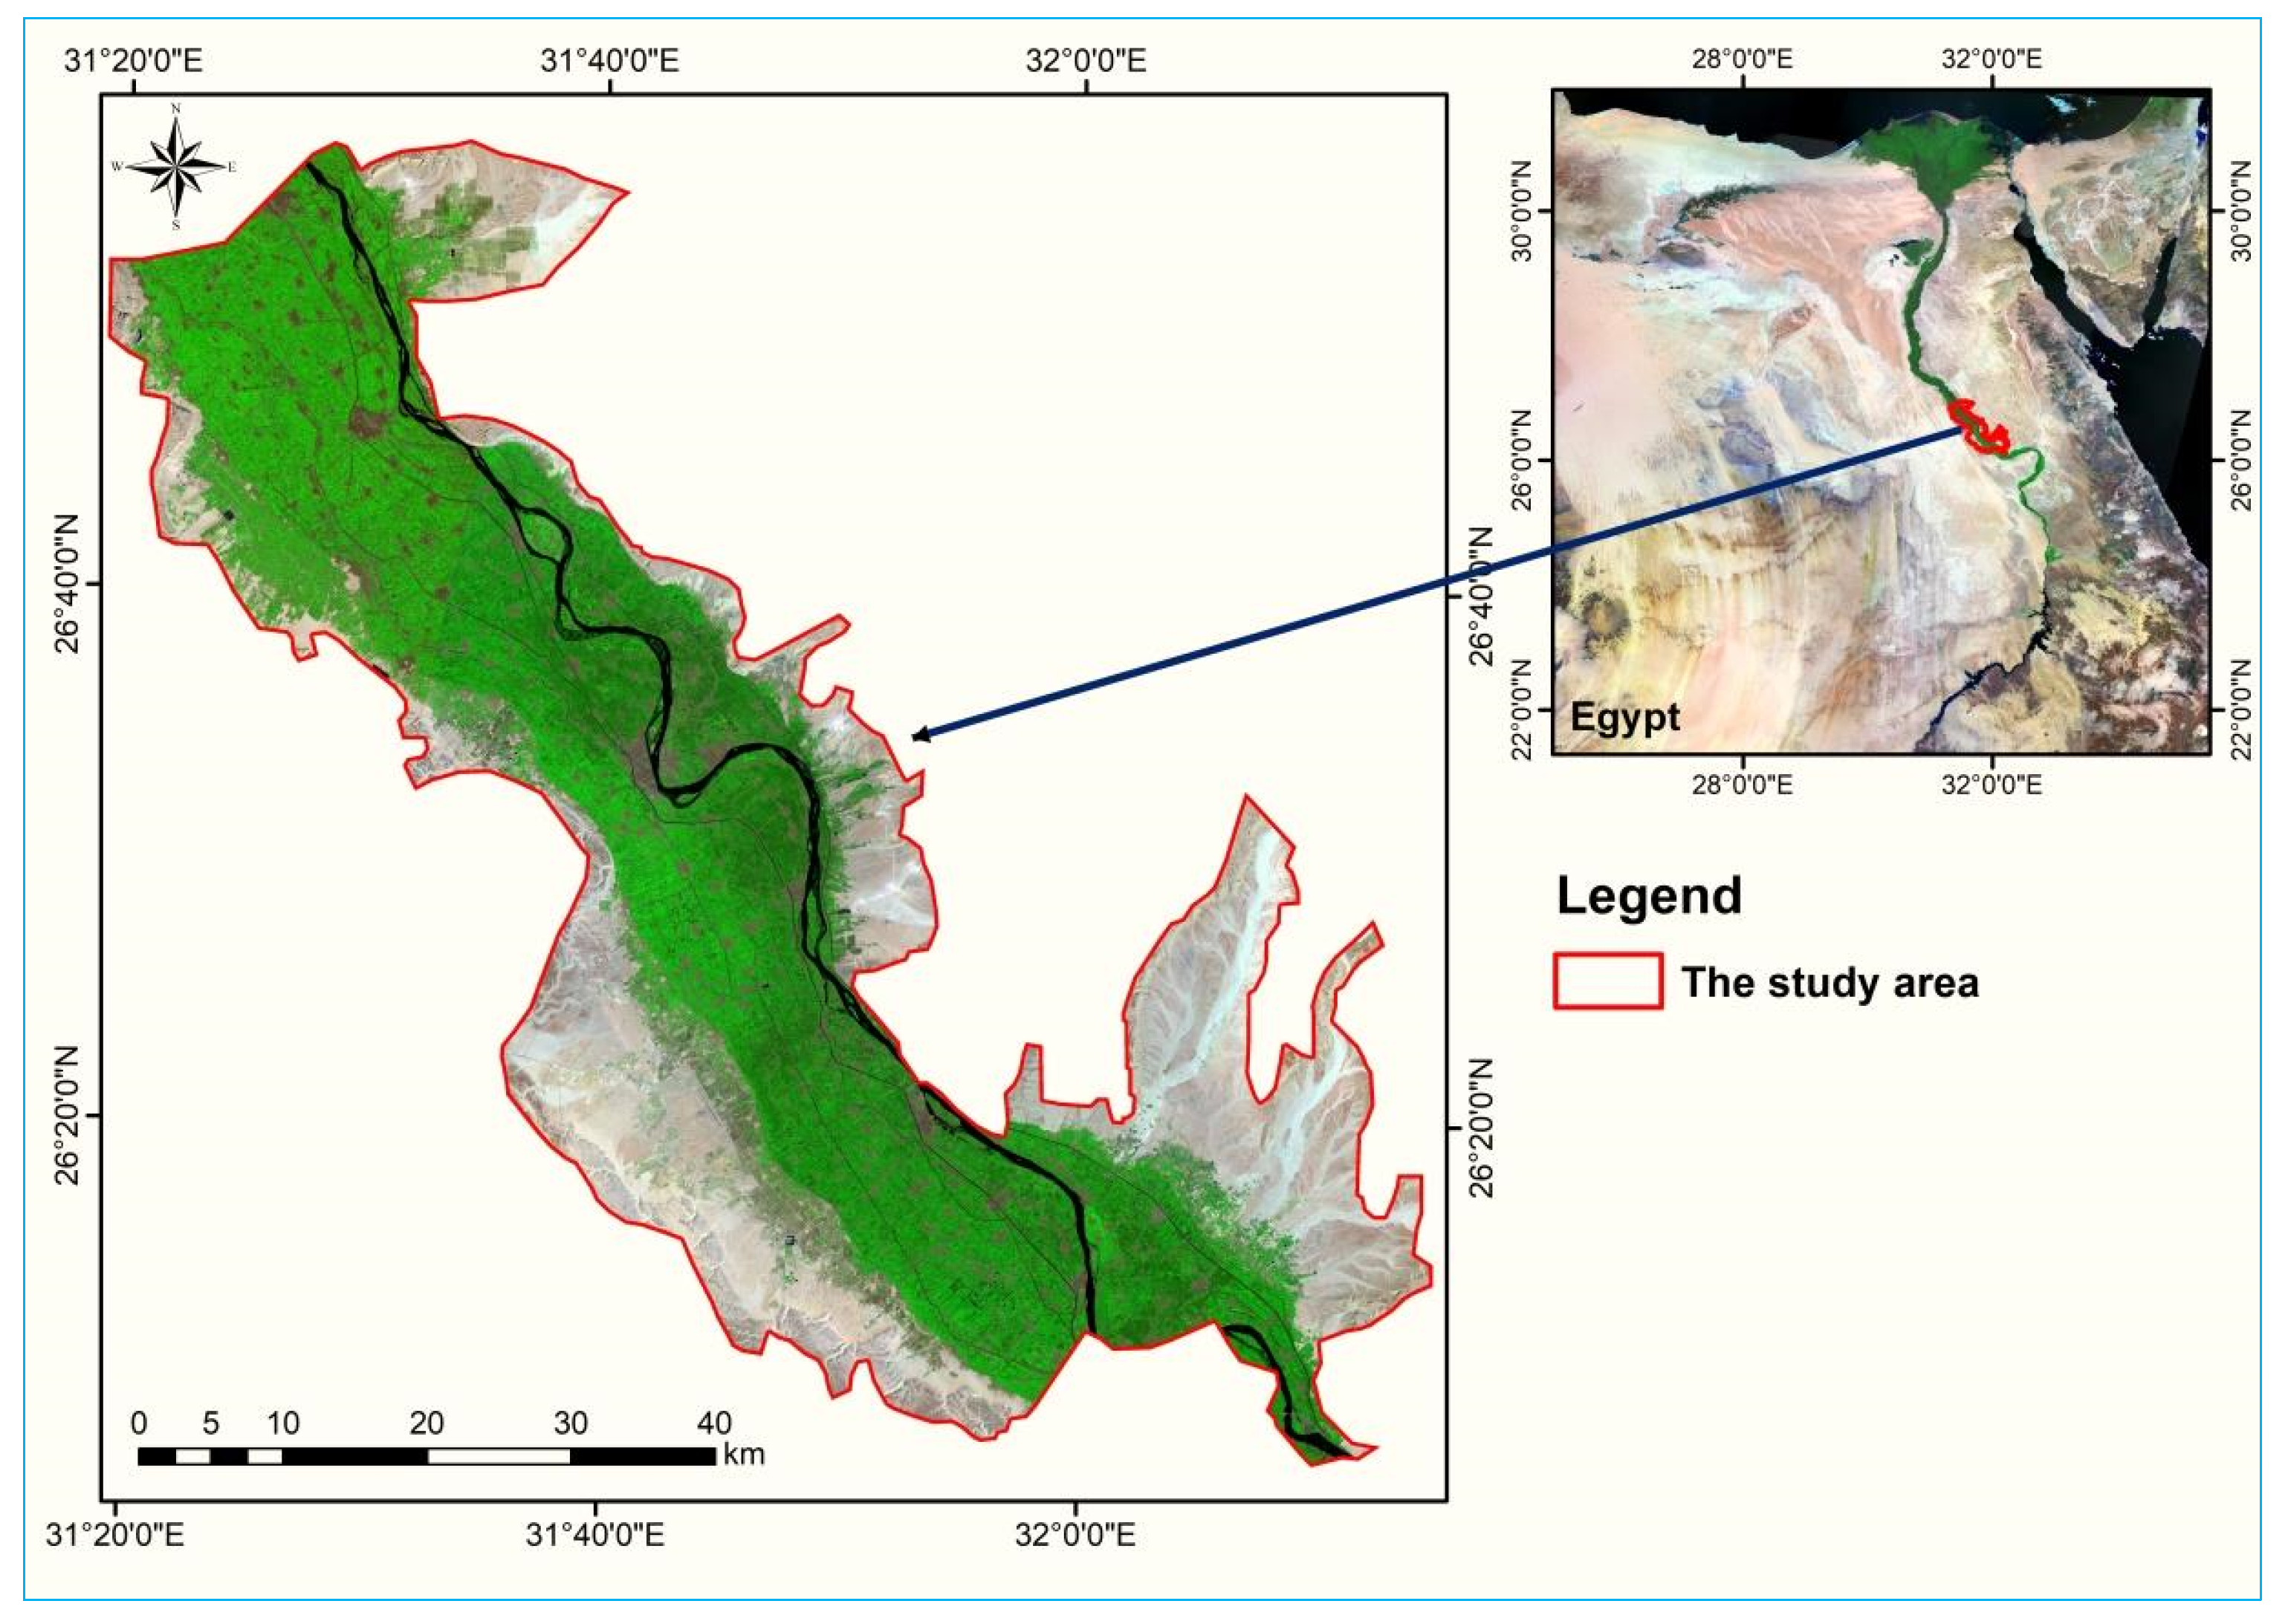
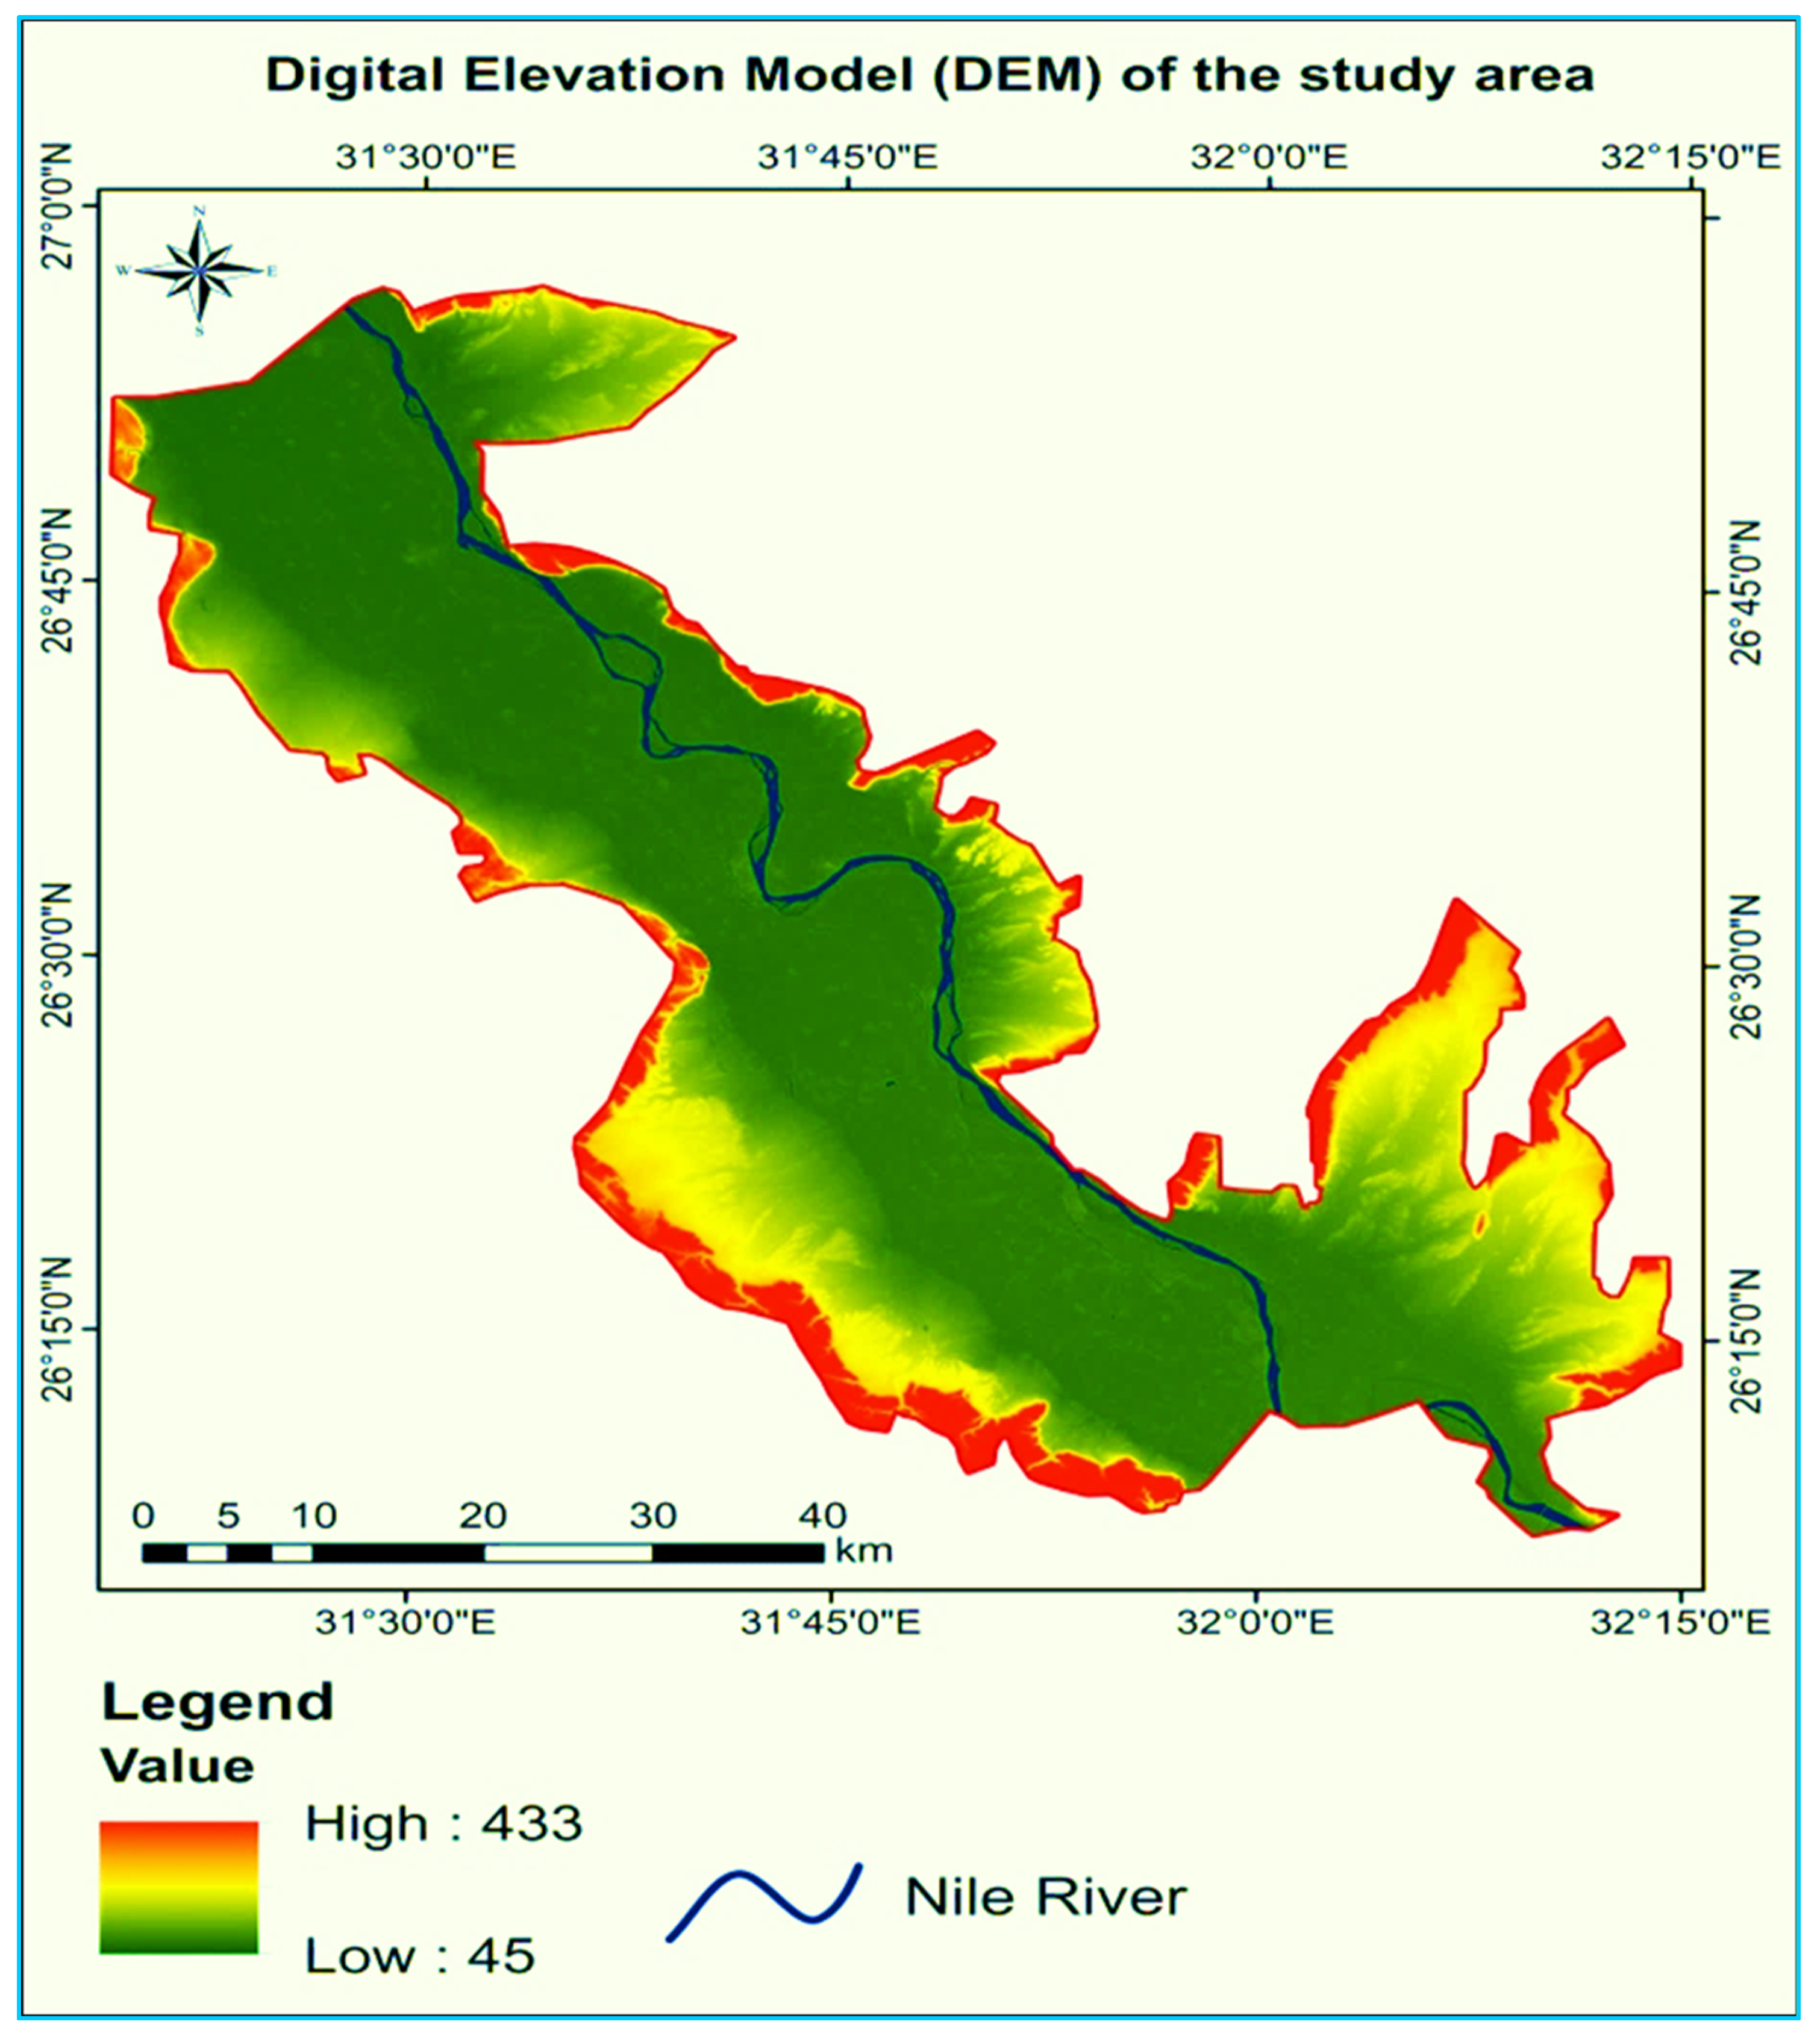
2.1. Study Area
2.2. Data Acquisition
2.3. Pre-Processing of Remote Sensing Data
2.4. Image Classification and Accuracy Assessment
2.5. LULC Change Analysis Using CA-Markov Modeling
2.6. Future LULC Prediction for 2030, 2040, and 2050
- The Markov chain model was used to compute transition probabilities matrices for 1984, 2002, 2013, and 2022;
- The computed transition matrices were used to generate a set of conditional probability data for the different land uses from 1984 to 2022;
- The transition probabilities matrices of 1984–2002, 2002–2013, and 2013–2022 for each LULC category, as well as conditional probability data and LULC, classified maps of 2013 and 2020, were integrated using the CA-Markov spatial operator in IDRISI 7.02 software, which is based on Markov chain analysis and multi-criteria evaluation (MCE), to simulate the LULC maps of 2030, 2040, and 2050;
- Predicted LULC maps for future dates were produced by overlapping the results obtained in the previous steps.
2.7. CA-Markov Model Validation
3. Results and Discussion
3.1. Accuracy Assessment of the LULC Classification
3.2. The LULC Classification
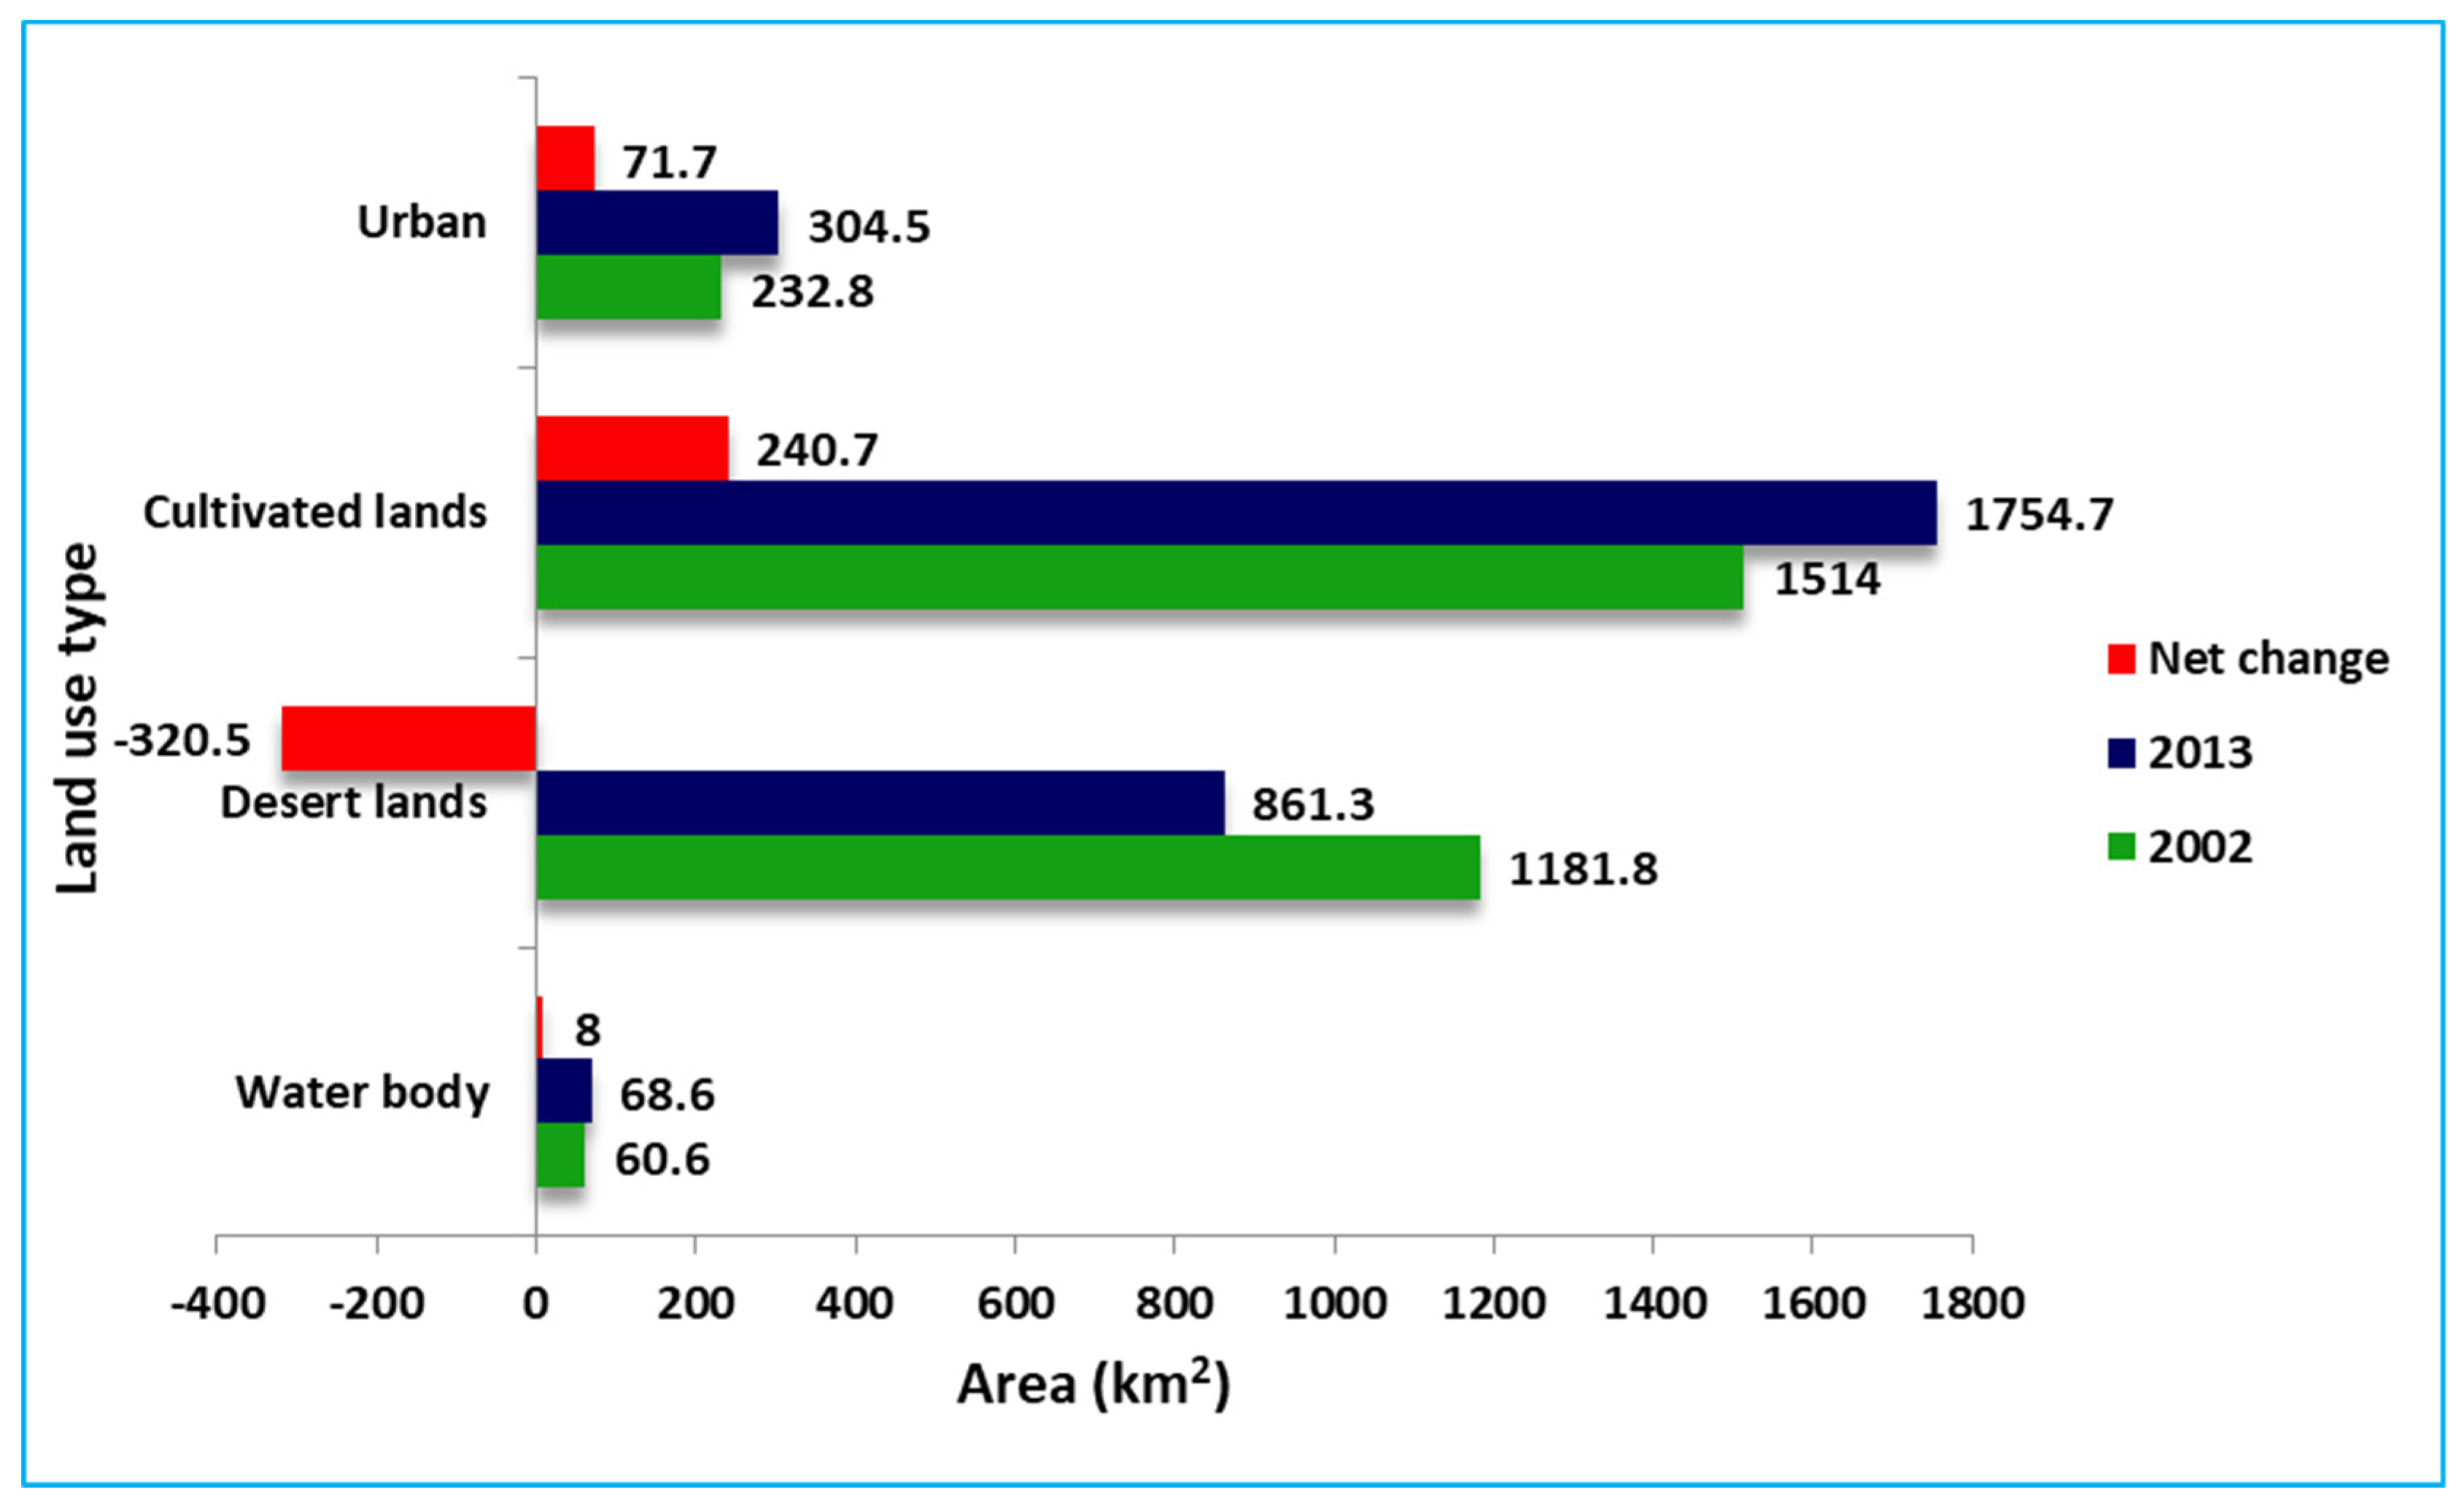
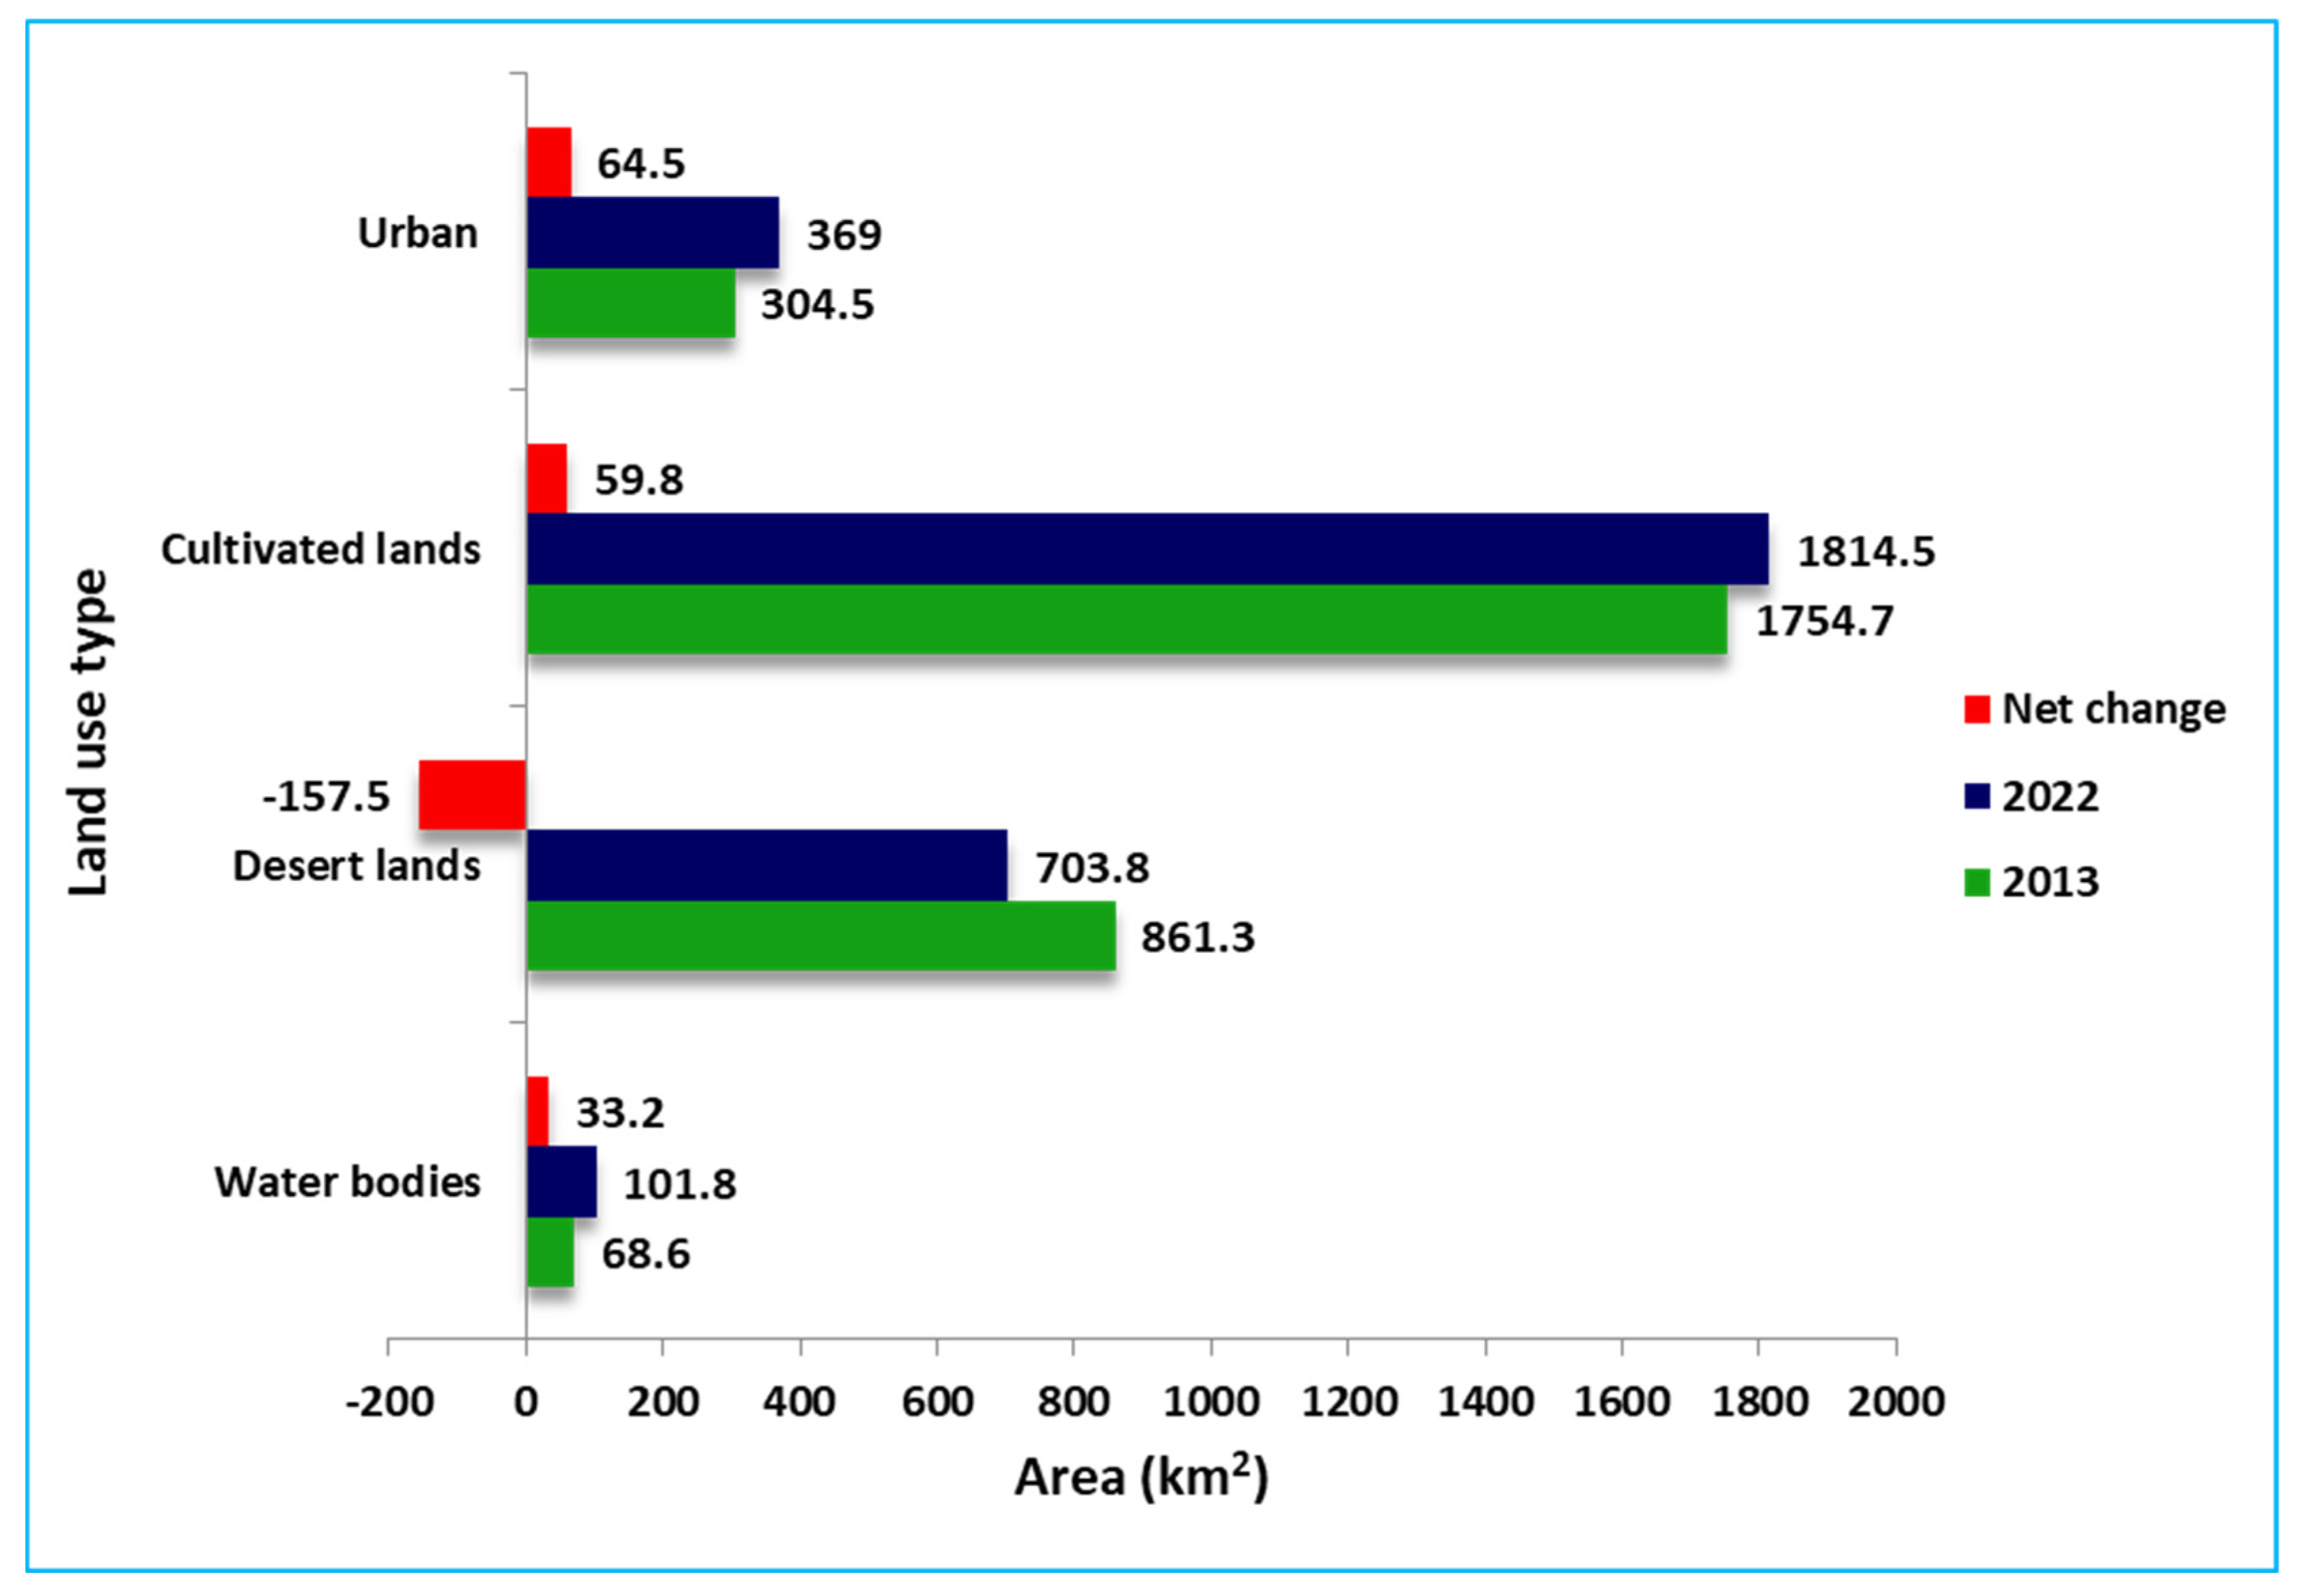
3.3. LULC Change Dynamics
3.4. Markov Chain Model Analysis
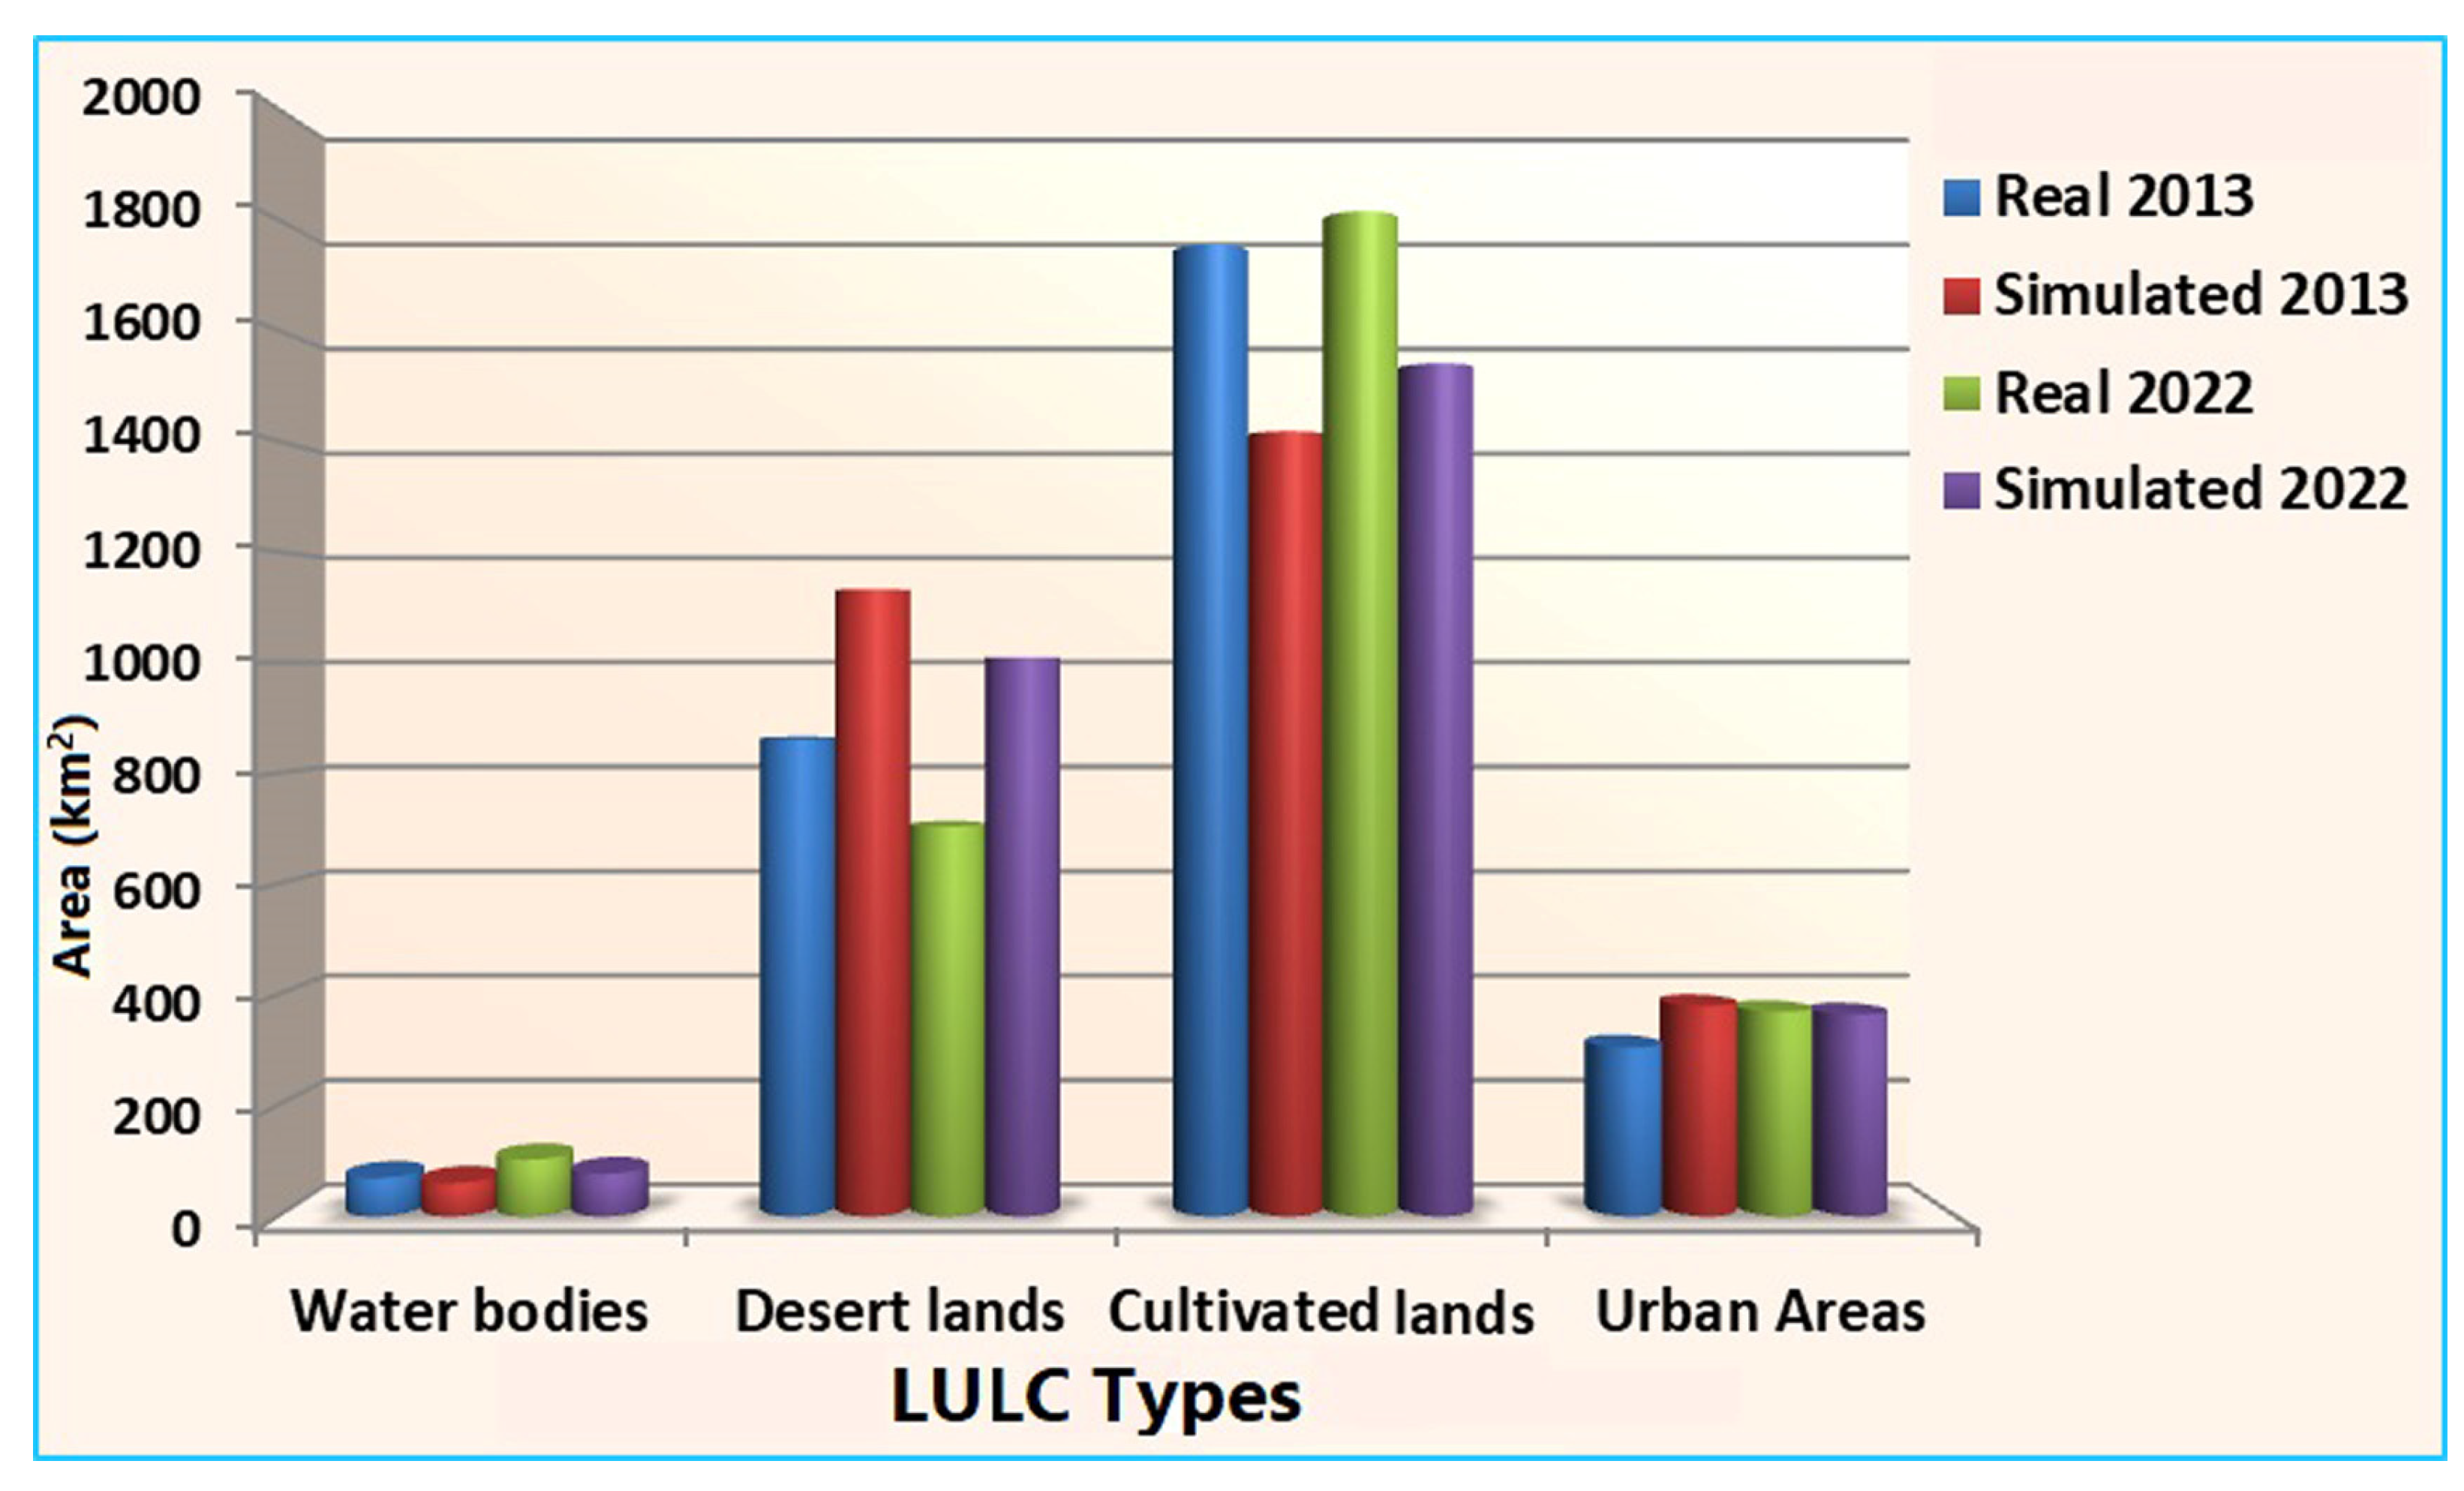
3.5. CA-Markov Model Validation for Predicting Future LULC Scenarios
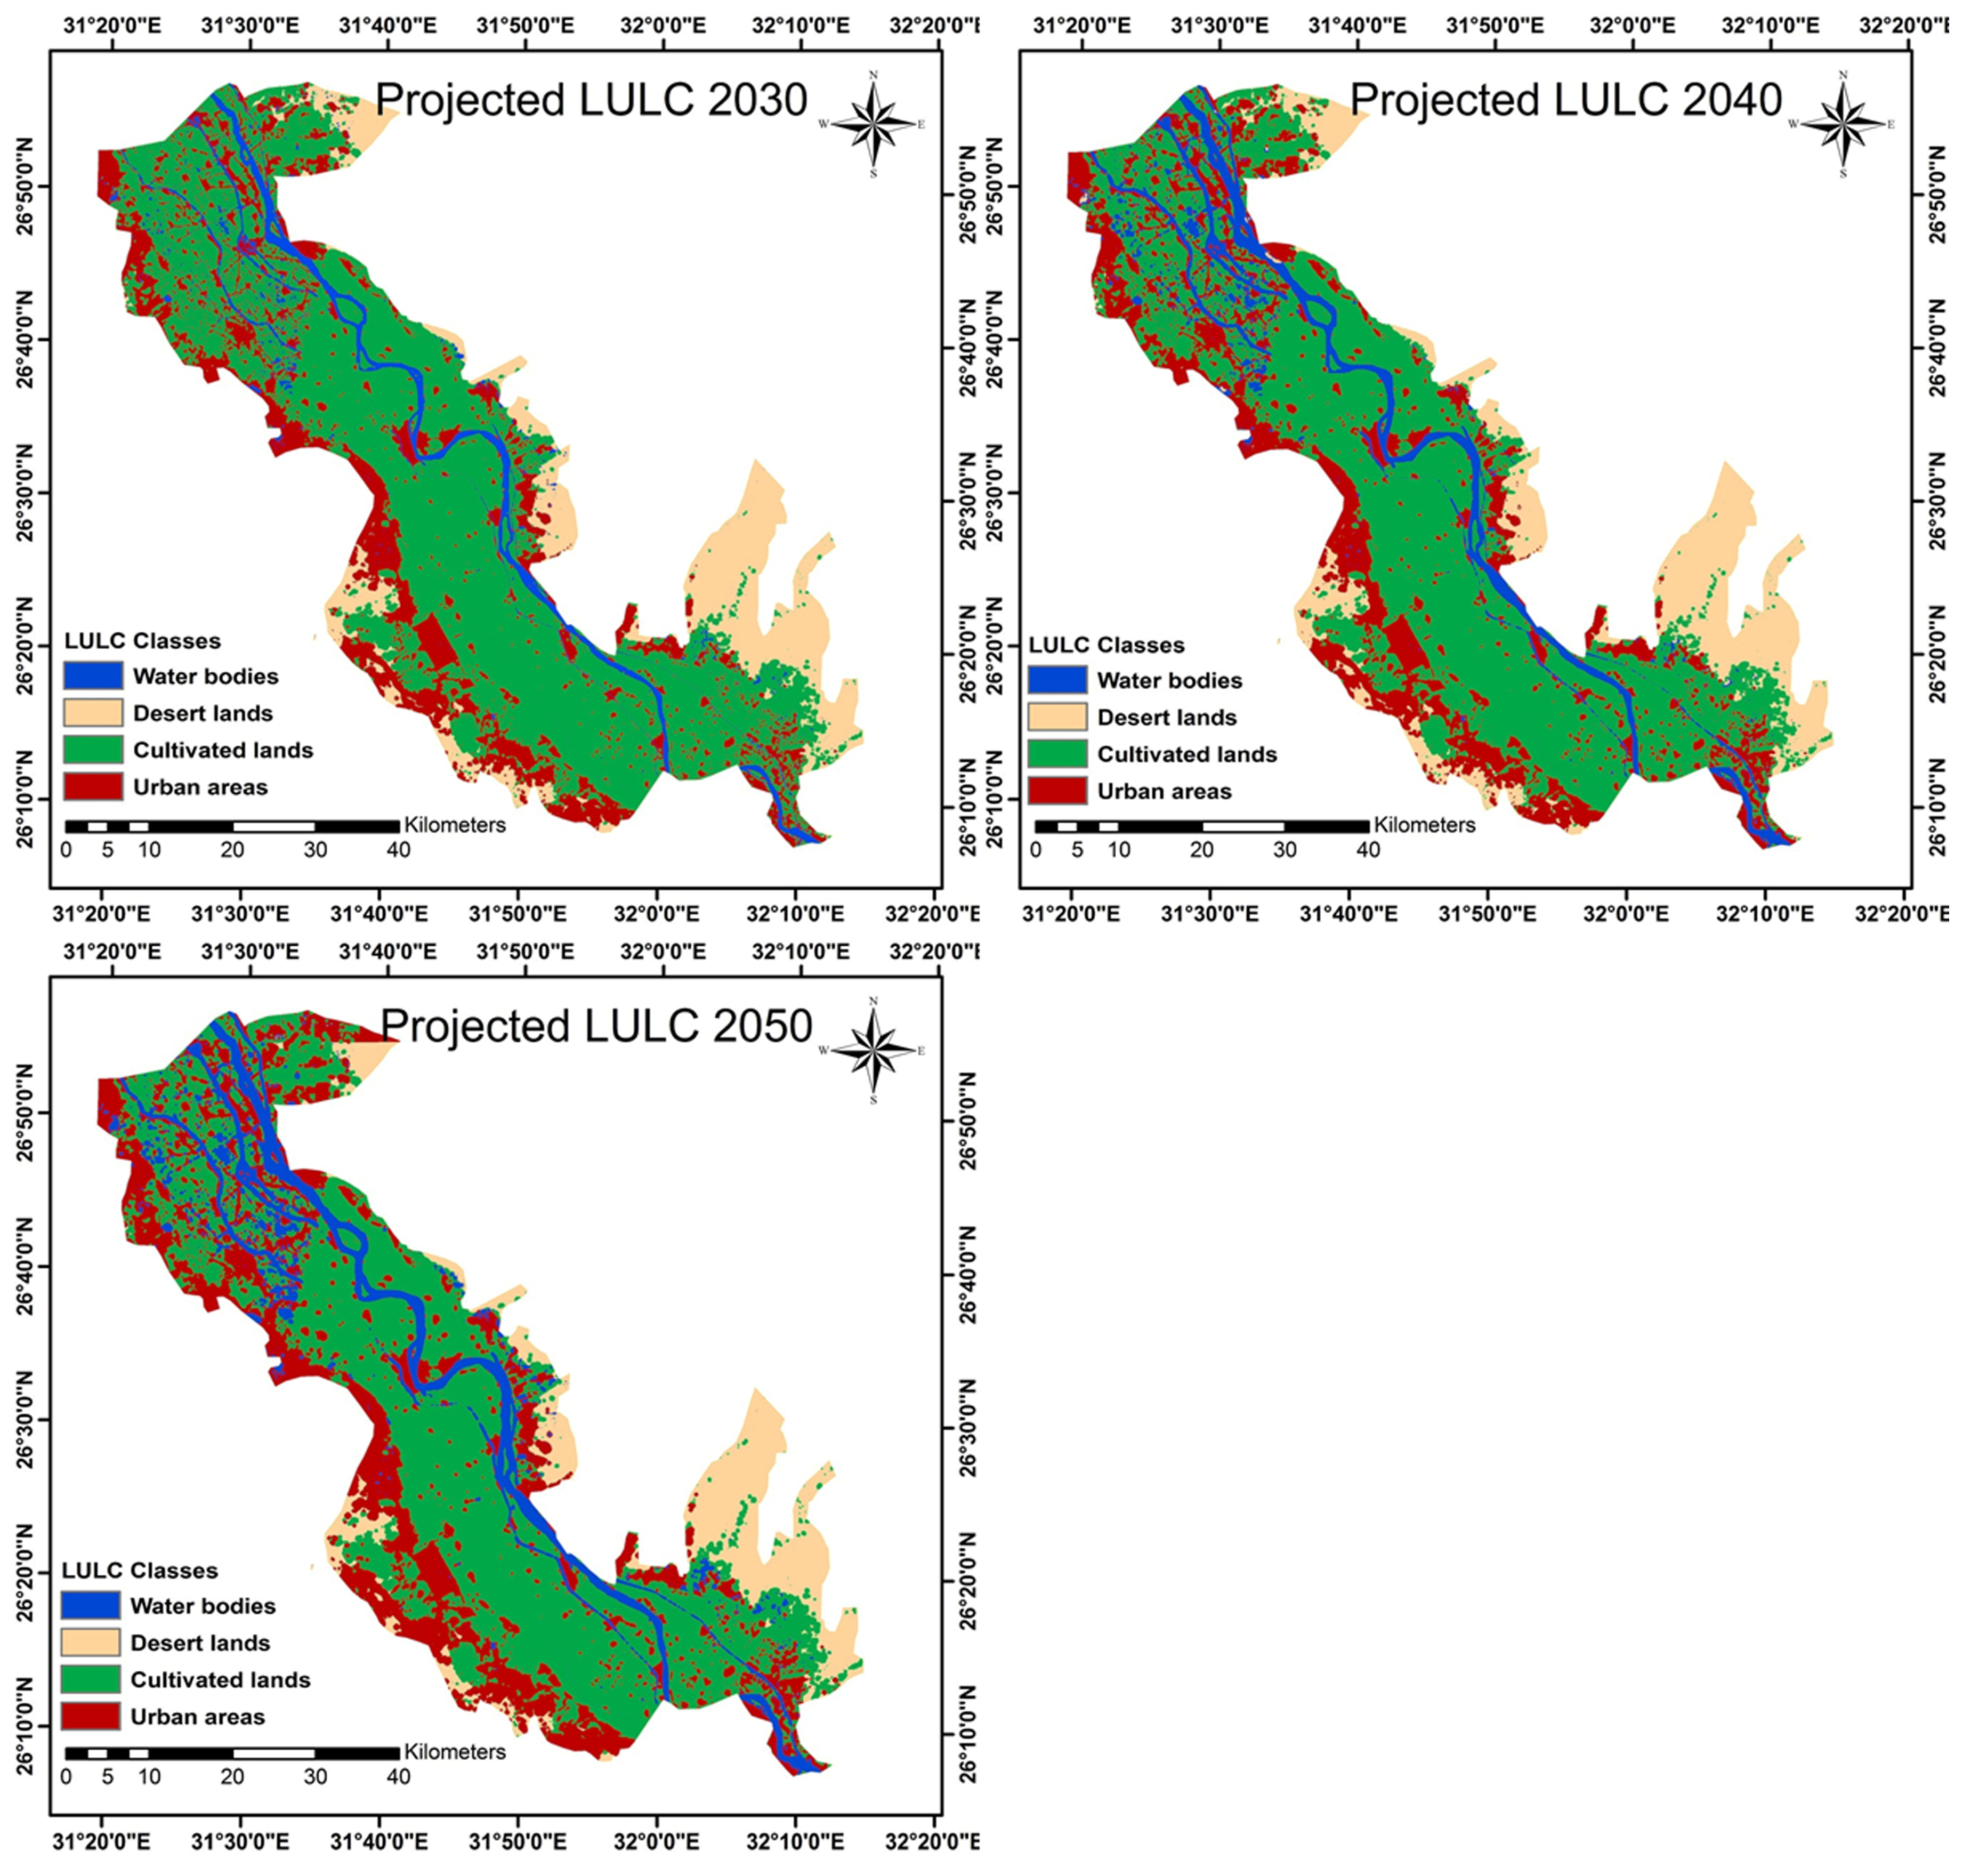
3.6. Prediction of the Future LULC Scenarios
4. Conclusions
Author Contributions
Funding
Data Availability Statement
Conflicts of Interest
References
- Biro, K.; Pradhan, B.; Buchroithner, M.; Makeschin, F. Land use/land cover change analysis and its impact on soil properties in the northern part of Gadarif region, Sudan. Land Degrad. Dev. 2013, 24, 90–102. [Google Scholar] [CrossRef]
- Ayele, A.; Tarekegn, K. The impact of urbanization expansion on agricultural land in Ethiopia: A review. Environ. Socio-Econ. Stud. 2020, 8, 73–80. [Google Scholar] [CrossRef]
- Abdulaziz, A.M.; Hurtado, J.M.; Al-Douri, R. Application of multitemporal Landsat data to monitor land cover changes in the Eastern Nile Delta region, Egypt. Int. J. Remote Sens. 2009, 30, 2977–2996. [Google Scholar] [CrossRef]
- FAO. The Future of Food and Agriculture: Trends and Challenges; FAO: Rome, Italy, 2017; ISBN 978-9-25109-551-5. [Google Scholar]
- Calicioglu, O.; Flammini, A.; Bracco, S.; Bellù, L.; Sims, R. The Future Challenges of Food and Agriculture: An Integrated Analysis of Trends and Solutions. Sustainability 2019, 11, 222. [Google Scholar] [CrossRef]
- Adepoju, M.O.; Millington, A.C.; Tansey, K.T. Land Use/Land Cover Change Detection in Metropolitan Lagos (Nigeria): 1984–2000. In Proceedings of the AASPRS 2006 Annual Conference, Reno, NV, USA, 1–5 May 2006. [Google Scholar]
- Zabihi, M.; Moradi, H.; Gholamalifard, M.; Khaledi Darvishan, A.; Fürst, C. Landscape Management through Change Processes Monitoring in Iran. Sustainability 2020, 12, 1753. [Google Scholar] [CrossRef]
- Dadashpoor, H.; Azizi, P.; Moghadasi, M. Analyzing spatial patterns, driving forces and predicting future growth scenarios for supporting sustainable urban growth: Evidence from Tabriz metropolitan area, Iran. Sustain. Cities Soc. 2019, 47, 101502. [Google Scholar] [CrossRef]
- Dewan, A.M.; Yamaguchi, Y.; Ziaur Rahman, M. Dynamics of land use/cover changes and the analysis of landscape fragmentation in Dhaka Metropolitan, Bangladesh. GeoJournal 2012, 77, 315–330. [Google Scholar] [CrossRef]
- Liu, J.; Zhang, Z.; Xu, X.; Kuang, W.; Zhou, W.; Zhang, S.; Li, R.; Yan, C.; Yu, D.; Wu, S.; et al. Spatial patterns and driving forces of land use change in China during the early 21st century. J. Geogr. Sci. 2010, 20, 483–494. [Google Scholar] [CrossRef]
- Shi, G.; Jiang, N.; Yao, L. Land Use and Cover Change during the Rapid Economic Growth Period from 1990 to 2010: A Case Study of Shanghai. Sustainability 2018, 10, 426. [Google Scholar] [CrossRef]
- Cihlar, J. Land cover mapping of large areas from satellites: Status and research priorities. Int. J. Remote Sens. 2000, 21, 1093–1114. [Google Scholar] [CrossRef]
- Wang, S.Q.; Zheng, X.; Zang, X. Accuracy assessments of land use change simulation based on Markov-cellular automata model. Procedia Environ. Sci. 2012, 13, 1238–1245. [Google Scholar] [CrossRef]
- Yan, W.Y.; Shaker, A.; El-Ashmawy, N. Urban land cover classification using airborne LiDAR data: A review. Remote Sens. Environ. 2015, 158, 295–310. [Google Scholar] [CrossRef]
- Karki, S.; Thandar, A.M.; Uddin, K.; Tun, S.; Aye, W.M.; Aryal, K.; Kandel, P.; Chettri, N. Impact of land use land cover change on ecosystem services: A comparative analysis on observed data and people’s perception in Inle Lake, Myanmar. Environ. Syst. Res. 2018, 7, 25. [Google Scholar] [CrossRef]
- Long, H.; Tang, G.; Li, X.; Heilig, G.K. Socio–economic driving forces of land–use change in Kunshan, the Yangtze River Delta economic area of China. J. Environ. Manag. 2007, 83, 351–364. [Google Scholar] [CrossRef] [PubMed]
- Ning, J.; Liu, J.; Kuang, W.; Xu, X.; Zhang, S.; Yan, C.; Li, R.; Wu, S.; Hu, Y.; Du, G.; et al. Spatiotemporal patterns and characteristics of land-use change in China during 2010–2015. J. Geogr. Sci. 2018, 28, 547–562. [Google Scholar] [CrossRef]
- Prestele, R.; Alexander, P.; Rounsevell, M.D.A.; Arneth, A.; Calvin, K.; Doelman, J.; Eitelberg, D.A.; Engstrom, K.; Fujimori, S.; Hasegawa, T.; et al. Hotspots of uncertainty in land-use and land-cover change projections: A global-scale model comparison. Glob. Change Biol. 2016, 22, 3967–3983. [Google Scholar] [CrossRef]
- Srivastava, P.K.; Han, D.; Rico-Ramirez, M.A.; Bray, M.; Islam, T. Selection of classification techniques for land use/land cover change investigation. Adv. Space Res. 2012, 50, 1250–1265. [Google Scholar] [CrossRef]
- Degife, A.W.; Zabel, F.; Mauser, W. Assessing land use and land cover changes and agricultural farmland expansions in Gambella Region, Ethiopia, using Landsat 5 and Sentinel 2a multispectral data. Heliyon 2018, 4, e00919. [Google Scholar] [CrossRef]
- Hou, H.; Wang, R.; Murayama, Y. Scenario-based modelling for urban sustainability focusing on changes in cropland under rapid urbanization: A case study of Hangzhou from 1990 to 2035. Sci. Total Environ. 2019, 661, 422–431. [Google Scholar] [CrossRef]
- Motlagh, Z.K.; Lotfi, A.; Pourmanafi, S.; Ahmadizadeh, S.; Soffianian, A. Spatial modeling of land-use change in a rapidly urbanizing landscape in central Iran: Integration of remote sensing, CA-Markov, and landscape metrics. Environ. Monit. Assess. 2020, 192, 695. [Google Scholar] [CrossRef]
- Ren, Y.; Lü, Y.; Comber, A.; Fu, B.; Harris, P.; Wu, L. Spatially explicit simulation of land use/land cover changes: Current coverage and future prospects. Earth-Sci. Rev. 2019, 190, 398–415. [Google Scholar] [CrossRef]
- Berihun, M.L.; Tsunekawa, A.; Haregeweyn, N.; Meshesha, D.T.; Adgo, E.; Tsubo, M.; Masunaga, T.; Fenta, A.A.; Sultan, D.; Yibeltal, M. Exploring land use/land cover changes, drivers and their implications in contrasting agro-ecological environments of Ethiopia. Land Use Policy 2019, 87, 104052. [Google Scholar] [CrossRef]
- Deng, X.; Huang, J.; Rozelle, S.; Uchida, E. Economic Growth and the Expansion of Urban Land in China. Urban Stud. 2010, 47, 813–843. [Google Scholar] [CrossRef]
- Gan, B.R.; Liu, X.N.; Yang, X.G.; Wang, X.K.; Zhoua, J.W. The impact of human activities on the occurrence of mountain flood hazards: Lessons from the 17 August 2015 flash flood/debris flow event in Xuyong County, South-Western China. Geomat. Nat. Hazards Risk 2018, 9, 816–840. [Google Scholar] [CrossRef]
- Munthali, M.G.; Mustak, S.; Adeola, A.; Botai, J.; Singh, S.K.; Davis, N. Modelling Land Use and Land Cover Dynamics of Dedza District of Malawi Using Hybrid Cellular Automata and Markov Model. Remote Sens. Appl. Soc. Environ. 2020, 17, 100276. [Google Scholar] [CrossRef]
- You, H. Agricultural landscape dynamics in response to economic transition: Comparisons between different spatial planning zones in Ningbo region, China. Land Use Policy 2017, 61, 316–328. [Google Scholar] [CrossRef]
- Apollonio, C.; Balacco, G.; Novelli, A.; Tarantino, E.; Piccinni, A.F. Land use change impact on flooding areas: The case study of Cervaro Basin (Italy). Sustainability 2016, 8, 996. [Google Scholar] [CrossRef]
- Carvalho-Santos, C.; Nunes, J.P.; Monteiro, A.T.; Hein, L.; Honrado, J.P. Assessing the effects of land cover and future climate conditions on the provision of hydrological services in a medium-sized watershed of Portugal. Hydrol. Process. 2016, 30, 720–738. [Google Scholar] [CrossRef]
- Hossain, F.; Moniruzzaman, M. Environmental Change Detection through Remote Sensing Technique: A Study of Rohingya Refugee Camp Area (Ukhia and Teknaf Sub-district), Cox’s Bazar, Bangladesh. Environ. Chall. 2021, 2, 100024. [Google Scholar] [CrossRef]
- Lambin, E.F.; Turner, B.L.; Geist, H.J.; Agbola, S.B.; Angelsen, A.; Bruce, J.W.; Coomes, O.T.; Dirzo, R.; Fischer, G.; Folke, C.; et al. The causes of land-use and land-cover change: Moving beyond the myths. Glob. Environ. Change 2001, 11, 261–269. [Google Scholar] [CrossRef]
- Lambin, E.F.; Geist, H.J.; Lepers, E. Dynamics of Land-Use and Land-Cover Change in Tropical Regions. Annu. Rev. Environ. Resour. 2003, 28, 205–241. [Google Scholar] [CrossRef]
- Mezger, G.; De Stefano, L.; Gonz, M. Analysis of the Evolution of Climatic and Hydrological Variables in the Tagus River Basin, Spain. Water 2022, 14, 818. [Google Scholar] [CrossRef]
- Shang, X.; Jiang, X.; Jia, R.; Wei, C. Land use and climate change effects on surface runoff variations in the upper Heihe River basin. Water 2019, 11, 344. [Google Scholar] [CrossRef]
- Sibanda, S.; Ahmed, F. Modelling historic and future land use/land cover changes and their impact on wetland area in Shashe sub-catchment, Zimbabwe. Model. Earth Syst. Environ. 2021, 7, 57–70. [Google Scholar] [CrossRef]
- Yang, D.; Kanae, S.; Oki, T.; Koike, T.; Musiake, K. Global potential soil erosion with reference to land use and climate changes. Hydrol. Process. 2003, 17, 2913–2928. [Google Scholar] [CrossRef]
- Behera, M.D.; Borate, S.N.; Panda, S.N.; Behera, P.R.; Roy, P.S. Modelling and analyzing the watershed dynamics using Cellular Automata (CA)–Markov model—A geo-information based approach. J. Earth Syst. Sci. 2012, 121, 1011–1024. [Google Scholar] [CrossRef]
- Rahman, M.T.U.; Tabassum, F.; Rasheduzzaman, M.; Saba, H.; Sarkar, L.; Ferdous, J.; Uddin, S.Z.; Islam, A.Z. Temporal dynamics of land use/land cover change and its prediction using CA-ANN model for southwestern coastal Bangladesh. Environ. Monit. Assess. 2017, 189, 565. [Google Scholar] [CrossRef]
- Armin, M.; Majidian, M.; Kheybari, V.G. Land Use/Land Cover Change Detection and Prediction in the Yasouj City Suburbs in Kohgiluyeh Va Boyerahmad Province in Iran. Arid. Ecosyst. 2020, 10, 203–210. [Google Scholar] [CrossRef]
- Kotaridis, I.; Lazaridou, M. Environmental Change Detection Study in the Wider Area of Lignite Mines. Civil Eng. Archit. 2018, 6, 108–114. [Google Scholar] [CrossRef]
- Hua, A.K. Land use land cover changes in detection of water quality: A study based on remote sensing and multivariate statistics. J. Environ. Public Health 2017, 2017, 7515130. [Google Scholar] [CrossRef]
- Liping, C.; Yujun, S.; Saeed, S. Monitoring and predicting land use and land cover changes using remote sensing and GIS techniques—A case study of a hilly area, Jiangle, China. PLoS ONE 2018, 13, e0200493. [Google Scholar] [CrossRef] [PubMed]
- Mannan, A.; Liu, J.; Zhongke, F.; Khan, T.U.; Saeed, S.; Mukete, B.; ChaoYong, S.; Yongxiang, F.; Ahmad, A.; Amir, M.; et al. Application of land-use/land cover changes in monitoring and projecting forest biomass carbon loss in Pakistan. Glob. Ecol. Conserv. 2019, 17, e00535. [Google Scholar] [CrossRef]
- Rawat, J.S.; Kumar, M. Monitoring land use/cover change using remote sensing and GIS techniques: A case study of Hawalbagh block, district Almora, Uttarakhand, India. Egypt. J. Remote Sens. Space Sci. 2015, 18, 77–84. [Google Scholar] [CrossRef]
- Nouri, J.; Gharagozlou, A.; Arjmandi, R.; Faryadi, S.; Adl, M. Predicting urban land use changes using a CA–Markov model. Arab. J. Sci. Eng. 2014, 39, 5565–5573. [Google Scholar] [CrossRef]
- Yang, X.; Zheng, X.-Q.; Lv, L.-N. A spatiotemporal model of land use change based on ant colony optimization, Markov chain and cellular automata. Ecol. Model. 2012, 233, 11–19. [Google Scholar] [CrossRef]
- Nath, B.; Wang, Z.; Ge, Y.; Islam, K.; Singh, R.P.; Niu, Z. Land Use and Land Cover Change Modeling and Future Potential Landscape Risk Assessment Using Markov-CA Model and Analytical Hierarchy Process. ISPRS Int. J. Geo-Inf. 2020, 9, 134. [Google Scholar] [CrossRef]
- Maviza, A.; Ahmed, F. Analysis of past and future multi-temporal land use and land cover changes in the semi-arid UpperMzingwane sub-catchment in the Matabeleland south province of Zimbabwe. Int. J. Remote Sens. 2020, 41, 5206–5227. [Google Scholar] [CrossRef]
- Hyandye, C.; Martz, L.W. A Markovian and cellular automata land-use change predictive model of the Usangu Catchment. Int. J. Remote Sens. 2017, 38, 64–81. [Google Scholar] [CrossRef]
- Memarian, H.; Balasundram, S.K.; Talib, J.B.; Sung, C.T.B.; Sood, A.M.; Abbaspour, K. Validation of CA-Markov for simulation of land use and cover change in the Langat Basin, Malaysia. Sci. Res. 2012, 4, 542–554. [Google Scholar] [CrossRef]
- Singh, S.K.; Mustak, S.; Srivastava, P.K.; Szabó, S.; Islam, T. Predicting spatial and decadal LULC changes through cellular automata Markov chain models using earth observation datasets and geo-information. Environ. Process. 2015, 2, 61–78. [Google Scholar] [CrossRef]
- Weng, Q. Land use change analysis in the Zhujiang Delta of China using satellite remote sensing, GIS and stochastic modelling. J. Environ. Manag. 2002, 64, 273–284. [Google Scholar] [CrossRef] [PubMed]
- Bashir, O.; Bangroo, S.A.; Guo, W.; Meraj, G.; Ayele, G.T.; Naikoo, N.B.; Shafai, S.; Singh, P.; Muslim, M.; Taddese, H.; et al. Simulating Spatiotemporal Changes in Land Use and Land Cover of the North-Western Himalayan Region Using Markov Chain Analysis. Land 2022, 11, 2276. [Google Scholar] [CrossRef]
- Jia, W.; Gu, X.; Mi, X.; Yang, J.; Zang, W.; Liu, P.; Yan, J.; Zhu, H.; Zhang, X.; Zhang, Z. Multi-Scale Spatiotemporal Pattern Analysis and Simulation (MSPAS) Model with Driving Factors for Land Cover Change and Sustainable Development Goals: A Case Study of Nepal. Remote Sens. 2022, 14, 6295. [Google Scholar] [CrossRef]
- Naboureh, A.; Moghaddam, M.H.R.; Feizizadeh, B.; Blaschke, T. An integrated object-based image analysis and CA-Markov model approach for modeling land use/land cover trends in the Sarab plain. Arab. J. Geosci. 2017, 10, 259. [Google Scholar] [CrossRef]
- Pereira, C.O.; Escanilla-Minchel, R.; González, A.C.; Alcayaga, H.; Aguayo, M.; Arias, M.A.; Flores, A.N. Assessment of Future Land Use/Land Cover Scenarios on the Hydrology of a Coastal Basin in South-Central Chile. Sustainability 2022, 14, 16363. [Google Scholar] [CrossRef]
- Wu, X.; Zhu, C.; Yu, J.; Zhai, L.; Zhang, H.; Yang, K.; Hou, X. Ecological Vulnerability in the Red Soil Erosion Area of Changting under Continuous Ecological Restoration: Spatiotemporal Dynamic Evolution and Prediction. Forests 2022, 13, 2136. [Google Scholar] [CrossRef]
- Dey, N.N.; Al Rakib, A.; Kafy, A.A.; Raikwar, V. Geospatial Modelling of Changes in Land Use/Land Cover Dynamics Using Multi-Layer Perception Markov Chain Model in Rajshahi City, Bangladesh. Environ. Chall. 2021, 4, 100148. [Google Scholar] [CrossRef]
- Fan, F.; Wang, Y.; Wang, Z. Temporal and spatial change detecting (1998–2003) and predicting of land use and land cover in Core corridor of Pearl River Delta (China) by using TM and ETM+ images. Environ. Monit. Assess. 2007, 137, 127–147. [Google Scholar] [CrossRef]
- Hamad, R.; Balzter, H.; Kolo, K. Predicting land use/land cover changes using a CA-Markov model under two different scenarios. Sustainability 2018, 10, 3421. [Google Scholar] [CrossRef]
- Yirsaw, E.; Wu, W.; Shi, X.; Temesgen, H.; Bekele, B. Land Use/Land Cover Change Modeling and the Prediction of Subsequent Changes in Ecosystem Service Values in a Coastal Area of China, the Su-Xi-Chang Region. Sustainability 2017, 9, 1204. [Google Scholar] [CrossRef]
- Al-shalabi, M.; Billa, L.; Pradhan, B.; Mansor, S.; Al-Sharif, A.A.A. Modelling urban growth evolution and land-use changes using GIS based cellular automata and SLEUTH models: The case of Sana’a metropolitan city, Yemen. Environ. Earth Sci. 2013, 70, 425–437. [Google Scholar] [CrossRef]
- Guan, D.; Li, H.; Inohae, T.; Su, W.; Nagaie, T.; Hokao, K. Modeling urban land use change by the integration of cellular automaton and markov model. Ecol. Model. 2011, 222, 3761–3772. [Google Scholar] [CrossRef]
- Cheong, S.M.; Brown, D.; Kok, K.; López-Carr, D. Mixed Methods in Land Change Research: Towards Integration. Trans. Inst. Br. Geogr. 2012, 37, 8–12. [Google Scholar] [CrossRef]
- Brown, D.G.; Walker, R.; Manson, S.; Seto, K.C. Modeling land use and land cover change. In Land Change Science: Observing, Monitoring, and Understanding Trajectories of Change on the Earth’s Surface; Gutman, G., Janetos, A., Justice, C., Moran, E., Mustard, J., Rindfuss, R., Skole, D., Turner, B.L., II, Cochrane, M.A., Eds.; Kluwer Academic Publishers: Dordrecht, The Netherlands, 2004; pp. 395–409. [Google Scholar]
- Bracchetti, L.; Carotenuto, L.; Catorci, A. Land-cover changes in a remote area of central Apennines (Italy) and management directions. Landsc. Urban Plan. 2012, 104, 157–170. [Google Scholar] [CrossRef]
- Tattoni, C.; Ciolli, M.; Ferretti, F. The fate of priority areas for conservation in protected areas: A fine-scale markov chain approach. Environ. Manag. 2011, 47, 263–278. [Google Scholar] [CrossRef] [PubMed]
- Belay, T.; Mengistu, D.A. Impacts of land use/land cover and climate changes on soil erosion in Muga watershed, Upper Blue Nile basin (Abay), Ethiopia. Ecol. Process. 2021, 10, 68. [Google Scholar] [CrossRef]
- Soil Survey Staff. Keys to Soil Taxonomy, 12th ed.; USDA-Natural Resources Conservation Service: Washington, DC, USA, 2014.
- Hansen, M.C.; Defries, R.S.; Townshend, J.R.G.; Sohlberg, R. Global land cover classification at 1 km spatial resolution using a classification tree approach. Int. J. Remote Sens. 2000, 21, 1331–1364. [Google Scholar] [CrossRef]
- Jensen, J.R. Introductory Digital Image Processing, 3rd ed.; Prentice Hall: Upper Saddle River, NJ, USA, 2005. [Google Scholar]
- Weier, J.; Herring, D. Measuring Vegetation: NDVI and EVI; NASA Earth Observatory: Washington, DC, USA, 2000.
- Xu, H.Q. Modification of normalised difference water index (NDWI) to enhance open water features in remotely sensed imagery. Int. J. Remote Sens. 2006, 27, 3025–3033. [Google Scholar] [CrossRef]
- Zha, Y.; Gao, J.; Ni, S. Use of normalized difference built-up index in automatically mapping urban areas from TM imagery. Int. J. Remote Sens. 2003, 24, 583–594. [Google Scholar] [CrossRef]
- Zhao, H.; Chen, X. Use of normalized difference bareness index in quickly mapping bare areas from TM/ETM+. In Proceedings of the 2005 IEEE International Geoscience and Remote Sensing Symposium, Seoul, Republic of Korea, 25–29 July 2005; Volume 3, pp. 1666–1668. [Google Scholar] [CrossRef]
- Ibharim, N.; Mustapha, M.A.; Lihan, T.; Mazlan, A. Mapping mangrove changes in the Matang Mangrove Forest using multi temporal satellite imageries. Ocean Coast. Manag. 2015, 114, 64–76. [Google Scholar] [CrossRef]
- Lin, C.; Wu, C.-C.; Tsogt, K.; Ouyang, Y.-C.; Chang, C.-I. Effects of atmospheric correction and pansharpening on LULC classification accuracy using WorldView-2 imagery. Inf. Processing Agric. 2015, 2, 25–36. [Google Scholar] [CrossRef]
- Congalton, R.G.; Green, K. Assessing the Accuracy of Remotely Sensed Data; CRC Press: Boca Raton, FL, USA, 2009; ISBN 0-87-37198-67. [Google Scholar]
- Sulieman, H.M. Mapping and modelling of vegetation changes in the Southern Gadarif region, Sudan, using remote sensing. Ph.D. Thesis, Dresden University of Technology, Dresden, Germany, 2008. [Google Scholar]
- Zhang, Z.; Liu, S.; Wei, J.; Xu, J.; Guo, W.; Bao, W.; Jiang, Z. Mass change of glaciers in Muztag Ata–Kongur Tagh, Eastern Pamir, China from 1971/76 to 2013/14 as derived from remote sensing data. PLoS ONE 2016, 11, e0147327. [Google Scholar] [CrossRef] [PubMed]
- Anderson, J.R.; Hardy, E.E.; Roach, J.T.; Witmer, R.E. A Land Use and Land Cover Classification System for Use with Remote Sensor Data; Government Printing Office: Washington, DC, USA, 1976.
- Stehman, S. Estimating the kappa coefficient and its variance under stratified random sampling. Photogramm. Eng. Remote Sens. 1996, 62, 401–407. [Google Scholar]
- Kumar, S.; Radhakrishnan, N.; Mathew, S. Land use change modelling using a Markov model and remote sensing. Geomat. Nat. Hazards Risk 2014, 5, 145–156. [Google Scholar] [CrossRef]
- Guan, D.; Gao, W.; Watari, K.; Fukahori, H. Land use change of Kitakyushu based on landscape ecology and Markov model. J. Geogr. Sci. 2008, 18, 455–468. [Google Scholar] [CrossRef]
- Chen, Y.; Li, X.; Liu, X.; Ai, B. Analyzing land-cover change and corresponding impacts on carbon budget in a fast developing sub-tropical region by integrating MODIS and Landsat TM/ETM+ images. Appl. Geogr. 2013, 45, 10–21. [Google Scholar] [CrossRef]
- Myint, S.W.; Wang, L. Multicriteria decision approach for land use land cover change using Markov chain analysis and a cellular automata approach. Can. J. Remote Sens. 2006, 32, 390–404. [Google Scholar] [CrossRef]
- Biswas, M.; Banerji, S.; Mitra, D. Land-use–land-cover change detection and application of Markov model: A case study of Eastern part of Kolkata. Environ. Dev. Sustain. 2019, 22, 4341–4360. [Google Scholar] [CrossRef]
- Hu, Y.; Zheng, Y.; Zheng, X. Simulation of land-use scenarios for Beijing using CLUE-S and Markov composite models. Chin. Geogr. Sci. 2013, 23, 92–100. [Google Scholar] [CrossRef]
- Sang, L.; Zhang, C.; Yang, J.; Zhu, D.; Yun, W. Simulation of land use spatial pattern of towns and villages based on CA-Markov model. Math. Comput. Model. 2011, 54, 938–943. [Google Scholar] [CrossRef]
- Wu, N.; Silva, E. Artificial intelligence solutions for urban land dynamics: A review. J. Plan. Lit. 2010, 24, 246–265. [Google Scholar] [CrossRef]
- Eastman, J.R. IDRISI Selva Tutorial; Clark University: Worcester, MA, USA, 2012; pp. 267–275. [Google Scholar]
- Aliani, H.; Malmir, M.; Sourodi, M.; Kafaky, S.B. Change detection and prediction of urban land use changes by CA–Markov model (case study: Talesh County). Environ. Earth Sci. 2019, 78, 546. [Google Scholar] [CrossRef]
- Nadoushan, M.A.; Soffianian, A.; Alebrahim, A. Modeling land use/cover changes by the combination of markov chain and cellular automata markov (CA-Markov) models. J. Earth Environ. Health Sci. 2015, 1, 16–21. [Google Scholar] [CrossRef]
- Clarke, K.C.; Hoppen, S.; Gaydos, L. A self-modifying cellular automaton model of historical urbanization in the San Francisco Bay area. Environ. Plan. B Plan. Des. 1997, 24, 247–261. [Google Scholar] [CrossRef]
- Yang, Q.S.; Li, X.; Shi, X. Cellular automata for simulating land use changes based on support vector machines. Comput. Geosci. 2008, 34, 592–602. [Google Scholar] [CrossRef]
- Ma, C.; Zhang, G.; Zhang, X.; Zhao, Y.; Li, H. Application of Markov model in wetland change dynamics in Tianjin Coastal Area, China. Procedia Environ. Sci. 2012, 13, 252–262. [Google Scholar] [CrossRef]
- Irwin, E.G.; Jayaprakash, C.; Munroe, D.K. Towards a comprehensive framework for modeling urban spatial dynamics. Landsc. Ecol. 2009, 24, 1223–1236. [Google Scholar] [CrossRef]
- He, D.; Zhou, J.; Gao, W.; Guo, H.Y.U.S.; Liu, Y. An integrated CA–markov model for dynamic simulation of land use change in Lake Dianchi watershed. Acta Sci. Nat. Univ. Pekin. 2014, 50, 1095–1105. [Google Scholar] [CrossRef]
- Keshtkar, H.; Voigt, W. A spatiotemporal analysis of landscape change using an integrated Markov chain and cellular automata models. Model. Earth Syst. Environ. 2016, 2, 1–13. [Google Scholar] [CrossRef]
- Liang, X.; Liu, X.; Li, D.; Zhao, H.; Chen, G. Urban growth simulation by incorporating planning policies into a CA–based future land–use simulation model. Int. J. Geogr. Inf. Sci. 2018, 32, 2294–2316. [Google Scholar] [CrossRef]
- Aksoy, H.; Kaptan, S. Simulation of future forest and land use/cover changes (2019–2039) using the cellular automata-Markov model. Geocarto Int. 2020, 37, 1183–1202. [Google Scholar] [CrossRef]
- Wang, R.; Murayama, Y. Change of Land Use/Cover in Tianjin City Based on the Markov and Cellular Automata Models. ISPRS Int. J. Geo-Inf. 2017, 6, 150. [Google Scholar] [CrossRef]
- Singh, S.K.; Laari, P.B.; Mustak, S.; Srivastava, P.K.; Szabó, S. Modelling of land use land cover change using earth observation data-sets of Tons River Basin, Madhya Pradesh, India. Geocarto Int. 2018, 33, 1202–1222. [Google Scholar] [CrossRef]
- Tali, J.A.; Divya, S.; Murthy, K. Influence of urbanization on the land use change: A case study of Srinagar City. Am. J. Res. Comm. 2013, 1, 271–283. [Google Scholar]
- Eastman, J.R. IDRISI Taiga Guide to GIS and Image Processing; Clark Labs Clark University: Worcester, MA, USA, 2009. [Google Scholar]
- Subedi, P.; Subedi, K.; Thapa, B. Application of a Hybrid Cellular Automaton—Markov (CA-Markov) Model in Land-Use Change Prediction: A Case Study of Saddle Creek Drainage Basin, Florida. Appl. Ecol. Environ. Sci. 2013, 1, 126–132. [Google Scholar] [CrossRef]
- Pan, S.; Liu, D.; Wang, Z.; Zhao, Q.; Zou, H.; Hou, Y.; Liu, P.; Xiong, L. Runoff Responses to Climate and Land Use/Cover Changes under Future Scenarios. Water 2017, 9, 475. [Google Scholar] [CrossRef]
- Tilahun, A.; Teferie, B. Accuracy assessment of land use land cover classification using Google Earth. Am. J. Environ. Prot. 2015, 4, 193–198. [Google Scholar] [CrossRef]
- Da Cunha, E.R.; Santos, C.A.G.; da Silva, R.M.; Bacani, V.M.; Teodoro, P.E.; Panachuki, E.; de Souza Oliveira, N. Mapping LULC types in the Cerrado-Atlantic Forest ecotone region using a Landsat time series and object-based image approach: A case study of the Prata River Basin, Mato Grosso do Sul, Brazil. Environ. Monit. Assess. 2020, 192, 136. [Google Scholar] [CrossRef]
- Li, X.; Liu, X.; Yu, L. A systematic sensitivity analysis of constrained cellular automata model for urban growth simulation based on different transition rules. Int. J. Geogr. Inf. Syst. 2014, 28, 1317–1335. [Google Scholar] [CrossRef]
- Rimal, B.; Zhang, L.; Keshtkar, H.; Haack, B.N.; Rijal, S.; Zhang, P. Land Use/Land Cover Dynamics and Modeling of Urban Land Expansion by the Integration of Cellular Automata and Markov Chain. ISPRS Int. J. Geo-Inf. 2018, 7, 154. [Google Scholar] [CrossRef]
- Abd El-Hamid, H.T.; El-Alfy, M.A.; Elnaggar, A. Prediction of future situation of land use/cover change and modeling sensitivity to pollution in Edku Lake. Egypt based on geospatial analyses. GeoJournal 2020, 86, 1895–1913. [Google Scholar] [CrossRef]
- Abd El-Hamid, H.T.A.; Nour-Eldin, H.; Rebouh, N.Y.; El-Zeiny, A.M. Past and Future Changes of Land Use/Land Cover and the Potential Impact on Ecosystem Services Value of Damietta Governorate, Egypt. Land 2022, 11, 2169. [Google Scholar] [CrossRef]
- Abd El-Kawy, O.R.; Rød, J.K.; Ismail, H.A.; Suliman, A.S. Land use and land cover change detection in the western Nile delta of Egypt using remote sensing data. Appl. Geogr. 2011, 31, 483–494. [Google Scholar] [CrossRef]
- Elagouz, M.; Abou-Shleel, S.; Belal, A.; El-Mohandes, M. Detection of land use/cover change in Egyptian Nile Delta using remote sensing. Egypt. J. Remote Sens. Space Sci. 2019, 23, 57–62. [Google Scholar] [CrossRef]
- El-Zeiny, A.M.; Effat, H.A. Environmental monitoring of spatiotemporal change in land use/land cover and its impact on land surface temperature in El-Fayoum governorate, Egypt. Remote Sens. Appl. Soc. Environ. 2017, 8, 266–277. [Google Scholar] [CrossRef]
- Halmy, M.W.A.; Gessler, P.E.; Hicke, J.A.; Salem, B.B. Land use/land cover change detection and prediction in the north-western coastal desert of Egypt using Markov-CA. Appl. Geogr. 2015, 63, 101–112. [Google Scholar] [CrossRef]
- Kamel, M. Monitoring of Land Use and Land Cover Change Detection Using Multi-temporal Remote Sensing and Time Series Analysis of Qena-Luxor Governorates (QLGs), Egypt. J. Indian Soc. Remote Sens. 2020, 48, 1767–1785. [Google Scholar] [CrossRef]
- Mohamed, E.S.; Baroudy, A.A.E.; El-beshbeshy, T.; Emam, M.; Belal, A.A.; Elfadaly, A.; Aldosari, A.A.; Ali, A.M.; Lasaponara, R. Vis-NIR Spectroscopy and Satellite Landsat-8 OLI Data to Map Soil Nutrients in Arid Conditions: A Case Study of the Northwest Coast of Egypt. Remote Sens. 2020, 12, 3716. [Google Scholar] [CrossRef]
- Said, M.E.S.; Ali, A.M.; Borin, M.; Abd-Elmabod, S.K.; Aldosari, A.A.; Khalil, M.M.N.; Abdel-Fattah, M.K. On the Use of Multivariate Analysis and Land Evaluation for Potential Agricultural Development of the Northwestern Coast of Egypt. Agronomy 2020, 10, 1318. [Google Scholar] [CrossRef]
- Biondini, M.; Kandus, P. Transition matrix analysis of land-cover change in the accretion area of the Lower Delta of the Paraná River (Argentina) reveals two succession pathways. Wetlands 2006, 26, 981–991. [Google Scholar] [CrossRef]
- Bai, X.; Chen, J.; Shi, P. Landscape Urbanization and Economic Growth in China: Positive Feedbacks and Sustainability Dilemmas. Environ. Sci. Technol. 2012, 46, 132–139. [Google Scholar] [CrossRef]
- Huang, G.; Jiang, Y. Urbanization and Socioeconomic Development in Inner Mongolia in 2000 and 2010: A GIS Analysis. Sustainability 2017, 9, 235. [Google Scholar] [CrossRef]
- Deng, X.; Huang, J.; Rozelle, S.; Zhang, J.; Li, Z. Impact of urbanization on cultivated land changes in China. Land Use Policy 2015, 45, 1–7. [Google Scholar] [CrossRef]
- Marques, A.; Martins, I.S.; Kastner, T.; Plutzar, C.; Theurl, M.C.; Eisenmenger, N.; Huijbregts, M.A.J.; Wood, R.; Stadler, K.; Bruckner, M.; et al. Increasing impacts of land use on biodiversity and carbon sequestration driven by population and economic growth. Nat. Ecol. Evol. 2019, 3, 628–637. [Google Scholar] [CrossRef] [PubMed]
- Pandey, B.K.; Khare, D. Analyzing and modeling of a large river basin dynamics applying integrated cellular automata and Markov model. Environ. Earth Sci. 2017, 76, 779. [Google Scholar] [CrossRef]
- Gashaw, T.; Tulu, T.; Argaw, M.; Worqlul, A.W. Evaluation and prediction of land use/land cover changes in the Andassa watershed, Blue Nile Basin, Ethiopia. Environ. Syst. Res. 2017, 6, 17. [Google Scholar] [CrossRef]
- Pontius, G.J.; Schneider, L.C. Land-cover change model validation by an ROC method for the Ipswich watershed, Massachusetts, USA. Agric. Ecosyst. Environ. 2001, 85, 239–248. [Google Scholar] [CrossRef]
- Pontius, R.; Millones, M. Death to Kappa: Birth of quantity disagreement and allocation disagreement for accuracy assessment. Int. J. Remote Sens. 2011, 32, 4407–4429. [Google Scholar] [CrossRef]
- Luo, G.; Amuti, T.; Zhu, L.; Mambetov, B.T.; Maisupova, B.; Zhang, C. Dynamics of landscape patterns in an inland river delta of Central Asia based on a cellular automata-Markov model. Reg. Environ. Chang. 2015, 15, 277–289. [Google Scholar] [CrossRef]
- Mondal, M.S.; Sharma, N.; Kappas, M.; Garg, P.K. CA Markov modeling of land use land cover change predictions and effect of numerical iterations, image interval (time steps) on prediction results. Int. Arch. Photogramm. Remote Sens. Spatial Inf. Sci. 2020, 43, 713–720. [Google Scholar] [CrossRef]
- Huang, Y.C.; Yang, B.G.; Wang, M.; Liu, B.W.; Yang, X.D. Analysis of the future land cover change in Beijing using CA-Markov chain model. Environ. Earth Sci. 2020, 79, 60. [Google Scholar] [CrossRef]
- Khwarahm, N.R.; Najmaddin, P.M.; Ararat, K.; Qader, S. Past and future prediction of land cover land use change based on earth observation data by the CA–Markov model: A case study from Duhok governorate, Iraq. Arab. J. Geosci. 2021, 14, 1–14. [Google Scholar] [CrossRef]
- Gidey, E.; Dikinya, O.; Sebego, R.; Segosebe, E.; Zenebe, A. Cellular automata and Markov Chain (CA_Markov) model-based predictions of future land use and land cover scenarios (2015–2033) in Raya, northern Ethiopia. Modeling Earth Syst. Environ. 2017, 3, 1245–1262. [Google Scholar] [CrossRef]
- Matlhodi, B.; Kenabatho, P.K.; Parida, B.P.; Maphanyane, J.G. Analysis of the Future Land Use Land Cover Changes in the Gaborone Dam Catchment Using CA-Markov Model: Implications on Water Resources. Remote Sens. 2021, 13, 2427. [Google Scholar] [CrossRef]
- Brodt, S.; Six, J.; Feenstra, G.; Ingels, C.; Campbell, D. Sustainable Agriculture. Nat. Educ. Knowl. 2011, 3, 1. [Google Scholar]
- Dewan, A.; Yamaguchi, Y. Land use and land cover change in Greater Dhaka, Bangladesh: Using remote sensing to promote sustainable urbanization. Appl. Geogr. 2009, 29, 390–401. [Google Scholar] [CrossRef]


| LULC | Description |
|---|---|
| Water bodies | The Nile River, canals, drainage patterns, and wastewater treatment plants. |
| Desert lands | Bare lands, sand sheets, and rocky lands in the eastern and western parts outside the Nile Valley. |
| Cultivated lands | Old cultivated lands in the Nile Valley and newly reclaimed lands outside the Nile Valley. |
| Urban areas | Residential, commercial, industrial, and road constructions in cities and rural areas. |
| Satellite Image | Year of Acquisition | Path/Row | Resolution (m) | Image Type |
|---|---|---|---|---|
| Landsat 5 (TM) | 1984 | 175/42, 176/42 and 176/41 | 15–30 | Level-1 |
| Landsat 7 (ETM+) | 2002 | |||
| Landsat 8 (OLI) | 2013 | |||
| Landsat 9 (OLI) | 2022 |
| Sensor | Spectral Range | Bands | Resolution (m) | Swath Width (km) | Quantization Level (Bits) |
|---|---|---|---|---|---|
| ASTER | VNIR, SWIR, and TIR | 14 | 15–90 | 60 | 8–12 |
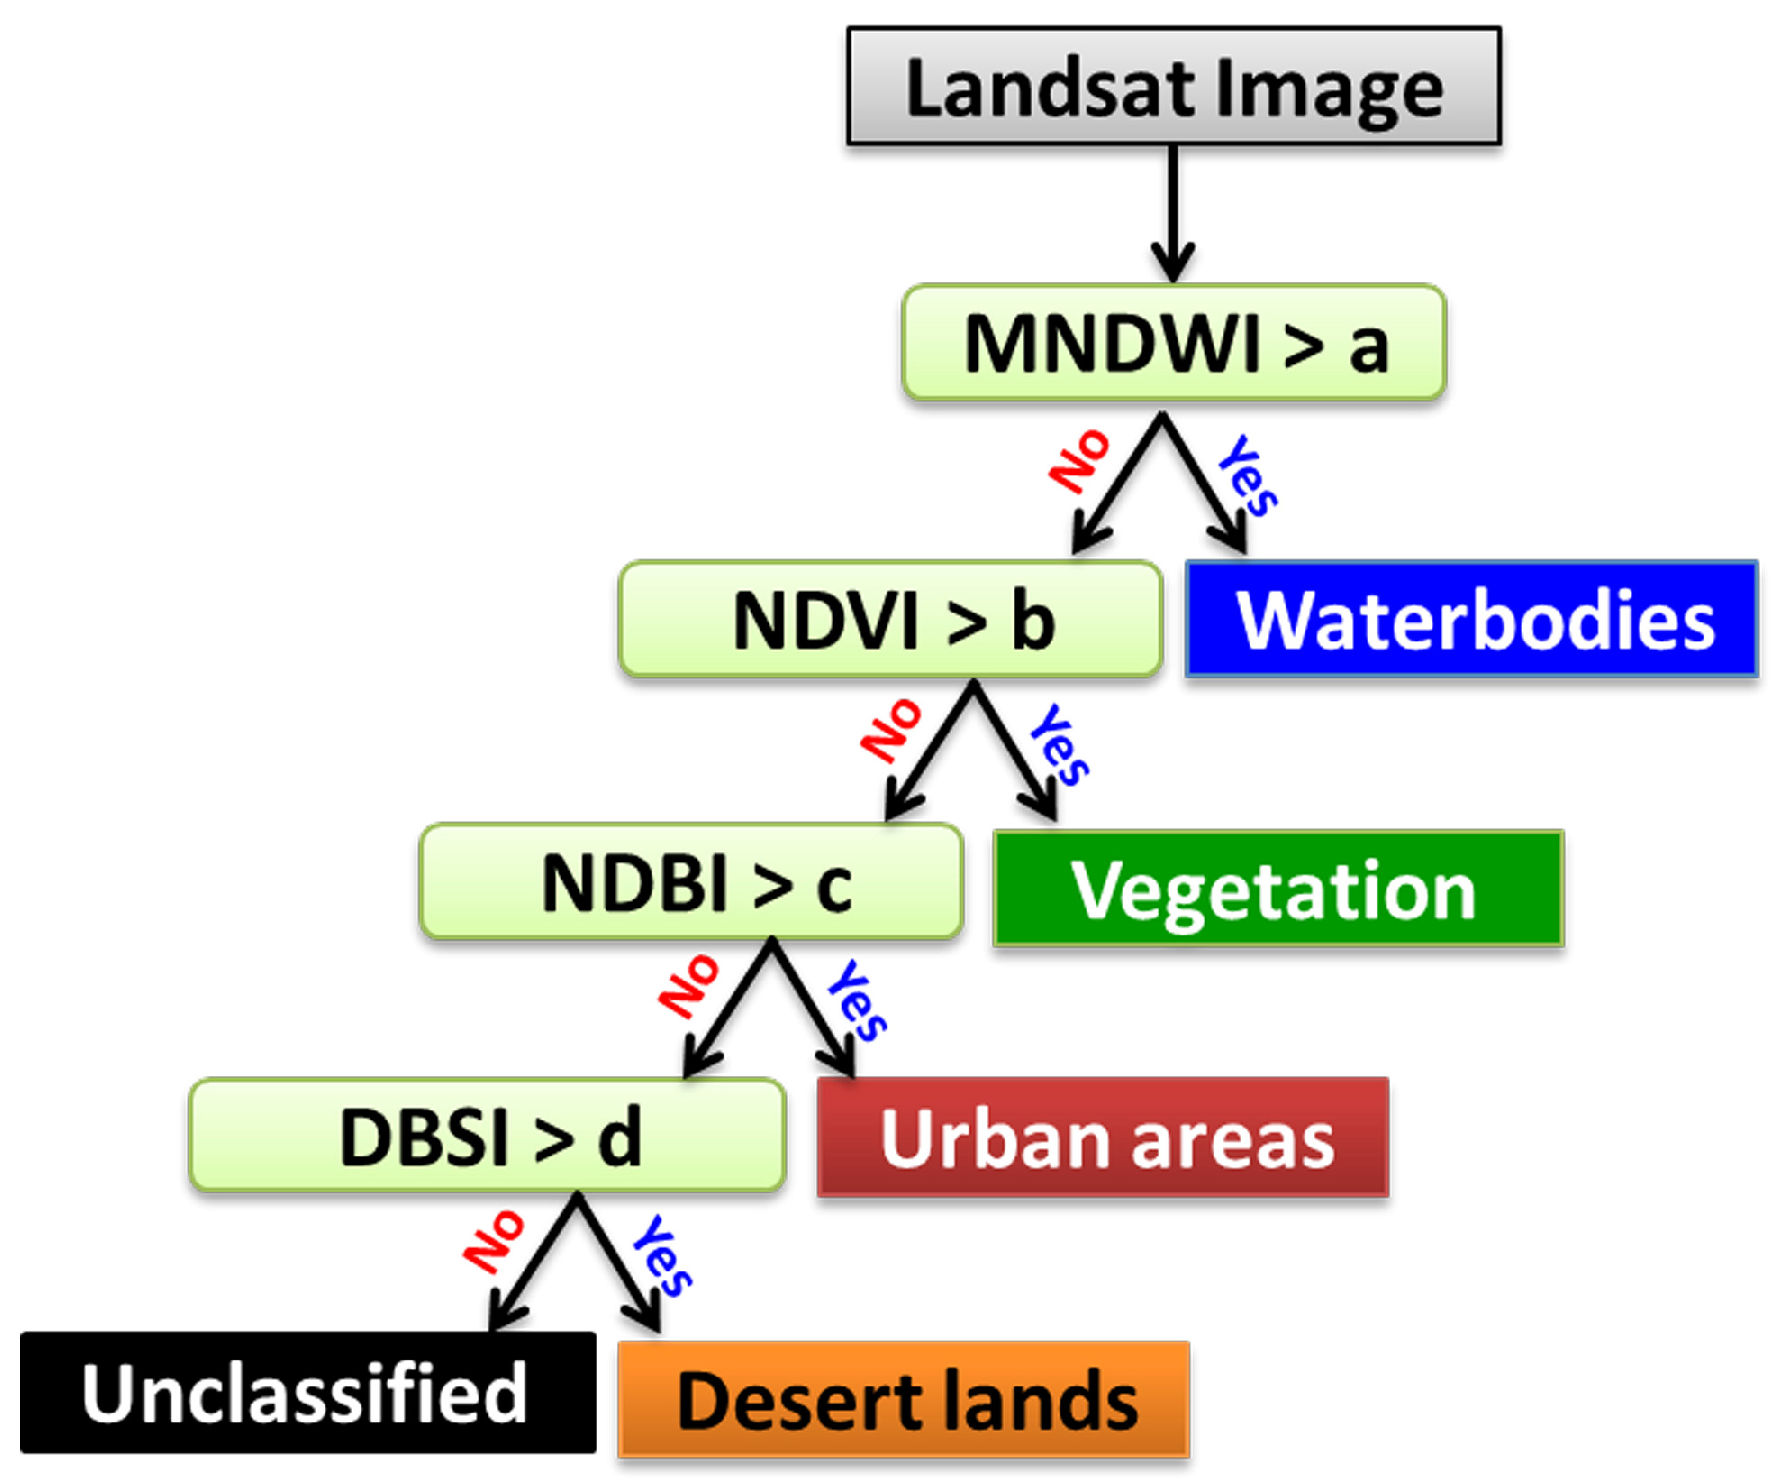
| The Index | Expression | Reference |
|---|---|---|
| NDVI | (NIR − R)/(NIR + R) | [73] |
| MNDWI | (G − SWIR)/(G + SWIR) | [74] |
| NDBI | (SWIR − NIR)/(SWIR + NIR) | [75] |
| DBSI | [(SWIR)/(SWIR + G)] − [(NIR − R)/(NIR + R)] | [76] |
| Kappa Coefficient Value | Agreement Degree |
|---|---|
| <0.2 | Weak |
| 0.21–0.4 | Acceptable |
| 0.41–0.6 | Moderate |
| 0.61–0.8 | Good |
| 0.81–1.0 | Very good |
| LULC Class | Landsat TM 1984 | Landsat ETM+ 2002 | Landsat ETM+ 2013 | Landsat OLI 2022 | ||||
|---|---|---|---|---|---|---|---|---|
| PA | UA | PA | UA | PA | UA | PA | UA | |
| (%) | ||||||||
| Water bodies | 97.1 | 100.0 | 99.4 | 98.9 | 98.7 | 96.3 | 82.2 | 97.4 |
| Desert lands | 99.7 | 91.1 | 97.8 | 99.2 | 96.4 | 92.5 | 88.6 | 45.9 |
| Cultivated lands | 72.2 | 91.2 | 91.7 | 86.4 | 86.1 | 95.5 | 94.6 | 92.3 |
| Urban Areas | 82.5 | 68.6 | 96.9 | 57.3 | 96.7 | 71.8 | 95.8 | 40.4 |
| Overall accuracy | 91.0 | 95.5 | 92.1 | 87.5 | ||||
| Kappa coefficient | 0.71 | 0.94 | 0.84 | 0.79 | ||||
| Land Use | 1984 | 2002 | 2013 | 2022 | ||||
|---|---|---|---|---|---|---|---|---|
| Area | ||||||||
| km2 | % | km2 | % | km2 | % | km2 | % | |
| Water body | 64.2 | 2.2 | 60.6 | 2.0 | 68.6 | 2.3 | 101.8 | 3.4 |
| Desert lands | 1398.9 | 46.8 | 1181.8 | 39.5 | 861.3 | 28.8 | 703.8 | 23.6 |
| Cultivated lands | 1361.0 | 45.5 | 1514.0 | 50.7 | 1754.7 | 58.7 | 1814.5 | 60.7 |
| Urban | 165.0 | 5.5 | 232.8 | 7.8 | 304.5 | 10.2 | 369.0 | 12.3 |
| Total | 2989.1 | 100.0 | 2989.1 | 100.0 | 2989.1 | 100.0 | 2989.1 | 100.0 |
| Probability of Changing from 1984 to 2002 | Subtotals | |||||
|---|---|---|---|---|---|---|
| Water Bodies | Desert Lands | Cultivated Lands | Urban Areas | Total | Loss | |
| Water bodies | 0.7649 | 0.0005 | 0.1626 | 0.072 | 1 | 0.2351 |
| Desert lands | 0.0009 | 0.7633 | 0.2277 | 0.0081 | 1 | 0.2367 |
| Cultivated lands | 0.0043 | 0.0079 | 0.7842 | 0.2036 | 1 | 0.2158 |
| Urban Areas | 0.0356 | 0.2528 | 0.0141 | 0.6975 | 1 | 0.3025 |
| Total | 0.8057 | 1.0245 | 1.1886 | 0.9812 | 4 | |
| Gain | 0.0408 | 0.2612 | 0.4044 | 0.2837 | ||
| Probability of Changing from 2002 to 2013 | Subtotals | |||||
|---|---|---|---|---|---|---|
| Water Bodies | Desert Lands | Cultivated Lands | Urban Areas | Total | Loss | |
| Water bodies | 0.8135 | 0.0016 | 0.172 | 0.0129 | 1 | 0.1865 |
| Desert lands | 0.001 | 0.7423 | 0.2467 | 0.01 | 1 | 0.2577 |
| Cultivated lands | 0.0146 | 0.0523 | 0.8071 | 0.126 | 1 | 0.1929 |
| Urban Areas | 0.0145 | 0.0125 | 0.5095 | 0.4635 | 1 | 0.5365 |
| Total | 0.8436 | 0.8087 | 1.7353 | 0.6124 | 4 | |
| Gain | 0.0301 | 0.0664 | 0.9282 | 0.1489 | ||
| Probability of Changing from 2013 to 2022 | Subtotals | |||||
|---|---|---|---|---|---|---|
| Water Bodies | Desert Lands | Cultivated Lands | Urban Areas | Total | Loss | |
| Water bodies | 0.8237 | 0.0030 | 0.1642 | 0.0092 | 1 | 0.1763 |
| Desert lands | 0.0052 | 0.5909 | 0.2003 | 0.2036 | 1 | 0.4091 |
| Cultivated lands | 0.0362 | 0.0181 | 0.7820 | 0.1638 | 1 | 0.218 |
| Urban Areas | 0.0306 | 0.0289 | 0.4610 | 0.4796 | 1 | 0.5205 |
| Total | 0.8957 | 0.6409 | 1.6075 | 0.8559 | 4 | |
| Gain | 0.072 | 0.05 | 0.8255 | 0.3764 | ||
| Land Use | Annual Change km2 | ||
|---|---|---|---|
| 1984–2002 | 2002–2013 | 2013–2022 | |
| Water bodies | −0.20 | 0.73 | 3.69 |
| Desert lands | −12.06 | −29.14 | −17.50 |
| Cultivated lands | 8.50 | 21.88 | 6.64 |
| Urban Areas | 3.76 | 6.52 | 7.17 |
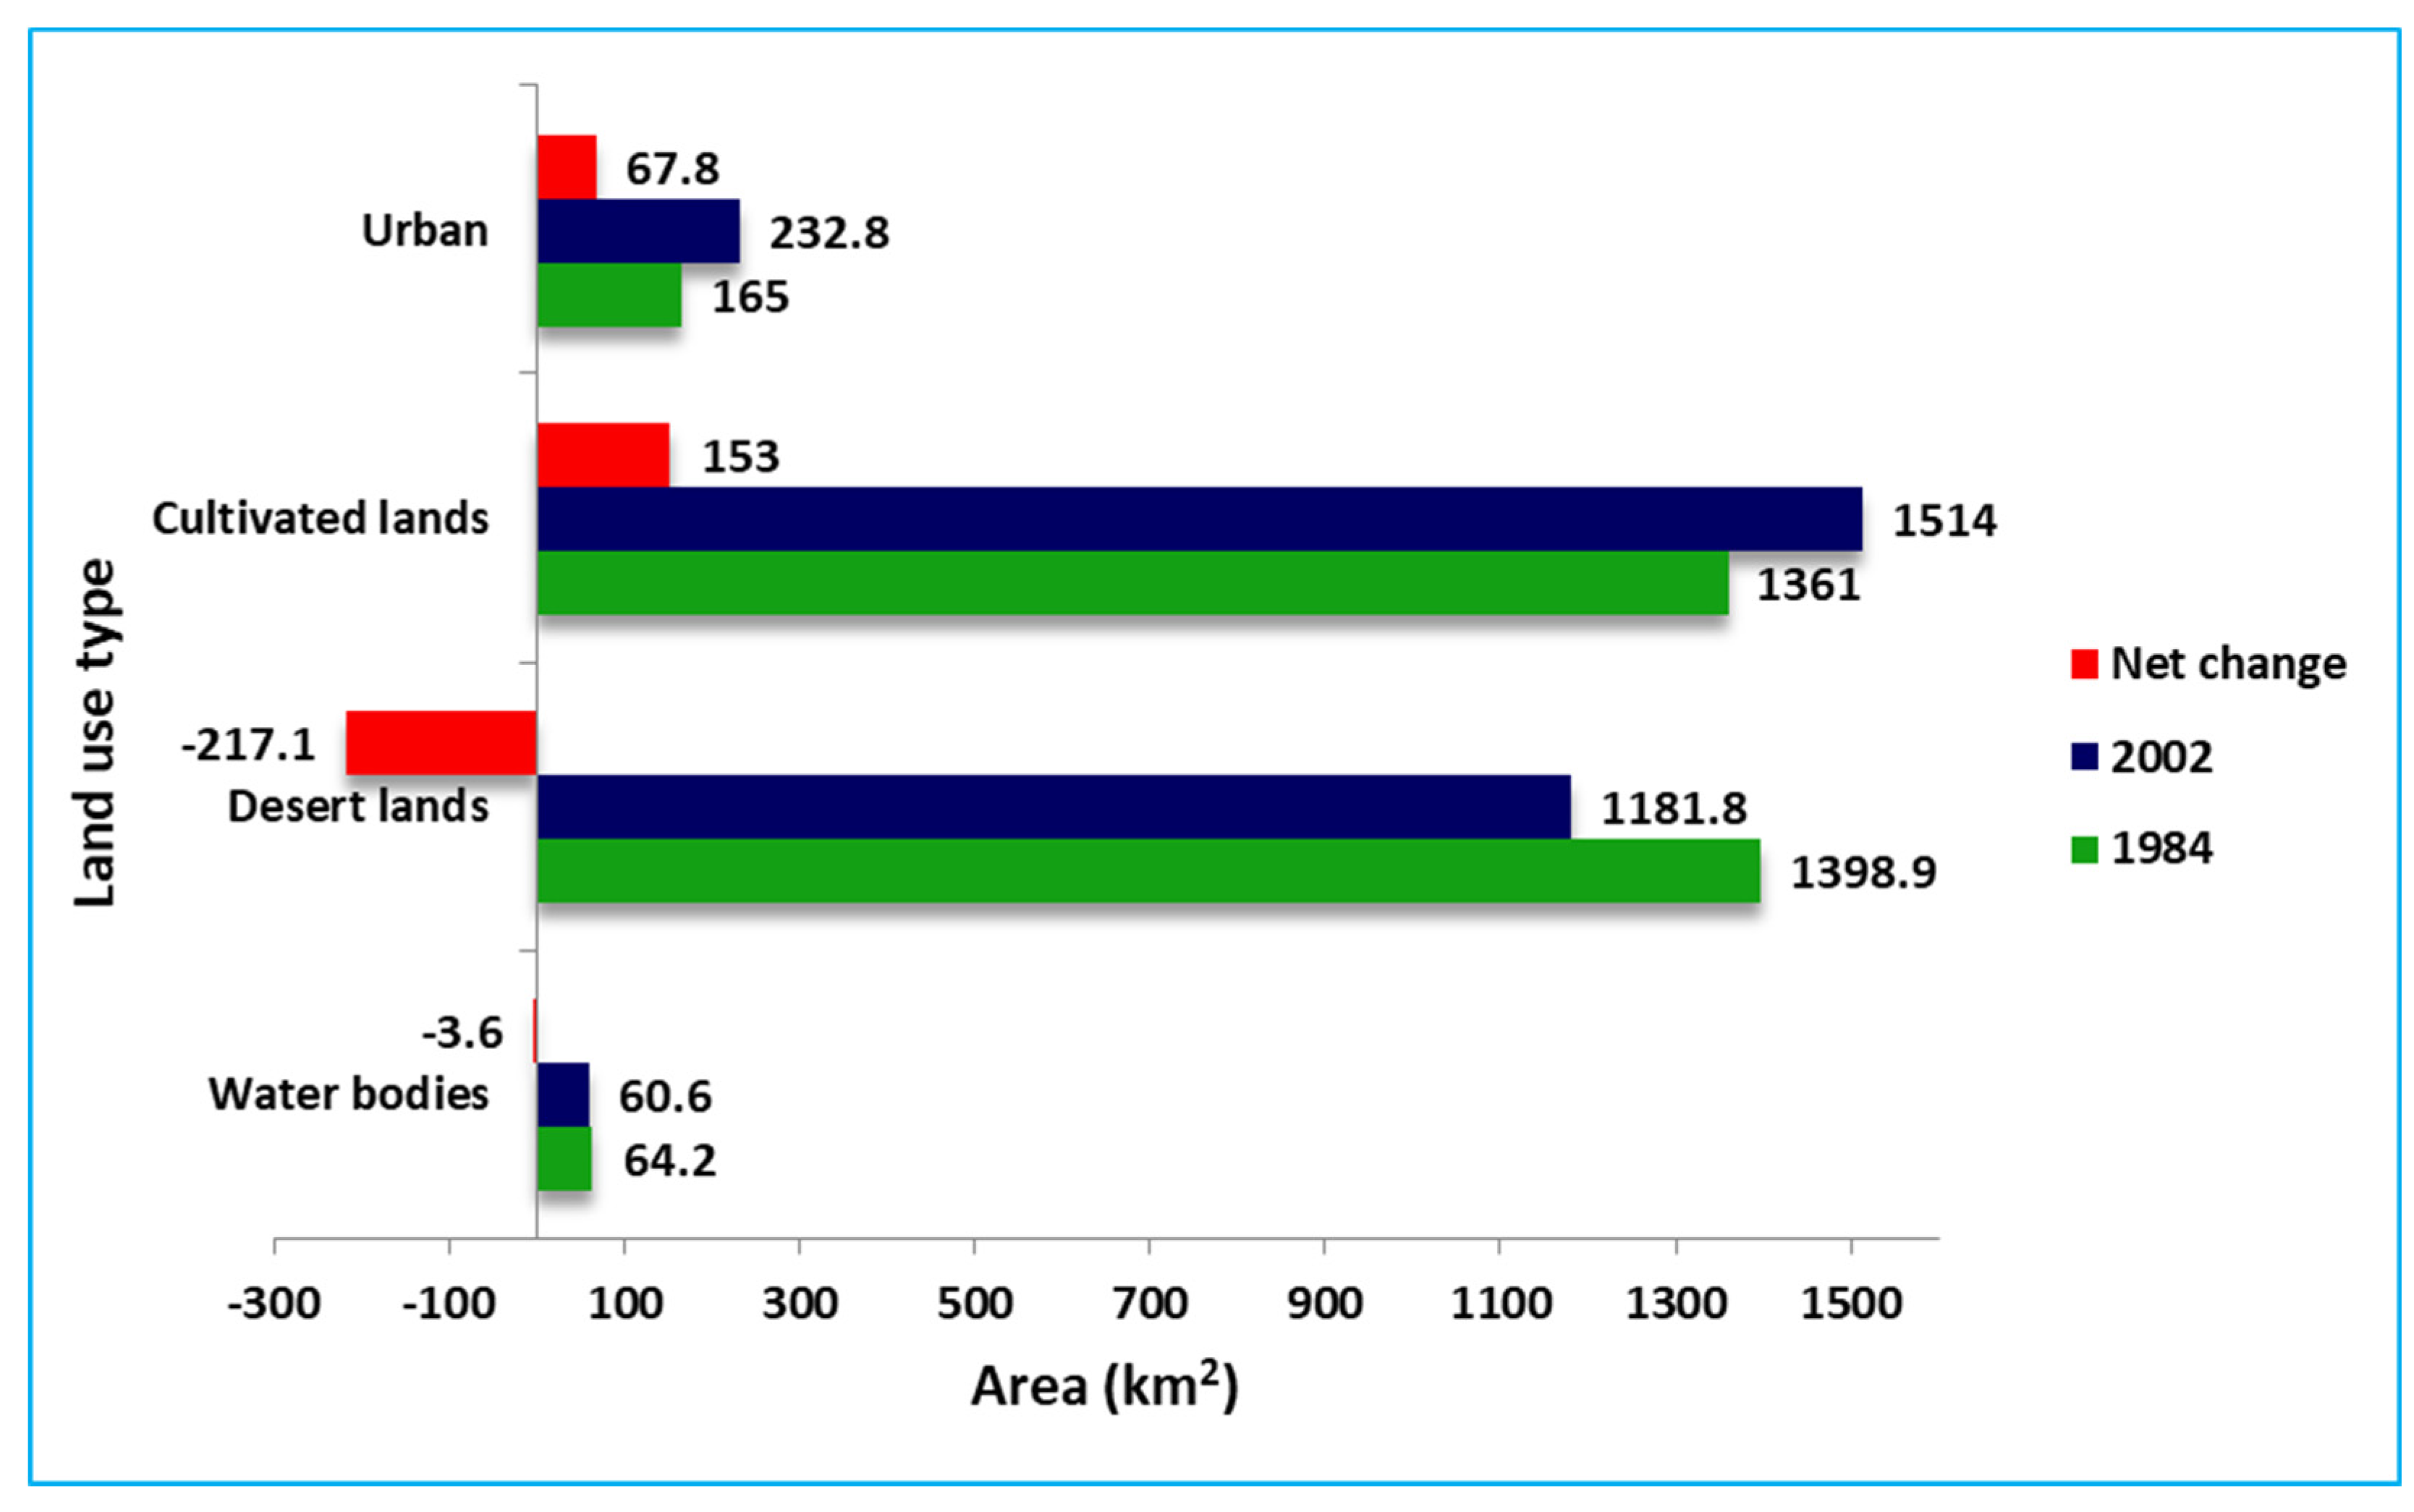
| Land Use | 1984 | 2002 | Change from 1984 to 2002 | 2013 | Change from 2002 to 2013 | 2022 | Change from 2013 to 2022 | ||||
|---|---|---|---|---|---|---|---|---|---|---|---|
| Areas | |||||||||||
| km2 | % | km2 | % | km2 | km2 | % | km2 | km2 | % | km2 | |
| WB | 64.2 | 2.2 | 60.6 | 2.0 | −3.6 | 68.6 | 2.3 | 8.04 | 101.8 | 3.4 | 33.21 |
| DL | 1398.9 | 46.8 | 1181.8 | 39.5 | −217.13 | 861.3 | 28.8 | −320.5 | 703.8 | 23.6 | −157.47 |
| CL | 1361.0 | 45.5 | 1514.0 | 50.7 | 152.99 | 1754.7 | 58.7 | 240.73 | 1814.5 | 60.7 | 59.73 |
| Urban | 165.0 | 5.5 | 232.8 | 7.8 | 67.74 | 304.5 | 10.2 | 71.73 | 369.0 | 12.3 | 64.52 |
| Total | 2989.1 | 100.0 | 2989.1 | 100.0 | 2989.1 | 100.0 | 2989.1 | 100.0 | |||
| K-Index | 2013 | 2022 |
|---|---|---|
| Kstandard | 0.8703 | 0.8402 |
| Kno | 0.9142 | 0.8942 |
| Klocation | 0.9336 | 0.9012 |
| Klocation strata | 0.9336 | 0.9012 |
| Land Use | Projected 2030 | Change from 2022 to 2030 | Projected 2040 | Change from 2030 to 2040 | Projected 2050 | Change from 2040 to 2050 | |||
|---|---|---|---|---|---|---|---|---|---|
| Areas | |||||||||
| km2 | % | km2 | km2 | % | km2 | km2 | % | km2 | |
| WB | 164.44 | 5.50 | 62.64 | 194.1 | 6.49 | 29.66 | 200.8 | 6.72 | 6.7 |
| DL | 459.71 | 15.38 | −244.09 | 312.4 | 10.45 | −147.31 | 245.4 | 8.21 | −67 |
| CL | 1746.63 | 58.43 | −67.87 | 1808.3 | 60.50 | 61.67 | 1851.5 | 61.94 | 43.2 |
| Urban | 618.35 | 20.69 | 249.35 | 674.3 | 22.56 | 55.95 | 691.4 | 23.13 | 17.1 |
| Total | 2989.13 | 100 | - | 2989.1 | 100 | - | 2989.1 | 100 | - |
Disclaimer/Publisher’s Note: The statements, opinions and data contained in all publications are solely those of the individual author(s) and contributor(s) and not of MDPI and/or the editor(s). MDPI and/or the editor(s) disclaim responsibility for any injury to people or property resulting from any ideas, methods, instructions or products referred to in the content. |
© 2023 by the authors. Licensee MDPI, Basel, Switzerland. This article is an open access article distributed under the terms and conditions of the Creative Commons Attribution (CC BY) license (https://creativecommons.org/licenses/by/4.0/).
Share and Cite
Selmy, S.A.H.; Kucher, D.E.; Mozgeris, G.; Moursy, A.R.A.; Jimenez-Ballesta, R.; Kucher, O.D.; Fadl, M.E.; Mustafa, A.-r.A. Detecting, Analyzing, and Predicting Land Use/Land Cover (LULC) Changes in Arid Regions Using Landsat Images, CA-Markov Hybrid Model, and GIS Techniques. Remote Sens. 2023, 15, 5522. https://doi.org/10.3390/rs15235522
Selmy SAH, Kucher DE, Mozgeris G, Moursy ARA, Jimenez-Ballesta R, Kucher OD, Fadl ME, Mustafa A-rA. Detecting, Analyzing, and Predicting Land Use/Land Cover (LULC) Changes in Arid Regions Using Landsat Images, CA-Markov Hybrid Model, and GIS Techniques. Remote Sensing. 2023; 15(23):5522. https://doi.org/10.3390/rs15235522
Chicago/Turabian StyleSelmy, Salman A. H., Dmitry E. Kucher, Gintautas Mozgeris, Ali R. A. Moursy, Raimundo Jimenez-Ballesta, Olga D. Kucher, Mohamed E. Fadl, and Abdel-rahman A. Mustafa. 2023. "Detecting, Analyzing, and Predicting Land Use/Land Cover (LULC) Changes in Arid Regions Using Landsat Images, CA-Markov Hybrid Model, and GIS Techniques" Remote Sensing 15, no. 23: 5522. https://doi.org/10.3390/rs15235522