Article

Multi-Frequency Differential Absorption LIDAR (DIAL) System for Aerosol and Cloud Retrievals of CO2/H2O and CH4/H2O

by
Jasper R. Stroud
1,
Gerd A. Wagner
2 and
David F. Plusquellic
1,*
1
Applied Physics Division, Physical Measurement Laboratory, National Institute of Standards and Technology, Boulder, CO 80305, USA
2
German Aerospace Center (DLR), Institute of Technical Physics, Pfaffenwaldring 38-40, 70569 Stuttgart, Germany
*
Author to whom correspondence should be addressed.
Remote Sens. 2023, 15(23), 5595; https://doi.org/10.3390/rs15235595
Submission received: 1 October 2023 / Revised: 23 November 2023 / Accepted: 29 November 2023 / Published: 1 December 2023

Abstract

:
We discuss a remote sensing system that is used to simultaneously detect range-resolved differential absorption LIDAR (light detection and ranging; DIAL) signals and integrated path differential absorption LIDAR signals (IPDA LIDAR) from aerosol targets for ranges up to 22 km. The DIAL/IPDA LIDAR frequency converter consists of an OPO pumped at 1064 nm to produce light at 1.6 μm and operates at 100 Hz pulse repetition frequency. The probe light is free space coupled to a movable platform that contains one transmitter and two receiver telescopes. Hybrid photon counting/current systems increase the dynamic range for detection by two orders of magnitude. Range resolved and column integrated dry-air CO2 and CH4 mixing ratios are obtained from line shape fits of CO2 and CH4 centered at 1602.2 nm and 1645.5 nm, respectively, and measured at 10 different frequencies over ≈1.3 cm−1 bandwidth. The signal-to-noise ratios (SNRs) of the IPDA LIDAR returns from cloud aerosols approach 1000:1 and the uncertainties in the mixing ratios weighted according to the integrated counts over the cloud segments range from 0.1% to 1%. The range-averaged DIAL mixing ratios are in good agreement with the IPDA LIDAR mixing ratios at the 1% to 2% level for both CO2 and CH4. These results can serve as a validation method for future active and passive satellite observational systems.

Graphical Abstract

1. Introduction

Active remote sensing systems based on differential absorption LIDAR (DIAL) [1,2,3,4,5,6] and integrated path differential absorption LIDAR (IPDA LIDAR) [7,8,9,10,11] have been demonstrated and characterized on local scales for their measurement precision and accuracy to study greenhouse gas (GHG) concentrations in the atmosphere. At lower sensitivity, the mixing ratios of the GHGs have to be monitored using ground-based DIAL systems for small-area emission studies where precisions typically range from 1% to 2% [1,2,4,11,12,13]. Higher precision IPDA LIDAR systems based on airborne systems have been used to develop spaceborne platforms and to later calibrate ground-based and spaceborne sensors [9,14,15] at precisions as low as ±0.3% for CO2 and ±0.5% for CH4 over 10 s of km ranges and on short time frames (<10 s).
On global scales, however, ground based systems are no match for the wide scale, broadband spectral imaging capacities of passive satellite observational systems that use reflected sunlight from the planet surface to assess the state and dynamics of GHG source and sink fluctuations. Like IPDA LIDAR systems, the accuracy requirements are high for satellite systems that measure the column-averaged concentrations of GHGs because of the small contributions that surface fluxes make to these averages. Consequently, current satellite systems are specified with low uncertainties, <±1 ppm (<±0.25%) for CO2 and <±10 ppb (<±0.5%) for CH4. Future LIDAR-based satellite missions [16,17,18,19] are also planned for climate studies on a global scale to measure GHG mixing ratios and, in the case of CH4, with statistical and systematic uncertainty requirements approaching 2 ppb (±0.1%) [20].
Current DIAL and IPDA LIDAR system development for remote sensing of CO2 and CH4 focuses on the near-infrared spectral regions (1572 nm (CO2), 1602 nm (CO2), 1645 nm (CH4), 2050 nm (CO2)). The main technological challenges are the selection of a suitable laser source and detector, both of which have been the subject of numerous studies for current research systems over the past decade (see the overview given in [11]). The latest developments for DIAL [4] and IPDA LIDAR [9,11,21] systems make use of multiple frequencies to sample the absorption line profile and use subsequent spectral line shape fitting to obtain the GHG mixing ratios. This method is found here to be particularly advantageous for complicated line shapes consisting of multiple underlying transitions (e.g., CH4) and/or multi-species determinations (e.g., CH4 and H2O, denoted CH4/H2O or CO2/H2O,). Additional advantages have been realized in studies to and through clouds to enhance sensitivity [5,9,22]. For example, previous IPDA LIDAR studies from aircraft [9] measured 30 points across the CO2 line shape to perform studies to cloud tops and through clouds to the surface at a reported precision of <±0.2% and a bias of <±0.25% in a 1 s average. Cloud targets have also found importance in the specification of the overall spectral purity of the DIAL frequency converter from comparisons of the online and offline frequency returns [23].
The work presented here demonstrates the application of a 10-frequency DIAL system to study GHG mixing ratios of CO2/H2O and CH4/H2O from aerosol and cloud aerosol returns using a laser based on an optical parametric oscillator (OPO) [22]. We present the data processing and mixing ratios obtained from IPDA LIDAR retrievals to clouds and make comparisons to the column-averaged DIAL mixing ratios to validate the methods. The primary objective of this work is to evaluate the precision and to investigate sources of bias of a standoff platform to simultaneously perform range-resolved DIAL measurements and IPDA LIDAR measurements to cloud targets for ranges up to 20 km and for averaging times of 10 min. One intended application is to perform future measurements in a mobile platform to cross validate the results against the GHG mixing ratios and uncertainties measured at Total Carbon Column Observing Network (TCCON) sites that are used worldwide to provide calibrations of passive satellite systems. The results we present here for cloud returns achieve the targeted precision of ±0.5% for dry-air mixing ratios of CH4 but only partially achieve the goal of ±0.25% uncertainty for dry-air CO2. We discuss additional methods for improving the measurement precision and accuracy that we expect are needed to reach these detection limits for both GHGs.
This paper is structured as follows: Section 2.1 presents the experimental 10-frequency OPO transmitter and movable transceiver platform used to perform DIAL and IPDA LIDAR studies of CO2/H2O and CH4/H2O. Section 2.2 discusses the DIAL and IPDA LIDAR data processing including the line shape fitting procedure to obtain GHG concentrations and mixing ratios. Section 2.3 reviews the latest spectroscopic improvements to the CH4 line shape near 1645 nm. Section 3 presents the data processing for IPDA LIDAR retrievals from diffuse clouds (3.1), the IPDA LIDAR results for CO2/H2O and CH4/H2O (3.2), the DIAL results for CO2/H2O and CH4/H2O (3.3), and a comparison of the mixing ratios obtained from the DIAL and IPDA LIDAR retrievals. A discussion of the uncertainties relative to satellite calibration requirements and the possible sources of bias observed in the CH4 line shapes is given in Section 4. The paper closes with conclusions and outlook in Section 5.

2. Experiment

2.1. Combined DIAL and IPDA LIDAR Hardware Description and Line Selection Criteria

A schematic of the overall system setup at NIST (Boulder, CO, USA) is shown in Figure 1 and the system specifications are given in Table 1 [24]. The frequency converter that includes the optical parametric oscillator (OPO) seed system is nearly identical to the system described in refs. [4,11]. Briefly, we sequentially generate 10 seed frequencies of high spectral purity (>99.9%) over a spectral bandwidth of ≈40 GHz using a filter cavity and a broadband electro-optic phase modulator driven by a fast scan microwave (MW) synthesizer. The different frequencies are generated at the 100 Hz pulse repetition frequency (PRF) of the injection-seeded 1064 nm Nd:YAG pump laser. A PZT in the OPO cavity is controlled by the Pound–Drever–Hall lock signal (PDH lock method [25]) to rapidly bring each seed frequency into cavity resonance prior to the arrival of the pump pulse. The frequency sequence is continuously repeated every 100 ms to give a 10 Hz overall scan repetition frequency (SRF). The KTA crystals of the OPO are cut so that the signal wave can be angle-tuned for type I phase matching over the spectral region from 1600 nm to 1650 nm. The angles of the two crystals were adjusted for the optimal signal wave pulse energies and flatness over the 40 GHz spectral bandwidth. To ensure eye-safe operation, the signal wave is separated from the pump and idler waves using a prism beam separator containing four SF6 60° prisms in a folded wavelength-compensating-path configuration. In the two spectral regions investigated in this work (near 1602 nm and 1645 nm), the signal pulse energies generated were ≈5 mJ at a pump energy of ≈170 mJ and have measured nearly transform-limited linewidths of ≈190 MHz [4].
The remaining aspects of the system that includes the movable platform (91 cm × 152 cm) weighing more than 300 kg are new to this work and shown in Figure 1. The platform pivots (about the tilt axis) along the front edge near the laboratory exit port to provide a 0° to 30° of inclination using a pneumatic cylinder equipped with an internal slide wire for position encoding. The encoder signal is used for active feedback to a proportional–integral–differential (PID) controller of the air pressure to the cylinder. A stepper motor stage is used for lateral rotation (about the rotation axis) of the platform by ±30°. The signal wave output is propagated along a Coudé path that uses two galvanometers, Galvo-X and Galvo-Y, for X and Y beam steering, respectively, (where X is parallel, and Y is normal to the platform surface) and a quadrant photodetector for locking the position of the transmit beam as the platform is moved. After reflecting from the Galvo-X and Galvo-Y mirrors, the beam is reflected along the center axis of the rotation stage and then to a 45° mirror located on the center axis and fixed to the platform. This configuration keeps the X position of the transmit beam fixed as the platform is rotated. The beam is then directed to a 254 mm expanding telescope (Tx) for Class I level transmission with a beam divergence of <400 μrad. To keep the pointing direction of the transmit beam fixed along the Y direction as the platform is tilted, the rotation axis of Galvo-Y is aligned colinear with the tilt axis of the platform. The encoded signal from the cylinder is gain-corrected and used as the input signal (feedforward) to Galvo-Y to keep of the transmit beam parallel to the platform surface as it is tilted. To remove the remaining pointing errors in the galvanometers’ beam steering relative to the platform motion, a small portion of the transmit beam illuminates the quadrant photodetector mounted on the platform. The detector’s differential error signal in the Y direction is electronically added to the Galvo-Y input signal for fine level feedback to lock the transmit beam to the center of the detector along Y. Likewise, the differential error signal in the X direction is used as input to Galvo-X to lock the transmit beam to the detector’s center along the X direction.
Two receiver telescopes (Rx) are positioned on either side of Tx and consist of 279 mm near-field (NF-Rx) and 406 mm far-field (FF-Rx) telescopes having fields of view (FOV) of 3 mrad and 2 mrad, respectively (only the FF data are discussed in these studies). Both are equipped with altitude/azimuth mount for alignment with the fixed transmitted beam. The collected light is coupled into 1 mm multi-mode fibers (MMF) and then free-space-coupled to near-IR photomultiplier tubes (PMTA and PMTB) housed in a temperature-cooled box. Optical bandpass filters inserted between the MMF and the PMT are centered at 1602.2 nm for CO2/H2O and 1645.5 nm for CH4/H2O and have peak transmissions of >90% and a full width at half maximum (FWHM) bandpass of 2 nm. To aid in reducing background light during daytime viewing, filter wheels are available with optical densities (OD) from 0 to 3. The NF and FF channels are amplified with a transimpedance gain of 5 kV/A (AMP) and digitized separately at 2 × 10⁹ samples (2GS) per second (0.5 ns/point) with 8 bits of resolution (ADC). The digitized signals are processed in real time to (i) discriminate and photon count the individual pulses (ΔtFWHM ≈ 3.5 ns) and (ii) accumulate the digital values (which are proportional to the PMT current) for each receiver. The counts and current were stored separately for each transmitted frequency and receiver resulting in 40 data segments that are stored every 10 s in Network Common Data Form file format (NetCDF). The range for each retrieval was truncated at 48 km.
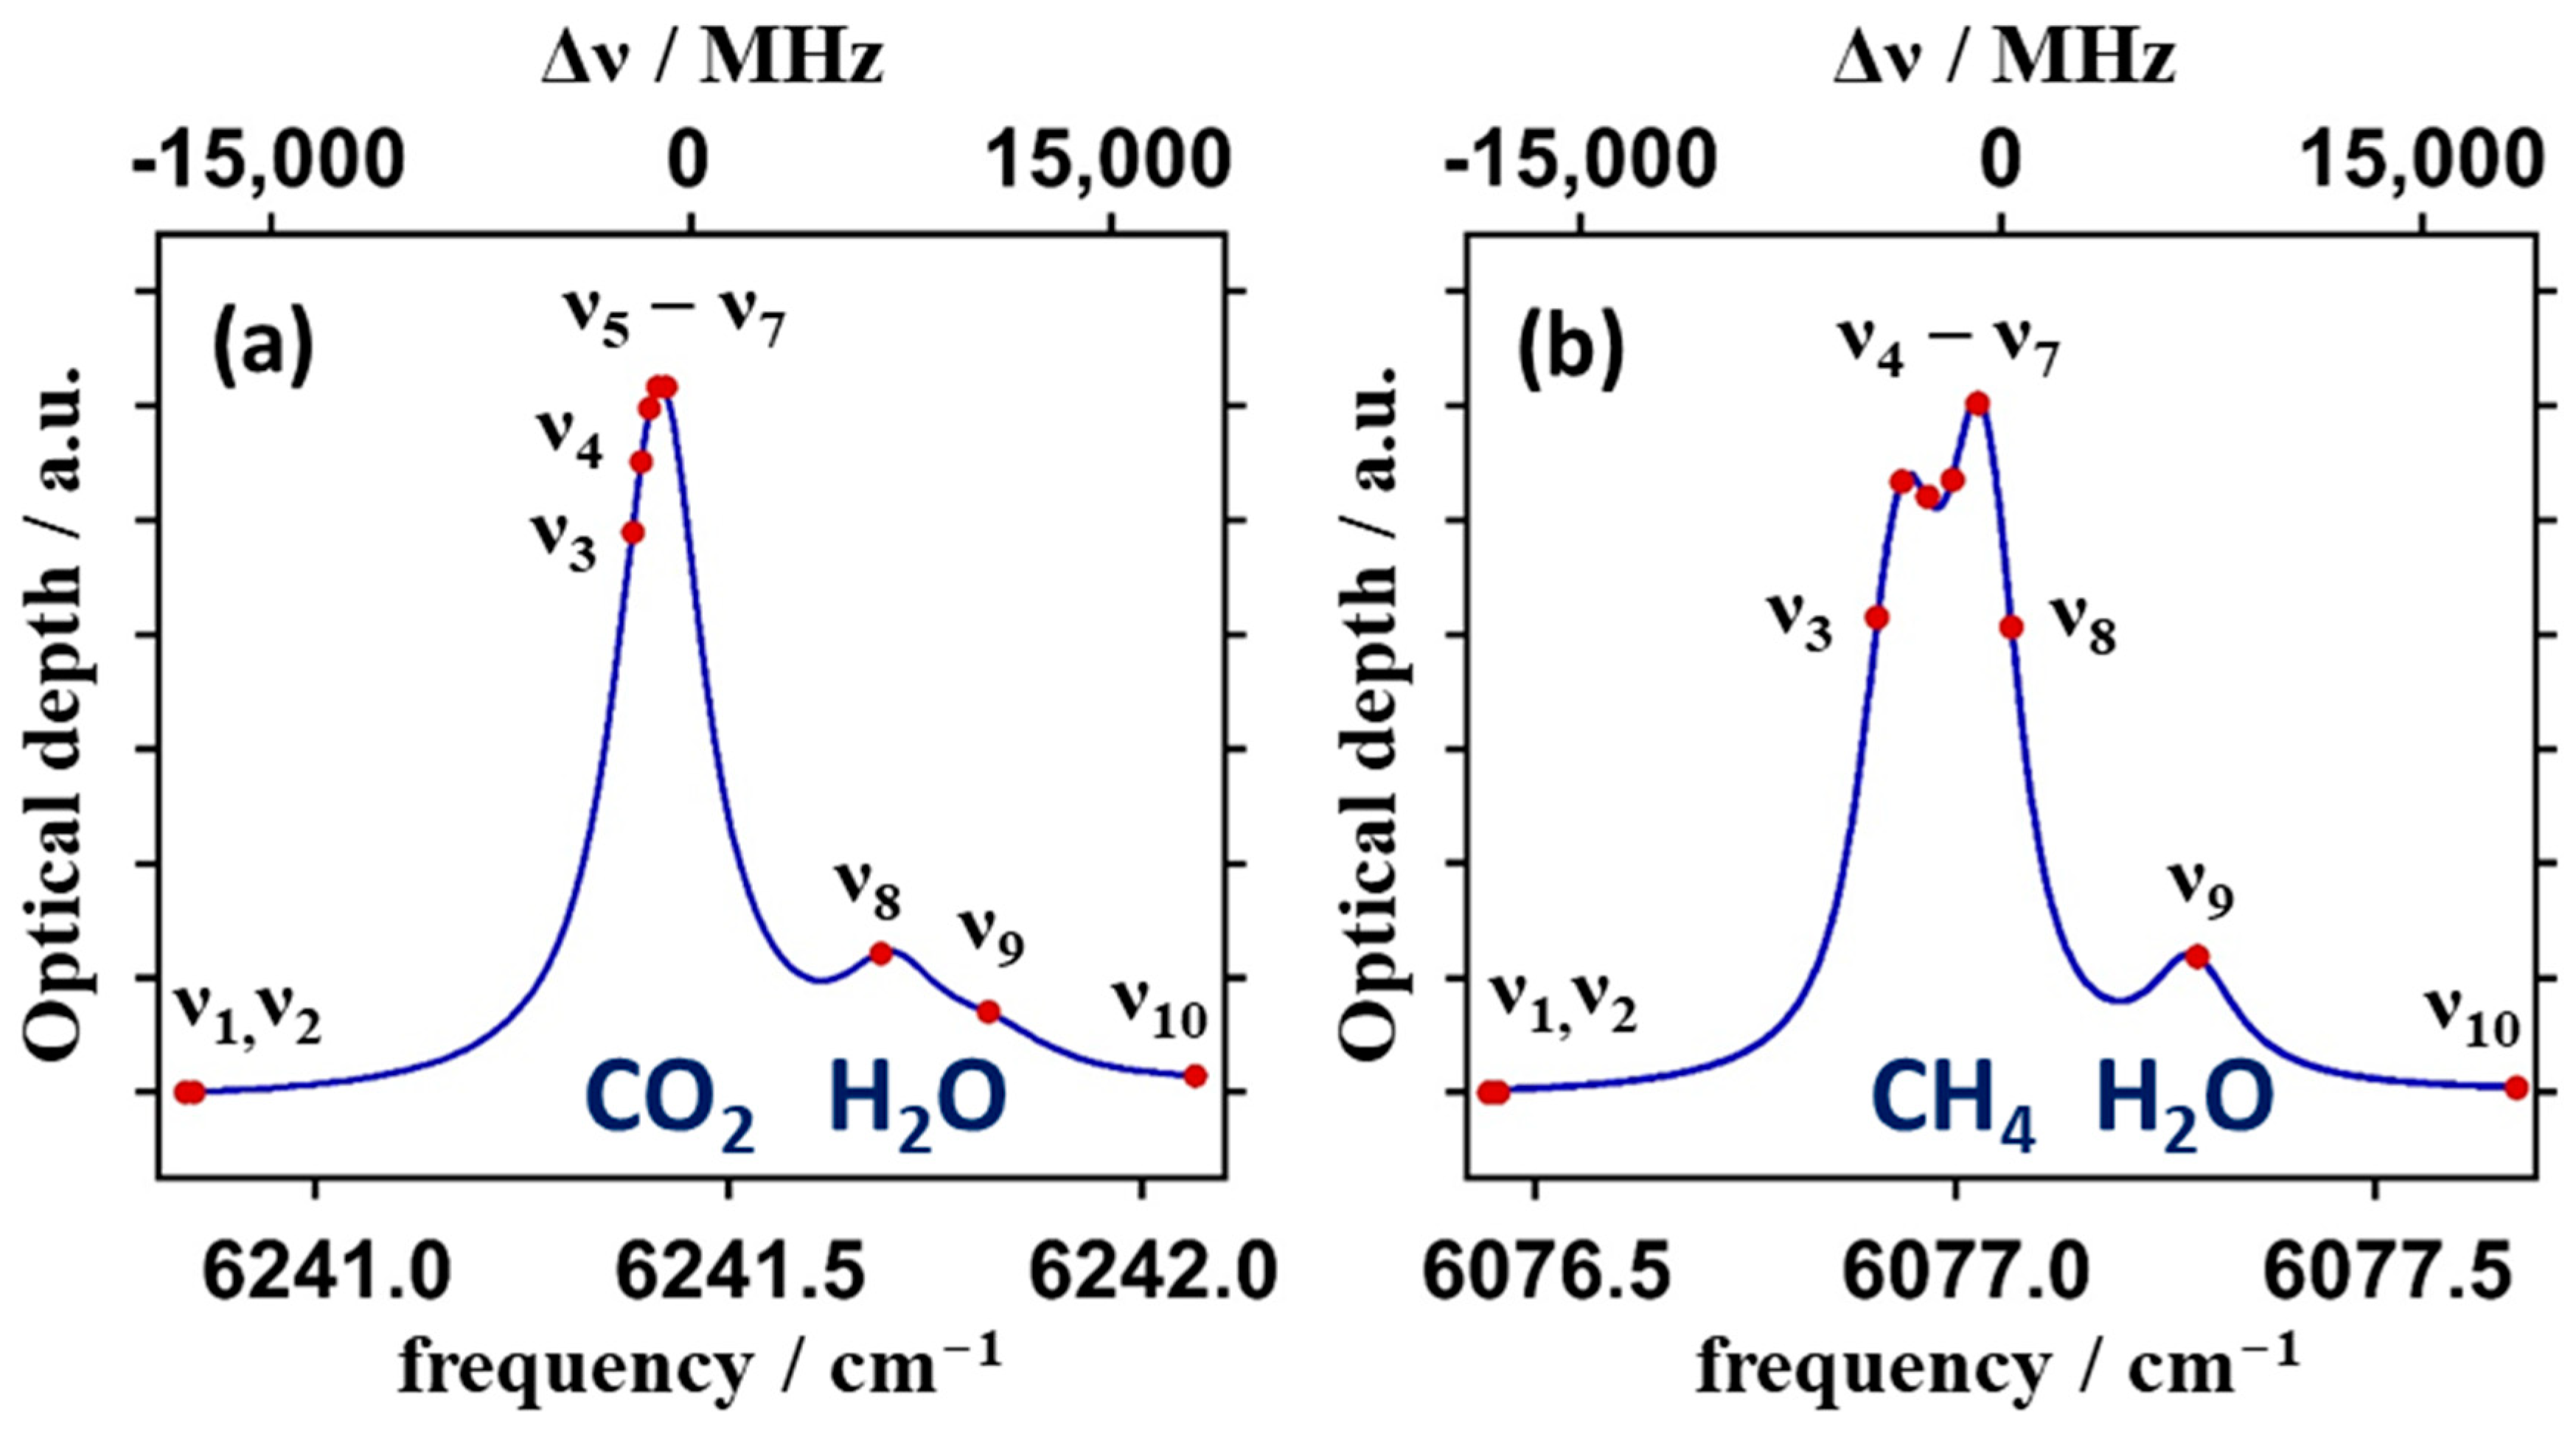
Two spectral regions targeted for these studies are illustrated in Figure 2a,b and consist of the R(18e) CO2 line of the 30013-0001 band at 1602.205 nm (6241.40 cm−1) and the R(6) manifold of the 2ν3 band of CH4 centered at 1645.534 nm (6077.05 cm−1). The choice for the line selection is based on several factors. First, the CO2 and CH4 lines selected are among the strongest transitions in the bands over the temperature range of these studies (320 K to 285 K). The temperature sensitivity of the CO2 and CH4 lines causes an ≈11% and ≈13% increase in the optical depths, respectively, over this high-to-low temperature range. Second, for CH4 at atmospheric conditions, all transitions in the 2ν3 band consist of a series of unresolved pressure broadened rovibrational lines. The multiplet arises from Coriolis coupling which severely complicates the dependence of the line shape function and integrated intensity on temperature, pressure, line mixing and speed-dependent effects. Given the importance of this manifold to the MERLIN mission [16], high-accuracy cavity ring down studies have recently been performed on the R(6) manifold [26,27] to determine the line-mixing and speed-dependent parameters over the wide range of atmospherically relevant conditions. As we discuss below, these refined parameters are necessary to minimize the residuals in the fits. Third, both selected regions in Figure 2 contain a nearby water vapor line or lines. Dry-air mixing ratios derived from [X]dry = [X]/(1 − 0.01·[H2O]), where X = CO2 or CH4 and [H2O] is percent mole fraction (PCM), are the universally comparable data products needed from atmospheric GHG studies. For relative humidities from 20% to 50%, the dry air correction can increase the dry air concentrations between 0.6% and 1.5%, so the water vapor concentrations are needed to remove this bias.
For the CO2/H2O region shown in Figure 2a, five frequencies are selected on the CO2 line and two frequencies on the H2O line pair at 1602.133 nm and 1602.102 nm (6241.68 cm−1 and 6241.81 cm−1), and the remaining 3 frequencies sample the baseline regions at both ends of the spectrum. For the CH4/H2O region shown in Figure 2b, six frequencies sample across the doublet structure of the CH4 manifold, one frequency on the H2O line at 1645.471 nm (6077.28 cm−1) and the remaining three frequencies sample the baseline regions on both ends. Over a range of 250 m (500 m path length), the optical densities of CO2 and CH4 are near 4% for ambient levels of CO2 (≈420 ppm) and CH4 (≈2 ppm).
The choice of frequencies chosen to sample the CO2 and CH4 line shapes is based on the following reasons. In general, the best SNR is expected for frequencies that sample across the maximum difference in absorbance between the online and offline regions which is analogous to 2-frequency DIAL. Therefore, maintaining this large absorbance difference in multi-frequency DIAL requires localizing the additional frequencies in these two regions. An added advantage of the multi-frequency approach is the ability to select more online vs. offline frequencies to offset the lower count rates of the online absorption to improve the SNR of the line shape measurement. The multiple offline frequencies that sample regions on both sides of the line help to minimize frequency-dependent effects in the detection system that impact the baseline absorption profile. Moreover, multiple frequencies that sample near the peak of the absorption enable the accurate determination of the line center frequencies from least square fits. This determination is particularly important in our strongly pumped OPO system to remove the offset and drifts associated with the seed–signal mismatch [28] that has been shown to range from 100 to 150 MHz in our system [4]. Finally, while adding more frequencies to the scan may be useful to better evaluate line shapes and even the temperature and pressure (T&P) profiles in the retrievals, there is a tradeoff between the resulting slower scan rate and SNR. These tradeoffs are currently under investigation.

2.2. Raw Data Processing and Concentration Fitting Procedure

The pre-processing of the raw data follows the procedure discussed previously [4]. Briefly, the hybrid photon counter/current detection system consists of a dual-channel 8-bit digitizer that samples the amplified output voltages of the PMTs at a rate of 2 GS/s. This is fast enough to resolve the individual photons detected at the PMT with 7 samples across the full width of each count pulse. Double counting is prevented by skipping 6 samples following threshold detection. In software (JB64, v6.05.09), the accumulated photon counts and the direct sum over the digital signals which is proportional to the PMT current are saved in separate records on 10 s intervals for both the NF and FF receivers and each frequency in NetCDF format.
For each of the 10 frequencies, the processing begins with the accumulation of the photon counts and the current signals over 10 consecutive ADC samples which reduces the range resolution to ≈1.5 m. Then, the 10 min average intervals of counts and current are determined for each frequency by averaging over 60 consecutive 10 s intervals. To splice together the current and counts intervals, a series of non-linear least square fits (NLLSFs) are first performed to determine the saturation parameters to correct the counts for pulse pileup error [29]. The individual parameters are typically fit over a region where the count rates range between N = (1 − 5) × 106 counts/s. The interval-averaged saturation parameter at each frequency is then fixed and the NLLSF repeated to fit the current to the count intervals using the best fit scalar and offset parameters for each interval. This hybrid detection scheme extends the linearity of the photon counting system by two orders of magnitude. These same saturation parameters at each frequency are used for the fitting of splices over the enhanced backscatter regions from cloud returns when the saturated count threshold levels are exceeded.
To fit the concentrations of the DIAL and IPDA LIDAR profiles at each altitude (i.e., at each T&P), we first generate line shape templates for CO2 and CH4 at 400 ppm and 2 ppm, respectively. Given that the CO2 line is a single transition and that we use only 5 online frequencies near the peak of the absorption to measure the line, a higher accuracy line shape function that includes line mixing and speed dependent effects was not necessary [30]. Therefore, the template line shape function used was a Voigt profile based on the line broadening and shift parameters reported in the HITRAN 2020 database [31]. However, for CH4, the most accurate line shape function was required and discussed separately below. Voigt functions for the nearby water vapor lines were added to the overall profile at the 1% (10,000 ppm) level.
For the fits of the range-resolved DIAL concentrations, the raw data are processed at the 10 frequencies using a numerical procedure described in [4]. The differential absorption optical depth, DAOD(R,νi), at each of the 10 frequencies, νi, is first determined from the integrated photon count data, Ni, at range R = (R1 + R2)/2 with range resolution ΔR = (R2R1) from
D A O D R , ν i = l n N i ( R 1 ) N b ( R 2 ) N b ( R 1 ) N i ( R 2 )
where Nb is the one of the background frequencies chosen as the first frequency (i.e., D A O D R , ν 1 = 0) and R = 0 is where the pulse leaves the transmitter telescope. Determinations of the DAOD(R,νi) using the other offline frequencies gave results within the reported uncertainties of the concentrations. From our prior DIAL study of CO2 [4], the OPO signal-wave frequency is known to be shifted by 100 MHz to 150 MHz relative to the input seed frequency. To account for this shift prior to performing fits of the DIAL concentrations, the frequency offset of each 10 min interval was determined from fits to the averaged profile of the first 6 range bins. Minor adjustments to this offset were made based on the small model-based pressure shift that results from changes in altitude with range.
The final fits of the optical densities at the 10 frequencies were obtained by varying a baseline offset, slope and the scaling factors of the line shape templates. Because of the much higher SNR of the IPDA LIDAR data, the frequency offset was simultaneously varied in the fit of each profile. All template components of a given species were scaled together to give concentrations in μmol/mol (ppm) for CO2 and CH4, and in percent mol/mol (PCM) for water vapor. We also note that the linewidth of the laser (190 MHz) was added in quadrature to the Gaussian component of the profile and the T&P used at each altitude were derived from the U.S. Standard Atmosphere model [32] after correction for the weather station data at the base altitude of the transmitter in Boulder (1655 m). Further details of the IPDA LIDAR processing procedure are given in Section 3.2.

2.3. Methane Line Shape Profile

The line shape function of the R(6) manifold of the 2ν3 band of CH4 is complicated given that it is an unresolved profile under atmospheric conditions primarily composed of the overlap of 6 individual pressure broadened lines. This complexity has likely contributed to the significant changes in the cross sections and Voigt line shape parameters reported in the HITRAN databases over the past 20 years. Moreover, the line shape is further complicated by line-mixing and speed-dependent effects which cannot be modeled by a simple Voigt profile used in HITRAN. Given the importance of the R(6) line for the upcoming active satellite IPDA measurements from MERLIN [16,17], several cavity ringdown studies have been performed to (i) measure the precise line centers of the 6 lines using saturation spectroscopy [33,34] and (ii) fit the T&P dependence of these transitions [26,27] to the Hartmann–Tran profile (HTP) [35] that includes line-mixing and speed-dependent effects. As a result of the high sensitivity of the IPDA LIDAR returns, we found it necessary to make use of this model to minimize the residuals. It is further noted that the overall integrated intensity of the HTP R(6) profile is scaled to that of HITRAN 2020 [27] and that additional studies are underway at NIST to link the intensity scale to the International System of Units (SI).

3. Results

3.1. IPDA LIDAR Studies of Signal Returns from Diffuse Clouds

The measurements of the CO2/H2O region were performed over the 5 h nighttime period on 24 November 2021 beginning at 8:08 PM local time. The telescope was at an inclination of 2.5° above the horizon and pointed ≈−10° off North across the city of Boulder. The measurements of the CH4/H2O region were performed over the 5 h nighttime period on 28 April 2022, beginning at 10:05 PM local time. The telescope was at an inclination of 10.5° and pointed ≈+2.4° off north across the city of Boulder.
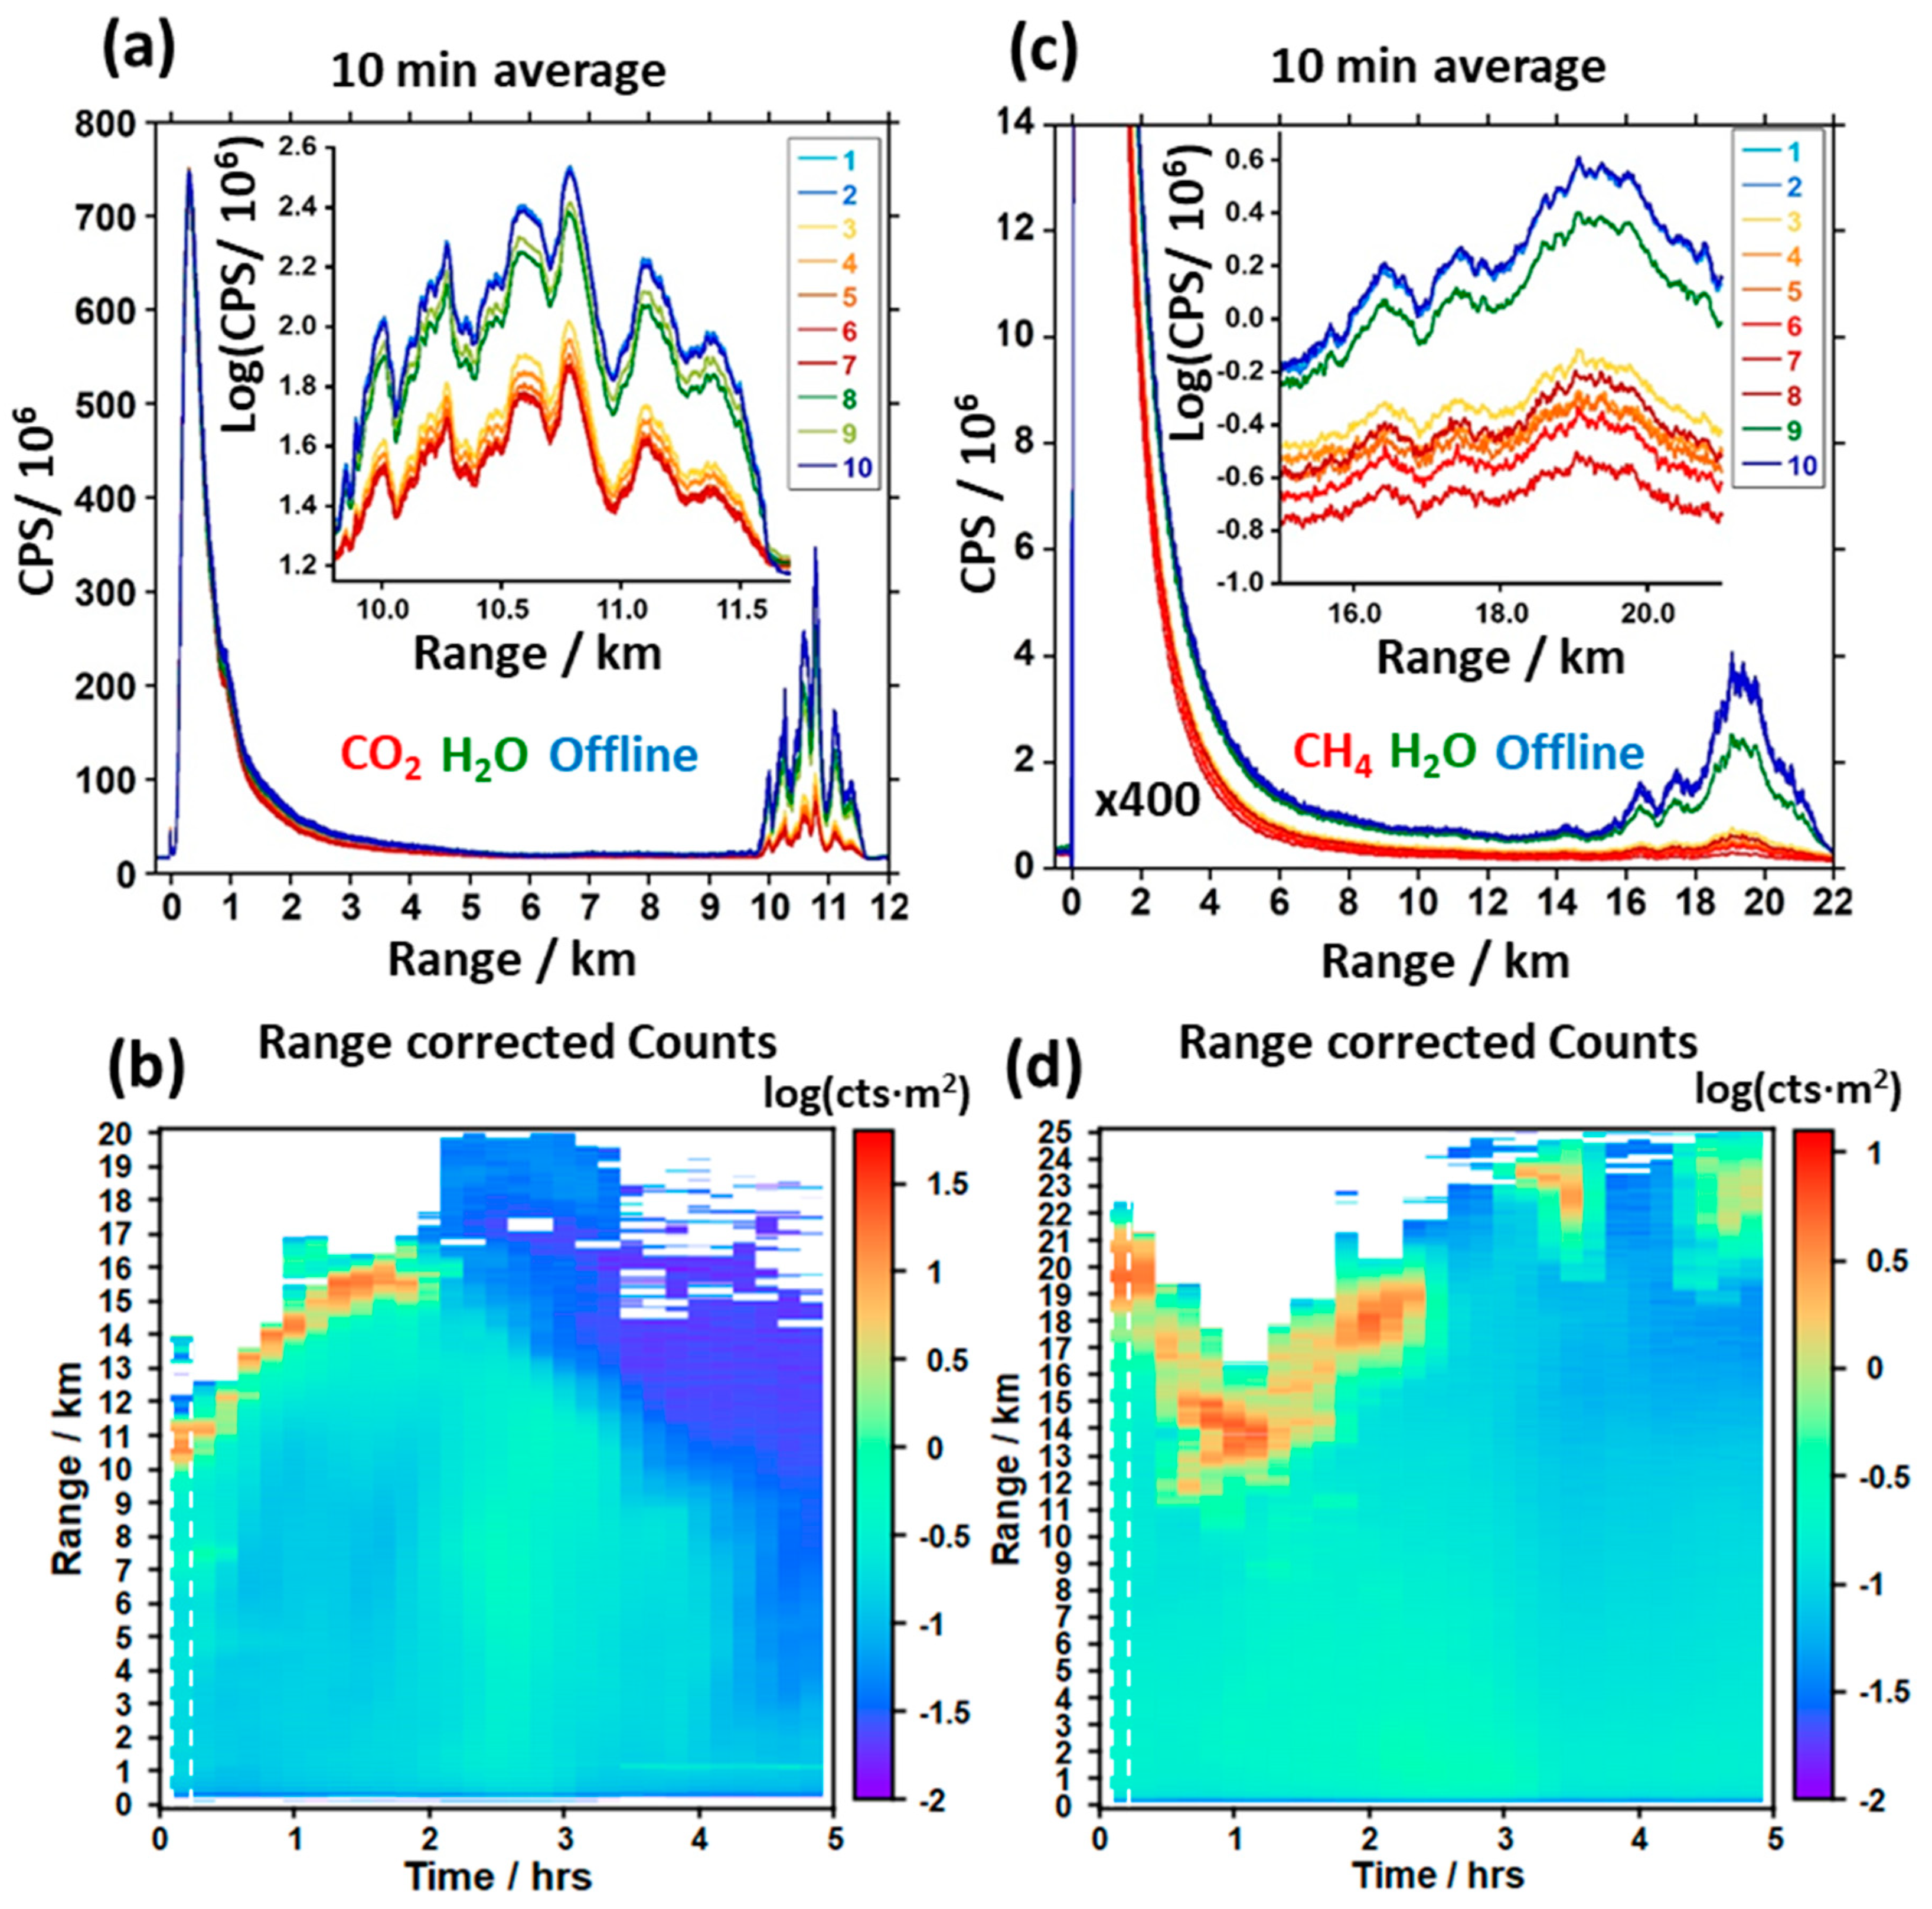
The logarithm (base 10) of the range- and background-corrected LIDAR map for the first offline frequency (ν1) in the CO2 region is shown for the full measurement period in Figure 3b. Cross-sections of the LIDAR returns are shown in Figure 3a at each of the 10 frequencies for the first 10 min interval. In the first 2 h period, normal aerosol returns extend to about 10 km, at which point the scattering is significantly enhanced upon passing through a ≈2 km cloud segment centered at ranges from 10 km to 16 km. The offline cloud signal returns (shown in blue shades) exceed 200 × 106 count/s and are of the same magnitude as seen near the peak of the signal return near 0.5 km. The inset in Figure 3a shows an expanded region of the first 10 min interval over the cloud segment. The signal returns are plotted on a logarithmic scale to enhance their separation at each frequency. From a comparison of the online (orange/red shades) and offline (blue shades) returns in the cloud region, the CO2 absorption signal over this 20+ km pathlength represents ≈85% fractional absorption.
The logarithm (base 10) of the range- and background-corrected LIDAR map for the first offline frequency (ν1) in the CH4 region is shown for the full measurement period in Figure 3d and a cross section cut of the raw returns at all 10 frequencies is shown in Figure 3c for ranges up to 22 km. The enhanced backscatter from the more diffuse clouds extends over a 6 km range beginning near 15 km and is 50 times weaker than the CO2 cloud region shown in Figure 3a. The inset in Figure 3c shows an expanded region of the first 10 min interval over the cloud segment. Again, the signal returns are plotted on a logarithmic scale to enhance their separation at each frequency. With the pathlength being nearly double that of the CO2 region, the online fractional absorption in the CH4 cloud region is ≈95% of the offline returns. Furthermore, the larger returns for the CO2 region are above the saturated count threshold and required the use of the PMT’s current channel, while the returns in the CH4 region remained linear in photon counts. Therefore, these two studies represent near limiting cases for backscatter studies from clouds.
The range dependence of the optical depth gives a better representation of the signal-to-noise ratio of the returns. The natural logarithm of the ratios for each frequency, k, relative to the first offline color gives the optical depth, OD(R), as a function of range, R, from
O D k R = l n N k ( R ) N 1 ( R )
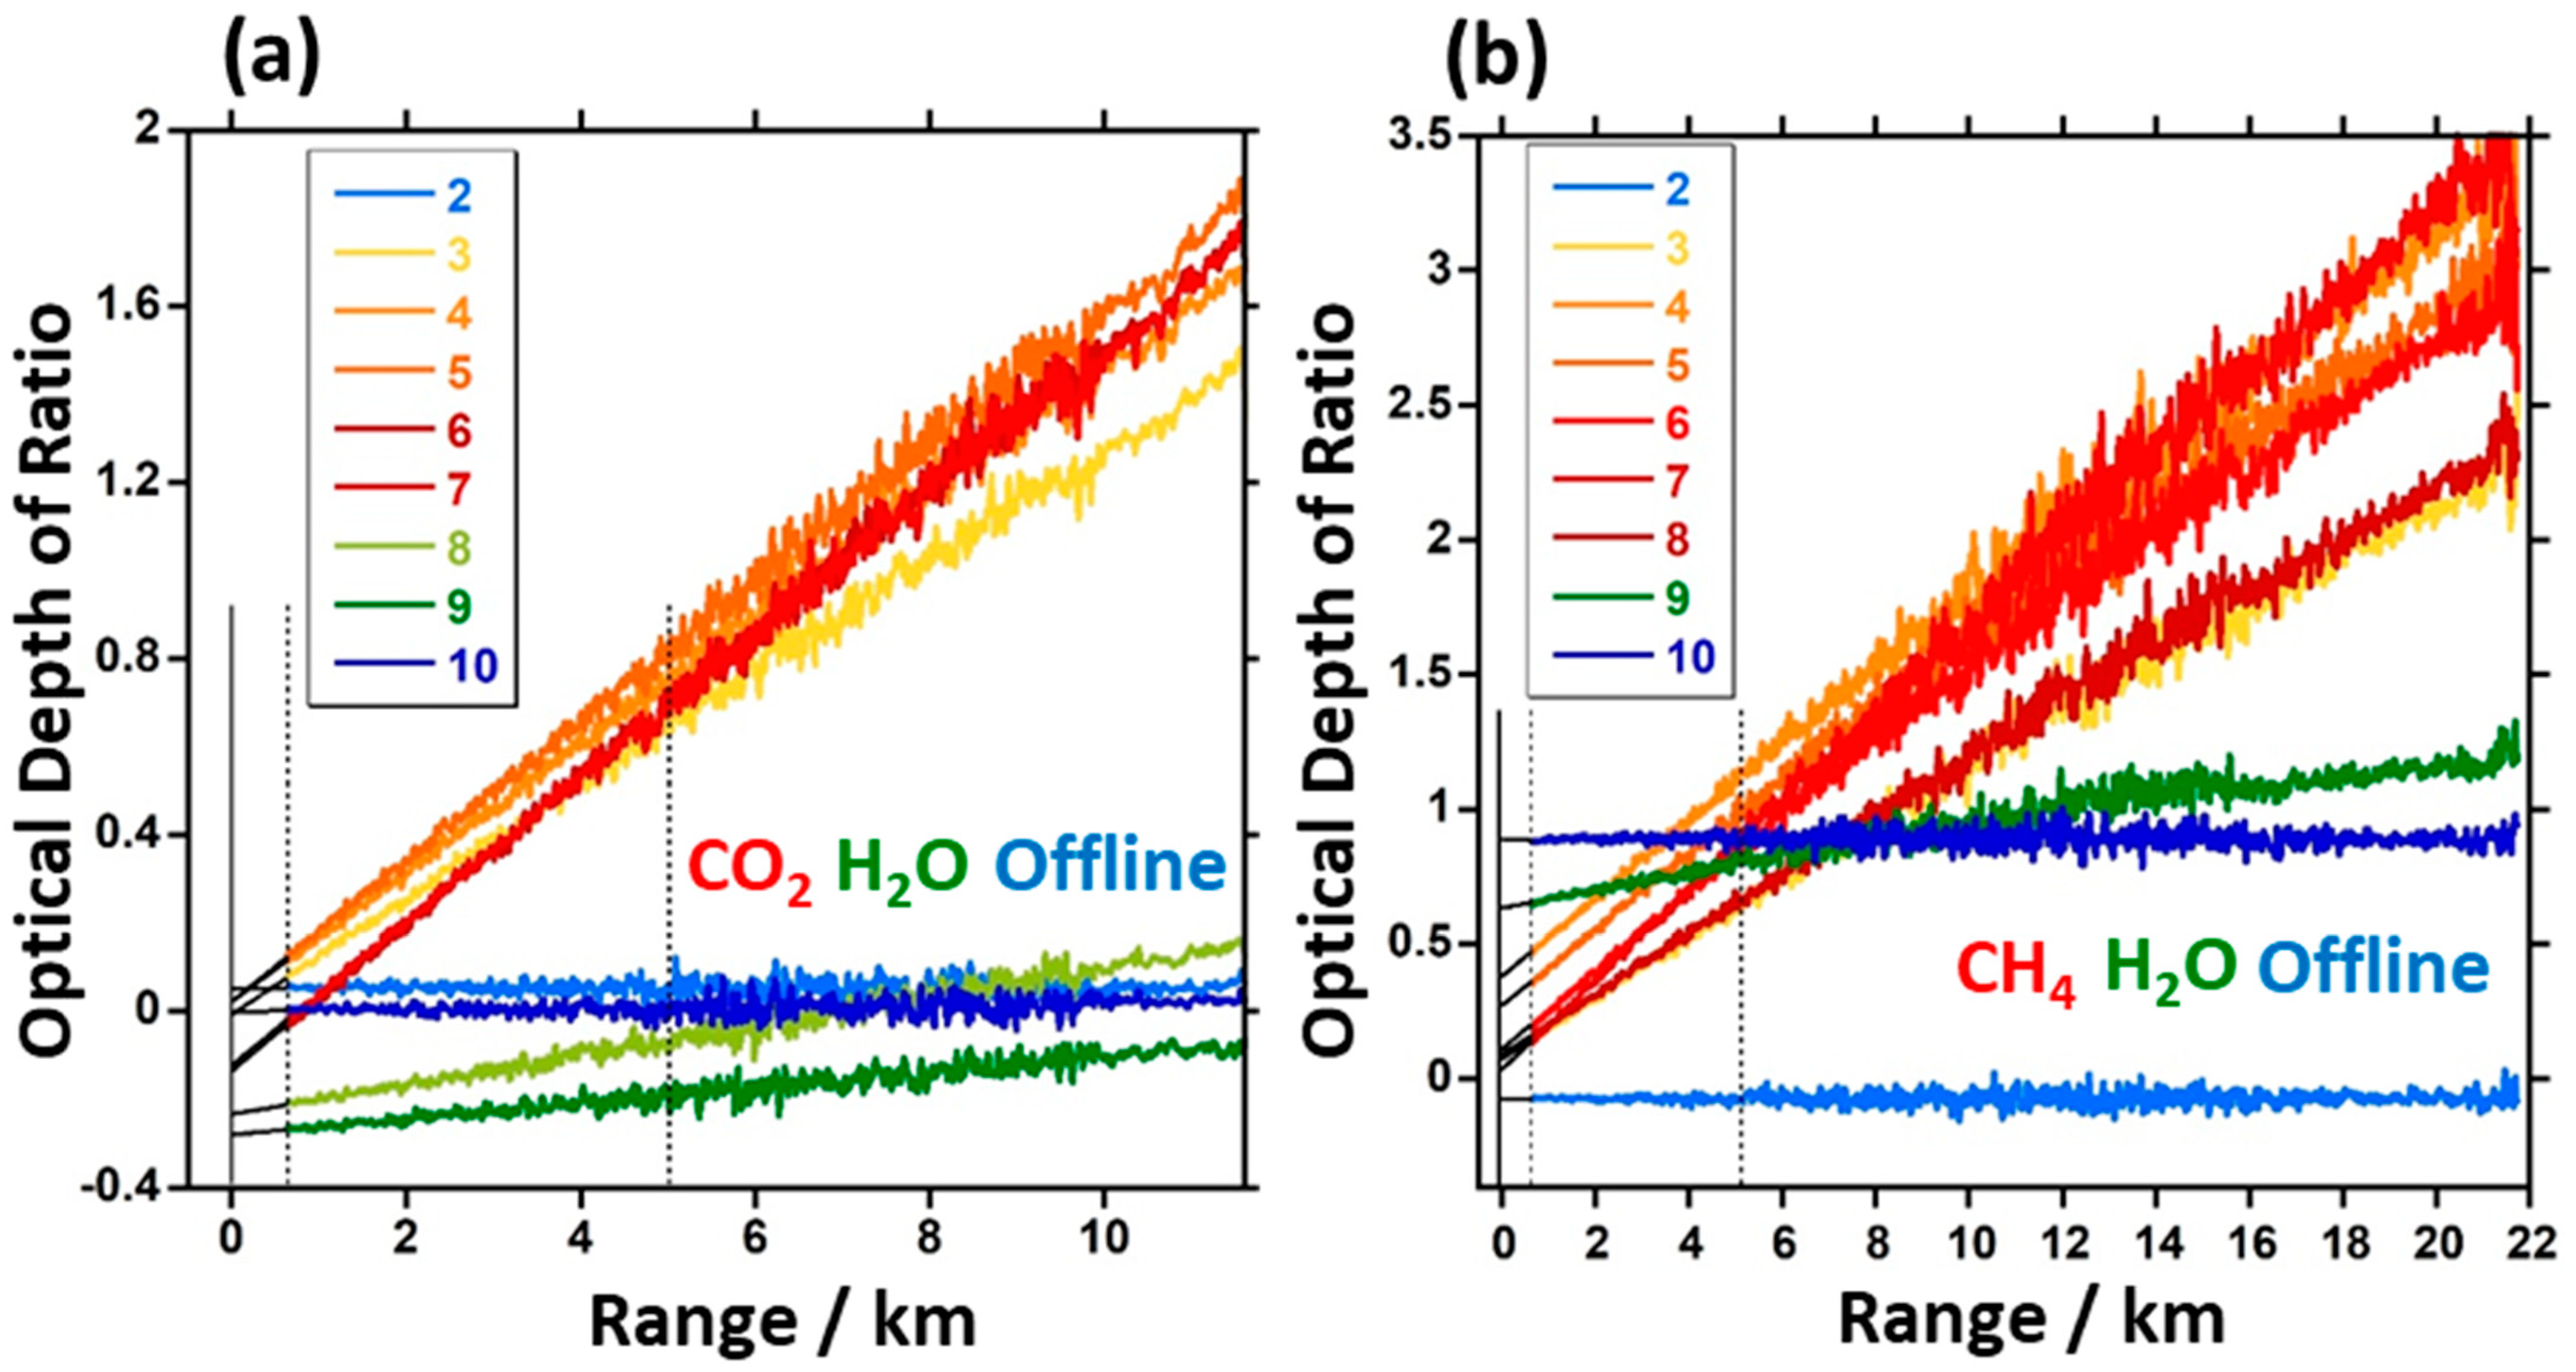
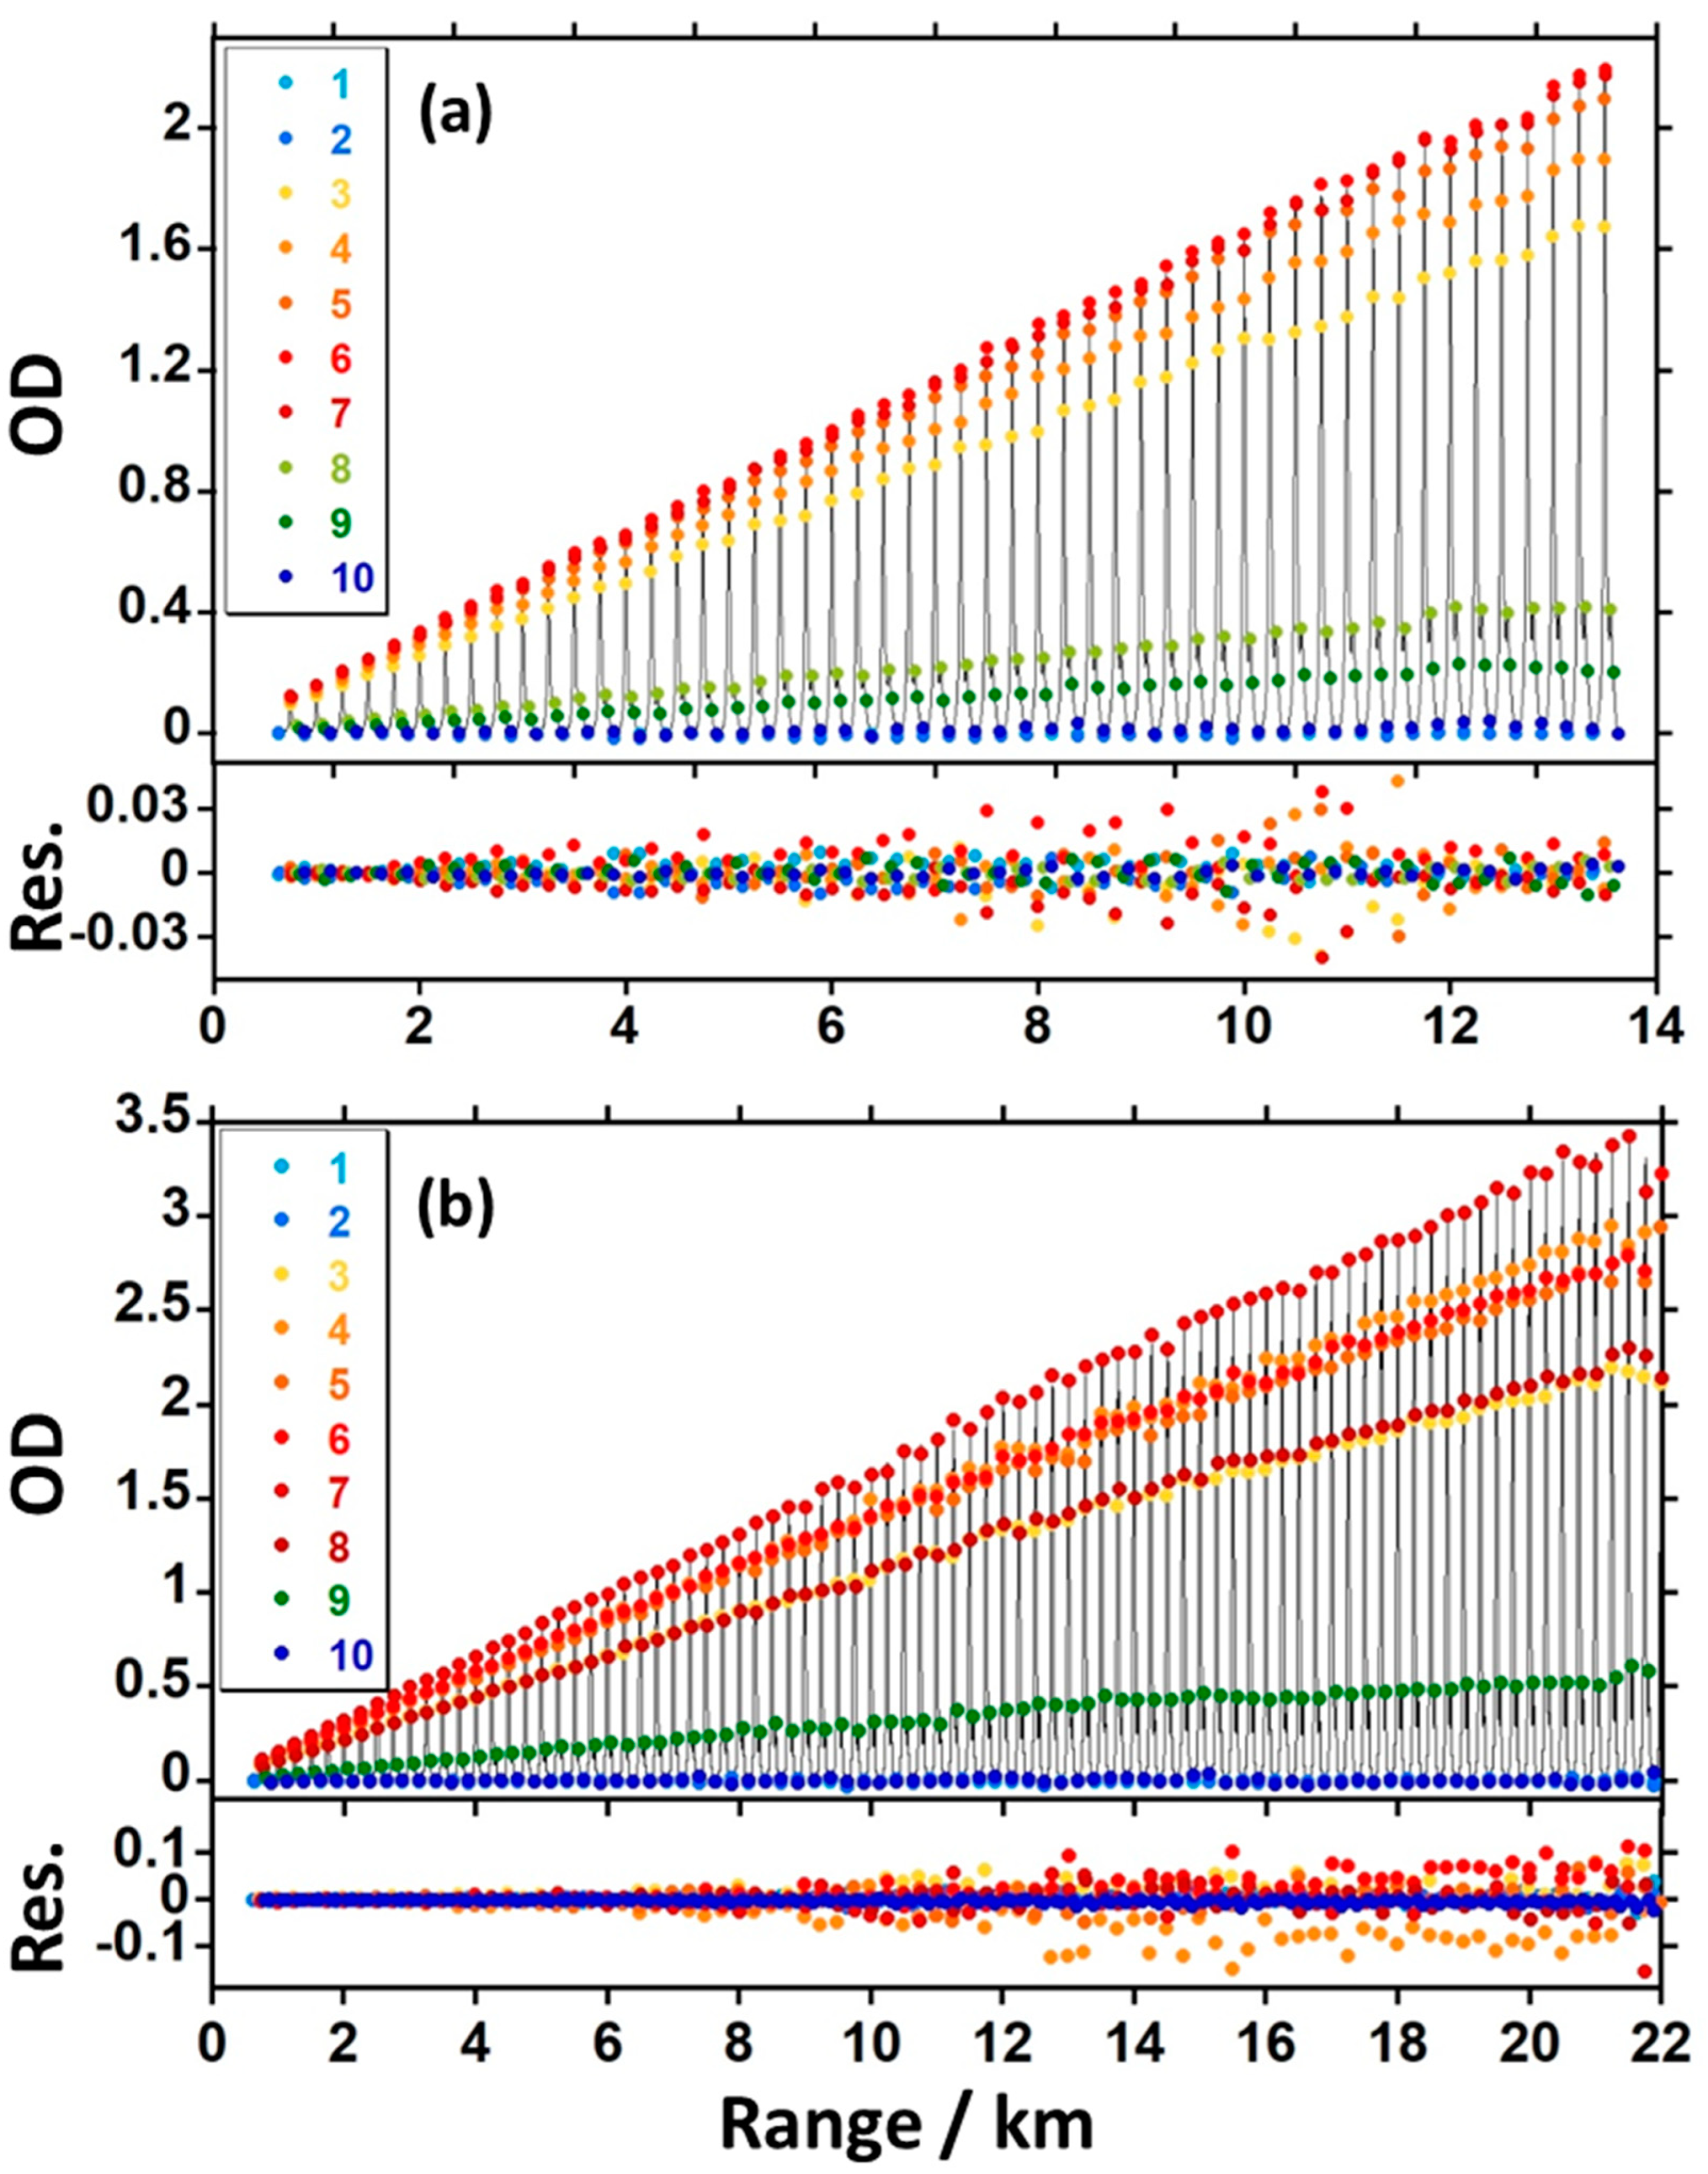
where N k ( R ) are the accumulated counts in each 10 min interval. The O D k R values for the nine ratios are shown in Figure 4a,b for the CO2/H2O and CH4/H2O regions, respectively. The near linear increases observed for the online ratios in both regions result from the following reasons. First, the returns represent the path average over the column, so deviations from linearity caused by changes in the T&P profiles with altitude will be reduced in the average over the line shapes. In general, for an isolated pressure broadened transition in the atmosphere at constant mixing ratio, the peak line intensity (OD) remains unchanged with decreasing pressure (i.e., with increasing altitude) since the line width scales linearly with pressure. Furthermore, temperature also decreases with increasing altitude, and for the selected CO2 and CH4 lines in this work, the shifts in the partition functions increase their intensity with altitude. For the five online CO2 frequencies, non-linearities in O D k R from temperature changes (<5 K obtained from Appendix A, Figure A2a) are small because of the nearly horizontal path used in this study (i.e., a 0.44 km change in altitude at a 10 km range). For the six overlapping lines in the CH4 manifold, the narrowing of each width leads to an overall intensity decrease across the line profile. This decrease in O D k R is, however, approximately offset by the decreasing temperature of ≈−35 K over a 3.5 km altitude change (see Appendix A, Figure A2a).
Also apparent in Figure 4a,b, the SNR decreases with range since the accumulated counts decrease by the inverse square of the range (i.e., SNR(R) ≈ N k / R 2 in a uniform aerosol field). However, beyond 10 km in Figure 4a, the SNR increases significantly from the enhanced backscatter from the cloud aerosol returns. Furthermore, the near linear increase in O D k R across the cloud region indicates sufficient transparency to perform integrated path measurements. A similar trend is observed in Figure 4b for CH4/H2O, although the enhancement in SNR from cloud aerosols is not as pronounced because the 2-fold increase in range results in significant decreases in the total backscatter signals.
In contrast to DIAL processing that is laser-energy-independent (see Equations (1) and (2)), the IPDA LIDAR processing of the integrated cloud returns requires knowledge of the relative energy in each pulse. The integrated path optical depth, I P O D k R , of point k can be expressed as
I P O D k R = l n N 1 0 N k 0 + l n N k R N 1 R
where the first term on the right represents the log ratio of the transmitted laser pulse energies (LPE). The different log ratios of the LPEs are the reason for the offset curves shown in Figure 4a,b and must be accurately evaluated before the I P O D k R can be used in the line shape fits of concentration. Typically, for IPDA LIDAR studies, the LPEs are measured independently in a reference channel by sampling the output beam before expansion and transmission [11,36]. However, unlike the output from single-mode fiber-based sources [11], the position of our free-space OPO beam depends slightly on frequency because of small changes in the PZT mirror position at each cavity resonance condition. Because of the secondary mirror obscuration in the beam-expanding telescope, the transmission efficiency was found to depend slightly on these beam shifts relative to the energies measured prior to the telescope using an integrating sphere and photodetector. Consequently, the energy ratios of the signal and reference channels at the different frequencies were not sufficiently proportional for normalization. Other factors such as the imperfectly matched bandpass filters and differences in the detectors’ frequency response functions also contributed to the observed variations in these ratios. As previously discussed [36], careful designs and detailed calibrations are required to proportionally match the relative energies in the signal and reference channels.
The simultaneous measurement of DIAL and IPDA LIDAR returns has enabled us to use an alternative method to determine the received LPEs that include the transmitter’s, detector’s, and bandpass filter’s frequency response functions. The method takes advantage of the linear range dependence of the optical depths following small corrections for changes in the range resolved concentrations and altitude of the data shown in Figure 4a,b. From Equation (3), the received LPEs can be obtained from the linear fits of these corrected data. By extrapolating the curves back to when the laser (OPO) pulse leaves the transmitter (R = 0), the received LPE terms in Equation (3) are obtained directly. The curve fits are performed over the region from 0.625 km to 5 km (see vertical dashed lines in Figure 4a,b) where the intercepts at R = 0 represent the received LPEs for each 10 min average. The uncertainties of the intercepts are typically <0.01 in optical density and therefore have a minor impact on the fitted concentrations. The early portions of the curve fits are shown with solid black lines from R = 0 to R = 0.625 km where full overlap begins.

3.2. IPDA LIDAR Studies of CO2/H2O and CH4/H2O

Unlike hard-target backscatter where the integrations are effectively performed over the width of the laser pulse, the diffuse nature of cloud aerosols leads to an extended source of the enhanced backscatter that ranges from 2 km for the CO2/H2O region to > 6 km ranges for the CH4/H2O region. The inclination angle for the CO2/H2O study was 2.5° which corresponds to clouds at an altitude of ≈0.44 km at a range of 10 km from the transmitter. The inclination angle for the CH4/H2O study was 10.5°, which corresponds to clouds at an altitude of ≈3.5 km at a distance of 19 km from the transmitter. Since the model line shape function depends on the T&P profile, it will change with altitude over the extended region of the cloud. As a result, separate calculations are required over multiple and contiguous range bin slices to determine the average model line shape to fit to obtain the path integrated concentrations.
The path integrated concentrations to cloud targets were determined on 10 min intervals, and fits were performed over consecutive 250 m slices. Furthermore, because of variations of T&P over the elevated path particularly in the CH4 study, the model line shape used in the fits for each slice was calculated by dividing the path length into five sections and performing an average over the predicted line shapes for each of these sections. For the CH4 study, each section corresponds to an atmospheric layer 0.7 km in altitude. The line shape for each layer was calculated at the T&P predicted from the U.S. Standard Atmosphere model following correction for the base altitude. The parameters that varied in the NLLSF included the frequency offset, baseline offset, slope and the concentration scalars of CO2/H2O or CH4/H2O where all lines of the given species were scaled together as a group. This approach is very similar to the multi-frequency IPDA LIDAR method described in ref. [37] to extract column-averaged dry-air CO2 concentrations to cloud tops and to the surface from near-nadir airborne measurements. One exception is that we perform our own layered profile calculations that include the HTP line profile for CH4 and the HITRAN 2020 database for CO2 rather than using the line-by-line radiative transfer model [38] and the HITRAN 2008 database for CO2 used in the airborne studies.
The series of best-fit line shapes to the absorption data over the CO2/H2O and CH4/H2O regions are shown on 250 m intervals in Figure 5a,b, respectively. The absorption data were obtained for a single 10 min interval near the beginning of both measurement periods after processing using Equation (3). The fit residuals shown in the sub-panels increase with range as expected for a ≈1/R decrease in SNR. However, in the cloud aerosol region of CO2/H2O between 12 km and 13.5 km, the SNR improves significantly, leading to an obvious reduction in the scatter of the residuals. The improvement in the corresponding cloud aerosol region of CH4/H2O between 18 km and 21 km is not as apparent because of the much weaker signal returns.
More detailed views of the fits and residuals of Figure 5a,b are illustrated in Figure 6a–d at both a short range from normal aerosol returns (1.5 km to 1.75 km) and at a long range from cloud aerosol returns (near 12.5 km for CO2 and 18.75 km for CH4). In both short and long range, the relative magnitude of the residual scatter for CO2/H2O is on the order of 1% relative to the peak online optical density. For the CH4/H2O region, residuals are again near 1% at short ranges but increase to ≈3% at long ranges. This increase may arise from the very low online count rates at 19 km (see Figure 3c). However, some systematic structure appears to remain in the residuals. The possible sources of bias in the measurements are discussed in Section 4. We note that relative to CO2, the CH4 cloud region was measured at more than eight times the altitude (0.43 km vs. 3.5 km), resulting in significant gradients in the T&P profile over the range. The model line shape narrows at this altitude and contributions to the average line shape lead to a more well-resolved doublet profile as the data in Figure 6d reveal.
The enhanced backscatter from the extended cloud aerosol regions affords an opportunity to reduce the measurement uncertainties of the column-averaged mixing ratios. The column integrated concentrations may be obtained from the mean over all slices, x ¯ w t d , each weighted by the integrated counts for that slice relative to the total returns (i.e., total weight). The uncertainties, s w t d , can then be evaluated from the weighted standard deviation of the mean of the slices as given by
x ¯ w t d = i = 1 n w i x i i = 1 n w i
v a r ( x ) w t d = i = 1 n w i x i 2 i = 1 n w i ( x ¯ w t d ) 2 n n 1
s w t d = v a r ( x ) w t d n
where w i are the weights of the individual measurements, x i , n is the number of slices and v a r ( x ) w t d is the weighted variance.
The averaging procedure has been applied over a large enough range to capture the cloud features in both regions. Signals below a certain threshold in the slices were excluded in the weighted average. The weighted dry-air mixing ratios are shown for 10 min intervals in Figure 7a,b for the CO2/H2O and CH4/H2O regions, respectively.
For dry-air CO2 mixing ratios, the uncertainties range from about ±0.2% to ±1% over the initial 3+ h measurement period. Interestingly, while the first 120 min showed enhanced backscatter from the clouds and therefore improved residuals, the weighted averages show little in the way of improvement relative to the cloudless regions after the first 120 min. We attribute the lack of improvement to difficulties in splicing the current to the counts for the signal returns that vary significantly over the initial 10 km range (see Figure 3b) and are near the upper dynamic range limit of the PMT as a current source. In contrast, the weighted mixing ratios for CH4 in Figure 7b show substantial improvement in the initial 2.5 h when clouds were present relative to the final 2.5 h when they were absent or too distant. We find the relative uncertainties over the cloud period range from ±0.1% to ±0.5% for CH4 and increase to 2% to 3% in the cloudless period.

3.3. DIAL Studies of CO2/H2O and CH4/H2O and Comparison with the IPDA LIDAR Results

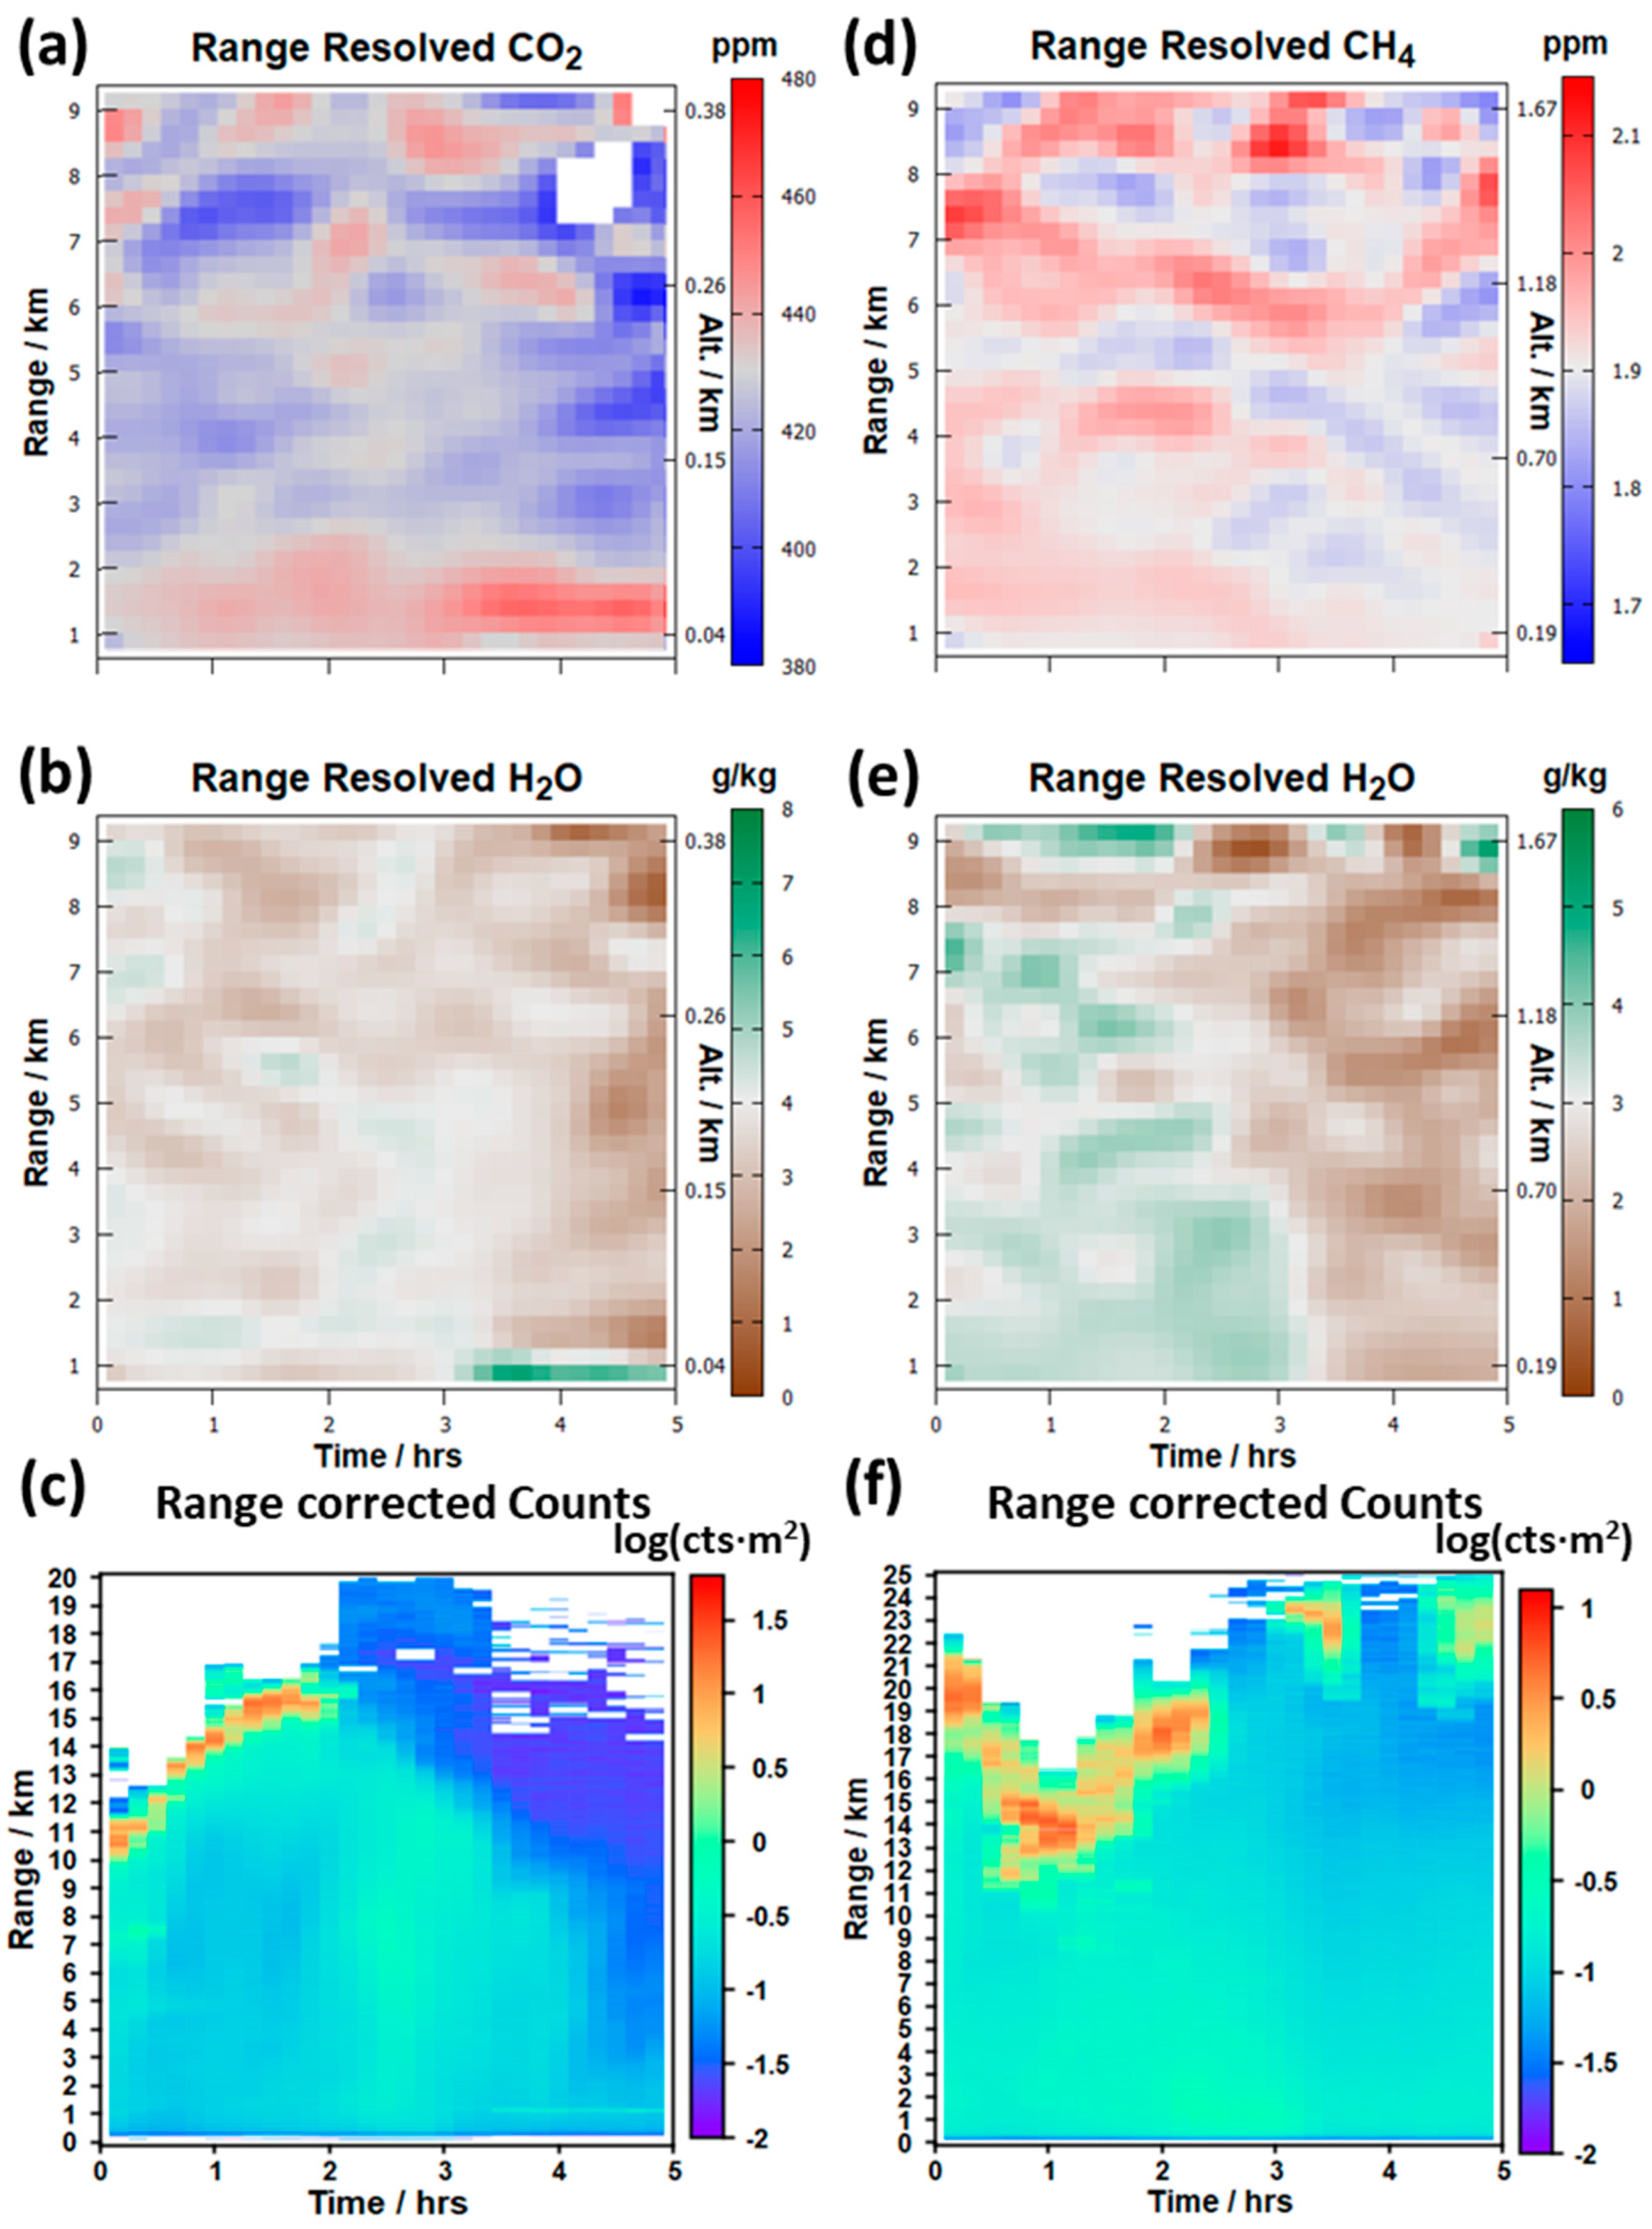
The range-resolved dry-air concentration maps for CO2 and H2O obtained from the DIAL fits using Equation (1) are shown in Figure 8a,b, respectively, and those for CH4 and H2O are shown in Figure 8d,e, respectively. The data are shown on 10 min intervals but have an effective temporal resolution of ≈20 min because of additional surface smoothing. Because of technical issues, the results are shown only from the far-field receiver where full overlap begins near 0.625 km. In both cases, the range resolution is 250 m beginning at 0.75 km and is linearly increased to a range resolution of ≈1.5 km at a range of 9.25 km to help offset the ≈1/R drop in SNR. The corresponding range- and background-corrected LIDAR maps are shown for the first offline frequency (ν1) in the lower panels on a logarithmic scale to enhance the variations in the aerosol backscatter over the range. The regions with an absence of color are below the detection sensitivity.
For the CO2/H2O region, the inclination angle is only 2.5° and, at 1.25 km, the beam path is only ≈50 m above two emission stacks from a natural gas burning utility plant on the University of Colorado campus that was running at full capacity this time of year. As evident in Figure 8a near this range, particularly after the first hour of the measurement period, additional contributions from the plant’s plume emission result in a (10–30) ppm increase above the background levels of ≈425 ppm. From NOAA wind LIDAR data, the initial increase is likely a result of a change in wind speed and direction from <3 m/s SE in the first hour to (8–10) m/s S for the remaining 4 h. Furthermore, the DIAL data suggest the increase in the column-averaged CO2 concentrations in Figure 7a that also occur in the first hour may arise, in part, from a stronger plume addition to the column average. Also apparent in Figure 8c at this range is a sharp and distinct increase (spike) in the LIDAR signals from the plume condensate. A recently reported DIAL study of ours using a fiber amplifier system made use of the spike to measure the emission flux from this utility plant [13]. We also note, in Figure 8c, the gradual decrease in the LIDAR signal intensity after the first 3 h which reduces the SNR at the longer ranges. This led to some missing data in regions beyond 7 km as indicated by the absence of color in Figure 8a.
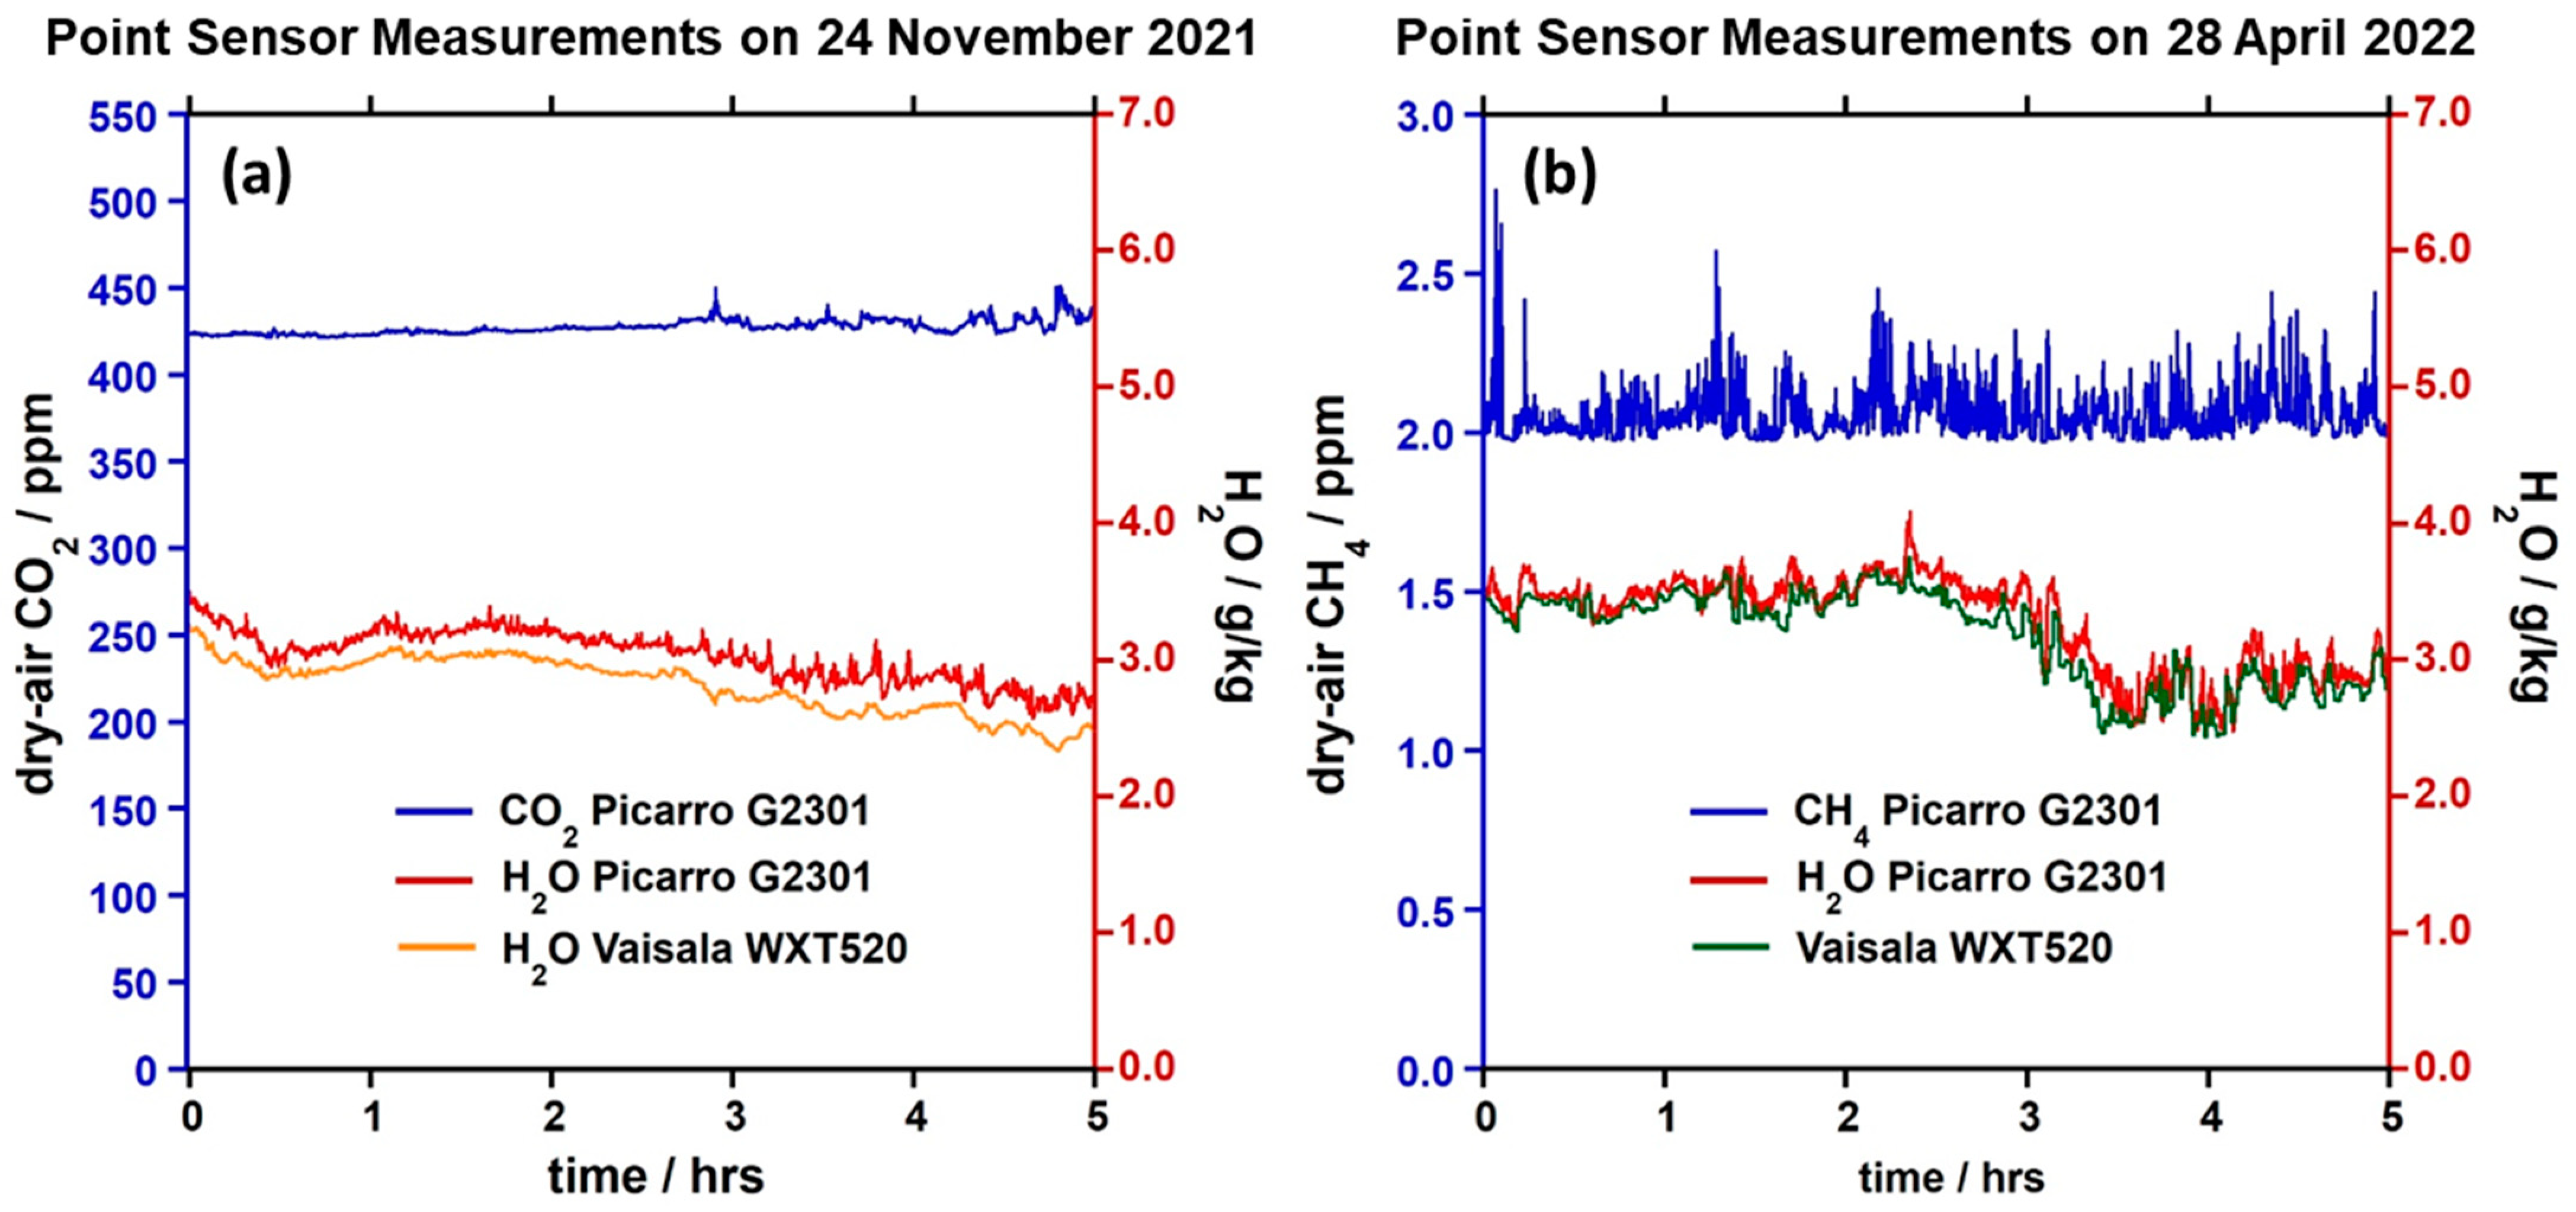
For the CH4/H2O region, the inclination angle is 10.5° and, at a range of 9.2 km, the relative altitude above the transmitter is 1.69 km. The CH4 concentrations in the first 4 km appear to be slightly more uniform relative to the higher variations (1.8 ppm to 2.1 ppm) that appear at longer ranges. In some cases, the bands of enhanced concentration appear to extend across the 5 h measurement period. The reasons for these variations are not clear. We note, however, that the CH4 measurements made with the cavity ringdown point sensor located near the transmitter also displayed an unusual broad variation of CH4 concentrations that ranged from 2.0 ppm to 2.4 ppm during this period (see Figure A3b). While some transients are common (e.g., see Figure A3a for CO2) and likely arise from a nearby power plant located on the Boulder NIST campus; the observed variations on this day far exceed those typically observed.
A cross check of the DIAL concentration maps can be obtained through comparisons with the IPDA LIDAR results reported in Section 3.2. Given that all data were acquired with the same transceiver system, filter and detector, and that the LPEs are not needed in the DIAL retrievals, differences in the column average mixing ratios from these two independent techniques can provide insight into any systematic errors associated in the data processing and/or assumptions in the models to retrieve concentration. For this, the mixing ratios of the range-averaged DIAL (RA-DIAL) data displayed in Figure 8a,b are needed. In contrast to the weighted mean method performed over multiple slices in the cloud region, the range resolved mixing ratios need to be weighted equally and the overall uncertainties must be added in quadrature. For a fixed range bin size of 250 m, the uncertainties would be dominated by the largest uncertainties associated with the weakest returns at long range. As discussed above, the range bin size was linearly increased to largely “equalize” these uncertainties over range. It is further noted that this comparison is not complete in the sense that the DIAL mixing ratios are missing in the first 0.75 km and, for the CH4/H2O region, the “gap” between the DIAL data and the IPDA LIDAR data is too large. Nevertheless, barring any unknown sources and sinks in these regions, the path-averaged values should largely agree with one another.
The comparison of the dry-air mixing ratios of the range-averaged DIAL (RA-DIAL) and the IPDA LIDAR measurements are shown in Figure 9a,b for CO2 and CH4, respectively. At most of the 10 min intervals, the RA-DIAL uncertainties for CO2 and CH4 range from ±1% to ±2% which are 5- to 10-fold larger than those from the IPDA LIDAR data. More importantly, IPDA LIDAR data are well-centered on the RA-DIAL mixing ratios for most of the measurement periods with perhaps a slight bias for lower IPDA LIDAR values at a few points. Nevertheless, for nearly every interval, the corresponding uncertainties are well within those of the RA-DIAL values.

4. Discussion

The accuracy requirements for satellite observing systems that measure the column-averaged dry-air concentrations of GHG over paths to and from the planet surface are quite severe because even sizable contributions from source and sink fluxes near the surface make minor changes to the column average. For this reason, passive satellites such as GOSAT, MethaneSAT, OCO-2, etc., typically have targeted uncertainties of <±1 ppm (<±0.25%) for CO2 and <±10 ppb (<±0.5%) for CH4. To reduce the uncertainties to such levels requires a worldwide network of ground-based calibration sites known as the Total Carbon Column Observing Network (TCCON). Like passive satellites, TCCON uses sunlight, typically a Fourier transform infrared spectrometer and spectral fitting software to obtain dry-air mixing ratios for fly-over satellite calibrations. These sites, in turn, require the use of in situ World Meteorological Organization (WMO) calibrated instruments on board aircraft as well as other bias corrections for the site’s certified validation. Moreover, for the future MERLIN mission, the accuracy requirements are even further reduced to near 2 ppb (±0.1%) for the active sensing of CH4 [20]. To complement the TCCON network, one intended use of our ground-based approach is to provide a calibration-free platform for passive and active satellites by developing a new portable 200 Hz OPO-based system in a mobile platform for vertical and slant path range-resolved DIAL and IPDA LIDAR measurements of clouds. While satellite retrievals depend on a cloud-free field-of-view (FOV), we expect to operate the IPDA LIDAR system on days when some clouds are present to enable retrievals over a near coincident path with the satellite FOV.
The measurement uncertainties of the IPDA LIDAR mixing ratios from cloud aerosol retrievals shown in Figure 7 represent two examples of the currently measured precision of this approach and reflect partial success in the achieving our targeted goals. For the dry-air CO2 mixing ratios in Figure 7a (note that the y-axis tics in both panels represent ≈1% uncertainty), only roughly a third of the measurements are at or below the ±0.25% level. However, for dry-air CH4 mixing ratios, all measurements within the first 2.5 h when clouds were present are at or below ±0.5% uncertainty and some even approach ±0.1%.
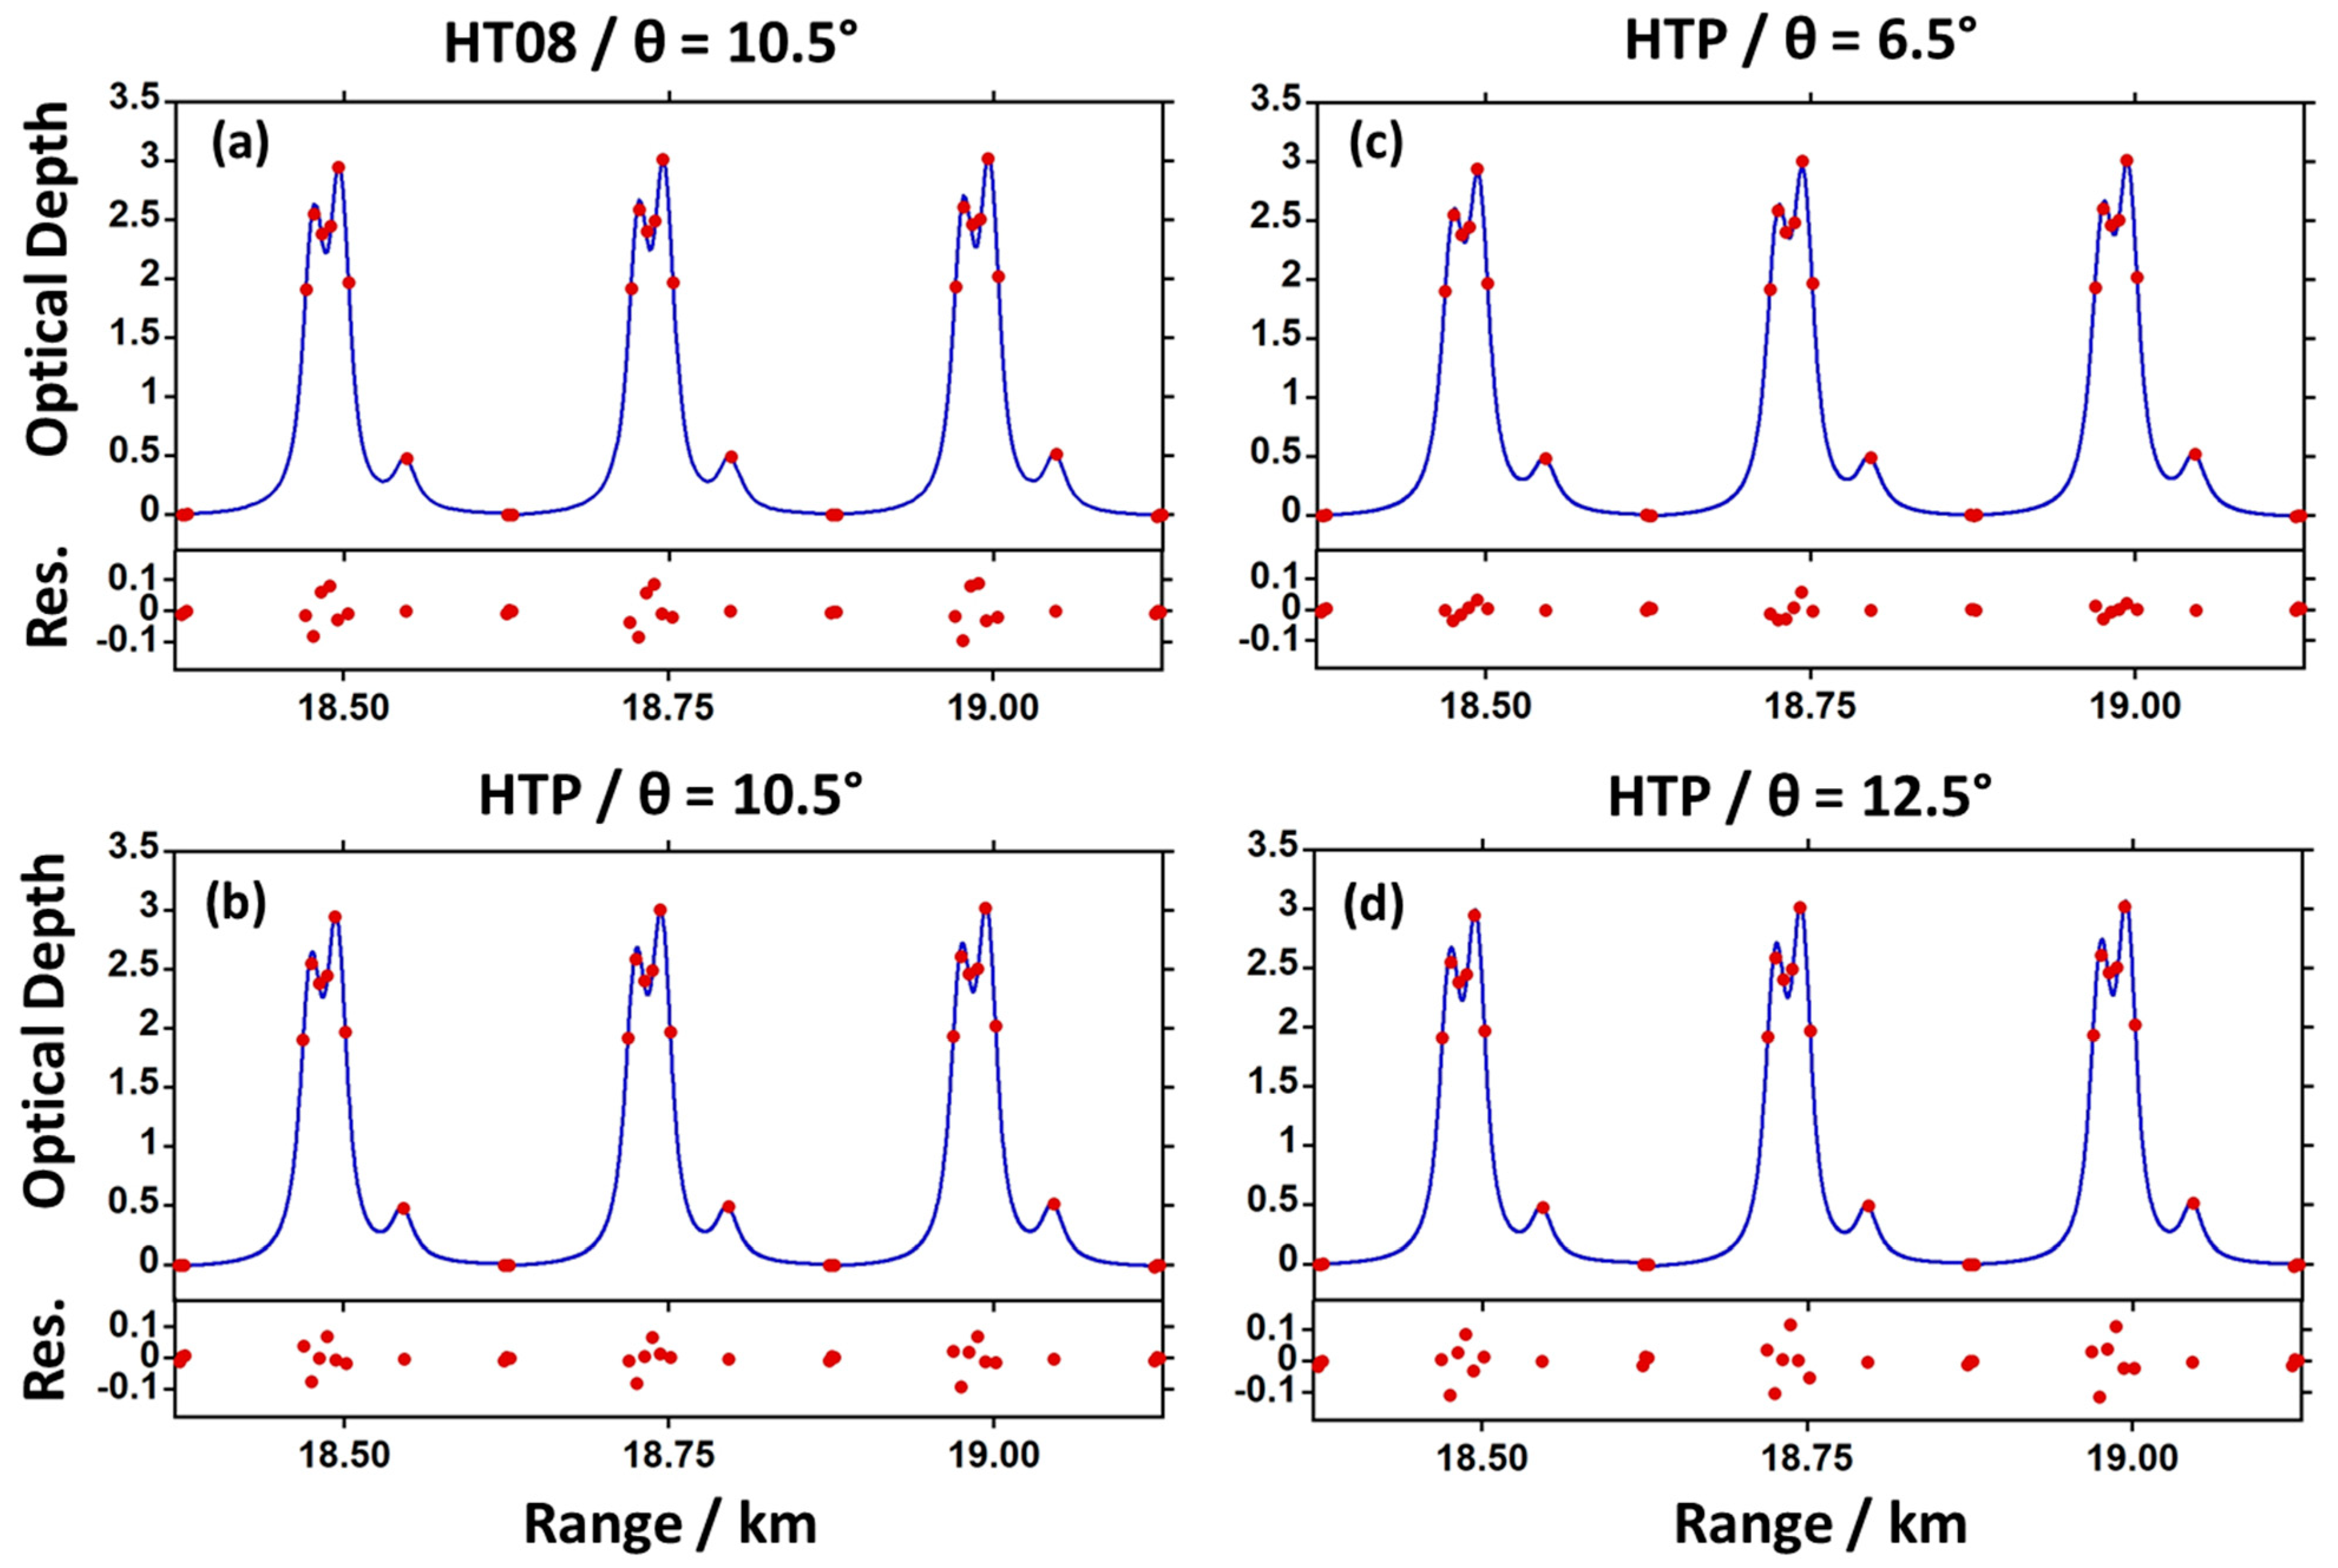
One of the primary goals in these ground-based spectroscopic studies is to assess possible biases in the method that would lead to increases in these uncertainties for the absolute mixing ratios. As mentioned in Section 2.3, systematic errors in the form of repeating patterns in the residuals from fits of the CH4 data to the HITRAN database required us to implement the more refined Hartmann–Tran profile (HTP) [26,27]. From comparisons of the HTP CH4 line shape with the HITRAN 2008, 2012, 2016 and 2020, the overall best shape relative to HTP was found for HITRAN 2008 (after scaling the overall peak intensity by 0.98). It is clear from the fit residuals to HITRAN 2008 shown in Figure 10a that the systematic errors are even more pronounced relative to those for HTP in Figure 10b. The HTP-integrated line intensity in ref. [27] was adjusted to that of the HITRAN 2020 database which corresponds to a peak intensity reduction of ≈0.91 of the HITRAN 2020 profile because of the reduced line broadening in HTP. Since our fits are to peak intensity; this led to a >8% increase in the best fit mixing ratios of CH4 relative to HTP. From these comparisons, there is a clear need for an SI standard that is traceable to the (WMO) scale for the absolute intensities of the CH4 lines. We again note that while the CO2 profile is also impacted by line-mixing and speed-dependent effects, the effects on the profile are much smaller relative to CH4 and are not revealed in the residuals in this study because of the smaller spectral coverage of the online CO2 measurements.
Another unknown that impacts the absolute uncertainties, particularly for the IPDA LIDAR results of CH4 at an altitude of ≈3.5 km, is in the calculated T&P profile using the U.S. Standard Atmosphere model [32]. While the CO2 study was performed over a nearly horizontal path where T&P changes along the column are expected to be minimal, some evidence for systematic residuals in the CH4 line shape residuals remain in Figure 10b. To investigate the impact of the T&P profile, we have refitted these data using two different inclination angles, θ, of 6.5° and 12.5°. The results are shown in Figure 10c,d, respectively. In contrast to the substantial increase in residuals for θ = 12.5°, the reduction seen for θ = 6.5° is significant. This angle difference of −4° corresponds to an altitude decrease of ≈1.4 km at a range of 20 km.
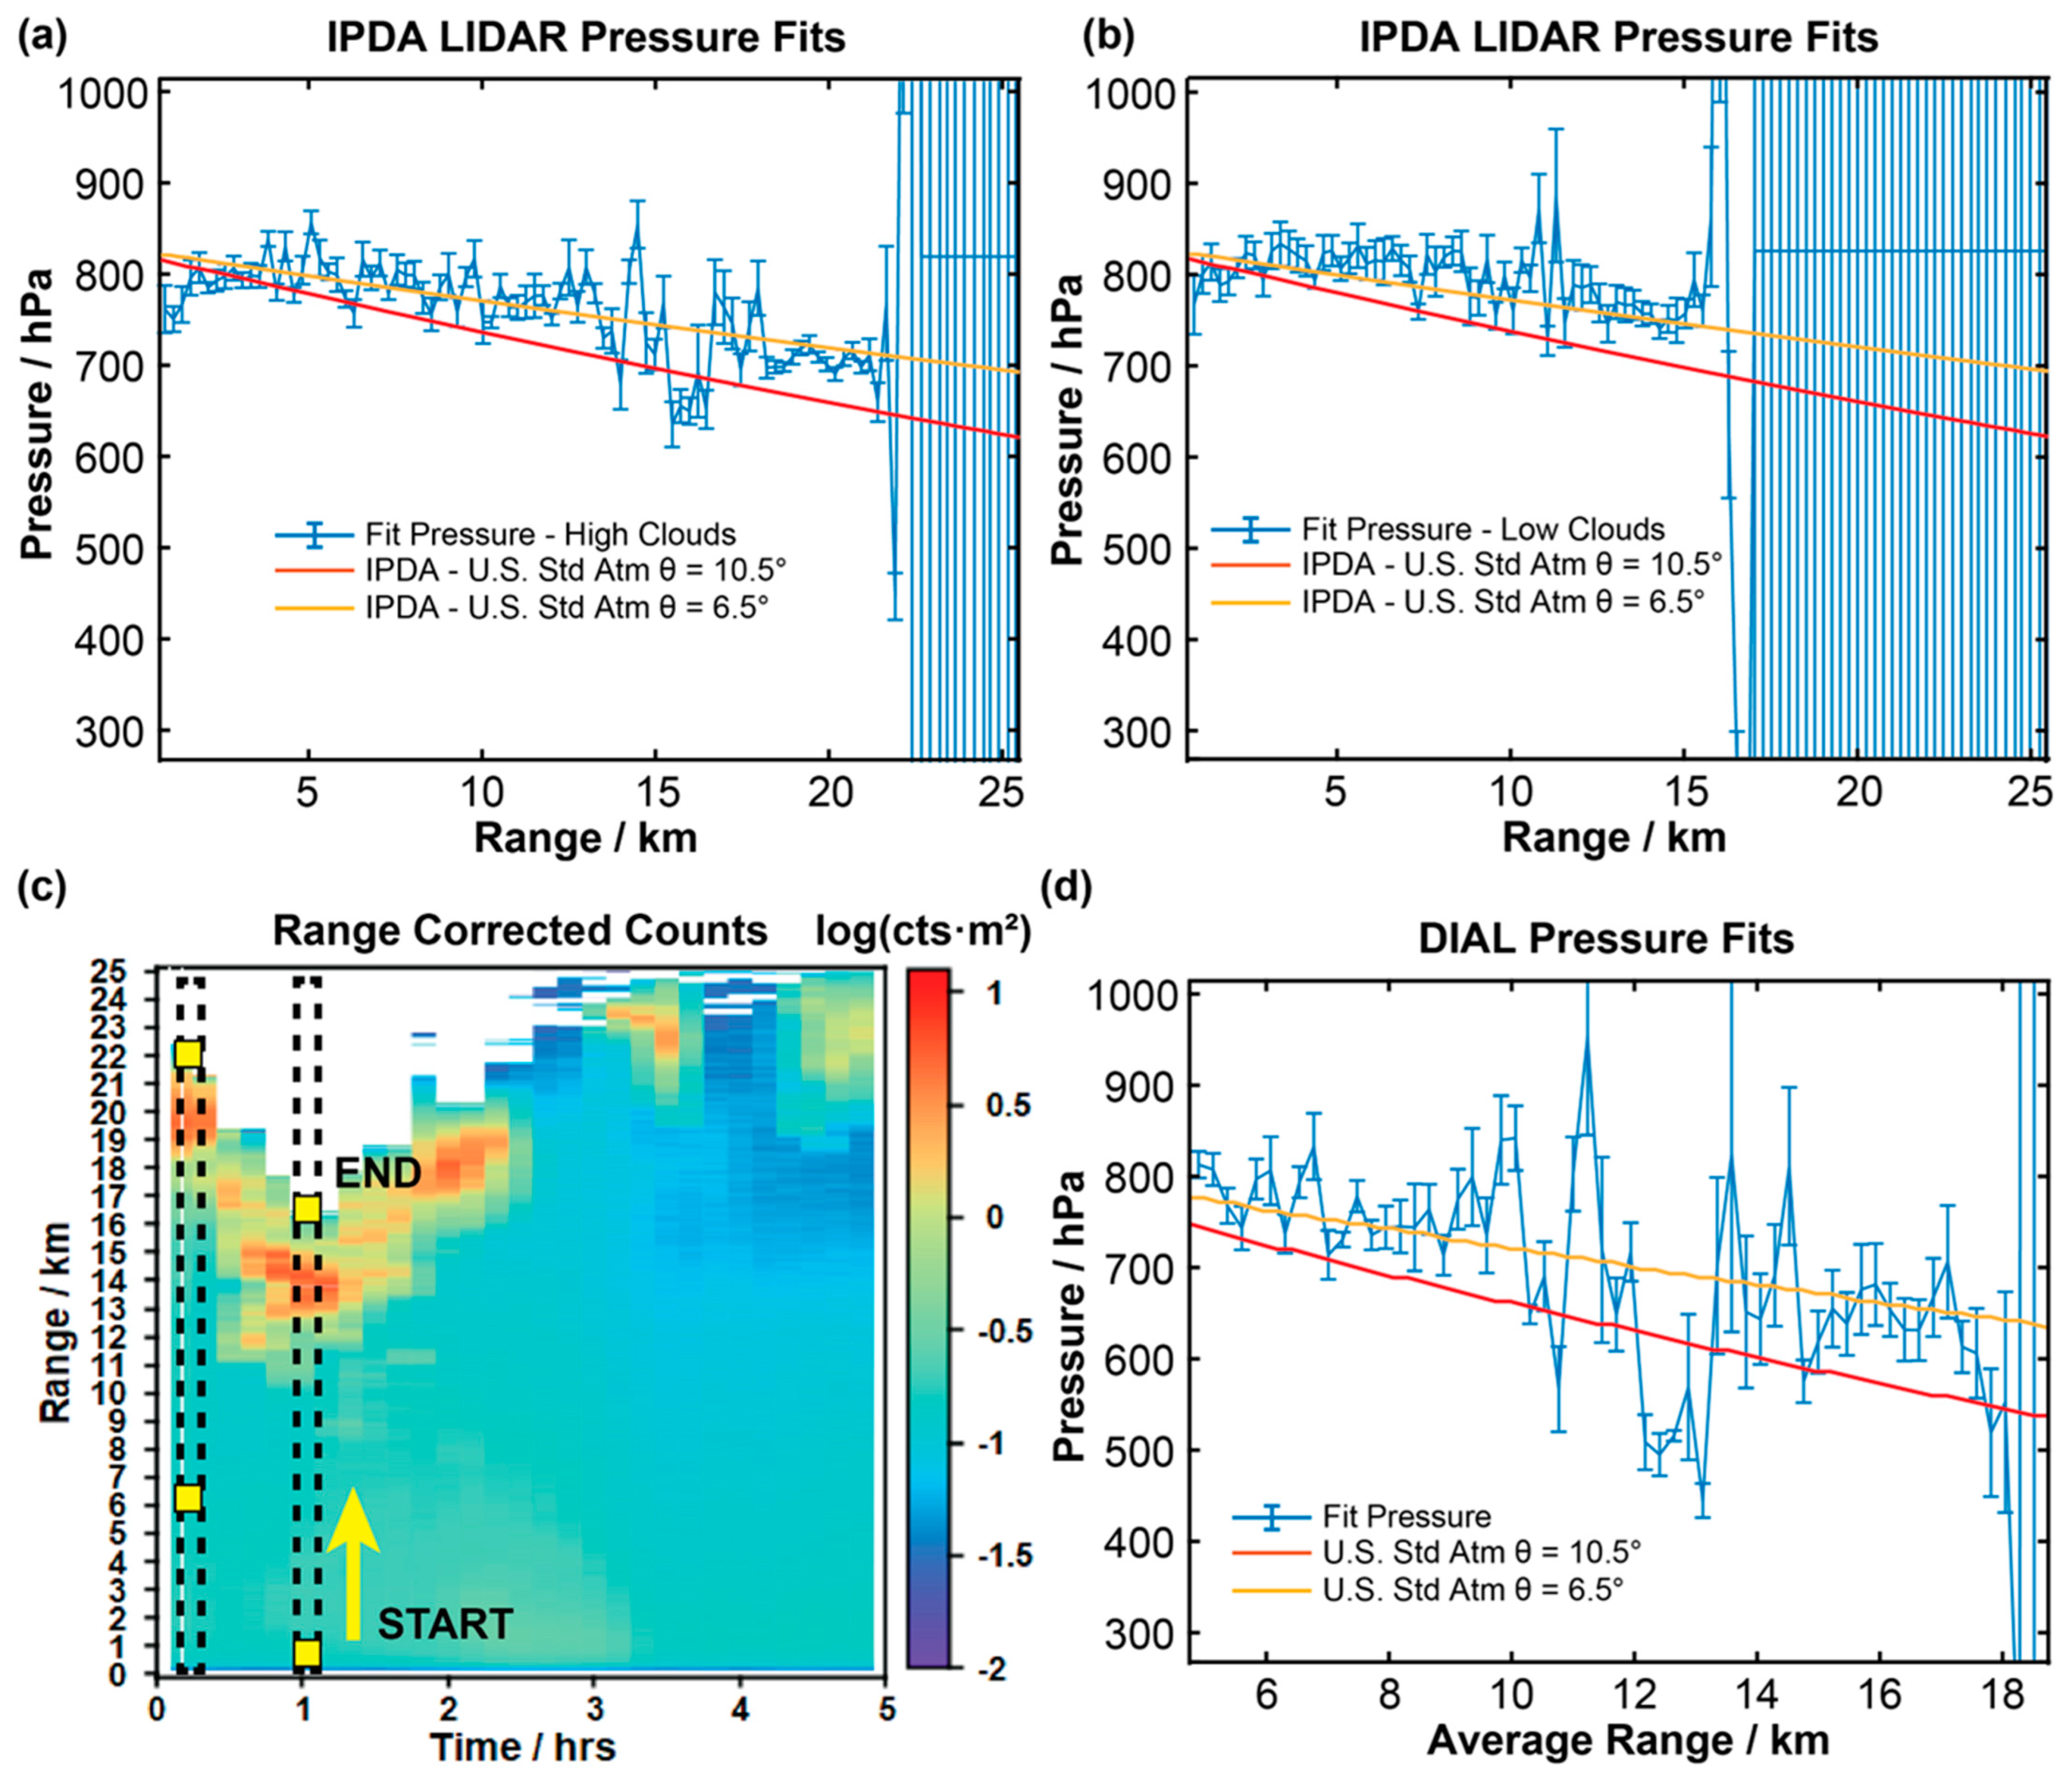
Given the strong pressure dependence of the shape of the CH4 doublet on the residuals, we have performed pressure fits over two series of IPDA LIDAR line shape profiles. The 10 min intervals chosen are shown in Figure 11c as vertical black lines superimposed on the LIDAR map. The best-fit path-averaged pressures and uncertainties (Type A, k = 1 or 1σ) are shown in Figure 11a,b for the 2nd and 7th intervals, which represent high- and low-altitude cloud aerosol regions, respectively. The trends expected for the path-averaged T&P profile of the U.S. Standard Atmosphere are superimposed on the plots with yellow and red lines for inclination angles θ = 6.5° and 10.5°, respectively. As found above, the profile for θ = 6.5° is in much better agreement with the observed pressure changes. Finally, we also perform pressure fits to profile differences that are separated by 6 km as illustrated by the yellow boxes in Figure 11c. This 6 km separation corresponds to the difference between the cloud ranges in the two columns. We note that, as a result of the improved SNR in the cloud regions at 19 km and 13 km in Figure 11a,b, respectively, the relative uncertainties of the pressure fits near the 16 km average range in Figure 11d are significantly reduced. The results shown in Figure 11d are again in much better agreement with the T&P profile calculated at an inclination angle of θ = 6.5°.
There may be several possible reasons why the predicted inclination angle from the pressure fits in Figure 11 is about 4° less than the actual inclination angle determined from the platform pitch sensor (which has a confirmed accuracy of ±0.5°). Any effect on the CH4 line shape that tends to fill in the central dip region will result in fits to higher pressures that will correlate to a lower inclination angle (and lower altitude). One possible mechanism that will fill in the dip region is from additional line broadening by H2O vapor. The pressure broadening in the HTP model used here is for dry air only. Previous studies [39] have found that CH4 dry-air broadening coefficients increase by 0.34 times the vapor pressure. As shown in the DIAL map of water vapor concentrations (Figure 8e), the relative humidity in this study is between 11% and 22% and, therefore, the additional CH4 broadening by water vapor is only between 0.1% and 0.2% which will not account for the observed angle difference of −4°.
A second possibility that will decrease the dip depth is from averaging over the Doppler line shifts associated with changes in wind shear over the integrated path [40]. While a Doppler wind LIDAR system is planned for future measurement campaigns, the only atmospheric wind profile measurements available in this study are from two Denver International Airport (DIA) soundings performed several hours before and after the IPDA LIDAR study. The wind profile measurements, shown in Appendix A, Figure A1a,b, vary between 11 m/s and 18 m/s at altitudes >4 km relative to near-ground-level speeds between 1 m/s and 5 m/s. Over this range, the predicted Doppler frequency shifts for winds parallel to the beam path (i.e., worst case scenario) would be in the range from ±3 MHz to ±10 MHz. Tests on the integrated HTP line shapes over the largest of these shifts indicates the impact on the CH4 dip depth is small. We also note that the maximum laser frequency shift from the thermal drift the filter cavity over periods longer than these 10 min averaging times is expected to be of this magnitude or less [4].
A final possible reason is that the U.S. Standard Atmosphere T&P profile is not an accurate approximation in this study. Some evidence for this is found from comparisons between the two DIA soundings shown in Appendix A, Figure A2a,b. We note especially the large differences in temperature profiles and an overall pressure shift of ≈15 hPa over this 12 h period. Significant differences are also seen relative to the T&P profile of the U.S Standard Atmosphere shown in Figure A2c. Given the impact of such factors on the online/offline measurements planned for the MERLIN mission [16,17] where such effects will not be evident in the data, current efforts are underway to perform simultaneous 3D wind profile measurements using a Doppler wind LIDAR system.
Improvements in the accuracy of the T&P profiles are also required to achieve the low absolute measurement uncertainties specified above. This is particularly important for the CO2 and CH4 lines chosen in this work given the high sensitivity to changes in temperature where the OD increases by 11% and 13%, respectively, for a ΔT of −35 K (320 K to 285 K). One possible way to improve the T&P model is to use data from the Global Forecast System weather prediction model and perform an atmospheric reanalysis [41] which should significantly improve the accuracy compared to the U.S. Standard Atmosphere used in these studies. Furthermore, efforts are underway to extend the measurement bandwidth of the frequency converter to measure additional lines. As we have shown previously [42], the scan bandwidth can be increased by as much as 4 cm−1 (120 GHz) by using the higher order sidebands of the electro-optic phase modulator for frequency generation [11]. For the CH4 line, the extension to 1.75 cm−1 (53 GHz) is all that is required to capture a second water vapor line, (101–212), at 6078.25 cm−1. The temperature dependence of the optical depth of the (101–212) transition is opposite to that of the (625–716) transition measured here. We estimate that a column-averaged temperature uncertainty of ≈±1 K can be obtained from OD measurements of these two water lines at a precision of ±1%. Based on the OD change of +13% for a −35 K change, the ±1 K translates to an uncertainty of <±0.4% for the CH4 concentration. To measure the three additional CO2 lines, R(20e), R(22e) and R(24e), adjacent to the R(18e) line measured here, will require a bandwidth extension to 3.7 cm−1 (111 GHz). We estimate that a column-averaged temperature uncertainty of ±1.3 K can be obtained from the OD measurements of these lines at a precision of ±0.25%. Given the R(24e) line of CO2 has about one half the temperature sensitivity of the R(18e) line (a 5.5% increase in OD for a −35 K change), the ±1.3 K translates to a ≈±0.2% uncertainty for the CO2 concentration. Measurements are currently underway to assess these estimates.
Finally, we note that while the position of the transceiver platform is computer-controlled, real-time feedback to steer the platform’s transmitted beam to continuously measure cloud regions has not yet been implemented. Consequently, the cloud backscatter returns in Figure 3b,d were limited in duration (i.e., 2 h for CO2 and 2.5 h for CH4). More importantly, the overall backscatter signal returns were far from optimal; in the CO2/H2O region, the offline returns were near the saturation limit of the PMT detection system, which is in sharp contrast to the online returns in the CH4/H2O region that were near the noise floor. It would clearly be advantageous to work well between these two limiting cases. We expect that the SNR ratios will improve significantly once an independent LIDAR-based cloud profiling system under development is completed.

5. Conclusions and Outlook

In this work, we have demonstrated a combined DIAL/IPDA LIDAR system to measure range-resolved and integrated path-mixing ratios of dry-air CO2 and CH4 above the city of Boulder, Colorado. The integrated path measurements are performed to cloud targets up to 20 km in range and up to 3.5 km in altitude. The technique uses 10 frequencies to sample across ≈1.3 cm−1 spectral regions and to measure portions of the absorption line profiles of CO2/H2O and CH4/H2O as a continuous function of range. A hybrid photon counting/current detection system enhanced the dynamic range to measure range-resolved backscatter signals from aerosols as well as distant cloud targets.
The DIAL/IPDA LIDAR multi-frequency method addresses two challenging tasks associated with standoff methods. For IPDA LIDAR studies, one important task is the measurement of the pulse energies with high precision and accuracy at each of the transmitted frequencies. This challenge is overcome through fitting the range-resolved DIAL data to extrapolate received pulse energies back to the time of emission thereby eliminating the difficulties associated with the uniform unbiased sampling of the transmitted pulses and with the calibration of multiple detectors’ responsivities [36]. A second challenge of two-frequency online/offline DIAL and IPDA LIDAR measurements is with potential biases that impact the optical densities and the frequency offset of the model fitting function arising from unknown environmental variations over the column average. Such factors may include added broadening contributions from foreign gases, poor models of the temperature and pressure (T&P) profiles and/or Doppler effects from altitude-dependent wind shear. From the multi-frequency sampling across the doublet structure of the R(6) manifold of CH4, a clear bias signature was observed in this work and while its specific origin remains unclear, the nature of the observed deviations from the model have indicated the need to perform simultaneous wind LIDAR and T&P profile measurements. An added benefit of the line shape fits is the determination of the frequency offset that removes systematic errors associated with the OPO seed–signal frequency shift and other potential thermal drift factors.
Two independent studies were performed in the CO2/H2O and CH4/H2O regions to simultaneously measure both DIAL and IPDA LIDAR mixing ratios. Over the cloud aerosol regions, the uncertainties in the IPDA LIDAR retrievals were found to vary between ±0.2% and ±1% for CO2 and ±0.1% and ±1% for CH4, while the uncertainties in the range-averaged DIAL measurements varied between ±1% and ±2% in both regions. Moreover, the mixing ratios from the IPDA LIDAR measurements were found to be well-centered and within the error bars of the DIAL data.
Finally, we note that because of the current inability to adjust in real time the transmitter location, the overall signal returns were found to be far from optimal; the backscatter signal intensities were near the PMT detector’s saturation level in the CO2/H2O region while the online returns in the CH4/H2O region approached the detector’s noise floor. Current efforts are directed towards the development of a higher pulse repetition rate LIDAR system operating at 1.6 μm to survey the cloud base and provide active feedback for better positioning of the DIAL/IPDA LIDAR transceiver system.

Author Contributions

Conceptualization, J.R.S., G.A.W. and D.F.P.; Methodology, J.R.S., G.A.W. and D.F.P.; Software, J.R.S., G.A.W. and D.F.P.; Validation, J.R.S., G.A.W. and D.F.P.; Formal analysis, J.R.S., G.A.W. and D.F.P.; Investigation, J.R.S., G.A.W. and D.F.P.; Resources, J.R.S., G.A.W. and D.F.P.; Data curation, J.R.S., G.A.W. and D.F.P.; Writing—original draft, D.F.P.; Writing—review & editing, J.R.S., G.A.W. and D.F.P.; Visualization, J.R.S. and D.F.P.; Supervision, D.F.P.; Project administration, D.F.P.; Funding acquisition, D.F.P. All authors have read and agreed to the published version of the manuscript.

Funding

This research received no external funding.

Data Availability Statement

Acknowledgments

We gratefully acknowledge funding from the NIST Special Programs Office, James Whetstone, and the Innovation in Measurement Science program entitled “Bringing the SI to Global Atmospheric Greenhouse Gas Measurement” at NIST. We also wish to thank Erin Adkins and David Long at NIST for discussions and simulations of the Hartmann–Tran line shape used for CH4. Special thanks to Martin Stevens, Ryan Cole, and Kimberly Briggman for their detailed comments that have improved the quality of the manuscript.

Conflicts of Interest

The authors declare no conflict of interest.

Appendix A. Atmospheric Profiles from Airport Soundings, Picarro Cavity Ringdown and Vaisala Weather Station Measurements
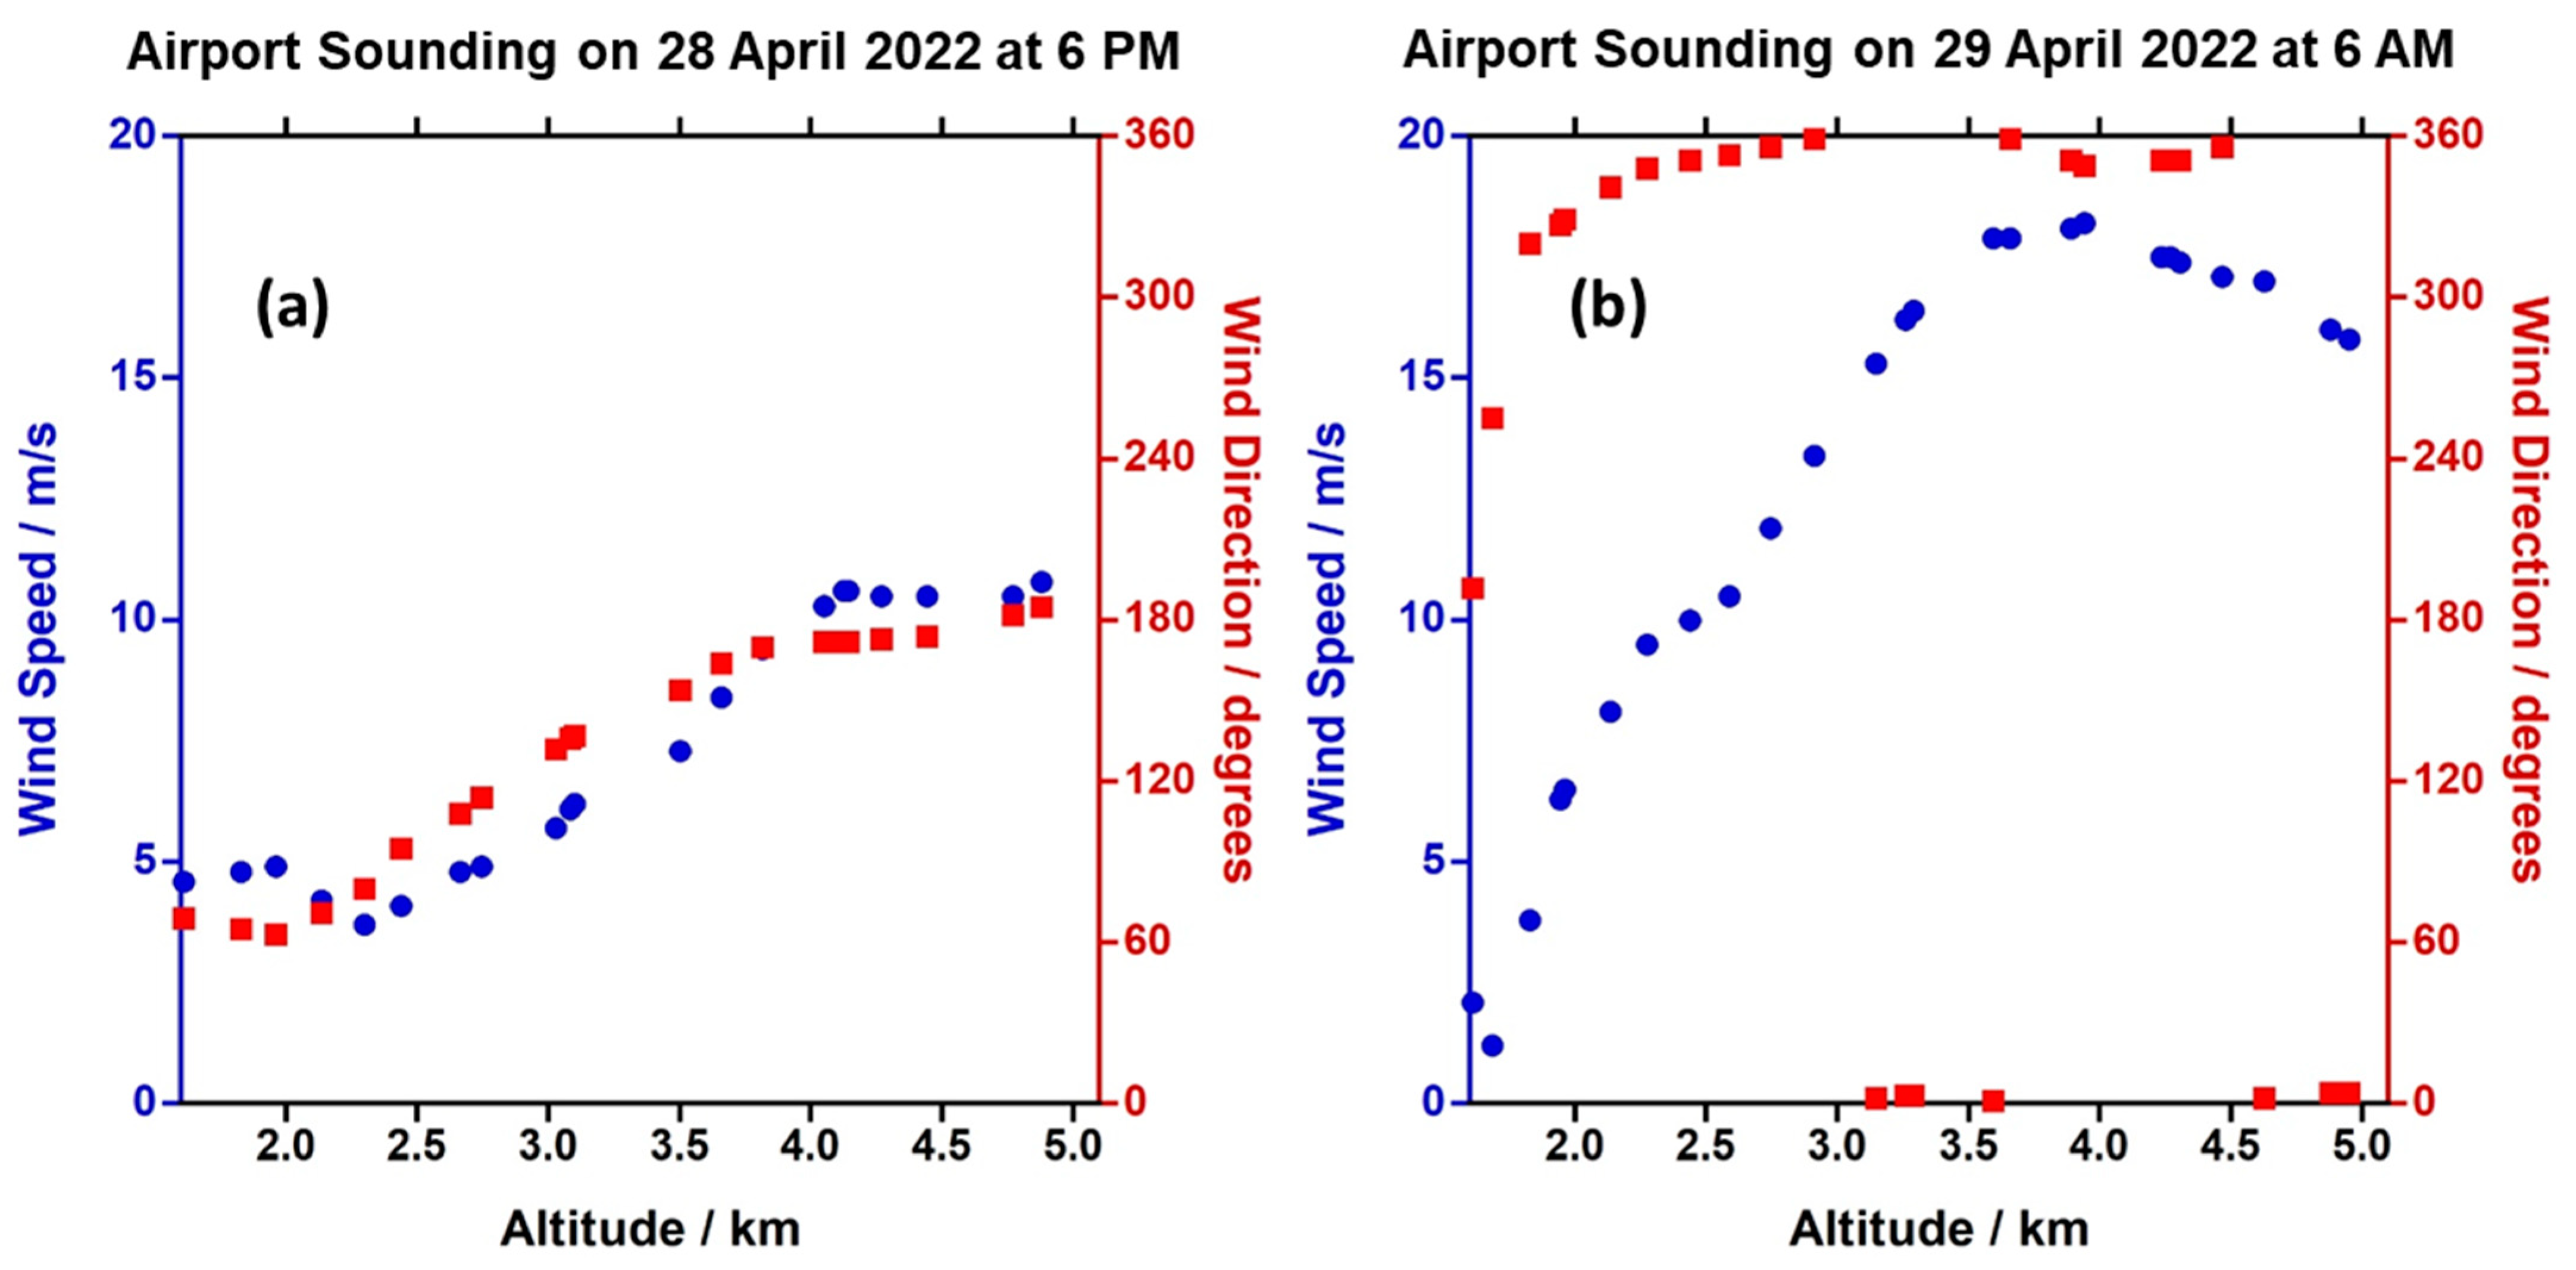
Figure A1. The measured wind speed (blue dots) and direction (red squares) profiles at the Denver International Airport located 65 km east from the NIST Boulder campus launched on (a) 28 April 2022, at ≈6:00 PM, and (b) 29 April 2022, at ≈6:00 AM. The profiles are shown from the base altitude of 1.6 km in Denver up to an altitude of 5 km, a range that would impact the pressure fits to the CH4 data in Figure 11.
Remotesensing 15 05595 g0a1
The Denver International Airport soundings measured on 28 April 2022, at ≈6 PM, and on 29 April 2022, at ≈6 AM, are shown in Figure A1a,b, respectively. These two soundings bracket the DIAL/IPDA LIDAR measurements performed on CH4/H2O beginning 28 April 2022, at 9:46:58 PM (Epoch: 1651204198).
Figure A2. The measured T&P profiles at the Denver International Airport located at 65 km east from the NIST Boulder campus launched on (a) 28 April 2022, at ≈6:00 PM, and (b) 29 April 2022, at ≈6:00 AM. Curve fits to the data were performed using decaying exponential for pressure and a polynomial of order 4 for temperature. The profiles are shown beginning at the base altitude of 1.6 km in Denver up to an altitude of 5 km, a range that would impact the pressure fits to the CH4 data in Figure 11. The T&P profiles of the U.S. Standard Atmosphere are shown in (c) for comparison.
Remotesensing 15 05595 g0a2
The Denver International Airport soundings measured on 28 April 2022, at ≈6 PM, and on 29 April 2022, at ≈6 AM, are shown in Figure A2a,b, respectively. These two soundings bracket the DIAL/IPDA LIDAR measurements performed on CH4/H2O beginning 28 April 2022, at 9:46:58 PM (Epoch: 1651204198). For this start time, the T&P profile for the U.S. Standard Atmosphere is shown in Figure A2c.
The real-time measurements from two point sensors (Picarro cavity ringdown instrument, G2301 and Vaisala weather station, WXT520) that were obtained with a temporal resolution of ≈10 s are shown in Figure A3a,b for CO2/H2O and CH4/H2O, respectively. In contrast to the relatively smooth trends observed for CO2/H2O in Figure A3a, the large scatter seen for CH4 in Figure A3b is highly unusual. The transients seen for CO2 are more typical of the trends observed and likely arise from a power plant located on the Boulder NIST campus in Colorado.
Figure A3. The point sensor measurement of the dry-air mixing ratios of (a) of CO2 and (b) CH4 (top traces in blue) and of H2O (bottom traces: Picarro in red and Vaisala in orange in (a) or green in (b)).
Remotesensing 15 05595 g0a3

References

  1. Cezard, N.; Le Mehaute, S.; Le Gouët, J.; Valla, M.; Goular, D.; Fleury, D.; Planchat, C.; Dolfi-Bouteyre, A. Performance assessment of a coherent DIAL-Doppler fiber lidar at 1645 nm for remote sensing of methane and wind. Opt. Express 2020, 28, 22345–22357. [Google Scholar] [CrossRef] [PubMed]
  2. Koch, G.J.; Beyon, J.Y.; Gibert, F.; Barnes, B.W.; Ismail, S.; Petros, M.; Petzar, P.J.; Yu, J.; Modlin, E.A.; Davis, K.J.; et al. Side-line tunable laser transmitter for differential absorption lidar measurements of CO2: Design and application to atmospheric measurements. Appl. Opt. 2008, 47, 944–956. [Google Scholar] [CrossRef] [PubMed]
  3. Sakaizawa, D.; Kawakami, S.; Nakajima, M.; Tanaka, T.; Morino, I.; Uchino, O. An airborne amplitude-modulated 1.57 μm differential laser absorption spectrometer: Simultaneous measurement of partial column-averaged dry air mixing ratio of CO2 and target range. Atmos. Meas. Tech. 2013, 6, 387–396. [Google Scholar] [CrossRef]
  4. Wagner, G.A.; Plusquellic, D.F. Multi-frequency differential absorption LIDAR system for remote sensing of CO2 and H2O near 1.6 µm. Opt. Express 2018, 26, 19420–19434. [Google Scholar] [CrossRef]
  5. Cadiou, E.; Dherbecourt, J.-B.; Gorju, G.; Melkonian, J.-M.; Godard, A.; Pelon, J.; Raybaut, M. Atmospheric CO2 measurements with a 2-μm DIAL instrument. EPJ Web Conf. 2018, 176, 05045. [Google Scholar] [CrossRef]
  6. Sakaizawa, D.; Nagasawa, C.; Nagai, T.; Abo, M.; Shibata, Y.; Nakazato, M.; Sakai, T. Development of a 1.6 μm differential absorption lidar with a quasi-phase-matching optical parametric oscillator and photon-counting detector for the vertical CO2 profile. Appl. Opt. 2009, 48, 748. [Google Scholar] [CrossRef] [PubMed]
  7. Amediek, A.; Fix, A.; Wirth, M.; Ehret, G. Development of an OPO system at 1.57 μm for integrated path DIAL measurement of atmospheric carbon dioxide. Appl. Phys. B 2008, 92, 295–302. [Google Scholar] [CrossRef]
  8. Ehret, G.; Kiemle, C.; Wirth, M.; Amediek, A.; Fix, A.; Houweling, S. Space-borne remote sensing of CO2, CH4, and N2O by integrated path differential absorption lidar: A sensitivity analysis. Appl. Phys. B 2008, 90, 593–608. [Google Scholar] [CrossRef]
  9. Abshire, J.B.; Ramanathan, A.K.; Riris, H.; Allan, G.R.; Sun, X.; Hasselbrack, W.E.; Mao, J.; Wu, S.; Chen, J.; Numata, K.; et al. Airborne measurements of CO2 column concentrations made with a pulsed IPDA lidar using a multiple-wavelength-locked laser and HgCdTe APD detector. Atmos. Meas. Tech. 2018, 11, 2001–2025. [Google Scholar] [CrossRef]
  10. Dobler, J.; Harrison, F.; Browell, E.; Lin, B.; McGregor, D.; Kooi, S.; Choi, Y.; Ismail, S. Atmospheric CO2 column measurements with an airborne intensity-modulated continuous wave 1.57 um fiber laser lidar. Appl. Opt. 2013, 52, 2874–2892. [Google Scholar] [CrossRef]
  11. Wagner, G.A.; Plusquellic, D.F. Ground-based, integrated path differential absorption LIDAR measurement of CO2, CH4, and H2O near 1.6 μm. Appl. Opt. 2016, 55, 6292–6310. [Google Scholar] [CrossRef] [PubMed]
  12. Yue, B.; Yu, S.; Li, M.; Wei, T.; Yuan, J.; Zhang, Z.; Dong, J.; Jiang, Y.; Yang, Y.; Gao, Z.; et al. Local-scale horizontal CO2 flux estimation incorporating differential absorption lidar and coherent Doppler wind lidar. Remote Sens. 2022, 14, 5150. [Google Scholar] [CrossRef]
  13. Stroud, J.R.; Dienstfrey, W.J.; Plusquellic, D.F. Study on local power plant emissions using multi-frequency differential absorption LIDAR and real time plume tracking. Remote Sens. 2023, 15, 4283. [Google Scholar] [CrossRef]
  14. Amediek, A.; Ehret, G.; Fix, A.; Wirth, M.; Büdenbender, C.; Quatrevalet, M.; Kiemle, C.; Gerbig, C. CHARM-F a new airborne integrated-path differential-absorption lidar for carbon dioxide and methane observations: Measurement performance and quantification of strong point source emissions. Appl. Opt. 2017, 56, 5182–5197. [Google Scholar] [CrossRef] [PubMed]
  15. Riris, H.; Numata, K.; Li, S.; Wu, S.; Ramanathan, A.; Dawsey, M.; Mao, J.; Kawa, R.; Abshire, J.B. Airborne measurements of atmospheric methane column abundance using a pulsed integrated-path differential absorption lidar. Appl. Opt. 2012, 51, 8296–8306. [Google Scholar] [CrossRef] [PubMed]
  16. Ehret, G.; Bousquet, P.; Pierangelo, C.; Alpers, M.; Millet, B.; Abshire, J.B.; Bovensmann, H.; Burrows, J.P.; Chevallier, F.; Ciais, P.; et al. MERLIN: A French-German space lidar mission dedicated to atmospheric methane. Remote Sens. 2017, 9, 1052. [Google Scholar] [CrossRef]
  17. Bode, M.; Alpers, M.; Millet, B.; Ehret, G.; Flamant, P. MERLIN: An integrated path differential absorption (IPDA) LIDAR for global methane remote sensing. In Proceedings of the International Conference on Space Optics (ICSO), Tenerife, Spain, 7–10 October 2014. [Google Scholar]
  18. Mao, J.; Ramanathan, A.; Abshire, J.B.; Kawa, S.R.; Riris, H.; Allan, G.R.; Rodriguez, M.; Hasselbrack, W.E.; Sun, X.; Numata, K.; et al. Measurement of atmospheric CO2 column concentrations to cloud tops with a pulsed multi-wavelength airborne lidar. Atmos. Meas. Tech. 2018, 11, 127–140. [Google Scholar] [CrossRef]
  19. Durand, Y.; Caron, J.; Bensi, P.; Ingmann, P.; Bézy, J.; Meynart, R. A-SCOPE: Concepts for an ESA mission to measure CO2 from space with a lidar. In Proceedings of the 8th International Symposium on Tropospheric Profiling, Delft, The Netherlands, 19–23 October 2009. [Google Scholar]
  20. Bousquet, P.; Pierangelo, C.; Bacour, C.; Marshall, J.; Peylin, P.; Ayar, P.V.; Ehret, G.; Bréon, F.-M.; Chevallier, F.; Crevoisier, C.; et al. Error budget of the Methane Remote LIdar missioN and its impact on the uncertainties of the global methane budget. J. Geophys. Res. Atmos. 2018, 123, 11766–11785. [Google Scholar] [CrossRef]
  21. Petros, M.; Refaat, T.F.; Singh, U.N.; Yu, J.; Antill, C.; Remus, R.; Taylor, B.D.; Wong, T.-H.; Reithmaier, K.; Lee, J.; et al. Development of an advanced two-micron triple-pulse IPDA LIDAR for carbon dioxide and water vapor measurements. EPJ Web Conf. 2018, 176, 01009. [Google Scholar] [CrossRef]
  22. Stroud, J.R.; Wagner, G.A.; Plusquellic, D.F. Validation of a Multi-Frequency Differential Absorption LIDAR (DIAL) System from Aerosol and Cloud Retrievals. Paper JW3A.18; CLEO: San Jose, CA, USA, 2022. [Google Scholar]
  23. Wagner, G.; Behrendt, A.; Wulfmeyer, V.; Späth, F.; Schiller, M. High-power Ti:sapphire laser at 820 nm for scanning ground-based water–vapor differential absorption lidar. Appl. Opt. 2013, 52, 2454–2469. [Google Scholar] [CrossRef]
  24. Certain commercial equipment, instruments, or materials are identified in this paper in order to specify the experimental procedure adequately. Such identification is not intended to imply recommendation or endorsement by NIST, nor is it intended to imply that the materials or equipment identified are necessarily the best available for the purpose.
  25. Drever, R.W.P.; Hall, J.L.; Kowalski, F.V.; Hough, J.; Ford, G.M.; Munley, A.J.; Ward, H. Laser phase and frequency stabilization using an optical resonator. Appl. Phys. B Laser Opt. 1983, 31, 97–105. [Google Scholar] [CrossRef]
  26. Delahaye, T.; Maxwell, S.E.; Reed, Z.D.; Lin, H.; Hodges, J.T.; Sung, K.; Devi, V.M.; Warneke, T.; Spietz, P.; Tran, H. Precise methane absorption measurements in the 1.64 μm spectral region for the MERLIN mission. J. Geophys. Res. Atmos. 2016, 121, 7360–7370. [Google Scholar] [CrossRef] [PubMed]
  27. Vasilchenko, S.; Delahaye, T.; Kassi, S.; Campargue, A.; Armante, R.; Tran, H.; Mondelain, D. Temperature dependence of the absorption of the R(6) manifold of the 2 ν3 band of methane in air in support of the MERLIN mission. J. Quant. Spectrosc. Radiat. Transf. 2023, 298, 108483. [Google Scholar] [CrossRef]
  28. Plusquellic, D.F.; Votava, O.; Nesbitt, D.J. Absolute frequency stabilization of an injection-seeded optical parametric oscillator. Appl. Opt. 1996, 35, 1464–1472. [Google Scholar] [CrossRef] [PubMed]
  29. Newsom, R.K.; Turner, D.D.; Mielke, B.; Clayton, M.; Ferrare, R.; Sivaraman, C. Simultaneous analog and photon counting detection for Raman lidar. Appl. Opt. 2009, 48, 3903–3914. [Google Scholar] [CrossRef]
  30. Mendonca, J.; Strong, K.; Wunch, D.; Toon, G.C.; Long, D.A.; Hodges, J.T.; Sironneau, V.T.; Franklin, J.E. Using a speed-dependent Voigt line shape to retrieve O2 from Total Carbon Column Observing Network solar spectra to improve measurements of XCO2. Atmos. Meas. Tech. 2019, 12, 35–50. [Google Scholar] [CrossRef]
  31. Gordon, I.; Rothman, L.; Hargreaves, R.; Hashemi, R.; Karlovets, E.; Skinner, F.; Conway, E.; Hill, C.; Kochanov, R.; Tan, Y.; et al. The HITRAN2020 Molecular spectroscopic database. J. Quant. Spectrosc. Radiat. Transf. 2022, 277, 107949. [Google Scholar] [CrossRef]
  32. NOAA; NASA; USAF. U.S. Standard Atmosphere. 1976. Available online: https://www.ngdc.noaa.gov/stp/space-weather/online-publications/miscellaneous/us-standard-atmosphere-1976/us-standard-atmosphere_st76-1562_noaa.pdf (accessed on 28 November 2023).
  33. Gotti, R.; Prevedelli, M.; Kassi, S.; Marangoni, M.; Romanini, D. Feed-forward coherent link from a comb to a diode laser: Application to widely tunable cavity ring-down spectroscopy. J. Chem. Phys. 2018, 148, 054202. [Google Scholar] [CrossRef]
  34. Vasilchenko, S.; Tran, H.; Mondelain, D.; Kassi, S.; Campargue, A. Accurate absorption spectroscopy of water vapor near 1.64 μm in support of the MEthane Remote LIdar missioN (MERLIN). J. Quant. Spectrosc. Radiat. Transf. 2019, 235, 332–342. [Google Scholar] [CrossRef]
  35. Ngo, N.; Lisak, D.; Tran, H.; Hartmann, J.-M. An isolated line-shape model to go beyond the Voigt profile in spectroscopic databases and radiative transfer codes. J. Quant. Spectrosc. Radiat. Transf. 2013, 129, 89–100. [Google Scholar] [CrossRef]
  36. Fix, A.; Quatrevalet, M.; Amediek, A.; Wirth, M. Energy calibration of integrated path differential absorption lidars. Appl. Opt. 2018, 57, 7501–7514. [Google Scholar] [CrossRef] [PubMed]
  37. Sun, X.; Abshire, J.B.; Ramanathan, A.; Kawa, S.R.; Mao, J. Retrieval algorithm for the column CO2 mixing ratio from pulsed multi-wavelength lidar measurements. Atmos. Meas. Tech. 2021, 14, 3909–3922. [Google Scholar] [CrossRef]
  38. Clough, S.A.; Iacono, M.J. Line-by-line calculation of atmospheric fluxes and cooling rates 2. Application to carbon dioxide, methane, nitrous oxide and the halocarbons. J. Geophys. Res. Atmos. 1995, 100, 16519–16535. [Google Scholar] [CrossRef]
  39. Delahaye, T.; Landsheere, X.; Pangui, E.; Huet, F.; Hartmann, J.-M.; Tran, H. Mesaurements of H2O broadening coefficients of infrared methane lines. J. Quant. Spectrosc. Radiat. Transf. 2016, 173, 40–48. [Google Scholar] [CrossRef]
  40. Cole, R.; Fredrick, C.; Nguyen, N.H.; Diddams, S.A. Precision Doppler shift measurements with a frequency comb calibrated laser heterodyne radiometer. Opt. Lett. 2023, 48, 5185–5188. [Google Scholar] [CrossRef]
  41. Agustí-Panareda, A.; Barré, J.; Massart, S.; Inness, A.; Aben, I.; Ades, M.; Baier, B.C.; Balsamo, G.; Borsdorff, T.; Bousserez, N.; et al. Technical note: The CAMS greenhouse gas reanalysis from 2003 to 2020. Atmos. Chem. Phys. 2023, 23, 3829–3859. [Google Scholar] [CrossRef]
  42. Stroud, J.R.; Simon, J.R.; Wagner, G.A.; Plusquellic, D.F. Interleaved electro-optic dual comb generation to expand bandwidth and scan rate for molecular spectroscopy and dynamics studies near 1.6 μm. Opt. Express 2021, 29, 33155–33170. [Google Scholar] [CrossRef]
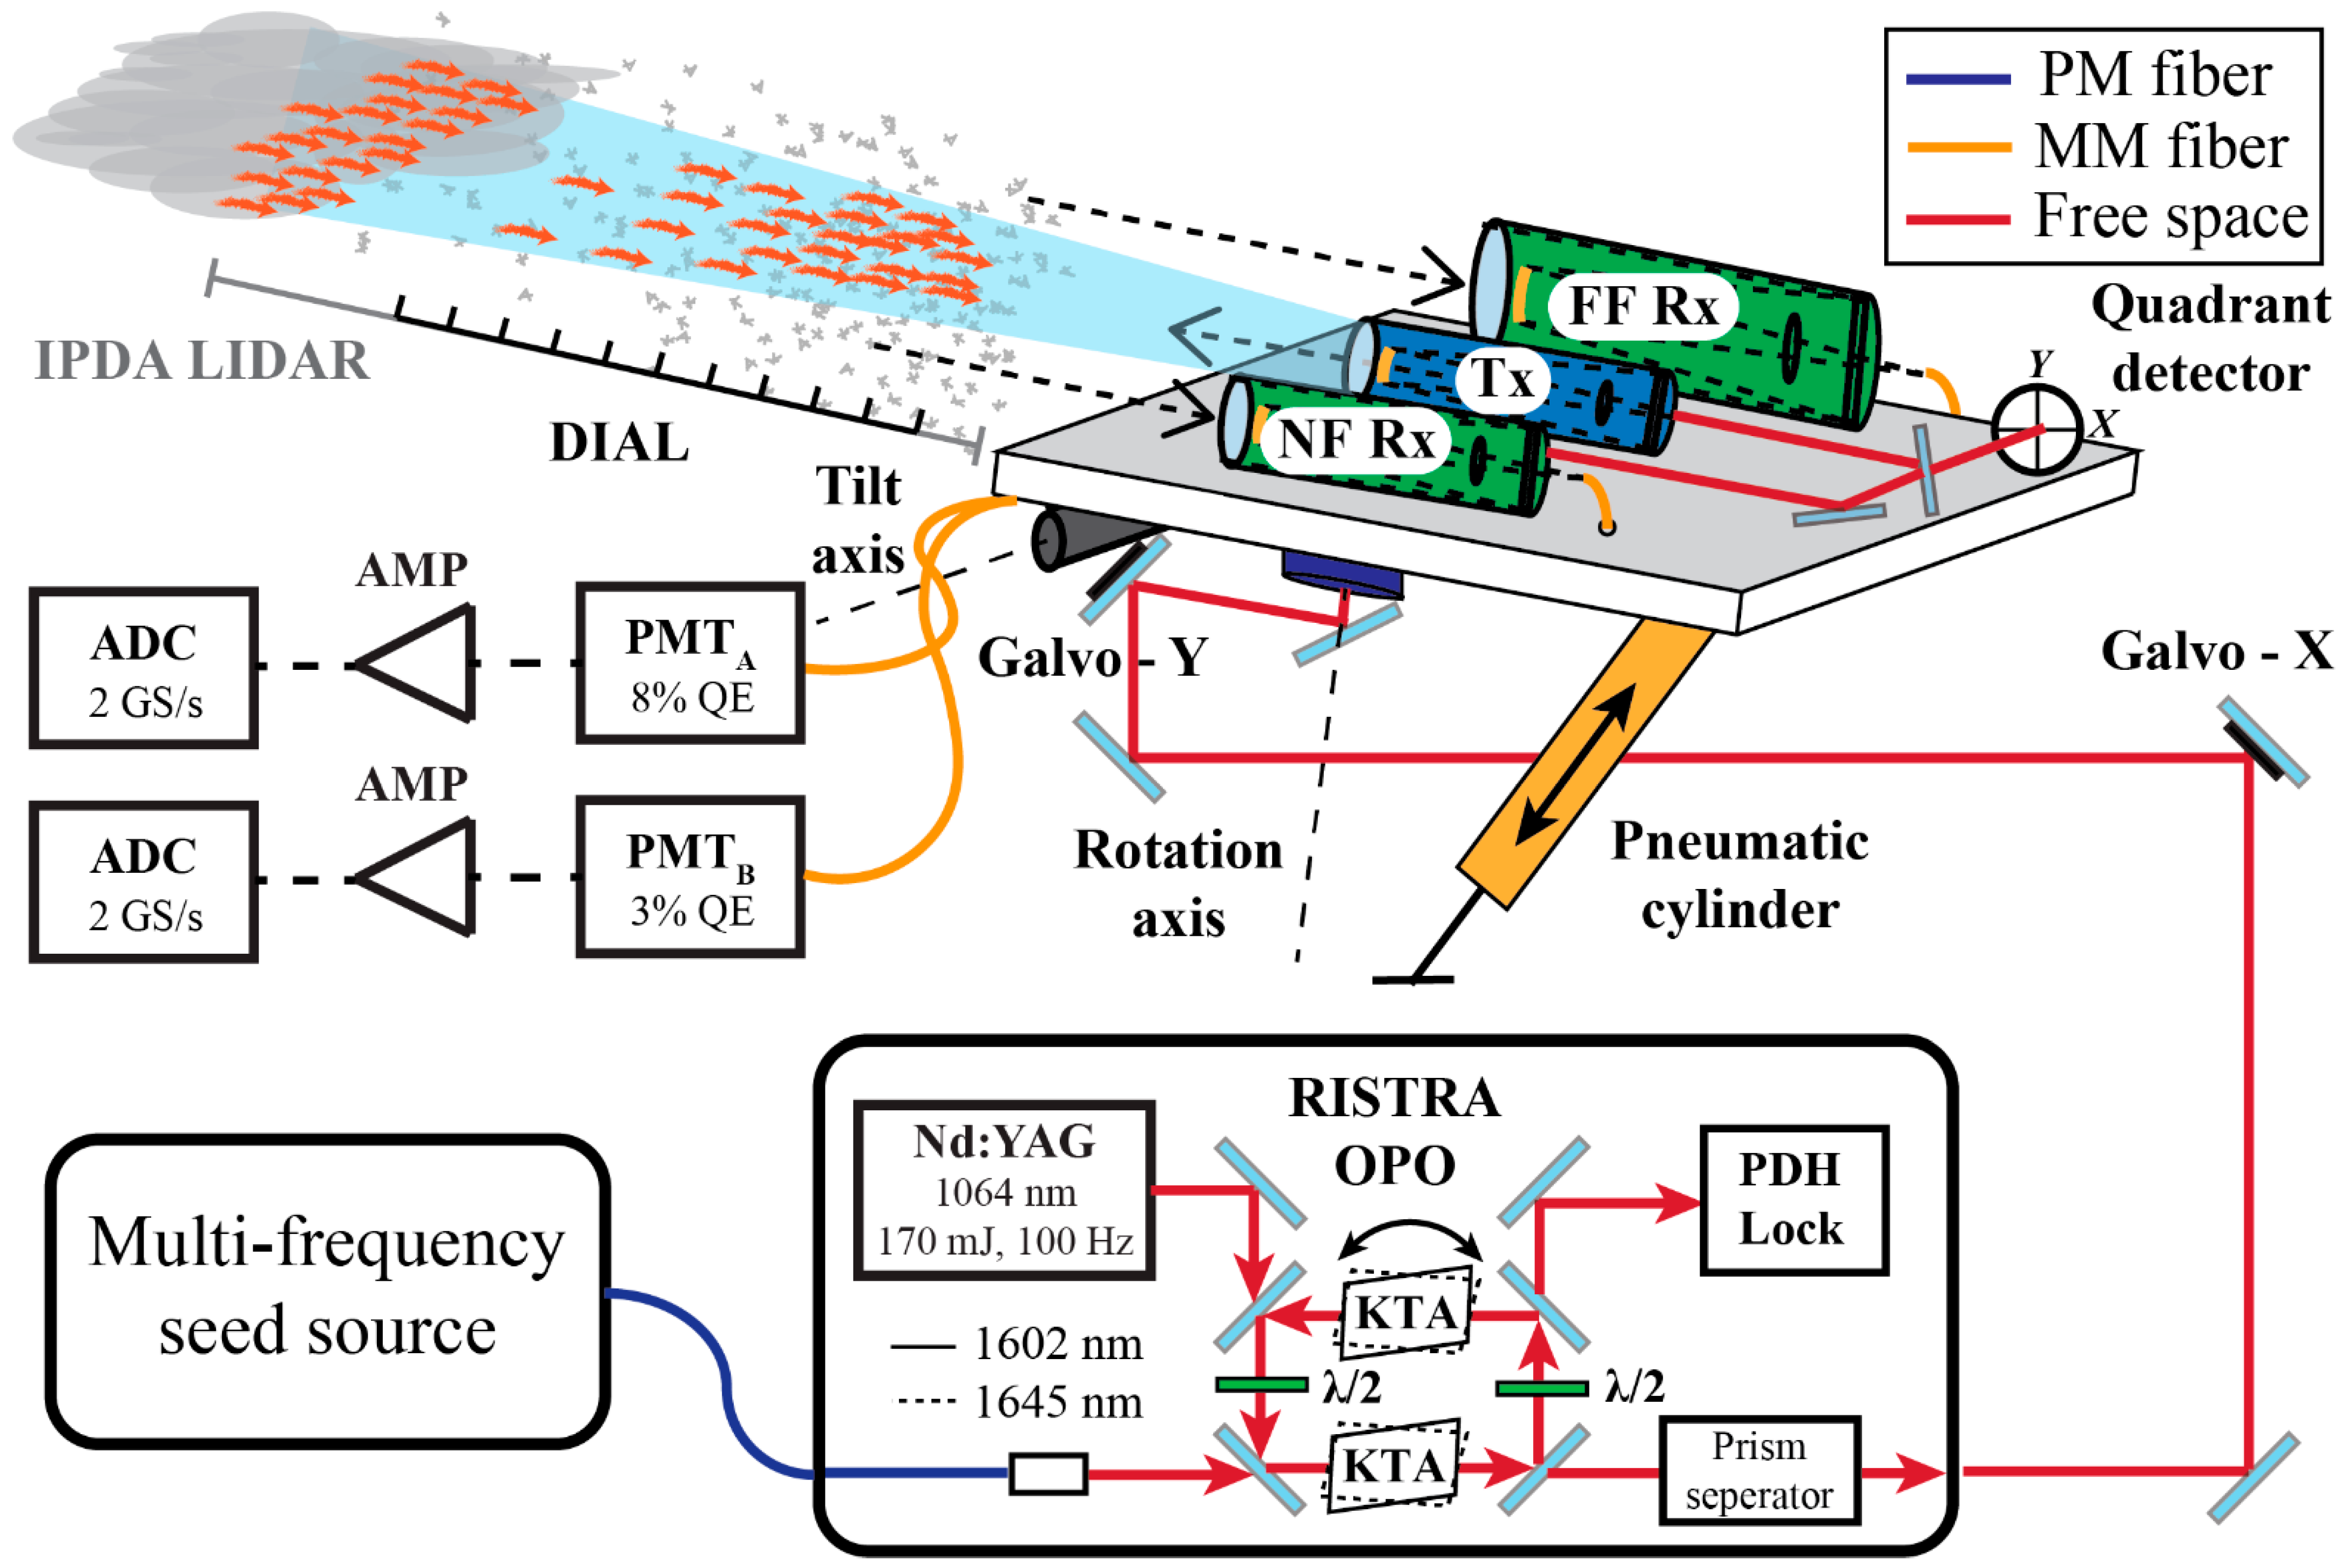
Figure 1. The principal components of the DIAL/IPDA LIDAR system and the movable platform that supports the transceiver assembly. Details of the OPO seed system are given in [4,11].
Remotesensing 15 05595 g001
Figure 2. The spectral regions selected to measure the mixing ratios of (a) CO2 and H2O and (b) CH4 and H2O. The ten frequencies used to probe the lines are shown with solid (red) dots where the first two offline frequencies are nearly on top of one another. The order of the frequencies in the sequence is labeled with ν1ν10. The top axis shows the relative frequency detuning in MHz.
Remotesensing 15 05595 g002
Figure 3. (a) The range-resolved signal returns from aerosols for the CO2 region out to 10 km and from cloud aerosols from 10 km to 12 km for the first 10 min interval (marked in (b) with vertical white dashed lines). The inclination of the receiver was 2.5° above the horizon. The data were obtained on 24 November 2021. The 3 offline returns are shown in blue shades (all overlapping), the 5 online returns of CO2 are shown in orange/red shades and the 2 online returns of H2O are shown in green shades. (b) The log (base 10) of the range- and background-corrected LIDAR map for the first offline frequency (ν1) is shown for the full measurement period. (c) The range-resolved signal returns from aerosols are shown for the CH4 region out to 15 km and from cloud aerosols from 16 km to 22 km for the first 10 min interval (marked in (d) with vertical white dashed lines). The inclination of the receiver was 10.5° above the horizon. The data were obtained on 28 April 2022. The 3 offline returns are shown in blue shades (all overlapping), the 6 online returns of CH4 are shown in orange/red shades and the one online return of H2O is shown in green. (d) The log (base 10) of the range- and background-corrected LIDAR map for the first offline frequency (ν1) is shown for the full measurement period. The insets in (a,c) are expanded regions over the cloud returns where the y-axis is shown on the log (base 10) scale to better separate the individual frequencies labeled 1–10 (see Figure 2). The data in (a,c) were taken 155 days apart. Regions with no color in (b,d) are below the detection sensitivity.
Remotesensing 15 05595 g003
Figure 4. (a) The log ratios, l n N k ( R ) N 1 ( R ) , for CO2/H2O as a function of range, illustrating their near linear increase out to and through the cloud (online CO2 or CH4, orange/red shades; online H2O, green shades; offline:, blue shades). The enhanced SNRs after 10 km are from the more than 100-fold increase in back-scattered counts from the cloud aerosol signal returns. (b) The near linear optical depth increases for CH4/H2O are shown as a function of range. The enhanced SNRs from 18 km to 20 km are from the >10-fold increase in back-scattered counts from the cloud aerosol signal returns. A small amount of data smoothing in (b) was applied to better distinguish the log ratios at the different frequencies that are labeled in the legend. In both panels, the solid black lines from R = 0 to full overlap at 0.625 km are extrapolated from linear fits of the data between the vertical dashed lines (0.625 km to 5 km) after correction for small variations in the range-resolved concentrations and altitude. The line intercepts for each color at the solid vertical line (i.e., R = 0) are proportional to the received laser pulse energies (LPEs).
Remotesensing 15 05595 g004
Figure 5. Integrated path (IPDA LIDAR) line shape fits as a function of range over a single 10 min interval of the (a) CO2/H2O sampled region and (b) CH4/H2O sampled region. Residuals from the fits are shown in the lower panels. The reduction in the residuals in (a) from 12 km to 13.5 km results from large enhancement in backscatter from cloud aerosols. For the CH4/H2O fits in (b), the reduction in the residuals is not as obvious because of the overall much weaker signal returns. Expanded sections of these fits are given in Figure 6a–d for ranges near 1.5 km and in the cloud regions.
Remotesensing 15 05595 g005
Figure 6. The IPDA LIDAR data (red dots) and best-fit profiles in the CO2/H2O sampled region for different ranges centered at (a) 1.5 km and (b) 12.5 km and in the CH4/H2O sampled region for ranges centered at (c) 1.75 km and (d) 18.75 km. The frequency axes of each profile span about 1.3 cm−1. The residuals are shown below each profile relative to calculated line shapes (blue curves) from HITRAN 2020 for the CO2/H2O regions and from HTP for CH4/H2O regions.
Remotesensing 15 05595 g006
Figure 7. (a) The dry-air CO2 mixing ratios obtained from the weighted average of the IPDA LIDAR data over a 3.8 h period on 24 November 2021 and (b) the dry-air CH4 mixing ratios obtained from the weighted average of the IPDA LIDAR data over a 5 h period on 28 April 2022. The y-axis ticks in both panels are given on ≈1% intervals. The uncertainties are Type A, k = 1 or 1σ.
Remotesensing 15 05595 g007
Figure 8. Nighttime DIAL measurement beginning at 20:32 MST on 24 November 2021 consisting of (a) range-resolved dry-air mixing ratios of CO2, (b) H2O near 6241.4 cm−1 from 0.75 km to 9.25 km and (c) the log (base 10) of the range and background corrected offline LIDAR signal returns. Nighttime DIAL measurements beginning at 21:50 MST on 28 April 2022 consisting of (d) range-resolved dry-air mixing ratios of CH4, (e) H2O near 6077.0 cm−1 from 0.75 km to 9.25 km and (f) the log of the range- and background-corrected offline LIDAR signal returns. The CO2 and CH4 concentrations are shown with an effective temporal resolution of ≈20 min. In both cases, the range resolution is 250 m at 0.75 km and linearly increases to ≈1.5 km at 9.25 km. The altitude scales on the right axes are relative to the transmitter base. Regions with missing color are below the detection sensitivity.
Remotesensing 15 05595 g008
Figure 9. (a) Comparison of the dry-air CO2 mixing ratios obtained from the weighted average of the IPDA LIDAR data (blue squares) and range-averaged DIAL data (RA-DIAL) (red dots) over a 3.8 h period on 24 November 2021 and (b) comparison of the dry-air CH4 concentrations obtained from the weighted average of the IPDA LIDAR data and RA-DIAL data (red dots) over a 5 h period on 28 April 2022. The range resolution is 250 m at 0.75 km and linearly increases to ≈1.5 km at 9.2 km. The uncertainties are Type A, k = 1 or 1σ.
Remotesensing 15 05595 g009
Figure 10. The best-fit CH4 line shapes (blue lines) to the experimental data (red dots) using (a) HITRAN 2008 (HT08) at the inclination angle, θ = 10.5° (3.4 km in altitude), (b) HTP at θ = 10.5° (3.4 km in altitude), (c) HTP at θ = 6.5° (2.1 km in altitude) and (d) HTP at θ = 12.5° (4.1 km in altitude).
Remotesensing 15 05595 g010
Figure 11. The best-fit path-averaged pressures to a continual IPDA LIDAR series of line shape profiles for (a) the 2nd 10 min interval and (b) the 7th 10 min interval that sample high- and low-altitude cloud aerosol regions, respectively. These column intervals are indicated on the LIDAR map in (c) with black dashed vertical lines and the yellow squares indicate the 250 m range bin profiles used as the start and end positions for the pressure fits. The best-fit path-averaged pressures are shown in (d) for a series of DIAL-like profile differences taken between 250 m range bin profiles spaced by 6 km and shown as a function of the average range defined by the midpoints of these 6 km spacings. In all cases, the error bars represent the 1σ (Type A, k = 1) uncertainties obtained directly from the fits. The yellow and red lines in each plot represent the elevation angles (θ) for the path-averaged T&P profiles based on the U.S. Standard Atmosphere.
Remotesensing 15 05595 g011
Table 1. Specifications of the OPO based DIAL/IPDA LIDAR system a [4,24].
Frequency ConverterParametersDescription/Manufacturer
Wavelength coverage1600 nm to 1647 nmNew Focus, ECDL
Number of frequencies10Spectral coverage ≈ 40 GHz
PRF, SRF100 Hz, 10 Hz-
Microwave Synthesizer 20 GHz bandwidthAnritsu, MG37022A
Pulse energy5 mJ signal waveEp ≈ 170 mJ, Coherent Infinity
Pulse length (FWHM)<3 nsPump pulse ≈ 3 ns FWHM
Spectral linewidth (FWHM)190 MHzNearly transform limited
Two OPO KTA Crystals10 × 10 × 15 mm3, θ = 67.4°, φ = 0°Optical Platz, Inc. (NM, USA)
OPORISTRA, twisted rectangleAS Photonics, Inc. (Albuquerque, MN, USA)
Telescopes and detectors
Tx beam diameter, divergence254 mm, <300 to 400 μradRitchey-Chrétien, Orion
NF Rx. diameter, FOV279.4 mm, 3 mradSchmidt-Cassegrain, Celestron
FF Rx. diameter, FOV406.5 mm, 2 mradSchmidt-Cassegrain, Meade
Bandpass filter, 1645.5 nm1.9 nm (FWHM), T > 90%>5 OD rejection, Alluxa
Bandpass filter, 1602.2 nm2.0 nm (FWHM), T > 90%>5 OD rejection, Materion
Neutral density filter0.1, 0.3, 0.6, and 1 ODThorlabs
Rx to PMT fiber core diameters1 mm1 m cable length
NF PMT~3% QEHamamatsu H12397-75
FF PMT~8% QEHamamatsu H12397-75 SEL
Data acquisition
Transimpedance amp5 kV/A, τ3dB ≈ 1 nsFemto HCA-400M-5K-C
Digitizer8 bits, 2 GS/s, 2 channelsGaGe CobraMax CSE24G8
Raw data storage10 s averageNetCDF4 file format
Range bin resolution250 m to 500 mDefined in post-processing
Temporal resolution10 minDIAL concentration average
a NF Rx: near-field receiver telescope; FF Rx: far-field receiver telescope; FOV: field of view; OPO: optical parametric oscillator; PRF: pulse repetition frequency; SRF: scan repetition frequency; Ep: 1064 nm pump pulse energy; FWHM: full width at half maximum; PMT: photomultiplier tube; QE: quantum efficiency; T: transmittance; OD: optical density; Tx: transmitter; Rx: receiver.
Disclaimer/Publisher’s Note: The statements, opinions and data contained in all publications are solely those of the individual author(s) and contributor(s) and not of MDPI and/or the editor(s). MDPI and/or the editor(s) disclaim responsibility for any injury to people or property resulting from any ideas, methods, instructions or products referred to in the content.