Article

Future Land Use and Flood Risk Assessment in the Guanzhong Plain, China: Scenario Analysis and the Impact of Climate Change

1
Key Laboratory of Subsurface Hydrology and Ecological Effects in Arid Region, Ministry of Education, Chang’an University, Xi’an 710054, China
2
Xi’an Monitoring, Modelling and Early Warning of Watershed Spatial Hydrology International Science and Technology Cooperation Base, Chang’an University, Xi’an 710054, China
3
School of Water and Environment, Chang’an University, Xi’an 710054, China
4
Xi’an Xinsemi Material Technology Co., Ltd., Xi’an 710054, China
5
River Engineering and Urban Drainage Research Centre (REDAC), University Sains Malaysia, Nibong Tebal 14300, Penang, Malaysia
6
State Key Laboratory of Desert and Oasis Ecology, Key Laboratory of Ecological Safety and Sustainable Development in Arid Lands, Xinjiang Institute of Ecology and Geography, Chinese Academy of Sciences, Urumqi 830011, China
7
School of Civil Engineering, Sun Yat-sen University, Guangzhou 510275, China
8
College of Geomatics, Xi’an University of Science and Technology, Xi’an 710054, China
9
Shaanxi Key Laboratory of Earth Surface System and Environmental Carrying Capacity, College of Urban and Environmental Sciences, Northwest University, Xi’an 710127, China
10
Department of Civil and Environment Engineering, The Hong Kong Polytechnic University, Hong Kong SAR, China
11
School of Engineering, University of California, Merced, 5200 Lake R, Merced, CA 95343, USA
*
Author to whom correspondence should be addressed.
Remote Sens. 2023, 15(24), 5778; https://doi.org/10.3390/rs15245778
Submission received: 7 October 2023 / Revised: 23 November 2023 / Accepted: 25 November 2023 / Published: 18 December 2023

Abstract

:
Continuously global warming and landscape change have aggravated the damage of flood disasters to ecological safety and sustainable development. If the risk of flood disasters under climate and land-use changes can be predicted and evaluated, it will be conducive to flood control, disaster reduction, and global sustainable development. This study uses bias correction and spatial downscaling (BCSD), patch-generating land-use simulation (PLUS) coupled with multi-objective optimization (MOP), and entropy weighting to construct a 1 km resolution flood risk assessment framework for the Guanzhong Plain under multiple future scenarios. The results of this study show that BCSD can process the 6th Climate Model Intercomparison Project (CMIP6) data well, with a correlation coefficient of up to 0.98, and that the Kappa coefficient is 0.85. Under the SSP126 scenario, the change in land use from cultivated land to forest land, urban land, and water bodies remained unchanged. In 2030, the proportion of high-risk and medium-risk flood disasters in Guanzhong Plain will be 41.5% and 43.5% respectively. From 2030 to 2040, the largest changes in risk areas were in medium- and high-risk areas. The medium-risk area decreased by 1256.448 km2 (6.4%), and the high-risk area increased by 1197.552 km2 (6.1%). The increase mainly came from the transition from the medium-risk area to the high-risk area. The most significant change in the risk area from 2040 to 2050 is the higher-risk area, which increased by 337 km2 (5.7%), while the medium- and high-risk areas decreased by 726.384 km2 (3.7%) and 667.488 km2 (3.4%), respectively. Under the SSP245 scenario, land use changes from other land use to urban land use; the spatial distribution of the overall flood risk and the overall flood risk of the SSP126 and SSP245 scenarios are similar. The central and western regions of the Guanzhong Plain are prone to future floods, and the high-wind areas are mainly distributed along the Weihe River. In general, the flood risk in the Guanzhong Plain increases, and the research results have guiding significance for flood control in Guanzhong and global plain areas.

1. Introduction

The dramatic changes in the global climate have led to an increase in the frequency of flood disasters. Meanwhile, anthropogenic activities have increased the proportion of impervious surfaces in the world and reduced the area of green space. In this case, it is causing serious economic and life losses on a global scale [1,2,3,4,5]. Especially in developing countries, the abuse of resources and environmental protection awareness is relatively low, making them more vulnerable to floods [6]. Recently, various parts of China have suffered from the effects of flooding [7]. For example, on 20 July 2021, Zhengzhou City, Henan Province, saw a “once-in-a-millennium” torrential rain, causing severe flash floods, landslides, river floods, and large-scale urban floods. The disaster caused 380 deaths and missing people in Zhengzhou City, with direct economic losses of CNY 40.9 billion, seriously affecting people’s lives [8,9,10]. The frequent occurrence of floods is closely linked to climate change. The latest assessment report of the Intergovernmental Panel on Climate Change (IPCC) shows that human activities have led to increasing climate change and dramatic changes in the regional environment [11,12,13], with more frequent extreme weather events and climate change disrupting the smoothness in hydrological analysis, thus further increasing the intensity of regional flooding. Flood disasters and human activities have a direct impact on land use and land cover, and changes in land use and land cover can subtly change regional temperature, rainfall, vegetation, and other neglected climatic factors to a certain extent [14,15], making flood prevention more difficult. At present, China’s research on the impact of climate change and land-use types on floods is still in its infancy, which poses a considerable challenge for future flood control and disaster reduction work and flood disaster risk management [16,17].
The research on global climate and land-use change has made great strides in recent years [14,18,19]. Climate models are indispensable for the prediction of climate change. The Coupled Model Intercomparison Project Phase 6 (CMIP6) global climate model (GCM) is now widely used in climate change research [20,21,22]. Chen [20] found that the CMIP6 model improved the modeling of extreme index trends in critical regions of the world, predicting a significant increase in extreme rainfall days and five consecutive days of maximum precipitation. It is crucial to predict areas prone to waterlogging on a fine scale. Studies showed that human activities change land-use conditions, which is an important reason for the occurrence of floods [23,24,25,26,27]. The probability of a waterlogging disaster is proportional to the proportion of the impervious surface and inversely proportional to the proportion of green space [28,29]. At present, the cellular automata (CA), future land-use simulation (FLUS), and PLUS models are widely used to simulate and predict dynamic changes in land use [30,31]. Lin et al. [31] used maximum entropy (MAXENT) and the FLUS model to predict future waterlogging-prone areas. Zhang [32] used the PLUS model to simulate future multi-scenario land-use types in the Yangtze River basin for 2035–2095, and the Kappa coefficient was 0.896. Most studies demonstrated that the PLUS model has a higher accuracy for the landscape pattern, location, and quantity simulation than the FLUS model [33,34]. Meanwhile, the PLUS model can be used to simulate regional ecological environment changes and to evaluate, design, and plan ecological management behaviors [35]. Compared with other models, the PLUS model can better reveal the internal relationship of land-use change. However, few studies have considered the impact of climate change and land use on flood disasters at the same time. This paper aims to fill this gap.
Another key issue is the selection and proportion of flood-disaster-causing factors [36,37]. In the current research, the methods of using multi-criteria analysis to evaluate flood disaster and vulnerability include the Technique for Order of Preference by Similarity to Ideal Solution (TOPSIS) and Simple Additive Weighting [38], hierarchical analysis (AHP) [39], the fuzzy analytic hierarchy process [40], the set pair analysis–variable fuzzy sets model [41], and entropy weighting [42]. The entropy weight method is mainly used in the study of environmental science, but it is a relatively new method for flood risk assessment. This method does not consider the decision maker’s factors in the calculation process, calculating the weight by solving the mathematical model, so it produces more objective results [43,44]. In previous flood risk studies, higher-resolution data play an essential role in regional future flood risk evaluation. A coarse resolution product [39] was used to predict the runoff under four typical concentration paths (RCPs) using 21 general climate models (GCMs), and runoff estimates at 25 km resolution in Canada from 1961 to 2005 and from 2061 to 2100 were generated [45]; Rincón [45] used CMhyd to downscale seven GCMs in CMIP5, and the study based its calculations on station data, with the number of stations directly influencing the spatial resolution. In contrast, most of the existing multi-scenario flood risk assessments focus on RCPs; Li [46] constructed flood risk assessments for different scenarios (RCPs 2.6, 4.5, 6.0, and 8.5). However, less consideration is given to SSPs, where the main flood-inducing factors that should be considered are precipitation (SSPs-RCPs), land use (SSPs-RCPs), GDP, and population (SSPs-RCPs). To optimize the scenario change and the resolution of the flood assessment, this study builds on this to construct a high-resolution multi-scenario flood risk assessment framework.
The present work aims to construct a 1 km resolution future multi-scenario flood risk assessment framework in the context of climate change and urbanization, to conduct a multi-scenario flood risk assessment for the future Guanzhong Plain via coupling BCSD, PLUS, and the entropy weighting methods, to guide future flood prevention in the Guanzhong Plain, and to supply references for other plain areas globally.

2. General Situation of the Research Area

2.1. Research Area

The Guanzhong Plain is located in the Weihe River alluvial plain on the northern foot of the Qinling Mountains in Shaanxi Province. It is also known as the Weihe Plain. It is between 107.4°~111.49°E and 33.92°~36.05°N, with an average altitude of about 500 m (Figure 1a). There have been significant spatial and temporal differences in the occurrence of floods in the Guanzhong Plain over the last 400 years, compared to other regions [47]. In the first 200 years, the flood disasters in the Guanzhong Plain mainly occurred in Xi’an and Tongchuan, in the lower reaches of the Luo River. The occurrence of floods in the Guanzhong Plain over the last 200 years has had noticeable seasonal differences, with the extremes mainly occurring in the summer and autumn. In addition, the flat topography, loose soils, and sparse surface vegetation of the Guanzhong Plain are unique natural conditions that can lead to regional flooding.

2.2. Data Sources

HRLT (1975–2014): Comprehensive statistical analysis methods such as machine learning, generalized additive models, and thin plate splines were used to interpolate daily grid data. They were based on the 0.5° × 0.5° grid dataset of the China Meteorological Administration, with elevation, aspect, slope, terrain humidity index, latitude, and longitude as the main covariates. The MAE, RMSE, Cor, R2, and NSE were 1.30 mm, 4.78 mm, 0.84, 0.71, and 0.70. The resolution of the dataset was 1 km × 1 km [48].
CMIP6 data (1975–2050) were derived from the historical test data of cmip6 and the data of different shared social and economic paths (SSPs, including SSP126 and SSP245); this study predicts the daily precipitation in the Guanzhong Plain under different scenarios from 2030 to 2050.
The data on land use and driving factors used in this study are shown in Table 1.
To ensure data consistency during the calculation, the drive factor data were uniformly resampled to 1 km × 1 km using ArcGIS.

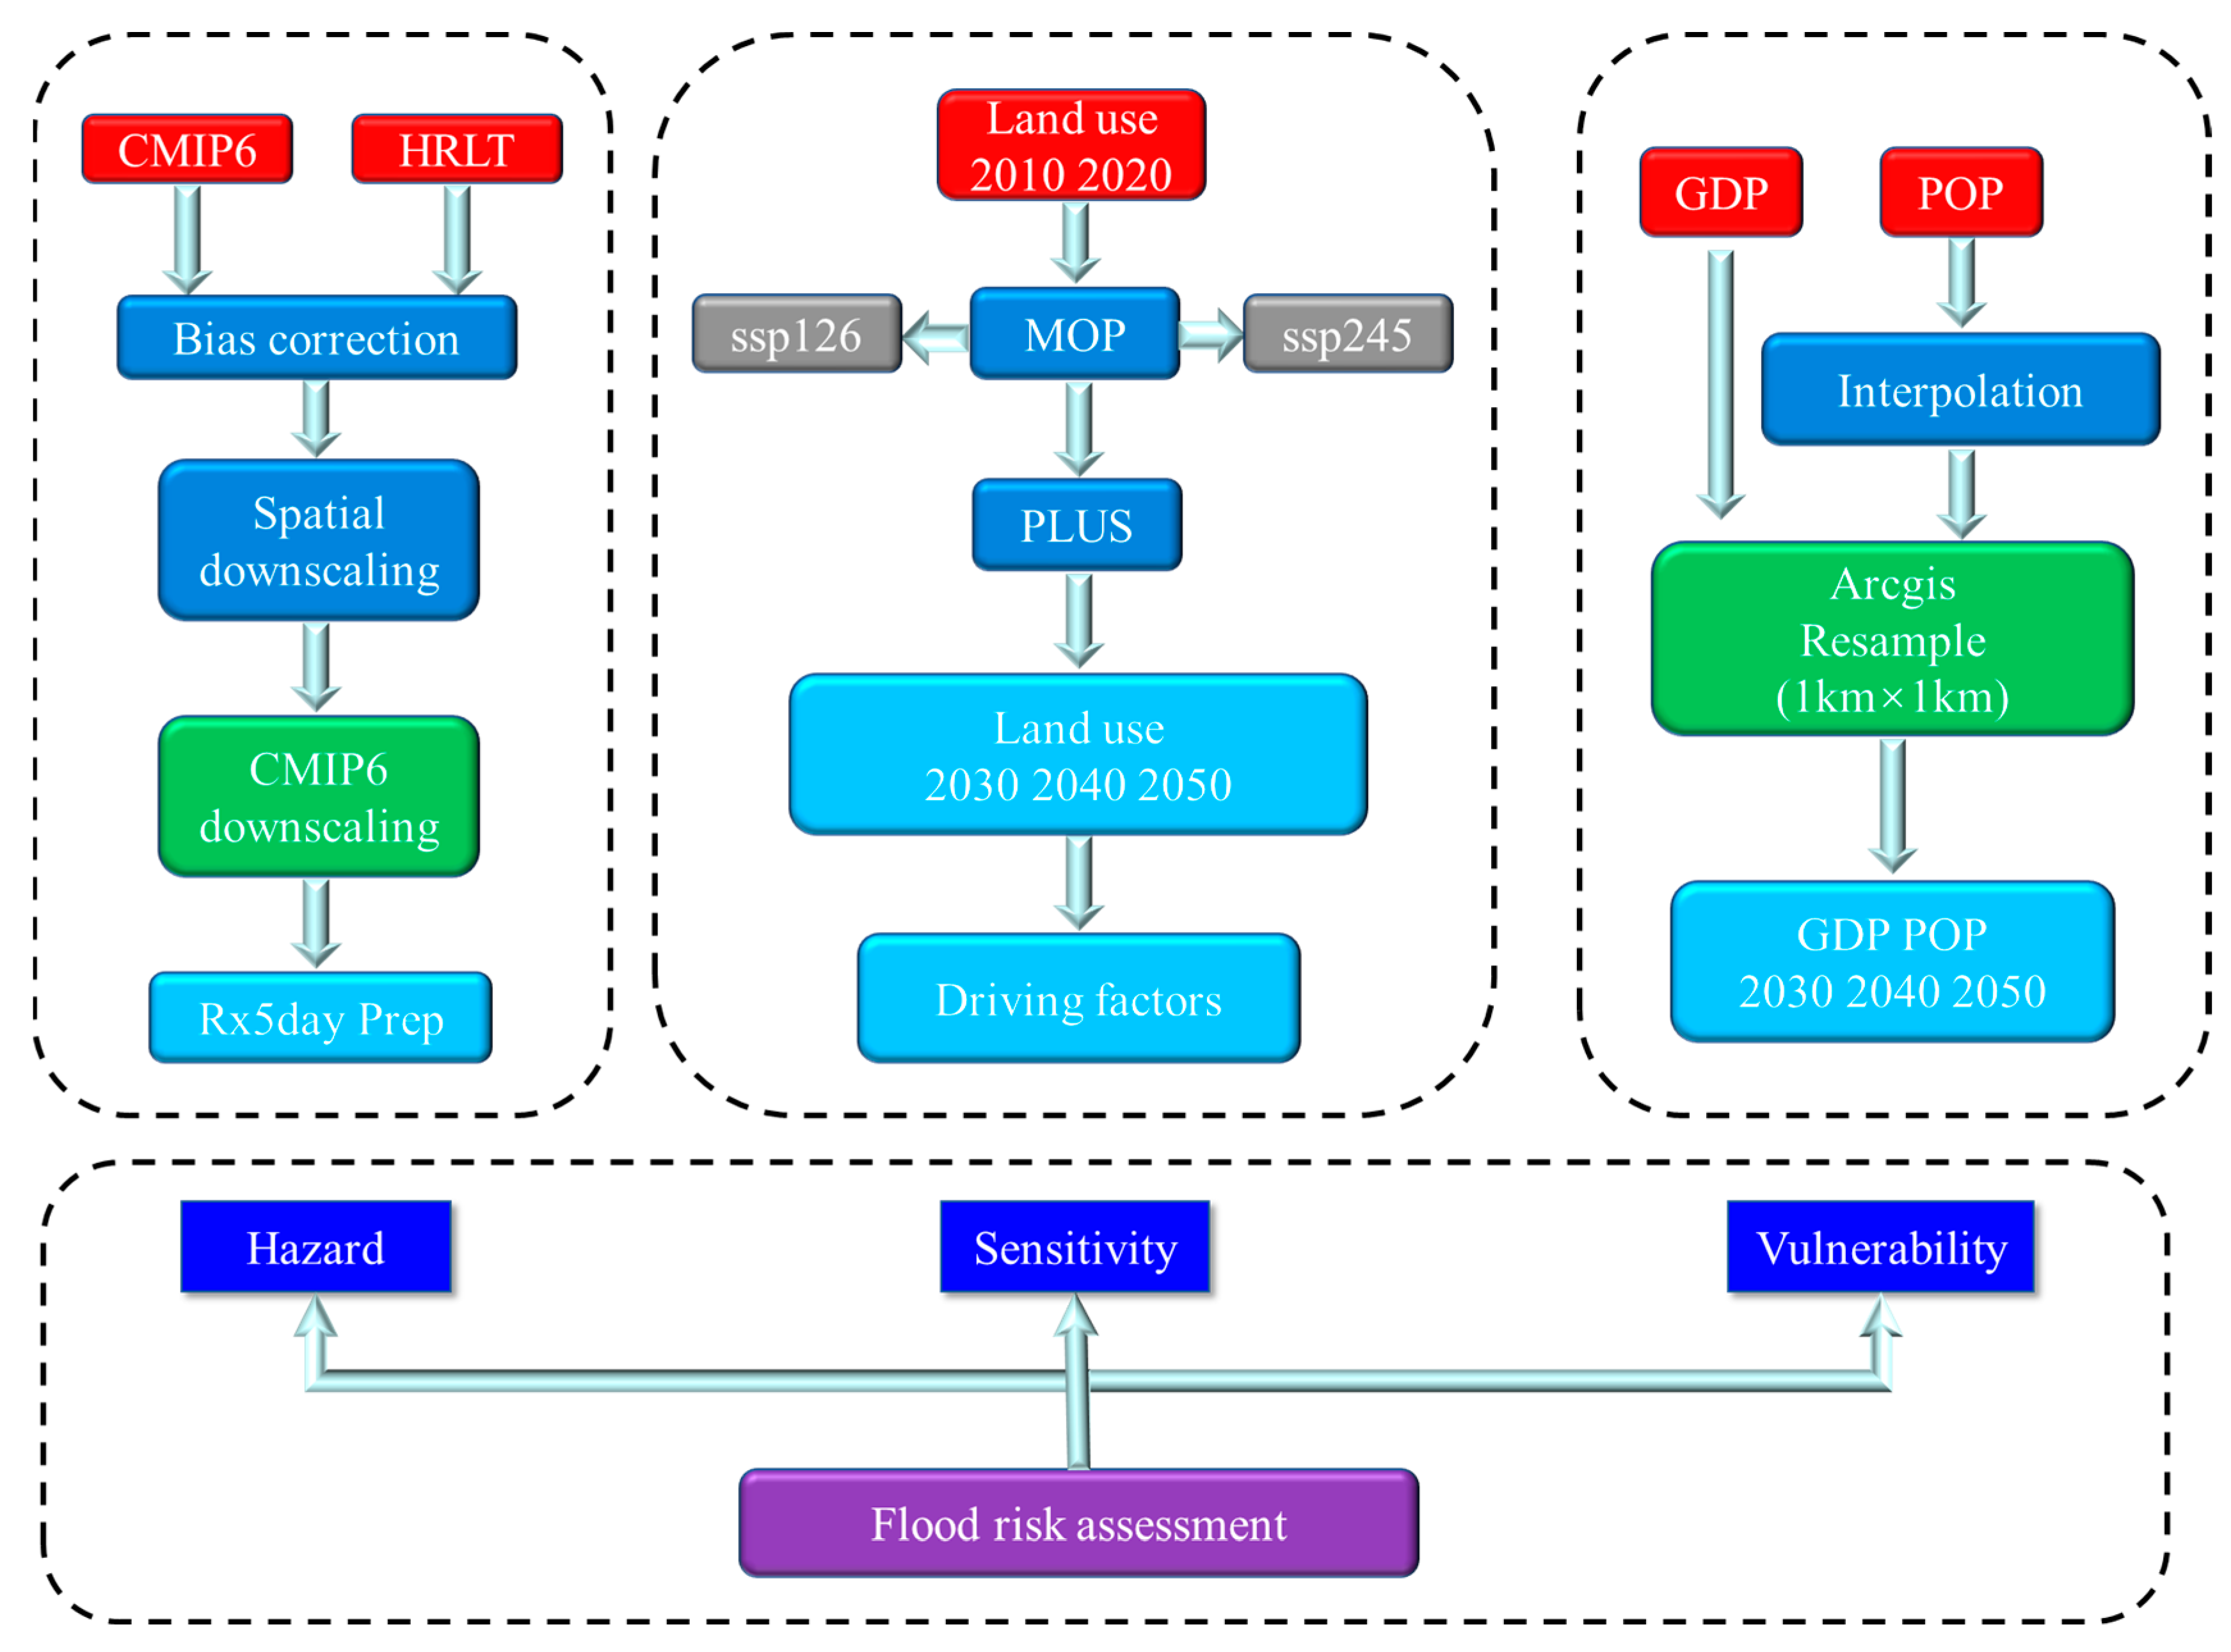
3. Materials and Methods

3.1. BCSD

To obtain reliable datasets at a conventional resolution of 0.5°, GCMs at different resolutions need to be bias-corrected and downscaled. Based on the bias between the simulated and observed climate variables at each percentile, the simulated dataset’s cumulative distribution function (CDF) is adjusted using the equidistant cumulative distribution function (EDCDF) method. The method can be expressed as follows:
x c o r r e c t = x + F o c 1 F m s x F m c 1 ( F m s ( x ) )
where x is the climate variable, in which the precipitation is used in this paper; F o c 1 F m s x F m c 1 ( F m s ( x ) ) is the deviation between the model output and the observation; F is the cumulative distribution function (CDF); F o c 1 and F m c 1 denotes the observation and the model output during the historical training period; and F m s denotes the model output during the correction period.

3.2. MOP + PLUS

3.2.1. MOP

MOP [49] is an open and flexible method incorporating various ecological and macroeconomic policies. To construct a reasonable land-use structure, this study designs two scenarios according to different constraints and objective functions: (1) a sustainable development model that balances economic benefits and ecological values (SSP126); (2) natural development scenarios predicted by the Markov chain (SSP245).
The optimization objectives of MOP are listed in Table 2. The constraint conditions of these objective functions are shown in Table 3. Finally, the multi-objective optimization results are calculated using Lingo.

3.2.2. PLUS

The PLUS model combines rule mining based on the land expansion analysis strategy with cellular automata based on multiple random patch seed types [34]. It allows the driver to be explored, and it is possible to obtain the reasonable probability of various kinds of LULC extensions using the RF classification.
(1)
Land expansion strategy analysis (LEAS)
The transition rules obtained in LEAS have the characteristics of time, which can describe the nature of land-use change during a specific time interval.
P i , k d x = n = 1 M I ( h n x = d ) M
where P is the final growth probability of the land-use type K in unit I, I (·) is the indicator function of the decision tree set, hn(x) is the prediction type of the nth decision tree of the vector x, and M is the total number of decision trees.
(2)
CA
The CA model is a land-use simulation model driven by scenarios. Its main principle is divided into two parts: “top-down” (global land-use demand) and “bottom-up” (local land-use competition).
O P i , k d = 1 , t = P i , k d = 1 × Ω i , k t × D k t
where O P i , k d = 1 , t represents the change probability of the kth land-use type at the ith place of the data grid, D k t is the influence of k on the future land use in t time, and Ω i , k t represents the neighborhood effect at the ith position of the grid.
(3)
Model validation
Based on previous studies and the principles of data availability, data consistency, data comprehensiveness, and data redundancy [50,51,52,53,54], this paper selects natural driving factors such as elevation, slope, and precipitation; accessibility driving factors such as river distance, road distance, and railway distance; and socio-economic driving factors such as GDP and population density. The land-use demand under the scenarios of SSP126 and SSP245 in 2030, 2040, and 2050, calculated by the Markov chain and MOP, is used to determine the land-use demand of the project. Based on the land-use pattern of the Guanzhong Plain in 2010 and 2020, the land-use patterns in 2030, 2040, and 2050 under the joint action of the above driving factors are simulated. By setting the same PLUS model parameters, this study simulates the land-use pattern in 2020 based on the land-use pattern in 2010 and compares it with the real land-use situation in 2020. The Kappa coefficient is 0.8507, which indicates that the prediction accuracy is higher, and the land-use pattern simulation results are reliable.

3.3. Construction of Flood Risk Assessment Model

This paper selects the flood risk evaluation index of the Guanzhong Plain from three aspects: disaster-causing factors, disaster-pregnant factors, and disaster-bearing factors. The disaster-causing factors are the average annual rainfall and Rx5day; the disaster-pregnant factors are the elevation, slope, distance from rivers, distance from roads, and land use, based on the land-use data for 2030, 2040, and 2050 under the two scenarios of SSP126 and SSP245 simulated by the PLUS model. Runoff coefficients (RC) were used to assign values to each of the six land uses: 0.60, 0.30, 0.35, 0.92, 0.70, and 1.00; and the disaster-bearing factors are the population density and GDP. All data were normalized to obtain the respective factor indicators. The flood risk assessment structure is shown in Figure 2.
For calculating the hazard, sensitivity, and vulnerability indicators, the entropy weighting method was chosen for each precipitation unit under different scenarios for 2030, 2040, and 2050.

4. Results

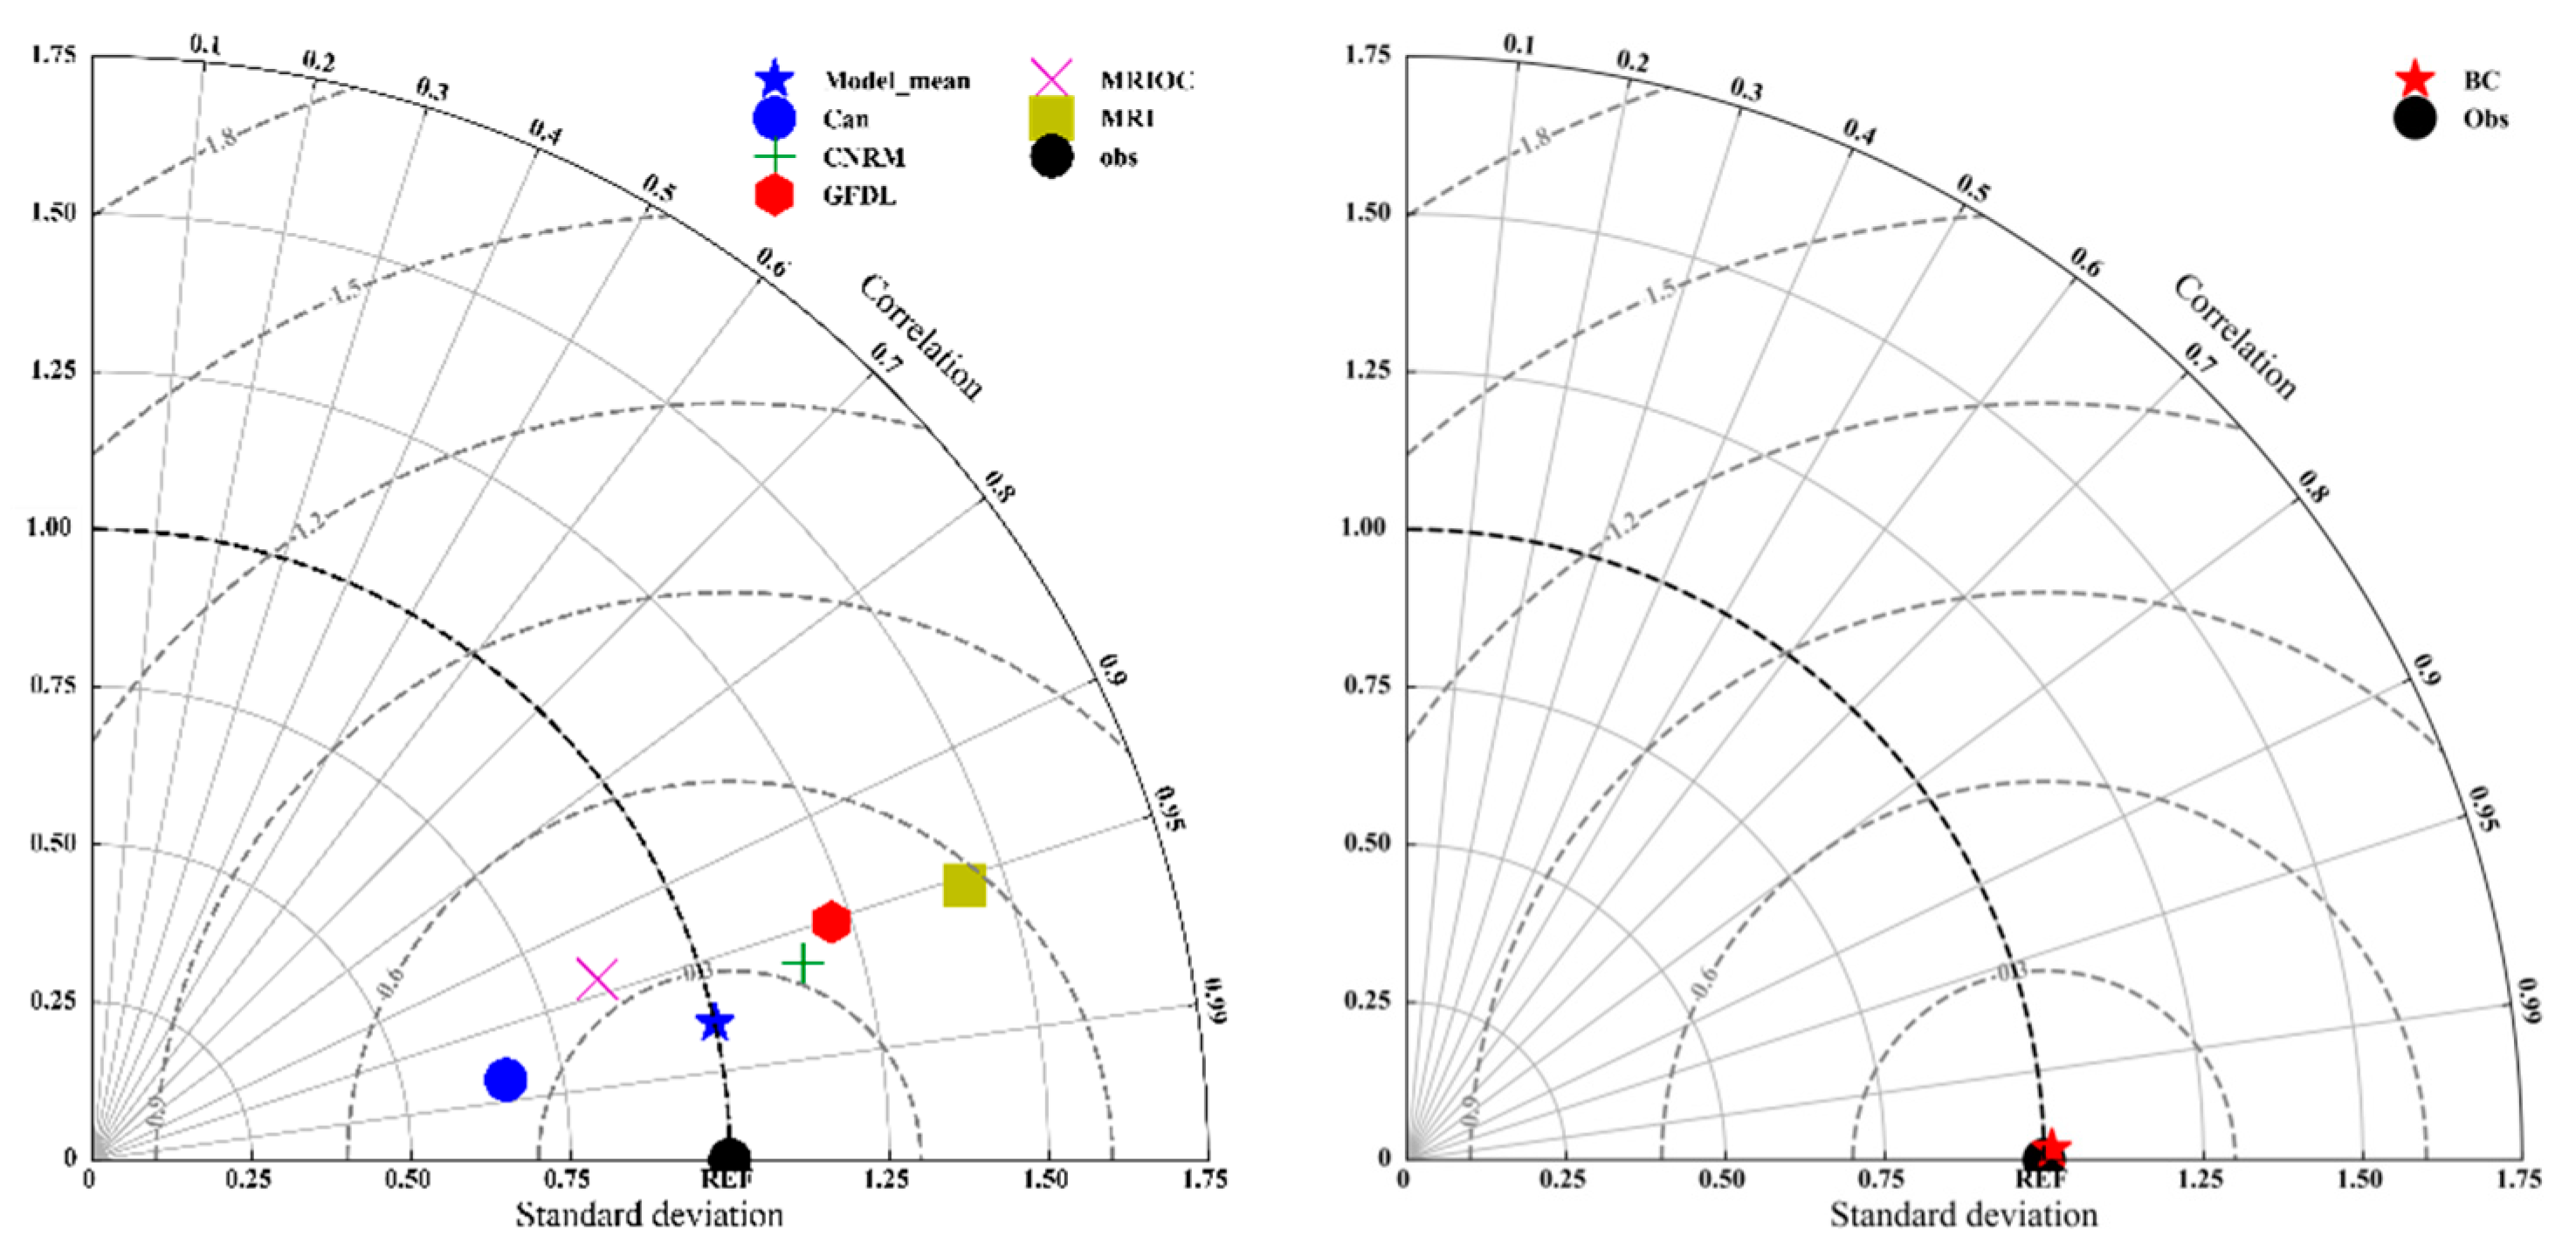
4.1. Verification of Future Precipitation Accuracy

The GCMs data selected for this study are shown in Table 4. The research, first, compares the performance of observation data and model data during the historical period (1970–2014). From the deviation index between the root-mean-square error and the multi-year average value, the error of the multi-mode ensemble average is significantly smaller than that of the single mode. The precipitation of the multi-mode set is consistent with the observed monthly precipitation during the year (Figure 3). The Taylor chart shows that each model has a good simulation ability for precipitation in the Guanzhong Plain. Among them, the standard deviation of each mode is less than 1, and the correlation coefficient is more than 0.95.
Moreover, the standard deviation is smaller than that of the single mode, and the correlation coefficient is higher than that of the single mode, reaching more than 0.98. As can be seen from Figure 3, the simulated monthly precipitation values before the model correction significantly deviated from the observed values. After the correction, the difference between the simulated and observed monthly precipitation values is controlled, with the maximum error within 5 mm (Figure 4). The constructed deviation correction model can correct the model deviation very well. In conclusion, the simulation effect of multi-mode ensemble averaging is better than that of single-mode. Still, the resolution and accuracy of the mode after ensemble averaging have not reached the accuracy required by this study, so deviation correction and downscaling are necessary.
The corrected downscaling model is used to downscale the cmip6 data from 2030 to 2050 under the SSP126 and SSP245 scenarios, that is, to complete the future precipitation forecast in the Guanzhong Plain. Ultimately, this study uses the downscaled CMIP6 data to calculate the annual precipitation and Rx5day.

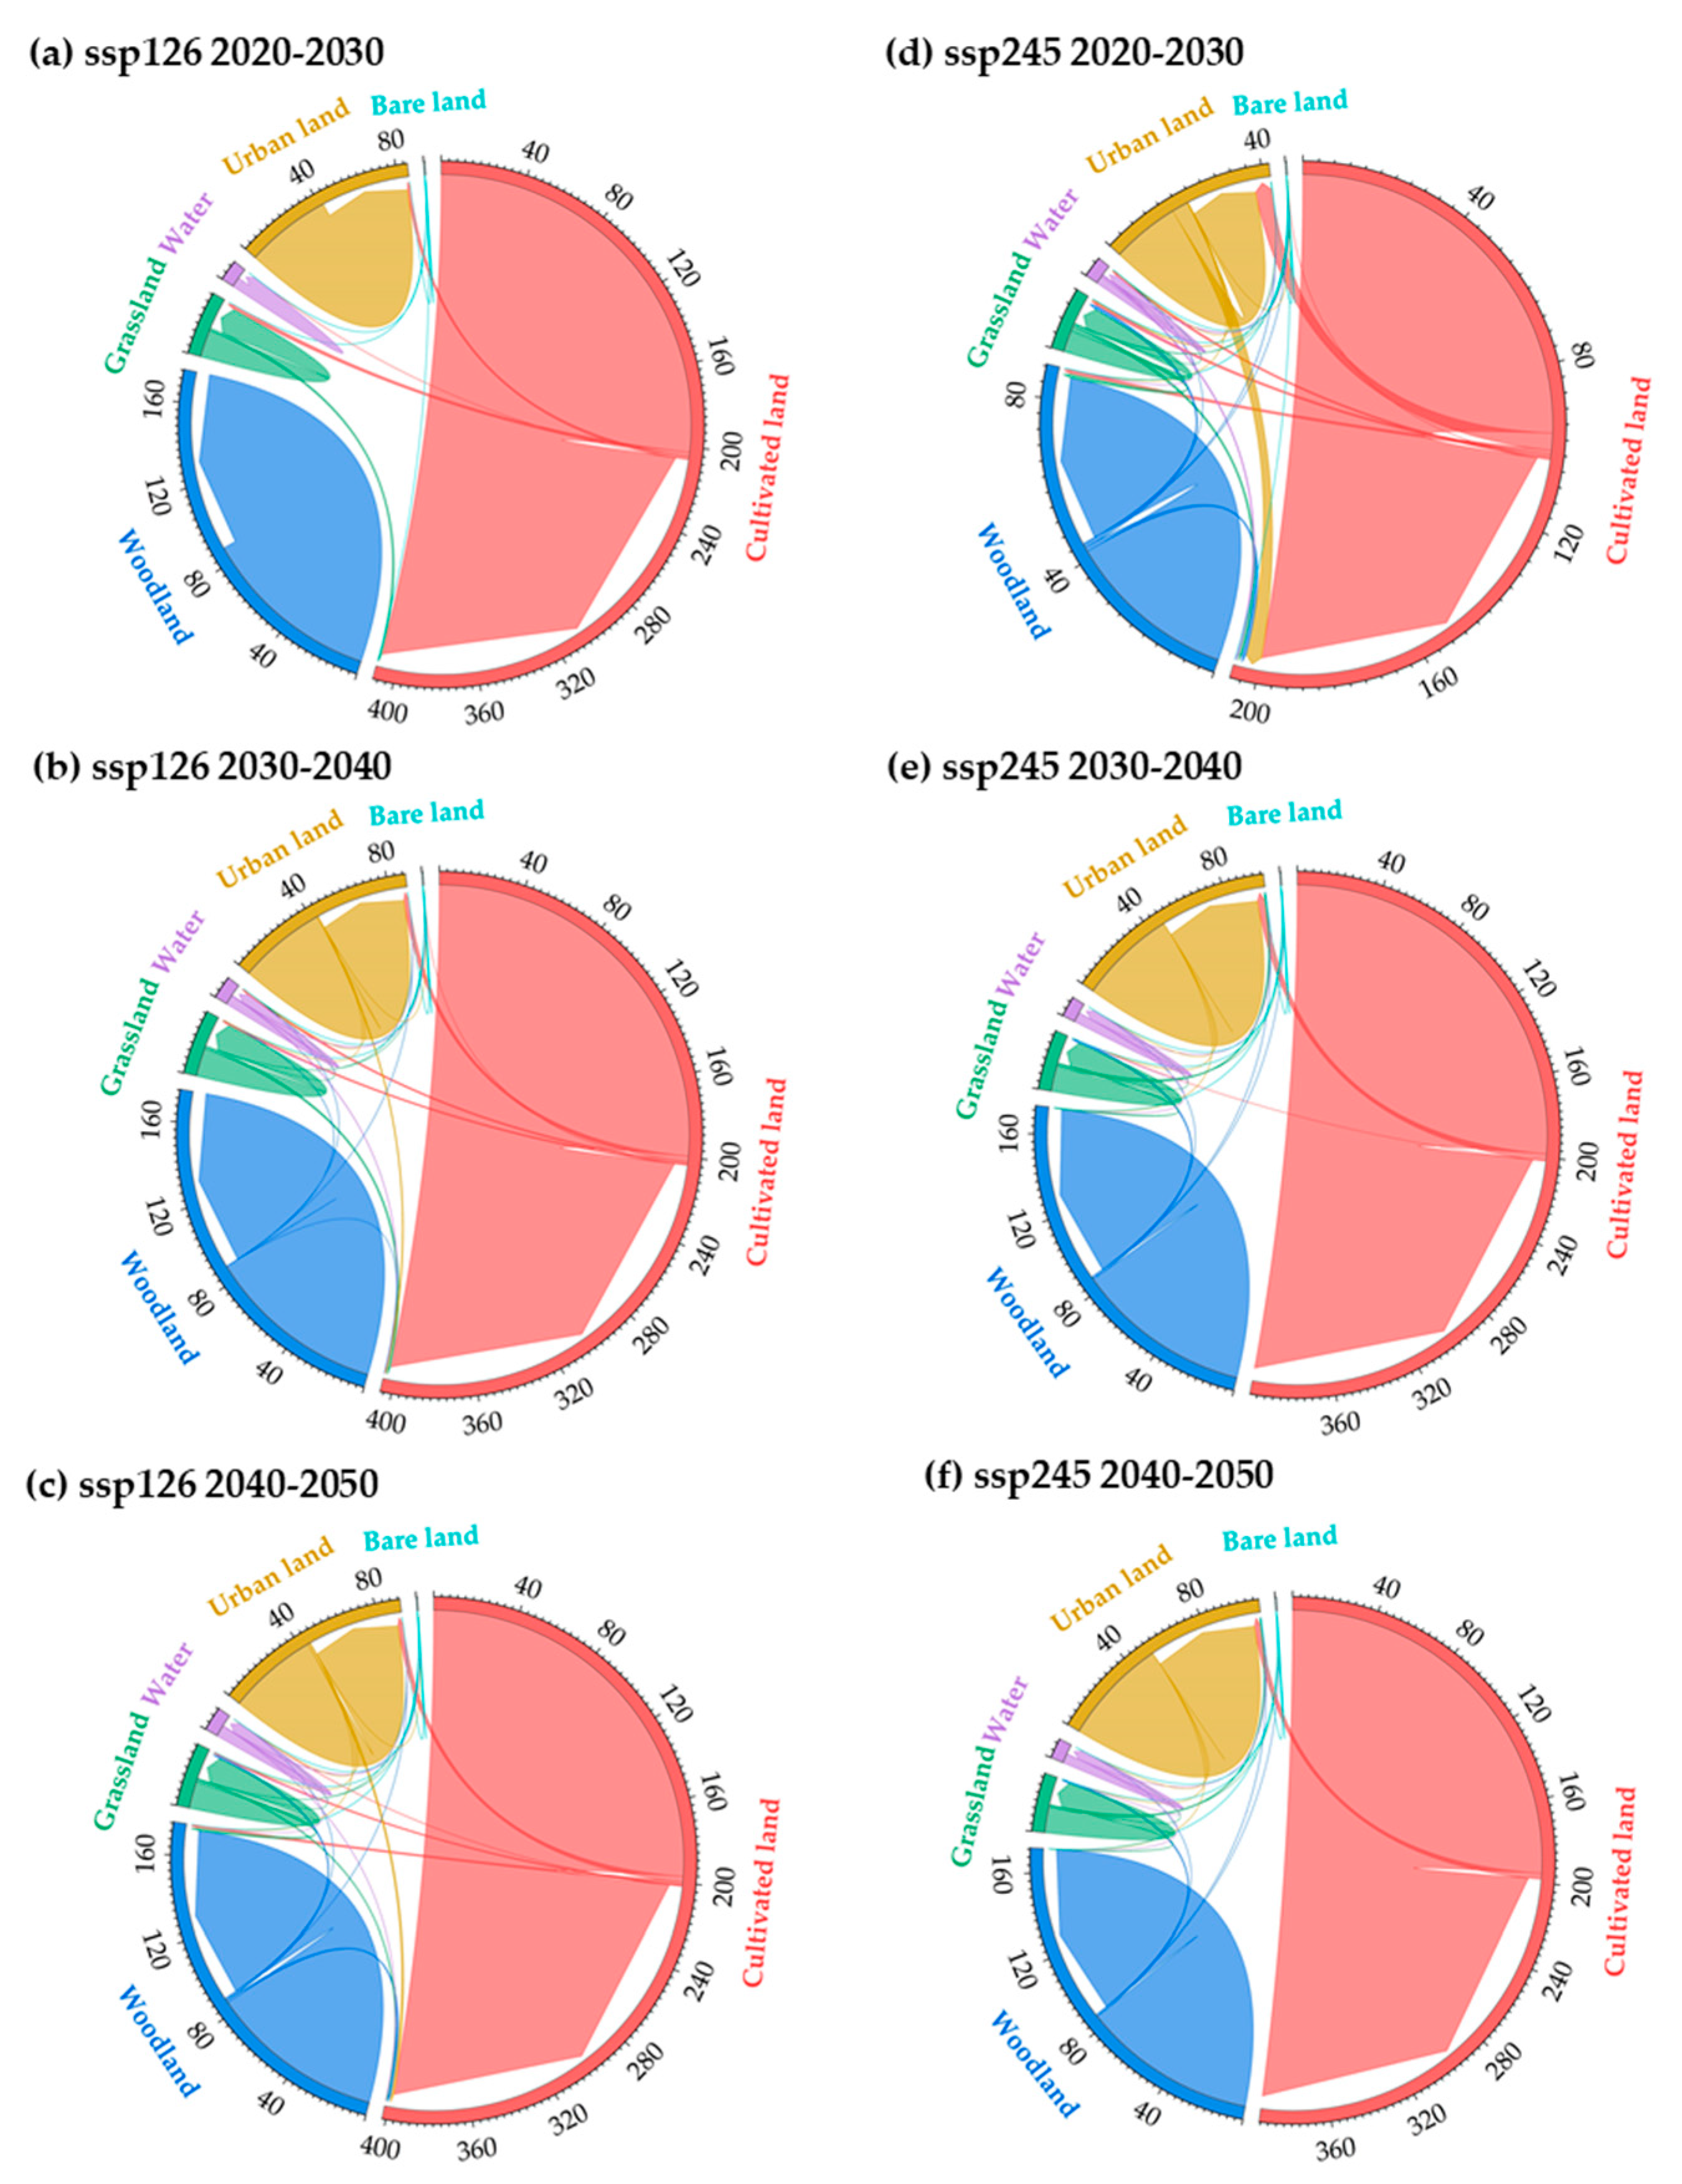
4.2. Future Land-Use Scenario Simulation Results

The spatial distribution of the drivers selected for this study is shown in Figure 5. Combining the drivers with the future land-use demand of the Guanzhong Plain under different scenarios obtained from MOP and Markov chain projections, the land-use pattern of the Guanzhong Plain can be simulated under multiple scenarios in 2030, 2040, and 2050 (Figure 6).
Figure 6 and Table 5 show the predicted results and the number of LULC types for the different scenarios. The area occupied by cultivated land is always higher, while urban land, water bodies, woodland, and grassland are lower, and bare land is always at the lowest level. In the SSP126 scenario, from 2030 to 2050, all land types show an increasing trend except for urban land, which decreases by 6.9% year on year. In contrast, urban land increases by 4.1% from 2030 to 2040 and by 2.6% from 2040 to 2050. Overall, it shows an upward trend and a slower growth rate. In contrast to the SSP126 scenario, urban land under the SSP245 scenario maintains a higher growth rate from 2030 to 2050, increasing by 18.4% year on year, with all other land types showing a decreasing trend.
Figure 7 shows the simulated LULC changes for the SSP126 and SSP245 scenarios. In 2020–2030, the arable land in the SSP126 scenario is mainly converted to grassland and urban land. Between 2030 and 2040, 1.8% of the arable land converts to urban land, while 4.6% of the urban land converts to arable land (and vice versa, to a lesser extent), resulting in a lower rate of change for urban land between 2030 and 2040 and a similar shift in the previous period between 2040 and 2050, with a continued overall conversion of agricultural land to other land types and, significantly, urban land use. Under the SSP2-4.5 scenario, the main changes between cropland, urban land, and forest land occur between 2020 and 2030, with conversion rates from cropland to urban land and forest land of 3.8% and 1.1%, respectively. In addition, similar changes occur between 2030–2040 and 2040–2050, with arable land mainly being converted to urban land, resulting in a significant increase in the urban land area.

4.3. Risk Assessment of Future Flood

4.3.1. Hazard Indicators

The Geographic Information System (GIS), as a visual technical means, is mainly used in flood disaster risk assessment [55]. Figure 8 shows the flood hazard maps under different scenarios during different periods, from which the spatial distribution characteristics of flood hazards in the Guanzhong Plain can be analyzed. Based on the GIS environment, the Jenks method creates a flood hazard map using the hazard index. The map shows the potential areas where flood events are more likely to occur. For scenario SSP126, the medium-to-higher-risk area gradually shifts from the northeast to the southwest of the Guanzhong Plain. There is a significant increase in the medium-to-higher-risk area. SSP245 is similar to the above, but the medium-to-higher-risk area is more significant. The rise in hazards in the southwest also contributes to a certain extent to the eventual concentration of the higher-risk areas for flooding in the southwestern part of the Guanzhong Plain. Combined with Figure 9, it can be seen that in the 25%–75% interval, more data exist for SSP245 than for SSP126. For Rx5day, the SSP245 scenario is mainly concentrated in the 80–90 mm range. The SSP126 scenario is primarily focused in the 70–100 mm range, with the former concentration associated with higher precipitation and more extreme values. In contrast, the annual rainfall also shows a similar distribution, which leads to the SSP245 scenario being more likely to produce higher precipitation in both scenarios relative to the SSP126 scenario, thus leading to flooding.

4.3.2. Sensitivity Indicators

The spatial distribution of the environmental sensitivity to flooding in the Guanzhong Plain between 2030 and 2050 is shown in Figure 10. The spatial distribution of the sensitivity to flood hazards in the Guanzhong Plain can be analyzed from this. To better analyze the changes, three typical areas of change are selected for analysis; when coupled with Figure 11, it can be seen that the green area mainly represents the variation in low-risk areas, which remains around 0.06 for all years, except for the SSP245 scenario, where it is 0.03 in 2030. The red areas mainly show the change from low-risk areas to medium- and high-risk areas, and the blue areas mainly show the transition from medium-risk areas to high- and higher-risk areas. As we set the distance from the river to remain constant, the changes in this part are mainly influenced by land use. Combined with Figure 6, it can be seen that there is a more obvious expansion of urban land in this area. Under the SSP245 scenario, the high- and higher-risk areas in 2050 account for more than 30%, with the higher-risk area reaching 38.9%, so the area’s risk level is significantly higher.

4.3.3. Vulnerability Indicators

This study primarily considers flood vulnerability regarding demographic and socioeconomic factors. On this basis, the Jenks methodology is used to classify the risk levels into five, which are lower, low, medium, high, and higher. Most of the medium–higher vulnerable areas are mainly located in urban land areas. Most areas have low vegetation cover but are densely populated and more economically developed, which has been shown to play a somewhat important role in increasing vulnerability. The areas of low vulnerability are mainly located in agricultural areas, and most are flat. As seen in Figure 12, there is little change in the vulnerability between the two scenarios, mainly in the form of a decrease in the lower-risk areas and an increase in the medium-to-higher-risk areas.

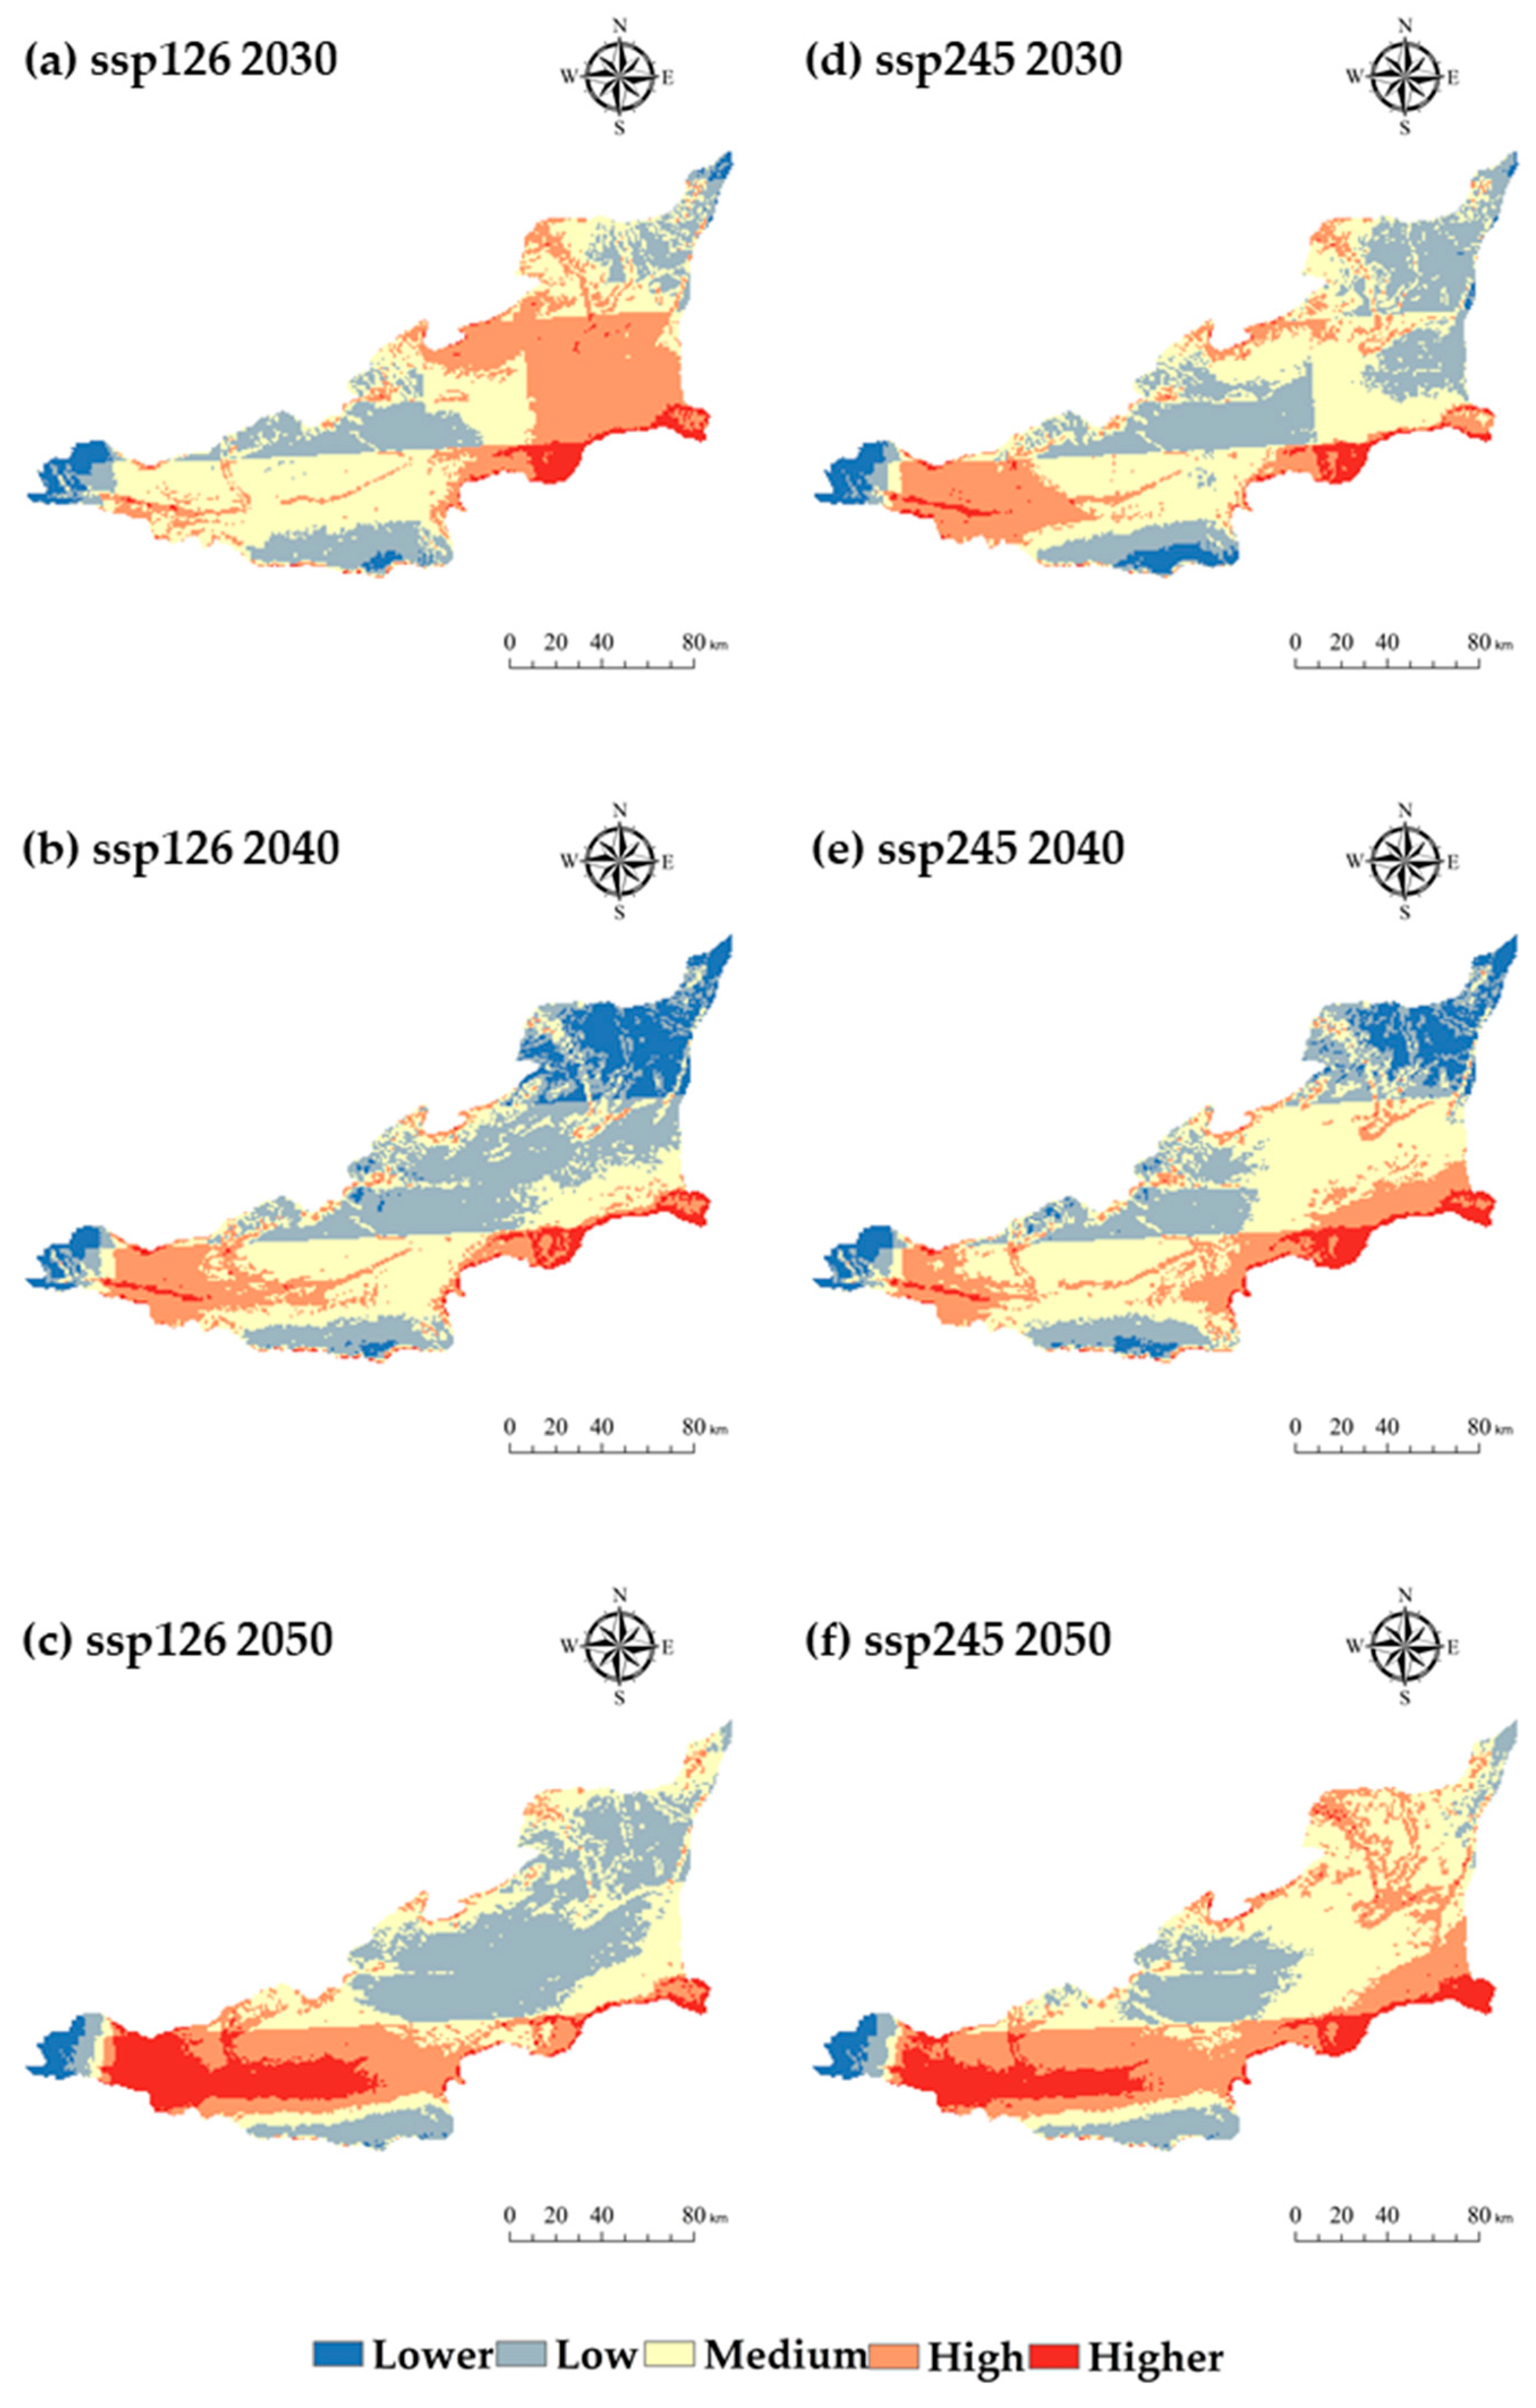
4.3.4. Future Multi-Scenario Flood Risk Assessment

The flood risk map for the Guanzhong Plain (Figure 13) was obtained by integrating the GIS environment-based hazard, sensitivity, and vulnerability maps described above. The equal spacing approach was used to classify the flood risk into five categories: lower, low, medium, high, and higher risk.
Combined with Figure 14 and Figure 15, it can be seen that under the SSP126 scenario, the percentage of flood risk zone levels in the Guanzhong Plain in 2030 are 0.018, 0.123, 0.435, 0.415, and 0.009, where the high- and medium-risk zones occupy a large area and are mainly concentrated in the areas where rivers converge, with the high-risk zones located near the Weihe River (Pucheng, Wugong, Fengxiang, and Yongji). The largest changes in the risk area between 2030 and 2040 are in the medium- and high-risk areas, with the medium-risk area decreasing by 1256.448 km2 (0.064) and the high-risk area increasing by 1197.552 km2 (0.061); the increase mainly comes from the transition from the medium-risk area to the high-risk area. The spatial distribution of risk areas is similar, but the high-risk areas increase in Qindu and near the lower reaches of the Weihe River and the Ba River, and a comparison of Figure 5 and Figure 7 shows that the increase in the high-risk areas is related to the rise in urban land use and precipitation. The most significant change in the risk area in the Guanzhong Plain between 2040 and 2050 is in the higher-risk area, which increases by 337 km2 (0.057), while the medium- and high-risk areas decrease by 726.384 km2 (0.037) and 667.488 km2 (0.034), respectively, with a distribution similar to that of precipitation and urban land use in 2050. This distribution is identical to that of precipitation and urban land use in 2050. As shown in Figure 13, a large proportion of the area at risk overall is related to the distribution of DEM, the slope, and arable land, and the overall flat topography of the Guanzhong Plain and its well-developed rivers are more prone to flooding.
In the SSP245 scenario, the overall risk distribution is similar to that in the SSP126 scenario, with an overall increase in the high-risk area in the central and western parts of the plain, with the percentage of flood-risk areas in the Guanzhong Plain in 2030 being 0.021, 0.117, 0.418, 0.429, and 0.012, respectively. Between 2030 and 2040, the medium- and high-risk areas continue to have the greatest change in the area, with the medium-risk area decreasing by 1433.136 km2 (0.073) and the high-risk area increasing by 1099.392 km2 (0.056), mainly due to changes in precipitation and an increase in urban land use; between 2040 and 2050, the increase in the area of the higher-risk area peaks at 1472.4 km2. This is mainly in the vicinity of the Weihe River’s mainstem. The urban land area has significantly changed, from 236.112 km2 to 905.096 km2 and, finally, to 2380.796 km2.

5. Discussion

5.1. CMIP6 Downscaling and Validation

Based on the CMIP6 data, we selected five GCMs’ data that are suitable for the study area, and the selected data were revised for bias and downscaled by pooled averaging as well as BCSD methods, which showed that after ensemble averaging, the standard deviation of each mode is less than 0.5, the root-mean-square error is within 0.4, and the correlation coefficient is more than 0.95. For higher accuracy, the BCSD method was chosen to downscale the data after ensemble averaging, and it can be seen that BCSD can completely carry out downscaling and correction work. Zhu [56,57] used the model ensemble averaging method to validate the CMIP6 precipitation data for the Tibet Plateau and the Yangtze River Basin, and the results showed that the model ensemble averaging method can reduce model errors well, but further corrections are needed. Eum [58] ranked four downscaling methods, BCSD, the bias-correction/constructed analog, multivariate adaptive constructed analogs (MACA), and the bias-correction/climate imprint, based on performance metrics using the TOPSIS; the results showed that MACA and BCSD have considerable skills regarding the time series correlation criteria, while BCSD is superior to the other methods regarding the distribution and extreme value correlation criteria. This would suggest that the BCSD method chosen for this study has some advantages over other downscaling methods and is a tool that can be used well for downscaling.

5.2. MOP Coupling PLUS Multi-Scenario Simulation

This study uses the MOP and PLUS models for land-use multi-scenario prediction. The simulation accuracy can reach a Kappa of 0.85 and an overall accuracy of 0.92, which can better simulate the future land-type distribution of the Guanzhong Plain. The change in land use also shows different characteristics under different scenarios. In the SSP126 scenario, the conversion of agricultural land to forests, buildings, and water is constant [59]. In Europe, the area of forested land in a similar context has increased due to the introduction of policies and the designation of nature reserves [60]. “Forest conservation”, “Reforestation and Revegetation”, and other eco-civilizations promote environmental protection as well as sustainable development, which also leads to the continuous return of cultivated land to forest and grass [61]. This is in line with our results. In the SSP245 scenario, the future conversion of arable land to buildings and increased population density in the southeast will continue to affect climate change and lead to more extreme rainfall events [62].

5.3. Flood Risk Assessment

The entropy weight method is used in this article for flood risk assessment. The analysis shows that the higher risk areas for flooding in the Guanzhong Plain are mainly found in the central part of the Guanzhong Plain as well as in the northern part, which is in line with the findings of Dou’s study [63]. In other regions, Liu [64] used the entropy weight method to assess flood risk in the Bangladesh–India–Myanmar region and found that the results were generally consistent with those obtained from the study when compared with historical flood hazards. The impact of different flood disaster risk factors on future flood disaster risk was quantitatively analyzed. The results of the quantitative calculation by the entropy weight method in this study show that when the flood risk is determined by spatial weight superposition, the weights of each factor in the two scenarios are similar, among which the distance from the river has the highest weight (16.8%), and the second is RMAX3 (16.3%). These results are deviated from those of previous studies [65,66,67]. Stefanos [65] pointed out that compared with natural factors, human factors are the main cause of flood disasters in most basins. Hammami [67] selected eight kinds of flood causes to evaluate the sensitivity of regional flood disasters. The results showed that the factor that had a significant impact on the occurrence of floods was elevation. Based on this study of flood disaster risk assessment, it is found that the most important flood-disaster-causing factors are different in multi-criteria systems in different regions. Therefore, the most appropriate flood control measures should be taken according to the evaluation results of different regions.
This paper combines the risk of flood disasters during historical periods with the accurate prediction of flood risks in future development scenarios, which is of great significance for future sustainable development. Previous studies have shown that this is an effective method to determine the future flood risk distribution through future land-use scenarios. Lin et al. [68] used the FLUS model to simulate future land-use scenarios in Guangzhou to assess the city’s flood risk. Canters et al. [69] used the CA model to simulate land-use change on the Belgian coast and analyze its impact on flood risk. However, the commonly used land-use scenario simulation methods (FLUS, the Conversion of Land Use and its Effects at Small Region Extent model, etc.) have the disadvantages of an unclear model conversion mechanism and inconvenient operation. There are great deficiencies in excavating the law of land-use conversion and revealing dynamic changes in the landscape, and it is difficult to effectively identify the factors affecting the dynamic evolution of various land-use patches [60,70]. These problems limit the application of these models in land-use simulation and will inevitably affect the prediction accuracy of flood risk. At the same time, the assessment of flood risk is mostly based on history and the current situation [71,72] or climate change [73,74]. Few studies have linked the PLUS model to future urban land development planning and urban flood disaster risk evolution. In this study, the flood disaster risk maps under different development scenarios obtained by coupling PLUS, MOP, and the entropy weight method can provide a basis and reference for future urban planning and flood control in plain areas.

5.4. Flood Adaptation Strategies and Policies

In the 21st century, flood control in plain cities is a major challenge, and government departments need the guidance of risk analysis to determine flood control policies. In this study, the proposed framework can be used to explore future flood disaster risks. The results can provide support for land-use planning and provide a basis for decision-makers to decide how to set flood control measures and urban development directions, which is crucial for developing countries in the process of rapid urbanization. In the future, the Guanzhong Plain area must increase flood control planning, such as drainage systems, flood buffer zones, etc. Low-impact development and a sponge city can effectively reduce rainfall runoff, the amount of pollutants in rainwater, and return rainfall, which are sustainable flood control and disaster reduction measures [75,76]. Luo et al. [6] considered that the combination of gray (engineering measures) and green (natural measures) can effectively reduce the damage of floods to cities. Therefore, increasing the proportion of green space and green plants in Guanzhong and global plain urban areas, combining the natural conditions with urban flood control measures, and forming an integrated rainwater control system to reduce rainwater runoff are all suggested measures. At the same time, the government should incorporate the protection and restoration of natural systems into policies and regulations to promote urban flood control construction in plain areas.
For the urban areas that have been built, flexible and multi-spatial scale flood management strategies should be proposed. Among them, the most critical thing is to dynamically adjust the land-use function for future flood scenarios. For example, flood-prone agricultural areas can be changed to aquaculture models. In the planning of building types, the building structure should be innovated, the building specifications should be enhanced, and the flood control capacity should be improved. At the same time, the government should establish emergency strategies for flood risk management, plan evacuation routes in advance, improve rescue systems and assistance mechanisms, and ensure the safety of people’s lives and property. According to the survey results of flood disasters in recent years, the disorder of social and economic development is the main reason for the increase in flood losses. The scientific land-use planning of the flood detention area can avoid large-scale development, thus greatly reducing flood losses [77].

6. Conclusions

In this study, after averaging the five GCMs by mode ensemble, the BCSD method was used for downscaling analysis. The results show that the standard deviation after ensemble averaging is less than 1, and the correlation coefficient exceeds 0.95. However, the resolution is still relatively low, and, to improve the resolution, the resolution and accuracy after the operation with the BCSD method are better than after ensemble averaging.
Under different scenarios, there is a wide range of future land-use changes. The SSP126 scenario, except for cultivated land, maintains an increasing trend, with woodland and grassland showing fluctuating growth trends and with cultivated land consistently shifting to woodland, urban land, and water bodies; the SSP245 scenario, except for urban land, maintains a decreasing trend, with cultivated land and other land types mainly shifting to urban land, leading to a large increase.
The results of the flood risk assessment using the entropy weighting method show that the overall spatial distribution of flood risk is similar between the SSP126 and SSP245 scenarios, with the central and western parts of the Guanzhong Plain being more susceptible to flooding in the future, mainly due to the regional increase in future precipitation and the expansion of urban land use. Under the SSP245 scenario, the higher-risk area increases to 2380.796 km2 by 2050, and the higher-risk area for the whole region shows a gradual increase from east to west along the Wei River. This study can provide a guide for future flood hazard prevention in the Guanzhong Plain.

Author Contributions

All authors contributed to the work. P.L.: writing—original draft preparation and conceptualization. X.W.: writing—reviewing and editing. P.L. and X.W.: methodology. L.Z. and M.R.R.M.A.Z.: software. M.H. and W.D.: data curation. Y.Z.: visualization. B.G. and Y.W.: investigation and supervision. D.N.: article polishing. All authors have read and agreed to the published version of the manuscript.

Funding

This research was funded by the China Scholarship Council (grant nos.: Liujinmei [2022] no. 45; Liujinxuan [2022] no. 133; Liujinou [2023] no. 22), the International Education Research Program of Chang’an University (300108221102), the Project of Ningxia Natural Science Foundation (2022AAC03700; 2022BEG03059), the 2022 Guangdong University Youth Innovation Talent Program (2022KQNCX143), and the Yinshanbeilu Grassland Eco-hydrology National Observation and Research Station, China Institute of Water Resources and Hydropower Research, Beijing 100038, China, grant no. YSS2022004.

Data Availability Statement

No new data were created or analyzed in this study. Data sharing is not applicable to this article.

Conflicts of Interest

Lei Zhang was employed by Xi’an Xinsemi Material Technology Co., Ltd. The remaining authors declare that the research was conducted in the absence of any commercial or financial relationships that could be construed as a potential conflict of interest. The funders had no role in the design of the study; in the collection, analyses, or interpretation of data; in the writing of the manuscript; or in the decision to publish the results.

References

  1. Manzoor, Z.; Ehsan, M.; Khan, M.B.; Manzoor, A.; Akhter, M.M.; Sohail, M.T.; Hussain, A.; Shafi, A.; Abu-Alam, T.; Abioui, M. Floods and flood management and its socio-economic impact on Pakistan: A review of the empirical literature. Front. Environ. Sci. 2022, 10, 2480. [Google Scholar] [CrossRef]
  2. Merz, B.; Blöschl, G.; Vorogushyn, S.; Dottori, F.; Aerts, J.C.J.H.; Bates, P.; Bertola, M.; Kemter, M.; Kreibich, H.; Lall, U.; et al. Causes, impacts and patterns of disastrous river floods. Nat. Rev. Earth Environ. 2021, 2, 592–609. [Google Scholar] [CrossRef]
  3. Tingsanchali, T. Urban flood disaster management. Procedia Eng. 2012, 32, 25–37. [Google Scholar] [CrossRef]
  4. Wu, J.; Chen, X.; Lu, J. Assessment of long and short-term flood risk using the multi-criteria analysis model with the AHP-Entropy method in Poyang Lake basin. Int. J. Disaster Risk Reduct. 2022, 75, 102968. [Google Scholar] [CrossRef]
  5. Dastagir, M.R. Modeling recent climate change induced extreme events in Bangladesh: A review. Weather Clim. Extrem. 2015, 7, 49–60. [Google Scholar] [CrossRef]
  6. Luo, P.; Yan, P.; Wang, X.; Wu, Y.; Lyu, J.; He, B.; Duan, W.; Wang, S.; Zha, X. Historical and comparative overview of sponge campus construction and future challenges. Sci. Total Environ. 2023, 907, 167477. [Google Scholar] [CrossRef]
  7. Luo, P.; Luo, M.; Li, F.; Qi, X.; Huo, A.; Wang, Z.; He, B.; Takara, K.; Nover, D.; Wang, Y. Urban flood numerical simulation: Research, methods and future perspectives. Environ. Model. Softw. 2022, 156, 105478. [Google Scholar] [CrossRef]
  8. Zheng, Q.; Shen, S.-L.; Zhou, A.; Lyu, H.M. Inundation risk assessment based on G-DEMATEL-AHP and its application to Zhengzhou flooding disaster. Sustain. Cities Soc. 2022, 86, 104138. [Google Scholar] [CrossRef]
  9. Guo, X.; Cheng, J.; Yin, C.; Li, Q.; Chen, R.; Fang, J. The extraordinary Zhengzhou flood of 7/20, 2021: How extreme weather and human response compounding to the disaster. Cities 2023, 134, 104168. [Google Scholar] [CrossRef]
  10. Wang, X.; Luo, P.; Zheng, Y.; Duan, W.; Wang, S.; Zhu, W.; Zhang, Y.; Nover, D. Drought Disasters in China from 1991 to 2018: Analysis of Spatiotemporal Trends and Characteristics. Remote Sens. 2023, 15, 1708. [Google Scholar] [CrossRef]
  11. IPCC. Climate Change 2021: The Physical Science Basis. Contribution of Working Group I to the Sixth Assessment Report of the Intergovernmental Panel on Climate Change; Technical Summary; Cambridge University Press: Cambridge, UK, 2021. [Google Scholar]
  12. Wang, S.; Luo, P.; Xu, C.; Zhu, W.; Cao, Z.; Ly, S. Reconstruction of Historical Land Use and Urban Flood Simulation in Xi’an, Shannxi, China. Remote Sens. 2022, 14, 6067. [Google Scholar] [CrossRef]
  13. Luo, P.; Zheng, Y.; Wang, Y.; Zhang, S.; Yu, W.; Zhu, X.; Huo, A.; Wang, Z.; He, B.; Nover, D. Comparative Assessment of Sponge City Constructing in Public Awareness, Xi’an, China. Sustainability 2022, 14, 11653. [Google Scholar] [CrossRef]
  14. Guo, B.; Xie, T.; Zhang, W.; Wu, H.; Zhang, D.; Zhu, X.; Ma, X.; Wu, M.; Luo, P. Rasterizing CO2 emission and characterizing their trends via an enhanced population-light index at multiple scales in China during 2013–2019. Sci. Total Environ. 2023, 905, 167309. [Google Scholar] [CrossRef]
  15. Zhu, W.; Cao, Z.; Luo, P.; Tang, Z.; Zhang, Y.; Hu, M.; He, B. Urban Flood-Related Remote Sensing: Research Trends, Gaps and Opportunities. Remote Sens. 2022, 14, 5505. [Google Scholar] [CrossRef]
  16. Luo, P.; Liu, L.; Wang, S.; Ren, B.; He, B.; Nover, D. Influence assessment of new Inner Tube Porous Brick with absorbent concrete on urban floods control. Case Stud. Constr. Mater. 2022, 17, e01236. [Google Scholar] [CrossRef]
  17. Luo, P.; Mu, Y.; Wang, S.; Zhu, W.; Mishra, B.K.; Huo, A.; Zhou, M.; Lyu, J.; Hu, M.; Duan, W.; et al. Exploring sustainable solutions for the water environment in Chinese and Southeast Asian cities. Ambio 2021, 51, 1199–1218. [Google Scholar] [CrossRef]
  18. Guo, B.; Wang, Z.; Pei, L.; Zhu, X.; Chen, Q.; Wu, H.; Zhang, W.; Zhang, D. Reconstructing MODIS aerosol optical depth and exploring dynamic and influential factors of AOD via random forest at the global scale. Atmos. Environ. 2023, 315, 120159. [Google Scholar] [CrossRef]
  19. Torres, R.R.; Marengo, J.A. Climate change hotspots over South America: From CMIP3 to CMIP5 multi-model datasets. Theor. Appl. Climatol. 2014, 117, 579–587. [Google Scholar] [CrossRef]
  20. Chen, H.; Sun, J.; Lin, W.; Xu, H. Comparison of CMIP6 and CMIP5 models in simulating climate extremes. Sci. Bull. 2020, 65, 1415–1418. [Google Scholar] [CrossRef] [PubMed]
  21. Gusain, A.; Ghosh, S.; Karmakar, S. Added value of CMIP6 over CMIP5 models in simulating Indian summer monsoon rainfall. Atmos. Res. 2020, 232, 104680. [Google Scholar] [CrossRef]
  22. Wang, Y.; Li, H.; Wang, H.; Chen, H.P. Evaluation of CMIP6 model simulations of extreme precipitation in China and comparison with CMIP5. Acta Meteorol. Sin 2021, 79, 369–386. [Google Scholar] [CrossRef]
  23. Shi, M.; Wu, H.; Fan, X.; Jia, H.; Dong, T.; He, P.; Baqa, M.F.; Jiang, P. Trade-offs and synergies of multiple ecosystem services for different land use scenarios in the yili river valley, China. Sustainability 2021, 13, 1577. [Google Scholar] [CrossRef]
  24. Zhai, H.; Lv, C.; Liu, W.; Yang, C.; Fan, D.; Wang, Z.; Guan, Q. Understanding spatio-temporal patterns of land use/land cover change under urbanization in Wuhan, China, 2000–2019. Remote Sens. 2021, 13, 3331. [Google Scholar] [CrossRef]
  25. Li, C.; Yang, M.; Li, Z.; Wang, B. How will rwandan land use/land cover change under high population pressure and changing climate? Appl. Sci. 2021, 11, 5376. [Google Scholar] [CrossRef]
  26. Haase, D. Integrating Ecosystem Services, Green Infrastructure and Nature-Based Solutions—New Perspectives in Sustainable Urban Land Management: Combining Knowledge About Urban Nature for Action. In Sustainable Land Management in a European Context: A Co-Design Approach; Springer International Publishing: New York, NY, USA, 2021; pp. 305–318. [Google Scholar]
  27. Wu, J.; Sha, W.; Zhang, P.; Wang, Z. The spatial non-stationary effect of urban landscape pattern on urban waterlogging: A case study of Shenzhen City. Sci. Rep. 2020, 10, 7369. [Google Scholar] [CrossRef]
  28. Liu, S.; Lin, M.; Li, C. Analysis of the Effects of the River Network Structure and Urbanization on Waterlogging in High-Density Urban Areas-A Case Study of the Pudong New Area in Shanghai. Int. J. Environ. Res. Public Health 2019, 16, 3306. [Google Scholar] [CrossRef]
  29. Zhang, H.; Cheng, J.; Wu, Z.; Li, C.; Qin, J.; Liu, T. Effects of Impervious Surface on the Spatial Distribution of Urban Waterlogging Risk Spots at Multiple Scales in Guangzhou, South China. Sustainability 2018, 10, 1589. [Google Scholar] [CrossRef]
  30. Janizadeh, S.; Pal, S.C.; Saha, A.; Chowdhuri, I.; Ahmadi, K.; Mirzaei, S.; Mosavi, A.H.; Tiefenbacher, J.P. Mapping the spatial and temporal variability of flood hazard affected by climate and land-use changes in the future. J. Environ. Manag. 2021, 298, 113551. [Google Scholar] [CrossRef]
  31. Lin, J.; He, P.; Yang, L.; He, X.; Lu, S.; Liu, D. Predicting future urban waterlogging-prone areas by coupling the maximum entropy and FLUS model. Sustain. Cities Soc. 2022, 80, 103812. [Google Scholar] [CrossRef]
  32. Zhang, S.; Yang, P.; Xia, J.; Wang, W.; Cai, W.; Chen, N.; Hu, S.; Luo, X.; Li, J.; Zhan, C. Land use/land cover prediction and analysis of the middle reaches of the Yangtze River under different scenarios. Sci. Total Environ. 2022, 833, 155238. [Google Scholar] [CrossRef]
  33. Wang, J.; Zhang, J.; Xiong, N.; Liang, B.; Wang, Z.; Cressey, E.L. Spatial and Temporal Variation, Simulation and Prediction of Land Use in Ecological Conservation Area of Western Beijing. Remote Sens. 2022, 14, 1452. [Google Scholar] [CrossRef]
  34. Liang, X.; Guan, Q.; Clarke, K.C.; Liu, S.; Wang, B.; Yao, Y. Understanding the drivers of sustainable land expansion using a patch-generating land use simulation (PLUS) model: A case study in Wuhan, China. Comput. Environ. Urban Syst. 2021, 85, 101569. [Google Scholar] [CrossRef]
  35. Jiang, X.; Duan, H.; Liao, J.; Xue, X. Land use in the Gan-Lin-Gao region of middle reaches of Heihe River Basin based on a PLUS-SD coupling model. Arid. Zone Res. 2022, 39, 1246–1258. [Google Scholar] [CrossRef]
  36. Tapia, C.; Abajo, B.; Feliu, E.; Mendizabal, M.; Martinez, J.A.; Fernández, J.G.; Laburu, T.; Lejarazu, A. Profiling urban vulnerabilities to climate change: An indicator-based vulnerability assessment for European cities. Ecol. Indic. 2017, 78, 142–155. [Google Scholar] [CrossRef]
  37. Wang, Z.; Lai, C.; Chen, X.; Yang, B.; Zhao, S.; Bai, X. Flood hazard risk assessment model based on random forest. J. Hydrol. 2015, 527, 1130–1141. [Google Scholar] [CrossRef]
  38. Meshram, S.G.; Alvandi, E.; Meshram, C.; Kahya, E.; Al-Quraishi, A.M. Application of SAW and TOPSIS in prioritizing watersheds. Water Resour. Manag. 2020, 34, 715–732. [Google Scholar] [CrossRef]
  39. Roy, S.; Bose, A.; Chowdhury, I.R. Flood risk assessment using geospatial data and multi-criteria decision approach: A study from historically active flood-prone region of Himalayan foothill, India. Arab. J. Geosci. 2021, 14, 999. [Google Scholar] [CrossRef]
  40. Wang, Y.; Li, Z.; Tang, Z.; Zeng, G. A GIS-based spatial multi-criteria approach for flood risk assessment in the Dongting Lake Region, Hunan, Central China. Water Resour. Manag. 2011, 25, 3465–3484. [Google Scholar] [CrossRef]
  41. Zou, Q.; Zhou, J.; Zhou, C.; Song, L.; Guo, J. Comprehensive flood risk assessment based on set pair analysis-variable fuzzy sets model and fuzzy AHP. Stoch. Environ. Res. Risk Assess. 2013, 27, 525–546. [Google Scholar] [CrossRef]
  42. Khosravi, K.; Pourghasemi, H.R.; Chapi, K.; Bahri, M. Flash flood susceptibility analysis and its mapping using different bivariate models in Iran: A comparison between Shannon’s entropy, statistical index, and weighting factor models. Environ. Monit. Assess. 2016, 188, 656. [Google Scholar] [CrossRef]
  43. Tien-Chin, W.; Hsien-Da, L. Developing a fuzzy TOPSIS approach based on subjective weights and objective weights. Expert Syst. Appl. 2009, 36, 8980–8985. [Google Scholar] [CrossRef]
  44. Liu, T.; Deng, Y.; Chan, F. Evidential Supplier Selection Based on DEMATEL and Game Theory. Int. J. Fuzzy Syst. 2018, 20, 1321–1333. [Google Scholar] [CrossRef]
  45. Rincón, D.; Velandia, J.F.; Tsanis, I.; Khan, U.T. Stochastic Flood Risk Assessment under Climate Change Scenarios for Toronto, Canada Using CAPRA. Water 2022, 14, 227. [Google Scholar] [CrossRef]
  46. Li, L.; Yang, J.; Wu, J. Future flood risk assessment under the effects of land use and climate change in the tiaoxi basin. Sensors 2020, 20, 6079. [Google Scholar] [CrossRef] [PubMed]
  47. Chen, X.-D.; Su, Y.; Fang, X.-Q. Social impacts of extreme drought event in Guanzhong area, Shaanxi Province, during 1928–1931. Clim. Chang. 2021, 164, 1928–1931. [Google Scholar] [CrossRef]
  48. Qin, R.; Zhang, F. HRLT: A high-resolution (1 day, 1 km) and long-term (1961–2019) gridded dataset for temperature and precipitation across China. Pangaea 2022, 14, 4793–4810. [Google Scholar]
  49. Gardiner, L.R.; Steuer, R.E. Unified interactive multiple objective programming: An open architecture for accommodating new procedures. J. Oper. Res. Soc. 1994, 45, 1456–1466. [Google Scholar] [CrossRef]
  50. Long, Y.; Han, H.; Lai, S.; Mao, Q. Urban growth boundaries of the Beijing Metropolitan Area: Comparison of simulation and artwork. Cities 2013, 31, 337–348. [Google Scholar] [CrossRef]
  51. Xu, L.; Liu, X.; Tong, D.; Liu, Z.; Yin, L.; Zheng, W. Forecasting Urban Land Use Change Based on Cellular Automata and the PLUS Model. Land 2022, 11, 652. [Google Scholar] [CrossRef]
  52. Zhang, S.; Zhong, Q.; Cheng, D.; Xu, C.; Chang, Y.; Lin, Y.; Li, B. Landscape ecological risk projection based on the PLUS model under the localized shared socioeconomic pathways in the Fujian Delta region. Ecol. Indic. 2022, 136, 108642. [Google Scholar] [CrossRef]
  53. Li, X.; Fu, J.; Jiang, D.; Lin, G.; Cao, C. Land use optimization in Ningbo City with a coupled GA and PLUS model. J. Clean. Prod. 2022, 375, 134004. [Google Scholar] [CrossRef]
  54. Gao, L.; Tao, F.; Liu, R.; Wang, Z.; Leng, H.; Zhou, T. Multi-scenario simulation and ecological risk analysis of land use based on the PLUS model: A case study of Nanjing. Sustain. Cities Soc. 2022, 85, 104055. [Google Scholar] [CrossRef]
  55. Chen, Y. Flood hazard zone mapping incorporating geographic information system (GIS) and multi-criteria analysis (MCA) techniques. J. Hydrol. 2022, 612, 128268. [Google Scholar] [CrossRef]
  56. Zhu, H.; Jiang, Z.; Li, J.; Li, W.; Sun, C.; Li, L. Does CMIP6 Inspire More Confidence in Simulating Climate Extremes over China? Adv. Atmos. Sci. 2020, 37, 1119–1132. [Google Scholar] [CrossRef]
  57. Babaousmail, H.; Hou, R.; Ayugi, B.; Sian, K.T.C.L.K.; Ojara, M.; Mumo, R.; Chehbouni, A.; Ongoma, V. Future changes in mean and extreme precipitation over the Mediterranean and Sahara regions using bias-corrected CMIP6 models. Int. J. Climatol. 2022, 42, 7280–7297. [Google Scholar] [CrossRef]
  58. Eum, H.I.; Cannon, A.J.; Murdock, T.Q. Intercomparison of multiple statistical downscaling methods: Multi-criteria model selection for South Korea. Stoch. Environ. Res. Risk Assess. 2017, 31, 683–703. [Google Scholar] [CrossRef]
  59. Nelson, E.; Mendoza, G.; Regetz, J.; Polasky, S.; Tallis, H.; Cameron, D.R.; Chan, K.M.A.; Daily, G.C.; Goldstein, J.; Kareiva, P.M.; et al. DSpace at UVM (CTL server badger.uvm.edu): Modeling multiple ecosystem services, biodiversity conservation, commodity production, and tradeoffs at landscape scales. Front. Ecol. Environ. 2009, 7, 4–11. [Google Scholar] [CrossRef]
  60. Rounsevell, M.; Reginster, I.; Araújo, M.; Carter, T.; Dendoncker, N.; Ewert, F.; House, J.; Kankaanpää, S.; Leemans, R.; Metzger, M.; et al. A coherent set of future land use change scenarios for Europe. Agric. Ecosyst. Environ. 2006, 114, 57–68. [Google Scholar] [CrossRef]
  61. Peng, L.; Wang, X.-X. What is the relationship between ecosystem services and urbanization? A case study of the mountainous areas in Southwest China. J. Mt. Sci. 2019, 16, 2867–2881. [Google Scholar] [CrossRef]
  62. Pelletier, J.D.; Murray, A.B.; Pierce, J.L.; Bierman, P.R.; Breshears, D.D.; Crosby, B.T.; Ellis, M.; Foufoula-Georgiou, E.; Heimsath, A.M.; Houser, C.; et al. Forecasting the response of Earth’s surface to future climatic and land use changes: A review of methods and research needs. Earths Future 2015, 3, 220–251. [Google Scholar] [CrossRef]
  63. Dou, X. Flood Risk Assessment Based on Flood Hazard Index Model: A Case Study of Guanzhong Area; Northwest University: Washington, DC, USA, 2018. [Google Scholar]
  64. Liu, Y.; Wang, S.; Wang, X.; Vijitpan, T. Flood risk assessment in Bangladesh, India and Myanmar based on the AHP weight method and entropy weight method. Geogr. Res. 2020, 39, 1892–1906. [Google Scholar] [CrossRef]
  65. Stefanidis, S.; Stathis, D. Assessment of flood hazard based on natural and anthropogenic factors using analytic hierarchy process (AHP). Nat. Hazards 2013, 68, 569–585. [Google Scholar] [CrossRef]
  66. Souissi, D.; Zouhri, L.; Hammami, S.; Msaddek, M.H.; Zghibi, A.; Dlala, M. GIS-based MCDM–AHP modeling for flood susceptibility mapping of arid areas, southeastern Tunisia. Geocarto Int. 2019, 35, 991–1017. [Google Scholar] [CrossRef]
  67. Hammami, S.; Zouhri, L.; Souissi, D.; Souei, A.; Zghibi, A.; Marzougui, A.; Dlala, M. Application of the GIS based multi-criteria decision analysis and analytical hierarchy process (AHP) in the flood susceptibility mapping (Tunisia). Arab. J. Geosci. 2019, 12, 653. [Google Scholar] [CrossRef]
  68. Lin, W.; Sun, Y.; Nijhuis, S.; Wang, Z. Scenario-based flood risk assessment for urbanizing deltas using future land-use simulation (FLUS): Guangzhou Metropolitan Area as a case study. Sci. Total Environ. 2020, 739, 139899. [Google Scholar] [CrossRef]
  69. Canters, F.; Vanderhaegen, S.; Khan, A.Z.; Engelen, G.; Uljee, I. Land-use simulation as a supporting tool for flood risk assessment and coastal safety planning: The case of the Belgian coast. Ocean. Coast. Manag. 2014, 101, 102–113. [Google Scholar] [CrossRef]
  70. Tian, L.; Tao, Y.; Fu, W.; Li, T.; Ren, F.; Li, M. Dynamic simulation of land use/cover change and assessment of forest ecosystem carbon storage under climate change scenarios in Guangdong Province, China. Remote Sens. 2022, 14, 2330. [Google Scholar] [CrossRef]
  71. Sado-Inamura, Y.; Fukushi, K. Empirical analysis of flood risk perception using historical data in Tokyo. Land Use Policy 2019, 82, 13–29. [Google Scholar] [CrossRef]
  72. Li, C.; Liu, M.; Hu, Y.; Wang, H.; Zhou, R.; Wu, W.; Wang, Y. Spatial distribution patterns and potential exposure risks of urban floods in Chinese megacities. J. Hydrol. 2022, 610, 127838. [Google Scholar] [CrossRef]
  73. Toosi, A.S.; Doulabian, S.; Tousi, E.G.; Calbimonte, G.H.; Alaghmand, S. Large-scale flood hazard assessment under climate change: A case study. Ecol. Eng. 2020, 147, 105765. [Google Scholar] [CrossRef]
  74. Hsiao, S.-C.; Chiang, W.-S.; Jang, J.-H.; Wu, H.-L.; Lu, W.-S.; Chen, W.-B.; Wu, Y.-T. Flood risk influenced by the compound effect of storm surge and rainfall under climate change for low-lying coastal areas. Sci. Total Environ. 2021, 764, 144439. [Google Scholar] [CrossRef]
  75. Kourtis, I.M.; Tsihrintzis, V.A.; Baltas, E. A robust approach for comparing conventional and sustainable flood mitigation measures in urban basins. J. Environ. Manag. 2020, 269, 110822. [Google Scholar] [CrossRef]
  76. Bhatt, A.; Bradford, A.; Abbassi, B.E. Cradle-to-grave life cycle assessment (LCA) of low-impact-development (LID) technologies in southern Ontario. J. Environ. Manag. 2019, 231, 98–109. [Google Scholar] [CrossRef]
  77. Xia, J.; Chen, J. A new era of flood control strategies from the perspective of managing the 2020 Yangtze River flood. Sci. China Earth Sci. 2021, 64, 1–9. [Google Scholar] [CrossRef]
Figure 1. (a) Location map of the Guanzhong Plain; (b) monthly precipitation, evaporation, and temperature in Guanzhong Plain during the study year.
Remotesensing 15 05778 g001
Figure 2. Flood risk assessment framework.
Remotesensing 15 05778 g002
Figure 3. Taylor chart of monthly average precipitation based on climate model and meteorological observation data.
Remotesensing 15 05778 g003
Figure 4. Comparison of monthly average precipitation between observation value and simulation value.
Remotesensing 15 05778 g004
Figure 5. (ah) Distribution of the drivers in the Guanzhong Plain.
Remotesensing 15 05778 g005
Figure 6. LULC simulation results and land class shares for different scenarios at different times.
Remotesensing 15 05778 g006
Figure 7. Variation in LULC types during different periods in the SSP126 and SSP245 scenarios.
Remotesensing 15 05778 g007
Figure 8. Spatial distribution of hazard indicators in the Guanzhong Plain between 2030 and 2050 under different development scenarios.
Remotesensing 15 05778 g008
Figure 9. Distribution of Rx5day versus annual precipitation timing for the two scenarios during 2030–2050.
Remotesensing 15 05778 g009
Figure 10. Spatial distribution of sensitivity indicators in the Guanzhong Plain between 2030 and 2050 under different development scenarios.
Remotesensing 15 05778 g010
Figure 11. Map showing the percentage of area in different risk zones.
Remotesensing 15 05778 g011
Figure 12. Spatial distribution of vulnerability indicators in the Guanzhong Plain between 2030 and 2050 under different development scenarios.
Remotesensing 15 05778 g012
Figure 13. Spatial distribution of flood risk indices in the Guanzhong Plain between 2030 and 2050 under different development scenarios.
Remotesensing 15 05778 g013
Figure 14. Map of the area at risk as a percentage.
Remotesensing 15 05778 g014
Figure 15. Change in risk transfer under different scenarios.
Remotesensing 15 05778 g015
Table 1. Driving factors and land-use data.
TypeDataTimeOriginal
Resolution
Resource
Land use20101 kmwww.globallandcover.com/, accessed on 3 January 2022
2020
Socio-economic factorsPOP2010, 20200.5°https://springernature.figshare.com/articles/dataset, accessed on 10 January 2022
Gross domestic product (GDP)2010, 2020http://cstr.cn/31253.11.sciencedb.01683, accessed on 10 January 2022. CSTR:31253.11.sciencedb.01683.
Grain sown area and output2010, 2020 Statistical Yearbook of Shaanxi Province 2022
Rural and urban population2010, 2020
Grain purchase price2010, 2020
Natural environmental conditionsDigital elevation model (DEM)20101 kmNASA SRTM1 v3.0
Slope20101 km
Traffic location factorsRailway2010 OpenStreetMap
https://www.openstreetmap.org/, accessed on 10 January 2022
Highway2010
Expressway2010
River2010
Table 2. Multi-objective optimization function for evaluation.
FunctionFormulaDescription
Function for estimating
economic benefits.
M 1 = m a x i = 1 6 e b i x i = m a x { 5.89 x 1 + 0.40 x 2 + 24.37 x 3 + 249.6 x 4 + 0.001 x 5 + 1.97 x 6 } The coefficient ebi is the economic benefits of each land-use type (unit: 104 CNY/ha), CNY = Chinese yuan.
Function for estimating
ecological service value
M 2 = m a x i = 1 6 e s v i x i = m a x { 0.68 x 1 + 2.89 x 2 + 0.22 x 3 + 0.000142 x 4 + 0.4 x 6 } The coefficient esvi is the ecological service values of each land-use type (unit: 104 CNY/ha).
MOP function under the SSP126
scenario
S S P 126 = m a x 0.5 i = 1 6 e b i x i + 0.5 i = 1 6 e s v i x i x 1 ~ x 6 represents the area of different land-use types (ha): cultivated land ( x 1 ), woodland ( x 2 ), grassland ( x 3 ), urban land ( x 4 ), bare land ( x 5 ), and water ( x 6 ).
Table 3. Multi-objective optimization constraints for evaluation.
ConstraintDescription
i = 1 6 x i = 3552159.78 The total land-use area remains unchanged.
0.35 i = 1 3 x i + 66.53 x 4 P i The population density of agricultural land and urban land are 0.35 and 66.53, respectively (person/ha). P i is the total population by 2030, 2040, and 2050; P i is, respectively, 30 million, 31.2 million, and 32.3 million.
x 3 + x 5 3552159.78 0.04 To ensure the diversity of land use, the total grassland and bare land area in this study are less than 0.04.
i = 1 3 x i 3080771 Considering that the change in cultivated land should keep a dynamic balance, the total area of cultivated land should be greater than or equal to the current value.
875920.6   x 2 w i × 120 % We set the woodland area to be between the woodland area in 2020 and w i × 120 % , and w i is the predicted woodland area of the Markov chain in 2030, 2040, and 2050.
0.038 x 3 3552159.78 0.043 We set the grassland coverage in 2020 as the upper limit (0.043) and the grassland coverage in 2050 predicted by the Markov chain as the lower limit (0.038).
u i × 80 % x 4 u i × 120 % u i is what the Markov chain predicts as the urban land area in 2030, 2040, and 2050. We set u i × 120 % as the upper limit (0.043) and u i × 80 % as the lower limit (0.038).
49539.33 x 6 v i × 120 % v i is what the Markov chain predicts as the water area in 2030, 2040, and 2050. We set v i × 120 % as the upper limit and the water area in 2020 as the lower limit.
Table 4. Basic information of 5 GCMs from CMIP6.
ModelCountryOriginal Resolution (°)Resolution after Downscaling (°)
CanESM5Canada2.8 × 2.80.5 × 0.5
CNRM-ESM2-1France2.5 × 1.26760.5 × 0.5
GFDL-ESM4U.S.A.2.88 × 1.80.5 × 0.5
MIROC6Japan1.4063 × 1.40.5 × 0.5
MRI-ESM2-0Germany1.125 × 1.120.5 × 0.5
Table 5. Land-use demands under different scenarios.
Type SSP126SSP245
2020203020402050203020402050
Cropland22,879,84322,628,62222,396,61122,240,35622,398,81722,005,50221,685,365
Woodland9,732,4519,730,2519,718,9429,748,9189,656,9939,575,5509,490,178
Grassland1,618,4981,697,1431,657,6741,660,7981,569,4061,529,7471,497,225
Water548,437550,432633,893622,750538,184528,244518,958
Urban land4,660,2534,831,0985,033,0045,167,2805,276,3465,801,0816,248,796
Bare land28,96028,69628,31828,34028,69628,31827,919
Disclaimer/Publisher’s Note: The statements, opinions and data contained in all publications are solely those of the individual author(s) and contributor(s) and not of MDPI and/or the editor(s). MDPI and/or the editor(s) disclaim responsibility for any injury to people or property resulting from any ideas, methods, instructions or products referred to in the content.

