
Research of Seismogenic Structures of the 2016 and 2022 Menyuan Earthquakes, in the Northeastern Tibetan Plateau
 and
and
Abstract
:1. Introduction
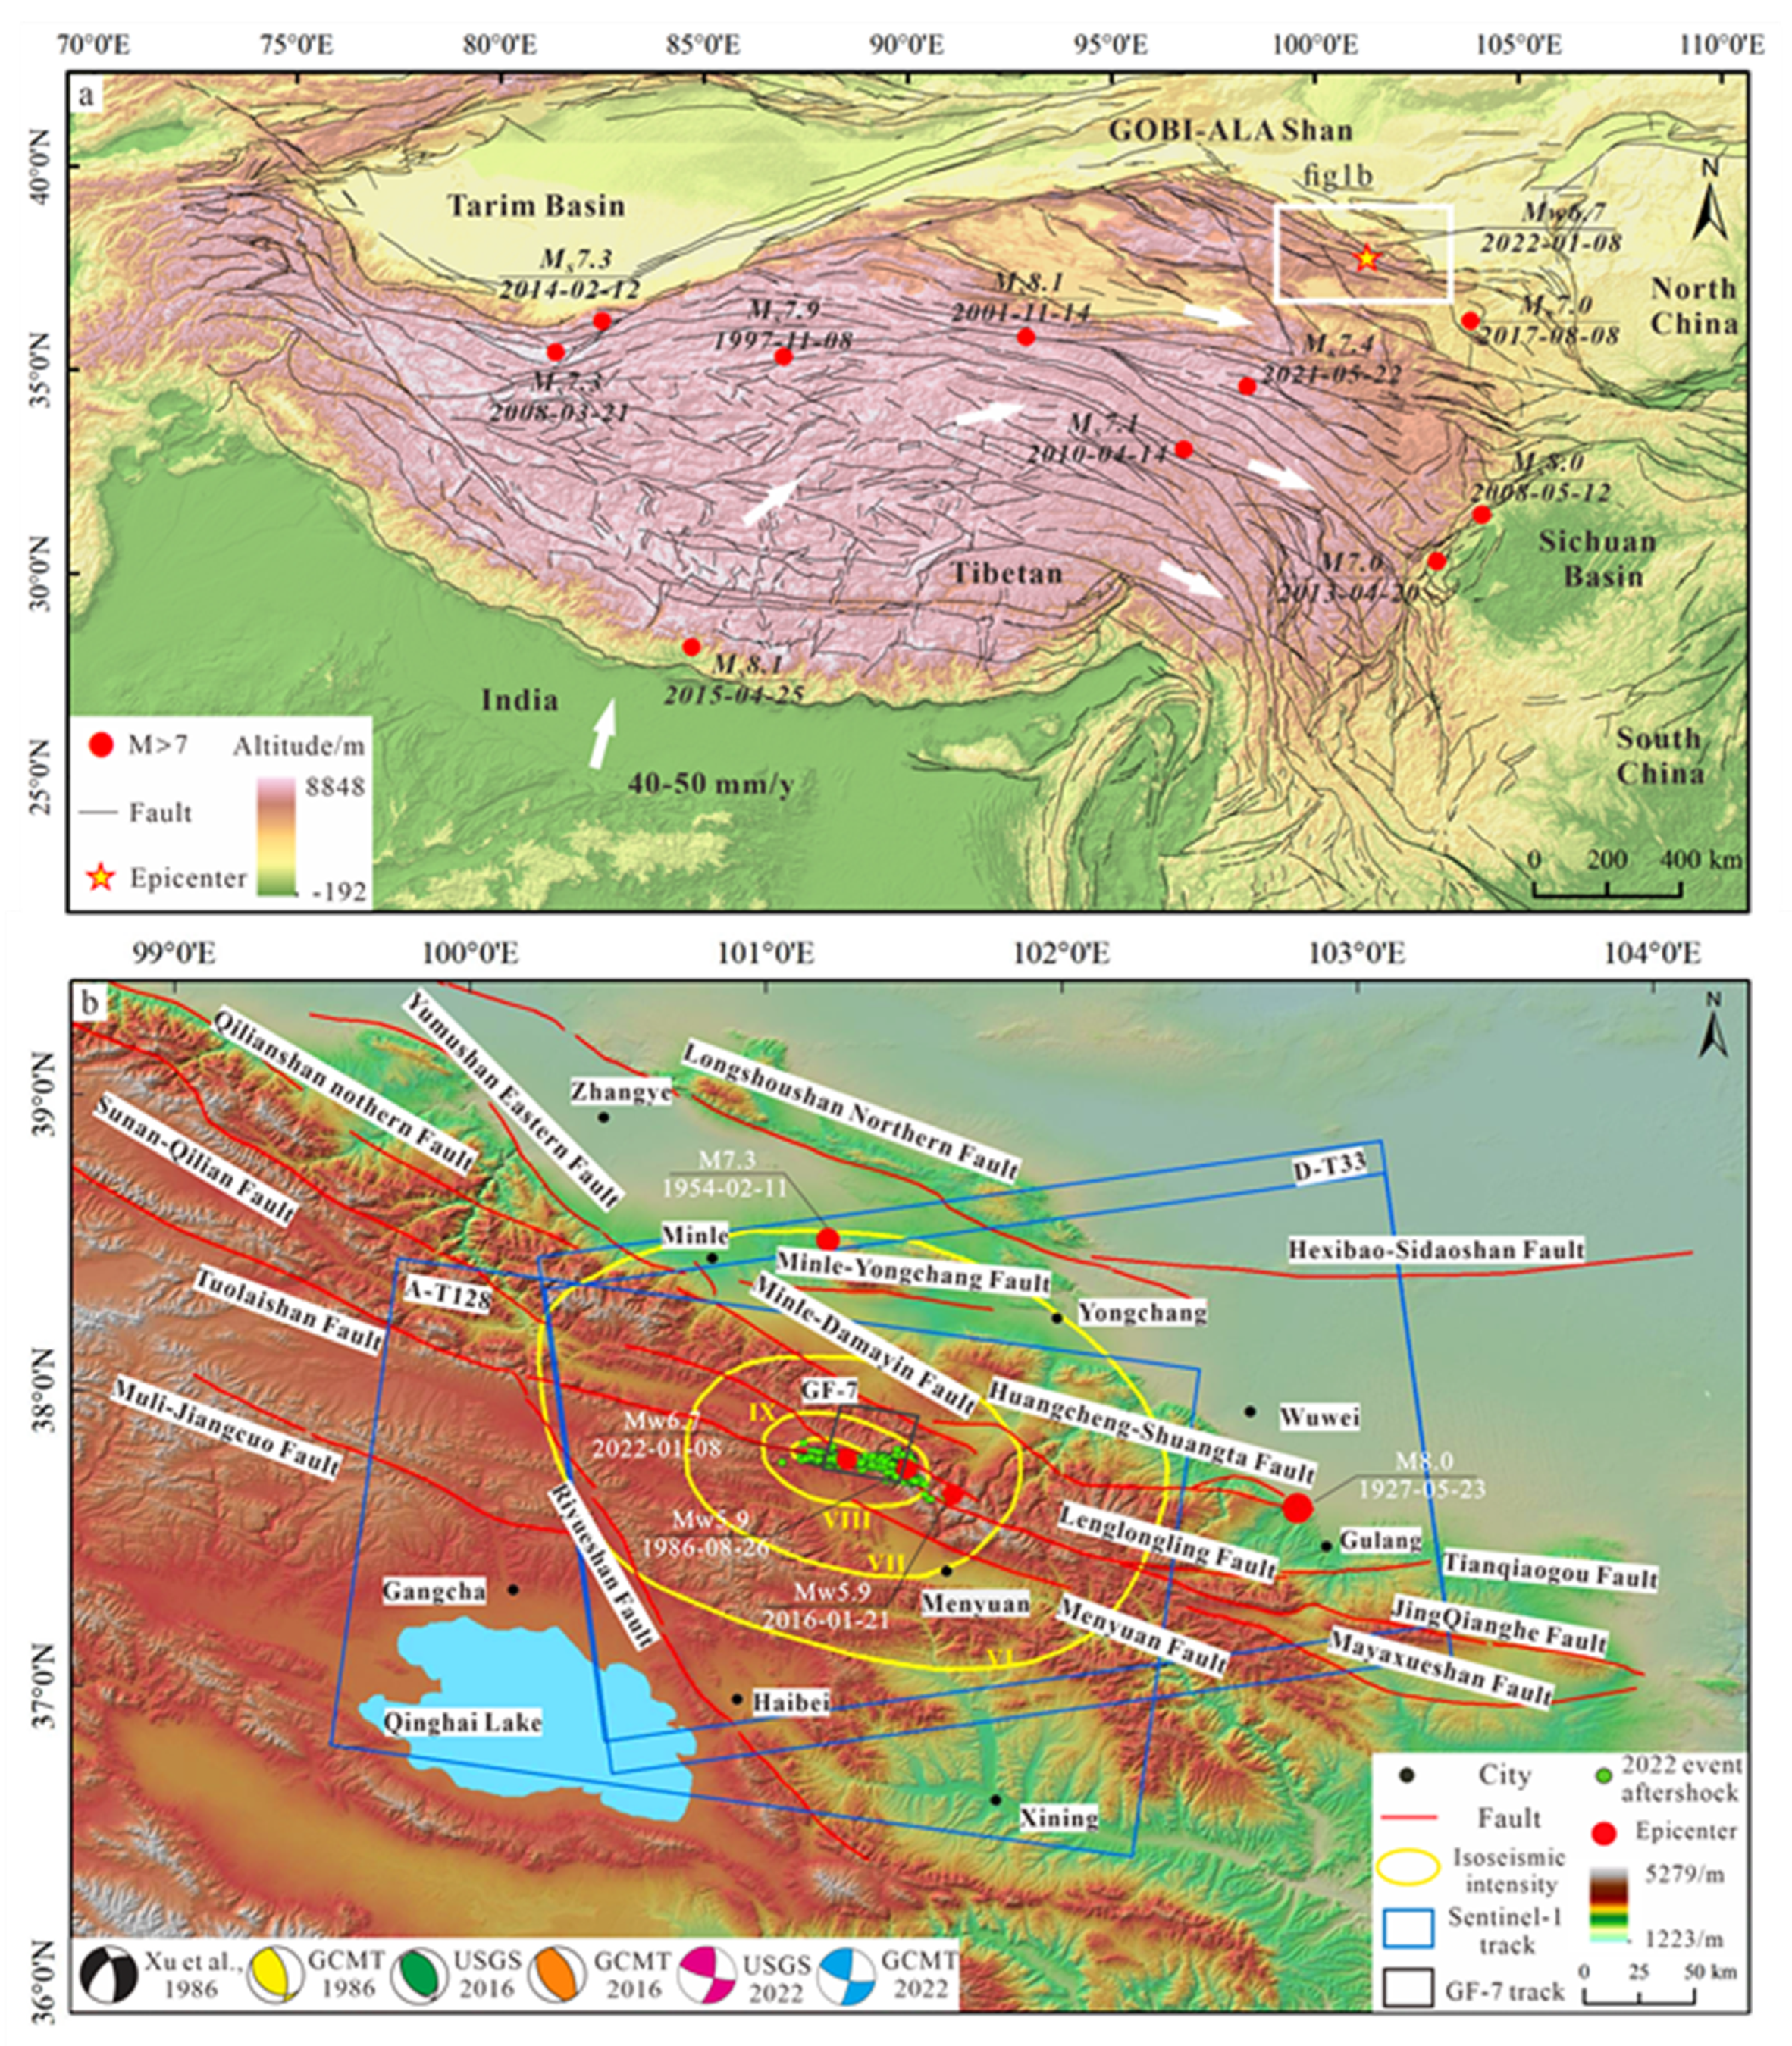
2. Tectonic Setting
3. Satellite Image Processing
3.1. GF-7 Satellite Image Interpretation
3.2. Sentinel-1 SAR Images Processing
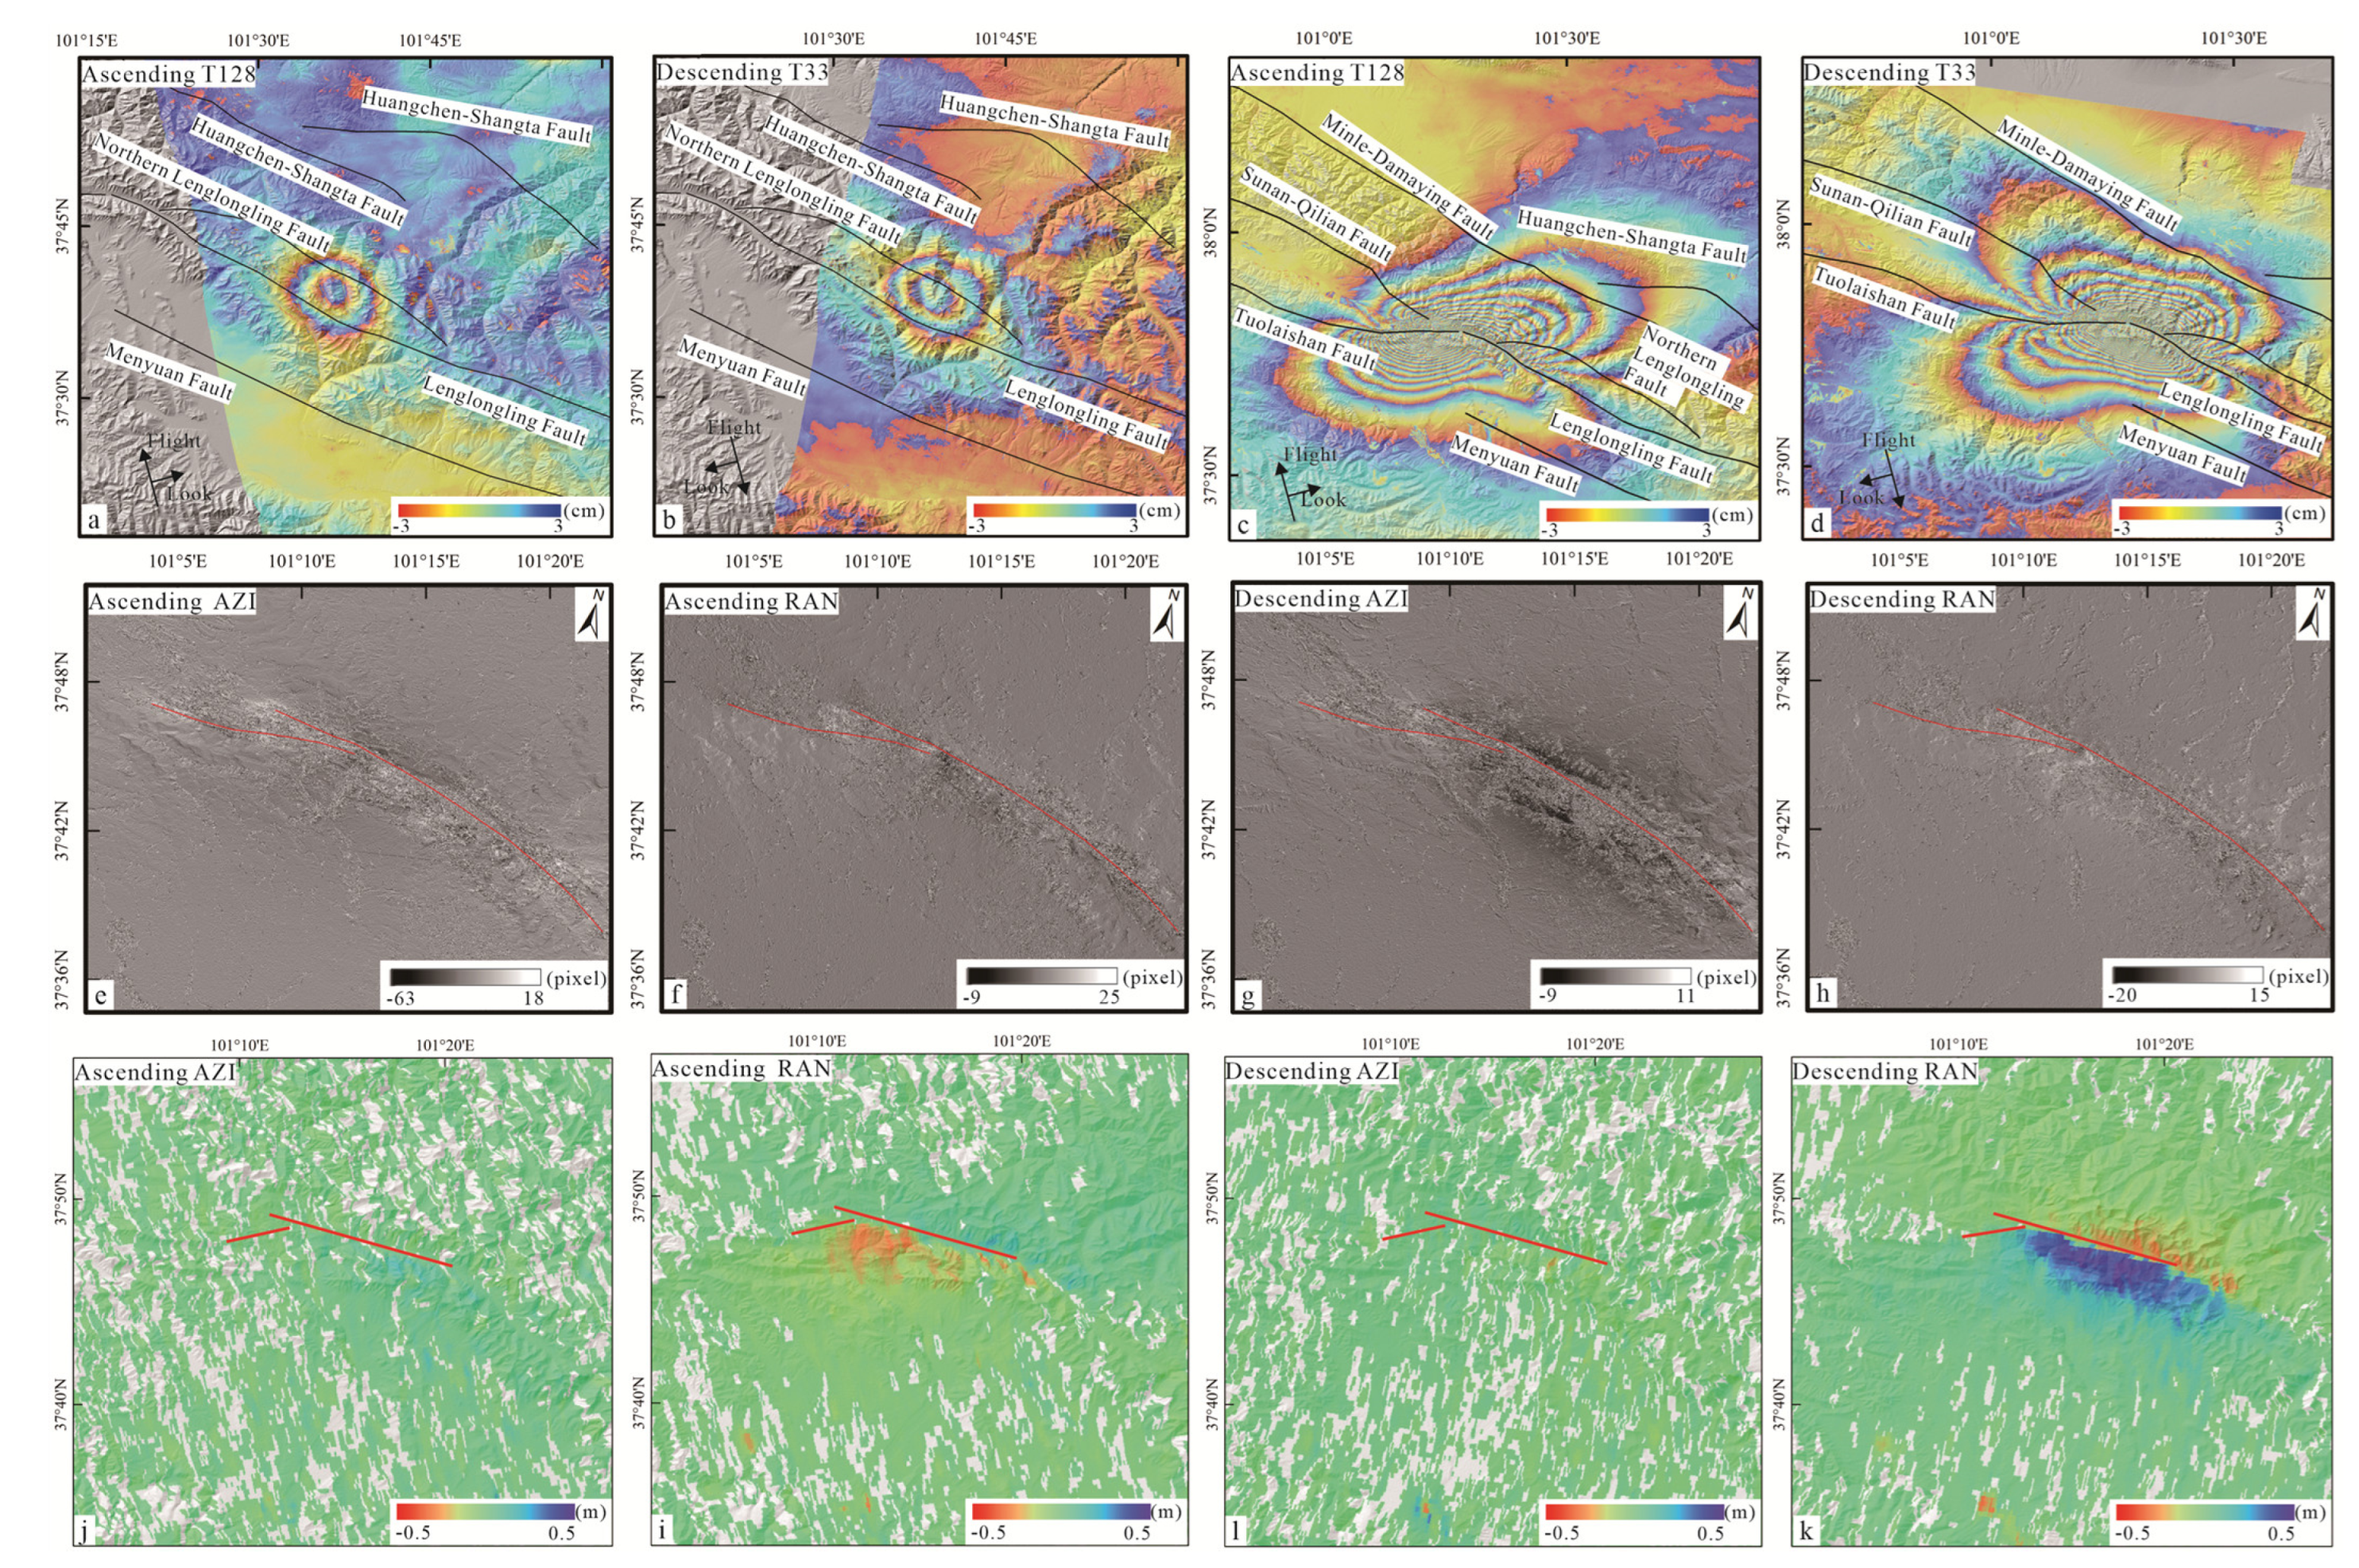
3.2.1. Coseismic Deformation Field
3.2.2. Phase Gradient
3.2.3. Pixel Offset Tracking
4. Fault Inversion and Coulomb Stress
4.1. Inversion of Fault Geometric Parameters
4.2. Distributed Slip Model
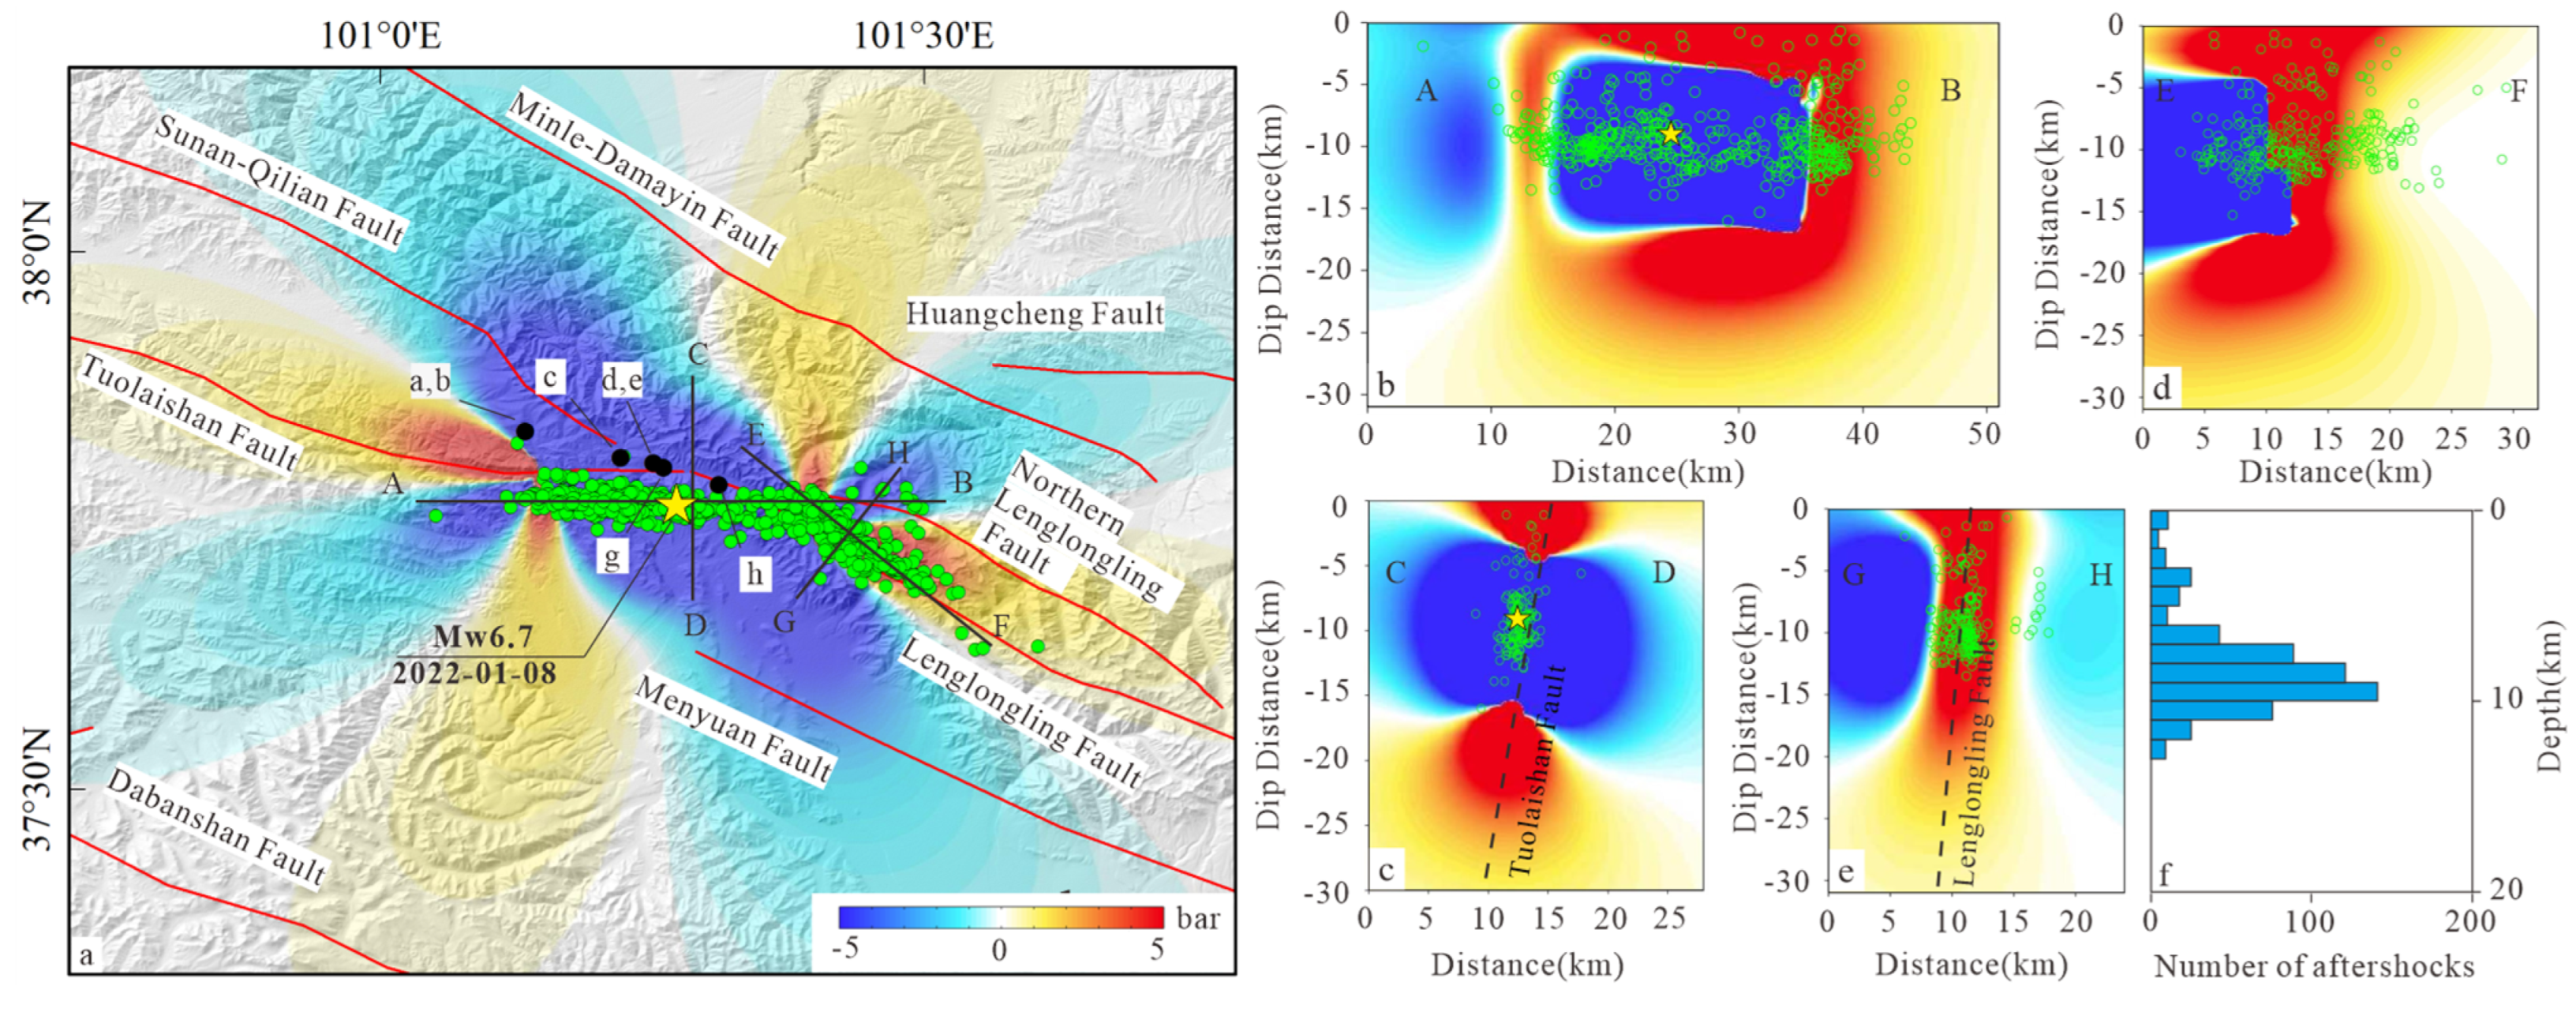
4.3. Coulomb Stress Change
5. Discussion
5.1. Regional Coulomb Stress
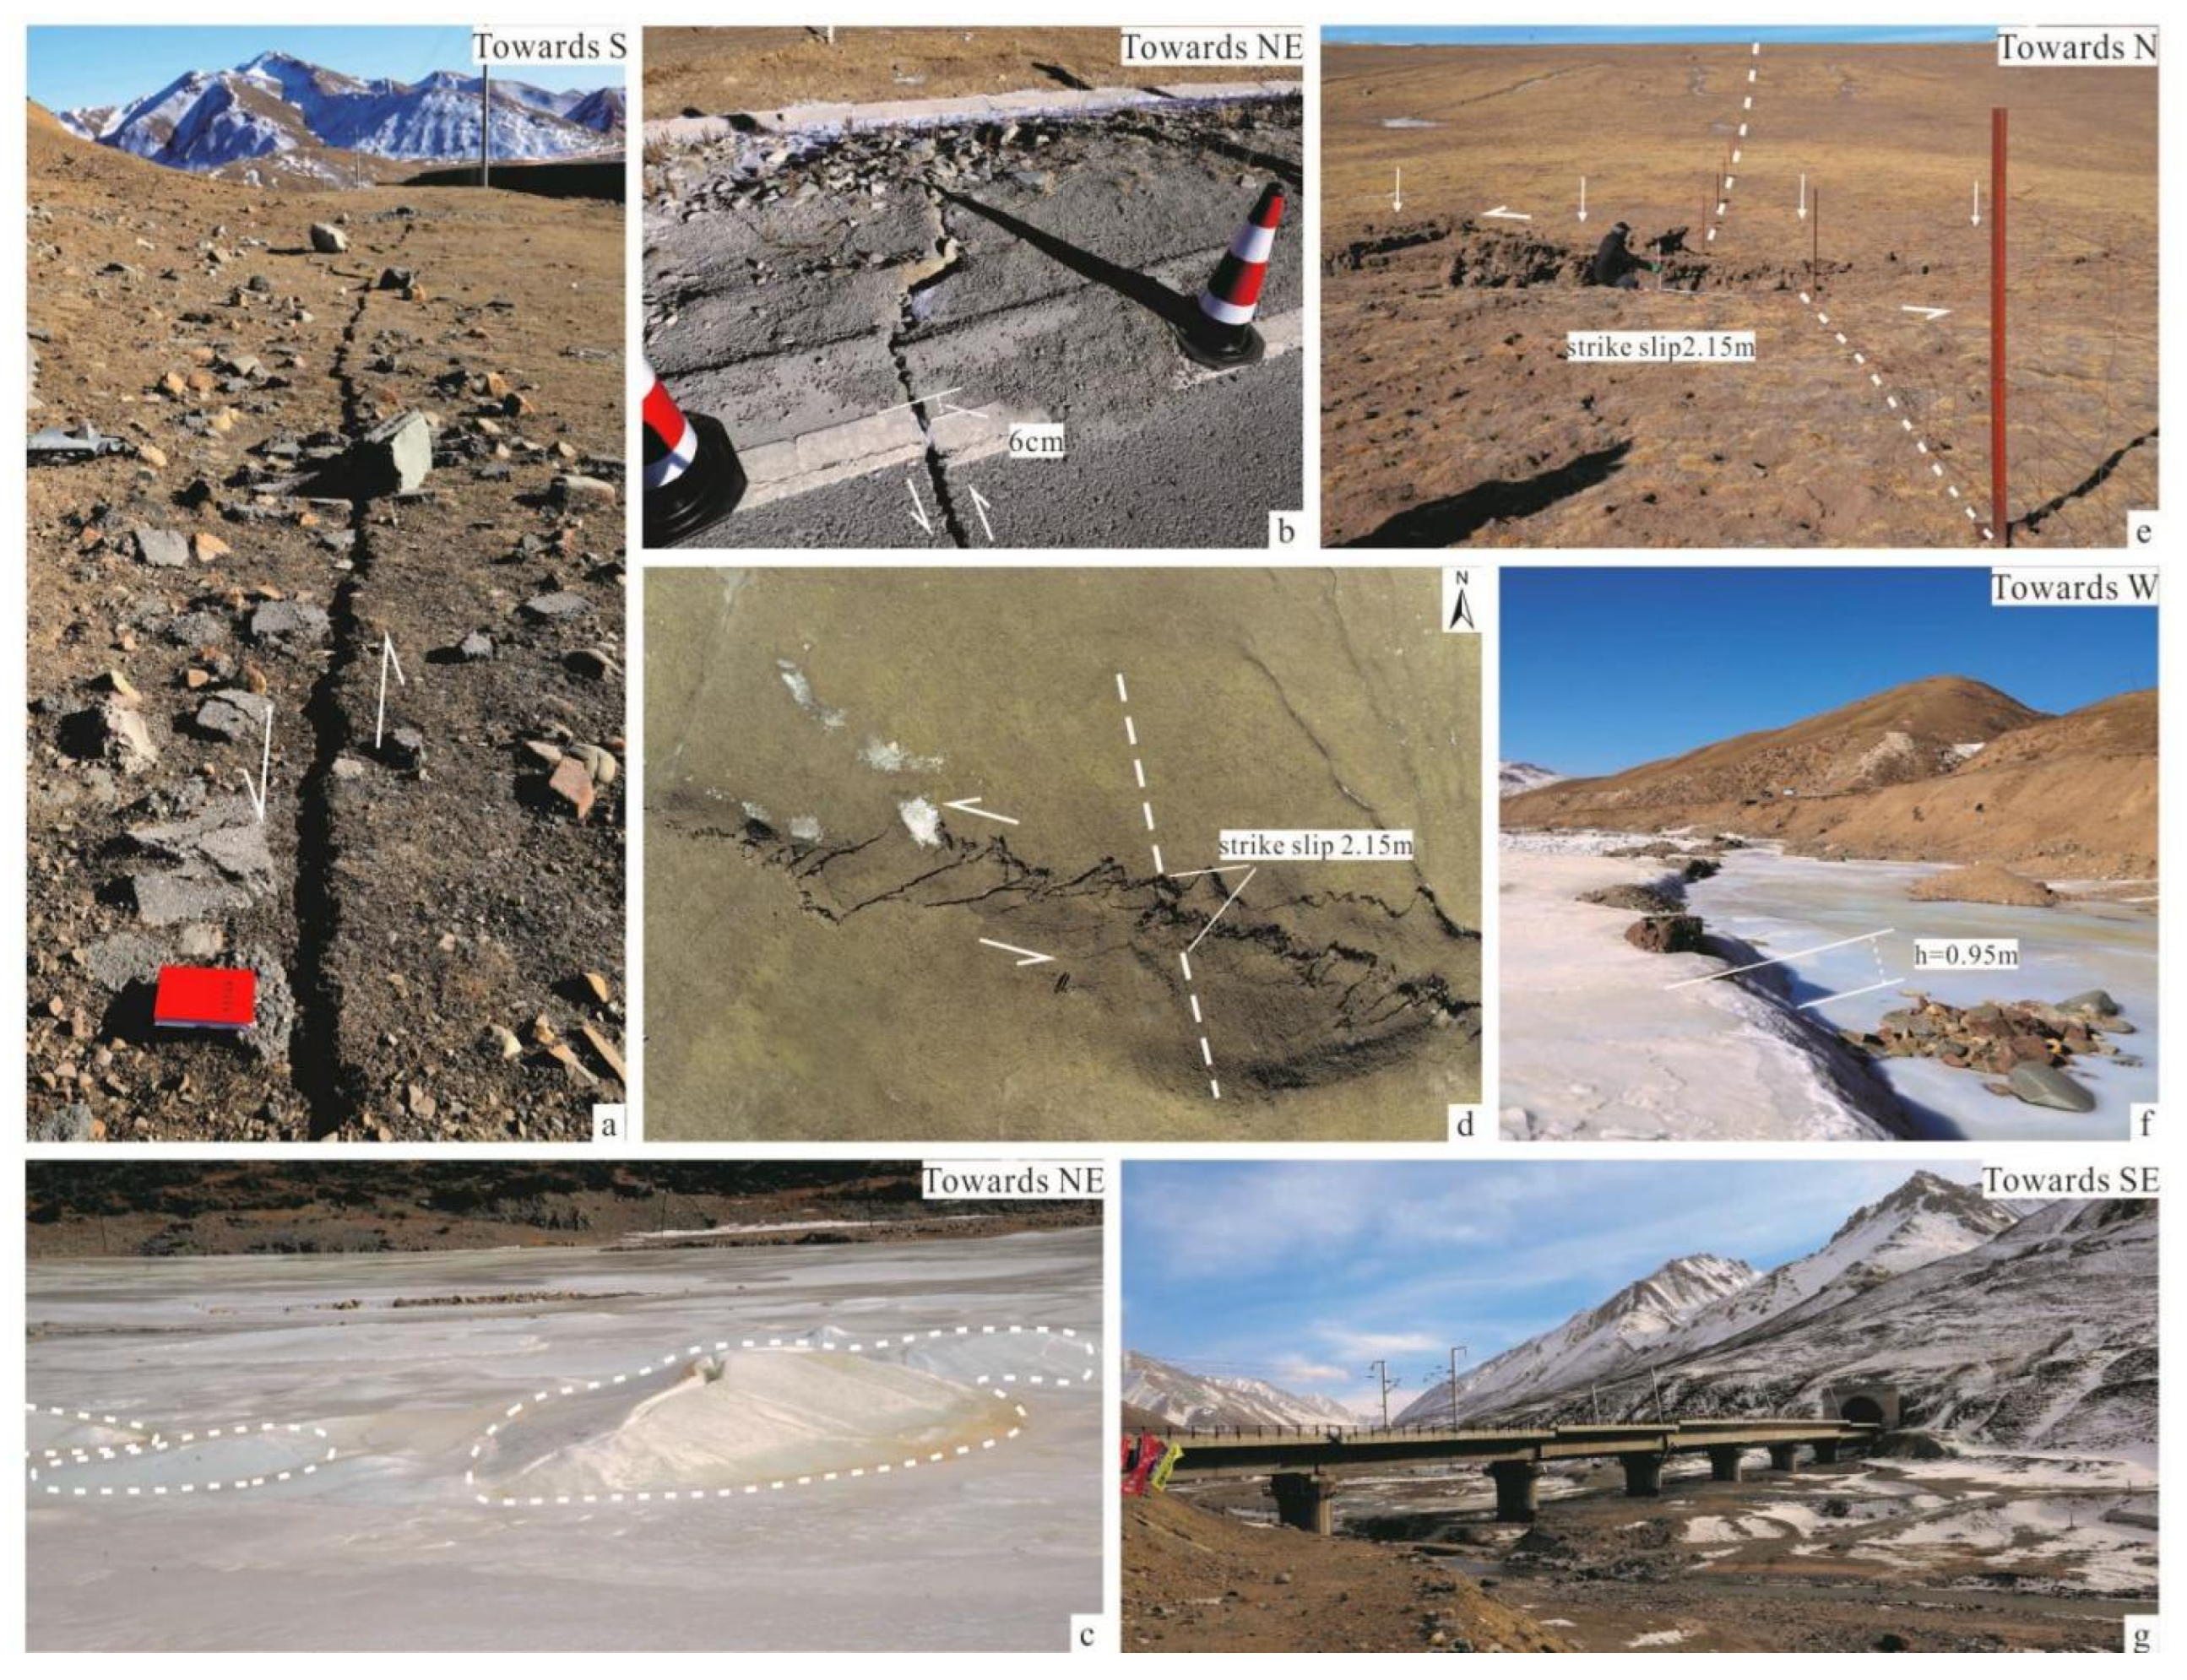
5.2. Seismic Hazard Due to Spatial Diversity of Surface Rupture of the 2022 Menyuan Earthquake
5.3. Seismogenic Structure
6. Results
Author Contributions
Funding
Data Availability Statement
Acknowledgments
Conflicts of Interest
References
- Liang, K.; He, Z.T.; Jiang, W.L.; Li, Y.S.; Liu, Z.M. Surface rupture characteristics of the Menyuan Ms6.9 Earthquake on January 8, 2022, Qinghai Province. Seismol. Geol. 2022, 44, 256–278. (In Chinese) [Google Scholar] [CrossRef]
- Hu, C.Z.; Yang, P.X.; Li, Z.M.; Huang, S.T.; Zhao, Y.; Chen, D.; Xiong, R.W.; Chen, Q.Y. Seismogenic mechanism of the 21 January 2016 Menyuan, Qinghai Ms6.4 earthquake. Chin. J. Geophys. 2016, 59, 1637–1646. [Google Scholar] [CrossRef]
- Xu, J.R.; Yao, L.X.; Wang, J. Earthquake source mechanisms of Menyuan earthquake (Ms = 6.4, on Aug.26,1986) and its strong aftershocks. Chin. Earthq. Eng. J. 1986, 8, 82–84. (In Chinese) [Google Scholar]
- He, X.H.; Zhang, Y.P.; Shen, X.Z.; Zheng, W.J.; Zhang, D.L. Examination of the repeatability of two Ms6.4 Menyuan earthquakes in Qilian-Haiyuan fault zone (NE Tibetan Plateau) based on source parameters. Phys. Earth Planet. Inter. 2019, 299, 106–408. [Google Scholar] [CrossRef]
- Jiang, W.L.; Li, Y.S.; Tian, Y.F.; Han, Z.J.; Zhang, J.F. Research of seismogenic structure of the Menyuan Ms6.4 earthquake on January 21, 2016 in Lenglongling area of NE Tibetan plateau. Seismol. Geol. 2017, 39, 536–549. (In Chinese) [Google Scholar] [CrossRef]
- Gaudemer, Y.; Tapponnier, P.; Myer, B.; Peltzer, G.; Shunmin, G.; Zhitai, C. Partitioning of crustal slip between linked, active faults in the eastern Qilian Shan, and evidence for amajor seismic gap, the Tianzhu gap, on the western Haiyuan fault, Gansu (China). Geophys. J. Int. 1995, 120, 599–645. [Google Scholar] [CrossRef] [Green Version]
- He, W.G.; Liu, B.C.; Yuan, D.Y.; Yang, M. Research on the slip rate of the Lenglongling fault zone. Chin. Earthq. Eng. J. 2000, 22, 90–97. (In Chinese) [Google Scholar]
- Liu, F.B.; Wang, A.G.; Yuan, D.Y. Static Coulomb Stress changes and triggering interaction among strong earthquakes in the eastern segment of North Qilian Mountain. Chin. Earthq. Eng. J. 2014, 36, 360–371. (In Chinese) [Google Scholar]
- Wu, D.L.; Qu, C.Y.; Zhao, D.Z.; Shan, X.J.; Han, C. Slip models of the 2016 and 2022 Menyuan, China, earthquakes, illustrating regional tectonic structures. Remote Sens. 2022, 14, 6317. [Google Scholar] [CrossRef]
- Lindsey, E.O.; Natsuaki, R.; Xu, X.; Shimada, M.; Hashimoto, M.; Melgar, D.; Sandwell, D.T. Line-of-sight displacement from ALOS-2 interferometry: M-w 7.8 Gorkha earthquake and M-w 7.3 aftershock. Geophys. Res. Lett. 2015, 42, 6655–6661. [Google Scholar] [CrossRef]
- Chen, K.J.; Avouac, J.P.; Aati, S.; Milliner, C.; Shi, C. Cascading and pulse-like ruptures during the 2019 Ridgecrest earthquakes in the Eastern California Shear Zone. Nat. Commun. 2020, 11, 22. [Google Scholar] [CrossRef] [Green Version]
- Qu, W.; Liu, B.; Zhang, Q.; Gao, Y.; Chen, H.; Wang, Q.; Hao, M. Sentinel-1 InSAR observations of co-and post-seismic deformation mechanisms of the 2016 Mw 5.9 Menyuan Earthquake, Northwestern China. Adv. Space Res. 2021, 68, 1301–1317. [Google Scholar] [CrossRef]
- Yang, H.F.; Wang, D.; Guo, R.; Xie, M.; Zang, Y.; Wang, Y.; Yao, Q.; Cheng, C.; An, Y.; Zhang, Y. Rapid report of the 8 January 2022 MS 6.9 Menyuan earthquake, Qinghai, China. Earthq. Res. Adv. 2022, 2, 100113. [Google Scholar] [CrossRef]
- Luo, H.; Wang, T. Strain partitioning on the western Haiyuan fault system revealed by the adjacent 2016 Mw5. 9 and 2022 Mw6. 7 Menyuan earthquakes. Geophys. Res. Lett. 2022, 49, e2022GL099348. [Google Scholar] [CrossRef]
- Okada, Y. Surface deformation due to shear and tensile faults in a Half Space. Bull. Seismol. Soc. Am. 1992, 82, 1018–1040. [Google Scholar] [CrossRef]
- Tapponnier, P.; Xu, Z.Q.; Roger, F.; Meyer, B.; Arnaud, N.; Wittlinger, G.; Yang, J. Oblique stepwise rise and growth of the Tibet plate. Science 2001, 294, 1671–1677. [Google Scholar] [CrossRef]
- Ding, L.; Kapp, P.; Wan, X.Q. Paleocene-Eocene record of ophiolite obduction and initial India-Asia collision, south central Tibet. Tectonics 2005, 24, TC3001. [Google Scholar] [CrossRef] [Green Version]
- Wang, T.Y.; Li, G.B.; Elmes, M. Biostratigraphy and provenance analysis of the Cretaceous to Palaeogene deposits in southern Tibet: Implications for the India-Asia collision. Basin. Res. 2021, 33, 1749–1775. [Google Scholar] [CrossRef]
- Xu, X.W.; Wu, X.Y.; Yu, G.H.; Tan, X.B.; Li, K. Seismo-geological signatures for identifying M ≥ 7.0 earthquake and their premilimary application in mainland China. Seismol. Geol. 2017, 39, 219–275. (In Chinese) [Google Scholar] [CrossRef]
- Li, H.B.; Pan, J.W.; Sun, Z.M.; Si, J.L.; Pei, J.L.; Liu, D.L.; Marie, L.C.; Wang, H.; Lu, H.J.; Zheng, Y.; et al. Continental tectonic deformation and seismic activity: A case study from the Tibetan Plateau. Acta Geol. Sin. 2021, 95, 194–213. (In Chinese) [Google Scholar] [CrossRef]
- Yuan, D.Y.; Zhang, P.Z.; Liu, B.C.; Gan, W.J.; Mao, F.Y.; Wang, Z.C.; Zheng, W.J.; Guo, H. Geometrical imagery and tectonic transformation of late Quaternary activate tectonics in northeastern margin of Qinghai-Xizang plateau. Acta Geol. Sin. 2004, 78, 270–278. (In Chinese) [Google Scholar]
- Zheng, W.J.; Zhang, P.Z.; He, W.G.; Yuan, D.Y.; Shao, Y.X.; Zheng, D.W.; Ge, W.P.; Min, W. Transformation of displacement between strike-slip and crustal shortening in the northern margin of the Tibetan plateau: Evidence from decadal GPS measurements and late Quaternary slip rates on faults. Tectonophysics 2013, 584, 267–280. [Google Scholar] [CrossRef]
- Jiang, W.L.; Jiao, Q.S.; Tian, T.; Zhang, J.F. Seismic slip distribution and rupture model of the Lenglongling Fault Zone, northeastern Tibetan Plateau. Geol. J. 2021, 56, 1299–1314. [Google Scholar] [CrossRef]
- Pan, J.W.; Li, H.B.; Marie, L.C.; Liu, D.L.; Li, C.; Liu, F.C.; Wu, Q.; Lu, H.J.; Jiao, L.Q. Coseismic surface rupture and seismogenic structure of the 2022 Ms6.9 Menyuan earthquake, Qinghai Province, China. Acta Geol. Sin. 2022, 96, 215–231. (In Chinese) [Google Scholar] [CrossRef]
- Lasserre, C.; Gaudemer, Y.; Tapponnier, P.; Meriaux, A.S.; Var der Woerd, J.; Yuan, D.Y.; Ryerson, F.J.; Finkel, R.C.; Caffee, M.W. Fast late Pleistocene slip rate on the Leng Long ling segment of the Haiyuan Fault, Qinghai, China. J. Geophys. Res. Solid Earth 2002, 107, 2276. [Google Scholar] [CrossRef]
- Wu, D.L.; Ge, W.P.; Wei, C.M. Characteristics of present-day crustal defotmation along the Haiyuan fault zone using PS-InSAR method. Chin. Earthq. Eng. J. 2020, 42, 1055–1064. (In Chinese) [Google Scholar] [CrossRef]
- Guo, P.; Han, Z.J.; An, Y.F.; Jiang, W.L.; Mao, Z.B.; Feng, W. Activity of the Lenglongling fault system and seismotectonics of the 2016 Ms6.4 Menyuan earthquake. Sci. China Earth Sci. 2017, 60, 929–942. (In Chinese) [Google Scholar] [CrossRef]
- Huang, H.; Fu, H. A preliminary study of the seismogenic structure of the Now.23, 2015 Qilian 5.2 earthquake. Earthquake 2019, 39, 114–125. (In Chinese) [Google Scholar]
- Li, Y.S.; Jiang, W.L.; Li, Y.J.; Shen, W.H.; He, Z.T.; Li, B.Q.; Li, Q.; Jiao, Q.S.; Tian, Y.F. Coseismic rupture model and tectonic implications of January 7 2022, Menyuan Mw6.6 earthquake constrains from InSAR observations and filed investigation. Remote Sens. 2022, 14, 2111. [Google Scholar] [CrossRef]
- Li, Q.; Jiang, Z.S.; Wu, Y.Q.; Zhao, J.; Wei, W.X.; Liu, X.X. Present–day tectonic deformation characteristics of Haiyuan—Liuoanshan fault zone. J. Geod. Geodyn. 2013, 33, 18–22. [Google Scholar] [CrossRef]
- Xu, G.Y.; Xu, X.W.; Yi, Y.N.; Wen, Y.M.; Wang, Q.X.; Li, K.; Ren, J.J. Seismogenic structure of the 2022 Menyuan Mw6.6 earthquake, Qinghai province, constrained by InSAR and Gaofen-7 observation. Chin. J. Geophys. 2022, 65, 4704–4724. [Google Scholar] [CrossRef]
- Liu, J.; Klinger, Y.; Xu, X.W.; Lasserre, C.; Chen, G.H.; Chen, W.B.; Tapponnier, P.; Zhang, B. Millennial Recurrence of Large Earthquakes on the Haiyuan Fault near Songshan, Gansu Province, China. Bull. Seismol. Soc. Am. 2007, 97, 14–34. [Google Scholar] [CrossRef] [Green Version]
- Guo, P.; Han, Z.J.; Mao, Z.B.; Xie, Z.D.; Dong, S.P.; Gao, F.; Gai, H.L. Paleoearthquakes and rupture behavior of the Lenglongling fault: Implications for seismic hazards of the northeastern margin of the Tibetan Plateau. J. Geophys. Res. Solid Earth 2019, 124, 1520–1543. [Google Scholar] [CrossRef]
- Guo, P.; Han, Z.J.; Dong, S.P.; Yuan, R.M.; Xie, Z.D. Surface rupture and slip distribution along the Lenglongling fault in the NE Tibetan Plateau: Implications for faulting behavior. J. Asian Earth Sci. 2019, 172, 190–207. [Google Scholar] [CrossRef]
- Guo, P.; Han, Z.J.; Gao, F.; Zhu, C.H.; Gai, H. A new tectonic model for the 1927 M8.0 Gulang earthquake on the NE Tibetan Plateau. Tectonics 2020, 39, e2020TC006064. [Google Scholar] [CrossRef]
- Deng, Q.D.; Zhang, P.Z.; Ran, Y.K.; Yang, X.P.; Min, W.; Chun, Q.Z. Basic characteristics of active tectonics of China. Sci. China Ser. D Earth Sci. 2003, 46, 356–372. [Google Scholar] [CrossRef]
- Fan, L.P.; Li, B.R.; Liao, S.R.; Jiang, C.; Fang, L.H. Precise relocation of the aftershock sequences of the 2022 M6.9 Menyuan earthquake. Earthq. Sci. 2022, 35, Q20220008. [Google Scholar] [CrossRef]
- Poormirzaee, R.; Oskouei, M.M. Use of spectral analysis for detection of alterations in ETM data, Yazd, Iran. Appl. Geomat. 2010, 2, 147–154. [Google Scholar] [CrossRef] [Green Version]
- Aati, S.; Milliner, C.; Avouac, J.-P. A new approach for 2-D and 3-D precise measurements of ground deformation from optimized registration and correlation of optical images and ICA-based filtering of image geometry artifacts. Remote Sens. Environ. 2022, 277, 113038. [Google Scholar] [CrossRef]
- Lei, Y.; Gardner, A.; Agram, P. Autonomous Repeat Image Feature Tracking (autoRIFT) and Its Application for Tracking Ice Displacement. Remote Sens. 2021, 13, 749. [Google Scholar] [CrossRef]
- Cao, H.Y.; Zhang, X.W.; Zhao, C.G.; Xu, C.; Mo, F.; Dai, J. 2020. System design and key tectnolongies of the GF-7 satellite. Chin. Space Sci. Technol. 2020, 40, 1–9. (In Chinese) [Google Scholar] [CrossRef]
- Li, G.Y.; Tang, X.M.; Chen, J.Y.; Yao, J.Q.; Liu, Z.; Gao, X.M.; Zuo, Z.Q.; Zhou, X.Q. Processing and preliminary accuracy validation of the GF-7 satellite laser altimetry data. Acta Geod. Cartograph. Sin. 2021, 50, 1338–1348. (In Chinese) [Google Scholar] [CrossRef]
- Jiao, Q.S.; Jiang, W.L.; Li, Q.; Lai, J.B.; Zheng, Y.; He, Z.T.; Shen, W.H.; Li, Y.S.; Luo, Y.; Zhang, J.F. Rapid emergency analysis of the surface related to the Qinghai Menyuan Ms6.9 earthquake on January 8, 2022, using GF-7 satellite images. J. Remote Sens. 2022, 9, 1895–1908. (In Chinese) [Google Scholar] [CrossRef]
- Sandwell, D.T.; Mellors, R.; Tong, X.; Wei, M.; Wessel, P. Open radar interferometry software for mapping surface deformation. Trans. Am. Geophys. Union 2011, 92, 234. [Google Scholar] [CrossRef] [Green Version]
- Xu, X.H.; Ward, L.; Jiang, J.L.; Smith–Konter, B.; Tymofyeyeva, E.; Lindsey, E.O.; Sylvester, A.G.; Sandwell, D. Surface creep rate of the southern San Andreas fault modulated by stress perturbations from nearby large events. Geophys. Res. Lett. 2018, 45, 10259–10268. [Google Scholar] [CrossRef]
- Xu, X.H.; Sandwell, D.T.; Smith-Konter, B. Coseismic Displacements and Surface Fractures from Sentinel–1 InSAR: 2019 Ridgecrest Earthquakes. Seismol. Res. Lett. 2020, 91, 1979–1985. [Google Scholar] [CrossRef]
- Chen, C.W.; Zebker, H.A. Phase unwarpping for large SAR interferograms: Statistical Segmentation and Generalized Network Models. IEEE Trans. Geosci. Electron. 2002, 40, 1709–1719. [Google Scholar] [CrossRef] [Green Version]
- Chen, Y.; Penna, N.T.; Li, Z.H. Generation of real-time mode high-resolution water vapor fields from GPS observations. J. Geophys. Res. Atmos. 2017, 122, 2008–2025. [Google Scholar] [CrossRef]
- Chen, Y.; Li, Z.H.; Penna, N.T.; Crippa, P. Generic atmospheric correction model for Interferometric Synthetic Aperture Radar observations. J. Geophys. Res. Solid Earth 2018, 123, 9202–9222. [Google Scholar] [CrossRef]
- Chen, Y.; Li, Z.H.; Penna, N.T. Interferometric synthetic aperture radar atmospheric correction using a GPS–based iterative tropospheric decomposition model. Remote Sens. Environ. 2018, 204, 109–121. [Google Scholar] [CrossRef]
- Rosen, P.A.; Gurrola, E.M.; Sacco, G.F.; Zebker, H. The InSAR scientific computing environment. In Proceedings of the EUSAR 2012, 9th European Conference on Synthetic Aperture Radar, Nuremberg, Germany, 23–26 April 2012. [Google Scholar]
- Shan, X.J.; Qu, C.Y.; Gong, W.Y.; Zhang, Y.F.; Zhang, G.H.; Song, X.G.; Liu, Y.H.; Zhang, G.F. Coseismic deformation field of the Jiuzhaigou Ms7.0 earthquake from Sentinel–1A InSAR data and fault slip inversion. Chin. J. Geophys. 2017, 60, 4527–4536. (In Chinese) [Google Scholar] [CrossRef]
- Sandwell, D.T.; Price, E.J. Phase gradient approach to stacking interferograms. J. Geophys. Res. Solid Earth 1998, 103, 1858–1862. [Google Scholar] [CrossRef] [Green Version]
- Meade, C.; Sandwell, D.T. Synthetic aperture radar for geodesy. Science 1996, 273, 1181–1182. [Google Scholar] [CrossRef]
- Elliott, J.R.; Walters, R.J.; Wright, T.J. The role of Space-Based observation in understanding and responding to active tectonics and earthquakes. Nat. Commun. 2016, 7, 13844. [Google Scholar] [CrossRef] [PubMed] [Green Version]
- Poormirzaee, R.; Fister, I., Jr. Model-Based inversion of Rayleigh Wave Dispersion Curves via linear and nonlinear methods. Pure Appl. Geophys. 2021, 178, 341–358. [Google Scholar] [CrossRef]
- Poormirzaee, R.; Kabgani, A. Characterizing the vs. profile from surface wave data using a customized artificial jellyfish search algorithm. Pure Appl. Geophys. 2022, 179, 4429–4444. [Google Scholar] [CrossRef]
- Barnhart, W.D.; Lohman, R.B.; Mellors, R.J. Active accommodation of plate convergence in Southern Iran: Earthquake locations, triggered aseismic slip, and regional strain rates. J. Geophys. Res. Solid Earth 2013, 118, 5699–5711. [Google Scholar] [CrossRef]
- Barnhart, W.D.; Murray, J.R.; Yun, S.-H.; Svarc, J.L.; Samsonov, S.V.; Fielding, E.J.; Brooks, B.A.; Milillo, P. Geodetic Constraints on the 2014 M 6.0 South Napa Earthquake. Seismol. Res. Lett. 2015, 86, 335–343. [Google Scholar] [CrossRef] [Green Version]
- Barnhart, W.D. Fault creep rates of the Chaman fault (Afghanistan and Pakistan) inferred from InSAR. J. Geophys. Res. Solid Earth 2017, 122, 2016JB013656. [Google Scholar] [CrossRef]
- Barnhart, W.D.; Hayes, G.P.; Wald, D.J. Global Earthquake Response with Imaging Geodesy: Recent Examples from the USGS NEIC. Remote Sens. 2019, 11, 1357. [Google Scholar] [CrossRef] [Green Version]
- Sambridge, M. Geophysical inversion with a neighbourhood algorithm—I. Searching a parameter space. Geophys. J. Int. 1999, 138, 479–494. [Google Scholar] [CrossRef] [Green Version]
- Lohman, R.B.; Simons, M. Some thoughts on the use of InSAR data to constrain models of surface deformation: Noise structure and data downsampling. Geochem. Geophys. Geosyst 2005, 6. [Google Scholar] [CrossRef]
- Li, Y.S.; Jiang, W.L.; Zhang, J.F.; Luo, Y. Space Geodetic Observations and Modeling of 2016 Mw5.9 Menyuan Earthquake: Implications on Seismogenic Tectonic Motion. Remote Sens. 2016, 8, 519. [Google Scholar] [CrossRef] [Green Version]
- Li, Z.H.; Han, B.Q.; Liu, Z.J.; Yu, C.; Chen, B.; Liu, H.H.; Du, J.; Zhang, S.C.; Zhu, W.; Zhang, Q.; et al. Source parameters and slip distributions of the 2016 and 2022 Menyuan, Qinghai earthquake constrained by InSAR observations. Geomat. Inf. Sci. Wuhan Univ. 2022, 47, 887–897. (In Chinese) [Google Scholar] [CrossRef]
- Feng, W.P.; Li, Z.H.; Elliott, J.R.; Fukushima, Y.; Hoey, T.; Singleton, A.; Cook, R.; Xu, Z. The 2011Mw6.8 Burma earthquake: Fault constrains provided by multiple SAR techniques. Geophys. J. Int. 2013, 195, 650–660. [Google Scholar] [CrossRef] [Green Version]
- Fukahata, Y.; Wright, T.J. A non–liner geodetic data inversion using ABIC for slip distribution on a fault with an unknown dip angle. Geophys. J. Int. 2008, 173, 353–364. [Google Scholar] [CrossRef] [Green Version]
- Li, Y.S.; Feng, W.P.; Zhang, J.F.; Li, Z.H.; Tian, Y.F.; Jiang, W.L.; Luo, Y. Coseismic slip of the 2014 Mw6.1 Napa, California earthquake revealed by Sentinel–1A InSAR. Chin. J. Geophys. 2015, 58, 2339–2349. (In Chinese) [Google Scholar] [CrossRef]
- Feng, W.P.; Samsonov, S.; Qiu, Q.; Wang, Y.Q.; Zhang, P.Z.; Li, T.; Zheng, W.J. Orthogonal fault rupture and rapid postseismic deformation following 2019 Ridgecrest, California, earthquake sequence revealed from geodetic observations. Geophys. Res. Lett. 2020, 47, E2019GL086888. [Google Scholar] [CrossRef]
- Simons, M.; Fialko, Y.; Rivera, L. Coseismic deformation from the 1999 Mw7.1 Hector Mine, California, earthquake as inferred from InSAR and GPS observations. Bull. Seismol. Soc. Am. 2002, 92, 1390–1402. [Google Scholar] [CrossRef]
- de Nardis, R.; Pandolfi, C.; Cattaneo, M.; Monachesi, G.; Cirillo, D.; Ferrarini, F.; Bello, S.; Brozzetti, F.; Lavecchia, G. Lithospheric double shear zone unveiled by microseismicity in a region of slow deformation. Sci. Rep. 2022, 12, 21066. [Google Scholar] [CrossRef]
- Cirillo, D.; Totaro, C.; Lavecchia, G.; Orecchio, B.; Nardis, R.D.; Presti, D.; Ferrarini, F.; Bello, S.; Brozzetti, F. Structural complexities and tectonic barriers controlling recent seismic activity in the Pollino area (Calabria-Lucania, southern Italy)—Constraints from stress inversion and 3D fault model building. Solid Earth 2022, 13, 205–228. [Google Scholar] [CrossRef]
- Galderisi, A.; Galli, P. Coulomb stress transfer between parallel faults. The case of Norcia and Mt Vettore normal faults (Italy, 2016 Mw 6.6 earthquake). Results Geophys. Sci. 2020, 1–4, 100003. [Google Scholar] [CrossRef]
- Stein, R.S. The Role of stress transfer in earthquake occurrence. Nature 1999, 402, 605–609. [Google Scholar] [CrossRef]
- Lin, J.; Stein, R.S. Stress triggering in reverse and subduction earthquakes, and stress interaction between the southern San Andreas and nearby reverse and strike–slip faults. J. Geophys. Res. Solid Earth 2004, 109, B02303. [Google Scholar] [CrossRef] [Green Version]
- Toda, S.; Stein, R.S. Richards-Dinger, K.; Bozkurt, S.B. Forecasting the evolution of seismicity in southern California: Animations built on earthquake stress transfer. J. Geophys. Res. Solid Earth 2005, 110, B05S16. [Google Scholar] [CrossRef]
- Toda, S.; Stein, R.S.; Sevilgen, V.; Lin, J. Coulomb 3.3 Graphic-Rich Deformation and Stress-Change Software for Earthquake, Tectonic, and Volcano Research and Teaching—User Guide; U.S. Geological Survey Open-File Report 2011—1060; USGS: Reston, VA, USA, 2011; 63p. [Google Scholar]
- Wells, D.L.; Coppersmith, K.J. New empirical relationships among magnitude, rupture length, rupture width, rupture area, and surface displacement. Bull. Seismol. Soc. Am. 1994, 84, 974–1002. [Google Scholar] [CrossRef]
- Harris, R.A. Introduction to special section: Stress triggers, stress shadows and implications for seismic hazard. J. Geophys. Res. Solid Earth 1998, 103, 24347–24358. [Google Scholar] [CrossRef]
- Zheng, D.W.; Wang, W.T.; Wang, J.L.; Yuan, D.Y.; Liu, C.R.; Zheng, W.J.; Zhang, H.P.; Pang, J.Z. Progressive northward growth of the northern Qilianshan–Hexi Corridor (northeastern Tibet) during the Cenozoic. Lithosphere 2017, 9, 408–416. [Google Scholar] [CrossRef] [Green Version]
- Zhang, P.Z.; Shen, Z.K.; Wang, M.; Gan, W.J.; Burgmann, R.; Wang, Q.; Niu, Z.J.; Sun, J.Z.; Wu, J.C.; Sun, H.R.; et al. Continuous deformation of the Tibetan Plateau from global positioning system data. Geology 2004, 32, 809–812. [Google Scholar] [CrossRef]
- Feng, W.P.; He, X.H.; Zhang, Y.P.; Fang, L.H.; Sergey, S.; Zhang, P.Z. Seismic faults of the Mw6.6 Menyuan, Qinghai earthquake and their implication for the regional seismogenic structures. Chin. Sci. Bull. 2023, 2-3, 254–270. (In Chinese) [Google Scholar] [CrossRef]
- Wang, H.; Liu, M.; Duan, B.; Cao, J.L. Rupture Propagation along Stepovers of Strike–Slip Faults: Effects of Initial Stress and Fault Geometry. Bull. Seismol. Soc. Am. 2020, 110, 1011–1024. [Google Scholar] [CrossRef]
- Zhang, H.; Gao, Y.; Shi, Y.T.; Liu, X.F.; Wang, Y.X. Tectonic stress analysis based on the crustal seismic anisotropy in the northeastern margin of Tibetan Plateau. Chin. J. Geophys. 2012, 55, 95–104. [Google Scholar] [CrossRef]


| Earthquake | Path | Flight Direction | Master | Slave | Spatial Baseline/m | Time Baseline/d |
|---|---|---|---|---|---|---|
| 2016/01/21 | 128 | Ascending | 2016/01/13 | 2016/02/06 | 27.8 | 24 |
| 33 | Descending | 2016/01/18 | 2016/02/11 | 30.28 | 24 | |
| 2022/01/08 | 128 | Ascending | 2022/01/05 | 2022/01/17 | 36.41 | 12 |
| 33 | Descending | 2021/12/29 | 2022/01/10 | 40.27 | 12 |
| Earthquake | Parameter Source | Magnitude | Strike/° | Dip/° | Rake/° | Length/ km | Width/ km | Maximum Slip/m | |
|---|---|---|---|---|---|---|---|---|---|
| 1986/8/26 | GCMT | Mw5.9 | 125 | 37 | 55 | - | - | - | |
| 346 | 60 | 113 | - | - | - | ||||
| [3] | Ms6.4 | 50 | 45 | - | - | - | - | ||
| 2016/1/21 | GCMT | Mw5.9 | 146 | 43 | 83 | - | - | - | |
| 335 | 47 | 96 | - | - | - | ||||
| USGS | Mw5.9 | 141 | 50 | 79 | - | - | - | ||
| 337 | 41 | 103 | - | - | - | ||||
| [64] | Mw5.9 | 134 | 43 | 68 | 24 | 20 | 0.45 | ||
| [12] | Mw5.9 | 141 | 40 | - | 9.1 | 4.2 | 0.3 (strkie slip)/0.1 (dip slip) | ||
| This study 1 | Mw5.9 | 142 | 44 | 73 | 9.4 | 7.7 | 0.61 | ||
| This study 2 | Mw5.9 | 139 | 41 | 78 | 8.3 | 7.2 | 0.57 | ||
| 2022/1/8 | GCMT | Mw6.7 | 104 | 82 | 1 | - | - | - | |
| 14 | 89 | 172 | - | - | - | ||||
| USGS | Mw6.6 | 104 | 88 | 15 | - | - | - | ||
| 13 | 75 | 178 | - | - | - | ||||
| [9] | TLSF 3 | Mw6.6 | 86 | 85.6 | 38 | - | - | 3.8 | |
| LLLF 4 | 105 | 85.6 | 38 | - | - | ||||
| [65] | TLSF 3 | Mw6.7 | 104 | 80 | 0 | 10 | 16 | 2.5 | |
| LLLF 4 | 109 | 80 | 5 | 20 | 16 | 3 | |||
| This study 1 | Mw6.6 | 108 | 80 | 5 | 24 | 14 | 3.5 | ||
| This study 2 | TLSF 3 | Mw6.7 | 89 | 82 | 6 | 7.6 | 6.3 | 2.7 | |
| LLLF 4 | 112 | 85 | 3 | 21 | 13 | 4 | |||
Disclaimer/Publisher’s Note: The statements, opinions and data contained in all publications are solely those of the individual author(s) and contributor(s) and not of MDPI and/or the editor(s). MDPI and/or the editor(s) disclaim responsibility for any injury to people or property resulting from any ideas, methods, instructions or products referred to in the content. |
© 2023 by the authors. Licensee MDPI, Basel, Switzerland. This article is an open access article distributed under the terms and conditions of the Creative Commons Attribution (CC BY) license (https://creativecommons.org/licenses/by/4.0/).
Share and Cite
Wang, J.; Ding, L.; He, J.; Cai, F.; Wang, C.; Zhang, Z. Research of Seismogenic Structures of the 2016 and 2022 Menyuan Earthquakes, in the Northeastern Tibetan Plateau. Remote Sens. 2023, 15, 742. https://doi.org/10.3390/rs15030742
Wang J, Ding L, He J, Cai F, Wang C, Zhang Z. Research of Seismogenic Structures of the 2016 and 2022 Menyuan Earthquakes, in the Northeastern Tibetan Plateau. Remote Sensing. 2023; 15(3):742. https://doi.org/10.3390/rs15030742
Chicago/Turabian StyleWang, Junyi, Lin Ding, Jiankun He, Fulong Cai, Chao Wang, and Zongkun Zhang. 2023. "Research of Seismogenic Structures of the 2016 and 2022 Menyuan Earthquakes, in the Northeastern Tibetan Plateau" Remote Sensing 15, no. 3: 742. https://doi.org/10.3390/rs15030742