Article

Responses of Stream Geomorphic Indices to Piedmont Fault Activity in the Northern Segment of the Red River Fault Zone

1
National Institute of Natural Hazards, Ministry of Emergency Management of China, Beijing 100085, China
2
State Key Laboratory of Earthquake Dynamics, Institute of Geology, China Earthquake Administration, Beijing 100029, China
3
Shanxi Taiyuan Continental Rift Dynamics National Observation and Research Station, Beijing 100029, China
*
Author to whom correspondence should be addressed.
Remote Sens. 2023, 15(4), 988; https://doi.org/10.3390/rs15040988
Submission received: 25 December 2022 / Revised: 6 February 2023 / Accepted: 8 February 2023 / Published: 10 February 2023
(This article belongs to the Special Issue Remote Sensing Perspectives of Geomorphology and Tectonic Processes)

Abstract

:
Based on a digital elevation model (DEM) and GIS technology, we extracted and analyzed stream geomorphic indices—such as the slope, relief degree of the land surface (RDLS), hypsometric integral (HI) and channel steepness index (ksn)—of the Cangshan Piedmont Fault, Fengyi–Dingxiling Fault and Midu Basin Margin Fault in the northern segment of the Red River Fault Zone. This work indicates that all the stream geomorphic indices show higher values, with the highest values along the Cangshan Piedmont Fault, followed by the Fengyi–Dingxiling Fault, and the lowest values along the Midu Basin Margin Fault, forming a decreasing trend from north to south. Based on lithology, climate and tectonics, we infer that neotectonic activity is the main factor controlling the development of the drainage geomorphology. The results show that the northern segment of the Red River Fault Zone is highly active and that the activity level shows a decreasing trend from north to south. The results of this study are consistent with previous conclusions that the overall activity of the Red River Fault Zone weakens from north to south, and the activity in the northern segment has been the most intense since the Late Pleistocene.

1. Introduction

The Sichuan–Yunnan rhomboidal block is one of the most complex, most deformed and most frequently seismically active regions in mainland China due to the joint action of the northeastward pushing of the Indian Block, the southeastward extrusion of plateau material and the blocking of the South China Block. Because of the particularity of its location, it has become a key area for researchers to study active tectonic and seismic monitoring and prediction [1,2,3,4,5,6,7]. The seismic activity is mainly distributed along the boundary fault zones of the active block, and strong earthquake ruptures tend to occur along faults in the range from NW–SE to SSE–NNW. The Red River Fault Zone, as the southwestern boundary of the Sichuan–Yunnan rhomboidal block, is an important large-scale fault zone cutting the Indochina Block and the Yangzi–South China block in southwestern China located at the front of the transverse extrusion deformation of the Qinghai–Tibet Plateau. It plays a key role in the extrusion, rotation and escape of continental masses on the southeastern margin of the Qinghai–Tibet Plateau. To date, almost all studies on the activity characteristics, uplift development and evolution of the Qinghai–Tibet Plateau and its dynamic mechanism are closely related to the study of the Red River Fault Zone [8,9,10,11,12,13,14,15,16]. The fault zone strikes NW–SE, is slightly convex to the southwest and is a large strike-slip fault zone with intense activity since the Quaternary period. In the neotectonic period, the fault zone experienced a transition from earlier large left-slip movement to later right-slip movement at approximately 5 Ma, and the right-slip distance since the start of the Quaternary Period amounts to approximately 7 km. The early large-scale left-lateral strike-slip motion was formed the Ailaoshan Shear Zone (ALSSZ), and the later right-slip motion is believed to be related to the southeastward extrusion of the Tibetan Plateau lithosphere [17,18,19,20,21,22,23,24,25,26,27,28]. Based on the geometric structure and activity of the Red River Fault Zone, previous authors divided it into three segments: the Eryuan–Maidu Fault (northern segment), the Juli–Dadoumen Fault (middle segment), and the Chunyuan–Hekou Fault (southern segment) [28,29,30,31,32]. In different segments of the fault zone, there is obvious heterogeneity in terms of activity intensity and activity timing.
The study of active tectonics focuses on the use of structural geomorphology to solve practical problems. However, it is difficult to retain geomorphic markers due to the weak preservation of the Quaternary sediments and the high erosivity of the geomorphic environment, and it is difficult to collect dating samples. The above reasons make it difficult to obtain information on structural deformation. The combination of tectonic, climatic and surface processes within active orogenic belts can lead to the formation of fluvial landscapes that record the history of tectonic–climatic evolution throughout geological time [33,34,35]. Stream geomorphic indices are a quantitative expression of the external morphological characteristics of the landforms formed by internal forces. They can be used as a basic survey tool to identify areas undergoing rapid tectonic deformation, and they can make up for the lack of geographical landmarks. In recent years, with the development of GIS and high-resolution digital elevation model (DEM) data, quantitative studies of fluvial landscapes using stream geomorphology indices to assess the status of neotectonic activity in the study area have achieved remarkable results in revealing information on tectonic activity based on stream geomorphology [36,37,38,39,40,41,42,43]. Previous studies have shown that the activity in the northern segment of the Red River Fault Zone has been stronger than that in the middle and southern segments since the Quaternary. The center of activity in the Late Holocene was located on the boundary fault between Dali and Midu in the northern section, with an increasingly older and weaker transition to the south [9,30,44,45]. The climate of the northern segment of the Red River Fault Zone is transtropical and subtropical, with mild and humid conditions. As a result of the large amount of rain, it is difficult to retain geomorphic markers, and the vegetation is well developed, which makes it difficult to collect effective dating samples. The regional climate characteristics make it difficult to study the activity in the northern section. In recent years, there have been many studies on the Red River Fault, but most of the work has been on the whole Red River Fault [6,7,46,47,48], and there are few studies on the specific activity of the northern section. One way to understand the activity characteristics of the northern segment is to identify spatial activity differences. This paper focuses on the northern segment, specifically the Cangshan Piedmont Fault, Fengyi–Dingxiling Fault and Midu Basin Margin Fault, and uses ArcGIS and MATLAB systems to extract and analyze the slope, relief degree of the land surface (RDLS), hypsometric integral (HI) and channel steepness index (ksn) of the fault. Additionally, direct evidence of spatial differences in the activity intensity of the northern segment of the Red River Fault Zone since the Late Pleistocene is obtained.

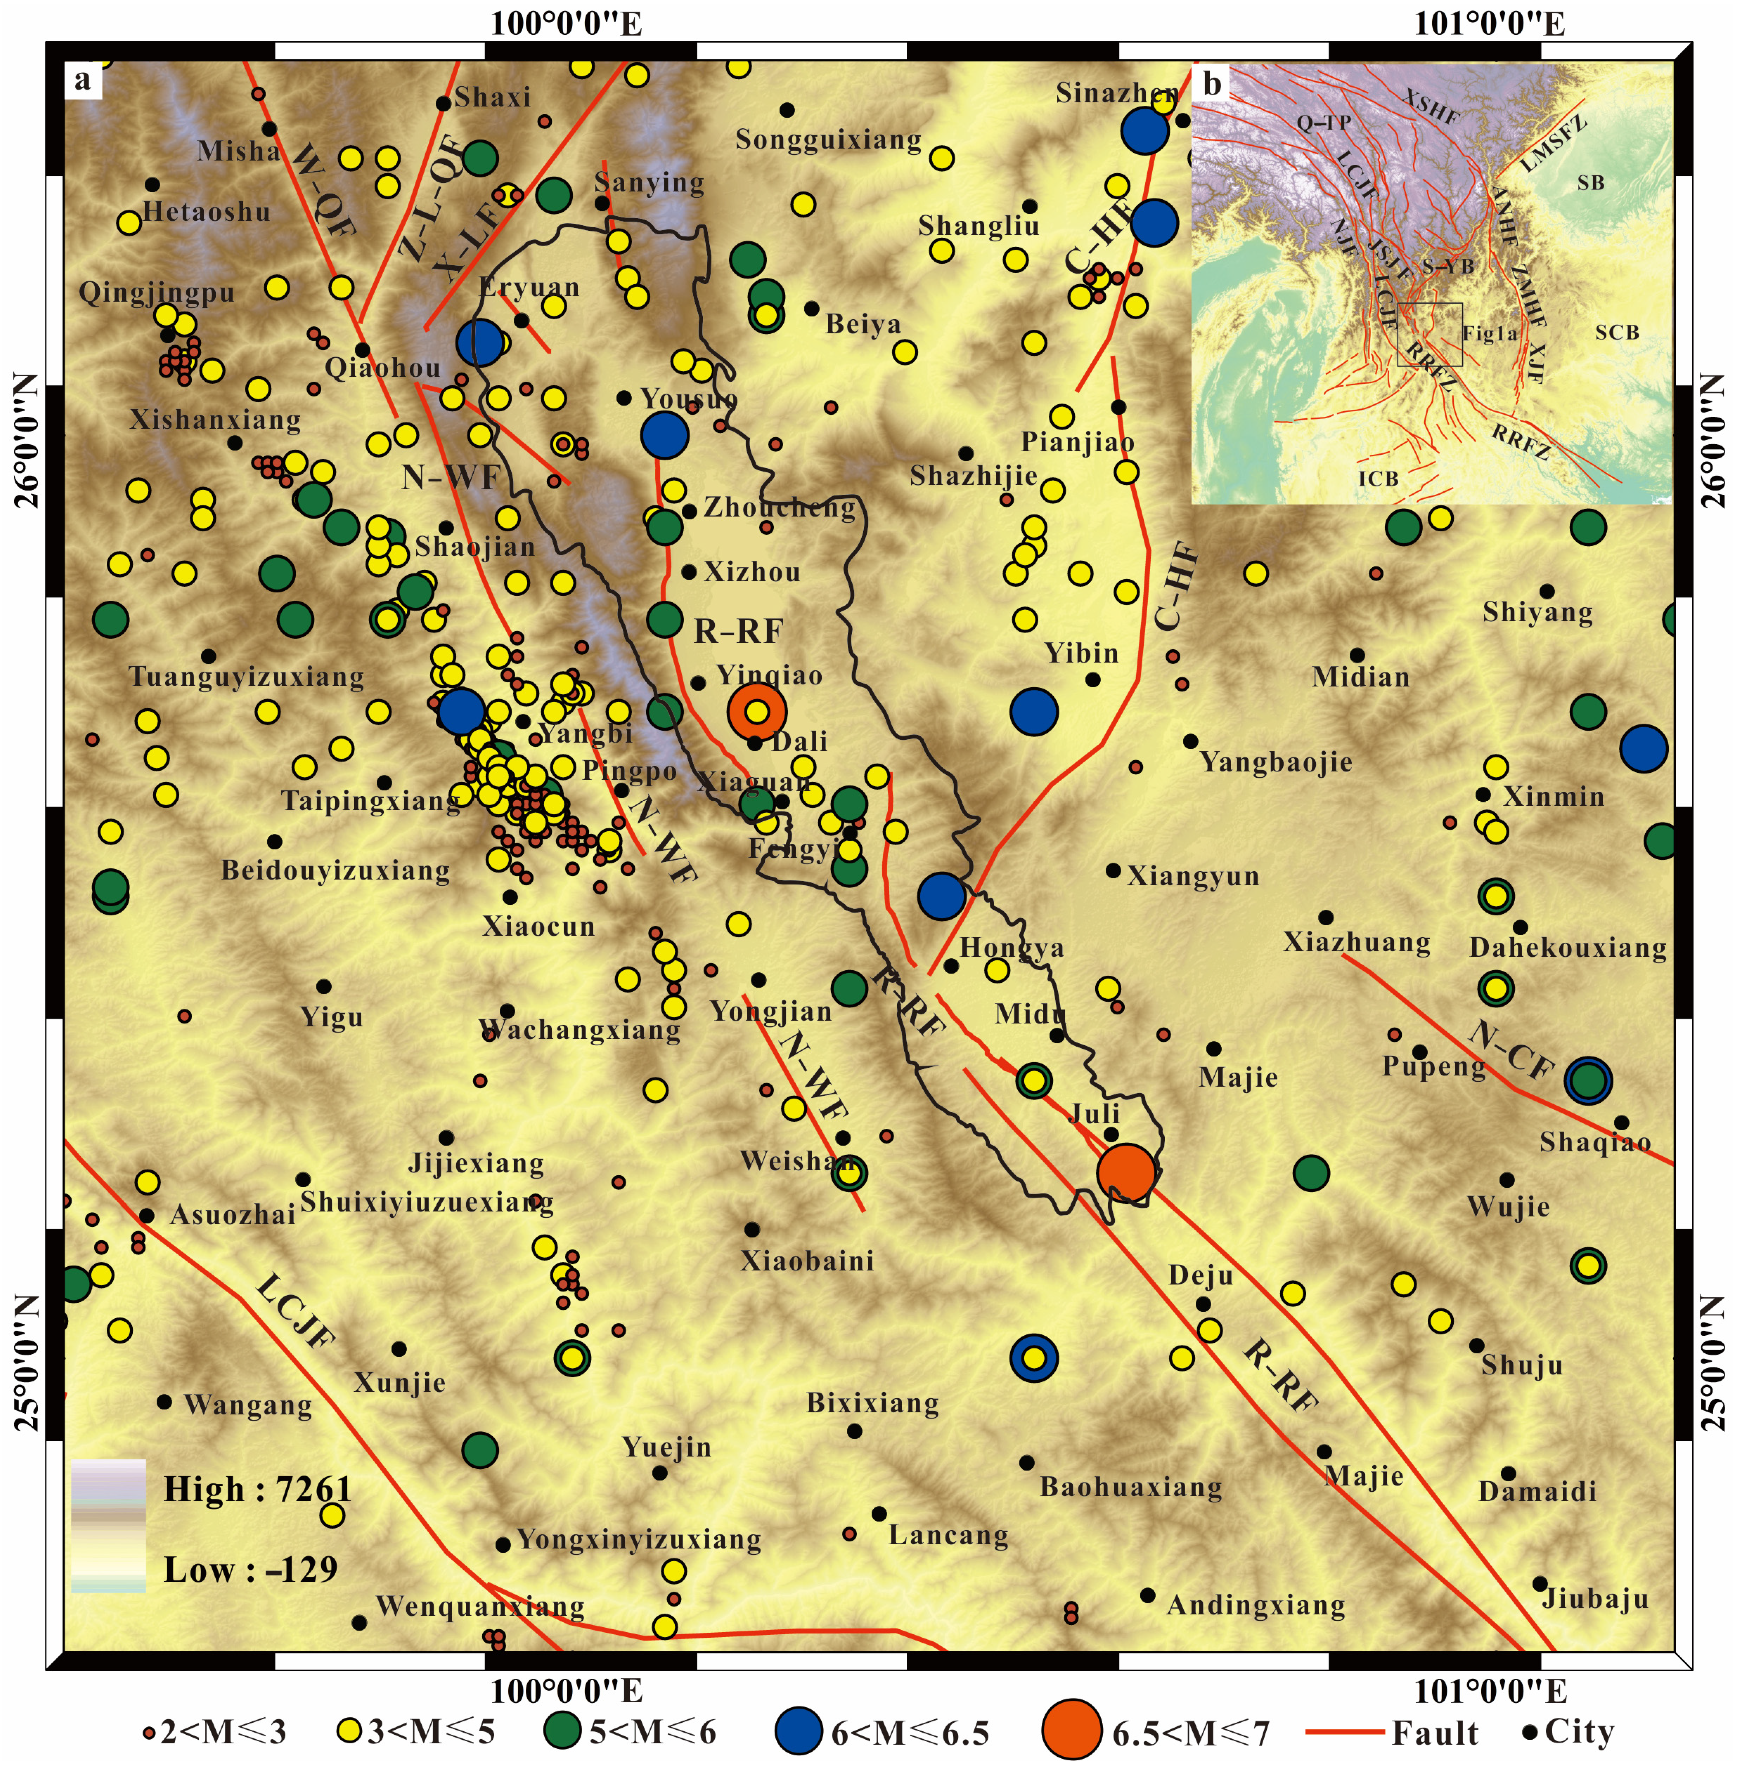
2. Regional Geological Overview

The northern segment of the Red River Fault Zone is a continental collision zone formed by the closure of the mid-Cenozoic Paleo-Tethys and Tethys Oceans [49,50]. This segment extends from Wanpotang in the north southeastward through Eryuan, Dali and Maidu to Juli, with a general strike of 332° and a length of approximately 135 km. Due to the right-slip migration of the eastern block of the fault zone, a mass-loss zone is present at its northern end, resulting in the formation of a extensional section in the northern segment with mainly vertical dislocation. This zone consists of a series of right-slip and normal faults with large extensional components, and the basins, in order from northwest to southeast, include the Eryuan Basin, Dali Basin, Fengyi Basin, Maidu Basin and the right-slip faults between the basins with a northwest to north-northwest orientation. The fault bundles are parallel but discontinuously distributed and arranged in a left-stepping en echelon arrangement with each other, and most of them correspond to the boundaries of the faulted basins (Figure 1a and Figure 2). The interconnection, transformation and transition between extension and shear are the basic features of the structure and dynamics of the basin and range topography along the northern segment [9,30,51,52]. According to the differences in the small-scale structure and the nature and timing of the fault activity, the northern segment of the Red River Fault Zone can be divided into four secondary segments from northwest to southeast—namely, the Wanpotang–Jiangwei segment, the Zhoucheng–Xiaguan segment, the Fengyi–Dingxiling segment and the Hongyan–Juli segment. The Wanpotang–Jiang segment mainly refers to the Eryuan Fault F1 (Figure 2), which is mainly distributed in the Eryuan Basin area. The Zhoucheng–Xiaguan segment mainly refers to the Dali faulted basin segment, including the Erhai region, which is the most intensely rifted area of the Red River Fault since the Quaternary, with a vertical dislocation of 3.2 km and some right-lateral dislocation. The Cangshan Piedmont Fault F2 (Figure 2) is the segment with the most intense and latest activity in the Red River Fault Zone, with the northern portion exhibiting the youngest activity with an age of 500 a B.P. The Fengyi–Dingxiling segment F3 (Figure 2) consists of the basin section along the eastern boundary of the Fengyi Basin and the mountainous section north of Dingxiling. The activity age and nature vary among the different sections, with ongoing normal faulting dominating in the basin section and strike-slip motion dominating in the canyon section. The Hongyan–Juli segment includes the Midu Basin, a wedge-shaped basin that opens to the northwest, and the Midu Basin Margin Fault F4 in this segment is the southwestern boundary of the Midu Quaternary Basin (Figure 2), which generally shows a right-lateral dislocated normal strike-slip fault section. According to the regional tectonic-geomorphological features, it is inferred that the last rupture may have occurred in the Late Holocene [30]. In the Late Holocene, the activity center of the Red River Fault Zone was located on the boundary fault between Dali and Midu—that is, corresponding to the three sections of the Cangshan Piedmont Fault, Fengyi–Dingxiling Fault and Midu Basin Margin Fault [30]. Considering the lack of development of bedrock rivers near the Eryuan Fault, this paper focuses on the analysis of the three boundary faults from Dali to Midu, while the Eryuan Fault is not analyzed.

3. Data and Methods

The data used in this paper are 12 m resolution TanDEM-X data. The TanDEM-X project is funded by DLR (Deutsches Zentrum fur Luft- und Raumfahrt, the German space agency) in partnership with Airbus Defence and Space. TanDEM-XDEM data are produced by a binary system consisting of the TerrasAR-X (TSX) and TanDEM-X (TDX) satellites, with an orbit altitude of 515 km and an inclination angle of 97.44°. The onboard synthetic aperture radar (SAR) is used for Earth observation. The elevation reference of the DEM data is the ellipsoid height, and the reference ellipsoid is WGS84. TanDEM-X DEM data are available at resolutions of 0.4 arcsecond (12 m), 1 arcsecond (30 m), and 3 arcsecond (90 m). Currently, only 90 m resolution data are available for download through registration. However, the 12 m high-resolution data adopted in this paper can be downloaded after submitting an application at https://tandemx-science.dlr.de, accessed on 3 June 2022.
Based on the DEM data, the extraction of streams and drainage basins was carried out using ArcGIS and MATLAB, and then the stream geomorphic indices were calculated. The ksn is derived from slope–area regression and has been widely used to probe areas affected by different rates of rock lift [35]. Since ksn utilizes the response of bedrock rivers to tectonic uplift, non-bedrock channels (colluvial channels) at the source of the streams should be excluded before statistical analysis. Finally, 75 streams along the Cangshan Piedmont Fault, Fengyi–Dingxiling Fault and Midu Basin Margin Fault and their drainage basins in the bedrock area were retained (Figure 2), including 36 along the Cangshan Piedmont Fault, and the streams were numbered from north to south as R1, R2, …, R36. Correspondingly, the drainage basin number of the bedrock area where the streams were located were labeled S1, S2, …, S36. The 20 streams along the Fengyi–Dingxiling Fault were labeled R37, R38, …, R56, and the drainage basins in the bedrock area associated with these streams were labeled S37, S38, …, S56. The 19 streams along the Maidu Basin margin were labeled R57, R58, …, R75 from north to south, and the basins in the bedrock area associated with these streams were labeled S57, S58, …, S75. Subsequently, a variety of stream geomorphic indices were extracted. Slope, relief degree of the land surface (RDLS) and hypsometric integral (HI) were extracted by ArcGIS, while ksn was obtained by MATLAB based on the program compiled by Schwanghart et al. [36,37]. Finally, the main factors affecting the stream geomorphic indices were comprehensively analyzed, and the response of the piedmont geomorphology of the Cangshan Piedmont Fault, Fengyi–Dingxiling Fault and Midu Basin Margin Fault to the active structure in the northern Red River Fault was quantitatively analyzed in combination with the geological and structural background of the region.

3.1. Slope and Relief Degree of the Land Surface (RDLS)

Slope and RDLS are traditional topographic analysis indices [53]. Slope refers to the angle of slope of the ground, which can generally be obtained from DEM data through the relationship between a raster point and the eight neighboring points (referred to as the D8 algorithm) and is often used as a reference index of tectonic and geomorphic conditions in bedrock mountainous areas. The slope has a certain critical value, approximately 30° [54]; beyond this value, it will not increase with increasing erosion rate [54,55,56]. The RDLS is the difference between the maximum and minimum elevations in a certain area, which can indirectly reflect the strength of tectonic activity [57]. A bedrock mountain drainage basin can have a variety of reliefs [55], and local relief is commonly used in regional analysis. The local relief is obtained by calculating the difference between the maximum elevation and the minimum elevation in a certain area around each grid point. In recent years, slope and RDLS have been widely used as geomorphic indicators to reflect regional tectonic activity [42,43,58,59].

3.2. Hypsometric Integral (HI)

The HI is very sensitive to neotectonic activity and has been widely used in the study of neotectonic movement and geomorphic development because it can quantitatively reflect the relationship between geomorphic evolution and tectonic uplift [40,60,61]. According to the geomorphic erosion cycle theory of Davis [62], geomorphic evolution can be divided into the juvenile stage, prime stage and old stage. The corresponding drainage area HI curves show an upward convex type, S type and downward concave type, and the HI obtained by the drainage area HI curve decreases from high to low. When the geomorphic development is in the juvenile stage (HI > 0.6), the terrain is flat, the ground slope is low and the tectonic activity is intense. When the geomorphic development enters the prime period (0.35 < HI ≤ 0.6), the land is the most rugged, the terrain is the most fragmented, the river network is the most developed, the slope reaches the maximum and the tectonic activity is mild. After the landform enters the old stage (HI ≤ 0.35), the terrain gradually returns to a flat state, the slope decreases and the tectonic activity is weak [63,64]. If a region has active tectonics and strong uplift, it is difficult for geomorphic evolution to reach a balance. Strong uplift often makes the development stage of the drainage basin stay in the juvenile or prime stage, and the HI value tends to be high [65]. In practical studies, the HI value of a drainage basin is often simply obtained by the substitution algorithm of Pike and Wilson [66], namely:
H = ( H m e a n H m i n ) / ( H m a x H m i n ) ,
In Equation (1), Hmax, Hmean and Hmin are the maximum, average and minimum elevation values in a basin, respectively.

3.3. Channel Steepness Index (ksn)

In orogenic belts with intense tectonic uplift, bedrock channels are common, and the geomorphic landscape caused by river erosion in bedrock channels can reflect the process of river erosion [34,67]. The ksn, derived from the slope–area regression, can be used as a reference to assess deviations in channel steepness from ideal conditions in which the river is in equilibrium, as streams experiencing intense tectonic activity become steeper. Therefore, the value of ksn can be used to quantitatively judge the tectonic activity [56,68,69]. Generally, the presence of high ksn values can indicate areas strongly affected by tectonic activity. Streams in such areas have steep gradients and thus exhibit high ksn values, indicating a high regional tectonic uplift rate. In contrast, areas with low ksn values are associated with low tectonic uplift rates [34,57,70,71,72]. The relationship in Formula (2) is consistent with the earlier conceptual model in Formula (3) [73].
S = ( U K ) 1 n   A   ( x ) m n ,
If ks =   ( U K ) 1 n , and m n = θ , this equation can be expressed as:
S = k s A θ
In Equation (2), U is the uplift rate of bedrock; K is the erosion coefficient; A is the convergence area; m is the area index; and n is the slope index, which depends on the specific erosion process. In Equation (3), S is the channel hydraulic gradient (also known as the river slope); ks is the channel steepness index; A is the confluence area, which refers to all the confluence areas above a certain point in the river; and θ is the convexity index, which describes the degree of convexity of the channel profile.

4. Results

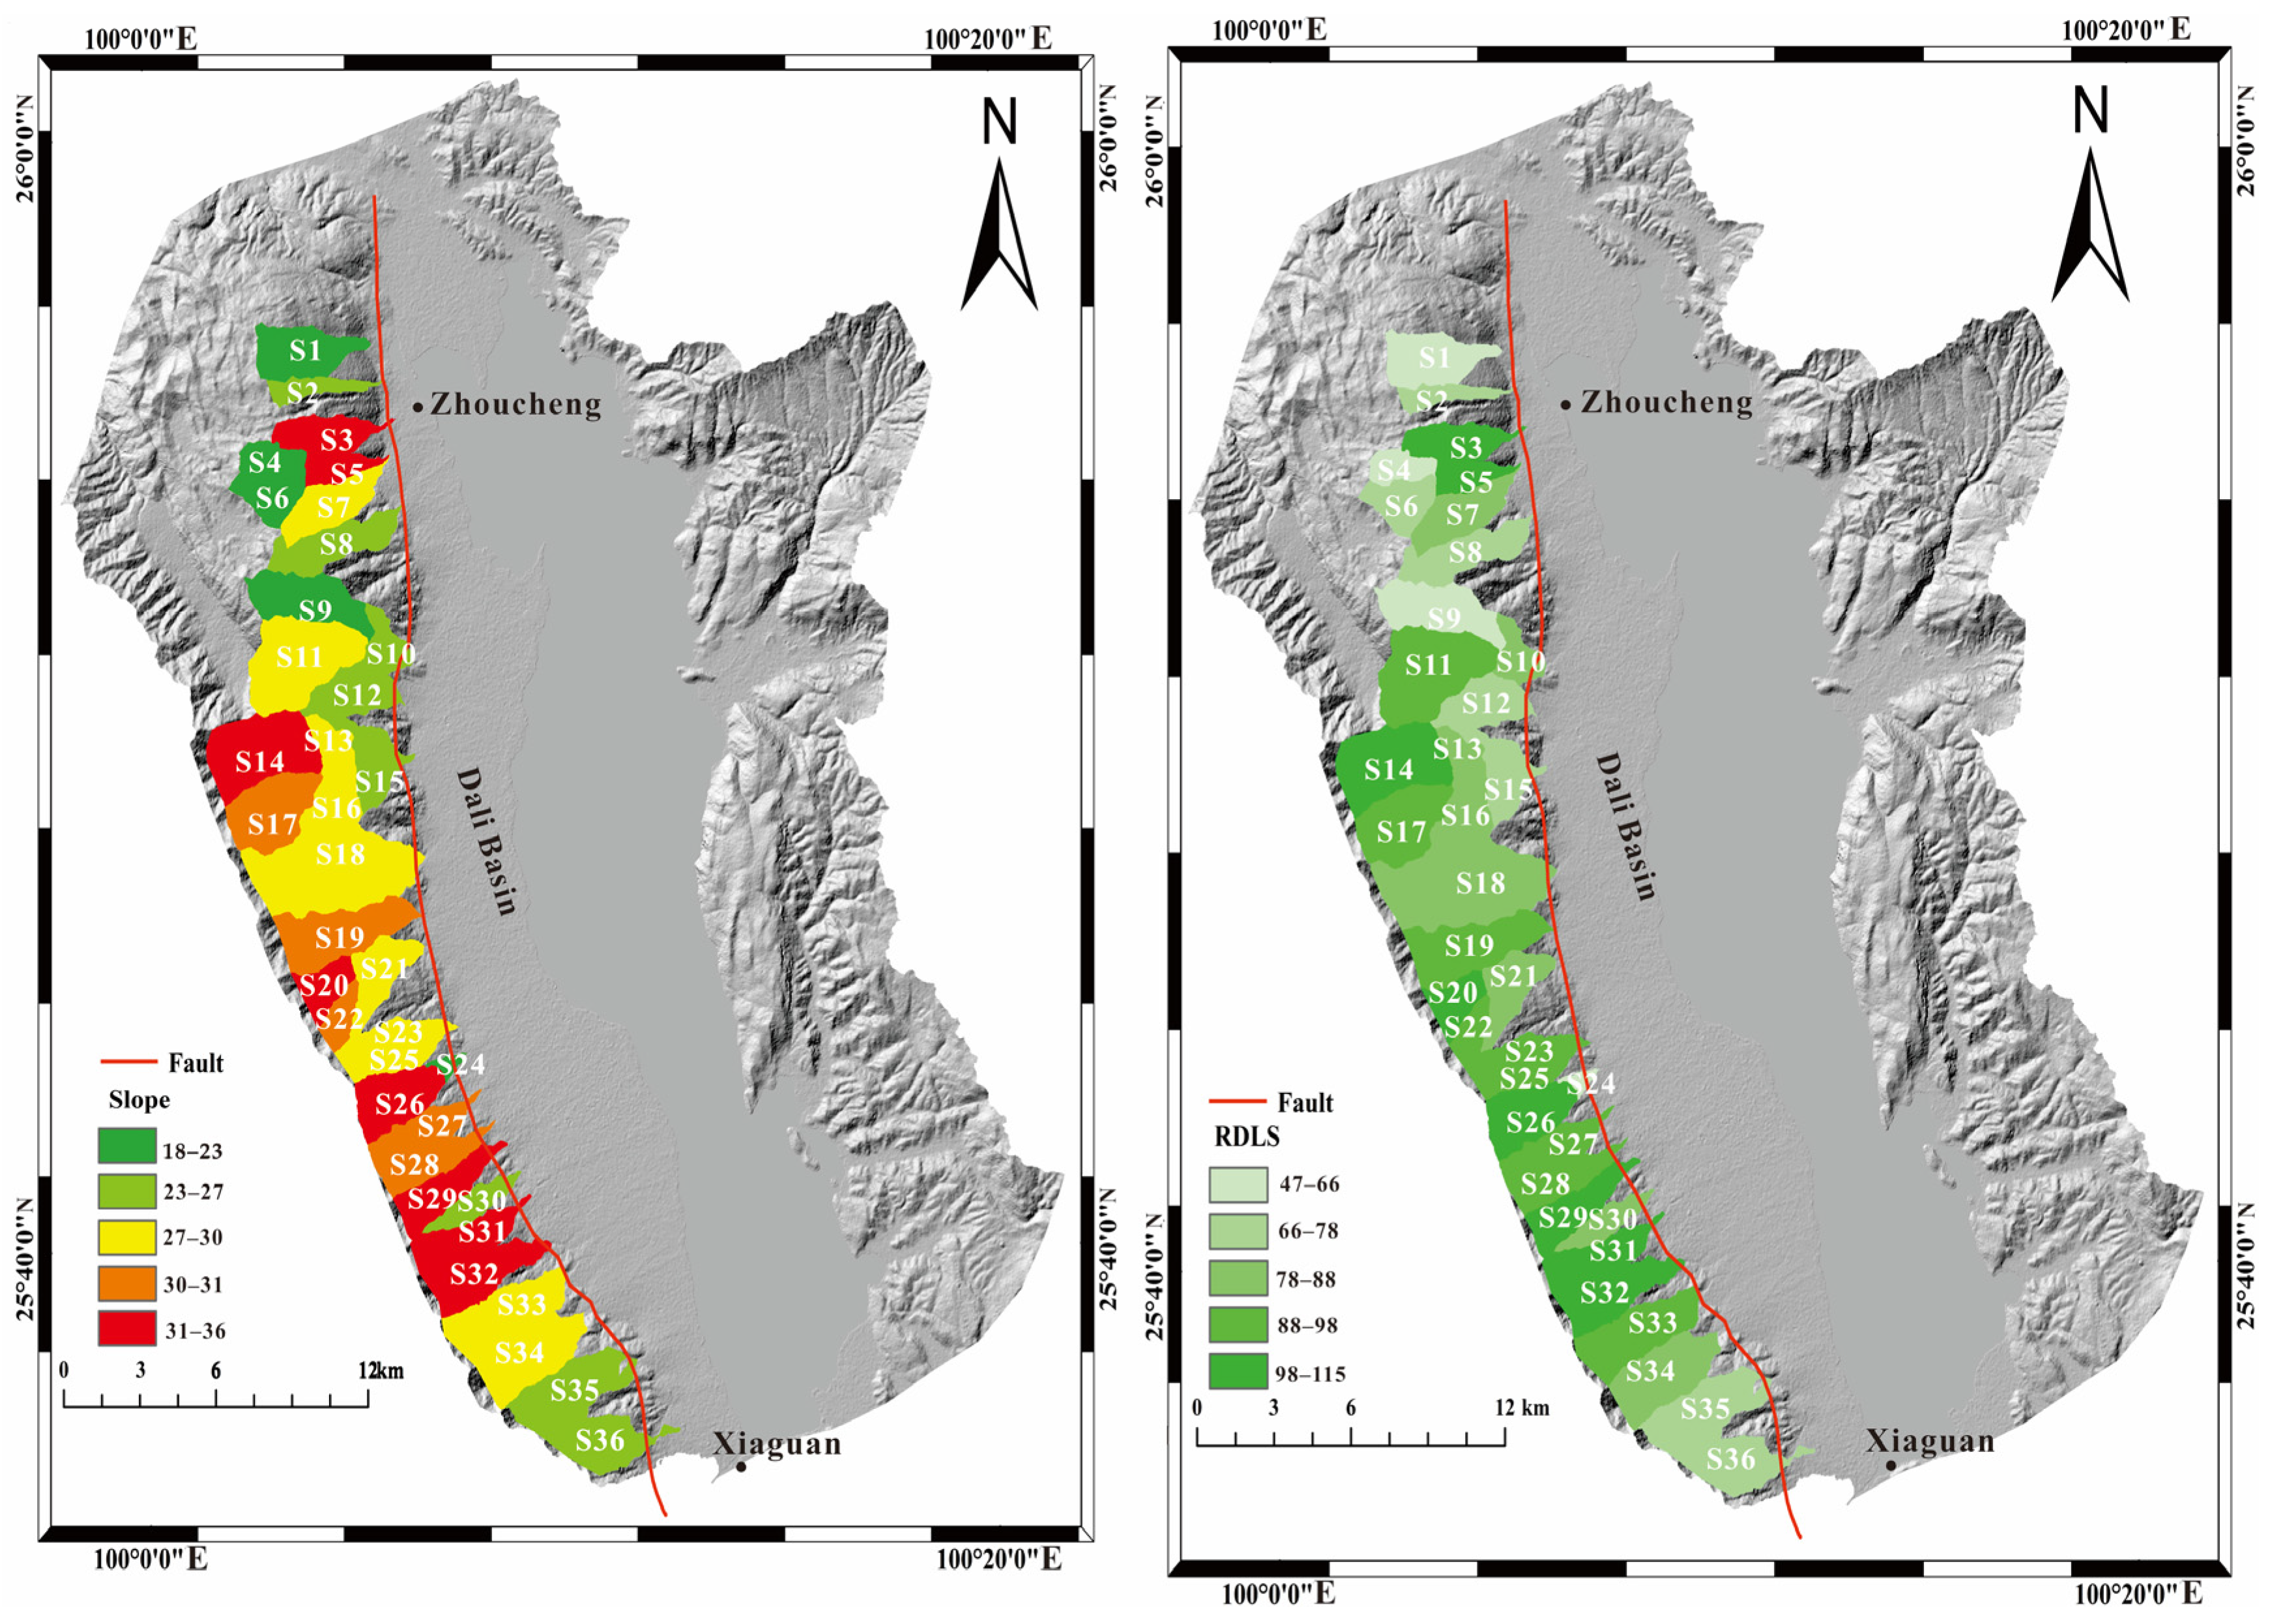
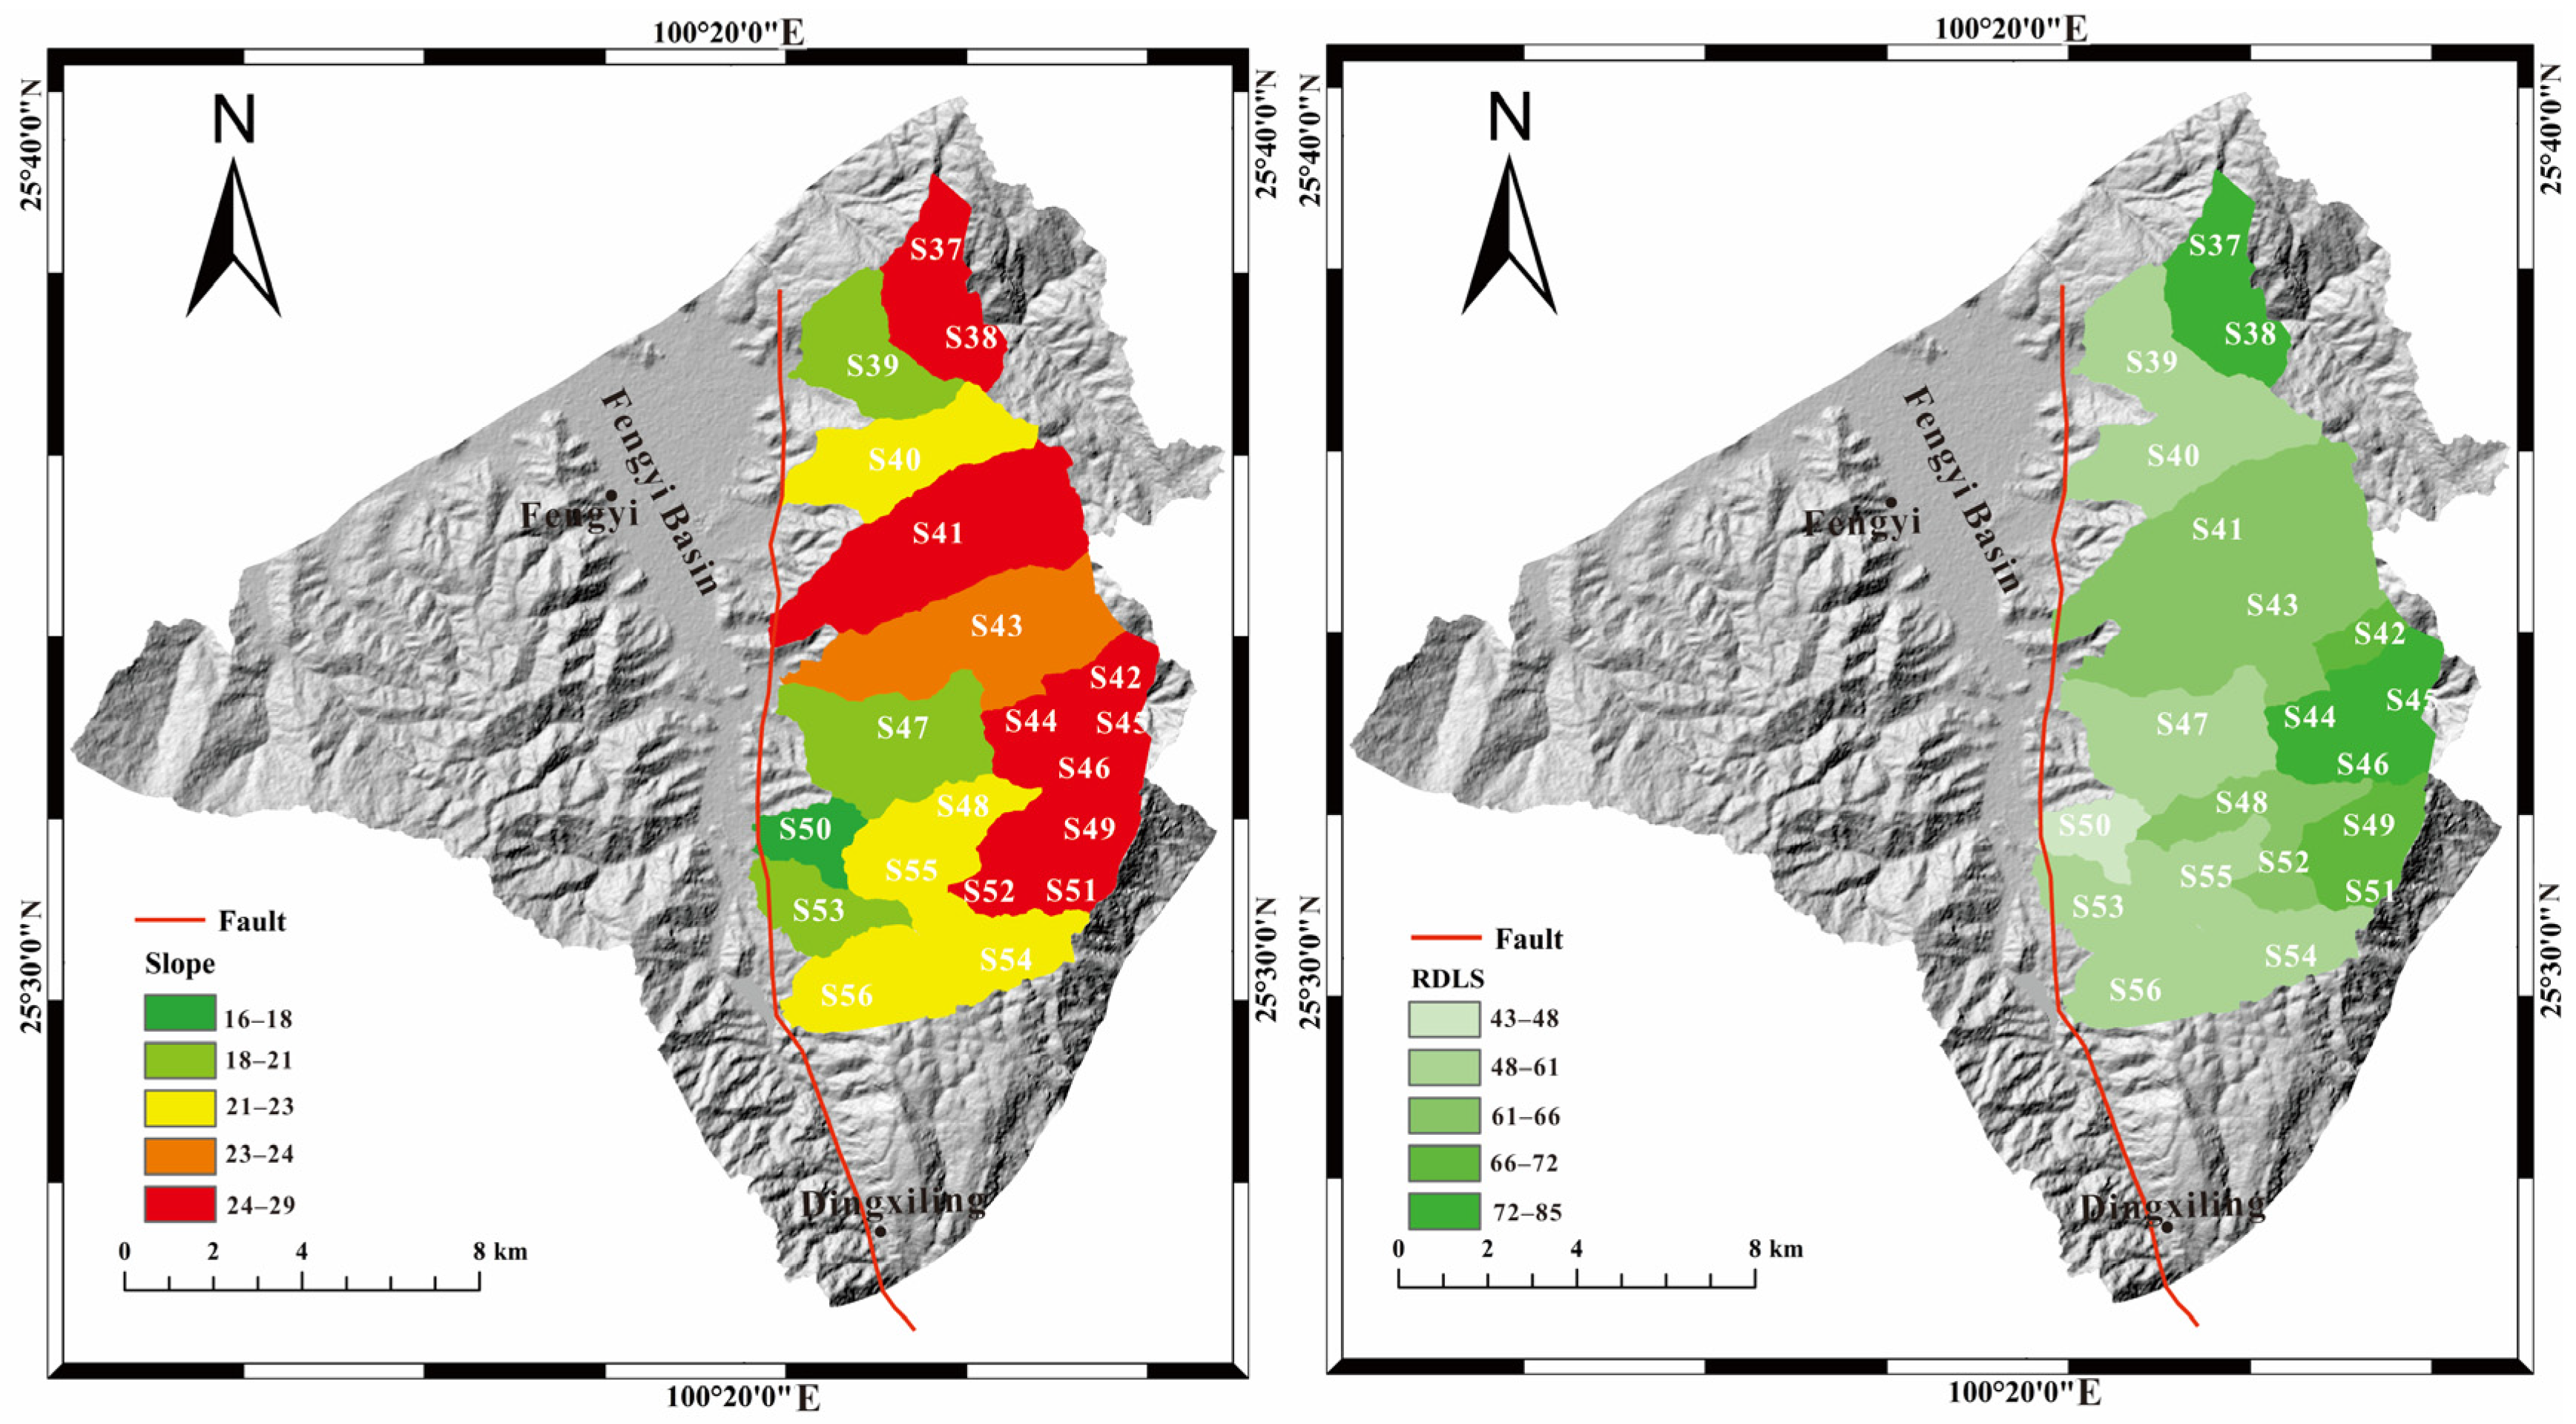
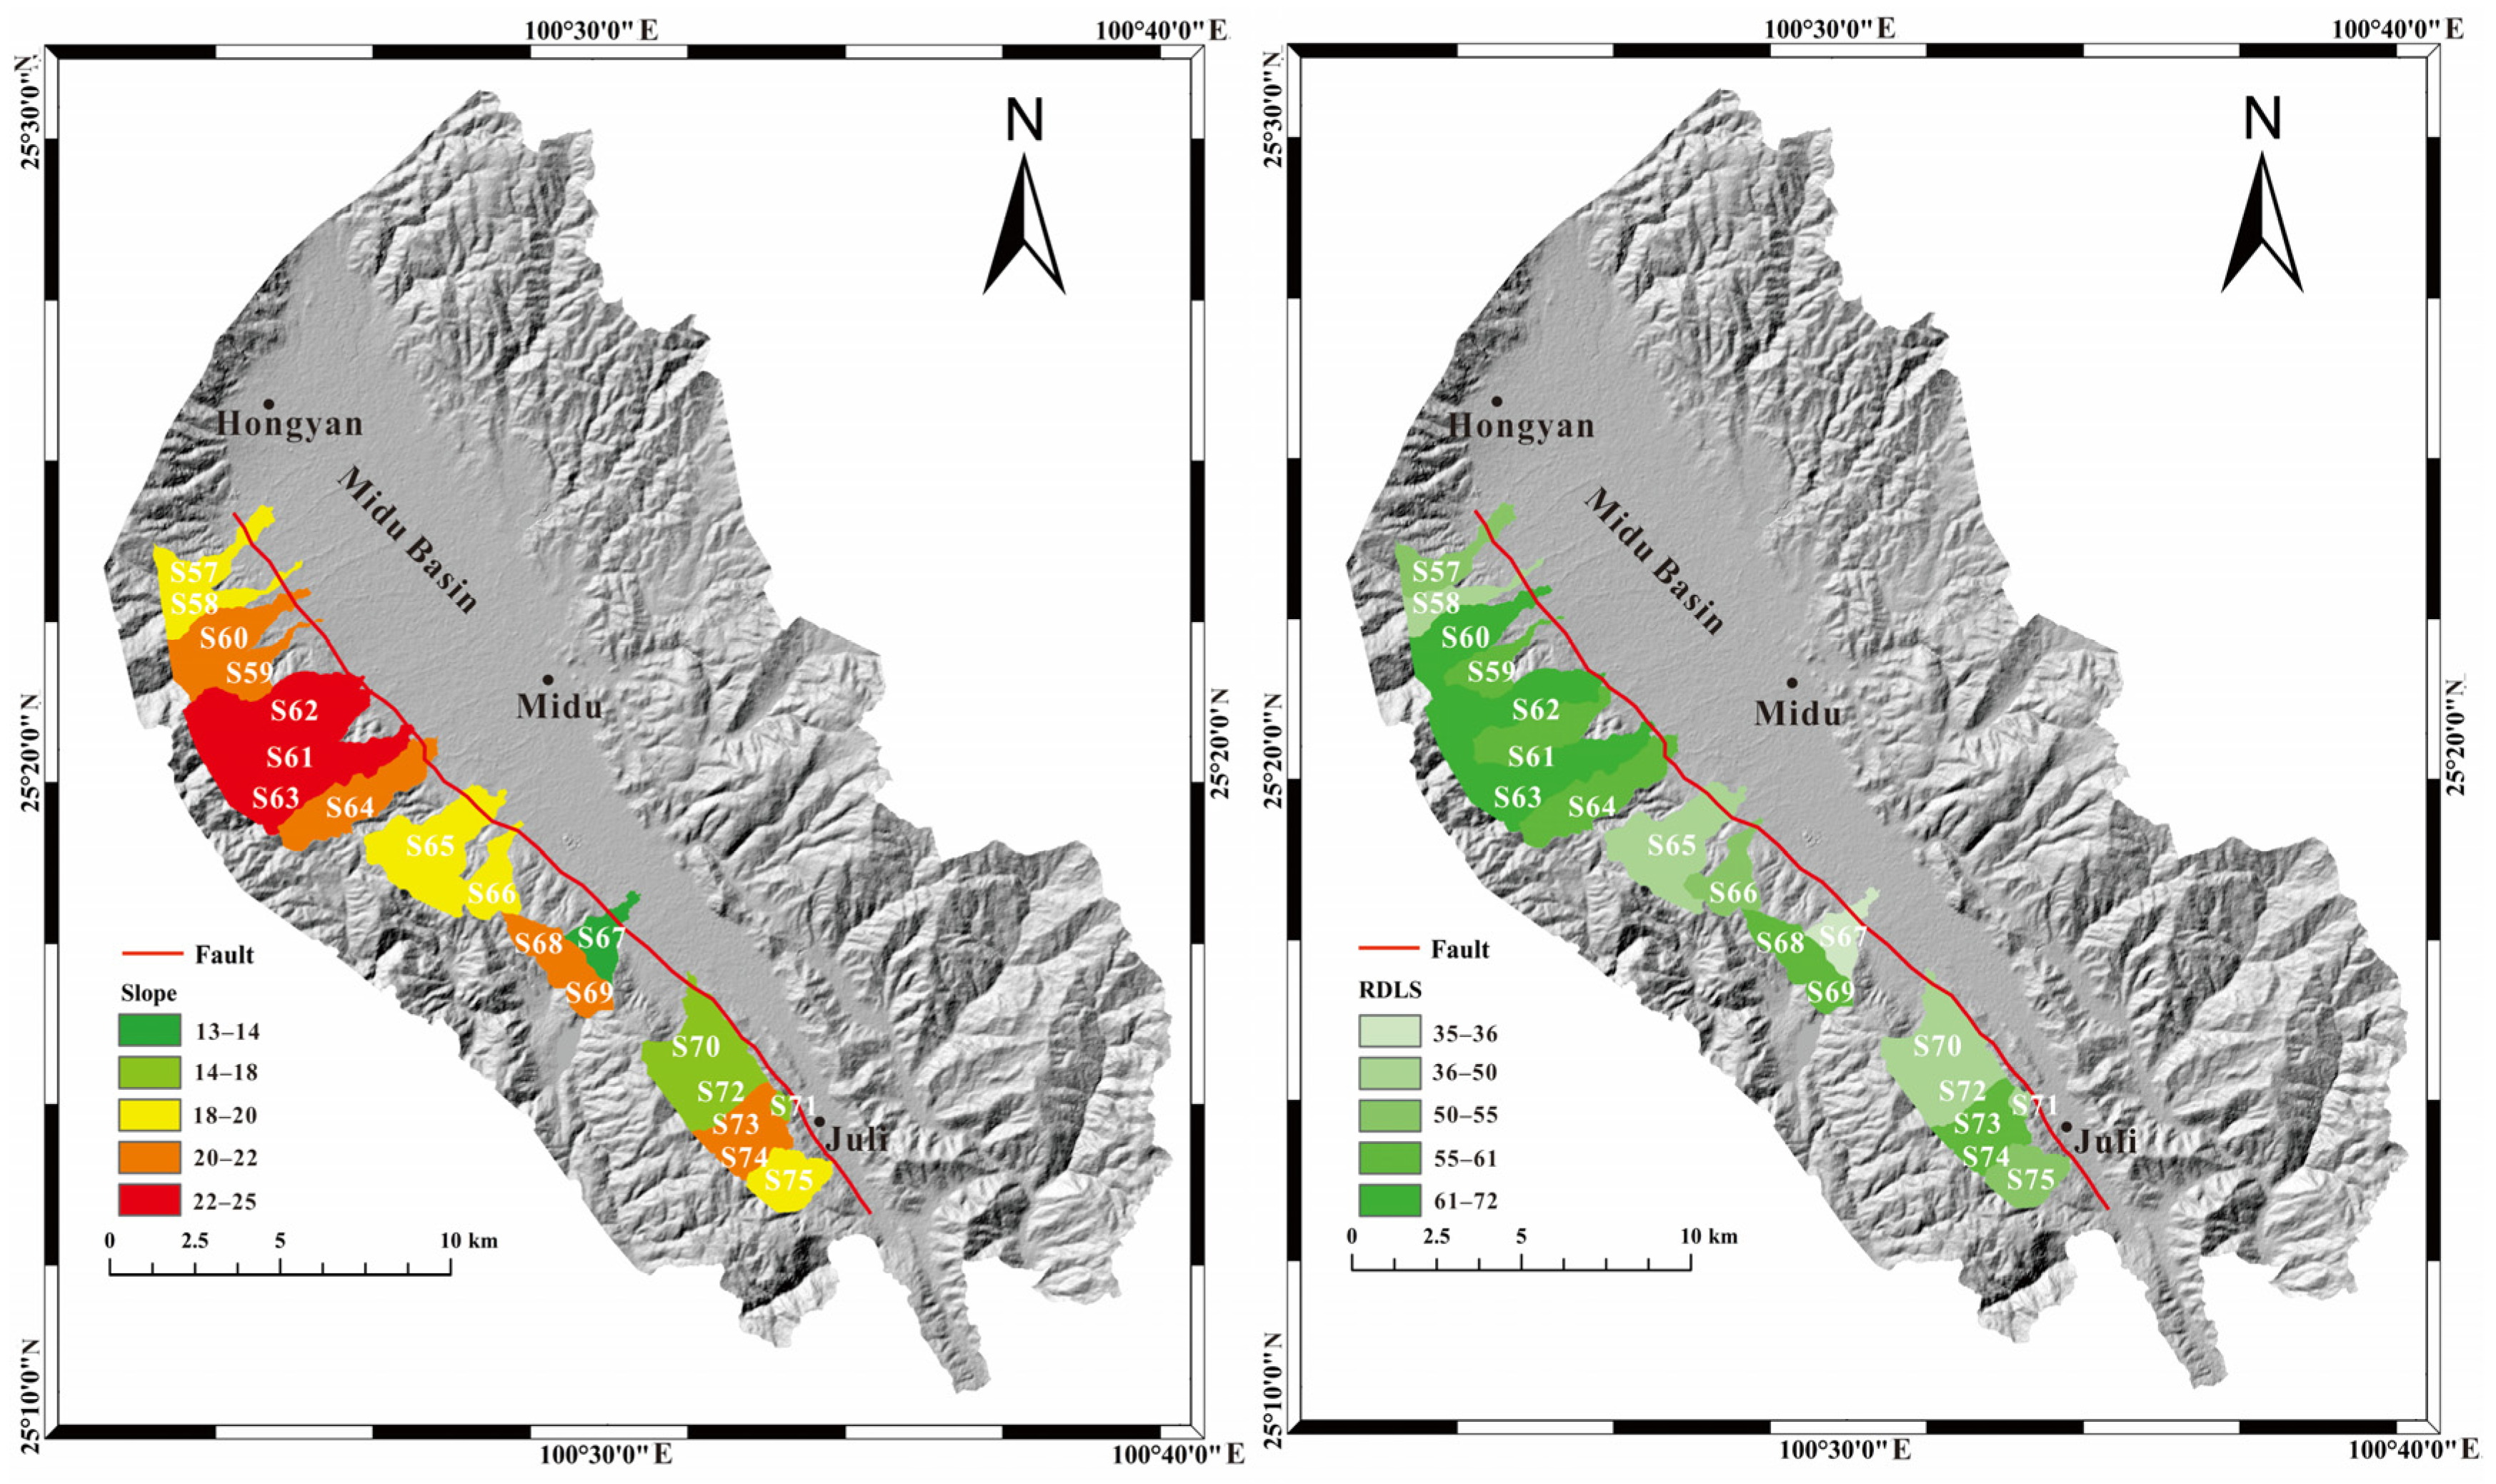
4.1. Slope and Relief Degree of the Land Surface (RDLS)

Figure 3 shows the spatial distributions of the slope and RDLS. The slope and RDLS results clearly show the characteristics of the basin and range structure in the northern segment of the Red River Fault Zone, and the spatial distributions of the slope and RDLS show a relatively high consistency. The difference between the basin and mountain regions is obvious; that is, the values of slope and RDLS are smaller in the basin sections and higher in the mountain sections. To further compare the slope and RDLS of each secondary fault, the drainage basins extracted along the Cangshan Piedmont Fault, Fengyi–Dingxiling Fault and Midu Basin Margin Fault were used to calculate regional statistical average slope values and regional statistical average RDLS values. Figure 4 shows that the average slope value of the Cangshan Piedmont Fault ranges from 18 to 36, and the average RDLS ranges from 47 to 115. According to Figure 5, the average slope value of the Fengyi–Dingxiling Fault is between 16 and 29, and the average RDLS is between 43 and 85. Figure 6 shows that the average slope value of the Midu Basin Margin Fault ranges from 13 to 25, and the average RDLS ranges from 35 to 72. By comparison, the average slope value and the average RDLS value of the Cangshan Piedmont Fault are the highest, followed by those of the Fengyi–Dingxiling Fault, and those of the Midu Basin Margin Fault are the lowest, which indirectly reflects the trend of decreasing activity from north to south in the northern segment.

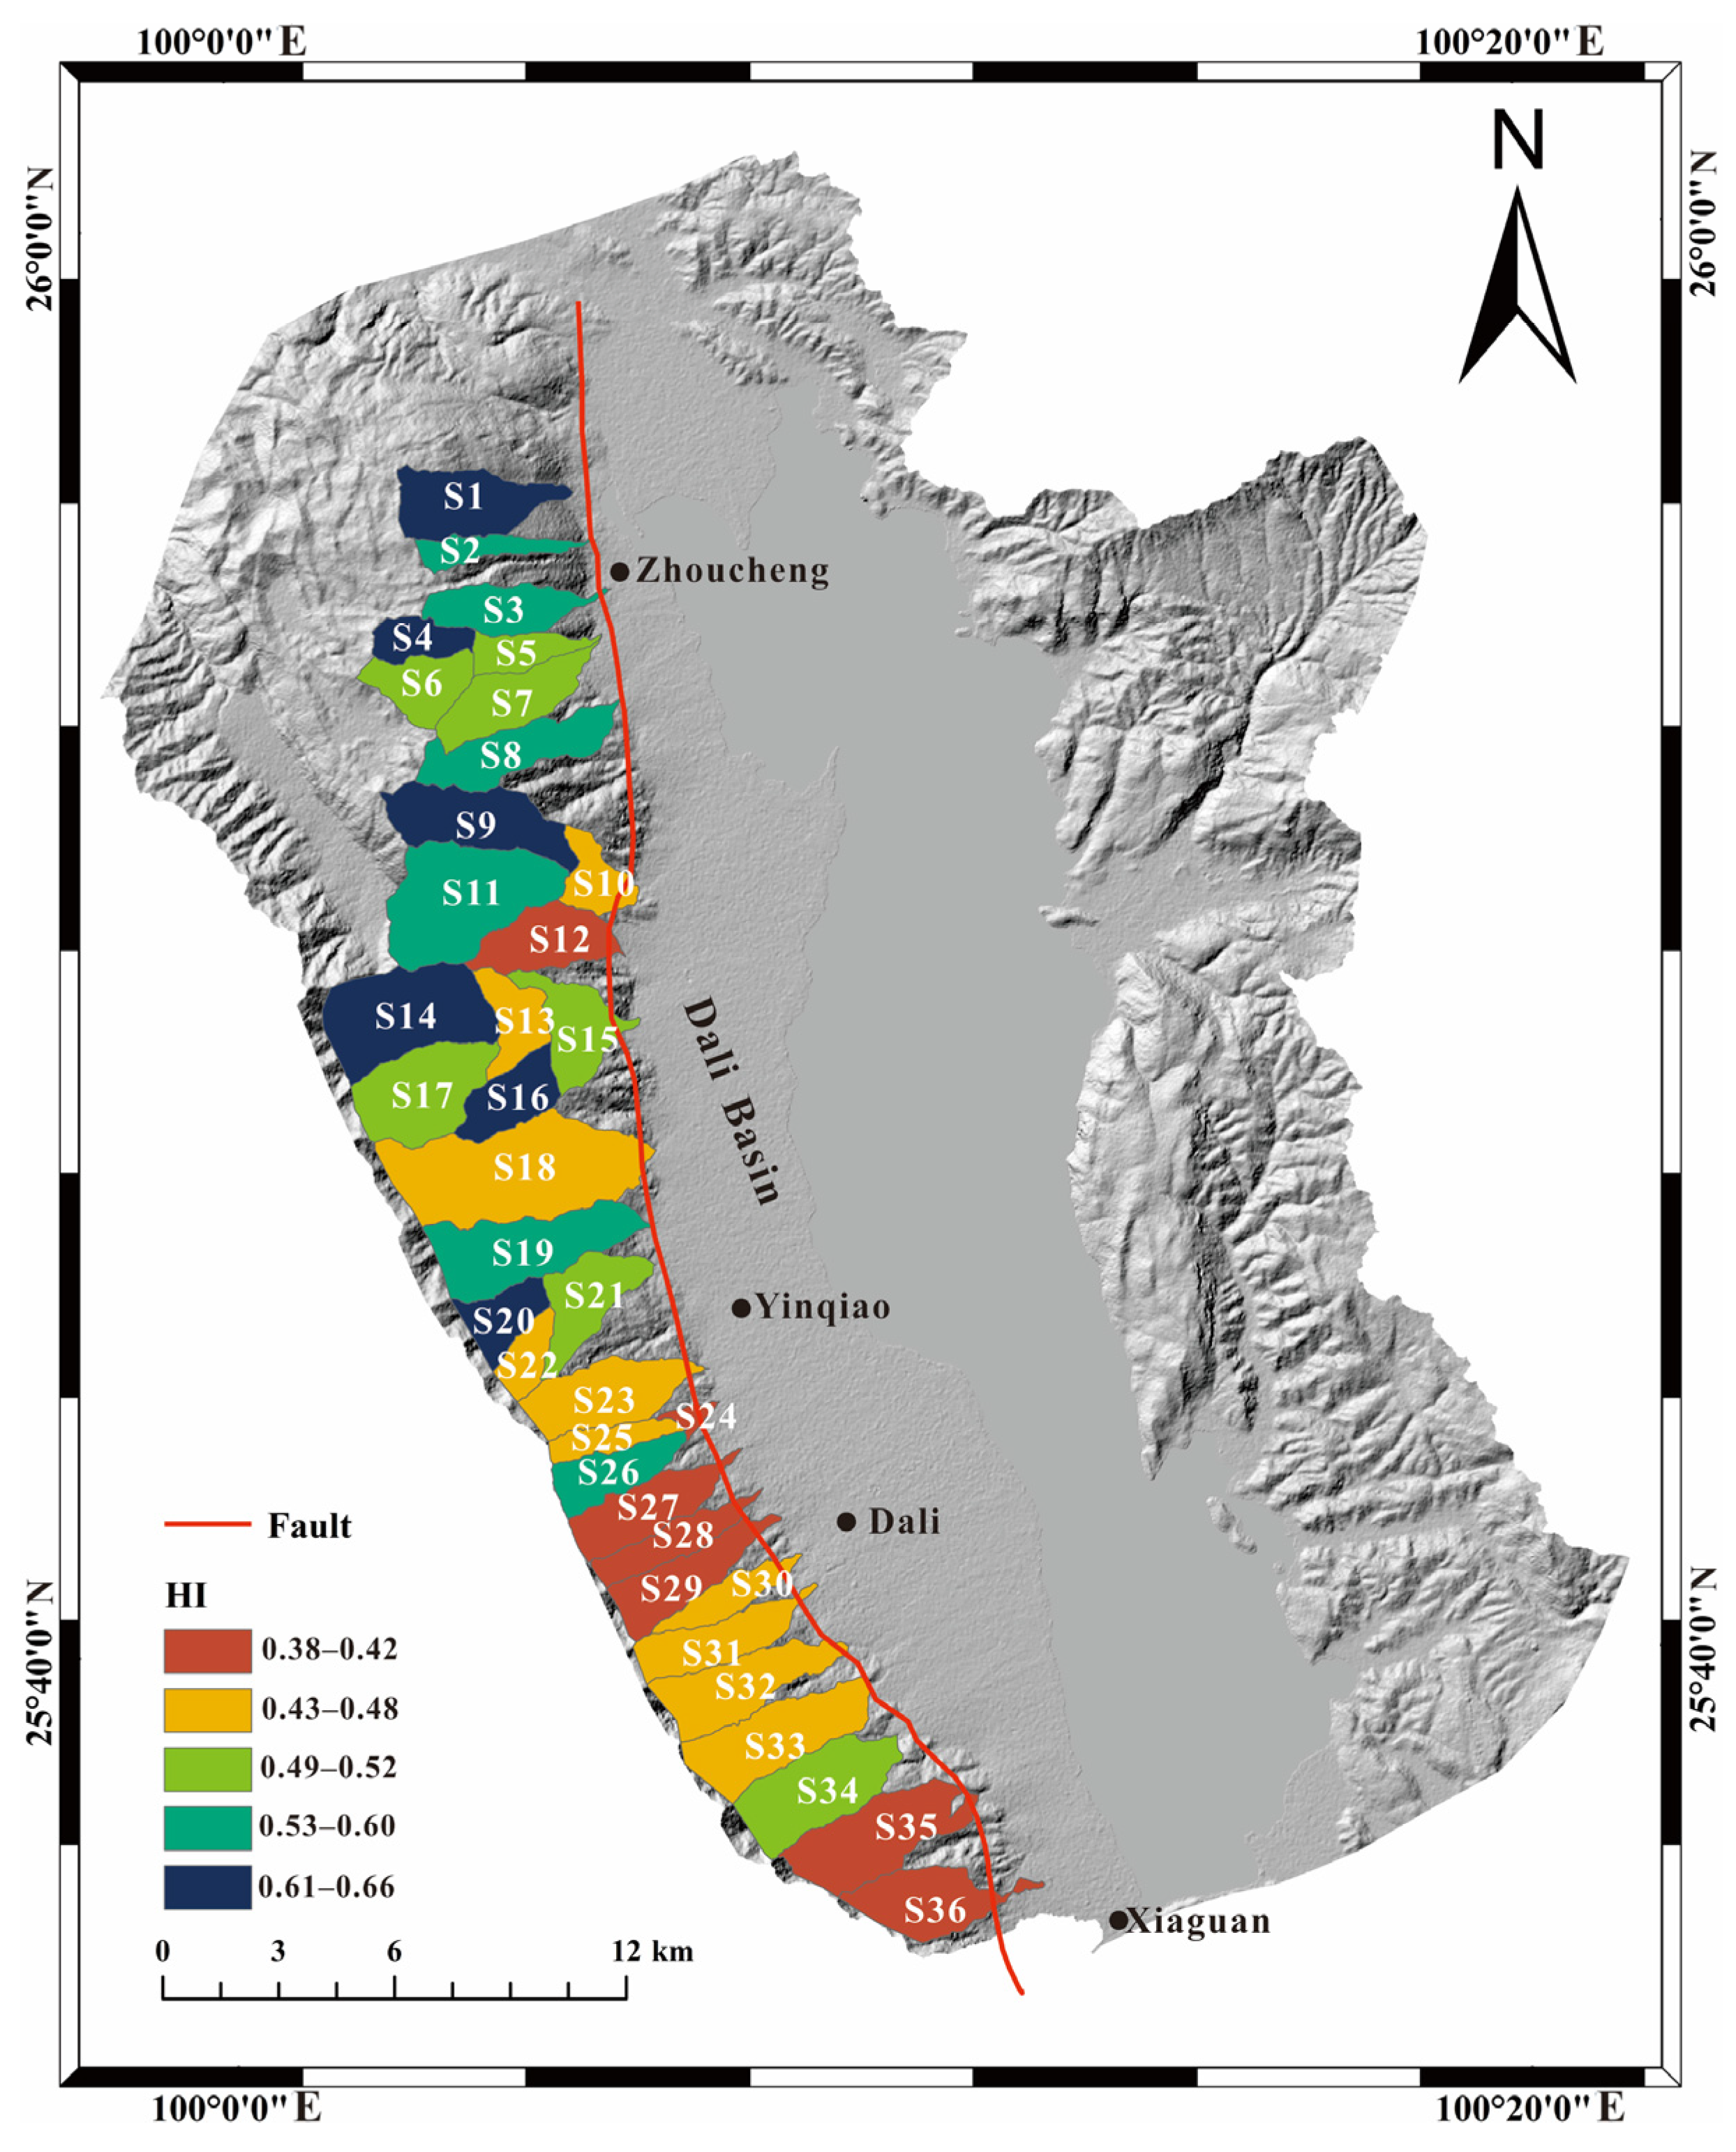
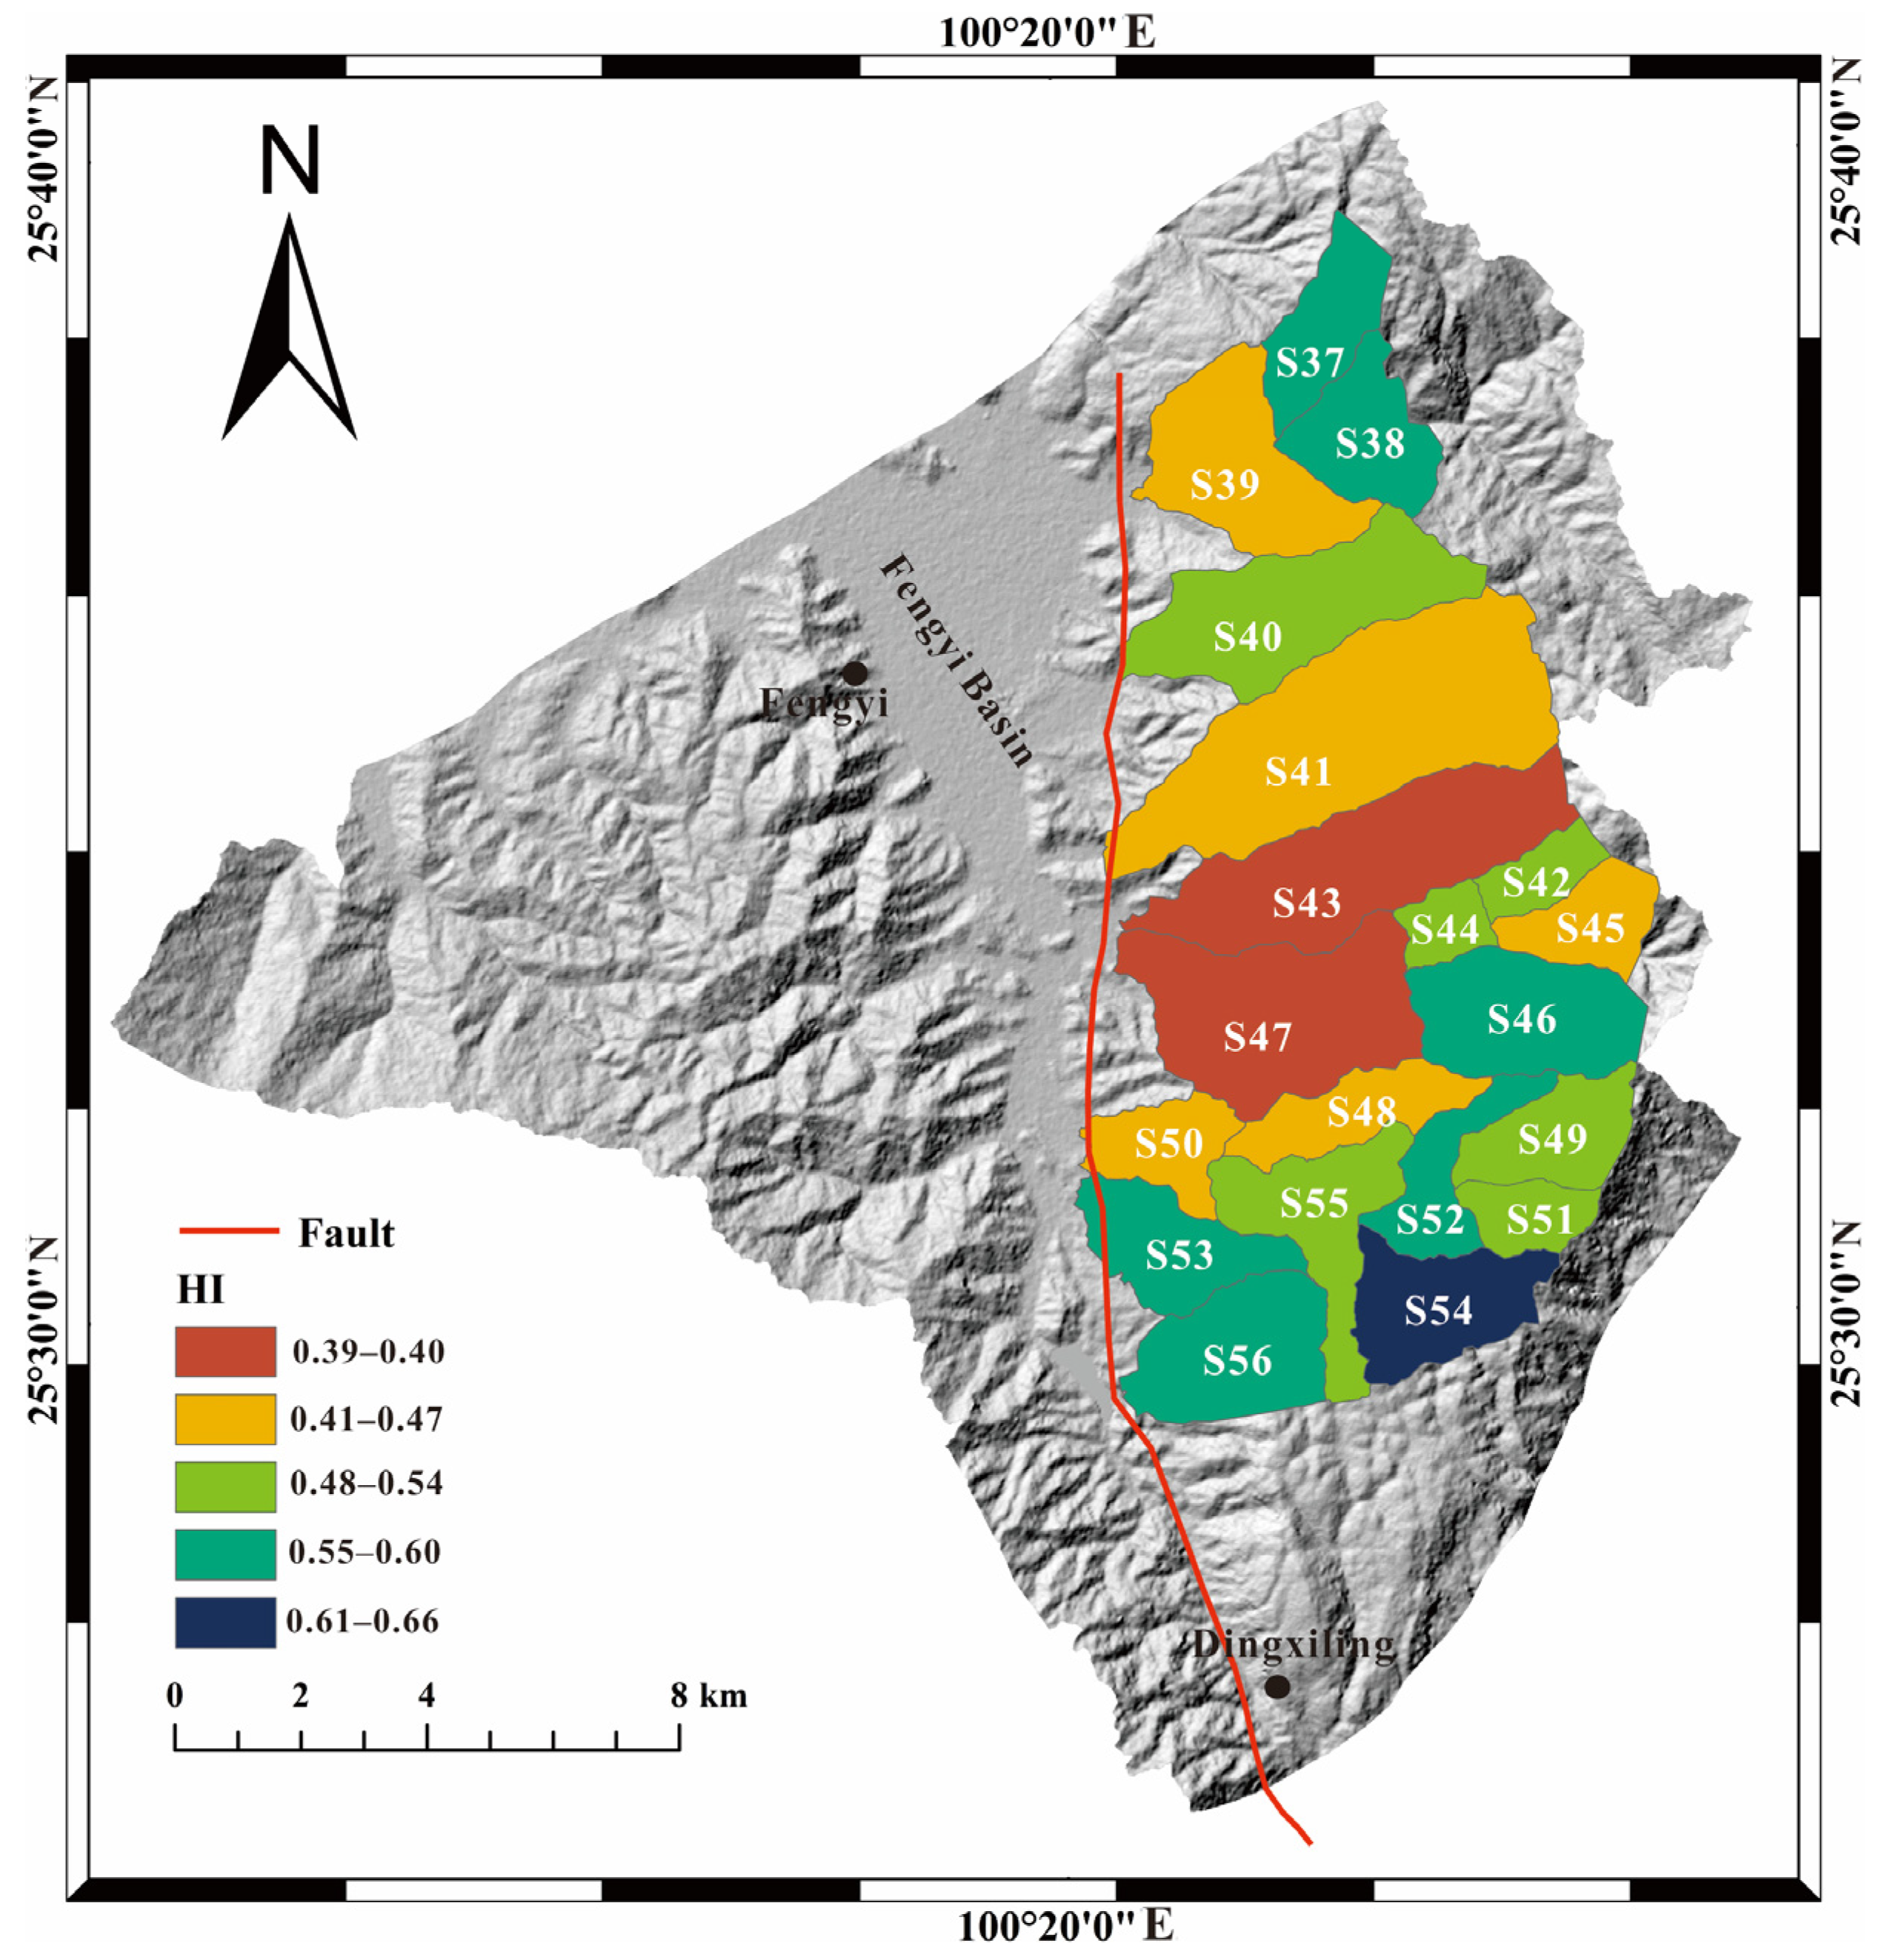
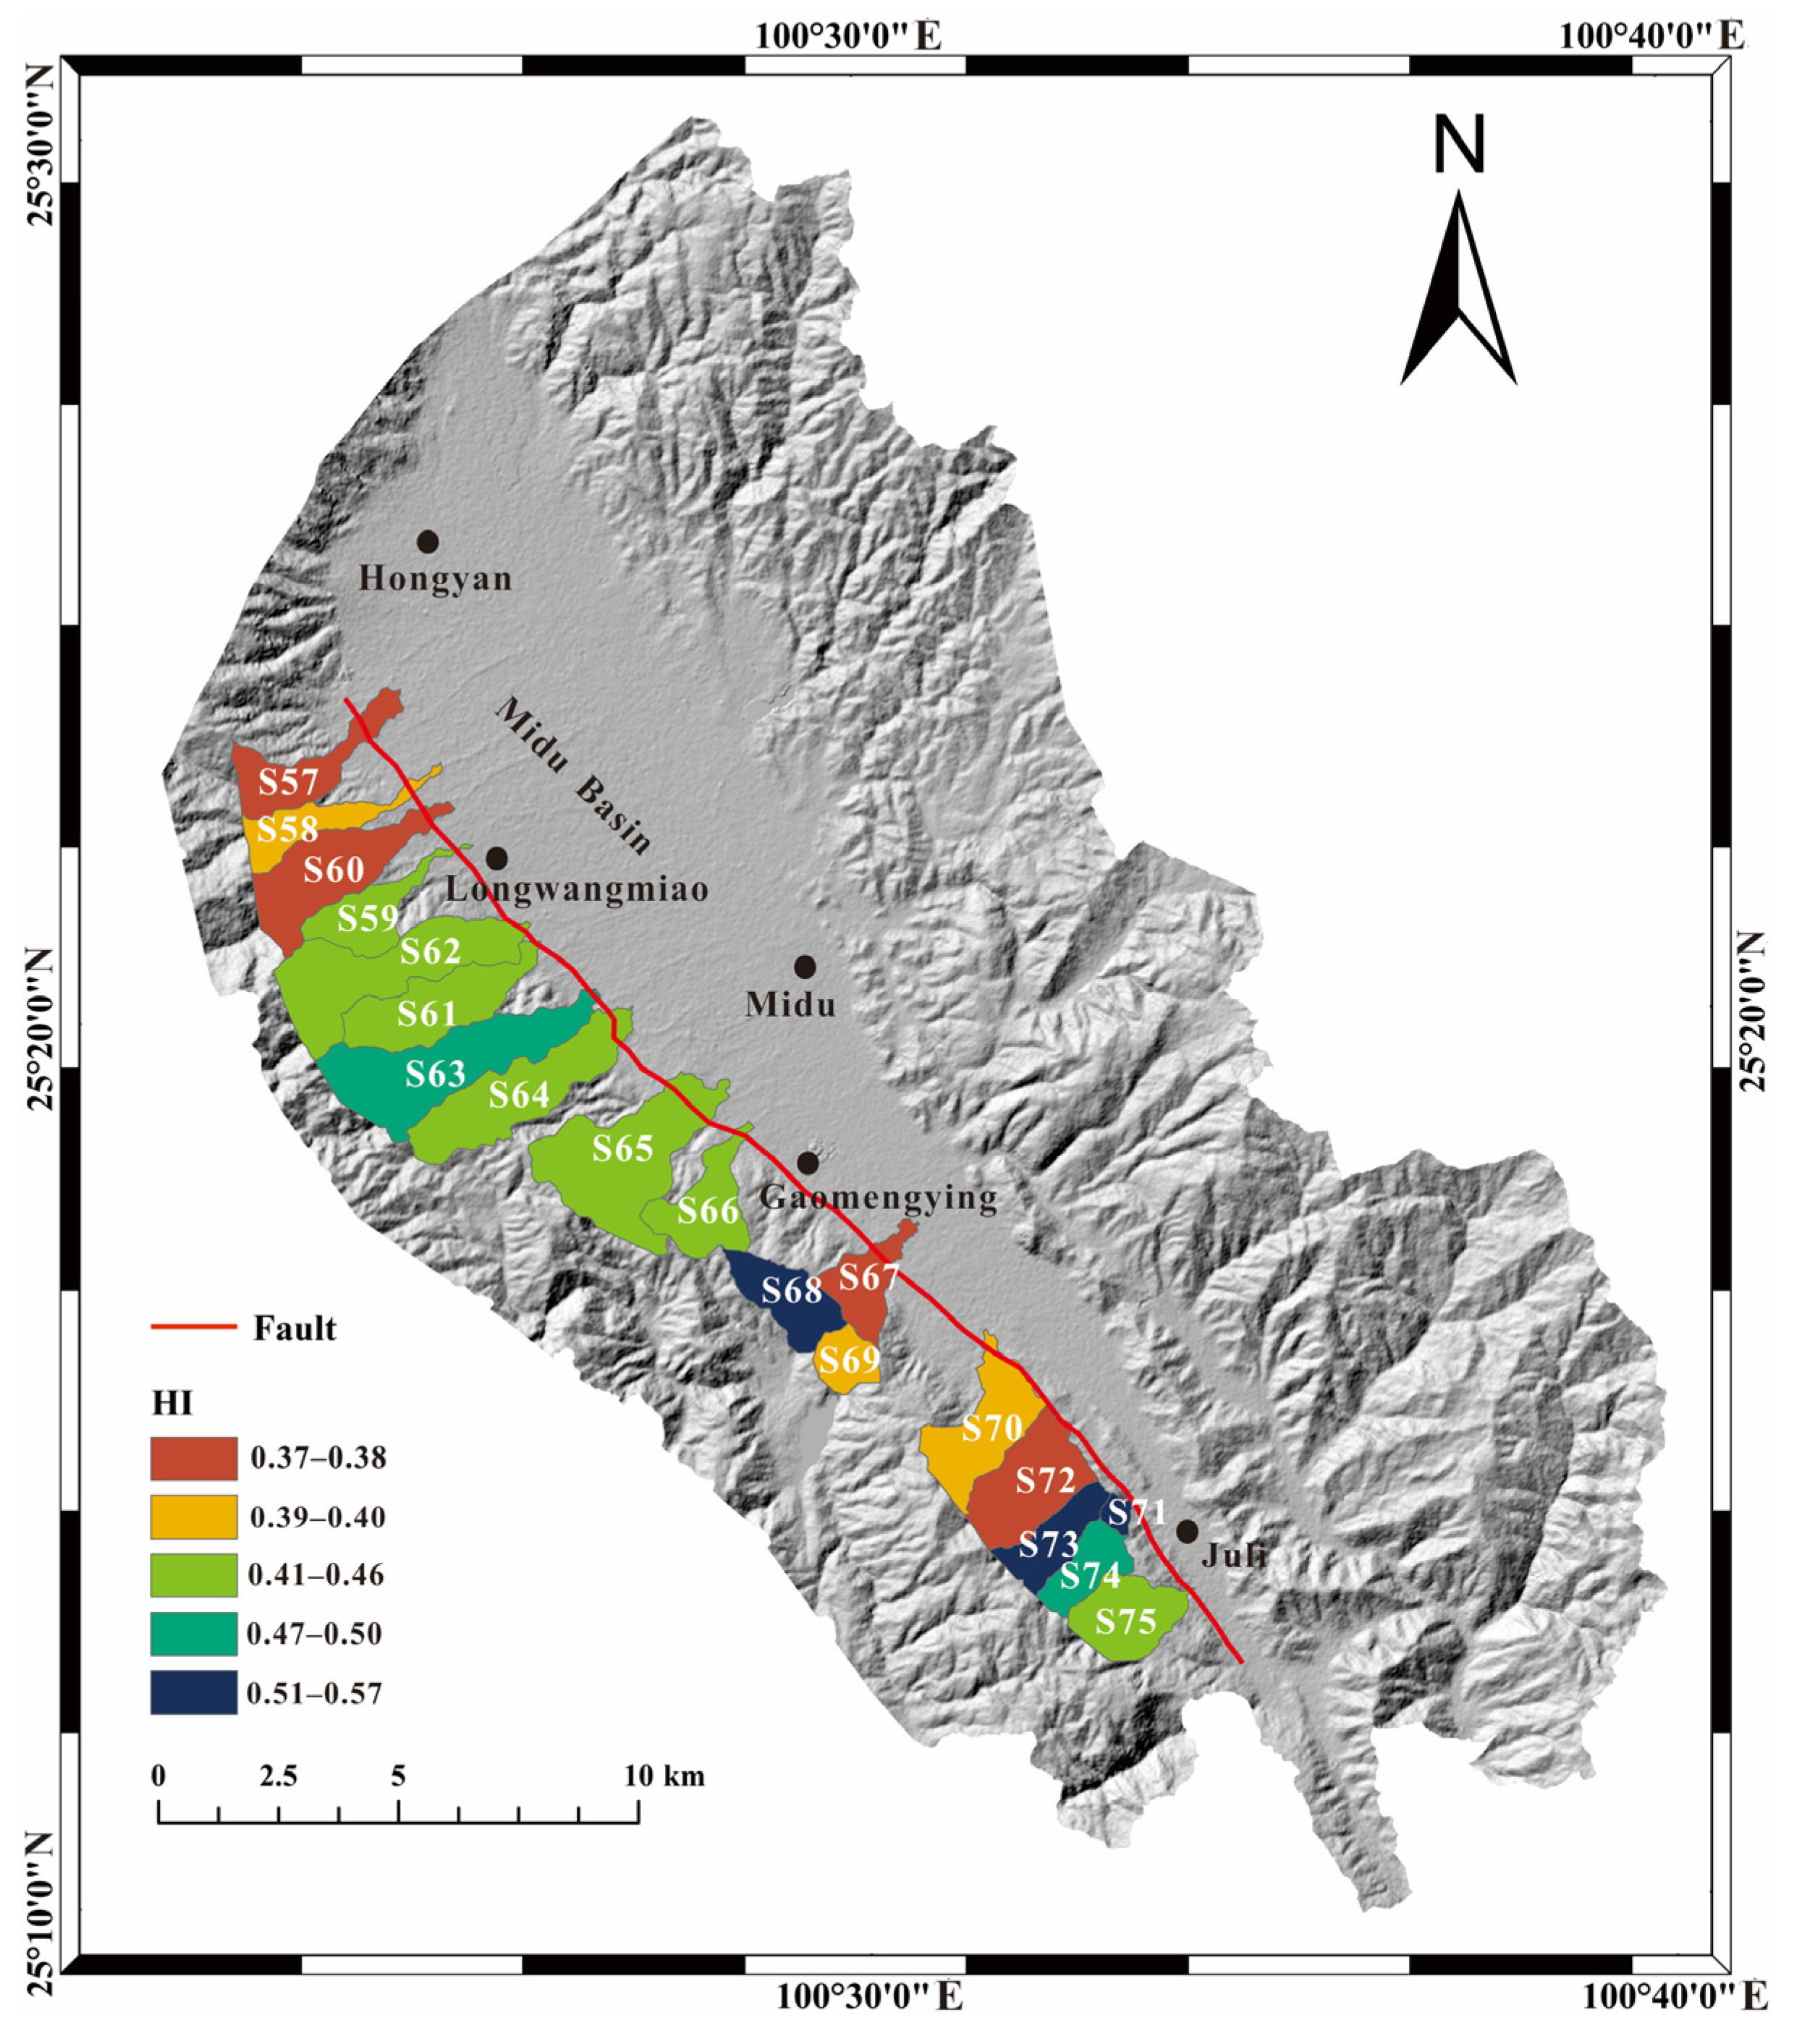
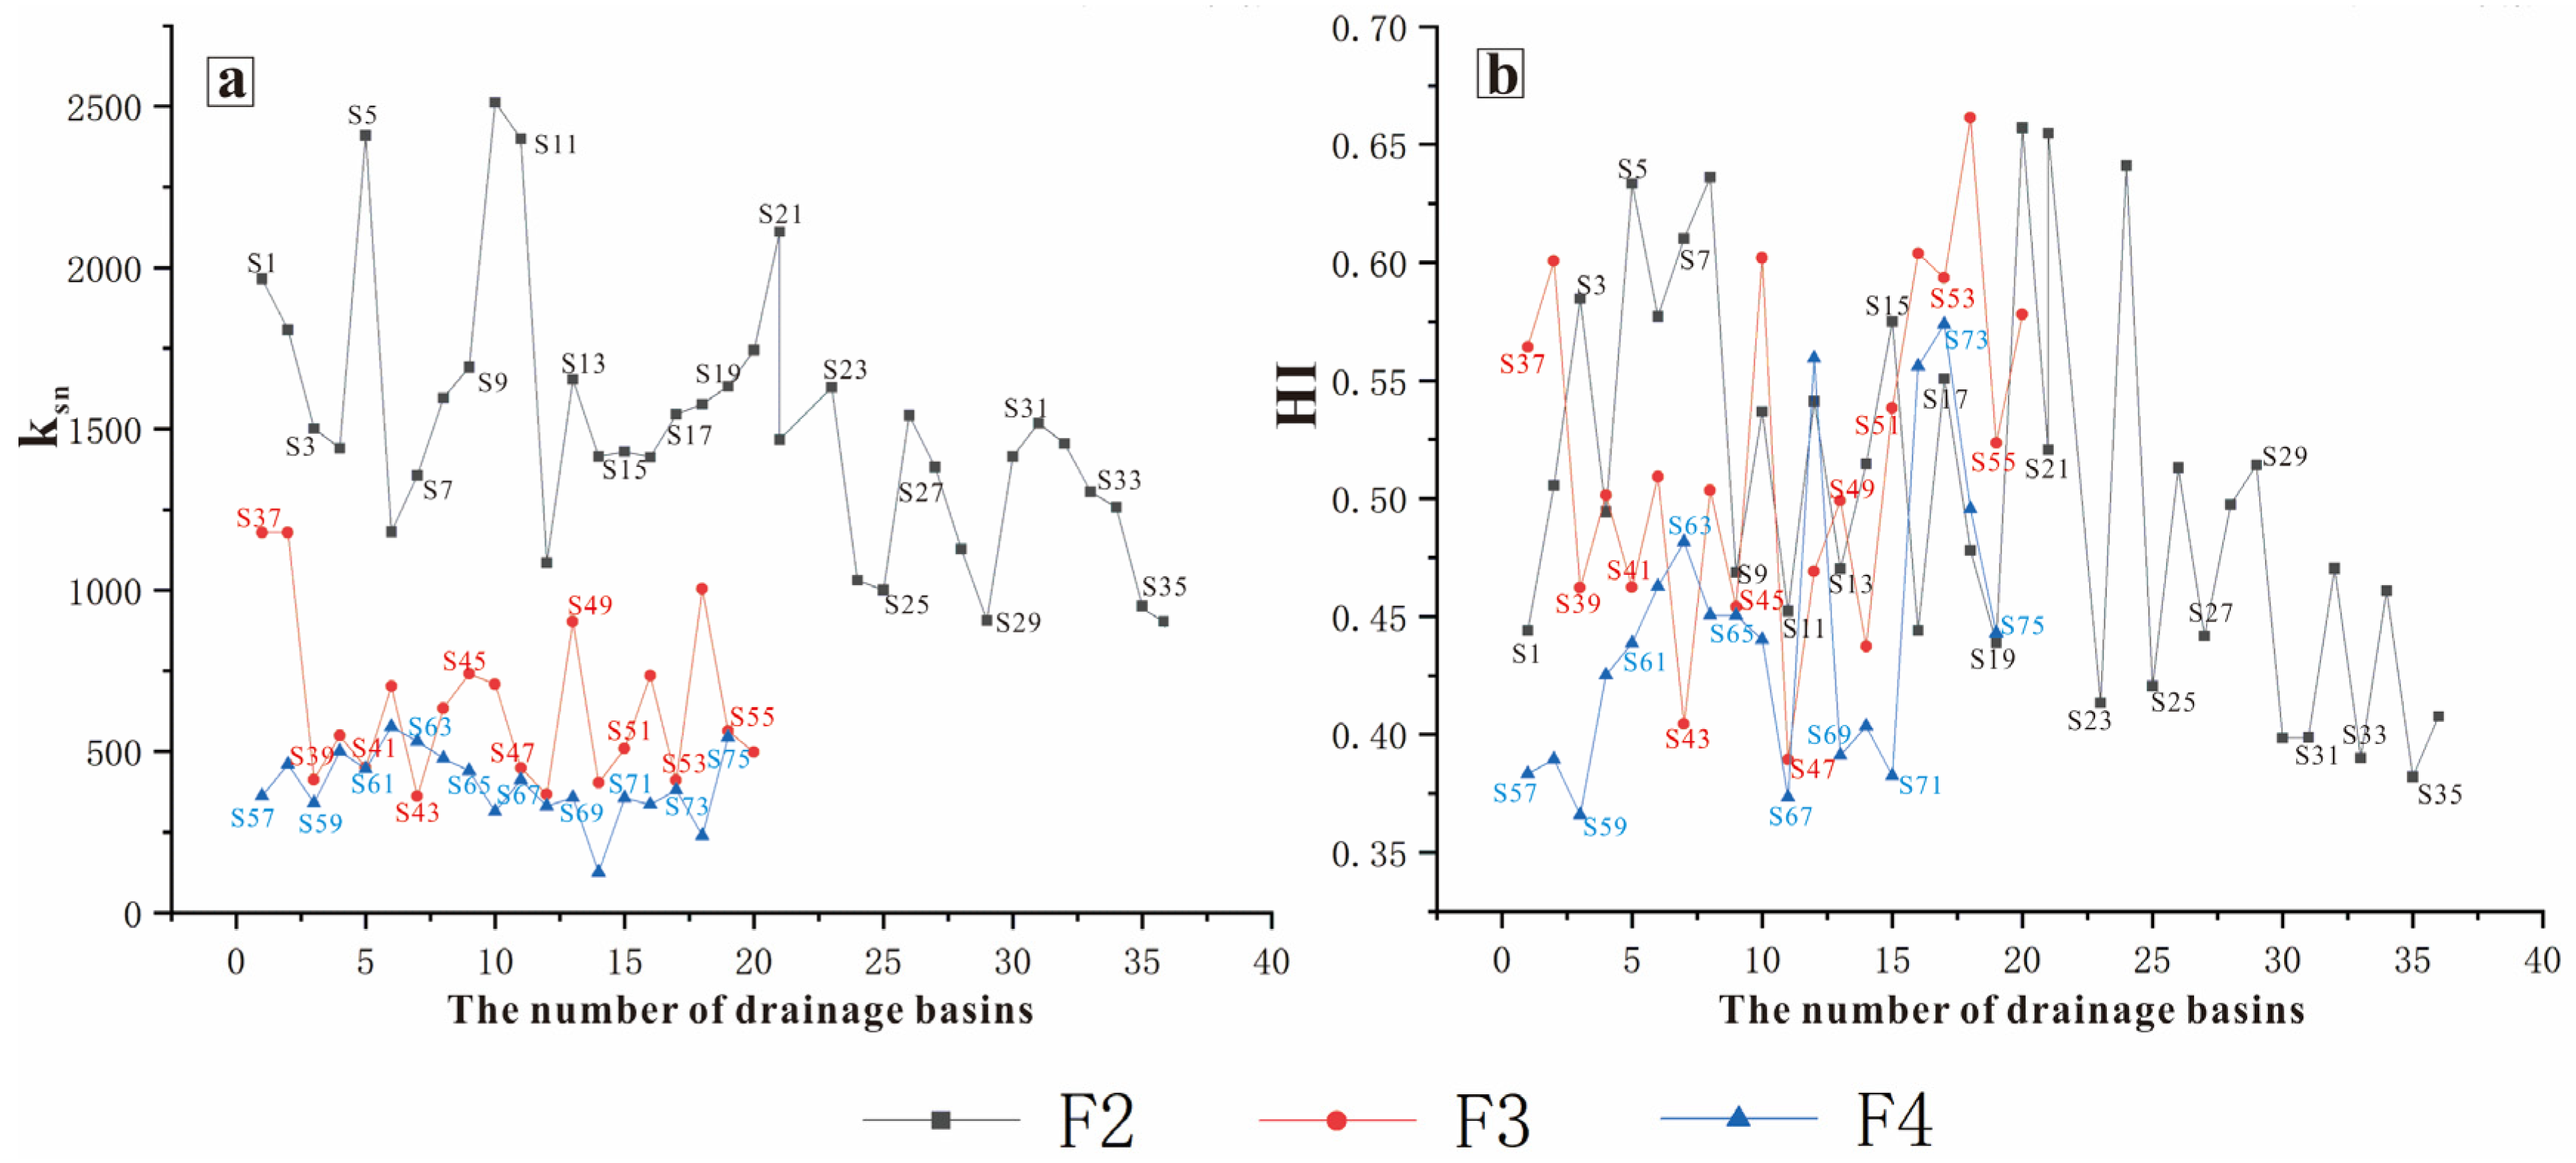
4.2. Hypsometric Integral (HI)

Table 1 shows the HI results for 75 bedrock drainage basins of streams across the Cangshan Piedmont Fault, Fengyi–Dingxiling Fault and Midu Basin Margin Fault. Figure 7 shows the HI results of the 36 bedrock drainage basins corresponding to the Cangshan Piedmont Fault. The calculated HI values range from 0.38 to 0.66, indicating that the drainage basin is in the juvenile or prime stage, and the HI values show a trend of increasing from south to north along the fault. The HI values along the southern Yinqiao–Xiaguan Fault are between 0.38 and 0.45, and the fault is in the prime stage. The HI values along the Yinqiao–Zhoucheng Fault in the north are between 0.44 and 0.66. The strong uplift of the Cangshan Piedmont Fault makes the development stage of the basin stay in the juvenile or prime stage, and the HI values are relatively high. The high HI values of the whole Cangshan Piedmont Fault from Zhoucheng to Xiaguan reflect the activity of the fault, and the tectonic activity is more intense in the north than in the south along the fault. Figure 8 shows the HI results of the 20 bedrock drainage basins corresponding to the Fengyi–Dingxiling Fault. The HI values are in the range of 0.39~0.66, and most values are between 0.39 and 0.60, showing that the drainage basins of the fault are in the prime stage. The fault is located at the edges of the Fengyi Basin in the north and the Dingxiling Mountain area in the south. It can be seen from the figure that the streams in the Fengyi Basin are longer and their drainage basin areas are larger, while the Dingxiling Mountain area has more river tributaries and the corresponding drainage basin areas are smaller. Figure 9 shows the HI results of the 19 bedrock drainage basins corresponding to the Midu Basin Margin Fault. The calculated HI values range from 0.36 to 0.57, and the values along the Longwangmiao–Gaomengying segment are generally high, concentrated between 0.43 and 0.47, and the HI values decrease to the south and north. The whole drainage basin is in the prime stage, indicating that the fault is tectonically active, and that the activity of the Longwangmiao–Gaomengying segment is the most intense. The HI values of the northern segment of the Red River Fault Zone are between 0.38 and 0.66, indicating that the northern segment is in a state of strong uplift and weak erosion; that is, the geomorphological evolution stage is in the juvenile and prime stage, and most of the drainage basins are in the prime stage.

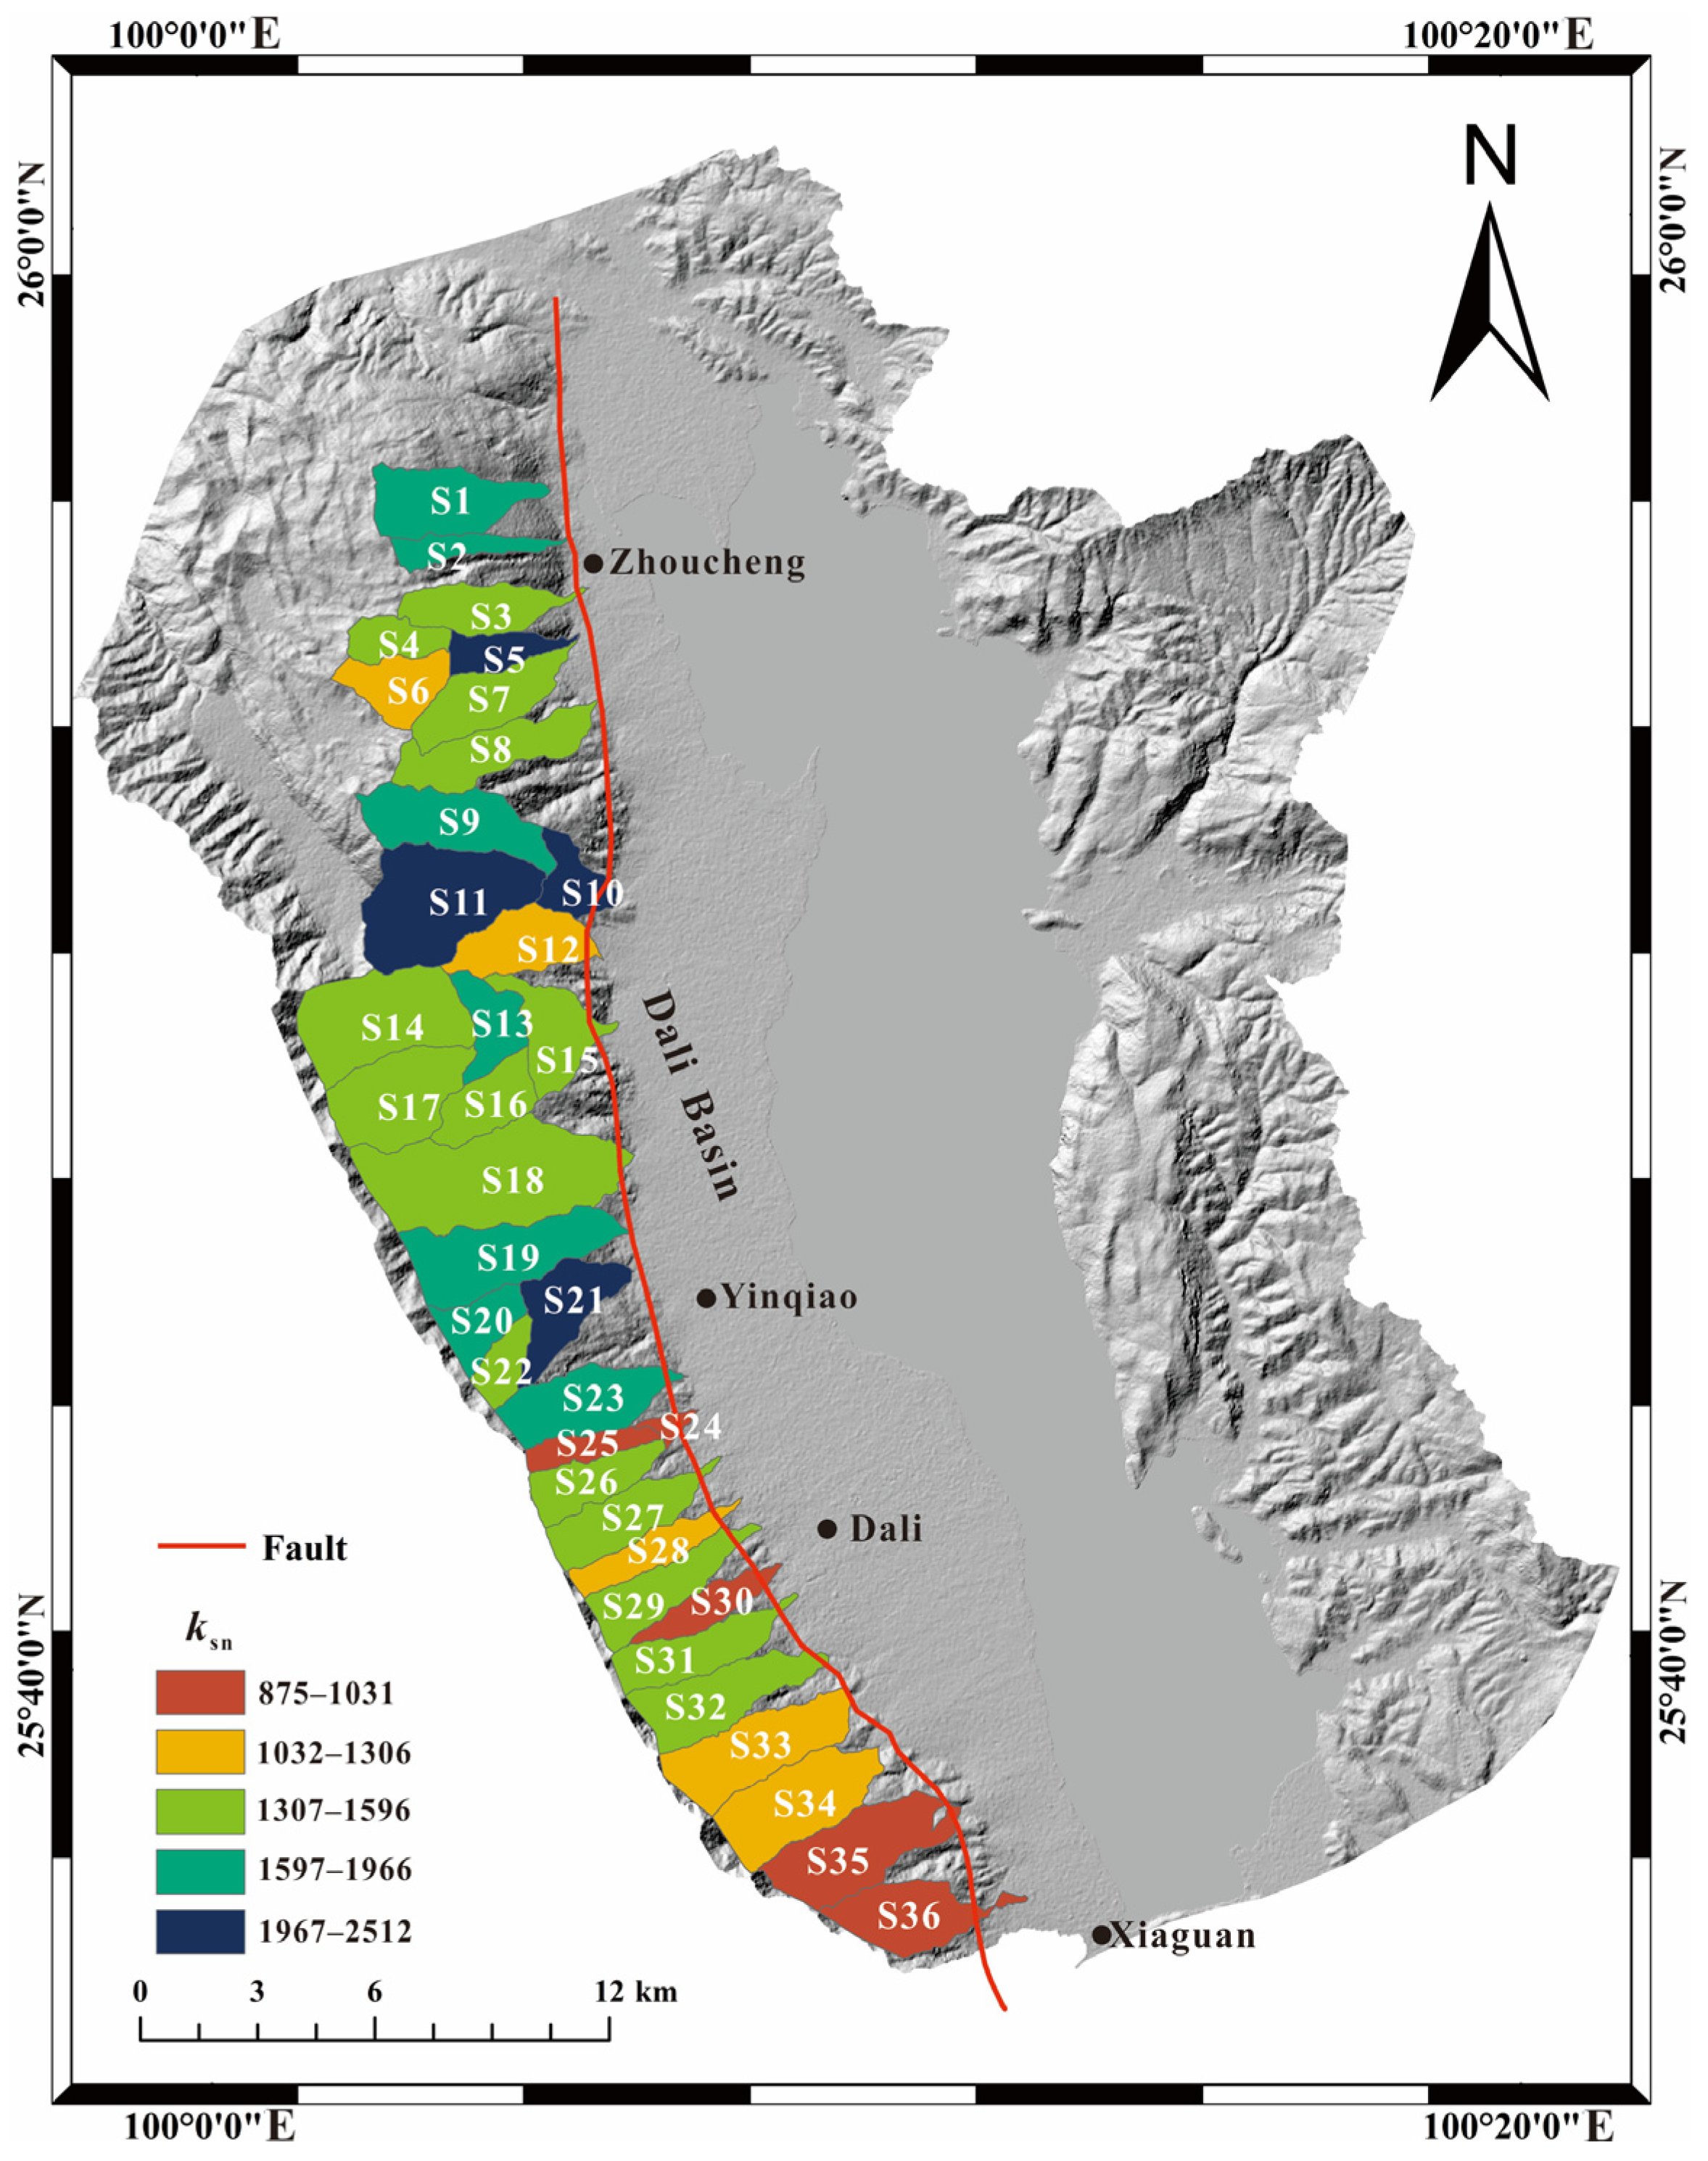
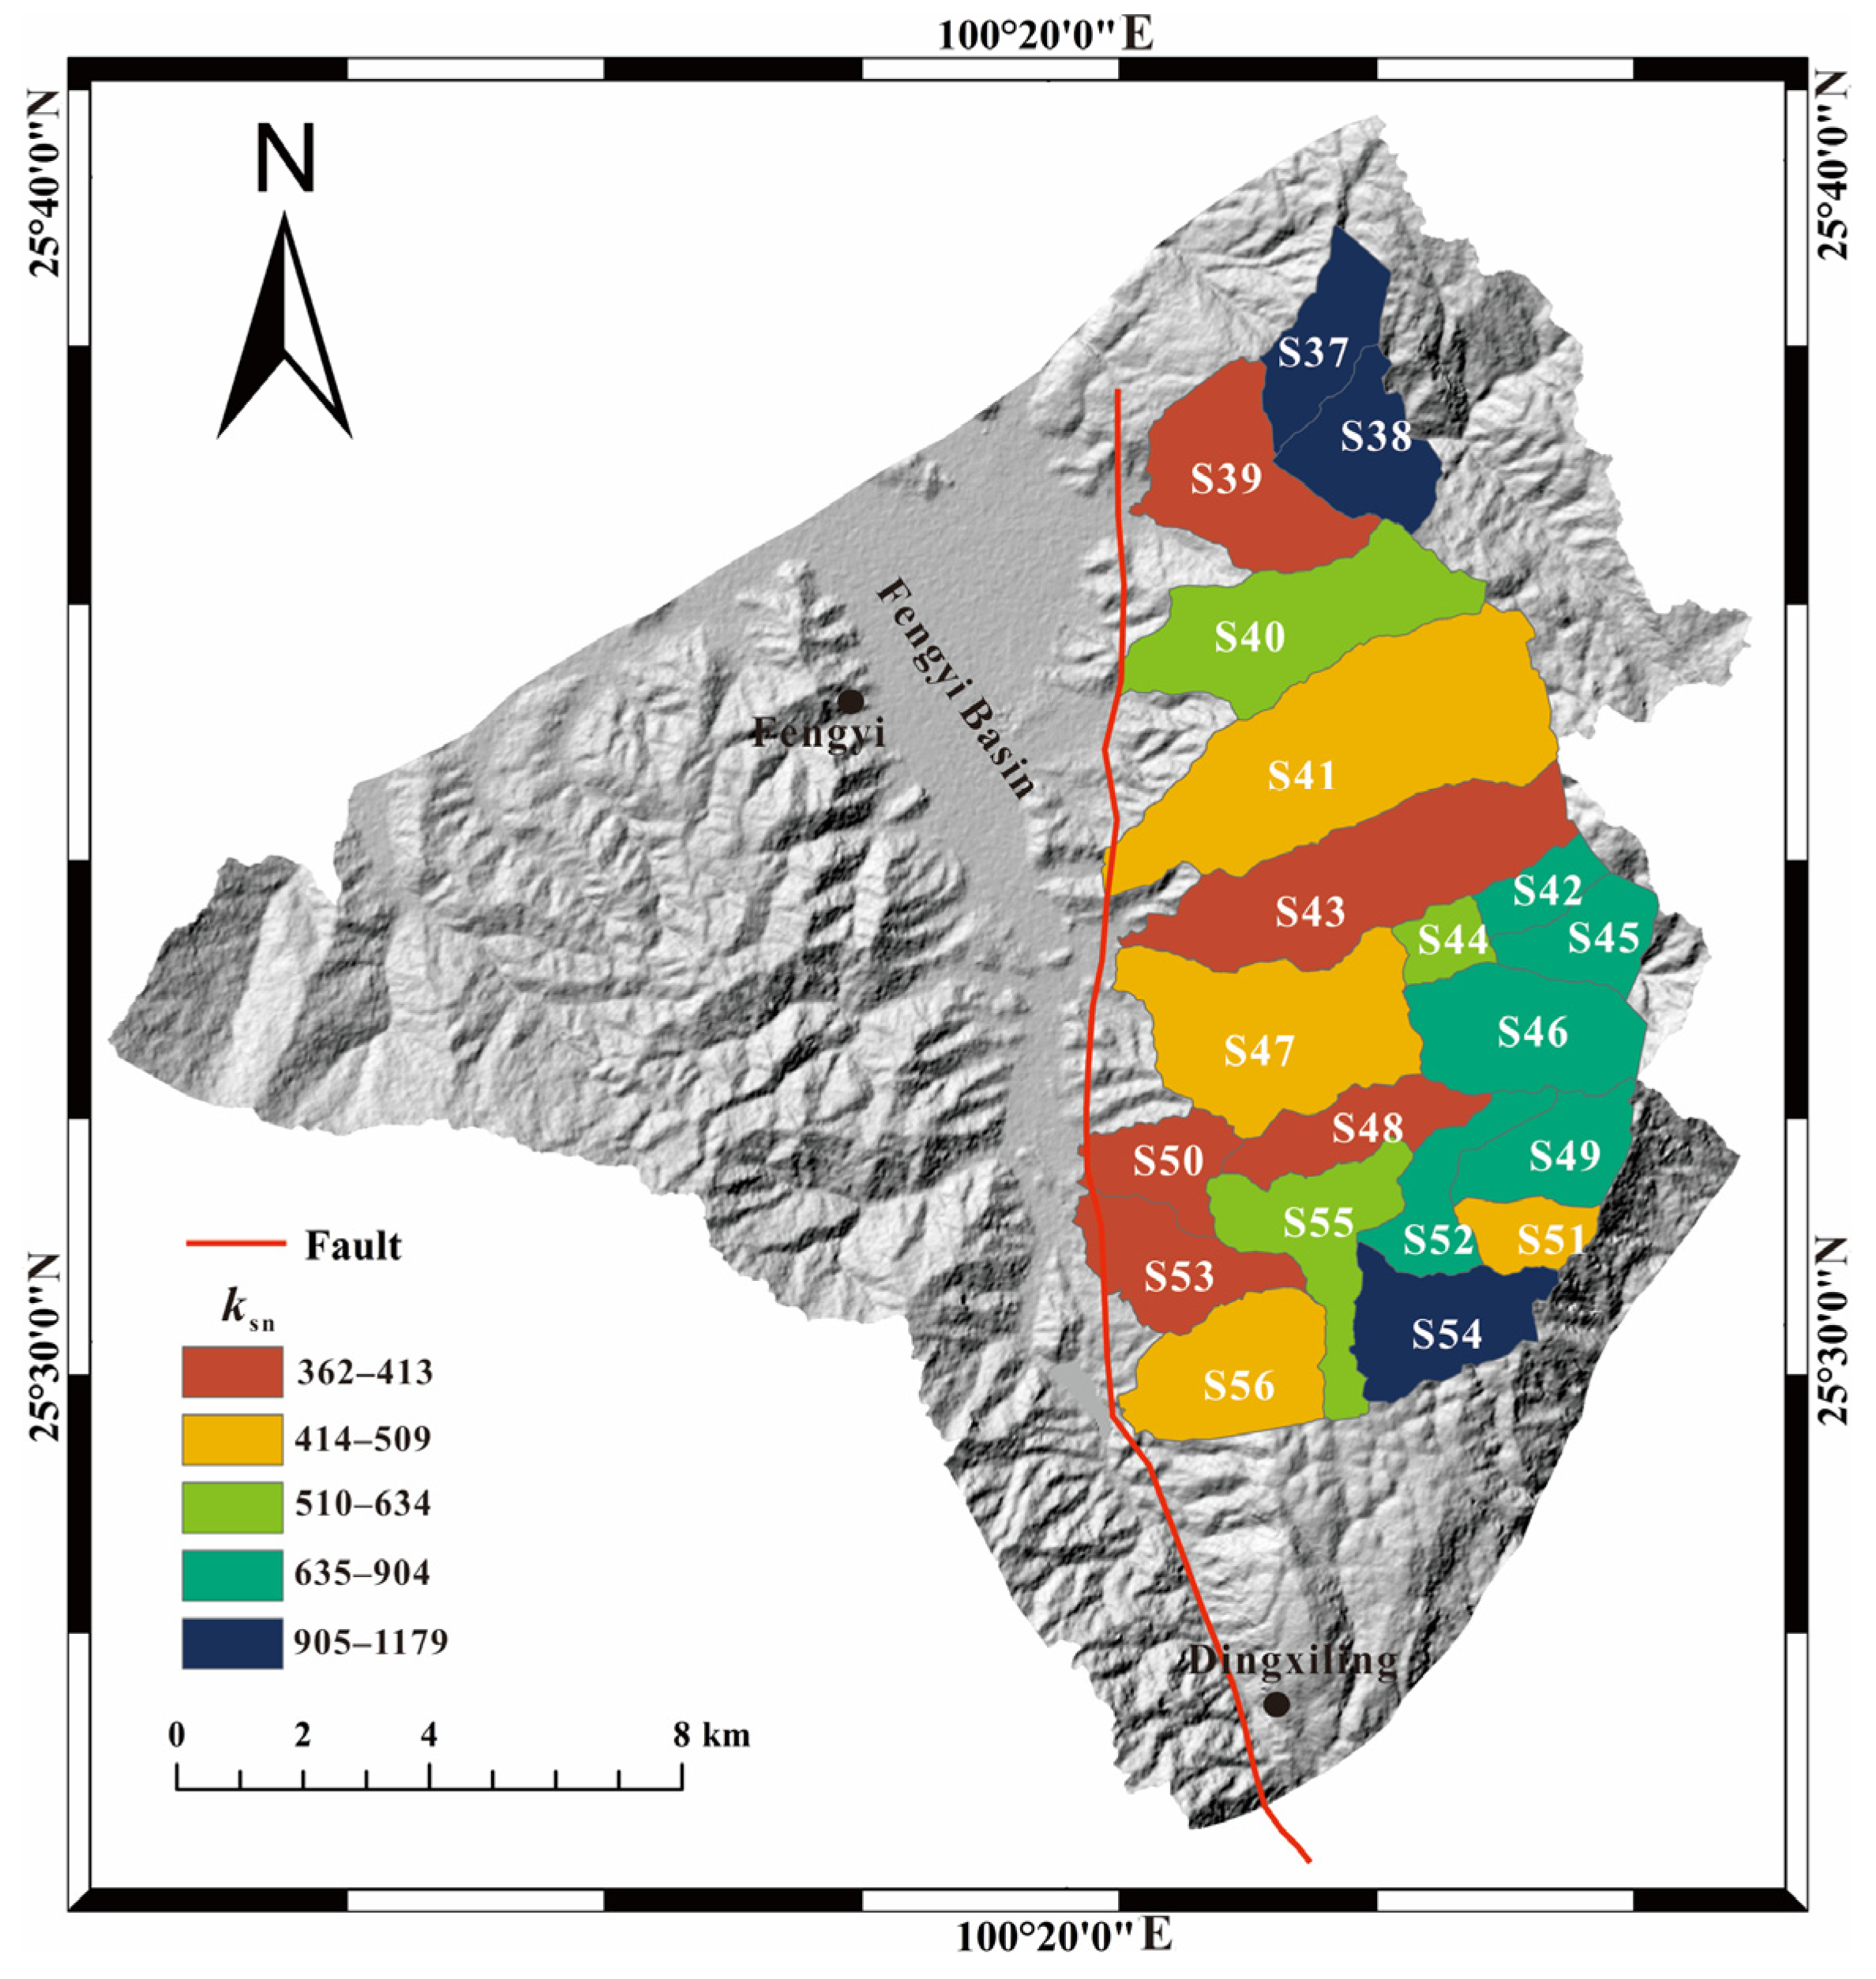
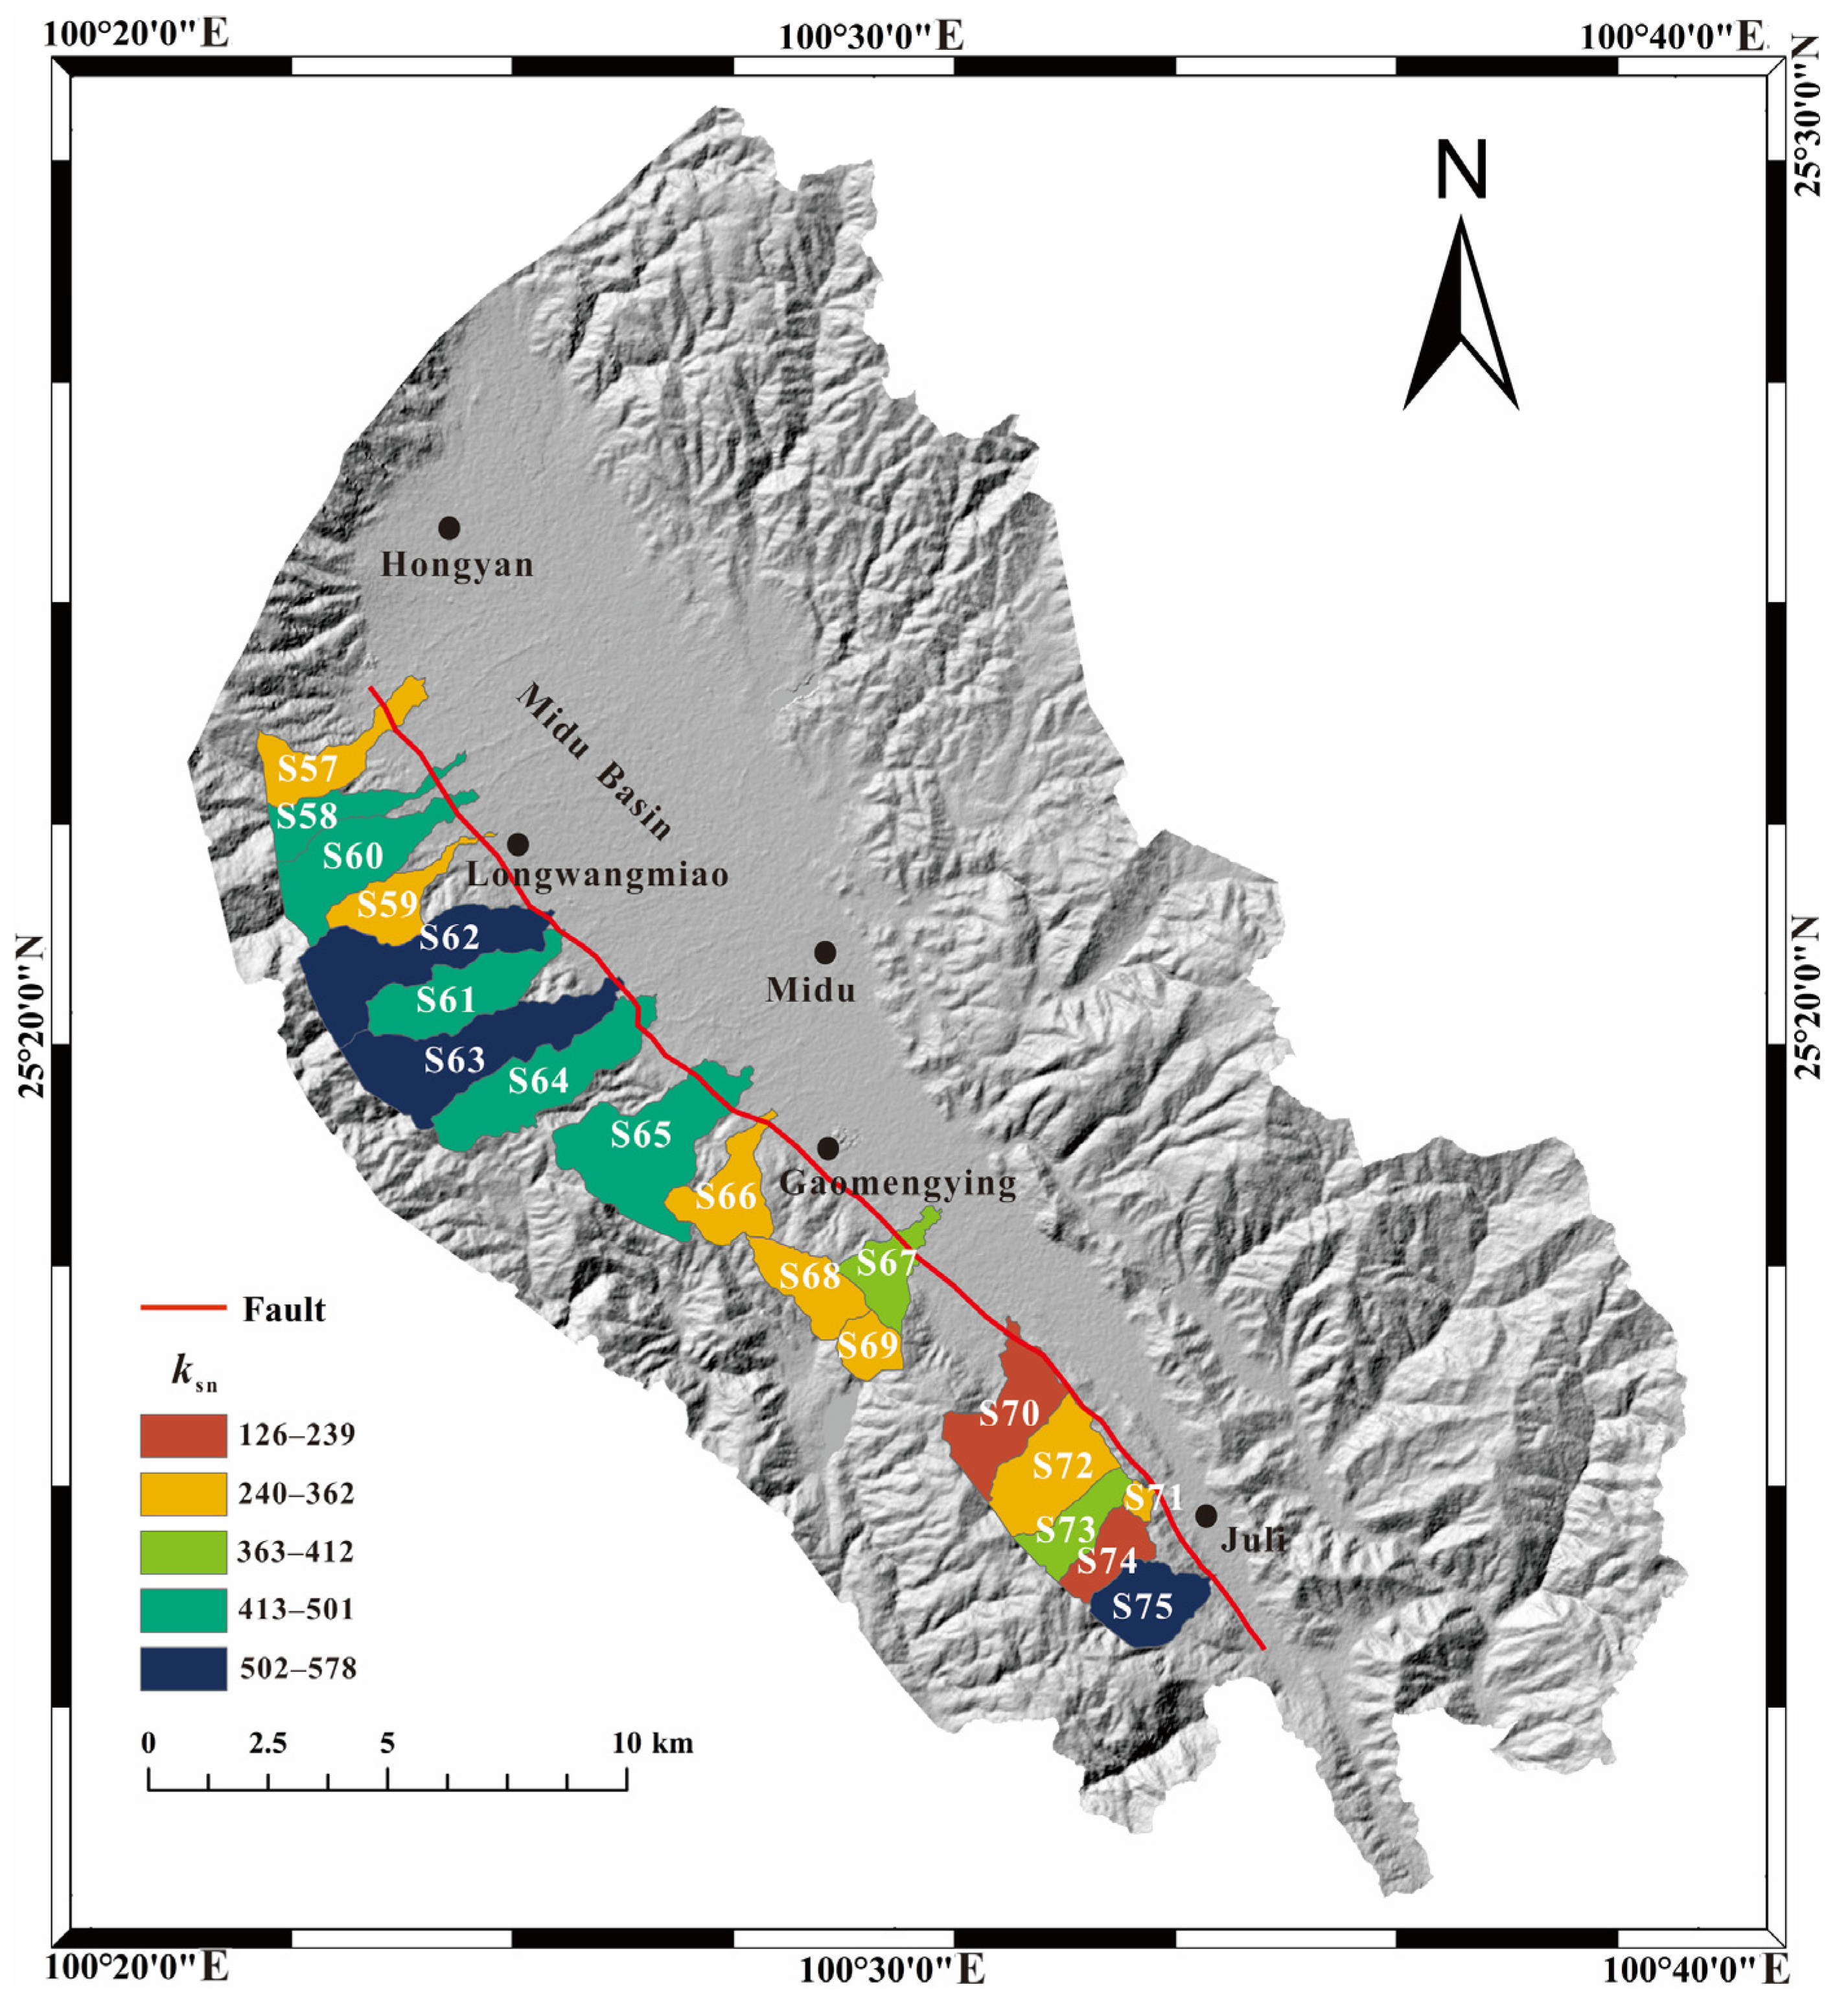
4.3. Channel Steepness Index (ksn)

Based on the program compiled by Schwanghart et al. [36,37], this paper uses the MATLAB platform to calculate the ksn of the streams in the bedrock area across the Cangshan Piedmont Fault, Fengyi–Dingxiling Fault and Midu Basin Margin Fault. The mean value of ksn in each basin was taken as the final ksn value of the basin (Table 2) to obtain the spatial distribution map of ksn of the basins along the fault segments. Figure 10 is the distribution map of the ksn calculated based on 36 bedrock channels along the Cangshan Piedmont Fault, and the ksn value ranges from 875–2512. The spatial distribution shows that the ksn value of the section from Yinqiao north to Zhoucheng ranges from 1085 to 2512, with an average value of 1678. The ksn value of the section from Yinqiao south to Xiaguan ranges from 875–1629, with an average value of 1242. With Yinqiao as the boundary, the ksn value of the northern section is larger than that of the southern section, showing the same spatial distribution trend as the calculated HI value. The overall high ksn value of the fault indicates that the Cangshan Piedmont Fault is tectonically active, and the tectonic activity of the Yinqiao-to-Zhoucheng section is higher than that of the Yinqiao-to-Xiaguan section. As shown in Figure 11, the ksn values of the Fengyi–Dingxiling Fault range from 362 to 1179, and only 3 of the 20 ksn values obtained are above 1000. As shown in Figure 12, the ksn value of the Midu Basin Margin Fault ranges from 126 to 578, and its overall ksn value is significantly lower than that of the Cangshan Piedmont Fault and Fengyi–Dingxiling Fault. The spatial distribution map of ksn shows that the ksn value of the Longwangmiao–Gaomengying section is higher and concentrated between 440 and 578, so the ksn value of the fault segment decreases significantly from south to north. The spatial distribution trend is consistent with that of the calculated HI values, indicating that the Longwangmiao–Gaomengying segment is the most active part of the Midu Basin Margin Fault. The ksn value of the northern segment of the Red River Fault Zone decreases from north to south, indicating that there is differential uplift in the northern segment; that is, the uplift rate gradually decreases from north to south.

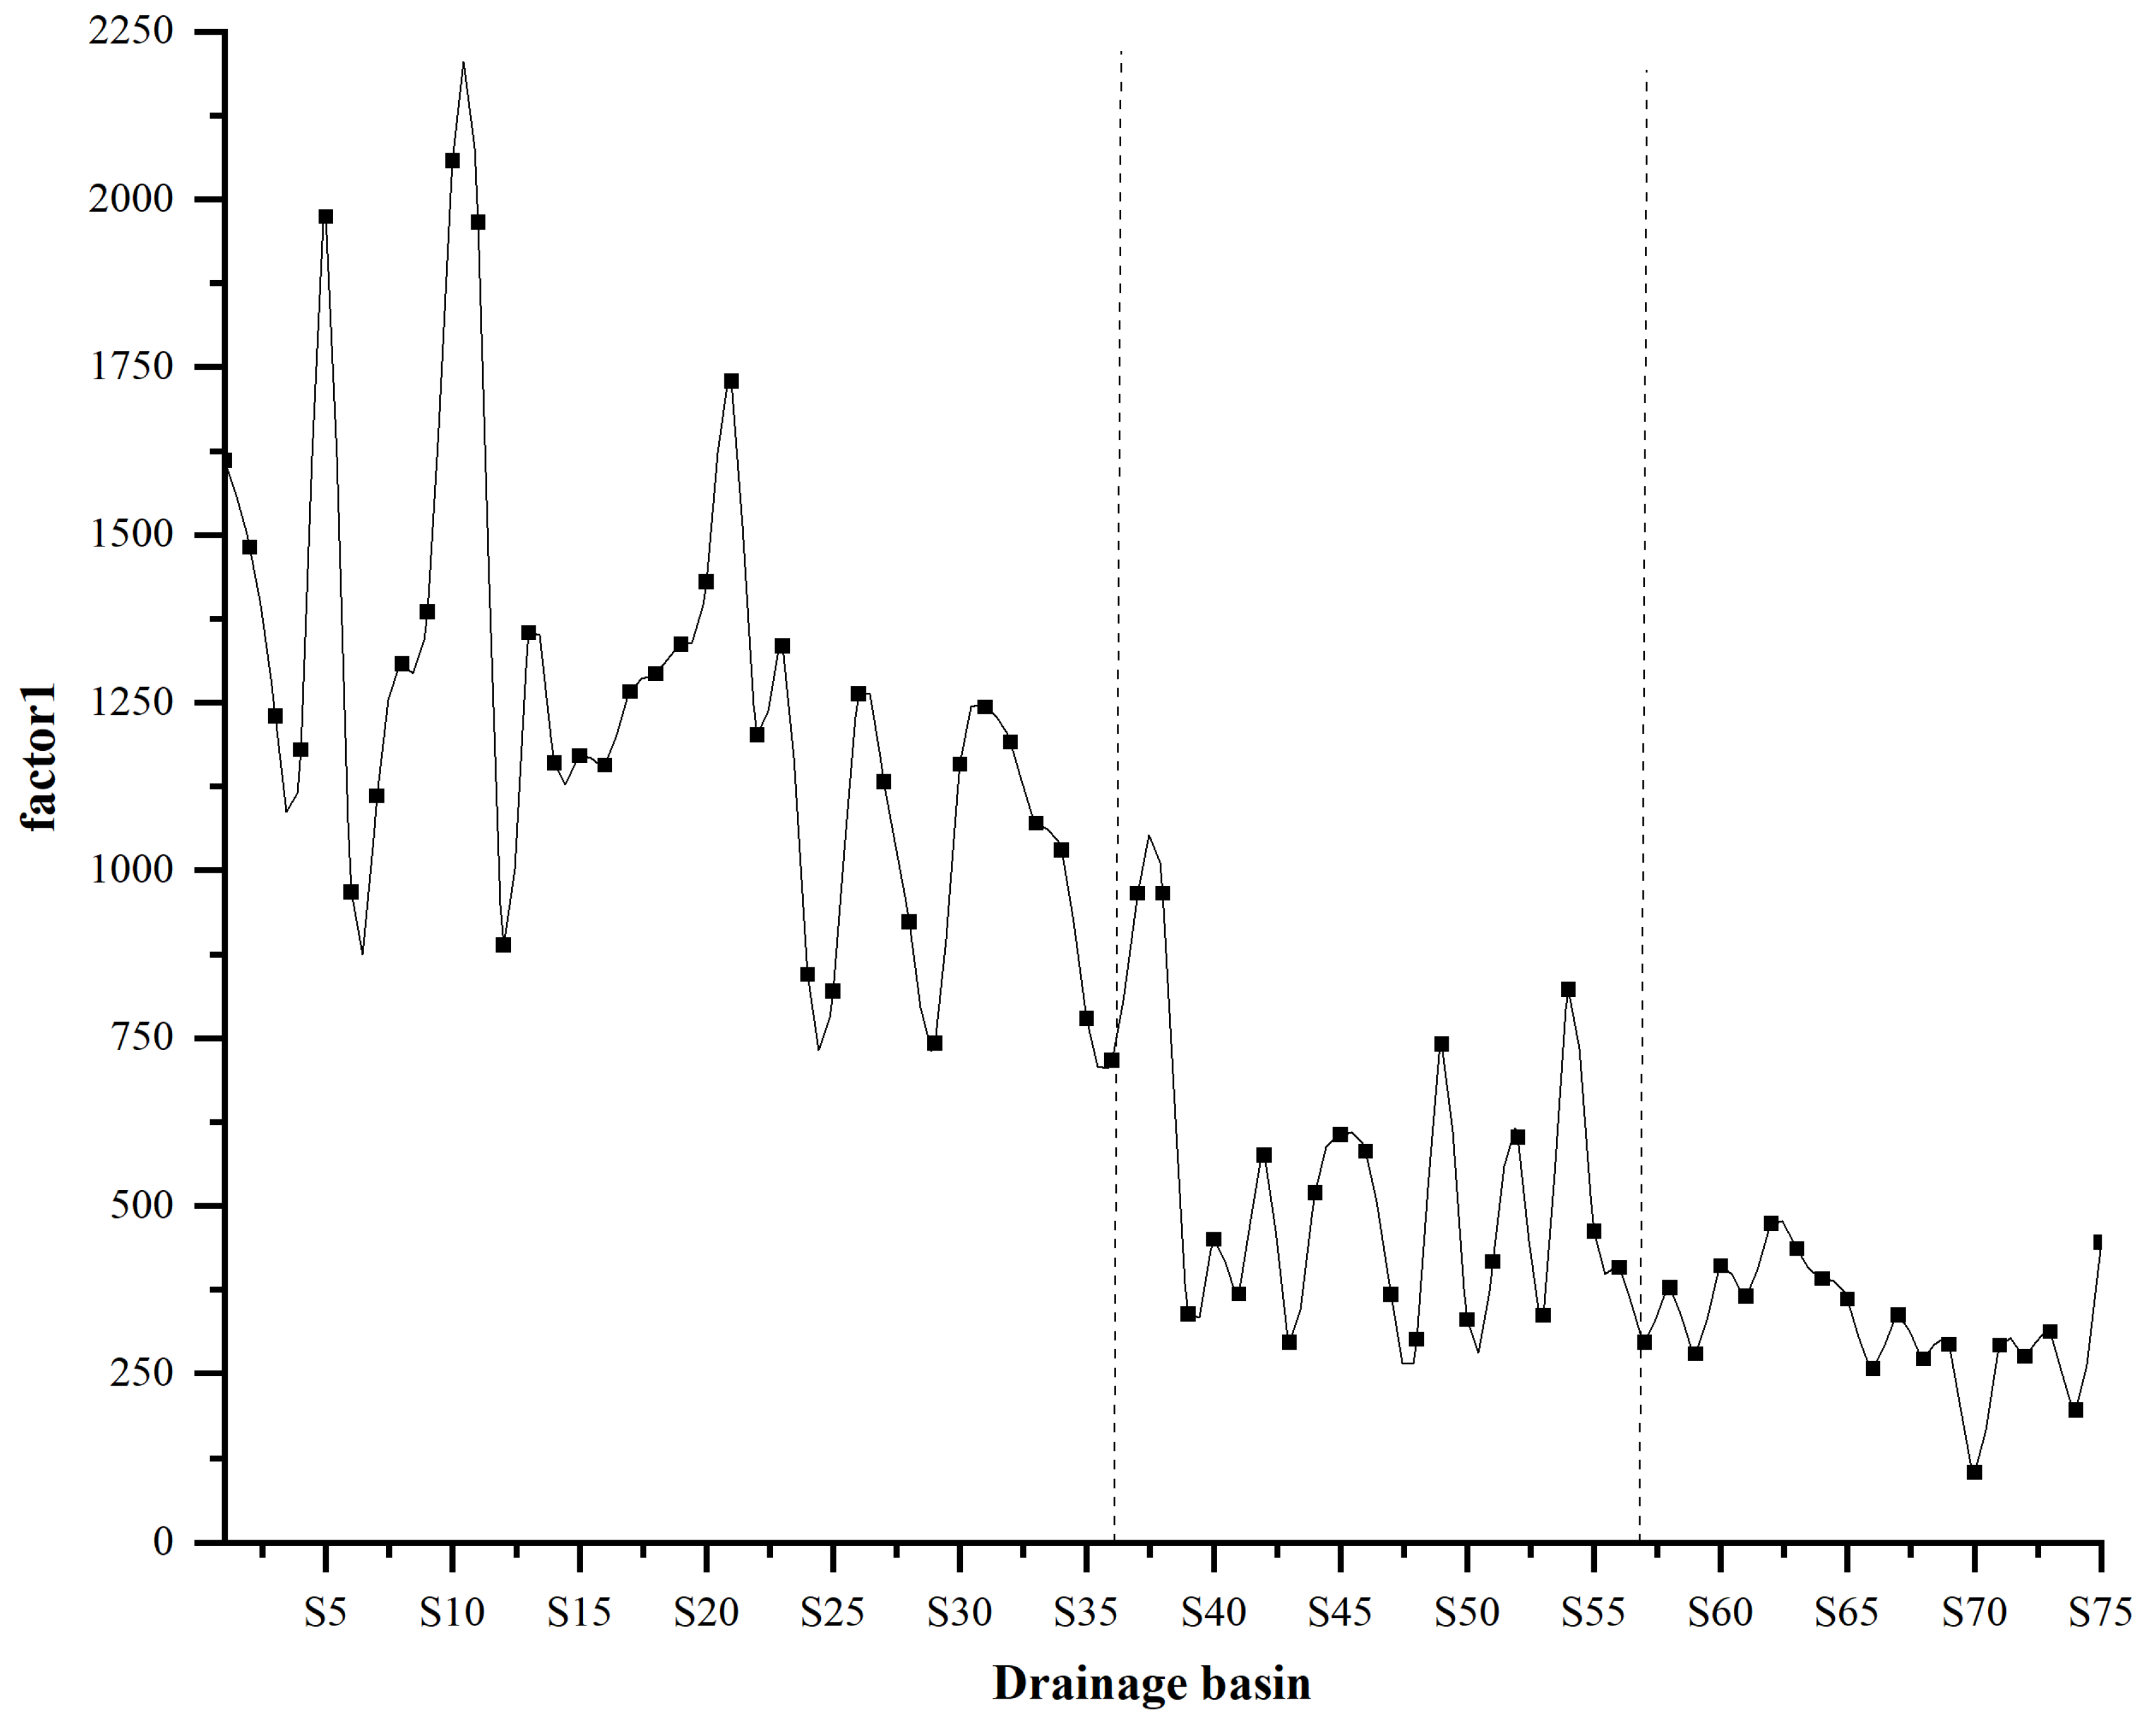
4.4. Indication of Stream Geomorphic Index to Active Tectonics

The average slope value and average RDLS value of each fault show high consistency. According to the value range of each fault, the Cangshan Piedmont Fault features the highest values, the Fengyi–Dingxiling Fault features the second highest values, and the Midu Basin Margin Fault features the lowest values. The ranges of ksn values and HI values in each basin of the Cangshan Piedmont Fault, Fengyi–Dingxiling Fault and Midu Basin Margin Fault are drawn as scatter plots for comparison. The ksn values of each fault (Figure 13a) are significantly different. The Cangshan Piedmont Fault values are the highest, followed by the Fengyi–Dingxiling Fault values and the Midu Basin Margin Fault values. Compared with the difference in the ksn values, the difference in the HI values on the scatter plot is relatively small (Figure 13b) and concentrated in the range of 0.4~0.6. However, it can also be seen that the Midu Basin Margin Fault has a smaller HI value, while the Cangshan Piedmont Fault has a higher HI value, and the trend is generally the same as that of the ksn values. A comprehensive analysis of several stream geomorphic indices shows that the northern section of the Red River Fault Zone is highly active. According to the differences in spatial distribution, the structural activity of the Cangshan Piedmont Fault, Fengyi–Dingxiling Fault and Midu Basin Margin Fault weakens from north to south, and the Cangshan Piedmont Fault is the most intense.
In order to effectively synthesize and summarize the indication of ksn and HI values on the change in active tectonic intensity, we conducted principal factor analyses of ksn and HI. Principal factor analysis can reduce the information loss of the original index as far as possible, and at the same time reduce the number of index parameters and replace all kinds of information existing in various variables with fewer comprehensive indicators. These comprehensive indicators can more directly reflect the substantive connotation of the original indicators to be explained, which is a highly effective generalization and abstraction of the original variables [74]. After principal factor analysis with SPASS software, we obtained factor 1 as the first principal factor, whose eigenvalue was 1.342 and the percentage of variance was 67.1%. Factor 1 contains about 67.1% of the information in the original two variables, which is relatively representative. We used it as a new index of active tectonic intensity. Like ksn and HI, the higher the value, the more active it is. We calculated the principal factor score and presented it as a variation curve (Figure 14), which can be easily divided into three sections, corresponding to the drainage basins of three faults (F2, F3, F4), respectively. The value of factor 1 in the three intervals showed a decreasing trend and it can also be concluded that the active tectonics of the northern segment of the Red River Fault Zone gradually weaken from north to south.

5. Discussion

5.1. Lithology and Climatic Factors

The distribution of Middle and Late Pleistocene alluvial deposits can be seen at the junction of the faults and basins in the study area. In addition, Proterozoic, Permian, Devonian, Ordovician and Jurassic strata are also exposed around the faults (Figure 15). The southern section of the Cangshan Piedmont Fault has a large number of Proterozoic rocks, including gneiss, amphibolite, schist and marble with moderate and high degrees of metamorphism, and these lithologies are highly resistant to erosion. The northern area is dominantly Devonian strata, consisting of shale, sandstone, etc., and there is a small amount of Late Paleozoic diorite and diabase with a relatively low degree of erosion resistance. The Fengyi–Dingxiling Fault has a large number of Ordovician strata, including sandstone, shale and limestone, and Devonian strata including limestone and sandstone in the south. Granitic porphyry is also distributed in the south and has a high degree of erosion resistance. The Midu Basin Margin Fault is associated mainly with Cretaceous strata, mainly quartz sandstone, mudstone, siltstone, sandstone and conglomerate. Jurassic strata and Permian rocks are distributed in the south, and the Permian eruptive rocks are dominated by various types of basalt, such as compact basalts and orthocline basalts [30]. Different lithologies have different degrees of erosion resistance, which affects the geomorphic evolution of the drainage basin. Comprehensive lithologic analysis shows that the erosion resistance of the bedrock in the southern section of the Cangshan Piedmont Fault is higher than that in the northern section. If the tectonic and rainfall factors are not considered, the HI and ksn values in the southern section should be higher than those in the northern section, but the actual results are the opposite. Similarly, there are granitic porphyry rocks with a high degree of erosion resistance in the southern section of the Fengyi–Dingxiling Fault, whose stream geomorphic indices should show a high value, but the results are lower than those of the northern section of the Cangshan Piedmont Fault with relatively weak erosion resistance. The stream geomorphic indices in the study area are not greatly affected by lithology. The climate of the study area is subtropical, with mild and humid conditions. Climate can also have an impact on the geomorphic evolution of a drainage basin. In terms of climate, the influence of topographically induced precipitation is greater in alpine regions than in mountain regions. From China Meteorological Data Network (https://data.cma.cn/data/weatherBk.html, accessed on 9 November 2022.) data, we obtained the monthly average precipitation statistics of Dali station near Cangshan Piedmont Fault and Midu station near Midu Basin Margin Fault from 1981 to 2010, and calculated the annual average precipitation. The annual average precipitation of Dali station is 87.9 mm and that of Midu station is 65.7 mm. Specifically, the precipitation is higher along the Cangshan Piedmont Fault than along the other faults, and if other factors are not considered, the HI and ksn values of this fault section should be lower; however, in fact, the opposite is true. Climate is not the main factor affecting the stream geomorphic indices.

5.2. Tectonics

Early studies have shown that the Quaternary activity intensity of the Red River Fault Zone gradually increases from south to north with decreasing activity age. A field geological survey showed that the center of activity in the Late Holocene was located on the boundary faults from Dali to Midu in the north—namely, the Cangshan Piedmont Fault, Fengyi–Dingxiling Fault and Midu Basin Margin Fault [30]. The spatiotemporal evolution of the activity is in good agreement with the distribution of destructive earthquakes and paleoseismic relics along the fault zone. In the northern segment of the fault with intense activity since the latest Pleistocene, there have been hundreds of earthquakes of magnitude 5 or higher, and many destructive earthquakes of magnitude 7 or so have occurred. The paleoseismic relics of the latest Pleistocene to Holocene period are clear [75,76]. The 1925 Dali earthquake of magnitude 7 and the 1652 Midu earthquake of magnitude 7 occurred in the northern segment. For example, the 1925 Dali M7 earthquake occurred on the Cangshan Piedmont Fault segment, which has been obviously active in the Holocene. This fault also exhibits obvious evidence of vertical differential activity from the Late Pleistocene to the Holocene, which can be seen in many fault scarps along the fault zone. There are several traces of paleoearthquakes along this fault, which is the main segment generating strong earthquakes. The 1652 Midu M7 earthquake occurred on the Midu Basin Margin Fault, which was also an active fault from the Late Pleistocene to the Holocene [30]. This paleoseismic information also indicates that the northern segment of the Red River Fault has been very active since the Late Pleistocene. Second, a large number of geophysical studies have also shown strong tectonic activity along the northern segment. Yan et al. [77] obtained the motion state of the Red River Fault Zone through sectional analysis based on the observation data of 144 GPS stations in the Red River Fault Zone and its adjacent areas from 2009 to 2014. The simulation results of fault dislocation showed that the locking degree of the northern section of the Red River Fault Zone is significantly higher than that of the central and southern sections. The locking coefficient of the northern section is 1.0 at a depth of 44 km, reaching the state of complete locking. The corresponding slip deficit of the northern section also decreases significantly from north to south. Xu et al. [6] used InSAR to obtain the co-seismic deformation field of the M6.4 earthquake that occurred in Yangbi County on 21 May 2021. They calculated the regional strain distribution and the Coulombic stress changes of neighboring faults caused by co-seismic dislocation. The Longpan–Qiaohou Fault, Chenghai Fault and northern Red River Fault Zone in the northwestern Yunnan tectonic area show a Coulomb stress increase, and the Coulomb stress increase in the northern Red River Fault Zone is the most significant, reaching 0.01 MPa. Numerous studies have shown that the northern segment of the Red River Fault Zone currently has continuous strain accumulation, large deformation width of the fault zone and a high degree of locking, which is manifested as an area with significantly high values of tensile strain and shear strain. The high-strain state indicates that the current tectonic stress is strong, and the high slip rate also reveals the activity of deep fault deformation in this area [48,78,79,80,81]. Considering that the stream geomorphic indices are not greatly influenced by lithology and climate factors, the major role played by tectonic processes is illustrated. The stream geomorphic indices show high values in the northern segment along the Cangshan Piedmont Fault to the Midu Basin Margin Fault, indicating that the neotectonic activity in this region is higher than elsewhere, and the values gradually decrease from north to south, indicating that the tectonic activity is highest along the Cangshan Piedmont Fault and decreases progressively to the south.
During the collision between the Indian Plate and the Eurasian Plate, the pushing of the Indian Plate in the northward and east–northeastward directions shortened, thickened and uplifted the crust of the Qinghai–Tibet Plateau and resulted in rotation and extrusion in the southeast direction. The movement of the southwest Qinghai–Tibet Plateau block was blocked by the Kunlun Mountain–Xianshuihe Fault, which made the block slip in the southeast direction. As a result, the Sichuan–Yunnan rhomboid block has experienced extrusion in a south–southeast direction [82]. The Red River Fault Zone is the southwestern boundary of the Sichuan–Yunnan rhomboid block, and the southward movement of the Sichuan–Yunnan block pushes and deforms the Red River Fault Zone, resulting in the right-lateral movement of the fault zone (Figure 16). Therefore, the activity of the Red River Fault Zone is controlled by the combined action of the ENE pushing of the Indian Plate, the SE extrusion of the Qinghai–Tibet Plateau, and the SE extrusion of the Sichuan–Yunnan rhomboid block, all of which play a crucial role in generating the forces driving activity along the Red River Fault Zone [30,83,84].
Resulting from the combined effects of the above pressures, large-scale dextral strike-slip movement has occurred in the Red River Fault Zone since the Quaternary, resulting in dextral slip in the eastern block of the fault zone, mass loss at the northern end and the formation of an extensional zone in the northern segment of the fault zone, as shown in the geometric model diagram of tension–shear activity in the northern segment of the Red River Fault Zone (Figure 17). The Cangshan Piedmont Fault and Fengyi–Dingxiling Fault in the northern section are tensile normal faults with dextral strike-slip motion. Second, in the northern section, a left-stepping en echelon arrangement of basins formed, including the Eryuan Basin, Dali Basin, Fengyi Basin and Midu Basin. They are triangular in shape, and the opening at the northwestern end and convergence at the southeastern end are the products of right-lateral extension. The above combined tectonic forces also cause the block located between faults to have a rotational motion. With the Red River Fault Zone as the boundary, the eastern blocks move clockwise and the western blocks move counterclockwise. The eastern block rotation occurred with the sinistral strike-slip movement of Chenghai Fault, Heqing–Eryuan Fault and Zhongdian–Jianchuan Fault. The western block move counterclockwise with the dextral strike-slip movement of the Red River Fault Zone and the Longling–Lancangjiang Fault [30]. The northern part of the Red River Fault Zone is the main location of the movement and deformation of the Sichuan–Yunnan Block, and this zone takes on and absorbs the movement energy and strain transferred by the northern Sichuan–Yunnan Block [85,86,87,88]. The trend of weakening activity in the northern segment from north to south may be the result of the gradual weakening of energy from the north in the southward transmission process. If the southeastward extrusion of the Qinghai–Tibet Plateau is considered the main driving force for the Sichuan–Yunnan Block movement with the Red River Fault Zone as the southwestern boundary, then the current weakening trend of the Red River Fault Zone from north to south indicates that the influence range of the lateral extrusion of the Qinghai–Tibet Plateau seems to be limited. It will be of great scientific value to study the influence of the lateral compression of the Tibetan Plateau on crustal deformation in the Sichuan–Yunnan region to further explore the dynamic mechanism of strong earthquake activity in the Sichuan–Yunnan region [15,83,84,89,90,91].

6. Conclusions

Based on DEM data, we used ArcGIS and MATLAB to extract several stream geomorphic indices. The information provided by the channel geomorphology regarding the activity of the Cangshan Piedmont Fault, Fengyi–Dingxiling Fault and Midu Basin Margin Fault in the northern segment of the Red River Fault Zone was quantitatively analyzed. The results showed the following:
(1)
The comprehensive analysis of multiple indices shows that the degree of activity along the northern segment of the Red River Fault Zone is relatively high, indicating that the future strong earthquake risk of the northern segment is worthy of attention.
(2)
The difference of tectonic activity intensity in the northern segment of the Red River Fault Zone is the main factor affecting the river landform change. The activity of the Cangshan Piedmont Fault is the highest. The spatial difference in geomorphic index values reflects the trend of decreasing activity in the northern segment from north to south, which is consistent with the trend of decreasing activity in the Red River Fault Zone from the northern segment to the middle and southern segments.
(3)
Among the factors of climate, lithology and tectonics, neotectonics are the main factor controlling the fluvial geomorphology development of each secondary fault in the northern segment of the Red River Fault Zone. The relative strength of tectonic activity in the northern segment of the Red River Fault Zone obtained by fluvial geomorphology is consistent with the findings of previous studies, indicating that drainage basins can effectively reflect regional differences in tectonic activity.

Author Contributions

Conceptualization, Z.H.; Data curation, L.L.; Formal analysis, L.G. and L.L.; Funding acquisition, Z.H.; Investigation, L.G. and L.L.; Methodology, Z.H. and L.G.; Project administration, Z.H.; Resources, Z.H.; Software, L.G.; Supervision, Z.H.; Validation, L.G.; Visualization, L.L.; Writing—original draft, L.G.; Writing—review and editing, Z.H. All authors have read and agreed to the published version of the manuscript.

Funding

This research was funded by National Science and Technology Basic Resources Investigation Program of China, grant number 2021FY100104; National Natural Science Foundation of China, grant number 41872227 and Research Grant from National Institute of Natural Hazards, Ministry of Emergency Management of China, grant number ZDJ2019-21.

Data Availability Statement

The topography data are from the website (https://tandemx-science.dlr.de, accessed on 3 June 2022). The earthquake catalog data are from the website (https://data.earthquake.cn, accessed on 7 November 2022). The regional lithologic data are from the website (https://www.ngac.org.cn, accessed on 4 November 2022).

Acknowledgments

We thank the reviewers and editors for their help in improving the manuscript.

Conflicts of Interest

The authors declare no conflict of interest.

References

  1. Royden, L.H.; Burchfiel, B.C.; King, R.W.; Wang, E.; Chen, Z.; Shen, F.; Liu, Y. Surface deformation and lower crustal flow in eastern Tibet. Science 1997, 276, 788–790. [Google Scholar] [CrossRef]
  2. Royden, L.H.; Burchfiel, B.C.; van der Hilst, R.D. The geological evolution of the Tibetan Plateau. Science 2008, 321, 1054–1058. [Google Scholar] [CrossRef]
  3. Clark, M.K.; Royden, L.H. Topographic ooze: Building the eastern margin of Tibet by lower crustal flow. Geology 2000, 28, 703–706. [Google Scholar] [CrossRef]
  4. Shen, F.; Royden, L.H.; Burchfiel, B.C. Large-scale crustal deformation of the Tibetan Plateau. J. Geophys. Res. Solid Earth 2001, 106, 6793–6816. [Google Scholar] [CrossRef]
  5. Su, Y.J.; Qin, J.Z. Relationship between strong seismic activity and regional neotectonic movement in Sichuan-Yunnan Area. Earthq. Res. China 2001, 17, 24–34. [Google Scholar]
  6. Xu, X.X.; Ji, L.Y.; Zhu, L.Y.; Wang, G.M.; Zhang, W.T.; Li, N. The co-seismic defomation characteristics and seismogenic structure of the Yangbi M,6.4 earthquake. Seismol. Geol. 2021, 43, 771–789. [Google Scholar]
  7. Wan, Y.K.; Shen, X.Q.; Liu, R.F.; Liu, X.; Zheng, Z.J.; Li, Y.; Zhang, Y.; Wang, L. Present motion and stress distribution of active block boundary faults in Sichuan-Yunnan region. Seismol. Geol. 2021, 43, 1614. [Google Scholar]
  8. Molnar, P.; Tapponnier, P. Cenozoic tectonics of Asia: Effects of a continental collision. Science 1975, 189, 419–426. [Google Scholar] [CrossRef] [PubMed]
  9. Allen, C.R.; Gillespie, A.R.; Yuan, H.A.N.; Sieh, K.E.; Buchun, Z.; Chengnan, Z.H.U. Red River and associated faults, Yunnan Province, China: Quaternary geology, slip rates, and seismic hazard. GSA Bull. 1984, 95, 686–700. [Google Scholar] [CrossRef]
  10. Replumaz, A.; Lacassin, R.; Tapponnier, P.; Leloup, P.H. Large river offsets and Plio-Quaternary dextral slip rate on the Red River fault (Yunnan, China). J. Geophys. Res. Solid Earth 2001, 106, 819–836. [Google Scholar] [CrossRef]
  11. Liu, B.M.; Xia, B.; Li, X.X.; Zhang, M.Q.; Niu, B.H.; Zhong, L.F.; Jin, Q.H.; Ji, S.C. Southeast extension of Honghe fault zone and its tectonic evolution significance. Sci. China D Earth Sci. 2006, 36, 914–924. [Google Scholar]
  12. Cao, S.Y.; Liu, J.L.; Bernd, L.; Zhao, C.Q. New Zircon U-Pb geochronology of the post-kinematic granitic plutons in the Diancang Shan metamorphic massif along the Ailao Shan-Red River shear zone and its geological implications. Acta Geol. Sin. Engl. Ed. 2010, 84, 1474–1487. [Google Scholar] [CrossRef]
  13. Zuchiewicz, W.; Cu’ò’ng, N.Q.; Zasadni, J.; Yêm, N.T. Late Cenozoic tectonics of the Red River Fault Zone, Vietnam, in the light of geomorphic studies. J. Geodyn. 2013, 69, 11–30. [Google Scholar] [CrossRef]
  14. Fyhn, M.B.W.; Phach, P.V. Late Neogene structural inversion around the northern Gulf of Tonkin, Vietnam: Effects from right-lateral displacement across the Red River fault zone. Tectonics 2015, 34, 290–312. [Google Scholar] [CrossRef]
  15. Yu, N.; Unsworth, M.; Wang, X.B.; Li, D.W.; Wang, E.C.; Li, R.H.; Hu, Y.B.; Cai, X.L. New insights into crustal and mantle flow beneath the Red river fault zone and adjacent areas on the Southern margin of the Tibetan Plateau revealed by a 3-D magnetotelluric study. J. Geophys. Res. Solid Earth 2020, 125, e2020JB019396. [Google Scholar] [CrossRef]
  16. Wen, X.Z.; Ma, S.L.; Fang, L.H.; Liang, M.J.; Du, F.; Long, F.; Zhao, X. Complex structural fault system and distributed deformation across the Big Bend of the Red River fault, Yunnan, China. Phys. Earth Planet. Inter. 2022, 333, 106942. [Google Scholar] [CrossRef]
  17. Zhong, D.B.; Tapponnier, P.; Wu, H.W.; Zhang, L.S. Large strike-slip fault-an important form of intracontinental deformation after collision. Chin. Sci. Bull. 1989, 34, 526–529. [Google Scholar]
  18. Tapponnier, P.; Lacassin, R.; Leloup, P.H.; Schärer, U.; Dalai, Z.; Haiwei, W.; Xiaohan, L.; Shaocheng, J.; Lianshang, Z.; Jiayou, Z. The Ailao Shan/Red River metamorphic belt: Tertiary left-lateral shear between Indochina and South China. Nature 1990, 343, 431–437. [Google Scholar] [CrossRef]
  19. Leloup, P.H.; Lacassin, R.; Tapponnier, P.; Schärer, U.; Zhong, D.; Liu, X.; Zhang, L.; Ji, S.; Trinh, P.T. The Ailao Shan-Red River shear zone (Yunnan, China), tertiary transform boundary of Indochina. Tectonophysics 1995, 251, 3–84. [Google Scholar] [CrossRef]
  20. Roger, F.; Leloup, P.H.; Jolivet, M.; Lacassin, R.; Trinh, P.T.; Brunel, M.; Seward, D. Long and complex thermal history of the Song Chay metamorphic dome (Northern Vietnam) by multi-system geochronology. Tectonophysics 2000, 321, 449–466. [Google Scholar] [CrossRef]
  21. Zhou, Y.; Zhou, P.; Wu, S.M.; Shi, X.B.; Zhang, J.J. Magnetic fabric study across the Ailao Shan–Red River shear zone. Tectonophysics 2002, 346, 137–150. [Google Scholar] [CrossRef]
  22. Xiang, H.F.; Han, Z.J.; Guo, S.M.; Zhang, W.X.; Chen, L.C. Large-scale dextral strike-slip movement and associated tectonic geomorphology deformation in the Honghe fault zone. Seismol. Geol. 2004, 26, 597–610. [Google Scholar]
  23. Xiang, H.F.; Wan, J.L.; Han, Z.J.; Guo, S.M.; Zhang, W.X.; Chen, L.C.; Dong, X.Q. Geological analysis and FT dating of the occurrence time of large dextral strike-slip movement in the Honghe Fault zone. Sci. China D Earth Sci. 2006, 36, 977–987. [Google Scholar]
  24. Zhang, Q.Z.; Liu, Y.P.; Chen, Z.L.; Tang, W.Q.; Zhang, X.Y. GPS monitoring of the Red River Break. J. Earth Sci. 2006, 27, 367–372. [Google Scholar]
  25. Zhang, B.L.; Liu, R.X.; Xiang, H.F.; Chu, Q.Z.; Huang, X.N.; Zheng, Y.G. Fractal characteristics and rheological parameters of mylonite in the mid-southern section of Honghe fault zone. Seismol. Geol. 2008, 30, 473–483. [Google Scholar]
  26. Zhang, B.L.; Liu, R.X.; Xiang, H.F.; Wang, J.; Huang, X.N. Tectonic-rock characteristics and stress field evolution of fault activity in the mid-southern section of Honghe fault zone. J. Petrol. Mineral. 2008, 27, 529–537. [Google Scholar]
  27. Gilley, L.D.; Harrison, T.M.; Leloup, P.H.; Ryerson, F.J.; Lovera, O.M.; Wang, J.-H. Direct dating of left-lateral deformation along the Red River shear zone, China and Vietnam. J. Geophys. Res. Solid Earth 2003, 108, 2127. [Google Scholar] [CrossRef]
  28. Guo, S.M.; Li, X.Y.; Xiang, H.F. Kinematic Model and Modern Crustal Movement of the Tail Extension Area of the Honghe Strike-Slip Fault in Yunnan Province (5); Seismological Press: Beijing, China, 1991. [Google Scholar]
  29. Institute of Geology; China Earthquake Administrator; Yunnan Province Seismological Bureau. Active Faults in Northwest Yunnan; Seismological Press: Beijing, China, 1990.
  30. Guo, S.M.; Ji, F.J.; Xiang, H.F.; Dong, X.Q.; Yan, F.H.; Zhang, S.L.; Li, X.Y.; Zhang, W.X. Honghe Active Fault Zone Chinese Active Fault Research Album; Ocean Press: Beijing, China, 2001. [Google Scholar]
  31. Zhang, Q.Z.; Liu, Y.P.; Chen, Z.L.; Tang, W.Q. GPS data inversion of the Honghe fault zone. Prog. Geophys. 2007, 22, 48–421. [Google Scholar]
  32. Zhang, J.G. Study on the Fault Activity of Honghe River in Central Vietnam; University of Science and Technology of China: Hefei, China, 2009. [Google Scholar]
  33. Hack, J. Studies of Longitudinal Profiles in Virginia and Maryland: U.S. Geological Survey Professional Paper 294B; United States Government Printing Office: Washington, DC, USA, 1957.
  34. Whipple, K. Bedrock rivers and the geomorphology of active orogens. Annu. Rev. Earth Planet. Sci. 2004, 32, 151. [Google Scholar] [CrossRef]
  35. Kirby, E.; Whipple, K.X. Expression of active tectonics in erosional landscapes. J. Struct. Geol. 2012, 44, 54–75. [Google Scholar] [CrossRef]
  36. Schwanghart, W.; Kuhn, N.J. TopoToolbox: A set of Matlab functions for topographic analysis. Environ. Model. Softw. 2010, 25, 770–781. [Google Scholar] [CrossRef]
  37. Schwanghart, W.; Scherler, D. Short communication: TopoToolbox 2–MATLAB-based software for topographic analysis and modeling in Earth surface sciences. Earth Surf. Dynam. 2014, 2, 1–7. [Google Scholar] [CrossRef]
  38. Willett, S.D.; McCoy, S.W.; Perron, J.T.; Goren, L.; Chen, C.Y. Dynamic reorganization of river basins. Science 2014, 343, 1248765. [Google Scholar] [CrossRef]
  39. Dai, Y.; Wang, X.Y.; Wang, S.L.; Li, Y.Q.; Lu, H.Y. The neotectonic activity of Wanchuan River Basin in the northeastern Tibetan Plateau reflected by geomorphologic morphology index. Acta Geogr. Sin. 2016, 71, 412–421. [Google Scholar] [CrossRef]
  40. Xu, W.; Yuan, Z.D.; Liu, Z.C.; Gao, Z.W. Fluvial geomorphic parameters and their neotectonic significance at the northern foot of Zhongtiaoshan Mountains. Arid Land Geogr. 2018, 41, 1009–1017. [Google Scholar]
  41. Forte, A.; Whipple, K. Short communication: The Topographic Analysis Kit (TAK) for TopoToolbox. Earth Surf. Dyn. 2019, 7, 87–95. [Google Scholar] [CrossRef]
  42. Wang, J.Y.; He, Z.T. Responses of stream geomorphic indices to piedmont fault activity in the Daqingshan area of China. J. Earth Sci. 2020, 31, 978–987. [Google Scholar] [CrossRef]
  43. Defo, P.L.W.; Owona, S.; Nsangou Ngapna, M.; Balla Ateba, C.; Mwabanua Mutabi, C. Post-orogenic transients and relict landforms of the Bafoussam-Mamfe region (West-Cameroon Highland margin). J. Mt. Sci. 2022, 19, 2180–2201. [Google Scholar] [CrossRef]
  44. Ji, F.J.; Guo, S.M.; Xiang, H.F. Spatial-temporal evolution of quaternary activity of the Honghe Fault zone. Seismol. Geol. 1997, 19, 108–114. [Google Scholar]
  45. Schoenbohm, L.M.; Burchfiel, B.C.; Liangzhong, C.; Jiyun, Y. Miocene to present activity along the Red River fault, China, in the context of continental extrusion, upper-crustal rotation, and lower-crustal flow. GSA Bull. 2006, 118, 672–688. [Google Scholar] [CrossRef]
  46. Shi, X.H.; Sieh, K.; Weldon, R.; Zhu, C.N.; Han, Y.; Yang, J.W.; Robinson, S.W. Slip rate and rare large prehistoric earthquakes of the Red River fault, Southwestern China. Geochem. Geophys. Geosys. 2018, 19, 2014–2031. [Google Scholar] [CrossRef]
  47. Yin, F.L.; Jiang, C.S.; Han, L.B.; Zhang, H.; Zhang, B. Seismic hazard assessment for the Red River fault: Insight from Coulomb stress evolution. Chin. J. Geophys. 2018, 61, 183–198. [Google Scholar]
  48. Li, N.; Kang, S.; Zhu, L.Y. To study the current locking degree and seismic risk of the Honghe fault zone based on GPS data. J. Geod. Geodyn. 2019, 39, 700–705. [Google Scholar]
  49. Xiang, H.F.; Guo, S.M.; Zhang, W.X.; Han, Z.J. Quantitative study of large dextral dislocations in the southern segment of Honghe Fault Zone since Miocene. Seismol. Geol. 2007, 29, 52–68. [Google Scholar]
  50. Wang, J.; Shen, C.Y.; Sun, W.K.; Tan, H.B.; Hu, M.Z.; Liang, W.F.; Han, Y.F.; Zhang, X.L.; Wu, G.J.; Wang, Q.H. Study on present gravity change and deep crust deformation in the Northern and middle sections of the red river fault zone. Seismol. Egol. 2021, 43, 1537. [Google Scholar] [CrossRef]
  51. Guo, S.M.; Xiang, H.F.; Ji, F.J.; Zhang, W.X. Study on the relationship between Quaternary dextral strike-slip and caudal extension transformation in the Honghe Fault zone. Seismol. Geol. 1996, 4, 301–309. [Google Scholar]
  52. Trinh, P.T.; Liem, N.V.; Huong, N.V.; Vinh, H.Q.; Thom, B.V.; Thao, B.T.; Tan, M.T.; Hoang, N. Late Quaternary tectonics and seismotectonics along the Red River fault zone, North Vietnam. Earth-Sci. Rev. 2012, 114, 224–235. [Google Scholar] [CrossRef]
  53. Scherler, D.; Bookhagen, B.; Strecker, M.R. Tectonic control on 10Be-derived erosion rates in the Garhwal Himalaya, India. J. Geophys. Res. Earth Surf. 2014, 119, 83–105. [Google Scholar] [CrossRef]
  54. Schmidt, K.M.; Montgomery, D.R. Limits to relief. Science 1995, 270, 617–620. [Google Scholar] [CrossRef]
  55. Whipple, K.X.; Kirby, E.; Brocklehurst, S.H. Geomorphic limits to climate-induced increases in topographic relief. Nature 1999, 401, 39–43. [Google Scholar] [CrossRef]
  56. Ouimet, W.B.; Whipple, K.X.; Granger, D.E. Beyond threshold hillslopes: Channel adjustment to base-level fall in tectonically active mountain ranges. Geology 2009, 37, 579–582. [Google Scholar] [CrossRef]
  57. Whipple, K.X.; Tucker, G.E. Dynamics of the stream-power river incision model: Implications for height limits of mountain ranges, landscape response timescales, and research needs. J. Geophys. Res. Solid Earth 1999, 104, 17661–17674. [Google Scholar] [CrossRef]
  58. Liang, O.B.; Ren, J.J.; Lu, Y.W. Response of fluvial geomorphological characteristics to Huya fault zone activity in the Fujiang River Basin. Seismol. Geol. 2018, 40, 42. [Google Scholar]
  59. Liang, O.B. Fluvial Geomorphic Index and Its Tectonic Significance at the Eastern Foot of Helan Mountain; Institute of Crustal Stress, China Earthquake Administration: Beijing, China, 2019.
  60. Singh, O.; Sarangi, A.; Sharma, M.C. Hypsometric integral estimation methods and its relevance on erosion status of North-Western lesser Himalayan Watersheds. Water Resour. Manag. 2008, 22, 1545–1560. [Google Scholar] [CrossRef]
  61. Pérez-Peña, J.V.; Azañón, J.M.; Booth-Rea, G.; Azor, A.; Delgado, J. Differentiating geology and tectonics using a spatial autocorrelation technique for the hypsometric integral. J. Geophys. Res. Earth Surf. 2009, 114, F02018. [Google Scholar] [CrossRef]
  62. Davis, W.M. The geographical cycle. Geogr. J. 1899, 14, 481–504. [Google Scholar] [CrossRef]
  63. Strahler, A.N. Hypsometric (area-altitude) analysis of erosional topography. GSA Bull. 1952, 63, 1117–1142. [Google Scholar] [CrossRef]
  64. Xin, Z.B.; Xu, J.X.; Ma, Y.X. Hypsometric integral analysis and its sediment yield implications in the Loess Plateau. China J. Mt. Sci. 2008, 3, 335–363. [Google Scholar]
  65. Chen, Y.J.; Song, G.C.; Chen, Z.N. Model of river hydraulic erosion in disequilibrium mountains. Chin. Sci. Bull. 2006, 7, 865–869. [Google Scholar]
  66. Pike, R.J.; Wilson, S.E. Elevation-relief ratio, hypsometric integral, and geomorphic area-altitude analysis. GSA Bull. 1971, 82, 1079–1084. [Google Scholar] [CrossRef]
  67. Tinkler, K.J.; Wohl, E.E. Rivers Over Rock: Fluvial Processes in Bedrock Channels; American Geophysical Union: Washington, DC, USA, 1998. [Google Scholar]
  68. Whittaker, A.C. How do landscapes record tectonics and climate? Lithosphere 2012, 4, 160–164. [Google Scholar] [CrossRef]
  69. Lague, D. The stream power river incision model: Evidence, theory and beyond. Earth Surf. Process. Landf. 2014, 39, 38–61. [Google Scholar] [CrossRef]
  70. Snyder, N.P.; Whipple, K.X.; Tucker, G.E.; Merritts, D.J. Landscape response to tectonic forcing: Digital elevation model analysis of stream profiles in the Mendocino triple junction region, northern California. GSA Bull. 2000, 112, 1250–1263. [Google Scholar] [CrossRef]
  71. Kirby, E.; Whipple, K. Quantifying differential rock uplift rates via stream profi le analysis: Geology. Geology 2001, 29, 415–418. [Google Scholar] [CrossRef]
  72. Wobus, C.; Whipple, K.X.; Kirby, E.; Snyder, N.; Johnson, J.; Spyropolou, K.; Crosby, B.; Sheehan, D. Tectonics from topography: Procedures, promise, and pitfalls. In Tectonics, Climate, and Landscape Evolution; Willett, S.D., Hovius, N., Brandon, M.T., Fisher, D.M., Eds.; Geological Society of America: Boluder, CO, USA, 2006; Volume 398, pp. 55–74. [Google Scholar]
  73. Flint, J.J. Stream gradient as a function of order, magnitude, and discharge. J. Water Resour. Res. 1974, 10, 969–973. [Google Scholar] [CrossRef]
  74. Wang, W.B.; Chen, X.Z. Comparison of principal component analysis and factor analysis methods in multi-index comprehensive evaluation. J. Stat. Inf. Forum 2006, 5, 19–22. [Google Scholar]
  75. Zhang, J.G.; Xie, Y.Q.; Jin, M.P. Study on the Activity of Honghe Fault in Central Vietnam; Yunnan Science and Technology Press: Kunming, China, 2009. [Google Scholar]
  76. Wang, S.J.; Zhang, J.G.; Yu, Q.K.; Long, X.F. Focal mechanism and modern tectonic stress field of Honghe fault zone. Geoseismic. Res. 2010, 3, 200–207. [Google Scholar]
  77. Yan, H.H.; Qiao, X.J.; Nie, Z.S.; Wang, W.; Zhao, B. The characteristics of crustal deformation and fault movement in the Honghe fault zone were studied by GPS. J. Geomat. 2019, 44, 36–40. [Google Scholar]
  78. Sun, G.H.; Peng, X.C.; Huang, Y.J. Geological structure characteristics of Yingge Sea Member of Honghe Fault zone. Acta Geol. Sinica 2013, 87, 154–166. [Google Scholar]
  79. Sun, Y.M.; Li, J.P. Current slip rate and strain accumulation in different tectonic segments of the Honghe fault zone. J. Trop. Oceanogr. 2018, 37, 89–96. [Google Scholar]
  80. Lu, X.F.; Tan, K.; Li, Q.; Li, C.T.; Wang, D.Z.; Zhang, C.H. Analysis of the current activity of the Red River fault based on GPS data: New seismological inferences. J. Seismol. 2021, 25, 1525–1535. [Google Scholar] [CrossRef]
  81. Wang, J.Y.; Xu, C.J.; Wen, Y.M.; Zang, J.F.; Xiao, Z.H. Characteristics of segmentation and interseismic coupling along the Red River fault from GPS observations. Chin. J. Geophys. 2022, 65, 1240–1254. [Google Scholar]
  82. Ding, G. Cluster and migration of fault activity on Quaternary faults. Quat. Sci. 1989, 1, 36–47. [Google Scholar]
  83. Huangfu, G.; Shi, S.X.; Su, Y.J. Study on seismic activity in Yunnan in the 20th century. Seismol. Res. 2000, 23, 1–9. [Google Scholar]
  84. Huangfu, G.; Qin, J.Z. Study on the regularity of large earthquakes in Yunnan Province. Seismol. Geol. 2006, 28, 37. [Google Scholar]
  85. Jiang, W.L.; Zhang, J.F.; Tian, T.; Wang, X. Crustal structure of Chuan-Dian region derived from gravity data and its tectonic implications. Phys. Earth Planet. Inter. 2012, 212–213, 76–87. [Google Scholar] [CrossRef]
  86. Chang, Z.F.; Zhang, Y.F.; Li, J.L.; Zang, Y. Geological and geomorphic manifestations of late Quaternary activity in Deqin-Zhongdian-Daju Fault. Seismol. Res. 2014, 37, 46–52. [Google Scholar]
  87. Chang, Z.F.; Chang, H.; Zang, Y.; Dai, B.Y. New activity characteristics of Weixi-Qiaohou fault and its relationship with Honghe fault. Chin. J. Geomech. 2016, 22, 517–530. [Google Scholar]
  88. Gao, Y.; Shi, Y.T.; Wang, Q. Seismic anisotropy in the southeastern margin of the Tibetan Plateau and its implications for deep tectonics. Chin. J. Geophys. 2020, 63, 802–816. [Google Scholar]
  89. Zhang, P.Z. Kinematics of present tectonic deformation in and around the Qinghai-Tibet Plateau. Seismol. Geol. 2004, 26, 367–376. [Google Scholar]
  90. Xu, X.W.; Wen, X.Z. Newly modified and changing patterns of active blocks in Sichuan-Yunnan region and their dynamic sources. Sci. China D 2003, 33, 151–162. [Google Scholar]
  91. Zhang, J.G.; Huangfu, G.; Xie, Y.Q. Investigation and research of Honghe fault zone in Zhongyue (I). J. Seismol. Res. 2008, 31, 362–368. [Google Scholar]
Figure 1. Regional geological setting ((a): The northern segment of Red River Fault Zone; (b): Southeastern margin of Qinghai-Tibet Plateau). (Q−TP: Qinghai−Tibet Plateau; SB: Sichuan Basin; SCB: South China Block; ICB: Indochina Block; S−YB: Sichuan−Yunnan Block; LMSFZ: Longmenshan Fault Zone; XSHF: Xianshuihe Fault; ANHF: Anninghe Fault; ZMHF: Zemuhe Fault; XJF: Xiaojiang Fault; RRFZ: Red River Fault Zone; LCJF: Lancangjiang Fault; JSJF: Jinshajiang Fault; NJF: Nujiang Fault; W−QF: Weixi−Qiaohou Fault; Z−L−QF: Zhongdian−Longpan−Qiaohou Fault; X−LF: Xiaojinhe−Lijiang Fault; N−WF: Nanjin−Weishan Fault; CHF: Chenghai Fault; N−CF: Nanhua−Chuxiong Fault; DEM data are TANDEM−X with resolution of 12 m, from https://tandemx-science.dlr.de, accessed on 3 June 2022.; earthquake catalog data from https://data.earthquake.cn, accessed on 7 November 2022).
Remotesensing 15 00988 g001
Figure 2. Secondary fault and stream distributions in the northern segment of the Red River Fault Zone (F1 Eryuan Fault; F2 Cangshan Piedmont Fault; F3 Fengyi–Dingxiling Fault; F4 Midu Basin Margin Fault; the DEM range is the minimum watershed range containing the above faults).
Remotesensing 15 00988 g002
Figure 3. Slope (left) and RDLS (right) of the region.
Remotesensing 15 00988 g003
Figure 4. Average slope (left) and average RDLS (right) in the drainage basin of the Cangshan Piedmont Fault.
Remotesensing 15 00988 g004
Figure 5. Average slope (left) and average RDLS (right) in the drainage basin of the Fengyi–Dingxiling Fault.
Remotesensing 15 00988 g005
Figure 6. Average slope (left) and average RDLS (right) in the drainage basin of the Midu Basin Margin Fault.
Remotesensing 15 00988 g006
Figure 7. HI of drainage basins of the Cangshan Piedmont Fault.
Remotesensing 15 00988 g007
Figure 8. HI of drainage basins of the Fengyi–Dingxiling Fault.
Remotesensing 15 00988 g008
Figure 9. HI of drainage basins of the Midu Basin Margin Fault.
Remotesensing 15 00988 g009
Figure 10. ksn of drainage basins of the Cangshan Piedmont Fault.
Remotesensing 15 00988 g010
Figure 11. ksn of drainage basins of the Fengyi–Dingxiling Fault.
Remotesensing 15 00988 g011
Figure 12. ksn of drainage basins of the Midu Basin Margin Fault.
Remotesensing 15 00988 g012
Figure 13. Comparison of ksn (a) and HI (b) values in basins along the secondary faults (F2: Cangshan Piedmont Fault; F3: Fengyi–Dingxiling Fault; F4: Midu Basin Margin Fault).
Remotesensing 15 00988 g013
Figure 14. Variation curve of factor 1 in the northern segment of Red River Fault Zone from north to south.
Remotesensing 15 00988 g014
Figure 15. Regional lithologic distribution map (from https://www.ngac.org.cn, accessed on 4 November 2022). (1: Holocene alluvium sediments; 2: Pleistocene alluvial sediments; 3: Tertiary; 4: Cretaceous; 5: Jurassic; 6: Triassic; 7: Permian; 8: Gray limestone; 9: Silurian; 10: Carboniferous; 11: Devonian; 12: Ordovician; 13: Precambrian metamorphic rocks; 14: Neoproterozoic; 15: Paleoproterozoic; 16: Brown schist; 17: Syenite porphyry; 18: Granite porphyry; 19: Diorite; 20: Granite; 21: Gabbro; 22: Mafic rock; 23: Diabase gabbro; 24: Lake).
Remotesensing 15 00988 g015
Figure 16. Crustal dynamics of the Qinghai–Tibet Plateau and its surrounding areas. XOB: Ximalaya Orogeny Belt; ATFZ: Altyn Tagh Fault Zone; QLSFA: Qilianshan Fault Zone; LMSF: Longmenshan Fault; A-XFZ: Anninghe–Xiaojiang Fault Zone; RRFZ: Red River Fault Zone; JSJFZ: Jinshajiang Fault Zone; K-XFZ: Kunlun–Xianshuihe Fault Zone.
Remotesensing 15 00988 g016
Figure 17. Geometric model diagram of tension–shear activity in the northern segment of the Red River Fault Zone. CHF: Chenghai Fault; H-EF: Heqing–Eryuan Fault; Z-JF: Zhongdian–Jianchuan Fault; RRFZ: Red River Fault Zone; L-LF: Longling–Lancangjiang Fault.
Remotesensing 15 00988 g017
Table 1. The HI values of drainage basins.
Drainage
Basin
HIDrainage
Basin
HIDrainage
Basin
HIDrainage
Basin
HIDrainage
Basin
HI
S10.63S160.64S310.44S460.60S610.46
S20.58S170.51S320.44S470.39S620.44
S30.55S180.47S330.44S480.47S630.48
S40.66S190.54S340.50S490.50S640.45
S50.51S200.61S350.39S500.44S650.45
S60.51S210.49S360.38S510.54S660.44
S70.51S220.48S370.56S520.60S670.37
S80.54S230.45S380.60S530.59S680.56
S90.64S240.40S390.48S540.66S690.39
S100.44S250.47S400.50S550.52S700.40
S110.58S260.58S410.46S560.58S710.56
S120.41S270.42S420.51S570.38S720.38
S130.47S280.40S430.40S580.39S730.57
S140.65S290.46S440.50S590.43S740.50
S150.52S300.41S450.45S600.37S750.44
Table 2. The ksn of streams.
StreamksnStreamksnStreamksnStreamksnStreamksn
R11966R161412R311518R46709R61446
R21808R171546R321454R47449R62578
R31501R181578R331306R48367R63532
R41440R191632R341257R49904R64478
R52410R201745R35951R50403R65440
R61181R212111R36875R51509R66314
R71356R221467R371179R52735R67412
R81596R231629R381179R53411R68331
R91691R241031R39413R541004R69358
R102512R251001R40549R55564R70126
R112400R261542R41450R56498R71356
R121085R271382R42702R57362R72336
R131653R281127R43362R58461R73381
R141416R29906R44634R59341R74239
R151429R301414R45740R60501R75544
Disclaimer/Publisher’s Note: The statements, opinions and data contained in all publications are solely those of the individual author(s) and contributor(s) and not of MDPI and/or the editor(s). MDPI and/or the editor(s) disclaim responsibility for any injury to people or property resulting from any ideas, methods, instructions or products referred to in the content.

