Article

Combining Remote Sensing Approaches for Detecting Marks of Archaeological and Demolished Constructions in Cahokia’s Grand Plaza, Southwestern Illinois

1
Environment and Sustainability Institute, University of Exeter, Penryn Campus, Penryn, Cornwall TR10 9FE, UK
2
College of Engineering, University of Baghdad, Baghdad 10001, Iraq
3
Taylor Geospatial Institute, Saint Louis University, St. Louis, MO 63108, USA
4
Department of Earth and Atmospheric Sciences, Saint Louis University, St. Louis, MO 63108, USA
*
Author to whom correspondence should be addressed.
Remote Sens. 2023, 15(4), 1057; https://doi.org/10.3390/rs15041057
Submission received: 20 December 2022 / Revised: 1 February 2023 / Accepted: 9 February 2023 / Published: 15 February 2023

Abstract

:
Remote sensing data are increasingly being used in digital archaeology for the potential non-invasive detection of archaeological remains. The purpose of this research is to evaluate the capability of standalone (LiDAR and aerial photogrammetry) and integration/fusion remote sensing approaches in improving the prospecting and interpretation of archaeological remains in Cahokia’s Grand Plaza. Cahokia Mounds is an ancient area; it was the largest settlement of the Mississippian culture located in southwestern Illinois, USA. There are a limited number of studies combining LiDAR and aerial photogrammetry to extract archaeological features. This article, therefore, combines LiDAR with photogrammetric data to create new datasets and investigate whether the new data can enhance the detection of archaeological/ demolished structures in comparison to the standalone approaches. The investigations are implemented based on the hillshade, gradient, and sky view factor visual analysis techniques, which have various merits in revealing topographic features. The outcomes of this research illustrate that combining data derived from different sources can not only confirm the detection of remains but can also reveal more remains than standalone approaches. This study demonstrates that the use of combination remote sensing approaches provides archaeologists with another powerful tool for site analysis.

1. Introduction

The application of non-invasive/non-destructive digital archaeology methods is vital to the ongoing effort to discover and identify potential archaeological remains. It is very difficult to reconstruct the archaeological record if an archaeological area is changed or destroyed by anthropogenic and destructive activities, especially when there is a lack of geospatial documentary data [1]. Although excavation is commonly used to identify remains, the process inherently removes evidence and can damage materials [1,2]. As a result, archaeologists often leave part of a site unexcavated to preserve it for future research using advanced techniques.
In the past 30 years, there has been a gradual shift from analogue to digital approaches in archaeology [3,4]. This paper makes a contribution to the ongoing development of digital approaches by investigating the effectiveness of methods that combine data from different digital sources.
While invasive methods continue to play a role in archaeological investigations, archaeologists are increasingly using geophysical and remote sensing methods [5,6,7]. Recently (since 2018), artificial intelligence (AI) approaches have also been used in archaeology based on the analysis of remote sensing data [8,9,10]. A very wide range of studies has been carried out in digital archaeology based on various remote sensing platforms [11,12,13,14,15,16,17,18,19,20]. The use of remote sensing data allows archaeologists to identify archaeological earthworks [11,12,13,14,15,21] and enhances the understanding of a known site/feature through better documentation. Such digital methods, e.g., photogrammetry and light detection and ranging (LiDAR), provide a non-destructive means of securing the “digital preservation” of archaeological areas as part of the process of preserving information about sites that are at risk of damage from various drivers (e.g., climate change, war, or development) [5].
In terms of quality and efficiency, the development of photogrammetry and LiDAR has led some studies to recommend applying one technique over another [14,15]. More recent studies, e.g., Liang et al., Filzwieser et al., and Luhmann [16,17,18], have found that combining both techniques is likely to boost the benefits of the acquired data to generate consistent and, to some extent, complete results. Hence, these methods could complement each other to enhance 2.5D and 3D models of archaeological areas [19,20]. The enhancement of 2.5D/3D models is conducted by combining various datasets through different approaches, such as data integration from the same sensor [22,23] and data integration from different sensors [18,24].
Data integration from the same sensor is an approach that has been applied in several archaeological studies such as [22,23,25]. The aim of this approach is to combine two or more different raster layers derived from the same source (photogrammetry or LiDAR). This integration is based on visual analysis techniques (VATs). VATs are techniques, such as hillshade, gradient, aspect, and the sky view factor (SVF), used to generate a realistic 2.5D raster from digital surface models (DSMs)/digital terrain models (DTMs). Each raster highlights traits of topographic surfaces. VATs are used to detect and interpret topographic features and to enhance the understanding of archaeological sites. Therefore, these techniques can be used towards the successful detection of archaeological features. The limitations of these approaches are mainly associated with illumination, raster distortion, and filtering; more information about these techniques is demonstrated in several archaeological studies, such as [26,27].
Previous studies such as [25,28,29,30] found that the edges of the archaeological features of the Barwhill in Scotland [30] and Beaufort County, South Carolina [28], were emphasised through red relief image maps (RRIMs). An RRIM is a VAT based on multiple layered topographic data, i.e., gradient and differential topographic data [24]. This raster is normally applied to archaeological sites since it provides a clearer and less-distorted view of topographic changes than the standalone VATs. Kokalj et al. [23] corroborated the conclusions of previous studies, suggesting the enhancement of the existing individual VATs to improve archaeological prospection and avoid missing possible remains. To enhance the visibility of detected remains, they created open-access relief visualisation tools (RVTs) to integrate various raster images derived from various fine LiDAR data (50 cm/pix and 25 cm/pix) from different archaeological areas. The study by Inomata et al. [25] was in line with previous studies such as Davis et al. [28] as they compared various VATs (e.g., hillshade, gradient, RVT, and RRIM) derived from LiDAR data (1 m/pix spatial resolution) under various conditions. The results of this study showed that the edge of marks is relatively more emphasized in RRIMs than in other applied VATs.
The second approach involves combining data from different sensors; this approach has been implemented in previous archaeological research, e.g., [18,24,31,32,33,34]. The concept of this approach is to combine two different remote sensing datasets, which are derived from different sources, after processing each one separately [35,36]. This includes the integration of 3D-to-3D dense cloud models [18,37,38] and 2D-to-2D raster images (photogrammetry and laser data) [18,24,31] to generate a new, enhanced, integrated dataset. Gunieri et al. [39] used photogrammetric and terrestrial laser scanning (TLS) data independently to create 3D models. After geo-referencing, both models were combined to generate a 3D representation of the area of interest (AOI).
A wealth of archaeological work has emphasised the importance of data combination in digital archaeology [23,37,39]. While a significant number of researchers have adopted the combination (integration/fusion) of TLS and photogrammetric point clouds for digital preservation [18,37,39,40,41,42], studies that combine LiDAR and photogrammetric data to detect archaeological remains are remarkably lacking [31]. Kokalj and Somrak [23] also emphasised the need to improve the detection of archaeological features by applying integrated approaches. This article, therefore, combines airborne LiDAR data with photogrammetric datasets to generate a new dataset in order to investigate whether the new data can enhance and improve the detection of archaeological remains at the Cahokia Grand Plaza study site in comparison to a standalone approach. We present results that were initially obtained from standalone approaches in order to critically investigate the enhanced potential of the new approach—the integration and fusion of LiDAR and photogrammetric data—in revealing a relatively greater level of detail (LOD) of the same archaeological area. Free, open-access LiDAR data are used for the AOI in this study as they are commonly used in archaeological studies, e.g., [2,28,43,44]. Drone photogrammetry is also used due to its cost-effectiveness compared to airborne photogrammetry. Ultimately, the aim of this research is to examine the capability of standalone and combination remote sensing approaches in enhancing the prospecting and interpretation of archaeological data. The approaches presented in this paper address a significant outstanding question related to the application of remote sensing in digital archaeology: which remote sensing combination approaches are most likely to improve the prospecting and interpretation of archaeological data? This question is divided into three sub-questions:
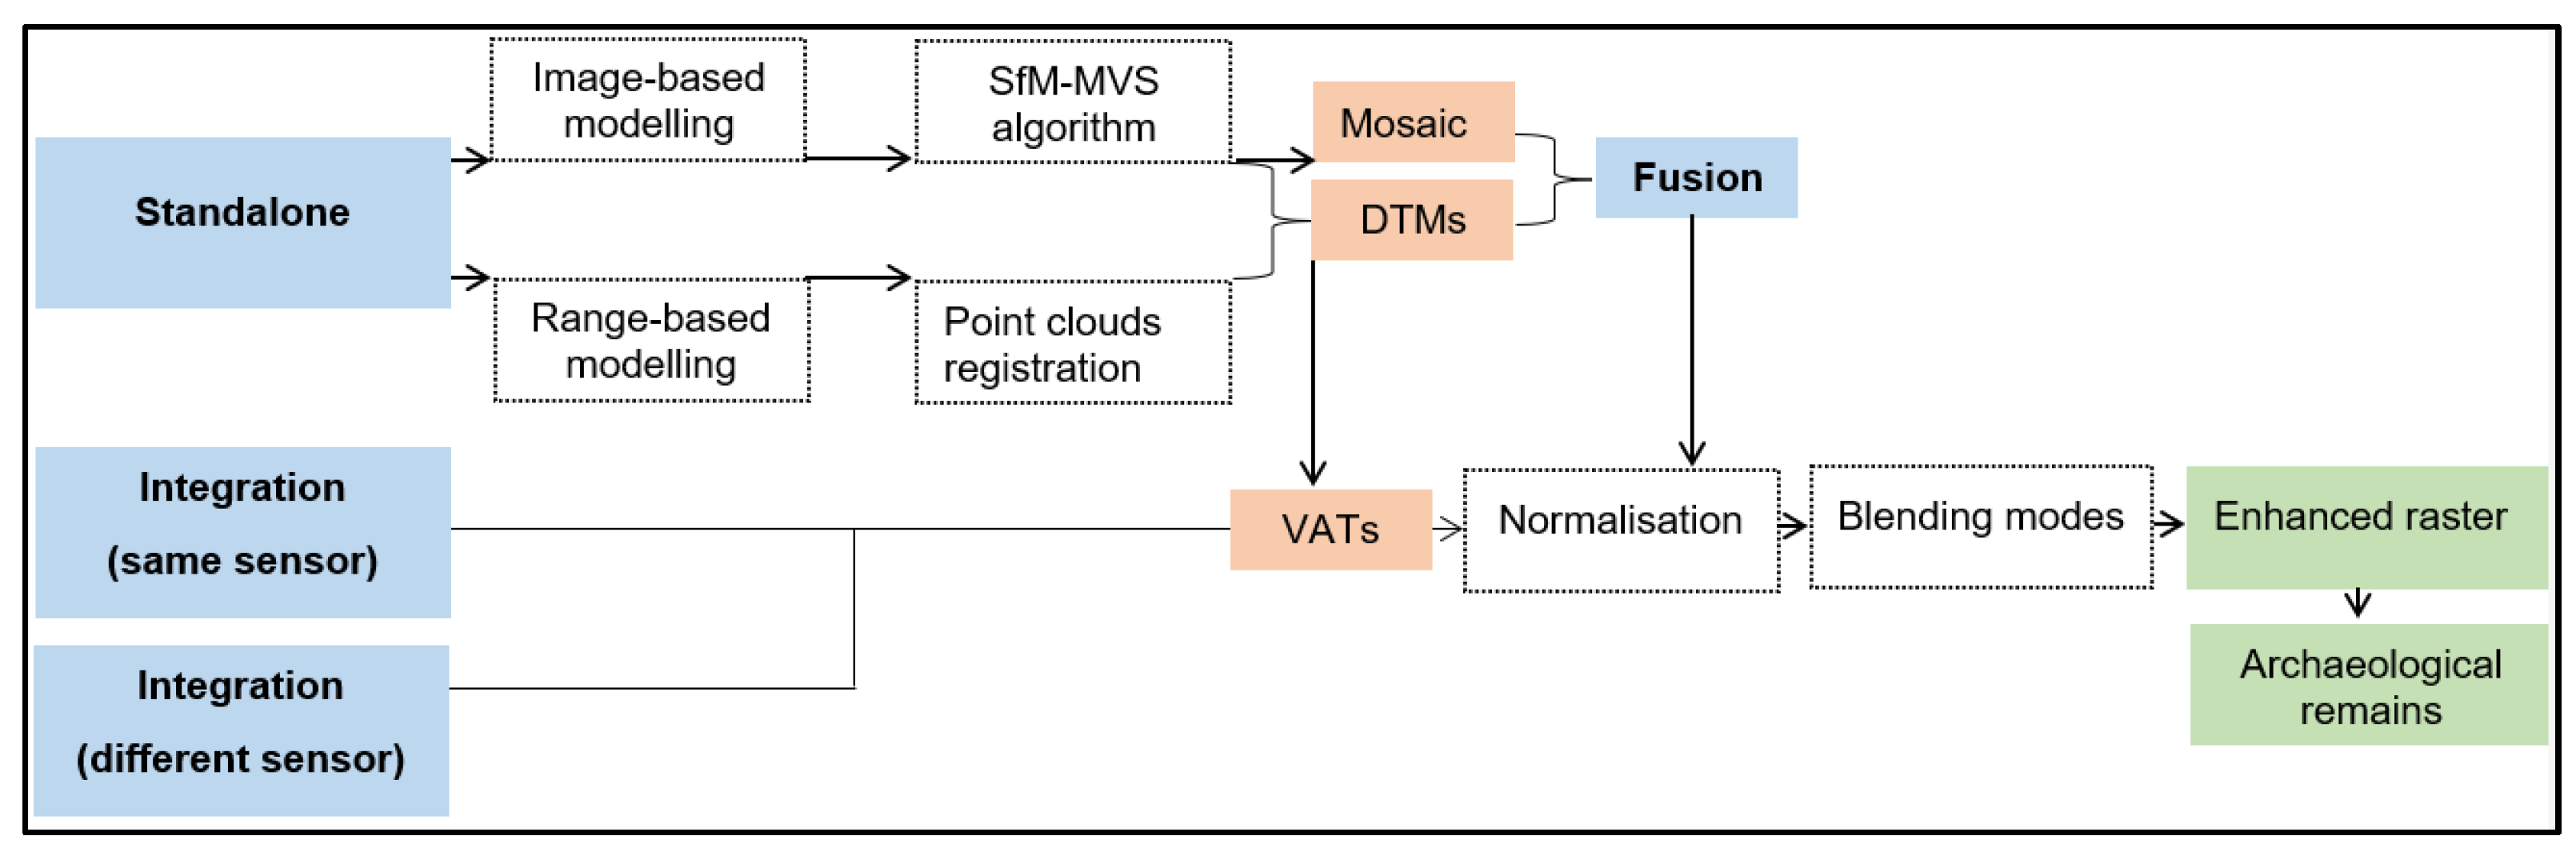
  • How can standalone approaches be successfully combined to develop a practical, supported procedure for the capture and representation of archaeological data?
  • What are the merits and limitations of individual sensors in observing and detecting archaeological sites?
  • Which remote sensing combination approaches provide the most LOD in comparison to standalone approaches?

2. Materials and Methods

This section comprises an introduction to the study area and the rationale for its selection, as well as a review of previous studies that conducted excavation works at the AOI. Demonstrating previous discoveries at the AOI is important to distinguish between the previous findings and those originally reported in this paper, which were produced using combined remote sensing approaches. This section also includes a discussion of data acquisition (LiDAR and aerial images) and the standalone and combination approaches applied for detecting archaeological remains. The flowchart below (Figure 1) displays the main steps accomplished in this study.

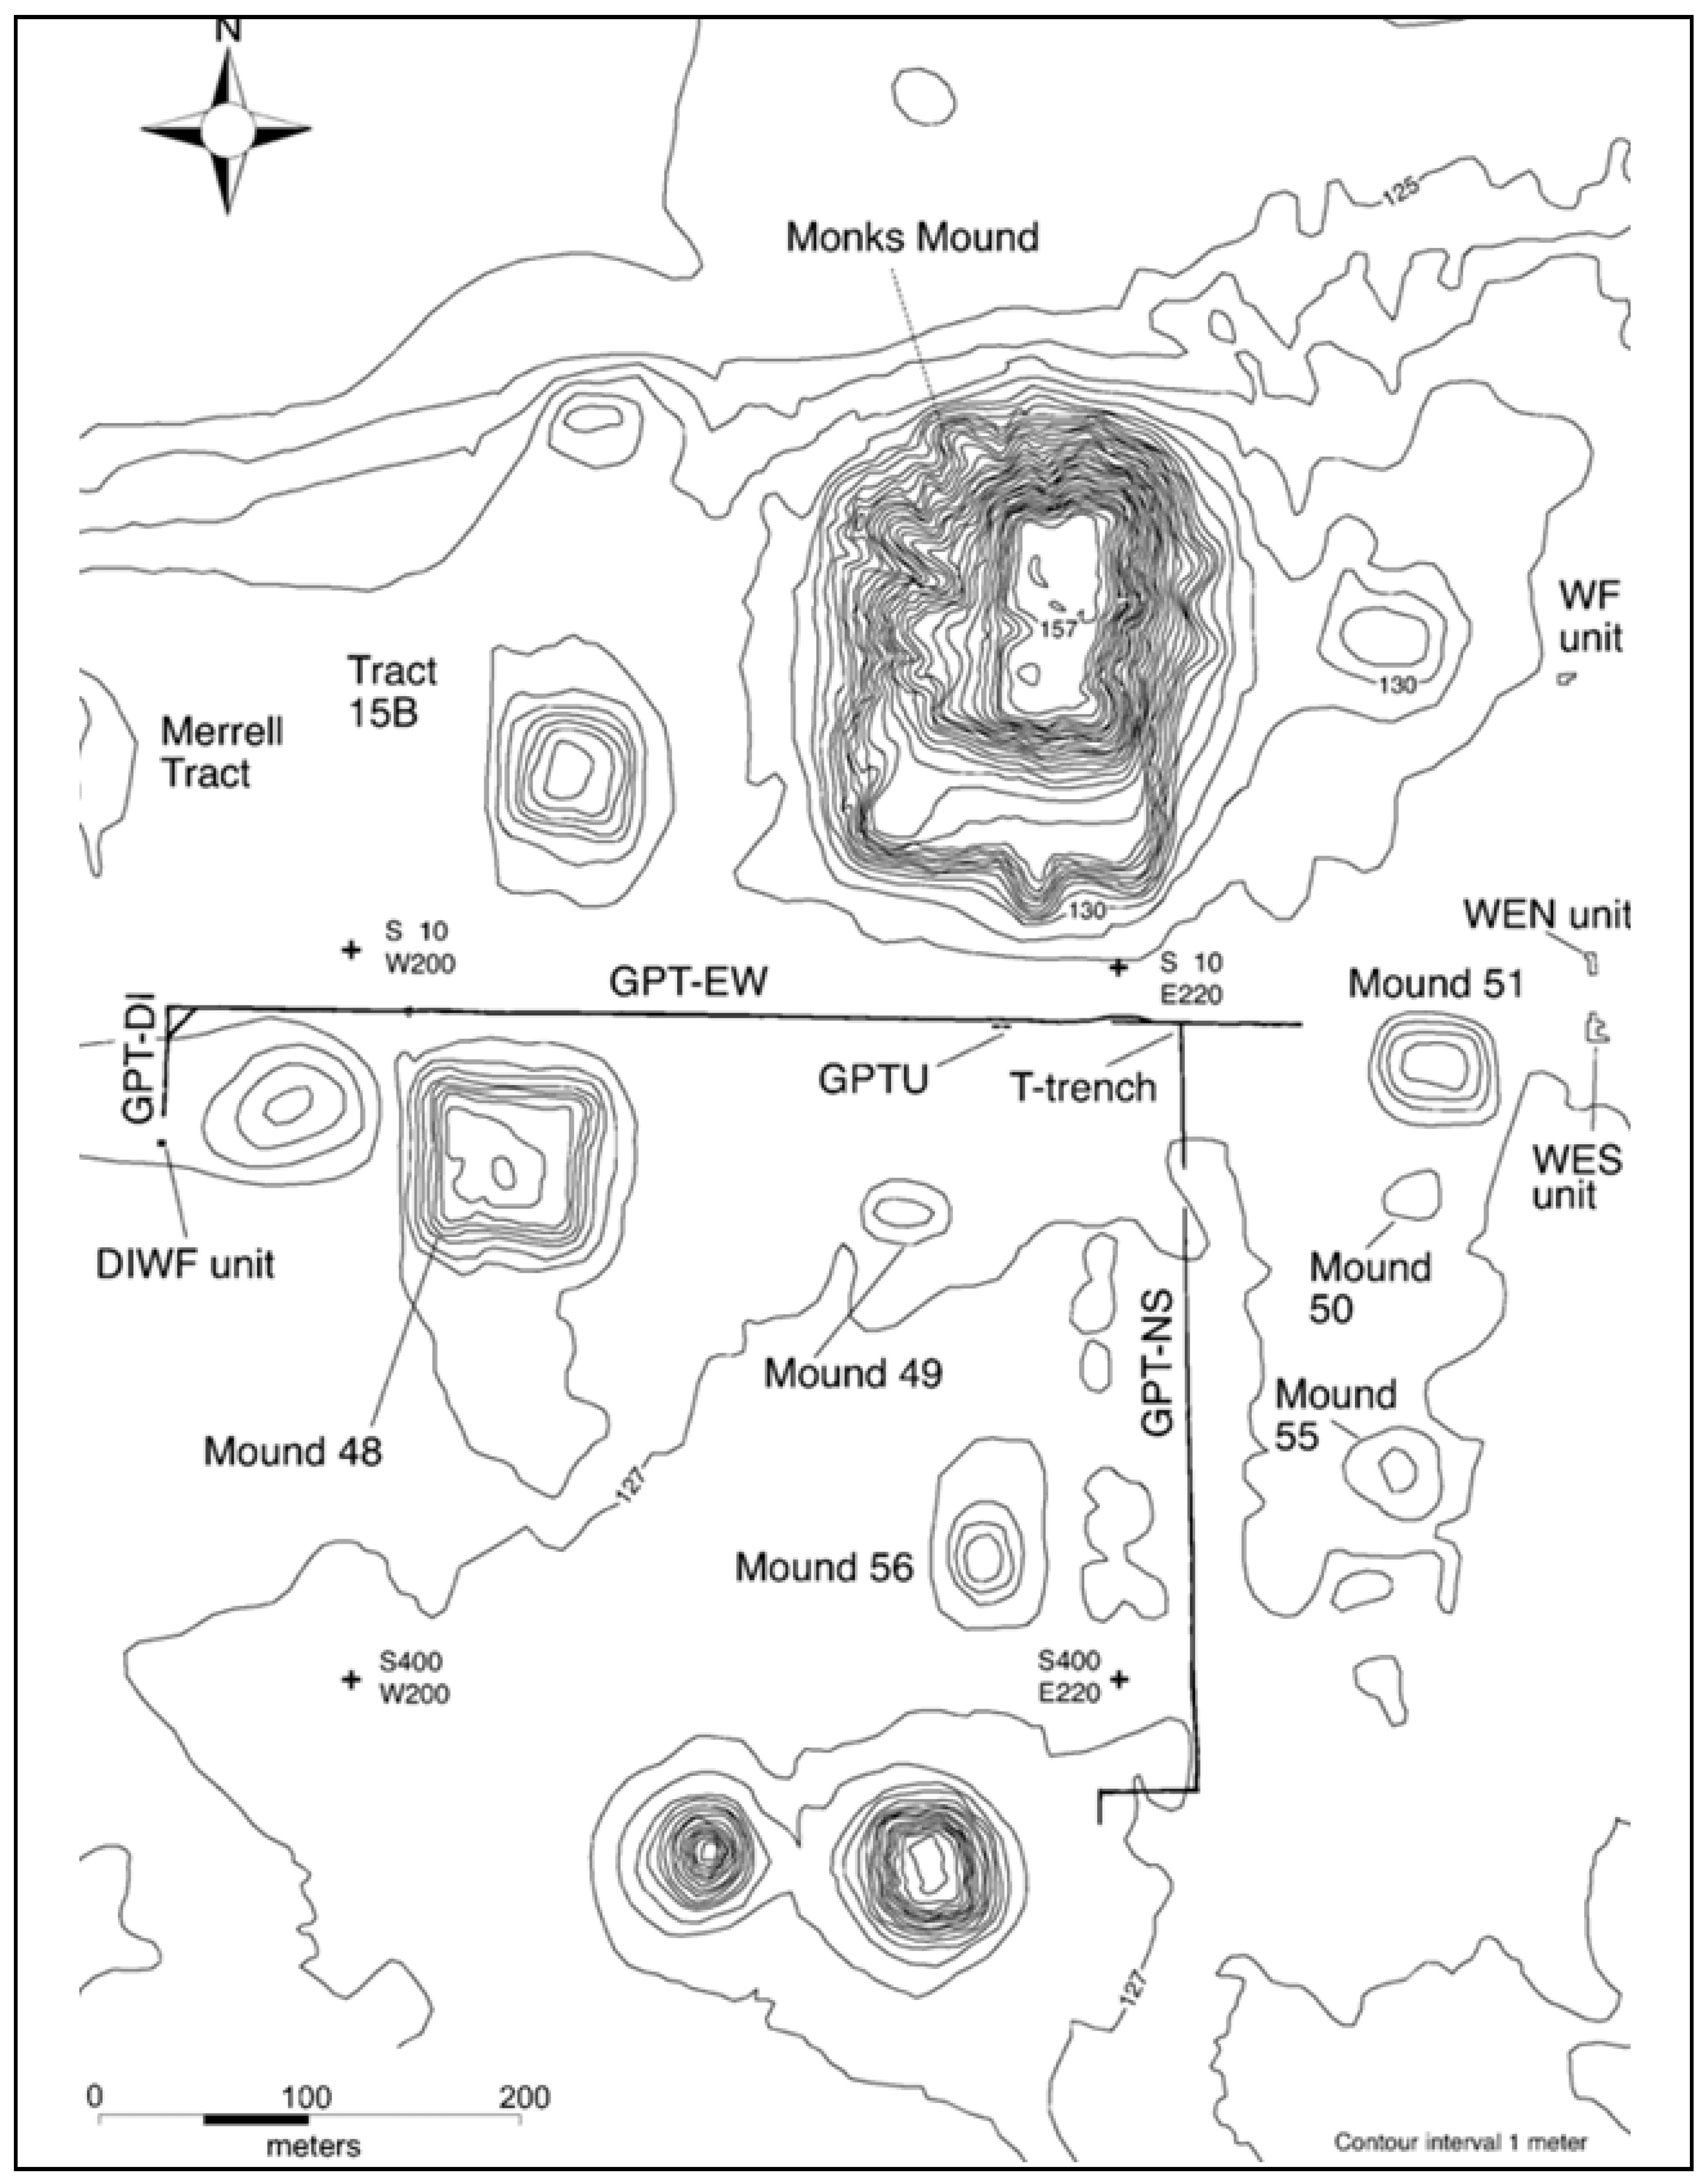
2.1. Study Area: Cahokia’s Grand Plaza

Cahokia (Figure 2) takes its name from the Indigenous tribe who inhabited Cahokia city when the first French voyagers arrived in the late 17th century [45]. An ancient area, Cahokia was constructed by the Mississippians and is located in southwestern Illinois, USA (38.6551°N, 90.0618°W) [45,46]. Cahokia was the largest settlement of the Mississippian culture, who lived in the southeast of the USA from the Mississippi River to the shores of the Atlantic [47]. The city was developed for its time and densely populated (between 10,000 and 20,000 people). There was a reduction in the population two centuries later, which archaeologists theorise may have been due to drought, climate change, disease, or war [48]. The city contains the largest pre-Columbian earthen mound in North and South America. Up to 120 mounds have been recorded; however, some mounds were demolished or ruined by construction and agricultural purposes, leaving 80 mounds among them. These include Monks Mound, the largest mound on the North American continent (Figure 3). Monks Mound measures 30.5 m in height and spans an area of approximately 56,655.99 m2 [2]. Nonetheless, there are no written records from the site, and its formation is still somewhat of a mystery [31,48].
The Grand Plaza (approximately 50.097 ha—measured in QGIS (version. 3.16), based on the structure from motion (SfM) mosaic imagery) is located between Monks Mound and the Twin Mound markets, gatherings, and ceremonies. Excavations were conducted several times at the study site. For instance, several remains were discovered in 1971, such as incised sandstone tablets on the east side of the Monks Mound and several watchtowers/fortifications surrounding the mounds. These fortifications were probably built by inhabitants in response to external threats (such as regional warfare) that had not previously existed [49]. Furthermore, archaeologists discovered potential constructions in front of Monks Mound and others located on the Plaza edges in 1997 [50]. In the early 21st century (from 2002 to 2010), surveys determined the exact location of copper tools that were originally discovered in 1950, traces of residential areas/ temples with wooden poles on top of the mounds, and flint and stones [51]. Therefore, many archaeological remains were already revealed in the AOI through the application of invasive methods. The reasons for selecting this study site are as follows:
  • This case study is an extension of the existing study led by researchers Vilbig et al. (2020) [2] at Saint Louis University. They compared the analysis of standalone approaches (LiDAR and photogrammetry) at Cahokia Mounds and found that the digital models derived from photogrammetry provided comparable archaeological detail to LiDAR data. Testing the proposed method (standalone and integration/fusion approaches) of this study and comparing the findings with previous studies is vital to obtaining more archaeological data from the study area;
  • The ancient city of Cahokia was abandoned in the 1400s and the reasons are still ambiguous as there are no contemporaneous records from this area. All the information received for this particular site is based on archaeologists’ hypotheses. Additionally, the outcomes of employing various remote sensing approaches are likely to suggest insights into appropriate applications for revealing new archaeological information.

2.2. Remote Sensing Data Acquisition

Two remote sensing datasets were employed in this research: (i) airborne LiDAR data and (ii) aerial-image-based photogrammetry. These datasets were used to investigate the potential of the integrated and fused datasets in enhancing the detection of archaeological remains.

2.2.1. LiDAR Datasets

The raw, airborne topographic LiDAR data for Cahokia’s Grand Plaza were captured in 2012 by a geospatial firm, Merrick & Company (https://www.merrick.com/about-us/) (accessed on 15 September 2021). The data were captured using a Leica ALS50II LiDAR Sensor for the Prairie Research Institute at the University of Illinois. The point density was 39.5 points/m2 and the horizontal and vertical accuracy of the raw data was 1 m, calibrated by Merrick & Company [2]. The LiDAR epochs (the return pulses) contain information about the topographic features, constructions, vegetation, and water, which was grouped into 12 different classes that correspond to a variety of terrain surfaces. The data were obtained for the Illinois State Geological Survey (ISGS) (https://isgs.illinois.edu/about) (accessed on 15 September 2021), and the LAS (LASer) tiles for St. Clair County were downloaded from (https://clearinghouse.isgs.illinois.edu/data/elevation/illinois-height-modernization-ilhmp accessed on 15 September 2021). The LAS files were then processed into a digital model.
The workflow to create a bare-earth digital terrain model (DTM) from LAS files was implemented in ArcGIS Pro 2.6.0 (https://pro.arcgis.com/ accessed on 16 September 2021). A LAS file is a file format mainly used to store three-dimensional (3D) LiDAR point clouds; hence, the workflow comprised generating LAS datasets following recommendations from the previous studies [2,52]. Hence, producing these datasets was important to examining the LAS files and selecting appropriate classification codes. In this study, the ground class was the only code selected to represent the terrain features and to create a DTM of Cahokia’s Grand Plaza with a 0.50 m spatial resolution. LiDAR covers a much wider footprint when compared to aerial photogrammetry. In this study, we applied both techniques to reveal archaeological information about Cahokia’s Grand Plaza. For this reason, LiDAR data forthe AOI were extracted to be within the same scale of the study site as the photogrammetric DTM (approximately 50.097 ha). Both digital models were projected and geotagged at the same projection and coordinate system (NAD83-NSRS2007/Illinois West ‘ftUS’—EPSG:3531).

2.2.2. Photogrammetric Datasets

The final raw, unpiloted aerial vehicle (UAV) data were obtained from the research by Vilbig et al. [2]. Additional details are contained therein. Images were captured using a DJI Phantom 4 Pro drone equipped with an fc6310 digital camera (5472 × 3078 pixels). The study site was surveyed with a programmed flight using the open-source Pix4D Capture app (https://www.pix4d.com/product/pix4dcapture accessed on 3 October 2021). This app was used as a dynamic control supplement to plan flight missions. The flight height was 80 m over the study site, with a minimum overlap of 70% to generate a fine spatial resolution of 0.23 m. The drone was flown over the study site for 30 min for individual missions. Three flights were conducted to capture 1201 aerial images for the entire AOI.
Following the data capture of the UAV images, the structure from motion and multi-view stereoscopic (SfM–MVS) processing phase was implemented in this study using a high-performance computer (128 GB, AMD Ryzen 9 3900XT 12-Core Processor 3.79 GHz) on Windows 10. Several computer programs can run the SfM–MVS method (e.g., Agisoft Metashape, and Recap). In this research, Agisoft Metashape Professional software (v.1.6) (https://www.agisoft.com/ accessed on 20 July 2020) was used for its efficiency and effectiveness in generating accurate dense point clouds from aerial images [3,53,54,55]. The SfM–MVS processing was implemented in this research following previous studies such as [18,25,56,57]. The scale-invariant feature transform (SIFT) algorithm was used to reveal the tie points of the images, match common points, and triangulate point clouds. More than 97% of the original UAV images were aligned and applied in the 3D reconstruction. The remaining UAV images did not align due to an inadequate recognition of tie points in the common image features and were not used in the modelling process. Following point cloud triangulation, the bundle block adjustment (BBA) algorithm was executed to enhance the camera positions and improve the 3D reconstructions [58,59,60]. Subsequently, a 3D mesh was created based on the sparse point clouds of the scene. The fc6310 camera has a rolling shutter, so rolling corrections were used through camera calibrations. We used the following lens coefficients for self-camera calibration to optimise the accuracy of the geometric reconstruction: aspect ratio and skew parameters (b1, b2), principal point (cx, cy), focal length (f), radial distortion (k1, k2), and tangential distortion coefficients (p1, p2). Following the production of sparse points, dense point clouds were produced by applying the MVS method based on the aligned images and camera positions [61]. Approximately 3 million (3,138,269) points, with altitude errors of 2.59 m and a spatial resolution of 0.23, were created by processing the UAV images of the AOI. The outputs of the SfM–MVS processing were textured meshes, orthomosaics, and digital models (46.3 points/m2 point density). These outputs were exported for further analysis to reveal archaeological remains.

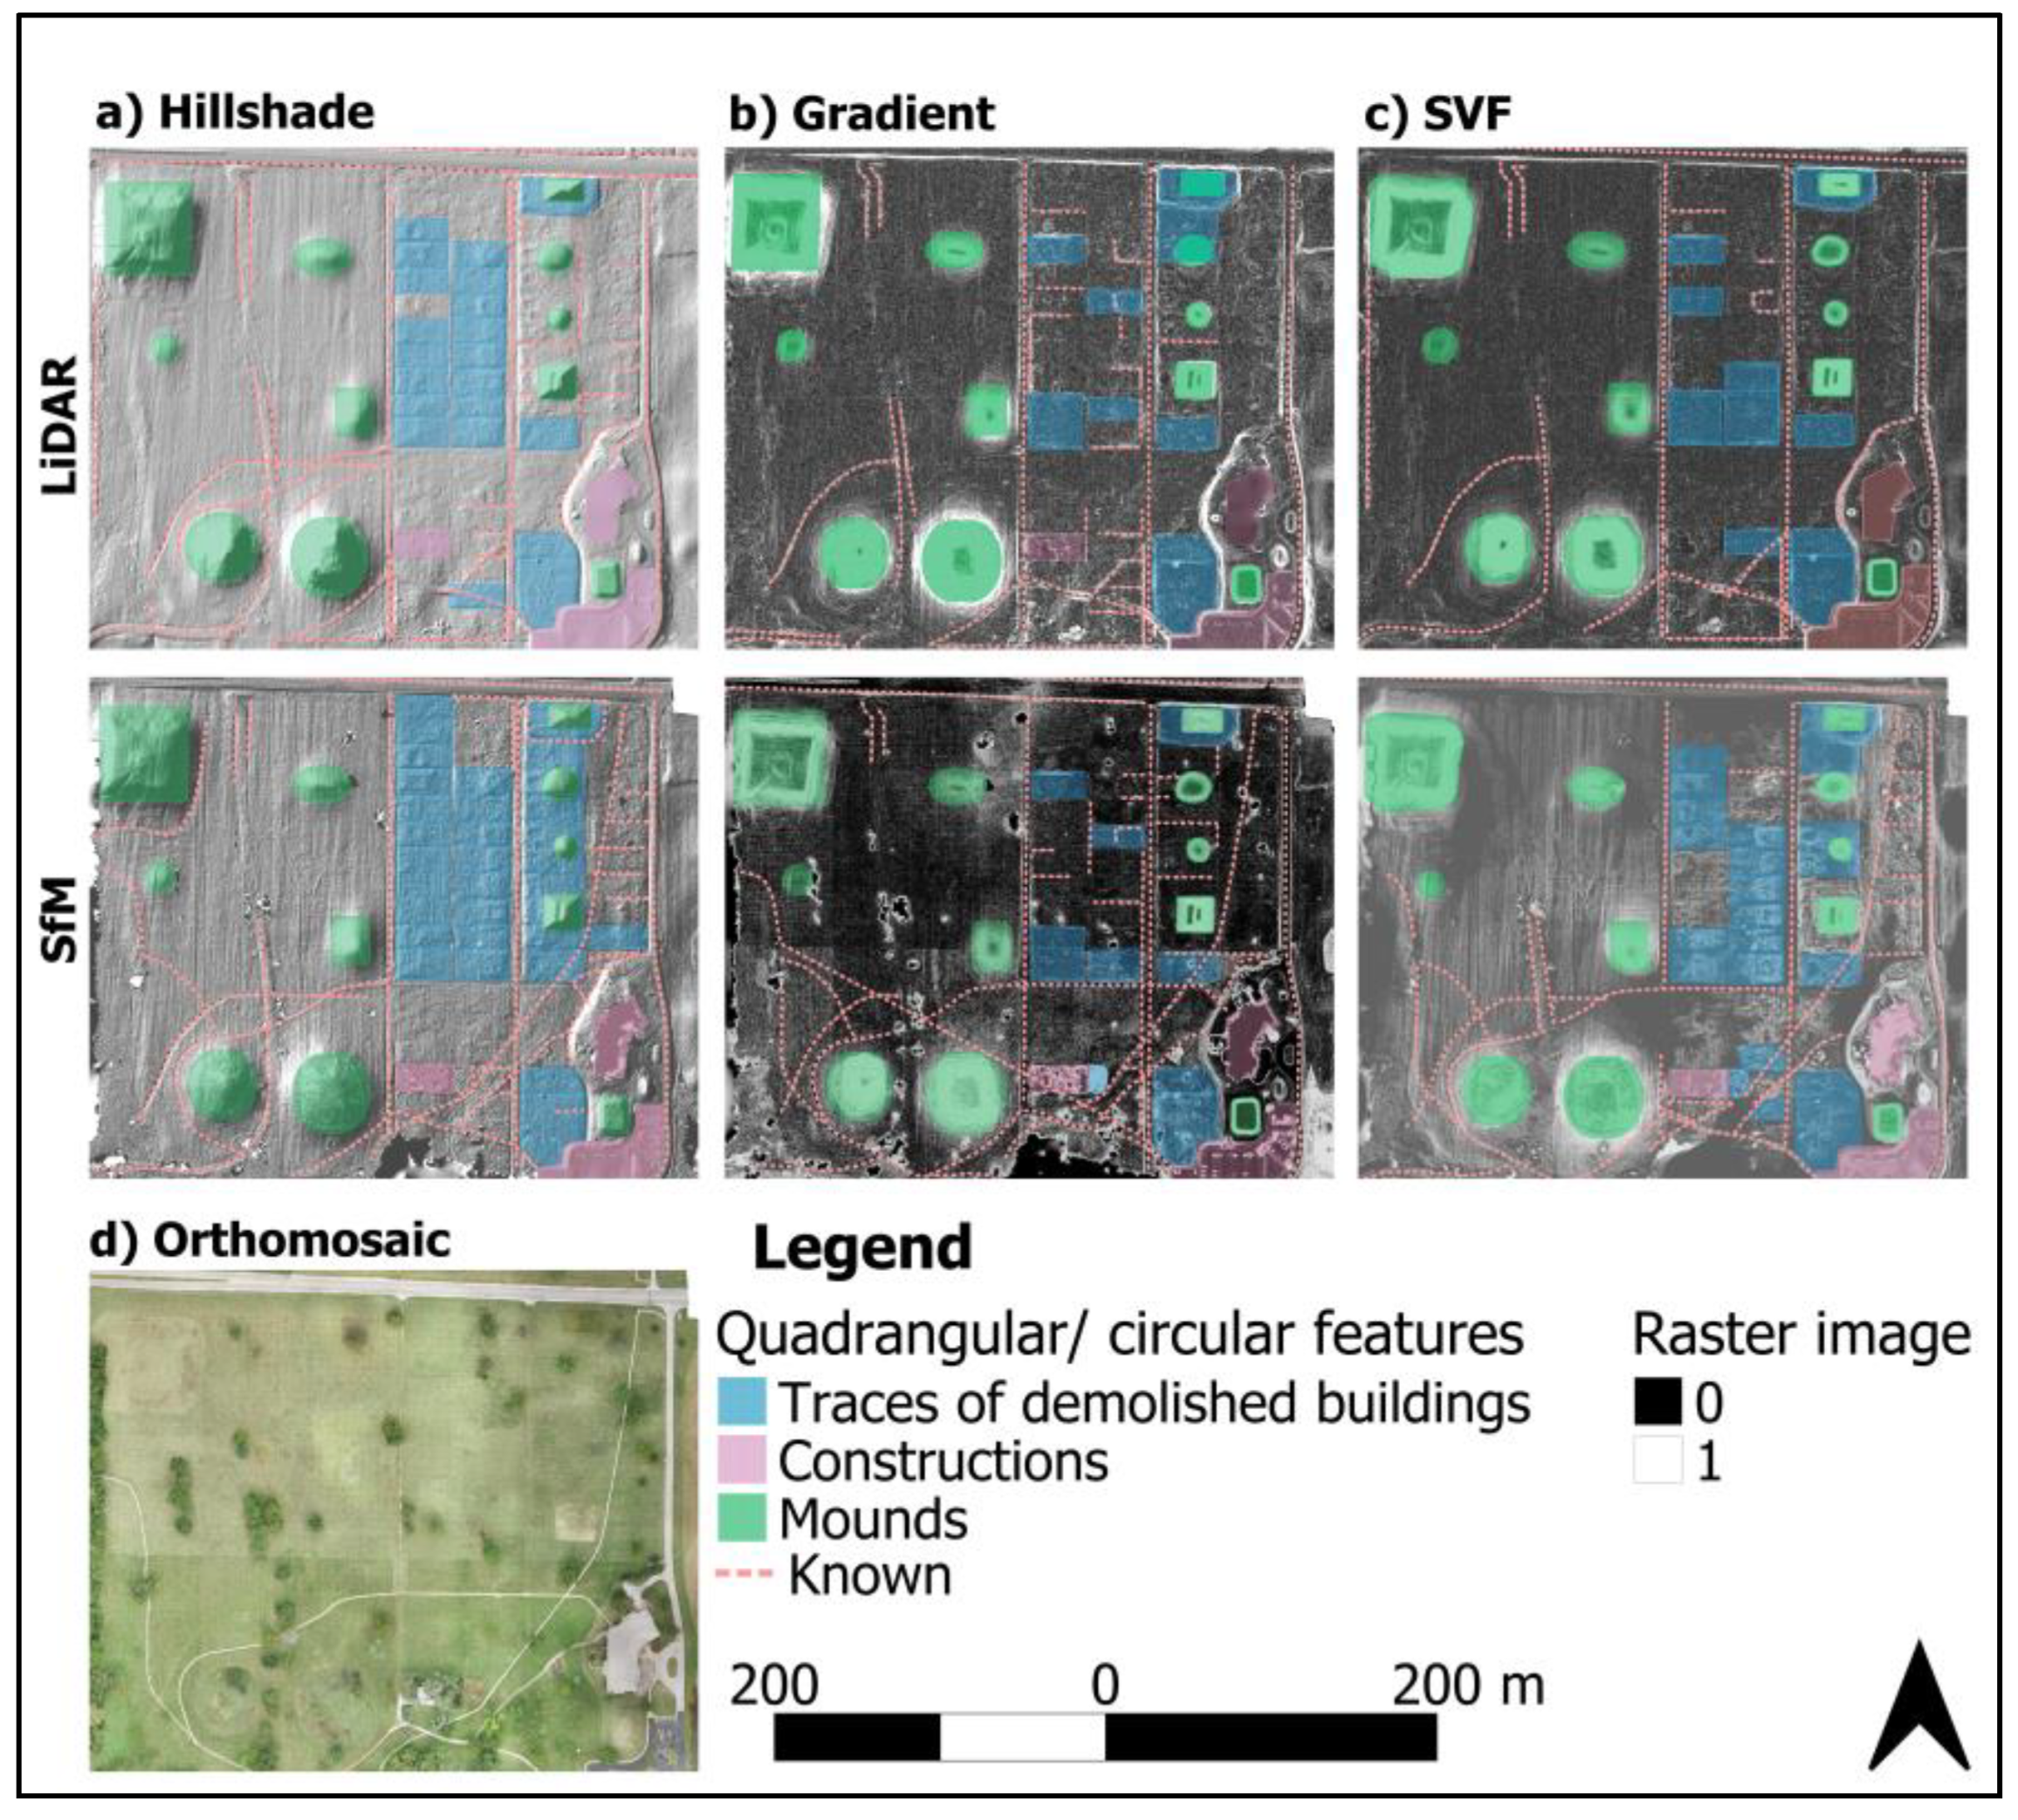
2.3. Standalone Detection Approaches

The digital models derived from the LiDAR and photogrammetric data were used to generate various visualisation raster images in a free and open-source platform, QGIS (version. 3.16) (https://qgis.org/en/site/forusers/download.html, accessed on 20 July 2020). Examples of the visualization techniques applied in this study are hillshade (shaded relief map), slope image, and sky view factor (SVF), which could contribute to the detection of topographic information [53,62]. These VATs were used in previous archaeological studies, as is illustrated in Section 1. In this paper, the purpose of using these well-known VATs was to demonstrate how the new, original combination (integration and fusion) approaches applied in this study can overcome the limitations of standalone raster images in revealing marks of demolished structures in the same archaeological area.
The hillshade technique was produced in this study using the following illumination parameters, which are suitable for multiple visualisation analyses: azimuth (315°), altitude (45°), and Z factor (1) [27,53,55]. These parameters were applied to the LiDAR and the photogrammetric digital models to create shaded-relief raster images of the AOI. The purpose of generating various raster images was to verify the visibility of the topographic detail of the AOI. Another VAT created was the slope technique. This technique was produced using a 3 × 3 neighbourhood, as it is executed in most GIS packages [27,29]. The slope raster was generated in degree units.
The third raster successfully created in this study was the SVF. The SVF was generated by applying specific parameters, i.e., the number of search directions (Dn) and the maximum search radius (Rm). These are two vital parameters in determining the SVF raster image. The Dn is generally set based on either the sector method or the multi-scale method. The sector method was applied here since the multi-scale method generates pyramid layers, which creates less accurate raster images than the sector method [54]. The Rm was set to 15 and 25 pixels, following the recommendation from the study by Somrak et al. [55], as the topographic detail in the SVF raster is enhanced when the Rm value is between 10–30 pixels and the Dn value is more than the Rm value. However, the computation time increases significantly when the Rm value is above 50 pixels [56,57].

2.4. Combination Detection Approaches

This section is divided into two sections: data integration from the same sensor (Section 2.4.1) and data integration and fusion from different sensors (Section 2.4.2). This section addresses the first part of the research question and focuses on combination approaches. The RRIM technique (using the parameters applied in Section 2.4.1) was already tested in previous studies, e.g., [22,28,29,59]. The purpose of applying this technique was to investigate how new combination approaches (Section 2.4.2) could improve the detection of archaeological remains in comparison to well-known techniques (standalone and RRIM) in the same archaeological area.

2.4.1. Data Integration from the Same Sensor

Multiple visualisation raster images derived from the individual sensors were combined in this research to increase the visibility of archaeological remains and improve the interpretability of the remote sensing data for Cahokia’s Grand Plaza. Several blending modes (e.g., multiply) can be implemented to integrate multiple raster images. The multiply mode was applied in this study, as it treats every raster separately, integrating the top raster image (X) with the bottom raster (Y) [26]. Integrating any raster with a relatively darker layer normally creates a dark raster; this means that the outcome raster images from the multiply mode are relatively darker than the standalone raster images.
Based on the multiply mode, two RRIMs were created in this study: one from the LiDAR data and one from the photogrammetric data. Both RRIMs were generated by integrating the gradient raster with the topographic layers (positive and negative openness) derived from the DTM, as demonstrated in previous studies, e.g., [31,59]. The differential openness (D) was created by applying certain parameters: the radial limits were 10 m, and the number of sectors was set at 8 [60]. We applied the sector method, as it is less likely to generate pyramid layers and can provide more accurate openness parameters compared to the multi-scale method [60,63]. To execute the RRIMs, a topographic openness raster (D) was used to determine the positive and negative openness (Po and No) [59]. When D is the differential openness raster, Po represents the positive openness, which highlights topographical concavity, and No signifies the negative openness, which highlights topographical convexity [28,63]. Hence, the RRIM was created by merging the D in a white-to-black raster with the red gradient layer [31,60].

2.4.2. Data Integration and Fusion from Different Sensors

Two new pipelines for combining two different datasets, namely the LiDAR and photogrammetric data for Cahokia’s Grand Plaza, was applied herein. This study refers to the integration method as a combination of two different raster images (2.5D raster) derived from the range-based LiDAR and the image-based methods after processing the individual datasets separately. In comparison, the term fusion approach denotes the combination of 2D images together to create a fused model. Both techniques match common features/points between aerial images and laser data to achieve a successful combination.
Due to the limitations of the standalone approaches [18,61], we argue that combining raster images generated from the LiDAR and photogrammetric datasets creates a new, single, integrated raster that includes all the distinguished archaeological features highlighted (or shadowed) on single images. The new concept of this approach is to multiply two raster layers created from different data sources, i.e., to integrate individual VATs derived from the LiDAR with the corresponding VAT derived from photogrammetry to generate new, integrated VATs. An example of this combination is the integration of the SVF from the LiDAR data with the SVF from the photogrammetric datasets. The new, integrated raster images were then compared with each other regarding the topographic detail and improvements in the detection of archaeological remains. The purpose of this approach was to boost the existing raster layers and thereby enhance the detection of archaeological remains. However, we avoided the integration of more than two raster images (e.g., RRIM derived from the LiDAR data with the corresponding raster from the SfM method), as this is not an efficient process and features are likely to be misdetected [23].
Following the registration of the individual rasters, six new raster images were created in this study. These new raster images are the integrated hillshade, integrated gradient, integrated SVF, and SVShade (I) (SfM SVF with LiDAR hillshade), SVShade (II) (LiDAR SVF with the SfM hillshade), and fused raster (SfM-derived mosaic and LiDAR DTM). Creating multiple raster images to reveal archaeological remains is an effective way to validate the results as well as make sure that the findings from individual approaches are truthful and agree with each other. This integration was achieved for the LiDAR and photogrammetric datasets after multiple attempts to combine a variety of raster layers to generate single, enhanced raster images. Similar procedures to those applied in Section 2.4.1 were employed here, but with multiple sources of data. Specifically, the parameters for integrating the hillshade raster derived from the LiDAR were: stretch to min–max, blending mode (multiply), transparency (75%), and brightness (default). The same parameters were applied to the hillshade generated from the SfM–MVS method except for brightness, which was set at 20. In addition, the settings for the SVF raster images from both sources were stretched to min–max, blending mode (multiply), transparency (90%), and brightness (default). Lastly, the gradient raster layers were configured at stretch to min–max, blending mode (multiply), and brightness (50%), while the transparency for the layers derived from the photogrammetry and LiDAR were 65% and 90, respectively. Selecting appropriate integration settings is important for accomplishing the desired result. For this reason, the applied parameters of the integration approaches were selected based on their performance in highlighting distinct topographic details of the AOI in a single raster. All the settings applied to generate new integrated raster images are summarised in Table 1.
The fusion of DTMs with mosaics (F) was originally performed and investigated by Al-Najjar et al. [62] in their study of land cover classifications using a standalone approach (aerial photogrammetry). This fusion was applied in this study to enhance the detection of archaeology based on multiple sensor datasets. More specifically, we used an open-source computer vision (OpenCV) Python module using the ‘addWeighted’ function, which is clarified in Equation (1) [63]. The image arrays (i.e., IA1 and IA2) were imported together, and various weights (e.g., ∝: 0.2 and β: 0.8, ∝: 0.3 and β: 0.7 and 0.5) were used for each input in order to apply the most optimal pixel weights to create a new fused raster that revealed a relatively greater LOD of the AOI. In this way, ∝ and β values of 0.3 and 0.7 were selected for the mosaic and the DTM, respectively. Gamma, γ, was the constant value (weight) also added to all the image pixels.
F = I A 1 . + I A 2 . β + γ

3. Results

This section includes the visual and statistical results of the detected remains obtained following the methodology implemented. The integrated raster images produced by combining LiDAR and photogrammetric data (Section 3.2) were originally and newly generated and evaluated with the standalone data (Section 3.1).

3.1. Standalone Approach Results

The findings of the standalone approaches that are reported and discussed in this section and Section 4 are crucial aspects to answering the second part of the research question, which focuses on the merits and weaknesses of single datasets in revealing archaeological features. In the previous study led by Kadhim and Abed [29], standalone approaches (LiDAR and photogrammetry) were applied separately to Chun Castle, England. In that study [29], it was recommended that fusion approaches be implemented in future work since it is possible to receive a relatively greater LOD of the archaeological sites. For this reason, we applied both standalone and combination approaches in this case study (Cahokia Grand’s Plaza). The results that were obtained from the standalone approaches are vital to critically assessing the potential of the new approaches—the integration and fusion of the LiDAR and SfM–MVS data—in revealing archaeological remains. Therefore, an investigation was implemented to examine the potential of the LiDAR- and photogrammetry-derived products to provide detailed data for detecting remains in the AOI. In this investigation, point clouds derived from the LiDAR data and the drone-based SfM–MVS photogrammetry created a 2.5D model representation of Cahokia’s Grand Plaza. The VATs were categorised into three main single raster images: hillshade, gradient, and SVF. The assessment was implemented for each raster in terms of the number of the detected remains (e.g., paths/roads, mounds, and marks of demolished buildings), their measured areas in square meters, and the variations in their measurements obtained from different products. We found that both the LiDAR- and the SfM–MVS photogrammetry-derived raster images successfully revealed archaeological features.
The detected marks at Cahokia’s Grand Plaza. which have rectangular shapes (divided into strips of land), were interpreted in this study as patterns of archaeological remains. The detected features are labelled (named) in this study with Latin numerals. Some archaeological marks (mounds), as well as the remains of modern archaeological features, were revealed from all the VATs, i.e., the ‘III’, ‘XX’, ‘XXIX’, and ‘XXX’ (Table A1 and Figure 4 and Figure 5). Examples of these remains derived from the SfM–MVS are ‘X’ and ‘IX’ in both hillshade and gradient, the ‘XIX’ in all the VATs, and the ‘XVII’ and ‘XVIII’ in both hillshade and SVF (Figure 4 and Figure 5). In addition, these structures obtained from the LiDAR data are ‘XVII’ in the hillshade and SVF, ‘XIV’ in the hillshade and gradient, and the ‘XXVIII’ feature in all the VATs (LiDAR VATs). The reasons for these differences in archaeological detection are discussed in Section 4. The SfM–MVS-derived hillshade uncovered relatively more marks of the study site when compared to other raster images. Specifically, the visual interpretation of the hillshade from the SfM and the LiDAR have detected 26 and 20 features (modern demolished structures), respectively, 14 known structures (e.g., mounds, museums, buildings), and well as linear features, i.e., footpaths/roads (Figure 4). However, more than 50% of the polygon features detected in the hillshade raster images were also revealed in the other VATs as linear features, not polygons.

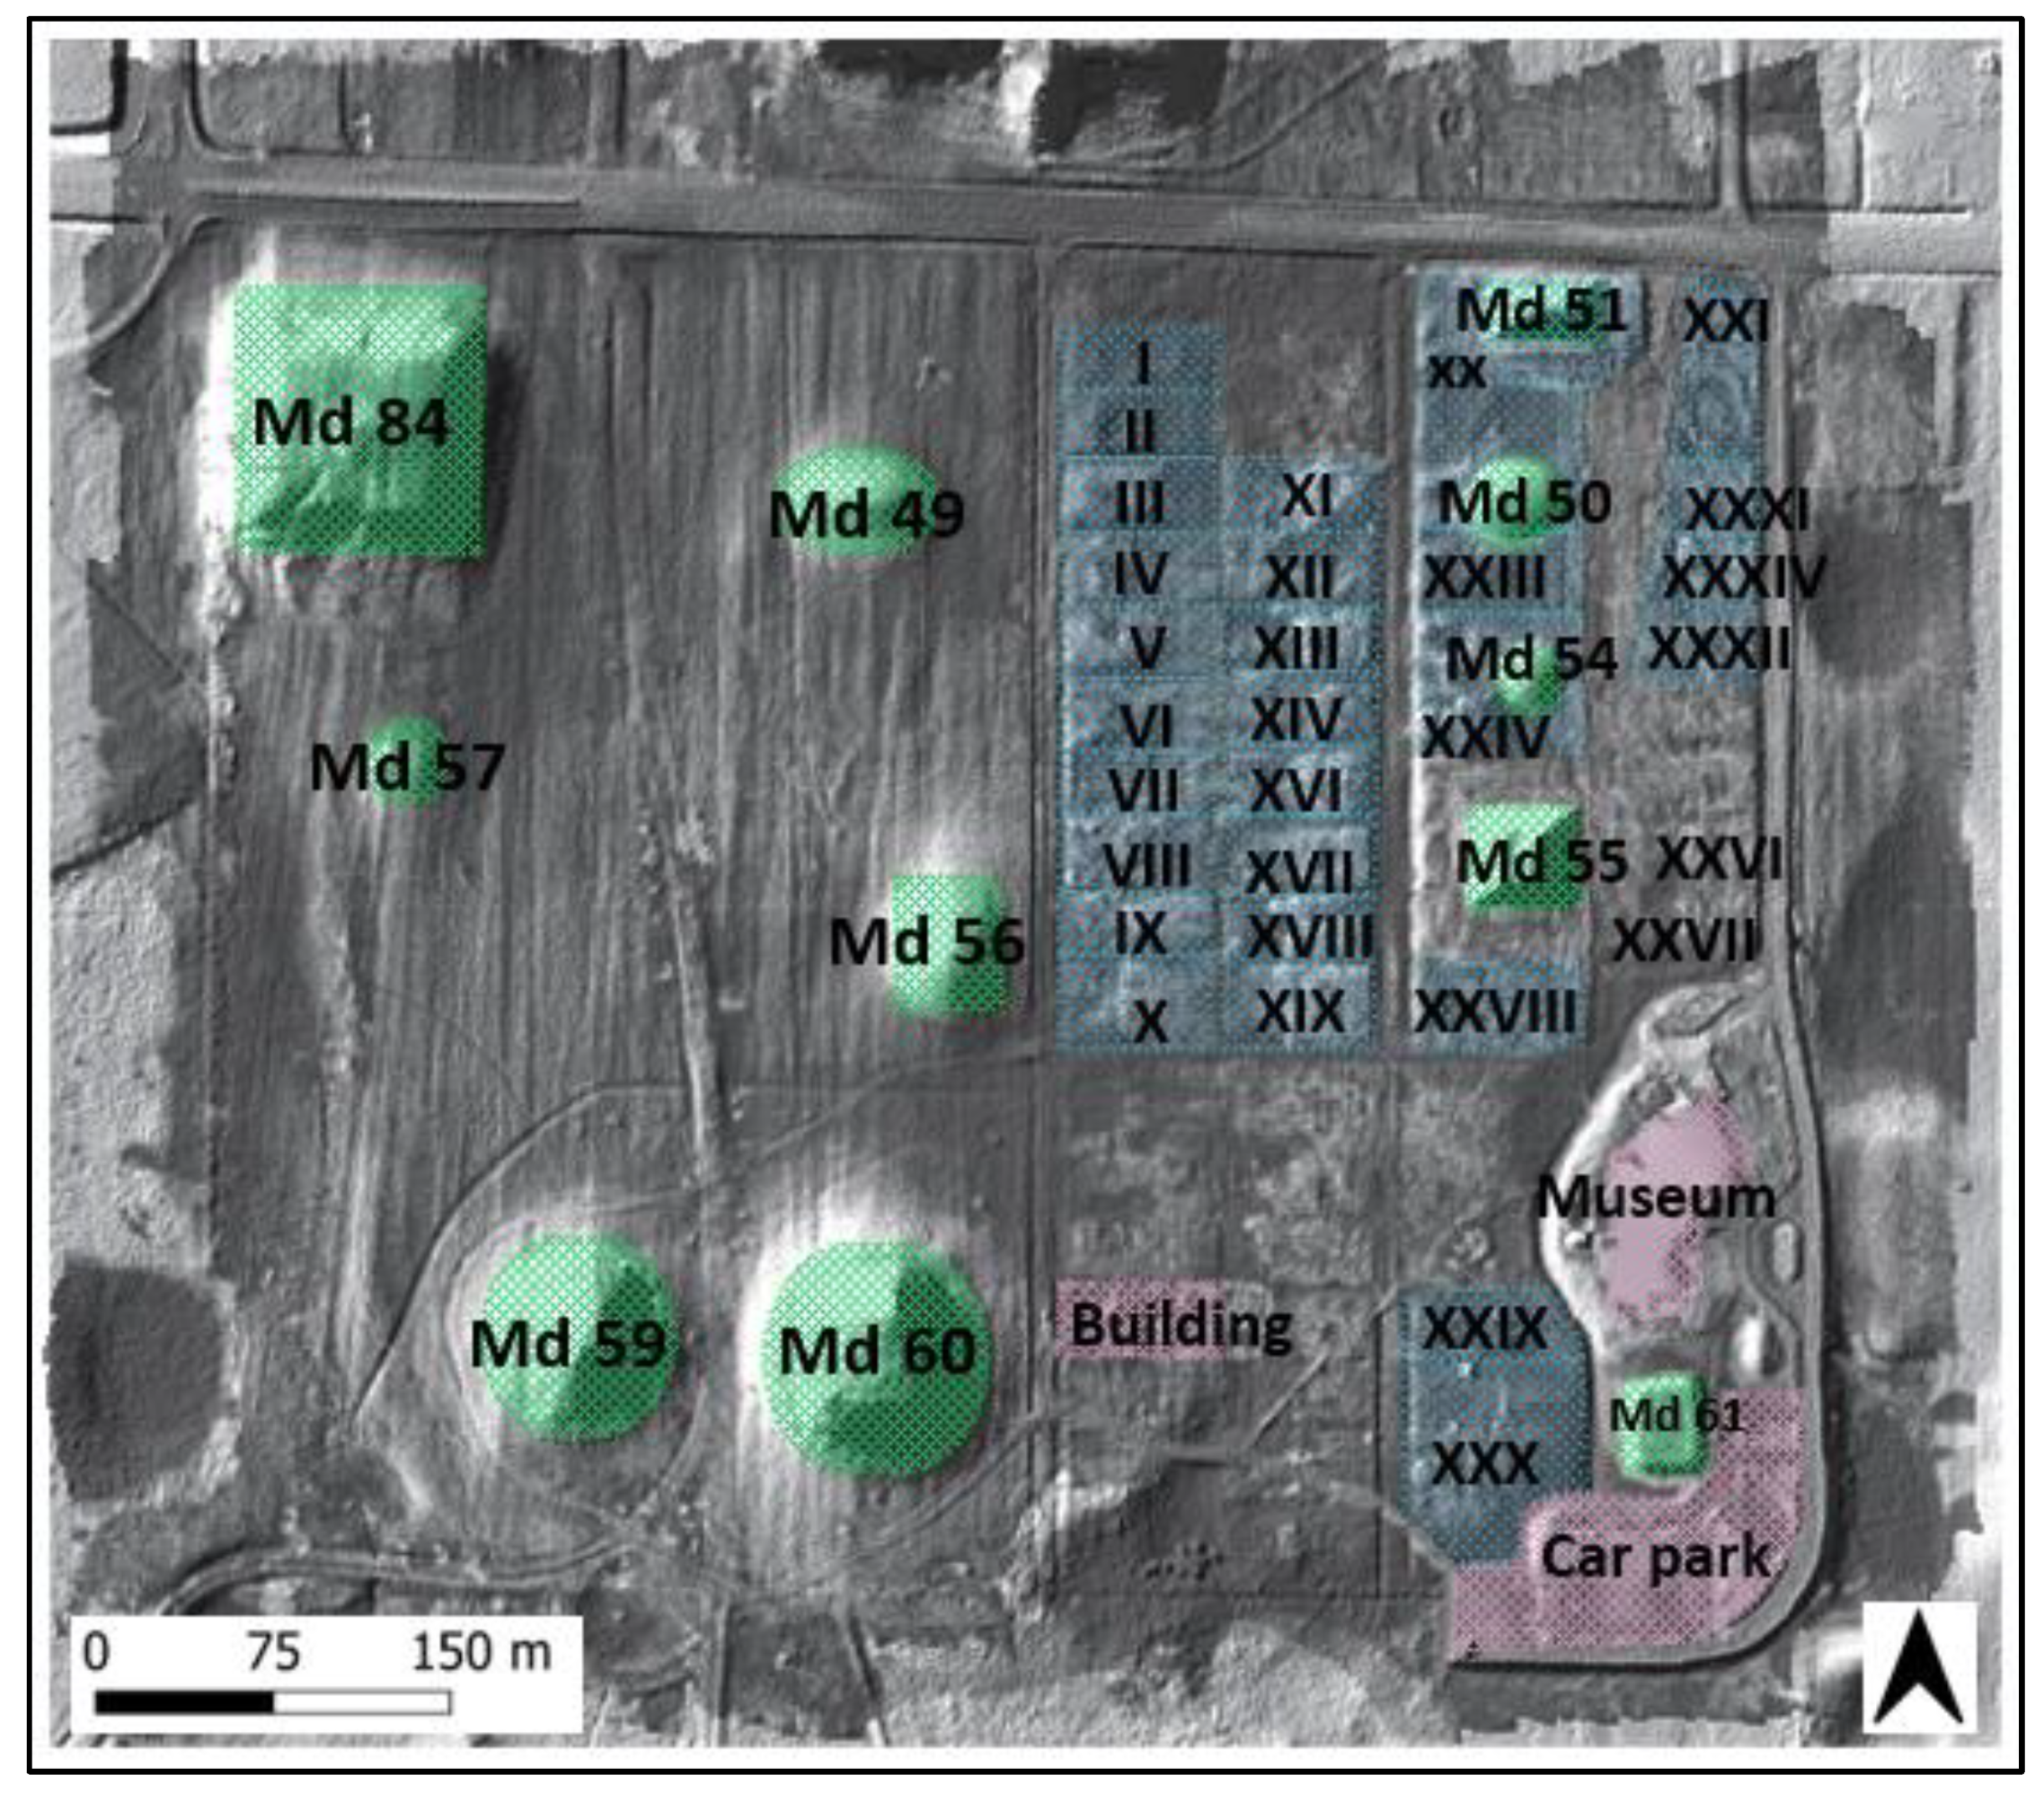
3.2. Combination Approach Results

The findings of the integration and fusion approaches that are presented and discussed in this section and Section 4 are vital aspects to addressing the third part of the research question, which concentrates on assessing the LOD of the integration and fusion raster images with the standalone datasets. A strong agreement was found between the marks revealed in the standalone and combination approaches (integration from the same and different sensors). The standalone and combination approaches to Cahokias’s Grand Plaza detected 50% of common marks of modern features (e.g., walking paths/ roads) that have been demolished (Table A1, Figure 6, Figure 7 and Figure 8). These marks and the labels of their names are presented in Figure 5. Relatively more archaeological marks were revealed when two raster images were combined. In particular, the RRIM derived from the SfM photogrammetry (Figure 6) and the integrated hillshade (Figure 7) allowed for the identification of 30 rectangular structures, respectively (in addition to the mounds), as well as linear features (roads/ footpaths). They considerably enhanced the detection of archaeological data when compared with the single raster images. However, the LiDAR RRIM (Figure 6) provided less data than the SfM-derived RRIM; there were 14 rectangular features (marks of demolished constructions) revealed in the LiDAR RRIM (Figure 6). Figure 7 shows the outcomes of the new, integrated data applied using different sensors; it is evidently displayed that the integrated raster provided a comparatively better distinction of the remains in the AOI than the single raster.
In addition to the integrated data, some features were detected in the fused raster. The fusion approach created enhanced data when compared to the mosaic and the LiDAR DTM. Several features were revealed, such as the known features (mounds and museum) and the remains of modern, demolished structures (‘II’, ‘III’, ‘IV’, ‘V’, ‘XIV’, ‘XXIX’, and ‘XXX’) as well as linear features (Table A1 and Figure 9). The edges of the mounds were more easily revealed in the fused raster than in the integrated data (Figure 6, Figure 7, Figure 8 and Figure 9). However, these marks, such as ’VI’, ‘VII’, and ‘VIII’, were less clearly recognised in the fused data compared to the integrated data. The presented results suggest that although the fusion approaches improved the detection of the single data, the integration approaches in this specific case study provided a relatively more detailed detection.
The marks detected with quadrilateral shapes were auto-calculated in QGIS to assess the variations in area between the standalone and the combined data. The auto-calculation was executed using the remote sensing data for the AOI. The size of the detected marks varied in individual rasters, and these variations are relatively correlated to the spatial resolution and the traits of the individual VATs, as discussed in Section 4. The variations of the two measurements acquired from the standalone and the integrated data are depicted in boxplots (Figure 10 and Figure 11) to demonstrate whether the results from both approaches are significantly different from each other. The variations of the standalone data include the areas, in m2, of the archaeological and modern remains detected from the six individual VATs (i.e., hillshade, gradient, and SVF) obtained from the Li-DAR and photogrammetric data. In parallel, the differences in the integrated results comprise the areas, in m2, of the remains revealed from the six integrated VATs (i.e., integrated hill-shade, integrated gradient, integrated SVF, SVShade (I), SVShade (II), and the fused data).
The variations in the measured areas of the study area were determined separately due to the number of detected features. The boxplots in Figure 10 represent the variations in area (m2) of the traces of known features (mounds). These boxplots illustrate that, although there were differences between the two approaches in the computed areas (m2) delivered for the same known features, no significant differences were perceived. The maximum variations were found in Mound (Md) 50 and Md 60—the lower whiskers for the standalone and the combined (integrated and fused) data for the Md 50 were 1340 m2 and 1320 m2, respectively, while the lower whiskers of the Md 60 measurements from the standalone and combined data were 7138 m2 and 7150 m2, respectively (Figure 10). In contrast, the smallest variations were identified in Md 48 and Md 55: the differences between the upper and lower whiskers for the standalone and combined measurements did not exceed 2 m2 (Figure 10). In addition, the upper whiskers for both the standalone and the combined data of Md 55 were 1990 m2, while the lower whiskers were 1284 m2 and 1282 m2, correspondingly. The variations in the area of the marks of modern, demolished constructions were greater than those for the mounds. The greatest variations between the measurements of the two approaches were found in the feature ‘XX’: the upper whiskers for the standalone and the combined data were 3900 m2 and 3980 m2, respectively, while the lower whiskers were 3880 m2 and 3875 m2, respectively. In contrast, the smallest variations of the two measurements were identified in feature ‘III’: the upper whiskers were 2064 m2 and 2068 m2 for the standalone and the combined data, respectively, while the lower whiskers were 2060 m2 and 2058 m2, correspondingly (Figure 11).

4. Discussion

The integrated data (e.g., the SVShade and integrated SVF) appear to be at a satisfactory level in providing more detailed raster images when compared to data from most standalone and fusion approaches. Therefore, this section contributes to a better understanding of the reasons why various outcomes may be obtained by using different remote sensing approaches and accomplishes the overall aim of this study to identify the most appropriate approach for specific archaeological applications. The features detected by the single and combined VATs of the AOI are presented in Figure 12.

4.1. Standalone Data Outcomes

The purpose of detecting archaeological and modern remains in this study was to provide valuable LOD regarding the design of the study site in the past. This information enhances and adds significant detail to the existing/known archaeological data. The outcomes of this research will remain accessible to the public for educational purposes and further interpretation and exploration and conservation.
The marks of archaeological and modern remains that were detected in all VATs are less likely to be created from raster distortions. Examples of this include the remains of features from modern demolished structures, i.e., ‘III’, ‘XX’, ‘XXIX’, and ‘XXX’. These features were revealed in all standalone VATs (Figure 4). Bennett et al. [26] also found that applying more than one VAT (derived from LiDAR data) was an effective way to reveal and confirm the existence of detected remains. The investigations in this research, which used various VATs derived from multiple remote sensing data, are likely to considerably confirm the real existence of the common detections extracted from individual rasters. On the other hand, features that were revealed in only one VAT are considered potential errors, such as XXXV from the integrated gradient (Figure 7).
Despite these common detections, outlet points of the measured areas were also found. Specifically, the area variations in the ‘III’ feature of Cahokia’s Grand Plaza (Figure 10 and Figure 11) did not exceed 11 m2. These variations indicate that the applied VATs have different specifications in visualising features. However, other unexpected variations emerged in this investigation. Particularly, the feature ‘XXII’ (Figure 4b,c and Figure 5) was revealed using the LiDAR gradient and SfM hillshade the (difference between them was 8.75 m2); however, those revealed by the integrated hillshade and SVShade (II) were comparatively significantly smaller (Table A1, Figure 4, Figure 7 and Figure 8). This is because not all of the entire quadrilateral feature was detected. This unanticipated result suggests that some edges of the ’XXII’ feature were not entirely revealed in the SfM SVF, so a smaller quadrilateral shape was revealed compared to those revealed by the LiDAR gradient and SfM hillshade.
Various archaeological features were obtained by applying multiple approaches due to the different conditions (e.g., sensors, spatial resolution, and the settings for data collection) of individual datasets. The outcomes for Cahokia’s Grand Plaza were rather similar to those obtained in [29]. In other words, the VATs derived from the SfM photogrammetry also revealed more remains than the LiDAR data, although the same processing and analysis methods were implemented in both datasets. This is an indication that the SfM–MVS method holds significant advantages over the LiDAR data, although the same processing and analysis methods were implemented in both datasets. This is likely to be due to the differences in spatial resolution between the two datasets. The spatial resolution of the SfM–MVS data was relatively higher (0.23 m) than that of the LiDAR data (0.50 m) for the AOI.
In this research, the ground sampling distances (GSDs) of the LiDAR and photogrammetric data were 0.5 m and 0.23 m/pix, respectively. This result also agrees with Vilbig et al. [2], who compared both datasets from the same AOI (Cahokia’s Grand Plaza) in terms of their qualities and efficiency. They stated that photogrammetric data were rather more feasible and practicable than LiDAR data, specifically in this archaeological area, which contains slight vegetation cover. Regardless of the differences in the aims of both studies, the conclusion of this part of our research meets [2] the conclusion that the UAV photogrammetry can generate comparable results to LiDAR data with less cost and greater ease.
Further, feature recognition relies not only on the dataset but also on the settings used to create the VATs. The settings for generating individual VATs depend on the topo-graphic type of the study area [23,27]. The latter study also applied various modes to create VATs to improve the recognitions of topographic features. Producing VATs by applying default settings, e.g., gradient setting: method (planer), Z factor (1), hillshade setting: horizontal angle (315°), vertical angle (40°), and Z factor (1), performed successfully in most archaeological areas, including the AOIs in our research and previous studies such as [25,27,29,55]. Nonetheless, the context of the SVF and the topographic openness layers (which were created in Section 2.3) should, in some cases, be modified from their default settings. The default settings are: radial limit (10,000 m), method (sectors), multi-scale factor (3.00), and the number of sectors (8). These settings were applied in this study and created a distortion of the raster image. Hence, the default settings were changed (Section 2.3). This suggestion was also reported in the study by Kokalj et al. [23], who recommended not applying the default settings for the SVF and the topographic openness as the default settings might not be effective for revealing some topographic features (specifically, relatively plain areas). Kokalj et al. [23] successfully identified an archaeological topography for areas that have relatively flat terrain in the SVF by applying the following parameters: directions (16° and 32°, respectively) and search radius (10 m). These configurations were unable to identify features of the AOI in this research as they did in previous studies [64,65]. In this study, a five-meter radius was used with the sector method; these were the most appropriate parameters, as the archaeological marks, which were only subtly indicated in this case study, became relatively clearer and more detectable. In accordance with these parameters, Daxer [54] demonstrated that applying a relatively smaller radial limit (e.g., two meters) is likely to provide a relatively more detailed topographic information than a higher radial limit (e.g., 50 m and/or 1000 m).
In addition to the settings, each VAT had different specifications. The hillshade data derived from the SfM photogrammetry and LiDAR data revealed relatively more marks compared to other VATs, particularly in Cahokia’s Grand Plaza. The hillshade raster images of the AOIs derived from both sensors were generated by applying the same parameters (vertical angle of 40°, azimuth of 315, and a Z factor of 1). These parameters were also demonstrated by other research [25,27] to be optimal settings for identifying archaeological remains and marks of ruined constructions. The outcomes of the hillshade in this case study (Cahokia’s Grand Plaza) would suggest considering the hillshade to be a more plausible detection technique than other standalone VATs. However, Challis et al. [66] found that an interpretation based merely on the hillshade tends to lead to the oversight of some remains in the study site. There are two studies [23,28] in agreement with the study by Challis et al. [66]: they stated that the illumination drawbacks of this technique could create topographical distortion, especially in archaeological detection.
The above claims indicate that although more features were revealed by the hillshade in this study, there is a possibility that some of them were generated from the distortion of the raster imagery. The outcomes of this study, to some extent, contradict these claims. Specifically, some of the features identified in the hillshade were also revealed as linear features in other VATs. Specifically, the feature ‘V’ was detected in the SfM hillshade and SfM SVF raster images of Cahokia’s Grand Plaza (Figure 4). These detections suggest that those features were not produced from the illuminations of the hillshade, as they were also revealed in the SVF. These outcomes agree with the findings of López et al. [67]. These previous studies normally prefer SVF over hillshade since one of the main merits of the SVF tends to overcome the hillshade’s distortions.

4.2. Combination Data Outcomes

Holata et al. [31] claimed that integrating airborne LiDAR and SfM–MVS data is not a common approach to revealing remains in archaeological areas. Kokalj and Somrak [23] also argued that there is a need to enhance the existing VATs and improve the detection of archaeological features. Various VATs derived from LiDAR data were combined in [23]. Quantifying and assessing archaeological features acquired from the combination approaches are vital for applications in prospecting archaeology, object detection, and assessing the most appropriate approach to explore new archaeological features/areas.
In this study, various VATs were applied. The combined raster images (e.g., SVShade and integrated gradient) that were derived from multiple sensors—LiDAR and photogrammetric data—provided comparatively more detailed and clearer raster images than the standalone VATs. Consequently, more archaeological marks were revealed.
The most important finding regarding the combined data is the new raster image, SVShade (I), which was originally created in this study (Figure 8). The SVShade (I) delivered the best object recognition compared to the other integrated data. It was originally generated by integrating the SfM SVF with the LiDAR hillshade. This integration appears to have overcome the limitations of the individual raster. Previous archaeological studies such as [24,27] integrated different raster images derived from the same source (e.g., LiDAR) and found that the visibilities of topographic features were enhanced. Inomata et al. [25] compared various VATs under various conditions. They found that the RRIM technique brought a relatively great visualization advantage to the end user when compared to other methods. In other words, the RRIMs provided, to some degree, better archaeological detection than other integrated techniques, e.g., the RVT in Jaber and Abed’s study [24]. Kokalj and Somrak [23] responded to [24], as they concluded that blending different data derived from the same sensor based on the (RVT) for archaeological detection is a viable alternative to the standalone approaches. Based on the results of this study, we would argue that the integration of two datasets derived from different sensors, specifically the SVShade (I), can significantly improve and enhance the recognition of archaeological remains and marks of modern demolished structures when compared to the RRIMs and standalone data (Figure 6, Figure 7, Figure 8 and Figure 9). This argument does not imply disagreement with the previous studies but instead highlights a significant advance in the understanding of new approaches that promise to provide a comparatively greater LOD for archaeological areas. It seems clear that, in this study, the integration approaches enhanced the edges of remains and thus improved their recognition. The SVShde was the most highly recommended raster to be applied for archaeological detection as it provided a detailed raster for Cahokia’s Grand Plaza.
Consequently, enhanced raster images were obtained to mitigate the weaknesses of the standalone data. As is illustrated in Section 2.2, the LiDAR and photogrammetric datasets were different in their GSDs in this study. Kokalj et al. [68] found that coarse spatial resolution data (e.g., 1 m/pix) possibly led to a reduction in detection capabilities. Integrating both datasets likely avoids the possibility of the occurrence of pseudo-detection and confirms the features identified from a single raster image. This is consistent with the study by Doneus et al. [69], which stated that LiDAR is likely to penetrate dense vegetation and improve the interpretation of the bare ground due to the higher point density, meaning that it has the capability to deliver relatively more detailed depth data compared to SfM photogrammetry. Consequently, LiDAR has provided improvement to object detection in this case. The combination of photogrammetry and LiDAR is, however, not commonly applied in digital archaeology. In this context, this study shows that the inadequacies of these products are mitigated when both datasets are combined, such as by combining SfM SVF with the LiDAR SVF and the SfM hillshade with the LiDAR hillshade. However, the possible feature ‘XXXV’ was only revealed in the integrated gradient of the AOI. This feature was considered a pseudo-detection since it was only revealed in one raster. This particular outcome of the integrated gradient in this study contradicts the results of other integrated datasets generated in this study since the weaknesses of the single gradient data were not overcome when both raster images were integrated (SfM gradient with the LiDAR gradient). Apart from the possible error detection in the integrated gradient, the integrated datasets, i.e., integrated hillshade, integrated SVF, SVShade (I), and SVShade (II), considerably refined the topographic detail in the raster and thus sharpened the distinction of archaeological and modern remains in the AOI.
Importantly, the outcomes of this research suggest that the integration of both hill-shade and SVF can mitigate the single limitations of each raster and further enhance the detection, providing crucial data for archaeological exploration (Figure 8). A similar result was achieved by Kokalj et al. [68], who integrated hillshade and SVF data derived from the same sensor (LiDAR). The results received in this study indicate that the integration of the SVF and hillshade derived from different sources is more effective in feature detection. The VATs derived from these sources also have various strengths and weaknesses. Specifically, both SfM SVF and LiDAR hillshade are different in terms of visual analysis. Kokalj et al. [68] found that the SVF was an effective analysis technique for improving the identification of archaeological features, particularly from high-resolution data. The standalone result of this study ties well with previous studies [68], wherein the SVF from both sources detected several archaeological and modern remains, especially from the high-resolution raster, i.e., the SfM SVF. The SVF was commonly used in several studies, such as [67], as an alternative VAT to hillshade due to its potential to overcome the limitations of the existing VATs, such as the diffusing illumination of hillshade. However, the findings from the integration approach in this study are slightly different, as the area variations of the detected features were less than those detected in the standalone approaches. This integration provides insight into digital preservation and object detection and demonstrates that combining various datasets can overcome some of the limitations of standalone data.
In addition to the outcomes of the integration approaches, another combined raster image was created from the fusion approach. This study implemented the fusion of the LiDAR DTM with the RGB (red, green, and blue) orthomosaic derived from photogrammetry to refine the final product and emphasise the mark edges identified by the standalone and integration outcomes. The fused data, as the integrated data, enhanced the detection of known, modern features (Figure 9). Examples of these features are ‘II’, ‘III’, ‘IV’, ‘V’, ‘XIV’, ‘XXIX’, and ‘XXX’ (Figure 5 and Figure 9). Additionally, the edges of the mounds were more easily identified in the fused raster (as well as in the aerial images and mosaic) than in the standalone and integrated data for this study (Figure 6, Figure 7, Figure 8 and Figure 9). The detections of these edges were enhanced as the forms of the features are extremely similar, especially in the absence of colour data, which means that the model (DTM/ VATs) might not be able to distinguish and detect them. In this case, the imagery had RGB colour, which contributed to the correct detection of archaeological features through the fused data and provided more realistic representations. Al-Najjar et al. [62] also applied this type of fusion (LiDAR DTM with SfM orthomosaic) for land-cover classification and found that the fused data improved the classifications among vegetation. However, it was anticipated in this research that connecting the mosaic with the height data (DTM) would generate clearer identifications of archaeological features than the integration approaches. Several archaeological features (e.g., ’VI’, ‘VII’, and ‘VIII’) that were detected through the integration approaches were not recognised in the fused raster. The absence of some marks of constructions in the fused raster of the study site led to the conclusion that the integration approaches in this study delivered a higher LOD about the study site than the fusion approach, although the detection of some existing features (mounds) was improved through the fusion approaches.

4.3. Limitations

Despite the importance of the applied approaches and the obtained results, there were some limitations to the applied methods tested in this study. One of the limitations is associated with the area variations of some of the detected archaeological features. The measurements of the detected features, particularly the areas of the quadrilateral marks in a certain VAT, were often >10 m2 for corresponding features in another raster technique (Figure 10 and Figure 11). These variations might be caused by digitising errors compounded by limitations in the VATs. Due to the different specifications of individual VATs, detected features were visualised in slightly different ways. Hence, some features were exposed in slightly different dimensions (Figure 4, Figure 5, Figure 6, Figure 7 and Figure 8) and therefore do not represent the exact areas due to the absence of ground control points (GCPs). These differences led to the digitisation of, to some degree, imprecise polygons/polylines of the detected features. Importantly, these variations were nonetheless significantly reduced in the new, combined datasets.
The absence of GCPs is another limitation identified. A number of related archaeological studies, such as Orengo et al. [21], Moussa [37], and Agudo et al. [70], used GCPs as they are arguably important steps to georeference aerial images and to establish object scale. Azmi, Ahmad, and Ahmad [71] argued that control points are recommended to avoid possible distortions in image overlapping. Regardless of these arguments, GCPs were not used in this study since the traditional element of photogrammetric processing was changed. The RTK drones applied here produce high-resolution mosaics and raster imagery through the SfM–MVS method. Additionally, the absolute positions yielded from the RTK drone, in this study, generated scaled models and determined the accuracy of the reconstructed datasets. From above, if the UAVs/digital cameras are RTK-enabled, then establishing GCPs is not essential in SfM–MVS processing [72]. In terms of data combination, several related studies, e.g., Holata et al. [31] and Moussa [37], established GCPs to georeference the laser and photogrammetric data since both datasets had different geographic systems. Herein, the LiDAR and aerial images obtained for Cahokia’s Grand Plaza were geotagged at the same projection and coordinate system; thus, GCPs were not used in this specific case (obtaining georeferenced datasets). However, the absence of GCPs is considered one of the limitations of this study, as the exact coordinates of the detected features (i.e., the centimetre accuracy of their locations) were not conclusively identified.

5. Conclusions

The novelty of this research is presented in a two-step approach to detect and digitally preserve features in archaeology: (i) the application of remote sensing standalone approaches and (ii) combination approaches based on VATs. The original contribution of this study was to combine different datasets acquired from LiDAR and photogrammetry and generate new, combined datasets in order to examine whether the new data can enhance and improve archaeological information in comparison to the standalone method. In this study, the combination of the LiDAR and photogrammetric datasets was investigated to detect archaeological and modern remains in Cahokia’s Grand Plaza site. The results demonstrate that both standalone and combination approaches produced successful detections of several remains in the AOI. The results illustrate that the standalone VATs generated from the SfM–MVS method delivered a greater LOD of the AOI than those created from the LiDAR data. However, the integrated VATs boosted the edges of archaeological features (mounds, paths/roads, and traces of demolished constructions) and improved their identification to a relatively greater extent than the standalone VATs. Particularly, the SVShade raster images were the most highly recommended raster to be applied in archaeological detection. Therefore, the integrated raster images allowed us to further detect and confirm remains that were detected using the standalone approaches. For future work, deep learning object detection algorithms can be applied based on standalone and combined remote sensing datasets to automatically detect archaeological remains. We argue that the integrated raster images generated in this study from two different sensors are valuable data sources that can be applied successfully to detect new archaeological features. In addition to deep learning algorithms, they may contribute to a paradigm shift in digital archaeology.

Author Contributions

Conceptualization, I.K. and F.M.A.; data curation, V.S. and J.M.V.; formal analysis, I.K.; methodology, I.K. and F.M.A.; Writing—original draft preparation, I.K.; Writing—review and editing, I.K., F.M.A., V.S., J.M.V. and C.D. All authors have read and agreed to the published version of the manuscript.

Funding

The publication of this article was supported by the University of Exeter.

Data Availability Statement

The research data supporting this publication are not publicly available. The data of this study was collected by my co-authors Vasit Sagan and Justin Vilbig as part of their research studies at Saint Louis University and shared only for this analysis. Requests to access the data should be directed to Vasit Sagan ([email protected]).

Acknowledgments

The authors would like to thank the Illinois State Geological Survey (ISGS) (https://isgs.illinois.edu/about (accessed on 15 September 2021)) for providing LiDAR data for the study site. The authors appreciate the support of Remote Sensing Lab members at Saint Louis University, who assisted with fieldwork. The authors would like to acknowledge the support of the University of Exeter for providing a high-performance computing facility. Additionally, big thanks to the English for Academic Purposes (EAP) tutors, Isabel Noon and Richard Little, from the University of Exeter for providing feedback on the organization and flow of ideas of this manuscript. Special thanks to the University of Exeter and CARA for the studentship stipend. Finally, we would like to thank the editors and the six anonymous reviewers for the valuable comments that have improved this paper.

Conflicts of Interest

The authors declare no conflict of interest.

Appendix A

Table A1. The areas of the archaeological remains, e.g., mounds (Md) and marks of known modern houses that were demolished in the 1970s in Cahokia’s Grand Plaza were revealed in this study using the SfM–MVS and LiDAR data based on the standalone and combination approaches. The areas are auto measured in QGIS (version 3.16) in m2, through various VATs, so these values do not represent the exact areas due to the absence of ground control points. The table also shows that the SfM-derived hillshade and RRIM as well as the integrated hillshade provided the highest Level Of Detail (LOD) compared to the other (VATs). The unrevealed archaeological remains have been identified in this table as not applicable (n/a) data. The locations of these remains with the labels of their names are presented in Figure 5.
Standalone Raster (m2)RRIM (m2)Fused Data
(m2)
Integrated Hillshade (m2)Integrated Gradient (m2)Integrated SVF (m2)SVShad (I) (m2)SVShad (II) (m2)
HillshadeGradientSVF
IDSfMLiDARSfMLiDARSfMLiDARSfMLiDAR
Md 48 11,755.711,756.411,761.611,758.811,753.411,760.8 11,759.83 11,756.3911,755.411,757.811,759.611,753.511,751.5611,757.11
Md 491335.941330.091329.581327.421329.391325.82 1315.53 1331.531335.781335.751331.061338.91339.691335.11
Md 501325.851319.141328.671314.3813201319.96 13,485.75 1312.831321.101327.641324.961323.91327.951330.68
Md 511265.561256.51260.11263.451261.551257.931258.39 1265.721262.081261.371261.921265.91264.961265.67
Md 54653.91655.85657.74660.38656.3665.66 649.73 653.83655.79649.58657.2653.5651.87657.52
Md 551989.631977.561983.561985.211987.221987.8 1983.47 1984.291983.921985.391980.731980.71988.341987.25
Md 562621.852630.232626.562624.972630.882627.99 2637.94 2632.752635.332639.972633.072637.72635.342639.53
Md 57953.85955.63951.45955.88950.57950.71 950.39 955.02953.73952.47959.29957.9954.78955.19
Md 595921.465923.495926.385930.825935.585935.21 5936.37 5939.835939.655938.275936.975933.55935.945935.11
Md 607137.747139.117140.567147.697150.857143.11 7152.49 7159.377149.297150.977153.627153.17153.287152.7
Md 611475.321467.681477.481477.831478.791475.24 1479.39 1472.791475.061472.361475.821471.21472.851470.68
Building2275.372289.792276.722273.822271.83 n/a 2271.312276.482270.782273.932271.012272.12272.592270.75
Museum4218.344203.774215.124211.634212.554210.32 4207.35 4215.584212.674211.54211.744215.44213.464217.39
I1814.81n/an/an/an/an/a 1811.28n/a n/a 1811.46n/an/a 1821.20 1819.58
II1832.031814.59n/an/a1831.3n/a1827.531825.61829.791823.821836.63n/a1822.191822.92
III2059.662059.262060.142061.252063.852068.752069.032059.262061.032063.822057.392065.82063.392061.82
IV1985.941976.14n/an/a1984.18n/a1989.72n/a1963.621988.971986.971980.81988.051985.47
V1971.27n/an/an/a1932.46n/a1949.841949.561962.861975.551978.751953.61975.321977.94
VI1936.011941.85n/an/an/an/a1947.231946.421938.271946.391940.71940.501941.981943.11
VII1720.621748.25n/an/an/an/a1722.95n/a n/a1719.36n/an/a1719.271723.07
VIII2157.72127.64n/an/a n/an/a2160.32n/a n/a2157.43n/a2158.62159.832159.16
IX1676.131699.961669.96n/a n/an/a1673.39n/a1659.571668.941680.021672.331673.841675.38
X2536.12534.942538.12n/an/an/a2548.67n/a n/a2522.8n/a2547.982530.102525.79
XIn/an/an/an/an/an/a1727.88n/a n/a1726.31n/an/a1726.961727.26
XII2041.022016.46n/an/an/an/a2048.69n/a n/an/an/an/a2055.502052.68
XIII2127.62195.82n/an/an/an/a2132.142123.24 n/an/an/a2124.372124.422122.83
XIV1782.861775.3n/a1789.291788.37n/a1786.56n/a1785.561788.32n/an/a1789.571789.20
XV2073.612068.5n/an/a2074.99n/a2075.842073.13 n/a2072.1n/a2065.32067.922069.49
XVI1933.421932.31n/an/a1942.19n/a1942.65n/a n/a1929.79n/an/a1939.521935.23
XVII2177.452162.31n/an/a2177.262174.892175.87n/a n/a2163.15n/a2170.22169.382168.53
XVIII1643.081662.08n/an/a1645.89n/a1644.87n/a n/a1635.142000.621643.31649.291650.69
XIX2569.582589.172569.09n/a2570.25n/a2571n/a n/a2548.29 2569.02551.822549.23
XX3897.083987.223909.863893.913902.633889.033903.713889.253970.693976.83979.783975.13985.713980.5
XXI n/a n/an/an/a n/an/a2217.78 n/a n/an/an/an/a n/a n/a
XXII4309.49n/an/a4318.24 n/an/a4316.92n/a n/a4327.83n/an/a n/a4311.62
XXIII2077.23n/a n/an/an/a n/a2086.45n/a n/a n/an/an/a2076.112075.83
XXIV4310.1n/a n/an/a4307.02n/a4328.574338.37 n/a4349.57n/a4332.94319.254312.57
XXV n/an/an/an/an/a n/a 1266.55 1272.83 n/an/an/an/a n/a n/a
XXVI n/an/an/a n/an/a n/a 2050.58 n/a n/a2074.33n/an/a n/a n/a
XXVII1895.02n/an/a n/an/an/a 1897.49 1896.07 n/a1892.54n/an/a n/a1897.76
XXVIII2506.72498.62n/a 2499.492475.382493.922548.21 2546.82 n/a2539.03 n/a2462.92505.192500.93
XXIX2097.862097.862078.822078.822080.482076.782093.382088.062087.152092.992097.152088.42089.992090.29
XXX5646.285657.595642.65644.25666.715644.325658.635636.365657.365651.565649.535652.35650.235647.01
XXXI n/an/a n/a n/a n/an/a n/a2069.36 n/a2075.07n/a2065.72071.182071.95
XXXII n/an/a n/an/a n/an/a n/an/a n/a2332.052327.72 n/a2332.382330.46
XXXIIIn/an/a n/an/a n/an/a n/an/a n/a1621.17 n/a n/an/an/a
XXXIV n/an/a n/an/a n/an/a n/an/a n/a1227.351233.76 n/a1226.821229.91
XXXVn/an/a n/an/a n/an/a n/an/a n/a n/a790.53 n/an/an/a

References

  1. Neubauer, W. GIS in archaeology—The interface between prospection and excavation. Archaeol. Prospect. 2004, 11, 159–166. [Google Scholar] [CrossRef]
  2. Vilbig, J.M.; Sagan, V.; Bodine, C. Archaeological surveying with airborne LiDAR and UAV photogrammetry: A comparative analysis at Cahokia Mounds. J. Archaeol. Sci. Rep. 2020, 33, 102509. [Google Scholar] [CrossRef]
  3. Remondino, F.; Campana, S. 3D Recording and Modelling in Archaeology and Cultural Heritage. BAR Int. Ser. 2014, 2598, 111–127. [Google Scholar]
  4. Huggett, J. The Apparatus of Digital Archaeology. Internet Archaeol. 2017, 44. [Google Scholar] [CrossRef]
  5. Remondino, F. Heritage Recording and 3D Modeling with Photogrammetry and 3D Scanning. Remote Sens. 2011, 3, 1104–1138. [Google Scholar] [CrossRef] [Green Version]
  6. Pavelka, K.; Šedina, J.; Matoušková, E.; Faltýnová, M.; Hlaváčova, I. Using Remote Sensing and RPAS For Archaeology and Monitoring In Western Greenland. Int. Arch. Photogramm. Remote Sens. Spat. Inf. Sci. 2016, 41, 979–983. [Google Scholar] [CrossRef] [Green Version]
  7. Campana, S. Drones in Archaeology. State-of-the-art and Future Perspectives. Archaeol. Prospect. 2017, 296, 275–296. [Google Scholar] [CrossRef]
  8. Trier, Ø.D.; Cowley, D.C.; Waldeland, A.U. Using deep neural networks on airborne laser scanning data: Results from a case study of semi—Automatic mapping of archaeological topography on Arran, Scotland. Archaeol. Prospect. 2019, 26, 165–175. [Google Scholar] [CrossRef]
  9. Garcia-Molsosa, A.; Orengo, H.A.; Lawrence, D.; Philip, G.; Hopper, K.; Petrie, C.A. Potential of deep learning segmentation for the extraction of archaeological features from historical map series. Archaeol. Prospect. 2021, 28, 187–199. [Google Scholar] [CrossRef]
  10. Guyot, A.; Lennon, M.; Lorho, T.; Hubert-Moy, L. Combined Detection and Segmentation of Archeological Structures from LiDAR Data Using a Deep Learning Approach. J. Comput. Appl. Archaeol. 2021, 4. [Google Scholar] [CrossRef]
  11. Barnes, I. Aerial Remote-sensing Techniques Used in the Management of Archaeological Monuments on the British Army’s Salisbury Plain Training Area, Wiltshire, UK. Archaeol. Prospect. 2003, 10, 83–90. [Google Scholar] [CrossRef]
  12. Bewley, R.H. Aerial survey for archaeology. Photogramm. Rec. 2003, 18, 273–292, 2003. [Google Scholar] [CrossRef] [Green Version]
  13. Kucukkaya, A.G. Photogrammetry and remote sensing in archeology. J. Quant. Spectrosc. Radiat. Transf. 2004, 88, 83–88. [Google Scholar] [CrossRef]
  14. Nuttens, T.; De Maeyer, P.; De Wulf, A.; Goossens, R.; Stal, C. Comparison of 3D Accuracy of Terrestrial Laser Scanning and Digital Photogrammetry: An Archaeological Case Study. In Proceedings of the 31st EARSeL Symposium: Remote Sensing and Geoinformation Not Only for Scientific Cooperation, Prague, Czech Republic, 30 May–2 June 2011; pp. 66–74. [Google Scholar]
  15. Yurtseven, H. Comparison of GNSS, TLS and Different Altitude UAV-Generated Datasets on The Basis of Spatial Differences. ISPRS Int. J. Geo-Inf. 2019, 8, 175. [Google Scholar] [CrossRef] [Green Version]
  16. Liang, H.; Li, W.; Lai, S.; Zhu, L.; Jiang, W.; Zhang, Q. The integration of terrestrial laser scanning and terrestrial and unmanned aerial vehicle digital photogrammetry for the documentation of Chinese classical gardens—A case study of Huanxiu. J. Cult. Herit. 2018, 33, 222–230. [Google Scholar] [CrossRef]
  17. Filzwieser, R.; Olesen, L.H.; Verhoeven, G.; Mauritsen, E.S.; Neubauer, W.; Trinks, I.; Nowak, M.; Nowak, R.; Schneidhofer, P.; Nau, E.; et al. Integration of Complementary Archaeological Prospection Data from a Late Iron Age Settlement at Vesterager—Denmark. J. Archaeol. Method Theory. 2018, 25, 313–333. [Google Scholar] [CrossRef]
  18. Luhmann, T.; Chizhova, M.; Gorkovchuk, D. Fusion of UAV and Terrestrial Photogrammetry with Laser Scanning for 3D Reconstruction of Historic Churches in Georgia. Drones 2020, 4, 53. [Google Scholar] [CrossRef]
  19. Hatzopoulos, J.N.; Stefanakis, D.; Georgopoulos, A.; Tapinaki, S.; Pantelis, V.; Liritzis, I. Use of various surveying technologies to 3D digital mapping and modelling of cultural heritage structures for maintenance and restoration purposes: The Tholos in Delphi, Greece. Mediterr. Archaeol. Archaeom. 2017, 17, 311–336. [Google Scholar] [CrossRef]
  20. Dostal, C.; Yamafune, K. Photogrammetric texture mapping: A method for increasing the Fidelity of 3D models of cultural heritage materials. J. Archaeol. Sci. Rep. 2018, 18, 430–436. [Google Scholar] [CrossRef]
  21. Orengo, H.A.; Krahtopoulou, A.; Garcia-Molsosa, A.; Palaiochoritis, K.; Stamati, A. Photogrammetric re-discovery of the hidden long-term landscapes of western Thessaly, central Greece. J. Archaeol. Sci. 2015, 64, 100–109. [Google Scholar] [CrossRef]
  22. Kadhim, I.; Abed, F.M. Investigating the old city of Babylon: Tracing buried structural history based on photogrammetry and integrated approaches. In Earth Resources and Environmental Remote Sensing/GIS Applications XII; SPIE: Bellingham, DC, USA, 2021; Volume 11863, pp. 75–90. [Google Scholar] [CrossRef]
  23. Kokalj, Ž.; Somrak, M. Why not a single image? Combining visualizations to facilitate fieldwork and on-screen mapping. Remote Sens. 2019, 11, 747. [Google Scholar] [CrossRef] [Green Version]
  24. Jaber, A.; Abed, F. The Fusion of Laser Scans and Digital Images for Effective Cultural Heritage Conservation. Master’s Thesis, University of Baghdad, Baghdad, Iraq, 2020. [Google Scholar]
  25. Inomata, T.; Pinzón, F.; Ranchos, J.L.; Haraguchi, T.; Nasu, H.; Fernandez-Diaz, J.C.; Aoyama, K.; Yonenobu, H. Archaeological application of Airborne LiDAR with object-based vegetation classification and visualization techniques at the lowland Maya Site of Ceibal, Guatemala. Remote Sens. 2017, 9, 563. [Google Scholar] [CrossRef] [Green Version]
  26. Bennett, R.; Welham, K.; Hill, R.A.; Ford, A. A Comparison of Visualization Techniques for Models Created from Airborne Laser Scanned Data. Archaeol. Prospect. 2012, 19, 41–48. [Google Scholar] [CrossRef]
  27. Tzvetkov, J. Relief visualization techniques using free and open source GIS tools. Pol. Cartogr. Rev. 2018, 50, 61–71. [Google Scholar] [CrossRef] [Green Version]
  28. Davis, D.S.; Sanger, M.C.; Lipo, C.P. Automated mound detection using lidar and object-based image analysis in Beaufort County, South Carolina. Southeast. Archaeol. 2019, 38, 23–37. [Google Scholar] [CrossRef]
  29. Kadhim, I.; Abed, F.M. The Potential of LiDAR and UAV-Photogrammetric Data Analysis to Interpret Archaeological Sites: A Case Study of Chun Castle in South-West England. ISPRS Int. J. Geo-Inf. 2021, 10, 41. [Google Scholar] [CrossRef]
  30. Cowley, D.; Jones, R.; Carey, G.; Mitchell, J. Barwhill Revisited: Rethinking Old Interpretations Through Integrated Survey Datasets. Trans. Dumfries. Galloway Nat. Hist. Antiqu. Soc. 2019, 93, 9–26. [Google Scholar]
  31. Holata, L.; Plzák, J.; Světlík, R.; Fonte, J. Integration of Low-Resolution ALS and Ground-Based SfM Photogrammetry Data. A Cost-Effective Approach Providing an ‘Enhanced 3D Model’ of the Hound Tor Archaeological Landscapes. Remote Sens. 2018, 10, 1357. [Google Scholar] [CrossRef] [Green Version]
  32. Papasaika, H.; Baltsavias, E. Fusion of LIDAR and photogrammetric generated Digital Elevation Models. In Proceedings of the ISPRS Hannover Workshop on High-Resolution Earth Imaging for Geospatial Information, Hannover, Germany, 2–5 June 2009; pp. 1–2. [Google Scholar]
  33. Megahed, Y.; Shaker, A.; Yan, W.Y. Fusion of airborne lidar point clouds and aerial images for heterogeneous land-use urban mapping. Remote Sens. 2021, 13, 814. [Google Scholar] [CrossRef]
  34. Ronnholm, P. Registration quality—Towards integration of laser scanning and photogrammetry. EuroSDR 2011, 1370, 6–43. [Google Scholar]
  35. Rönnholm, P.; Honkavaara, E.; Litkey, P.; Hyyppä, H.; Hyyppä, J. Integration of Laser Scanning and Photogrammetry. Int. Arch. Photogramm. Remote Sens. Spat. Inf. Sci. 2007, 36, 355–362. [Google Scholar]
  36. Franceschi, M.; Martinelli, M.; Gislimberti, L.; Rizzi, A.; Massironi, M. Integration of 3D modeling, aerial LiDAR and photogrammetry to study a synsedimentary structure in the Early Jurassic Calcari Grigi. Eur. J. Remote Sens. 2015, 48, 527–539. [Google Scholar] [CrossRef]
  37. Moussa, W. Integration of Digital Photogrammetry and Terrestrial Laser Scanning for Cultural Heritage Data Recording. Ph.D. Thesis, University of Stuttgart, Stuttgart, Germany, 2014. [Google Scholar]
  38. Voltolini, F.; Rizzi, A.; Remondino, F.; Girardi, S.; Gonzo, L. Integration of non-inavsive techniques for documentation and preservation of complex architectures and artworks. Int. Arch. Photogramm. Remote Sens. Spat. Inf. Sci. 2007, 36, 1–7. [Google Scholar]
  39. Guarnieri, A.; Remondino, F.; Vettore, A. Digital Photogrammetry and TLS Data Fusion Applied to Cultural Heritage 3D Modeling. Int. Arch. Photogramm. Remote Sens. Spat. Inf. Sci. 2006, 36, 1–6. [Google Scholar]
  40. Guidi, G.; Remondino, F.; Russo, M.; Menna, F.; Rizzi, A. 3D modeling of large and complex site using multi-sensor integration and multi-resolution data. In Proceedings of the 9th International Symposium on Virtual Reality, Archaeology and Cultural Heritage VAST, Braga, Portugal, 2–5 December 2008; pp. 85–92. [Google Scholar] [CrossRef]
  41. Jaber, A.; Abed, F.M. Revealing the potentials of 3D modelling techniques; a comparison study towards data fusion from hybrid sensors Revealing the potentials of 3D modelling techniques; a comparison study towards data fusion from hybrid sensors. IOP Conf. Ser. Mater. Sci. Eng. 2020, 737. [Google Scholar] [CrossRef]
  42. Barsanti, S.G.; Remondino, F.; Visintini, D. Photogrammetry and laser scanning for archaeological site 3D modeling—Some critical issues. In Proceedings of the 2nd Workshop on The New Technologies for Aquileia (NTA-2012), Aquileia, Italy, 25 June 2012; pp. 1–10. [Google Scholar]
  43. Cerrillo-Cuenca, E. An approach to the automatic surveying of prehistoric barrows through LiDAR. Quat. Int. 2017, 435, 135–145. [Google Scholar] [CrossRef]
  44. Yeomans, C.M.; Middleton, M.; Shail, R.K.; Grebby, S.; Lusty, P.A. Integrated Object-Based Image Analysis for semi-automated geological lineament detection in southwest England. Comput. Geosci. 2019, 123, 137–148. [Google Scholar] [CrossRef]
  45. Stephen, D. The Great Cahokia Mound. Am. Antiqu. Orient. J. 1891, 13, 3. [Google Scholar]
  46. Alt, S.M.; Kruchten, J.D.; Pauketat, T.R. The construction and use of Cahokia’s Grand Plaza. J. Field Archaeol. 2010, 35, 131–146. [Google Scholar] [CrossRef]
  47. Holley, G.R.; Dalan, R.A.; Smith, P.A. Investigation in the Cahokia Site Grand Plaza. Am. Antiq. 1993, 58, 306–319. [Google Scholar] [CrossRef]
  48. Hodges, G. Why Was the Ancient city of Cahokia Abandoned. National Geographic. 2021. Available online: https://www.nationalgeographic.com/environment/article/why-was-ancient-city-of-cahokia-abandoned-new-clues-rule-out-one-theory#:~:text=It%20might%20have%20been%20a,warfare%20had%20become%20a%20problem (accessed on 16 March 2022).
  49. Woods, W.I. Cahokia Mounds. Britannica. 2016. Available online: https://www.britannica.com/place/Cahokia-Mounds (accessed on 1 May 2022).
  50. Thompson, A.E.; Prufer, K.M. Airborne lidar for detecting ancient settlements, and landscape modifications at Uxbenká, Belize. Res. Rep. Belizean Archaeol. 2015, 12, 251–259. [Google Scholar]
  51. King, C. Cahokia Mounds Hosted Only Copper Works In North America. St. Louis Public Radio. 2014. Available online: https://news.stlpublicradio.org/arts/2014-08-01/cahokia-mounds-hosted-only-copper-works-in-north-america (accessed on 19 March 2022).
  52. Von Schwerin, J.; Richards-Rissetto, H.; Remondino, F.; Spera, M.G.; Auer, M.; Billen, N.; Loos, L.; Stelson, L.; Reindel, M. Airborne LiDAR acquisition, post-processing and accuracy-checking for a 3D WebGIS of Copan, Honduras. J. Archaeol. Sci. Rep. 2016, 5, 85–104. [Google Scholar] [CrossRef] [Green Version]
  53. Corns, A.; Shaw, R. High resolution 3-dimensional documentation of archaeological monuments & landscapes using airborne LiDAR. J. Cult. Herit. 2009, 10, 72–77. [Google Scholar] [CrossRef]
  54. Daxer, C. Topographic Openness Maps and Red Relief Image Maps in QGIS. Technol. Rep. Inst. Geol. 2020, 17, 1–15. [Google Scholar] [CrossRef]
  55. Somrak, M.; Džeroski, S.; Kokalj, Ž. Learning to classify structures in ALS-derived visualizations of ancient Maya settlements with CNN. Remote Sens. 2020, 12, 14. [Google Scholar] [CrossRef]
  56. Jiao, Z.H.; Ren, H.; Mu, X.; Zhao, J.; Wang, T.; Dong, J. Evaluation of Four Sky View Factor Algorithms Using Digital Surface and Elevation Model Data. Earth Space Sci. 2019, 6, 222–237. [Google Scholar] [CrossRef]
  57. Lo, C.M.; Lee, C.F.; Keck, J. Application of sky view factor technique to the interpretation and reactivation assessment of landslide activity. Environ. Earth Sci. 2017, 76, 1–14. [Google Scholar] [CrossRef]
  58. Dirksen, M.; Ronda, R.J.; Theeuwes, N.E.; Pagani, G.A. Sky view factor calculations and its application in urban heat island studies. Urb. Clim. 2019, 30, 100498. [Google Scholar] [CrossRef]
  59. Chiba, T.; Hasi, B. Ground surface visualization using red relief image map for a variety of map scales. Int. Arch. Photogramm. Remote Sens. Spat. Inf. Sci. 2016, 41, 393–397. [Google Scholar] [CrossRef] [Green Version]
  60. Yokoyama, R.; Shirasawa, M.; Pike, R.J. Visualizing Topography by Openness: A New Application of Image Processing to Digital Elevation Models. Photogramm. Eng. Remote Sens. 2002, 68, 257–265. [Google Scholar]
  61. Papasaika, H.; Poli, D.; Baltsavias, E. A framework for the fusion of digital elevation models. Int. Arch. Photogramm. Remote Sens. Spat. Inf. Sci. 2008, 37, 811–818. [Google Scholar]
  62. Al-Najjar, H.A.; Kalantar, B.; Pradhan, B.; Saeidi, V.; Halin, A.A.; Ueda, N.; Mansor, S. Land cover classification from fused DSM and UAV images using convolutional neural networks. Remote Sens. 2019, 11, 1461. [Google Scholar] [CrossRef] [Green Version]
  63. Singh, H. Practical Machine Learning and Image Processing: For Facial Recognition, Object Detection, and Pattern Recognition Using Python; Apress: Uttar Pradesh, India, 2019. [Google Scholar]
  64. Kokalj, Ž.; Zakšek, K.; Oštir, K. Visualizations of lidar derived relief models. In Interpreting Archaeological Topography: Airborne Laser Scanning, 3D Data and Ground Observation; Opitz, R.S., Cowley, D.C., Eds.; Oxbow Books: Oxford, UK, 2013; pp. 100–114. [Google Scholar]
  65. Fernández-Lozano, J.; Gutiérrez-Alonso, G. Improving archaeological prospection using localized UAVs assisted photogrammetry: An example from the Roman Gold District of the Eria River Valley (NW Spain). J. Archaeol. Sci. Rep. 2016, 5, 509–520. [Google Scholar] [CrossRef]
  66. Challis, K.; Forlin, P.; Kincey, M. A generic toolkit for the visualization of archaeological features on airborne LiDAR elevation data. Archaeol. Prospect. 2011, 18, 279–289. [Google Scholar] [CrossRef]
  67. López, J.B.; Jiménez, G.A.; Romero, M.S.; García, E.A.; Martín, S.F.; Medina, A.L.; Guerrero, J.E. 3D modelling in archaeology: The application of Structure from Motion methods to the study of the megalithic necropolis of Panoria (Granada, Spain). J. Archaeol. Sci. Rep. 2016, 10, 495–506. [Google Scholar] [CrossRef]
  68. Kokalj, Ž.; Zakšek, K.; Oštir, K. Application of sky-view factor for the visualisation of historic landscape features in lidar-derived relief models. Antiquity 2011, 85, 263–273. [Google Scholar] [CrossRef]
  69. Doneus, M.; Briese, C.; Fera, M.; Janner, M. Archaeological prospection of forested areas using full-waveform airborne laser scanning. J. Archaeol. Sci. 2008, 35, 882–893. [Google Scholar] [CrossRef]
  70. Agudo, P.U.; Pajas, J.A.; Pérez-Cabello, F.; Redón, J.V.; Lebrón, B.E. The potential of drones and sensors to enhance detection of archaeological cropmarks: A comparative study between multi-spectral and thermal imagery. Drones 2018, 2, 29. [Google Scholar] [CrossRef]
  71. Azmi, S.M.; Ahmad, B.; Ahmad, A. Accuracy assessment of topographic mapping using UAV image integrated with satellite images. IOP Conf. Ser. Earth Environ. Sci. 2014, 18, 1. [Google Scholar] [CrossRef] [Green Version]
  72. Forlani, G.; Pinto, L.; Roncella, R.; Pagliari, D. Terrestrial photogrammetry without ground con-trol Points. Earth Sci. Inform. 2014, 7, 882–893. [Google Scholar] [CrossRef]
Figure 1. Flowchart of this study for detecting archaeological remains through various visual analysis techniques (VATs) derived from the digital terrain models (DTMs) of the LiDAR and structure from motion–multi-view stereo (SfM–MVS) photogrammetric datasets.
Remotesensing 15 01057 g001
Figure 2. The location of the study site: (b) the study area—Cahokia’s Grand Plaza (approximately 50.097 ha, measured in QGIS) and (a) satellite imagery of the USA. (Source: map©2021 Google).
Remotesensing 15 01057 g002
Figure 3. Archaeological features of the Cahokia Mounds study site, demonstrated in the study by Alt et al. [46].
Remotesensing 15 01057 g003
Figure 4. Three visualization raster images: (a) hillshade, (b) gradient, (c) SVF were derived from the LiDAR data (upper side) and the SfM–MVS data (lower side) to reveal known archaeological remains (mounds) and traces of demolished houses in Cahokia’s Grand Plaza. Low pixel values are black while high values are white.
Remotesensing 15 01057 g004
Figure 5. Some of the detected features are represented by SVShade in Cahokia’s Grand Plaza and defined in Table A1.
Remotesensing 15 01057 g005
Figure 6. The integrated raster images created from the photogrammetric and LiDAR data: (a) red relief image map (RRIM) from the SfM–MVS photogrammetry and (b) the RRIM from the LiDAR data for the Cahokia’s Grand Plaza site.
Remotesensing 15 01057 g006
Figure 7. The illustration of five integrated raster images created from different datasets—photogrammetry and LiDAR—to enhance the recognition of archaeological remains and traces of modern features (demolished structures and paths/roads) that have been demolished in the Cahokia’s Grand Plaza site. Low pixel values are black, while high values are white.
Remotesensing 15 01057 g007
Figure 8. The illustration of two new, integrated raster images—the SVShade (I) was created by integrating SfM SVF with LiDAR hillshade. The second raster is the SVShade (II) which was generated by integrating SVF LiDAR with SfM hillshade. We revealed several features through these raster images, e.g., known features (mounds), traces of modern demolished structures, as well as linear features (walking paths/roads). Low pixel values are black, while high values are white.
Remotesensing 15 01057 g008
Figure 9. The illustration of the fused raster image created from combining the mosaic derived from the photogrammetry with the digital terrain model (DTM) generated from the light detection and ranging (LiDAR) data to detect archaeological features and marks of modern features that have been ruined in the Cahokia’s Grand Plaza site. Low pixel values are black, while high values are white.
Remotesensing 15 01057 g009
Figure 10. Represents the variations in areas (m2) of the detected remain (mounds) in Cahokia’s Grand Plaza produced from the standalone and the combination approaches (integration and fusion). These detected features were already known in the study area (a PDF of this figure is available in higher resolution).
Remotesensing 15 01057 g010
Figure 11. The variations in area (m2) of the newly detected remains (traces of demolished constructions) in Cahokia’s Grand Plaza extracted from the standalone and integration approaches (a PDF of this figure is available in higher resolution).
Remotesensing 15 01057 g011
Figure 12. The bar chart illustrates the relative number of features identified in this study based on the standalone visual analysis techniques (VATs) derived from the photogrammetric and light detection and ranging (LiDAR) data of Cahokia’s Grand Plaza. The possible remains that were identified in only one VAT are deemed possible errors, i.e., feature ‘XXXV’, feature in the integrated gradient (Table A1, Figure 7 and Figure 8).
Remotesensing 15 01057 g012
Table 1. The settings applied in this study to integrate the raster images (hillshade, gradient, and SVF) created from LiDAR and photogrammetry.
RasterIntegrated HillshadeIntegrated
Gradient
Integrated SVFSVShade (I)SVShade (II)
Contrast enhancement
(Both data sources)
Min–maxMin–maxMin–maxMin–maxMin–max
Blending mode
(Both data sources)
MultiplyMultiplyMultiplyMultiplyMultiply
Transparency (%)LiDAR: 75LiDAR: 70% LiDAR: 70LiDAR: 70LiDAR: 60
SfM: 75SfM: 65% SfM: 70SfM: 70SfM: 60
Brightness (%)LiDAR: default LiDAR: 50 LiDAR: Default LiDAR hillshade: 10LiDAR SVF: 20
SfM: 20 SfM: 50 SfM: Default SfM SVF: 20SfM hillshade: 20
Disclaimer/Publisher’s Note: The statements, opinions and data contained in all publications are solely those of the individual author(s) and contributor(s) and not of MDPI and/or the editor(s). MDPI and/or the editor(s) disclaim responsibility for any injury to people or property resulting from any ideas, methods, instructions or products referred to in the content.

