Abstract
Clusters of sea stacks, called rauks, are unique rocky landforms characteristic of Baltic Sea coasts. These limestone stacks raise interest due to their spectacular morphology and yet unexplained origin. This study presents the results of seasonal observations (2019–2020) of rauk coast changes carried out in one of the key rauk fields on Fårö Island, Sweden. The landforms developing within three test sites were examined. At Langhammars ‘classic’ field of rauks built from homogeneous limestone (1) and a shore platform devoid of rauks, underlain clearly separate limestone slabs were explored (2); and at Gamla Hamn, the analysis covered a non-typical rauk field built of densely laminated limestone (3). We applied terrestrial laser scanning (TLS) to obtain data needed in morphometric analyses and rauk surface change monitoring. We identified and determined contemporary erosional rates and dominant processes responsible for eroding and downwearing of rauk coasts. The observed changes were strongly associated with differences in local lithological and structural conditions—from a nearly complete absence within massive limestone rauks notches, to clear signs of erosion within limestone slabs eroded by waves, almost 1 m2 in size.
1. Introduction
Tors with complex morphological patterns, often forming larger clusters known as ruiniform relief [1,2], have raised interest since historical times and provoked numerous questions about their origin (e.g., [3,4]). Sea stacks in Sweden, known as rauks (Figure 1 and Figure 2), form spectacular and picturesque column-like tors cut in Silurian limestone (e.g., [5]). Presumably, rauks were mentioned in the scientific literature for the first time in the 18th century, when the famous taxonomist Carl Linneaus [6] called them ‘stone giants’ (p. 218). A terse description of the sea stacks of Gotland and Fårö was also provided by a British geologist, Roderick Murchison [7], and in the following century, their detailed characteristics became the subject of a study conducted by H. Munthe [8]. One of the reasons standing behind it is that Gotland possesses one of the most complete records of Silurian stratigraphy and hence, much of the research was devoted entirely to sedimentology and paleontology [9,10,11]; research focusing strictly on geomorphology referred mostly to beaches and attempted reconstruction of the post-glacial history of the Baltic Sea [12,13]. The geomorphological development of rauks was not of great interest to researchers, and the few studies, written mostly in Swedish, were not available to international audiences [14].
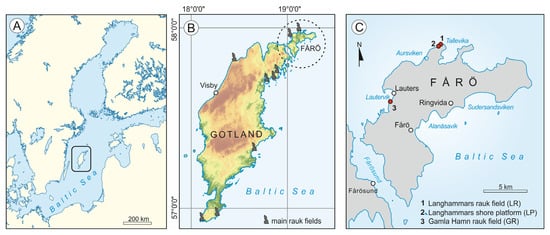
Figure 1.
Location of study area: (A) Gotland and Fårö on the Baltic Sea; (B) main rauk fields in Gotland and Fårö; (C) location of TLS measurement sites on Fårö.
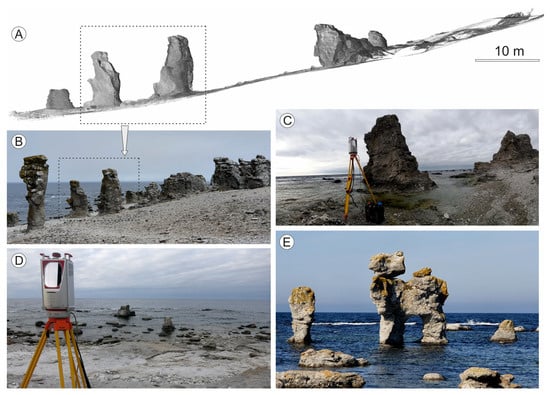
Figure 2.
Rocky rauk coast on Fårö Island: (A) cross-section of the TLS cloud point for Langhammars; (B) rauk field at Langhammars; (C) rauks at Digerhuvud; (D) limestone shore platform at Langhammars; (E) famous “Hund” rauk at Gamla Hamn (names of field sites are the same as in Figure 1C).
The landscape of the contemporary coastline of Gotland and Fårö Islands, including remaining rauk fields, is predominantly a product of post-glacial processes [15], which has recently been demonstrated in the studies by Strzelecki et al. [16,17]. Researchers agree that the fundamental lithological and structural factor the persistence and morphology of rauks is that they are most frequently cut in resistant, massive limestones that used to be the cores of Silurian coral reefs [15,18]. Sea abrasion is commonly regarded as the key erosive factor that leads to removing less resistant, stratified limestone surrounding its massive variety [15,19]. At the same time, it should be highlighted that although the role of abrasion seems obvious—the most recognisable rauk fields occur within the zone of the direct impact of waves—this erosional factor has been a priori accepted since the time of Linneus [6]. Only Rudberg [20] and Cruslock et al. [21] attempted to quantify sea abrasion. The former, however, due to the then available technology, used insufficiently precise methods, whereas the latter did not monitor rauks but solely rocky shore platforms at their bases.
Consequently, the nature and dynamics of the processes modelling rauk fields within the present-day coastline are still open questions. The significance of potential answers is manifested at two levels. Firstly, it provides a perspective for explaining the surprising persistence of such landforms. Secondly, it will facilitate stating whether and how quickly rauks deteriorate. Considering their outstanding geographical and educational value (many rauk fields are protected nature reserves), this is crucial to preparing protective plans.
Prior to this study, our team [17] presented a new conceptual model for rauks development, based on a mutual relationship between the efficiency of sea abrasion exposing resistant rauks from weaker limestone layers, and trends in sea level changes controlled by glacio-isostatic rebound, allowing rauk fields uplift and preservation. This study, for the first time, attempts to use high-resolution data from terrestrial laser scanning (TLS) for evaluating the seasonal morphodynamics of rauk fields and the nearby rocky coastal zones.
Terrestrial laser scanning was selected as the potentially most effective tool for collecting high-resolution morphometric data for a relatively large area [22,23,24,25,26,27] with expected sub-centimetre changes during the assumed one-season study period. TLS has been successfully applied to several rocky coastal studies where its precision allowed the detection of very subtle microrelief changes [28,29,30,31,32,33] that are often undetectable by other remote sensing applications, i.e., satellite, aerial, or unmanned aerial vehicle imagery analyses.
2. Materials and Methods
2.1. Study Side
The most recognisable and spectacular rauks are located on Fårö Island—in the Langhammars and Gamla Hamn localities (Figure 1 and Figure 2). They occur at different altitudes—some of them directly on the coast or even in the sea, whereas others are in the inland settings, 30 m asl (above sea level). This study analysed three study sites on Fårö Island: Langhammars rauk field (LR), Langhammars shore platform (LP), and Gamla Hamn rauk field (GR). Langhammars comprises the northern part of the island between Aursviken Bay in the west and Tällevika Bay in the east (Figure 3A). Within the LR site, a ‘classic’ rauk field was examined that consisted of massive, homogenous limestone landforms growing directly from the coast, and about 400 m WSW of them—the LP shore platform where rauks are no longer present. Within the GR site, laser scanning was performed on a rauk field consisting of forms found in laminated limestone [34]. Such an approach aimed to reveal differences in the dynamics of erosion processes occurring between respective sites, and to identify directional changes in the relief of the analysed sections of the coast.
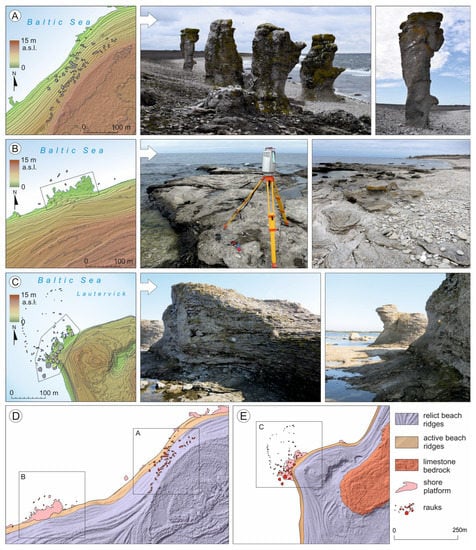
Figure 3.
Location of study areas with diverse coastal landscape: (A) rauk fields in Langhammars surrounded by shingle beach ridges of Langhammars (LR); (B) shore platform developed in limestone of Langhammars (LP); (C) rauks and rocky cliffs at Gamla Hamn; (D) geomorphological map of Langhammars; (E) geomorphological map of Gamla Hamn.
Nearly the entire Langhammars peninsula, more than 2.5 km long, is covered by the Langhammars (Raukområde) nature reserve. The peninsula gently descends towards the sea, and its tallest section—the cliff behind the rauk field in Klajvika—is up to 15 m a.s.l. The LR site extends over 1.4 ha, including about 50 rauks, several of which are 8–10 m high rock columns. These rauks tower above a 50–70 m wide shingle beach of crushed limestone [35].
The LP site is located on a small cape, and its surface area is about 0.4 ha (Figure 3B). This area covers a section of the shingle beach, as well as a well-developed and wave-polished rocky shore platform with numerous pools and elevated bedrock sections (up to 0.5–0.7 m). The platform is actively shaped by wave action, and is fully inundated during the high tide and storm floodings, and water filling the hollows remains in them almost permanently. Most of the rocky pools, fissures, and gaps between the limestone slabs separated from the platform are filled with shingle.
The GR site is about 1 km SW from Lauters (Figure 3C). This is a rocky cape on the southern tip of Lautervik. The cape, and the adjacent water area of 1.3 ha, are legally protected as a nature reserve. The section of a limestone platform extending about 100 m NW–SE of the beach is a protected landscape. This is where up to 4–5 m tall rauks occur; the biggest are found inland. Most often, rauks are shaped in densely laminated limestone. Rocks within the local rauk fields, apparently fragile and easy to loosen, are not disintegrated under hand pressure. These landforms’ ordinate tops are close to the crown of the beach embankments of Högklint formations that are abundant in stromatoporoids. Seven out of the fifty rock formations protruding above the water surface are rauks, and they are from 1.2 m to 5.5 m high. The most recognisable landform is ‘Kaffepannan’ (also known as ‘Hunden’).
The study area is located in the transitional temperate climate zone. The mean annual air temperature measured at the weather station in Fårösund (1997–2021) was 8.4 °C (own elaboration based on SMHI.se). Negative air temperatures in that multi-annual period were recorded from October until March. A mean monthly temperature below zero occurs from December until March, most frequently in February, which is the month when the mean monthly air temperature below zero was recorded 12 times in this multi-annual period. Boelhouwers et al. [35] found that in this area, from 1997 to 2017, the winter season, on average, featured only 21 days with a mean diurnal air temperature below 0 °C, and 53 days on which the minimum air temperature was below 0 °C. From 1997 to 2021, the lowest temperatures recorded in February amounted to −17.0 °C. By contrast, the highest temperatures were measured in July, and amounted to 30.9 °C. Precipitation, with a mean annual sum in this multi-annual period amounting to 448 mm, occurs mainly in the year’s second half, and reaches its peak in August—on average, 57 mm.
2.2. Data Acquisition
2.2.1. Equipment, Field Campaigns, and Post-Processing
Two scanners, a Leica ScanStation C10 and a Riegl VZ-4000, were used for acquiring project data. The Leica is a pulse laser with a single measurement accuracy of 4 mm, a range of 300 m at 90% albedo and 134 at 18% albedo, and a maximum scan rate of up to 50,000 points/s. The Riegl VZ-4000 is also a pulse laser with a maximum characteristic range of up to 4000 m and a fast data acquisition rate (from 20,000 to 200,000 pulses/s), an accuracy of 15 mm, and a precision of 10 mm. Field tasks were assigned as follows, considering the properties and efficiency of scanners. The Riegl VZ-4000 was mainly used for scanning large areas—rauk fields—from multiple stations for morphometric purposes. In particular, the MSA (Multi Station Adjustment) module allows merging a cloud point at the post-processing stage without needing benchmarks from other measuring stations. On the other hand, the Leica scanner was used for detailed measurements of several selected landforms.
The TLS campaigns were conducted during comprehensive geomorphological surveys in March 2019 and September 2020 on the coast of Fårö Island. The studies were intended to measure the efficiency of present-day erosional and weathering processes at the rocky coast to explain rauk fields’ origins. The tests covered rauk fields and platforms extending between 12,000 and 30,000 m2, and included from 4 to 14 TLS positions (Table 1).

Table 1.
Table of acquired field data.
During the second series of measurements (2020), the scanning sites were as close as possible to their locations from 2019.
The scans from the Riegl scanner, for general landscape monitoring, were performed at an angular step of 0.05°, which in the case of points projected onto a horizontal plane, results in their dispersion of about 1–3 cm, or more densely. The mean distance between all points used at the iterative closest point (ICP), during alignment by the MSA module, for two stations was 0.018–0.022 m, and nearly 400 generated planes were used for the comparison. This allowed for quick mapping and detecting surface changes from 15–20 cm2. In practice, a point-to-point analysis allowed the assessment of 10–20 mm changes. The uncertainty was much lower in the case of detailed scans with the Leica device, and it was assessed that certainly changes above 4 mm are very clearly noticeable.
Before combining scan positions from campaigns and making comparisons of point clouds, filtration was carried out to reflections coming directly from the ground—almost exclusively rocks. In the first stage, objects such as people or field equipment were removed manually. Then, the noise from the beams’ reflections from aerosols resulting from waves breaking against rocks was filtered out. The filtering was based on the reflectance parameter < −10 dB, performed by automatic selection and manual verification. Then, mirror reflections from the water were removed, initially by cutting below sea level, and verified manually.
The vegetation was sparse in the scanned area, mainly as single clumps of grass. In order to eliminate them, an automatic tool in the RiSCAN PRO program marked reflections on any base that was more than 2 cm in height from the coats, with an angle of inclination of up to 90 degrees. Point clouds were filtered for the presence of vegetation, also using echo detection using full waveforms [36]. Only single beams were left, and split padding—first, medium, and last—was removed.
Point clouds from respective scan positions acquired by the Leica scanner were aligned using 6″ circular HDS scan targets. In contrast, the RiSCAN PRO software and the Multi-Station Adjustment module were used with the Riegl scanner. This module enables the alignment of point clouds from multiple stations, with no need to locate any reference objects; it generates planes from the point clouds and aligns them on the basis of similarity and spatial distribution. The resulting PolyData objects are used by the RIEGL Multi Station Adjustment Tool for automatic fine alignment using the best-fit iterative least-squares iterative method. The alignment quality was visually confirmed for all point clouds.
The DTM was made for the initial assessment and searched for changes, but due to the large terrain roughness, sharp rocks, and the occasional occurrence of water in the depressions, this method could not be fully relied upon. Based on these data, the authors further manually identified individual sites by measuring them point to point. This was possible due to the small number and size of erosion sites. With a short series between the individual series of scans, the individual assessment of erosion sites was even more valuable, although more time-consuming.
2.2.2. Thermal Conditions
In order to recognise the possibilities for development in the examined area of processes associated with frost weathering in the subsequent winter season from 2020 to 2021, the temperature of the surface layer of rocks was registered using a waterproof temperature logger, Hobo–Pendant MX Temp. The sensor was placed at the GR Gamla Hamn site (Figure 4), inserted in the wall of a rauk between the rock layers close to the surface, where it was not directly exposed to sunlight, at approx. 3 m a.s.l. The data logger allowed temperature measurements with an accuracy of up to 0.1 °C. The measurements were conducted every 10 min. The hourly measurements were later analysed.
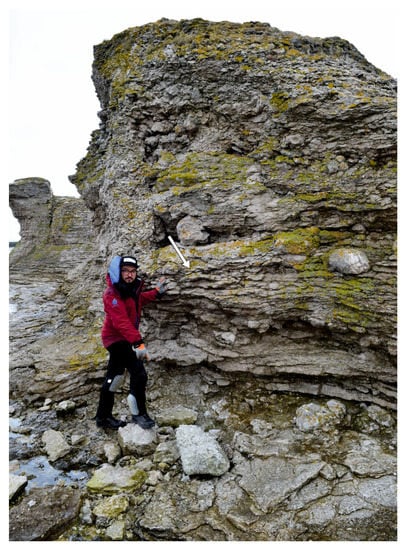
Figure 4.
Location of temperature logger on rauk in Gamla Hamn.
Diurnal SMI data (www.smhi.se/en/climate, accessed on 3 September 2022) were used for describing the thermal and pluvial conditions observed in the study area in the multi-annual period from 1997 to 2021.
3. Results
Based on the results of differential analyses of TLS point clouds in combination with a geomorphological reconnaissance, three types of contemporary transformations were identified within the examined rauk coastal systems. It turned out that their nature is closely associated to the lithological and structural properties of the rock massif.
3.1. Changes within Rauks Built of Massive, Homogeneous Limestone (Occurring at the LR Site)
The area where rauks occur is dominated by flat-lying rocks characteristically undercut, forming notches on the seaward side. The differential analysis of point clouds within the rock notches, based on scanning images from 2019 and 2020, showed no changes. The results were verified by mapping mesh models and measuring selected points in each cloud. No changes were also found during the visual assessment of the examined landforms carried out directly in the field, as freshly dislodged rocks are clearly lighter in colour since they are not weathered or overgrown with lichen. No changes were observed in all the examined notches that had developed in rauks, irrespective of their elevation and distance from the present waterline. However, slight transformations were visible out of the notches on strongly weathered rock surfaces of the rauks (Figure 5).
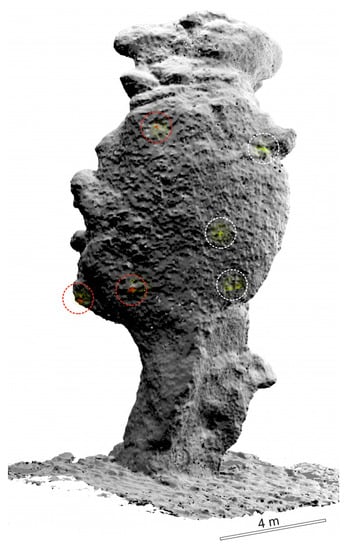
Figure 5.
A mesh model of a rauk at Langhammars with marked erosion points. The identified points of clear erosion were marked with red lines, and changes within the method’s accuracy limit were marked with white lines.
The analysis of point clouds revealed changes such as from 20 to 200 cm2 pieces of 0.5–1.0 (max. 2.0) centimetre-thick surface layers flaking off (Figure 6). These changes mainly occur within areas with clearly separate textures, and they are not easy to detect due to their small size and intermittent occurrence. Within a single rauk (with an area of 50–80 m2), up to ten transformed areas were identified. Although such cases were not very numerous, most occurred at about 2 m above ground level, mainly on the walls of rauks oriented towards the sea.
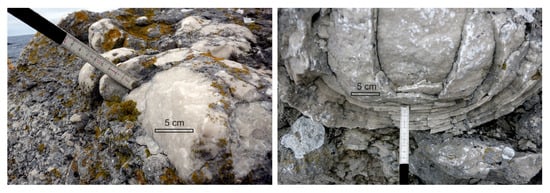
Figure 6.
Example of erosion on rocks in Langhammars.
3.2. Changes in the Rock Surface of Rauks Built from Laminated Limestone (GR Site)
A preliminary field assessment showed noticeable changes within the walls of rauks built of horizontally laminated limestone. Due to the presence of discontinuities between the rock layers, the effects of processes occurring here were clear and easily identifiable. They were seen both during a visual inspection in the field as traces of freshly dislodged pieces, and during the differential analysis of point clouds. Lighter spots implying recent losses in the rocks were seen intermittently. They were 20–30 cm long, and most often came from single beds.
The differential analysis of point clouds strongly supported our field observations. The changes occurred at some points only, and were identified irrespectively from the position in relation to the sea or from the slope aspect. In most cases, rocks were dislodged at the lower section of the micro-ledges (Figure 7). Most often, single, 2–5-centimetre-thick and 20–30-centimetre-long horizontal beds were observed to come off at a 3–8 cm depth. Generally, it was assumed that one spot where the changes existed was identified approximately per 2–4 m2 of the rock formation’s wall. No spectacular changes or ones that, in the nearest perspective, could affect the stability of rauks, were observed. The table gives examples of the dimensions of the dislodged pieces of rocks. Table 1 shows approximate rock volumes for the E and HI sites, and Figure 3 and Figure 4 illustrate the scaling range in detection point clouds.
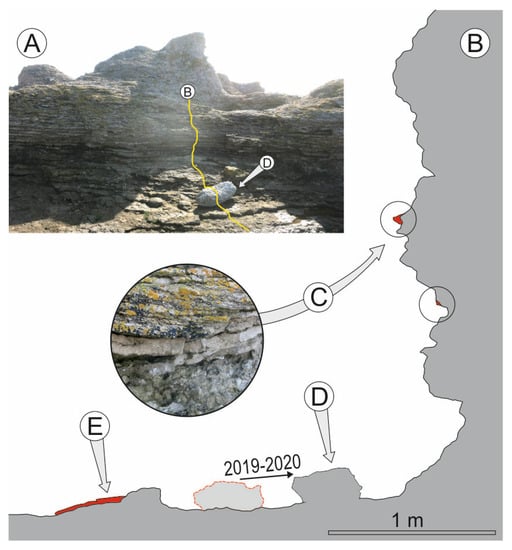
Figure 7.
Examples of erosion within laminated limestones at the Gamla Hamn site: (A) a piece of rauk built from laminated limestone; (B) rauk profile based on a TLS point cloud with marked points of erosion from 2019 and 2020 (marked in red); (C) a piece of limestone layer recently eroded and dislodged, identified based on the TLS differential analysis; (D) a displaced boulder at the rauk’s foot; (E) erosion on limestone slabs.
The material coming off the rauks was not deposited at their feet. Most likely, it was displaced, and disintegrated through wave erosion and tourist traffic.
3.3. Changes across Shore Platform
Horizontal limestone slabs with clearly horizontal layers were exposed at the LR site as well as some points at the GR site. On the slabs’ surface, fresh losses of the rock material were identified thanks to the lighter and more intense colour of the newly exposed rock surfaces with no traces of algae and lichen.
More numerous and more extensive transformations of the coast were observed across the well-developed shore platform at the Langhammars site (LP). The differential analysis of point clouds made it possible to evaluate that the sizes of rock losses started from the size of a palm (10/20 cm) with a thickness of 3–4 cm, and ended with more pieces than 50 cm (max. 80 cm) long and 10 cm thick (Figure 8 and Figure 9). In the area of 1000 m2, the number of cases when the surface of dislodged rocks exceeded 0.1 m2 was over 10. Eroded sections occurred throughout the exposed peninsula, where the waves did not reach in normal weather. At the same time, no remnants of dislodged pieces of rocks were observed on the platform surface, the size and shapes of which would allow identification of their original positions. Most likely, they were quickly disintegrating or removed from the platform by waves.
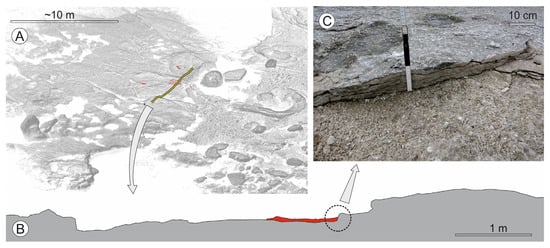
Figure 8.
Examples of limestone slabs erosion: (A) point cloud with a profile line (marked in yellow) and points of erosion (marked in red); (B) terrain profile based on point clouds with a marked point of limestone plate dislodging; (C) a piece of rock identified in the field showing traces of recent dislodging.
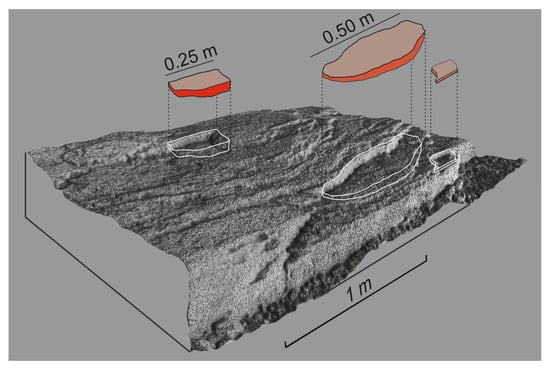
Figure 9.
An example of limestone plate erosion was identified from 2019 to 2020 at the Langhammars platform (LP). A mesh model made of TLS point clouds.
The losses were definitely less numerous and smaller at the Gamla Hamn site, and their maximum size was 20–30 cm (30 × 30 cm), affecting 2–3 cm thick layers, corresponding to the beds’ thickness.
Apart from the above-presented three types of disintegration of rocks in the examined coastal system, a dislocation of single rock blocks laying near the rauks was noted. For instance, on the shore platform at the Gamla Hamn site, at the elevation of 0.2–0.3 m asl, a rock block weighing about 100 kg was found to have been displaced (Figure 8). From 2019 to 2020, it moved 1 m towards the land, and the shape of the block did not change. This area is normally out of the reach of sea waves and is only affected by wave erosion during storms or sea-ice movement during cold winter seasons.
3.4. Frost Weathering
The basic condition for the development of frost weathering is the process of water freezing and thawing in the rock mass. In this case, due to the salinity of seawater, which, for the central Baltic is about 7‰ [37], this process occurs at approximately −0.4 °C water temperature. We assumed the moment the temperature passes through the point −0.4 °C, both below and above this value, to be the basis for calculating the number of freeze–thaw cycles (FTC) that occurred in the study area. Measuring data acquired from the temperature sensor indicated that in the study area, in the winter season 2021–2022, temperatures below this value were recorded from 13 January until 20 March. At that time, the FTC occurred 54 times over 26 days, divided into three sub-periods. The FTC number was clearly accumulated between 30.01 and 20.02 when 32 freeze–thaw cycles were recorded (Figure 10).
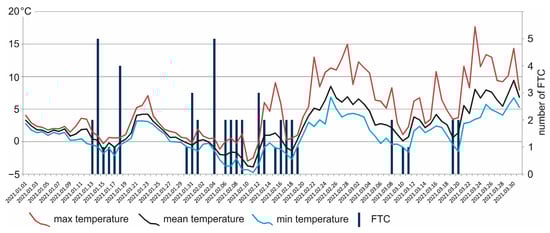
Figure 10.
Air temperature and number of FTC in the winter season of 2020/2021.
For the 2019–2020 winter season, between the TLS measurement series and the following one, 2020–2021, during which temperature was monitored on the land surface, were clearly warmer compared with the 25 years from 1997 to 2021. The 2019–2020 season was particularly warm, with monthly air temperatures from December until March exceeding monthly temperatures recorded for the multi-annual period, from 1.8–1.9 °C (March and December, respectively) to 3.7–3.3 °C (January and February, respectively). In the 2020–2021 season, the noted mean monthly temperatures exceeded the values recorded for the multi-annual period, from 2.7 °C (November) to 0.1 °C (January) (Figure 11).
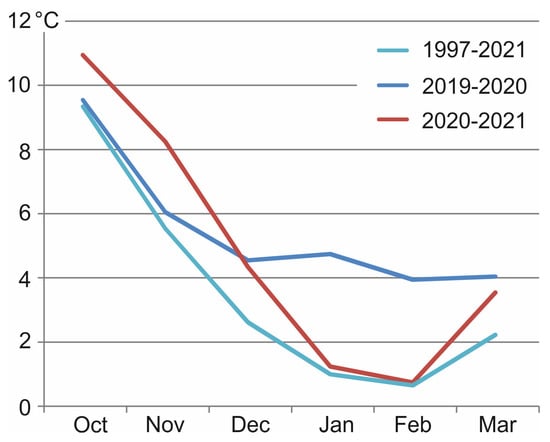
Figure 11.
Mean monthly air temperatures in winter 2019/2020 and 2020/2021 compared with the multi-annual period, Fårösund (Own elaboration based on SMHI.se).
4. Discussion—Rauk Evolution Concept in Light of TLS
This study corroborates the recent findings of Strzelecki et al. [17], who found that during sea-level standstills, continued coastal erosion led to the development of notches in the surface of sea stacks (rauks), and after the glacio-isostatic uplift of rauk fields and associated cut-off wave action on the stacks surface, wave-abraded notches were exposed to the operation of other subaerial processes (wind action, mechanical and chemical weathering, etc.) and remained relatively stable. The most susceptible to gradual flaking off were rauks built from stratified limestone (GR site), and sections of rauks in which separate layers could be seen (sections of the LR site). Their lithology is conducive to water penetration into gaps, leading to the degradation of small rocks. In contrast, where limestone slabs occurred, erosion was so significant that most rauks have not survived there.
One season is certainly not much, but our results validated conceptual theories explaining the evolution of rauk coastal systems on the Baltic islands, and characterised in more detail the controls of rauks’ surprisingly high resistance and the fascinating relief of stack surface. The TLS technique appeared to be an excellent tool for mapping purposes, particularly for landforms that were inaccessible for technical reasons and due to the protection of nature. Scanning is one of the most efficient non-invasive methods of high-resolution monitoring of large areas, allowing for detailed specification of relief transformations occurring within them.
Changes in the relief of rocky coasts, including limestone coasts, progress slowly [38,39]. Apart from single incidental events, such as the displacement of rock blocks of considerable size, their surface transformations are difficult to notice. Their diversity is linked to the type of rocks being transformed and their microlithological profiles, due to which the changes often occur topically. The research is further complicated by the fact that, except on a few occasions, it is impossible to indirectly evaluate the intensity of the processes based on the balance of volume of the rock material being dislodged from the rock landform and dislocated towards its foot. Wave action displaces this material from where it falls, after which it is further disintegrated. Depending on the reach of the sea waves’ impact in relation to the degraded coastal zone, the material is displaced when falling to the ground or later, during storms, when the wave energy and reach are increased.
Due to the above-described specific features of transformations occurring within rocky coasts—that is, low dynamics, point distribution, the possibility of assessing losses only, which requires recurring high-resolution measurements and the necessity to conduct research in large areas—terrestrial laser scanning was used in the study of the rauk coastal systems on Fårö Island. This method was also successfully applied in previous similar coast surveys [38,39]. The TLS method was accompanied by a detailed geomorphological reconnaissance of the area, particularly identifying signs of contemporary transformations within this area, which provided both qualitative and mostly quantitative data that allowed evaluation of the rates of such transformations.
In such surveys, it is essential to have a point of reference, both in terms of time and space, and TLS perfectly satisfies both requirements [40,41,42]. In geomorphological research, these are often solely the effects of erosion processes that can be observed, while the original status can only be estimated [43].
The surveys within the examined rauk coastal system identified three types of dislocations referring to the geological features of the massive rock, which resulted in the observed terrain relief. The results confirmed previous concepts regarding the evolution of such coasts presented by [15,18,19,20,21] and, recently, by Strzelecki et al. [17]. The absence of clear changes in the relief of notches developed in massive limestone, stemming from the analysis of the acquired data, implies that they are currently stable, and that the impact of processes that had the strongest influence on their shape has ceased (Figure 12). Most likely, they were formed (as assumed by [17]) by the activity of waves—shifting and abrasion caused by shingle. These landforms are currently out of the reach of sea waves, so the notches are not evolving in their original form, but are only subject to weathering processes and intermittent dislodging, which are imperceptible during such a short series of measurements. At the same time, the properties of the rocks in which they developed—massive limestones devoid of surfaces with clear texture—are responsible for their high resistance to weathering processes. Rauks, dominating over the gently sloping ground, can be tors constituting massive remnants of the original rock outcrop. The longevity of landforms built of homogenous limestone is well testified by the fact that many of them may be found hundreds of meters away from the present-day seashore, some tens of meters above contemporary sea level. Such solitary stacks, investigated by our team in the forests near the village of Bunge, prove to be particularly resistant, showing no signs of deterioration. At the same time, stratified limestones at Gamla Hamn are subject to erosion at higher rates, as implied by point losses identified in the walls of rauks developed in them. Their original relief, initiated by coastal erosion, is continually transformed due to the impact of present-day processes. The effect of abrasion processes is further reinforced by freeze–thaw weathering [17]. Currently, the observed rock crumbling process also occurs within the rauk fields on sections out of the contemporary reach of sea waves. The process, monitored for one season, progresses slowly, but over decades and hundreds of years can lead to the cutting and collapse of the rocky landforms. The rate of the erosional processes influencing rauks built of stratified limestone is considerably faster than that for their massive counterparts. It can be hypothesised that this is the reason for the general scarcity of sea stacks underlain by stratified limestone in the zones no longer under the action of sea waves. Most possibly, the rauks at Gamla Hamn will be eroded over millennia and will not survive as isolated remnants, as is the case of the rauks built of resistant, homogenous limestone.
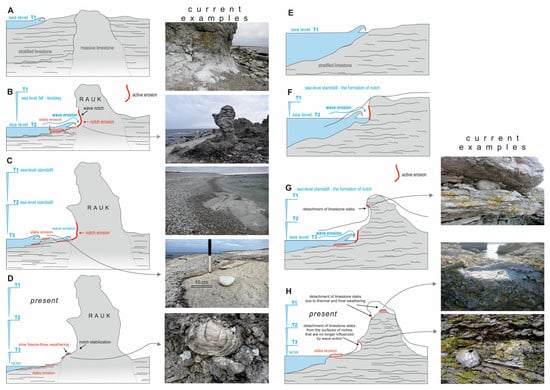
Figure 12.
The concept of rauk coastal system development (A–D) massive limestone rauks, (E–H) stratified limestone rauks) on Fårö Island emerged on the basis of our own field surveys, including but not limited to surveys based on TLS point cloud analysis and reference literature: (A) rocky coast built from stratified limestone and massive limestone that later developed into rauks; (B) period of a uplift of the rauk field due to glacio-isostatic rebound, development of notches due to the direct impact of waves on hard limestones, dislodgement of stratified limestone; (C) another period of sea-level stabilisation and wave erosion. Development of a new level of notches; (D) present-day. Notches out of the reach of waves. Erosion of limestone slabs and frost weathering of rock surface; (E) rocky coast built from laminated limestone—at the onset after the outcrop—ice sheet retreat; (F) period of a stable sea-level and wave operation on rauk surface; (G) subsequent period of sea-level stabilisation. Development of a lower level of notches. Destruction of rauks by waves and dislodgement of the top layers due to frost weathering; (H) further disintegration of the rauk.
The most changed parts of the examined coast were places where plattenkalk (stratified limestone) occurred. The dislodged pieces of rocks reference the rock layers, have a large surface, and, at the same time, are not very thick. Waves, particularly storm waves, displace the separated material, causing its disintegration. As a result, only shingle remains at the seashore, with no larger pieces of rocks. The plate on the shore platform that is flooded occasionally can become separated due to thermal erosion or water penetrating gaps in rocks.
Numerous localities with sea stacks have been described worldwide [44,45,46,47]; some of them are of special geoheritage and aesthetic value. Based on this study, it is highly recommended to monitor the stability and erosion rates of these landforms using the TLS technique, which proved to offer minute details of the morphological changes. Such data may serve for the preparation of protection and management plans, which are particularly important from a geoconservation perspective.
5. Conclusions
This study presented the results of monitoring a rauk coast’s seasonal morphodynamics, using detailed TLS surveys. The research highlights the value of high-resolution surveys in detecting very small microrelief changes in rocky coastal landscapes.
We draw the following conclusions:
- Through the use of TLS, the magnitude of contemporary changes on rauk coasts has been assessed for the first time on a seasonal basis at a high, sub-centimetre resolution, enabling an assessment of its current erosion rate and degradation.
- No significant changes were observed in all the examined notches of rauks built of massive, homogeneous limestone. Slight transformations were visible from the notches on strongly weathered rauk surfaces where 0.5–1.0 centimetre-thick surface layers were flaking off. The bigger changes were detected on the surface of rauks built from laminated limestone. Here, up to 2–5 centimetre-wide and 20–30-centimetre-long rock fragments were falling from the rauks, leaving ca. 3–8 cm deep hollows and cracks. On shore platforms, we mapped the erosion of limestone slabs up to 3–4 cm thick and more than 50 cm long.
- TLS enabled a spatial assessment of the amount and magnitude of changes within the Fårö and Gotland rauk fields, placing them against the area’s diverse geology and the geomorphological processes transforming it.
- The results support the conceptual model of rauk coast evolution presented by [17].
- The TLS measurements carried out constitute the first such detailed documentation of the rauk fields in the Baltic region, providing a starting point for future analyses of land stability and erosional and weathering patterns in a warmer future. The data obtained in TLS surveys constitute a digital archive of the rauk coast landscape, and should support future coastal monitoring and geoheritage studies.
Author Contributions
Conceptualisation of manuscript, S.T.; fieldwork, S.T., M.C.S., F.D. and Ł.Z.; TLS data acquisition, S.T. and Ł.Z.; analysed the rauk morphometric properties from TLS, S.T. and Ł.Z.; writing—original draft preparation, S.T., H.K., M.C.S., F.D. and Ł.Z.; visualisation, S.T.; analysis of the climatic data, H.K.; funding acquisition, M.C.S. All authors have read and agreed to the published version of the manuscript.
Funding
This is the contribution to the National Science Centre in Poland project ‘RAUK - forgotten witness of Holocene sea-level changes and development of Baltic rocky coasts’ (UMO-2016/21/D/ST10/01976). Investigations of rauk coasts supplement the research initiatives of the IAG Rock Coasts Working Group.
Data Availability Statement
The data presented in this study are available on request from the first author.
Acknowledgments
Five reviewers’ critical remarks and comments helped improve the manuscript. We thank Anki and her family from the STF Bunge Camping site for providing accommodation and new information about rauk field localities during our stays in Gotland. We are also grateful to the NAVIGA company for logistical support during fieldwork. The authors would like to acknowledge Roman Starostecki for support in the mesh visualisation.
Conflicts of Interest
The authors declare no conflict of interest.
References
- Migoń, P.; Duszyński, F.; Goudie, A. Rock cities and ruiniform relief: Forms—processes—terminology. Earth-Sci. Rev. 2017, 171, 78–104. [Google Scholar] [CrossRef]
- Migoń, P.; Duszyński, F. Ruiniform Relief. In Treatise on Geomorphology, 2nd ed.; Shroder, J., Ed.; Academic Press: Cambridge, MA, USA, 2022; pp. 408–431. [Google Scholar]
- Rooke, H. Some account of the Brimham Rocks in Yorkshire. Archaeologia 1787, 8, 1–9. [Google Scholar]
- Pennant, T. A Tour from Alston-Moor to Harrogate, and Brimham Crags; Mercier and Co.: London, UK, 1804; p. 130. [Google Scholar]
- Eliason, S.; Bassett, M.G.; Willman, S. Geotourism Highlights of Gotland; NGO GEOGuide Baltoscandia: Tallin, Estonia, 2010; pp. 5–41. [Google Scholar]
- Linnaeus, C. Ölandska Och Gotländska Resa Pa Riksens Högloflige Ständers Befallning Förrättad Ahr 1741. In Gotländska Resaflrrattad 1741; Naturoch Kultur: Stockholm, Sweden,, 1745; p. 187. [Google Scholar]
- Murchison, R.I. On the Silurian and Associated Rocks in Dalecarlia, and on the Succession from Lower to Upper Silurian in Smoland, öland, and Gothland, and in Scania. Q. J. Geol. Soc. 1847, 3, 1–48. [Google Scholar] [CrossRef]
- Munthe, H. Sveriges Raukar Jamte Exempel Pa Pseudoraukar. Sver. Geol. Unders. Ser. C 1921, 303, 1–39. [Google Scholar]
- Manten, A.A. Some middle silurian reefs of gotland. Sedimentology 1962, 1, 211–234. [Google Scholar] [CrossRef]
- Kershaw, S. The Silurian geology of Gotland, Sweden. Geol. Today 1993, 9, 187–190. [Google Scholar] [CrossRef]
- Watts, N.R.; Riding, R. Growth of rigid high-relief patch reefs, Mid-Silurian, Gotland, Sweden. Sedimentology 2000, 47, 979–994. [Google Scholar] [CrossRef]
- Björck, S. A review of the history of the Baltic Sea, 13.0-8.0 ka BP. Quat. Int. 1995, 27, 19–40. [Google Scholar] [CrossRef]
- Berglund, B.E.; Sandgren, P.; Barnekow, L.; Hannon, G.; Jiang, H.; Skog, G.; Yu, S.-Y. Early Holocene history of the Baltic Sea, as reflected in coastal sediments in Blekinge, southeastern Sweden. Quat. Int. 2005, 130, 111–139. [Google Scholar] [CrossRef]
- Forsberg, P. Geomorfologiska Studier Av Kustplattformen Utmed Gotlands Nordvästra Klintkust. Univ. Stockholm Dep. Phys. Geography. Forsk. 1995, 101, 74. [Google Scholar]
- Erlström, M.; Persson, L.; Sivhed, U.; Wickström, L. K 221 Beskrivning till Regional Berggrundskartaöver Gotlandslän; Sveriges Geologiska Undersökning: Uppsala, Sweden, 2009; pp. 5–60. [Google Scholar]
- Strzelecki, M.C.; Duszyński, F.; Tyszkowski, S.; Zbucki, Ł.; Kasprzak, M. Rauk—A Forgotten Witness of Holocene Sea-level Change and Development of Baltic Rocky Coasts: A Pilot Geomorphological Study in Lergrav Raukar Field. J. Coast. Res. 2020, 95, 659–663. [Google Scholar] [CrossRef]
- Strzelecki, M.C.; Duszyński, F.; Tyszkowski, S.; Zbucki, Ł. Limestone Sea Stacks (Rauks) Record Past Sea Levels and Rocky Coast Evolution in the Baltic Sea (Gotland and Fårö Islands, Sweden). Front. Earth Sci. 2022, 10. [Google Scholar] [CrossRef]
- Manten, A.A. Silurian Reefs of Gotland; Elsevier: Amsterdam, The Netherlands, 1971; 539p. [Google Scholar]
- Johansson, A.E. Geomorfologisk Klassificering Och Kartering Av Fårö Kust, Gotland. Kulturgeografiska Inst. 2017, 44. [Google Scholar]
- Rudberg, S. The Cliff Coast of Gotland and the Rate of Cliff Retreat. Geogr. Ann. Ser. A Phys. Geogr. 1967, 49, 283–298. [Google Scholar] [CrossRef]
- Cruslock, E.M.; Naylor, L.A.; Foote, Y.L.; Swantesson, J.O. Geomorphologic equifinality: A comparison between shore platforms in Höga Kusten and Fårö, Sweden and the Vale of Glamorgan, South Wales, UK. Geomorphology 2010, 114, 78–88. [Google Scholar] [CrossRef]
- Calligaro, S.; Sofia, G.; Prosdocimi, M.; Fontana, G.D.; Tarolli, P. Terrestrial laser scanner data to support coastal erosion analysis: The conero case study. Isprs Int. Arch. Photogramm. Remote Sens. Spat. Inf. Sci. 2013, XL-5/W3, 125–129. [Google Scholar] [CrossRef]
- Tyszkowski, S.; Kaczmarek, H.; Linowski, S.; Marszelewski, W. Testing of differential elevation models based on combined airborne and long-range terrestrial laser scanning for assessment of river bank erosion. Geogr. Pol. 2017, 90, 493–498. [Google Scholar]
- Rączkowska, Z.; Cebulski, J. Quantitative assessment of the complexity of talus slope morphodynamics using multi-temporal data from terrestrial laser scanning (Tatra Mts., Poland). Catena 2022, 209, 105792. [Google Scholar] [CrossRef]
- Cebulski, J. Impact of river erosion on variances in colluvial movement and type for landslides in the Polish Outer Carpathians. Catena 2022, 217, 106415. [Google Scholar] [CrossRef]
- Abellán, A.; Oppikofer, T.; Jaboyedoff, M.; Rosser, N.J.; Lim, M.; Lato, M.J. Terrestrial laser scanning of rock slope instabilities. Earth Surf. Process. Landforms 2013, 39, 80–97. [Google Scholar] [CrossRef]
- Tyszkowski, S.; Kaczmarek, H.; Linowski, S.; Kozyreva, E. Analysis of river bank erosion by combined airborne and long-range terrestrial laser scanning: Preliminary results on the vistula river. Geodyn. Tectonophys. 2018, 9, 249–261. [Google Scholar] [CrossRef]
- Dewez, T.J.; Rohmer, J.; Regard, V.; Cnudde, C. Probabilistic coastal cliff collapse hazard from repeated terrestrial laser surveys: Case study from Mesnil Val (Normandy, northern France). J. Coast. Res. 2013, 65, 702–707. [Google Scholar] [CrossRef]
- Esposito, G.; Salvini, R.; Matano, F.; Sacchi, M.; Danzi, M.; Somma, R.; Troise, C. Multitemporal Monitoring of a Coastal Landslide through SfM-Derived Point Cloud Comparison. Photogramm. Rec. 2017, 32, 459–479. [Google Scholar] [CrossRef]
- Schneiderwind, S.; Boulton, S.; Papanikolaou, I.; Reicherter, K. Innovative tidal notch detection using TLS and fuzzy logic: Implications for palaeo-shorelines from compressional (Crete) and extensional (Gulf of Corinth) tectonic settings. Geomorphology 2017, 283, 189–200. [Google Scholar] [CrossRef]
- Lim, M.; Strzelecki, M.C.; Kasprzak, M.; Swirad, Z.M.; Webster, C.; Woodward, J.; Gjelten, H. Arctic rock coast responses under a changing climate. Remote Sens. Environ. 2020, 236, 111500. [Google Scholar] [CrossRef]
- Westoby, M.; Lim, M.; Hogg, M.; Dunlop, L.; Pound, M.; Strzelecki, M.; Woodward, J. Decoding Complex Erosion Responses for the Mitigation of Coastal Rockfall Hazards Using Repeat Terrestrial LiDAR. Remote Sens. 2020, 12, 2620. [Google Scholar] [CrossRef]
- Ossowski, R.; Przyborski, M.; Tysiac, P. Stability Assessment of Coastal Cliffs Incorporating Laser Scanning Technology and a Numerical Analysis. Remote Sens. 2019, 11, 1951. [Google Scholar] [CrossRef]
- Svantesson, S.I. Beskrivning till jordartskartan: Gotland; Sveriges Geologiska Undersökning: Uppsala, Sweden, 2008; pp. 1–48. [Google Scholar]
- Boelhouwers, J.; Andersson, C.; Berg, R.; Kandastar, R.A.; Sjöman, A.; Lindgren, E.V. Long-term frost weathering rates of limestone beach clasts, Fårö Island, Central Baltic Sea. Geogr. Ann. Ser. A Phys. Geogr. 2020, 102, 12–32. [Google Scholar] [CrossRef]
- Tyszkowski, S.; Cebulski, J. Practical aspects of landslides surveys using terrestrial laser scanning in diverse geomorphological terrains: Case studies from Polish Carpathians and Lower Vistula Valley. Z. Geomorphol. 2019, 62, 107–124. [Google Scholar] [CrossRef]
- Feistel, R.; Weinreben, S.; Wolf, H.; Seitz, S.; Spitzer, P.; Adel, B.; Nausch, G.; Schneider, B.; Wright, D.G. Density and Absolute Salinity of the Baltic Sea 2006–2009. Ocean Sci. 2010, 6, 3–24. [Google Scholar] [CrossRef]
- Rosser, N.; Petley, D.; Lim, M.; Dunning, S.; Allison, R. Terrestrial laser scanning for monitoring the process of hard rock coastal cliff erosion. Q. J. Eng. Geol. Hydrogeol. 2005, 38, 363–375. [Google Scholar] [CrossRef]
- Roulland, T.; Maquaire, O.; Costa, S.; Medjkane, M.; Davidson, R.; Fauchard, C.; Antoine, R. Seasonal activity quantification of coast badlands by TLS monitoring over five years at the “Vaches Noires” cliffs (Normandy, France). Geomorphology 2022, 400, 108083. [Google Scholar] [CrossRef]
- Kociuba, W. Analysis of geomorphic changes and quantification of sediment budgets of a small Arctic valley with the application of repeat TLS surveys. Z. Geomorphol. Supp. Issues 2017, 61, 105–120. [Google Scholar] [CrossRef]
- Kociuba, W. Different Paths for Developing Terrestrial LiDAR Data for Comparative Analyses of Topographic Surface Changes. Appl. Sci. 2020, 10, 7409. [Google Scholar] [CrossRef]
- Kaczmarek, H.; Tyszkowski, S.; Bartczak, A.; Kramkowski, M.; Wasak, K. The role of freeze-thaw action in dam reservoir cliff degradation assessed by terrestrial laser scanning: A case study of Jeziorsko Reservoir (central Poland). Sci. Total Environ. 2019, 690, 1140–1150. [Google Scholar] [CrossRef]
- Harishidayat, D.; Al-Shuhail, A.; Randazzo, G.; Lanza, S.; Muzirafuti, A. Reconstruction of Land and Marine Features by Seismic and Surface Geomorphology Techniques. Appl. Sci. 2022, 12, 9611. [Google Scholar] [CrossRef]
- Shepard, F.P.; Kuhn, G.G. History of Sea Arches and Remnant Stacks of La Jolla, California, and Their Bearing on Similar Features Elsewhere. Mar. Geol. 1983, 51, 139–161. [Google Scholar] [CrossRef]
- Trenhaile, A.S.; Pepper, D.A.; Trenhaile, R.W.; Dalimonte, M. Stacks and Notches at Hopewell Rocks, New Brunswick, Canada. Earth Surf. Process. Landforms 1998, 23, 975–988. [Google Scholar] [CrossRef]
- Limber, P.W.; Murray, A.B. Sea stack formation and the role of abrasion on beach-mantled headlands. Earth Surf. Process. Landforms 2014, 40, 559–568. [Google Scholar] [CrossRef]
- Bezore, R.; Kennedy, D.M.; Ierodiaconou, D. The Drowned Apostles: The Longevity of Sea Stacks over Eustatic Cycles. J. Coast. Res. 2016, 75, 592–596. [Google Scholar] [CrossRef]


Disclaimer/Publisher’s Note: The statements, opinions and data contained in all publications are solely those of the individual author(s) and contributor(s) and not of MDPI and/or the editor(s). MDPI and/or the editor(s) disclaim responsibility for any injury to people or property resulting from any ideas, methods, instructions or products referred to in the content. |
© 2023 by the authors. Licensee MDPI, Basel, Switzerland. This article is an open access article distributed under the terms and conditions of the Creative Commons Attribution (CC BY) license (https://creativecommons.org/licenses/by/4.0/).