Article

Using UAV Time Series to Estimate Landslides’ Kinematics Uncertainties, Case Study: Chirlești Earthflow, Romania

1
Faculty of Geography, University of Bucharest, Nicolae Bălcescu, No. 1, 010041 Bucharest, Romania
2
Institute for Research (ICUB), University of Bucharest, 010041 Bucharest, Romania
3
Geological Institute of Romania, Caransebeş Street, No. 1, 012271 Bucharest, Romania
4
National Meteorological Administration, 013686 Bucharest, Romania
5
National Institute of Hydrology and Water Management, 013686 Bucharest, Romania
*
Author to whom correspondence should be addressed.
Remote Sens. 2023, 15(8), 2161; https://doi.org/10.3390/rs15082161
Submission received: 12 February 2023 / Revised: 11 April 2023 / Accepted: 13 April 2023 / Published: 19 April 2023

Abstract

:
This paper presents a methodology for evaluating the uncertainties caused by the misalignment between two digital elevation models in estimating landslide kinematics. The study focuses on the earthflow near the town of Chirlești, located in the Bend Subcarpathians, Buzău County, Romania, which poses a high risk of blocking the DN10 national road. Four flights were conducted between 2018 and 2022 using a DJI Phantom 4 UAV using the same flight plan. Monte Carlo simulations were used to model uncertainty propagation of the DEM misalignments in the landslide kinematics analysis. The simulations were applied to the accuracy values of the structure from a motion process used to generate the digital elevation models. The degree of uncertainty was assessed using the displaced material’s total amount in conjunction with the spatial correlation of the displaced material between two consecutive flights. The results revealed that the increase in the RMS values did not determine an increase in the displaced earth between two UAV flights. Instead, combining the RMS values and the correlation coefficient clearly indicated the correspondence between the spatial distribution of the displaced earth material and the overall changes reported between the two UAV flights. An RMS value of up to 1 unit associated with a correlation coefficient of 0.95 could be considered the maximum allowable error for estimating landslide kinematics across space and time. The current methodology is reliable when studying slow-movement landslides and when using short intervals between UAV flights. For rapid movements or significant terrain changes, such as translational and rotational landslides, careful analysis of the correlation coefficient in conjunction with the RMS values is recommended.

1. Introduction

An earthflow is a landslide flow type similar to debris flow and mudflow [1,2,3]. Depending on the rock types involved and the different water inputs, these types of flow can sometimes be confused, especially, if two types of flow can alternate at the same site. Despite their low velocity, the earthflows can cause significant material damage.
The morphology of an earthflow can resemble that of a mudflow, which is why confusion can be created. In the case of earthflow, the presence of lateral slickensides’ shear surfaces indicate the existence of an earthflow [4]. In mudflows, such sliding planes do not exist, and the flow is characterised by a much larger amount of water embedded in the displaced material. As mentioned by [4], an earthflow can sometimes also involve a much more fluid component. This type of flow, if it occurs in predominantly pelitic deposits, can turn into a mudflow with increasing water quantity [2,5]. Probably for these reasons, [4] included in the term earthflow, both earthflow and mudflow, based on a classification of landslides made by [6].
In the ensemble, the flows have elongated shapes [7] with very wide source and accumulation zones and relatively narrow transport zones [8]. The accumulation area is notable because it gives rise to a positive form of accumulation with a cone/fan shape. Usually, the accumulation area has many transverse ridges and depressions.
Synthesising the above, it can be concluded that the material that makes up earthflow and mudflow can be similar or identical; however, the two processes can be differentiated by different water content, which imprints different velocities [9].
In general, the earth material displaced by a landslide has been estimated from high-resolution digital elevation models by applying a technique named difference of DEMs (DoD). Over time, the digital elevation models were obtained by using various techniques. One of the first methods to build a DEM was based on the interpolation of contours and elevation points [10,11,12]. These datasets were usually digitised on scanned topographical maps or produced from stereo aerial imagery. More recently, the DEMs were obtained from stereo pairs of satellite imagery or as a product of interferometry when radar images were used [13,14]. The development of LiDAR sensors mounted on airplanes moved one step further the monitoring of landslides across the world and especially in areas with dense vegetation cover [15,16,17,18]. Still, the costs for monitoring a landslide with either of the proposed solutions were not affordable for the general landslide research community. With the recent advancements in earth observation from the last ten years, more lightweight sensors were developed and mounted on low-cost UAVs, thus, making the process of landslide kinematics monitoring more accessible than before. The combination of UAV and terrestrial LiDAR was another approach for mapping landslides under vegetation cover [19]. Nowadays, LiDAR sensors are available at reasonable prices on most consumer/enterprise UAVs, together with RGB cameras [20,21]. Even though LiDAR is available on UAVs, the most-used platforms and sensors for monitoring the landslide are those equipped with RGB cameras [22,23,24,25] due to the very low acquisition costs and the advantage of scanning very large areas in a short period of time.
Still, the results obtained from DoD are prone to uncertainties caused by the misalignment between the DEMs [26], especially, when the second- or third-order derivatives are produced, as they are for the estimation of the displaced material. The degree to which these uncertainties are associated with the misalignment still needs to be explored in much detail. Thus, the current study focuses on assessing the uncertainties associated with the space–time misalignment between the DEMs obtained from UAV aerial imagery when landslide volume displacements are mapped and evaluated. The case study is Chirlești’s earthflow, located in the Bend Carpathians, Romania, for which four flights have been flown from 2018 to 2022.

2. Study Area

2.1. Regional Settings

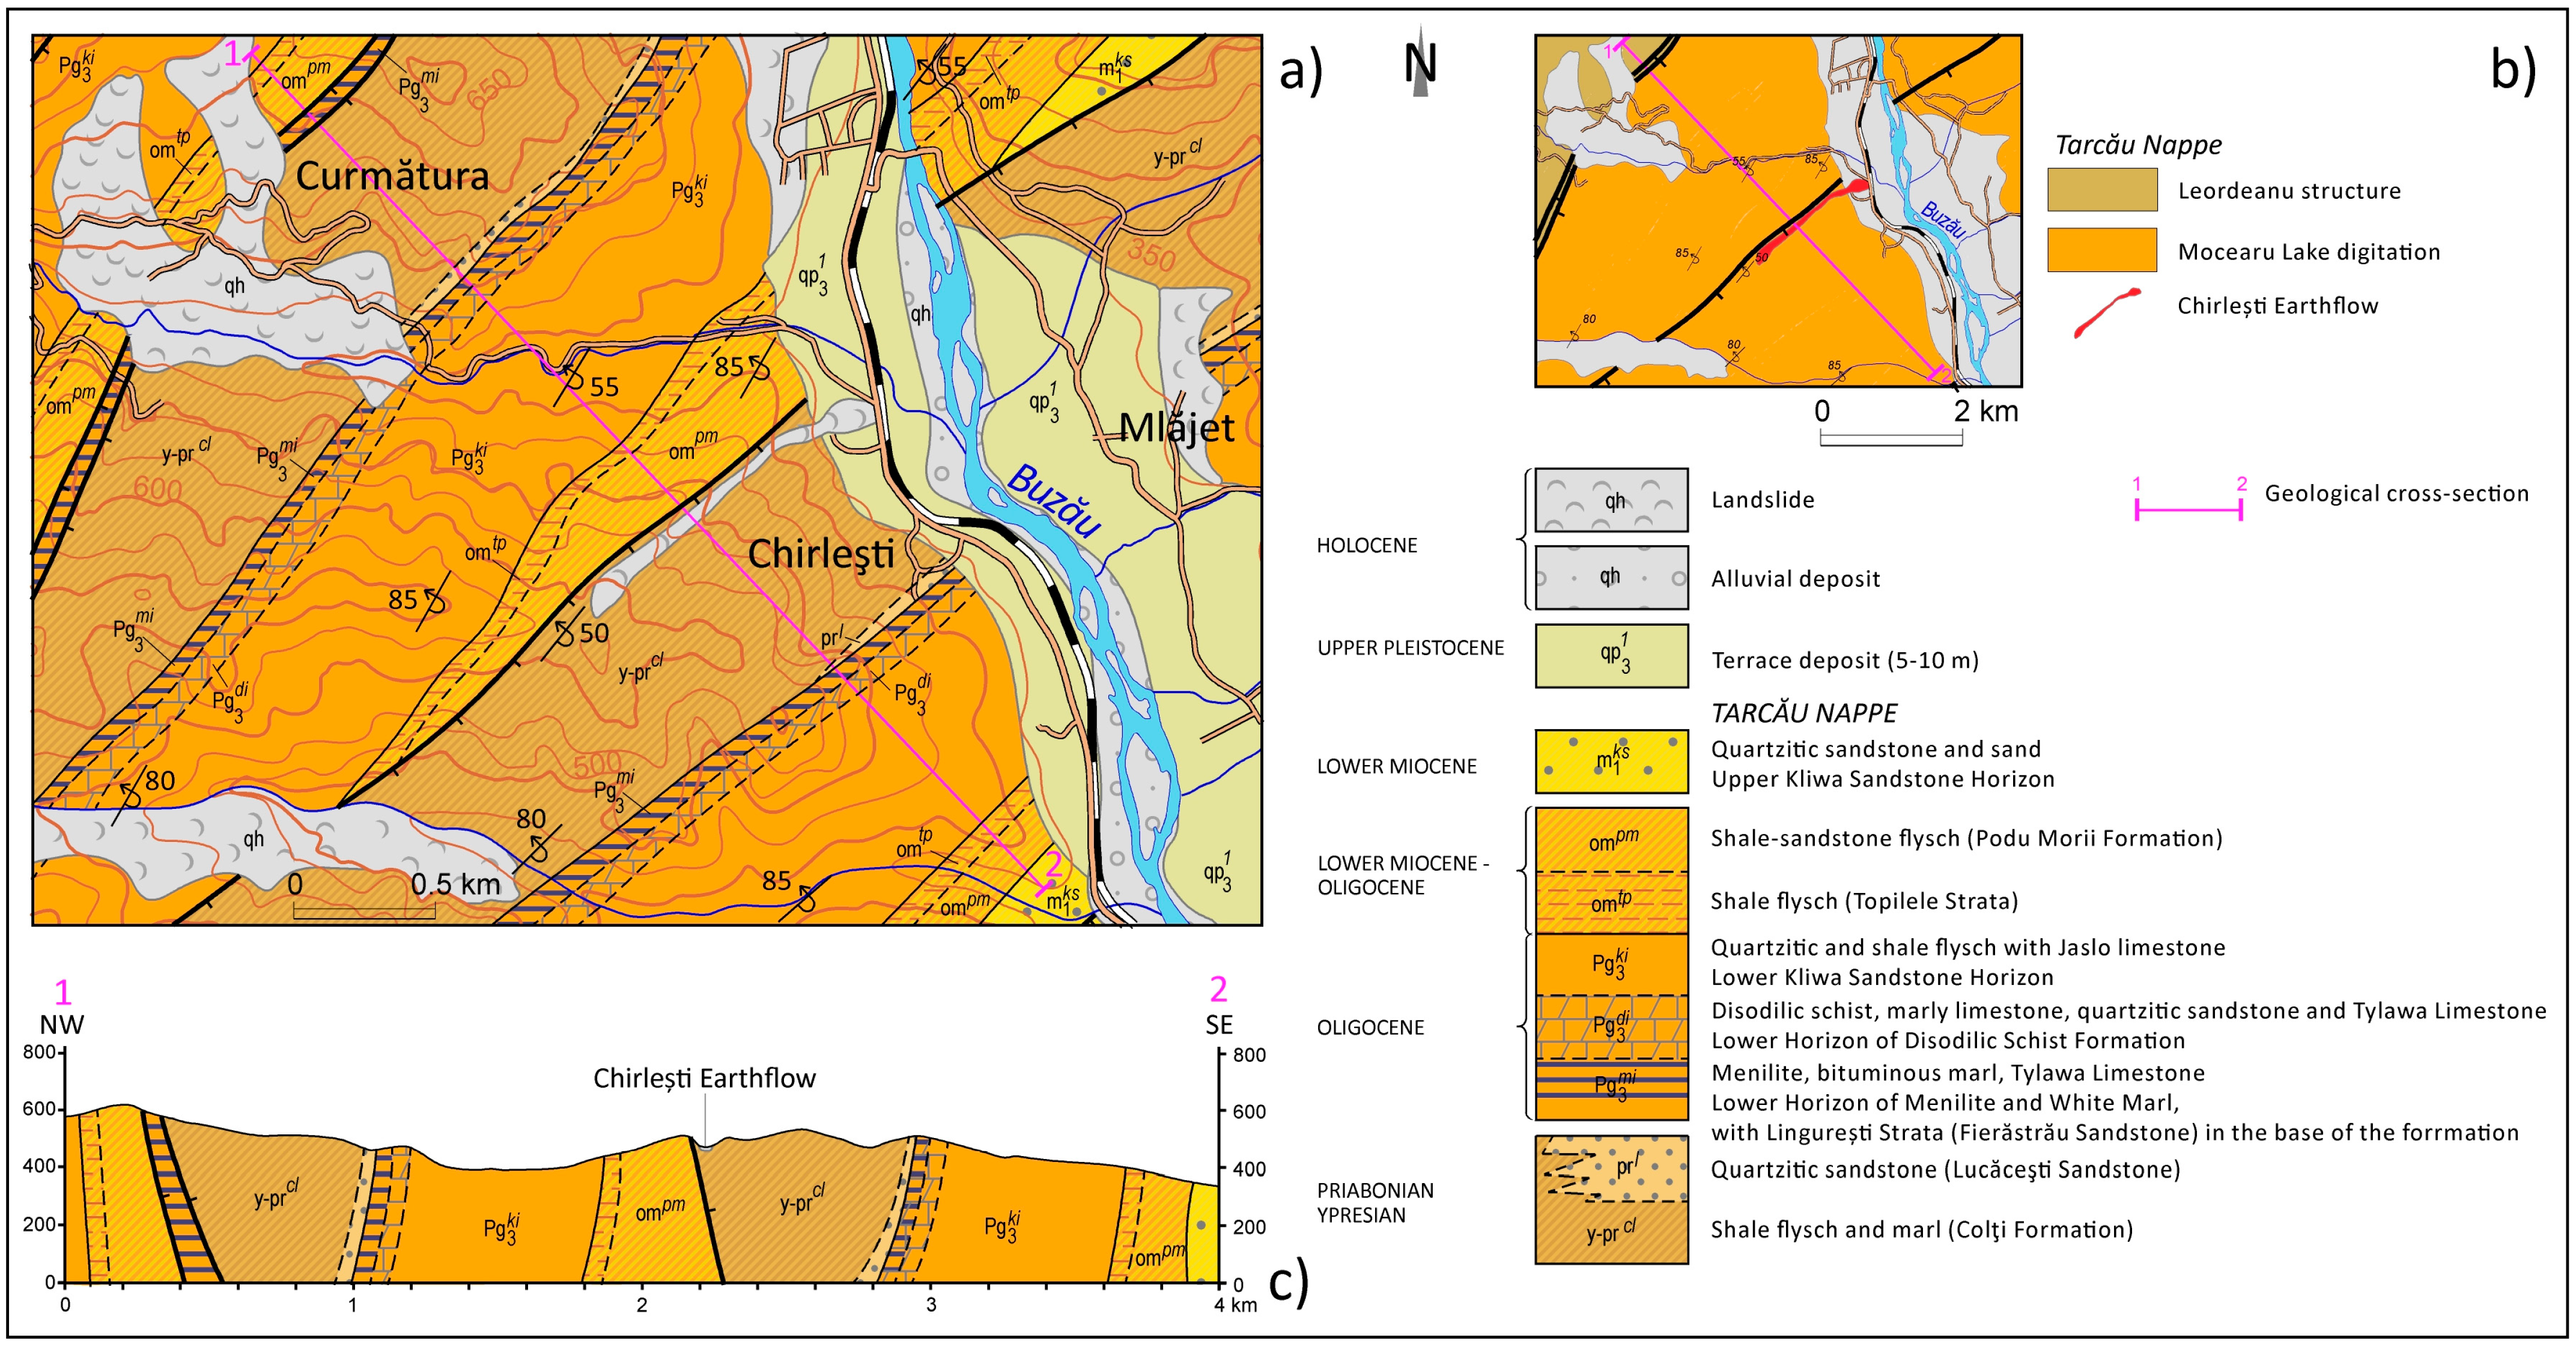
The Chirlești landslide is located in the Bend Carpathians, on the right slope of the Buzău River, south of the Pătârlatele locality (Figure 1), in the most active tectonic and seismic region in Romania. From a tectonic point of view, the Bend Carpathians consist of a succession of nappes with a structure of thrusts and folds, in which the direction is from the northwest to the southeast (Figure 2). The tectonic units which overlap the Chirlești landslide are the Moldavides (Tarcău Nappe, respectively), which include nappes with Miocene tectogenesis [27,28,29,30,31].
The disposition and array of the tectonic units are evident due to the alternation of a large variety of flysches with different lithology and cohesion, which display an alternation of hard and soft strips. The elevation in the mountains from the Buzău watershed usually does not exceed 1500 m; however, the area near Chirlești has a relatively low altitude, between 400 and 800 m.

2.2. Chirlești Earthflow

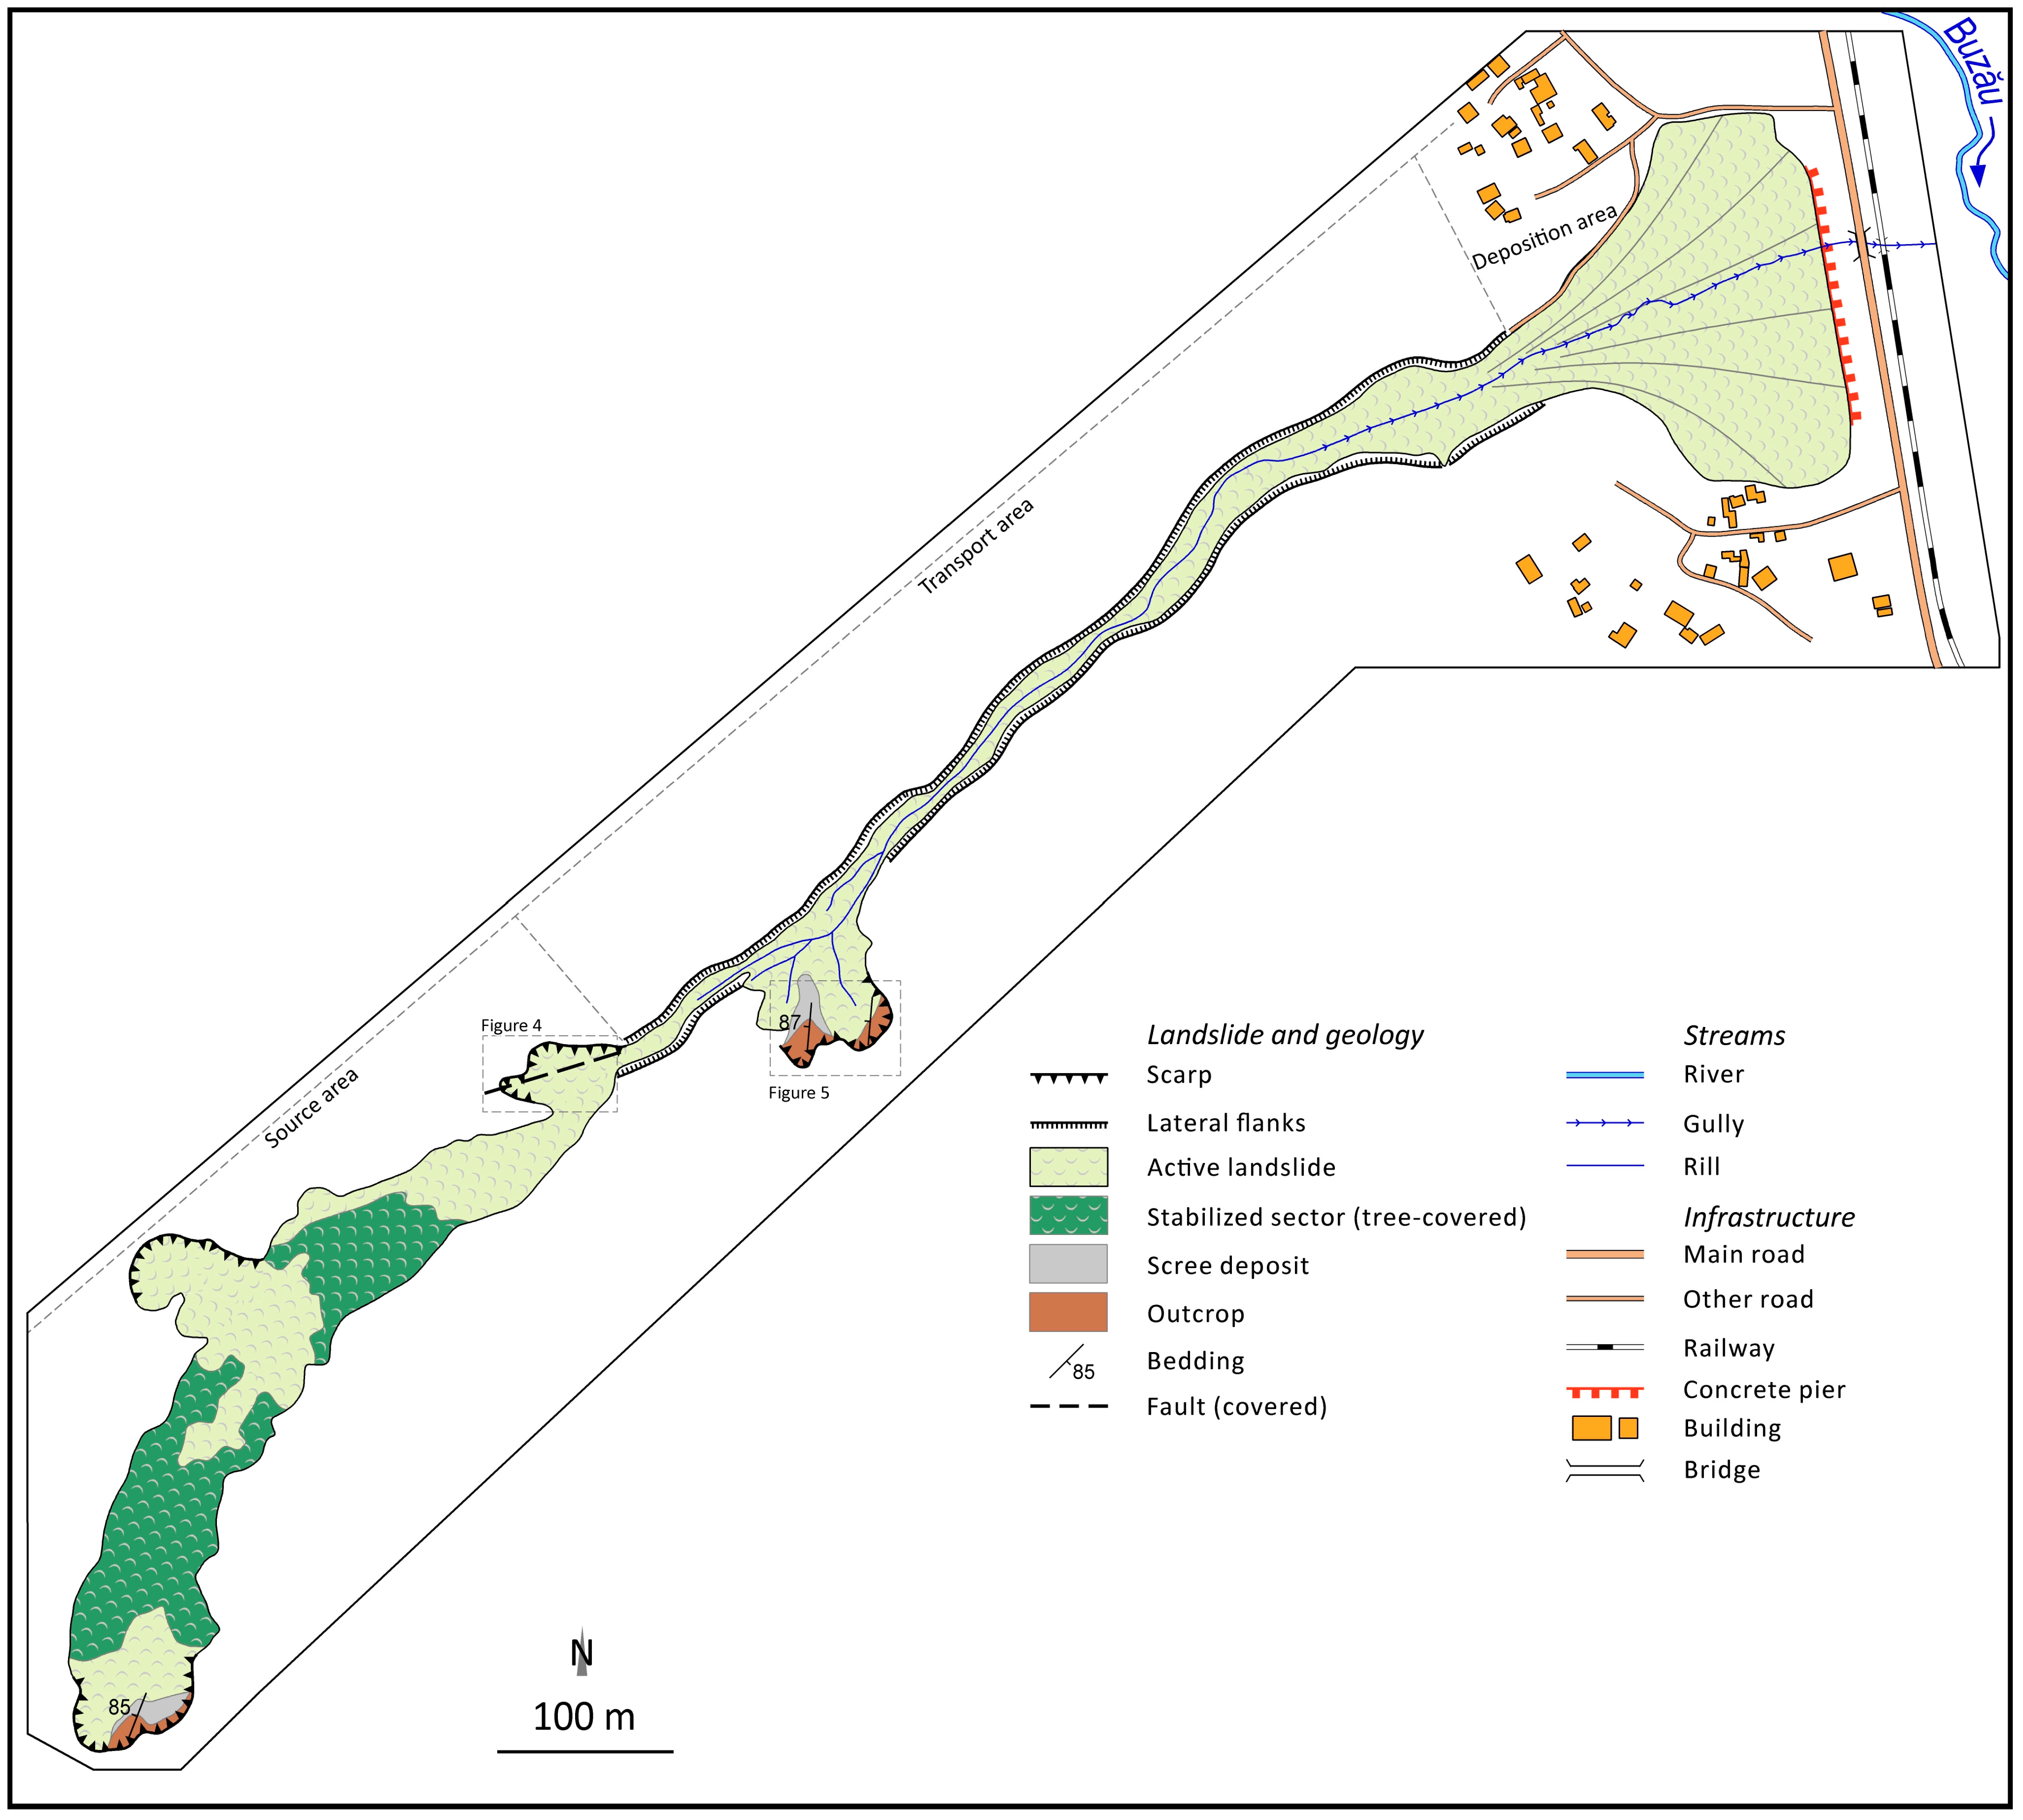
The landslide is over 1.3 km long, oriented from SW to NE (Figure 3), between the elevation of 640 m (main scarp) and 320 m (at the toe), and the length ratio (H/L) is 0.25. A few previous works describe the landslide as a mud torrent (torent noroios in Romanian) [33,34,35,36], mudflow [37], or torrent [38]. Field surveys show that the landslide is actually an earthflow, but the process can alternate with short waves of mudflows.
Tectonically, the landslide is located within the Tarcău Nappe, in a sub-tectonic unit called Mocearu Lake Digitation [32]. The landslide direction is SW to NE and follows the geological structure, being channelised along a thrust fault, respectively, at the contact of two different geological formations. The right slope consists of flysch (shale and sandstone) part of the Colți Formation (Ypresian–Priabonian), which may include some marls with Globigerina. The left slope consists of flysch but with higher content of clay and marl, which sometimes comprise tuff, and is part of the Podu Morii Formation (Oligocene–Miocene) [32].
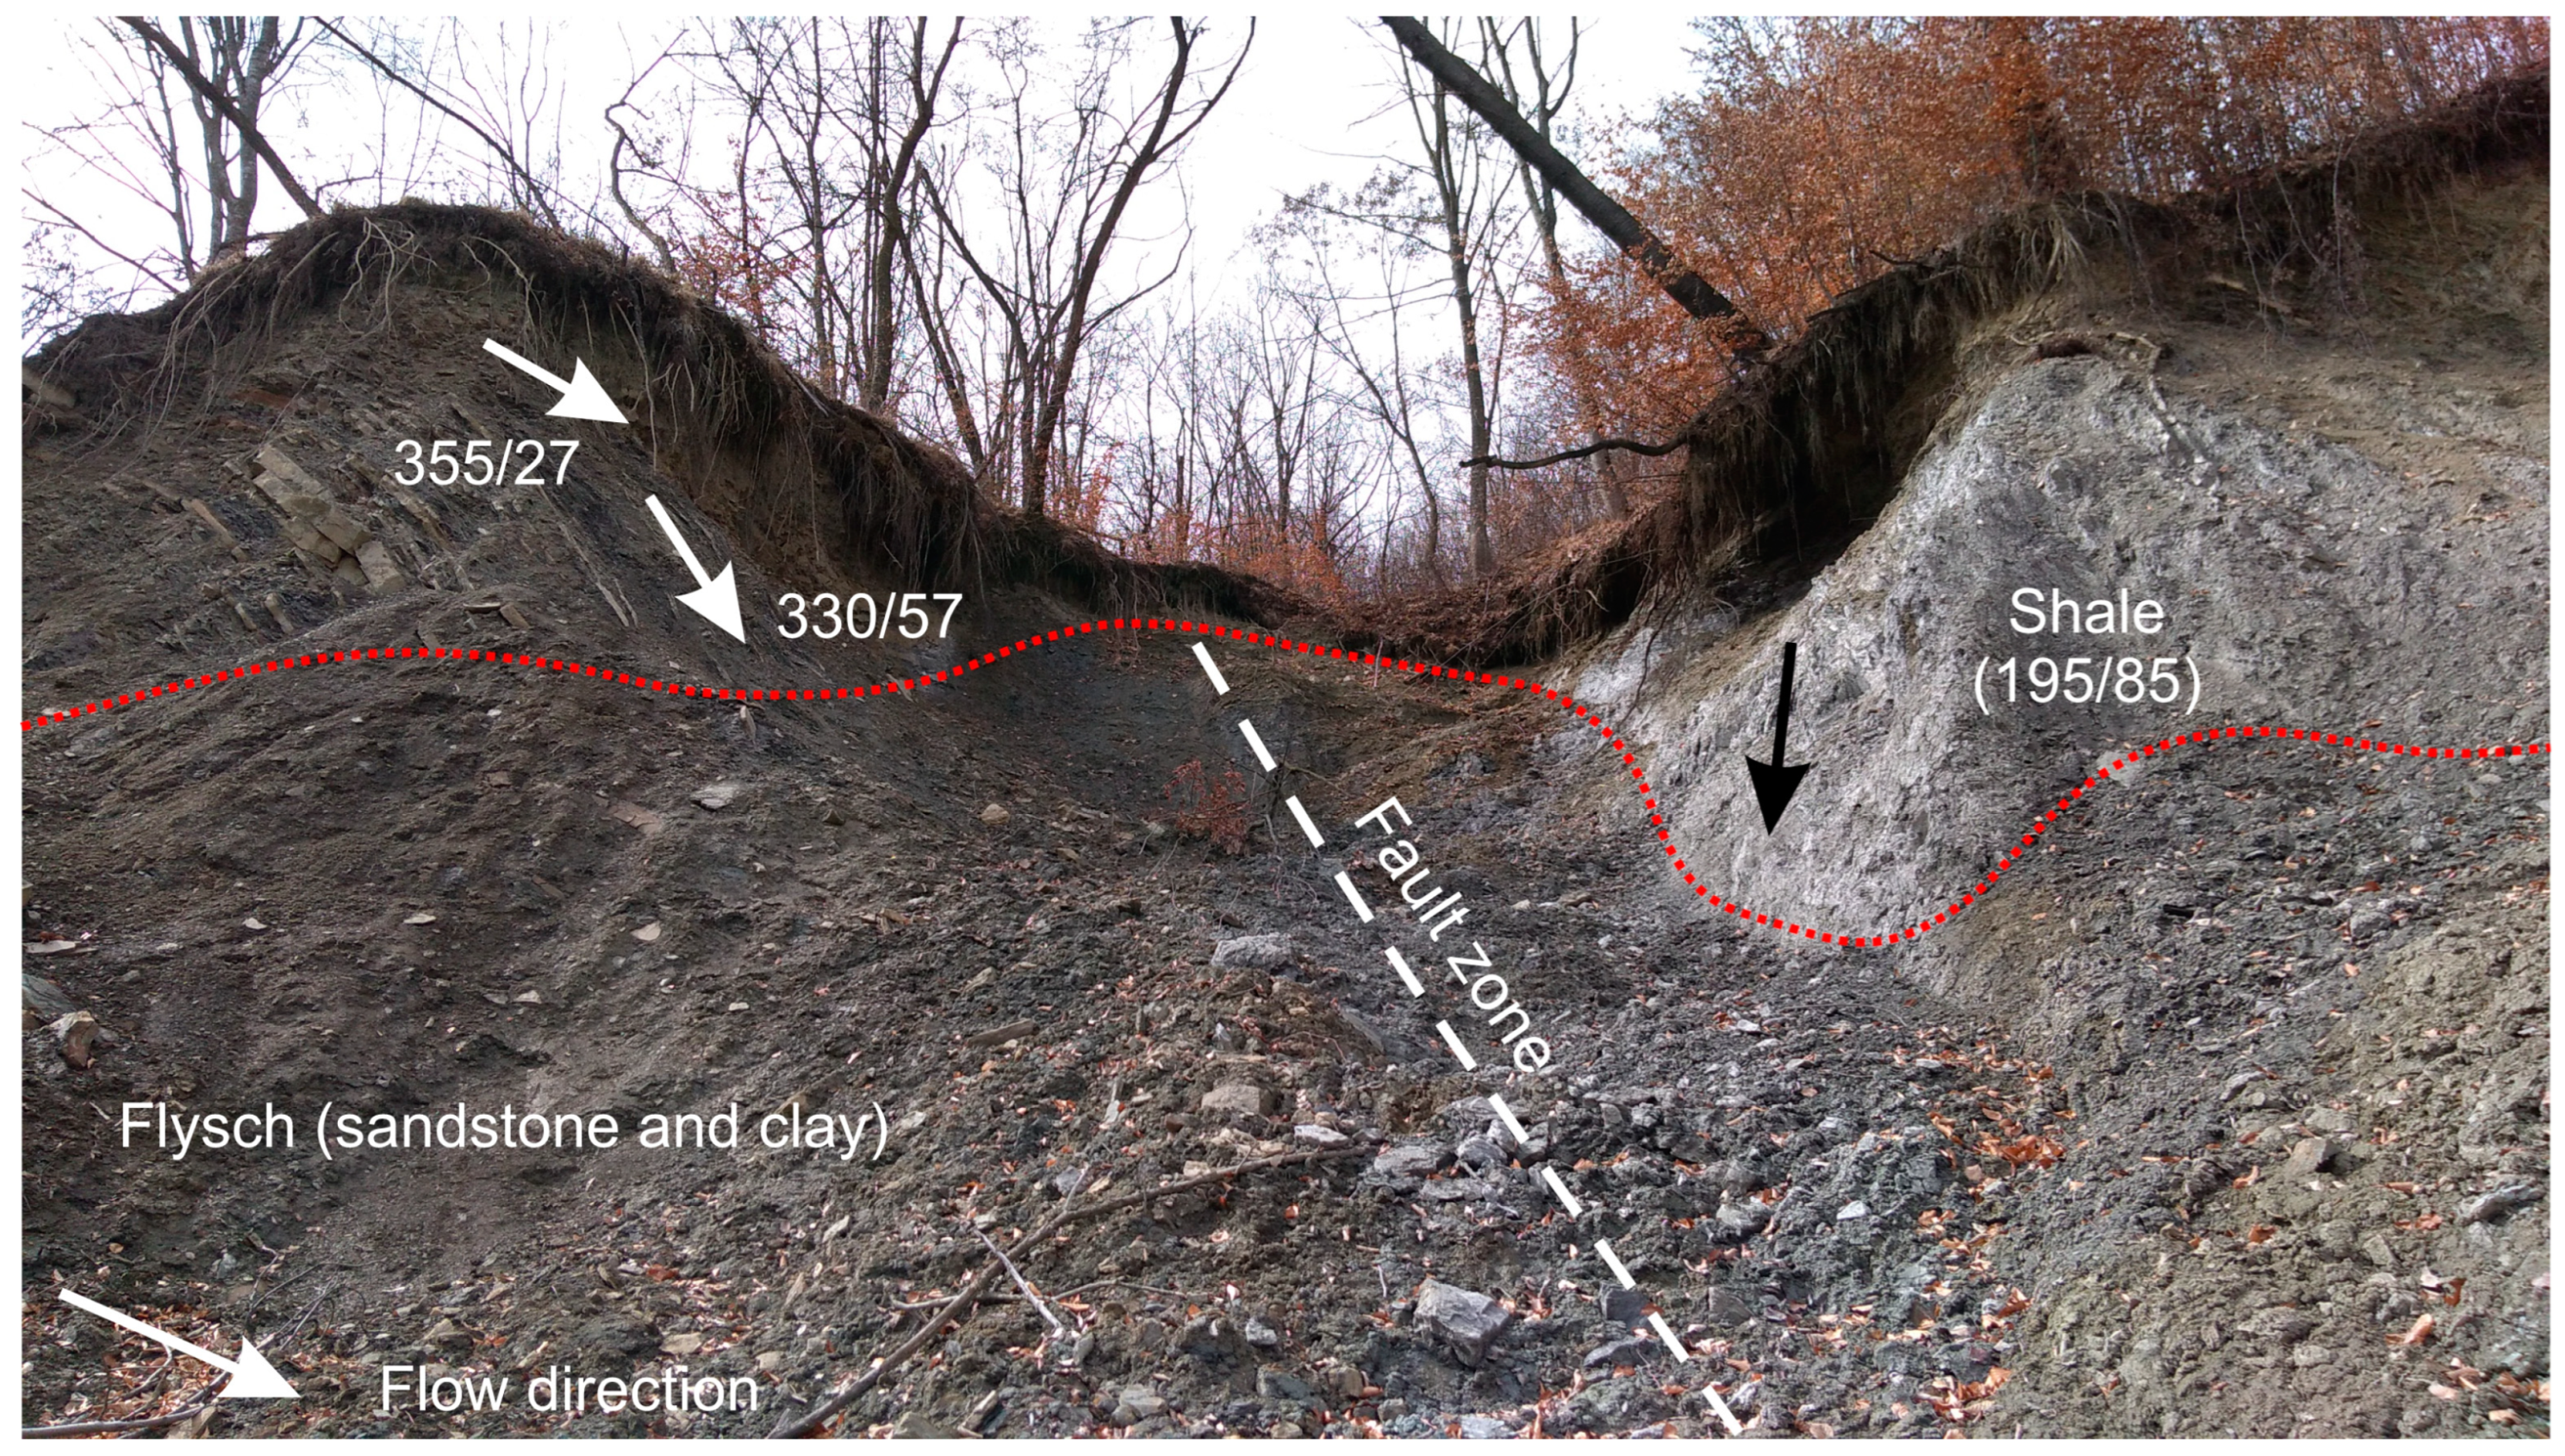
The outcrops from the landslide flanks are sparse but show that the Colți Formation is much more cohesive (predominantly sandstone), while, the other is much more pelitic. During the field survey in 2019, in an outcrop, the contact between the two formations was observed where the bedding dips in opposite directions. While the sandstone-shale flysch (Colți Formation) dips to the north with values of 27–57°, the shale clays dip to the south at 85° and therefore have an almost vertical position (Figure 4). The latter’s position is overturned, as sedimentological evidence suggests. However, during a field survey in 2020, the outcrop was no longer visible due to a small lateral landslide that had covered it.
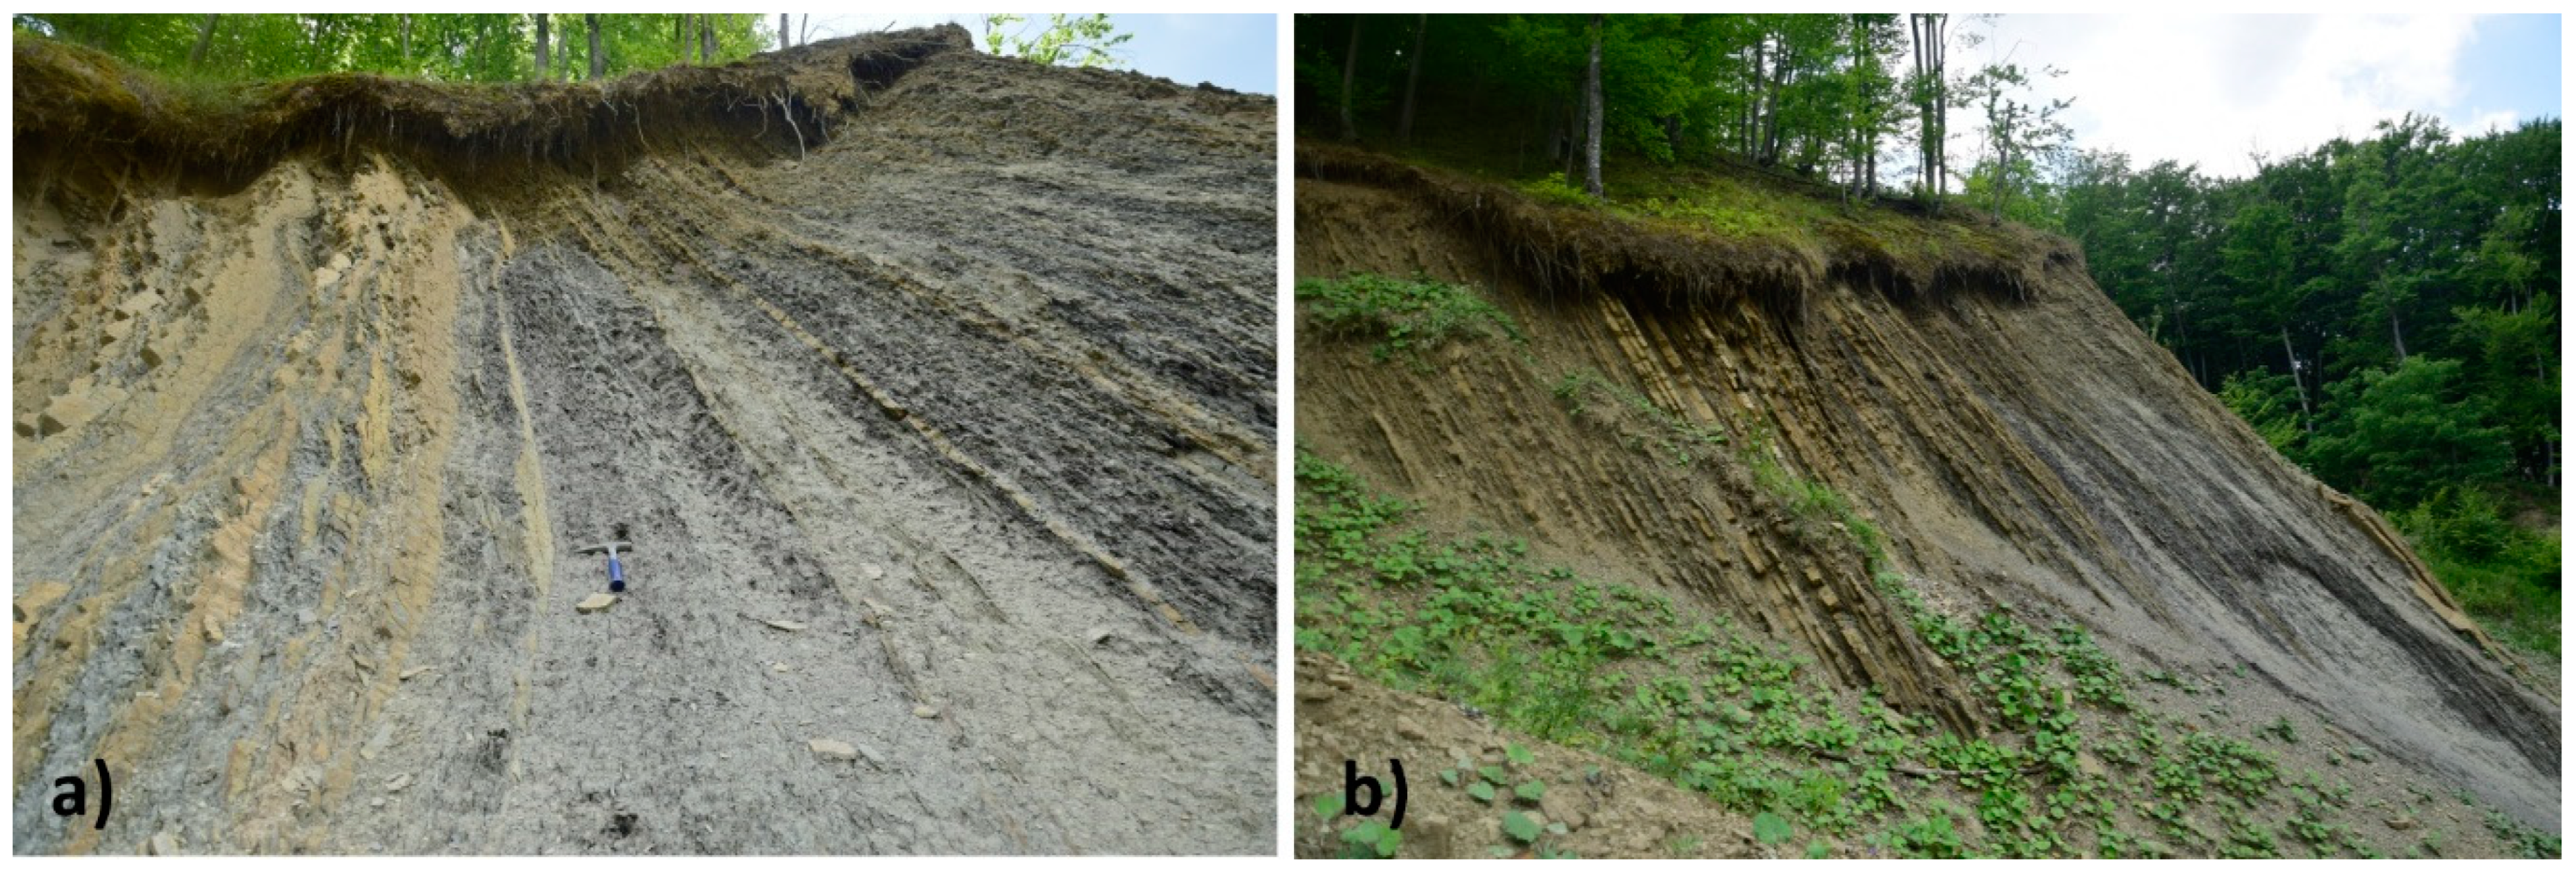
The Chirlești earthflow’s main source area is about 500 m in length and 50 to 80 m wide. Most of the material is supplied by the regressive erosion of the headscarp. Other scarps are located along the earthflow, with two on the left side (Figure 4) and one on the right side (Figure 5). The displacement rate here is very low, so certain areas have become more stable and partially forested.
The transport channel is 650 m in length, and the width varies between 7 to 20 m. The channel depth is about 3 to 5 m; however, it is almost filled with material during reactivations. The proof is the presence of a few lateral slickensides, which were about 3 m high above the surface of the sliding material during the field survey. A lateral source area with sandstone intercalation with thin clay layers feeds the main channel with additional material (Figure 3).
The deposition area has the typical shape of a cone, 180–200 m long and 200–220 m wide. At the contact of the mountain slope with the Buzău fluvial terraces, the channelised material tends to spread. Multiple earthflow events made the accumulation zone to rise and move toward the national road. In order to stop the landslide from flowing over the road, concrete pillars were built to retain the material, and the water is discharged through several drains that pass under the road and railway and go into the Buzău River.
The material involved in the flow consists of viscoplastic material. Most of it comes from clays and marl, but fragments of cohesive rocks such as sandstone, limestone, and menilite are also incorporated in the landslide body.
The Chirlești Earthflow was previously described in the literature shortly after it was triggered and then during its reactivation in December 1952 and February 1953, respectively, when ten houses were destroyed and orchards were affected [33,39]. However, Ref. [39] mentions that before the landslide occurred, an accumulation cone from an old landslide could be observed. The 1952 flow transported the material and deposited it on the left side of the cone, which it raised considerably, and the 1953 flow deposited it to the right side of the cone. A period of reactivation of the flow, but with a smaller magnitude, occurred later in the winter of 1953–1954 [39]. Subsequent reactivations were recorded in 1969, 1975, 1977, 1990, 1996, 1997, 1998, 1999, 2005, 2006, 2010, and 2011. More recently, in 2006, another house was destroyed [36,37,40]. Also, an accentuated dynamic was recorded in the period June–July 2006, when about 28,000 m3 of material was detached from the headscarp [40]. In 2010, the earthflow destroyed other two houses [37,38].

3. Data and Methods

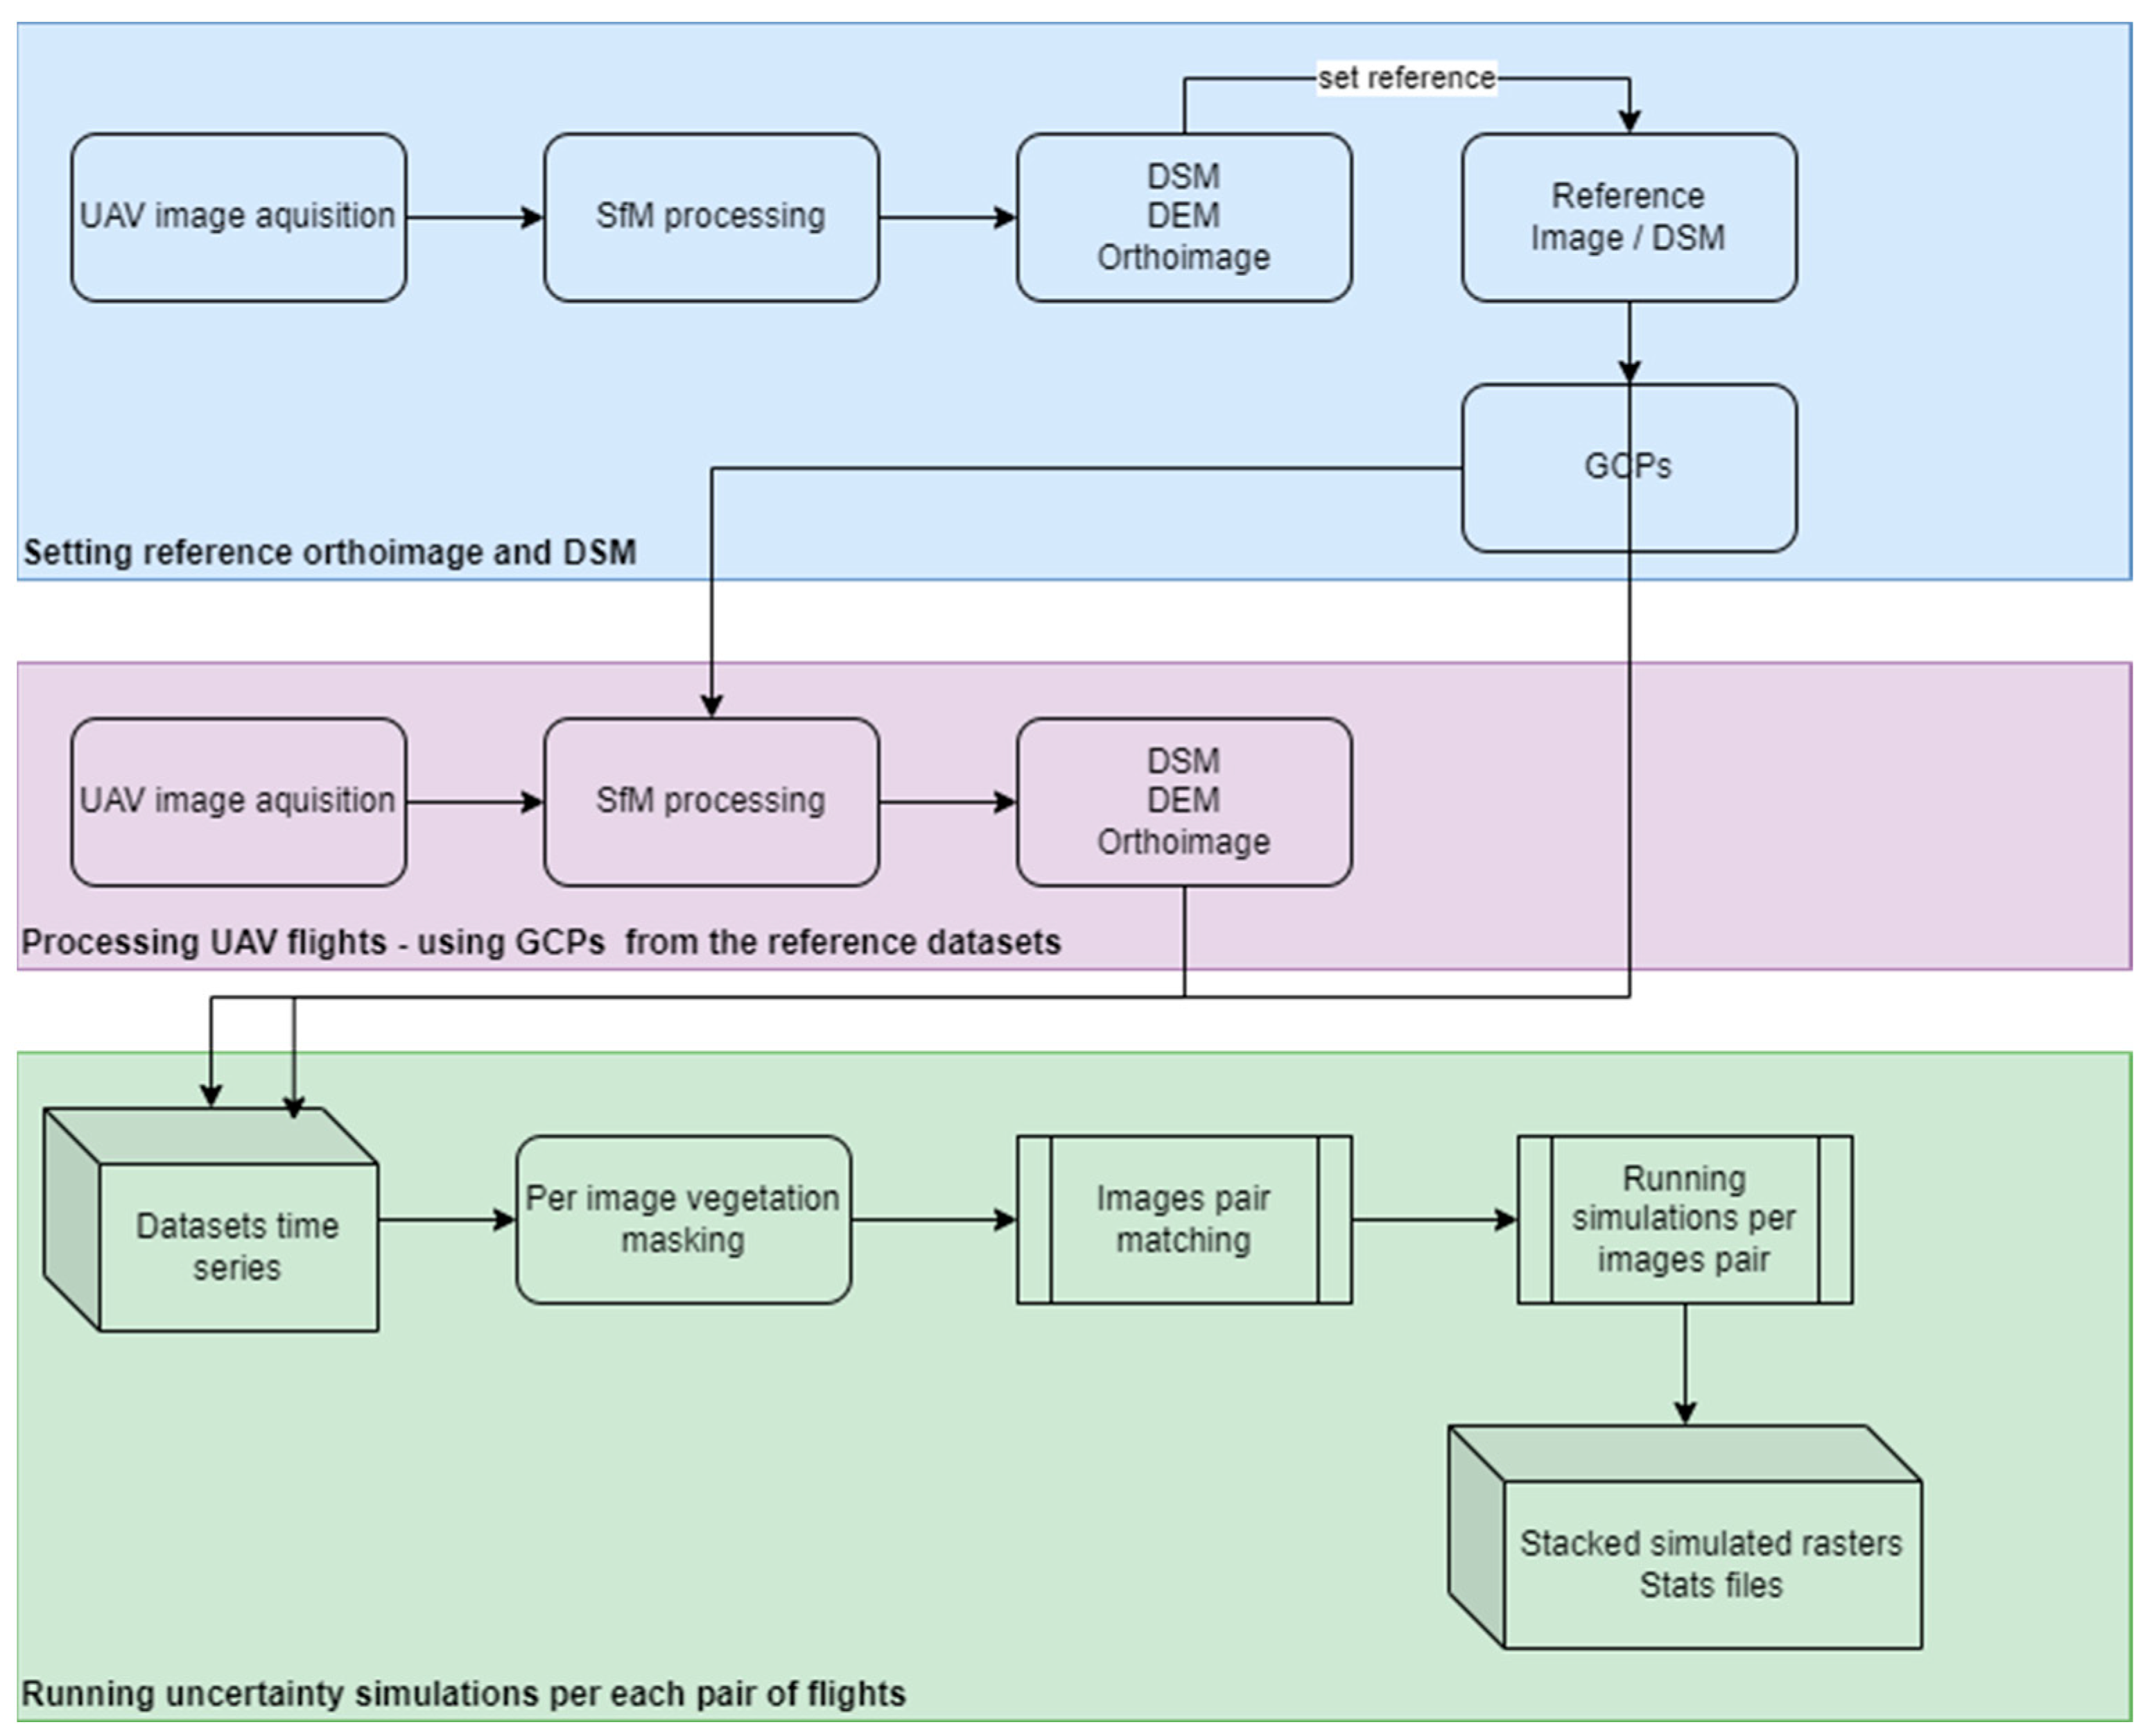
Mapping landslide kinematics gives a good insight into landslide dynamics and magnitude and is one of the first steps in landslide hazard assessment. In the current study, the methodology for mapping the spatial and temporal landslide displacement was based on aerial images collected with UAVs and the associated products obtained by processing the aerial images, as described in Figure 6. Three distinct processing chains are displayed from top to bottom: collecting and processing aerial images for the reference datasets; processing all aerial images using GCPs collected in the reference dataset; running the DEM simulations to estimate the uncertainty propagation into the landslide’s displacement analysis.
While landslide kinematics mapping is relatively straightforward when there is no vegetation, as in most cases of earthflows, in areas with a medium-to-dense vegetation cover, the landslide volume estimates are prone to high uncertainties. The task becomes more complicated when no LiDAR sensors are available. Thus, no accurate ground information can be retrieved from above when cameras from the visible spectrum are used. The main challenge arises from blocking the visible and near-infrared spectrum by vegetation. Knowing where vegetation is present and removing it is essential in mapping the landslide kinematics between sequential UAV flights.
The vegetation and other objects on the ground were mapped from the point cloud datasets obtained from the Structure from motion (SfM) process. The final DEM was obtained by interpolating only the ground point cloud data using the Natural Neighbor interpolation method. The process was performed with ArcGIS Pro (ESRI). Because of the lack of information in the near-infrared spectrum and intensity of the point cloud dataset, the removal of vegetation was not very accurate across the entire study site. To minimise the impact of the densely vegetated areas on the uncertainty assessment, all the areas with dense vegetation were masked out from the analysis. The masking of the vegetation was done by manually mapping the areas with medium-to-tall vegetation heights.

3.1. UAV Flights

Four UAV flights were flown between 4 August 2019 and 2 September 2022 (Table 1). All the flights were flown using a UAV without an RTK receiver, DJI Phantom 4, respectively. During all four flights, 1545 images were collected, spread almost equally across the flights.
The first UAV flight was performed on 4 August 2018; a DJI Phantom 4 quadcopter with a 12-MP RGB camera was used for this flight. The following flights were performed on 30 May 2019, 28 June 2020, and the last on 2 September 2022, using the same UAV used for the first flight. All the flights had been planned for a 4 cm/pixel spatial resolution across the study area. A constant height above the ground was used to achieve the same spatial resolution over the study area. Because the UAV’s speed highly influences the images’ sharpness, several tests were made with speeds between 2 and 10 m/s. The speed of 5 m/s was chosen as the best trade-off between UAV speed and the sharpness of the images. All the flights were planned and executed using the Universal Ground Control System software [41].
For an accurate analysis of the landslide displacement, the overlap between all the flights must be as precise as possible, with RMS (root-mean-squared error) below one pixel (for whatever the pixel size and measurement unit). In the current case study, to achieve this requirement, and because the flights were flown with a non-RTK UAV, it was compulsory to manually collect GCPs (ground control points) and readjust the aerial images using these GCPs. Of all the flights, the first flight from 4 August 2018 was chosen to be the reference base for collecting GCPs, and all the other flights were reprocessed using GCPs collected on the orthoimage and the digital surface model (DSM) obtained from this flight. Accuracies below the size of a few pixels have been achieved for all the flights (Table 2). The locations of the GCPs were carefully selected to be in areas with no displacement across all the fights. These areas are located outside of the earthflow boundary, in the lower and upper parts. In the lower part, the GCPs were placed along the national road and on the side of the main accumulation area. In the upper part, the GCPs were placed on stable rocks, visible across all the flights. Two GCPs were placed on each side of the transport area on stable rocks. Having the GCPs distributed across the entire earthflow ensured an acceptable overall accuracy (Table 2).
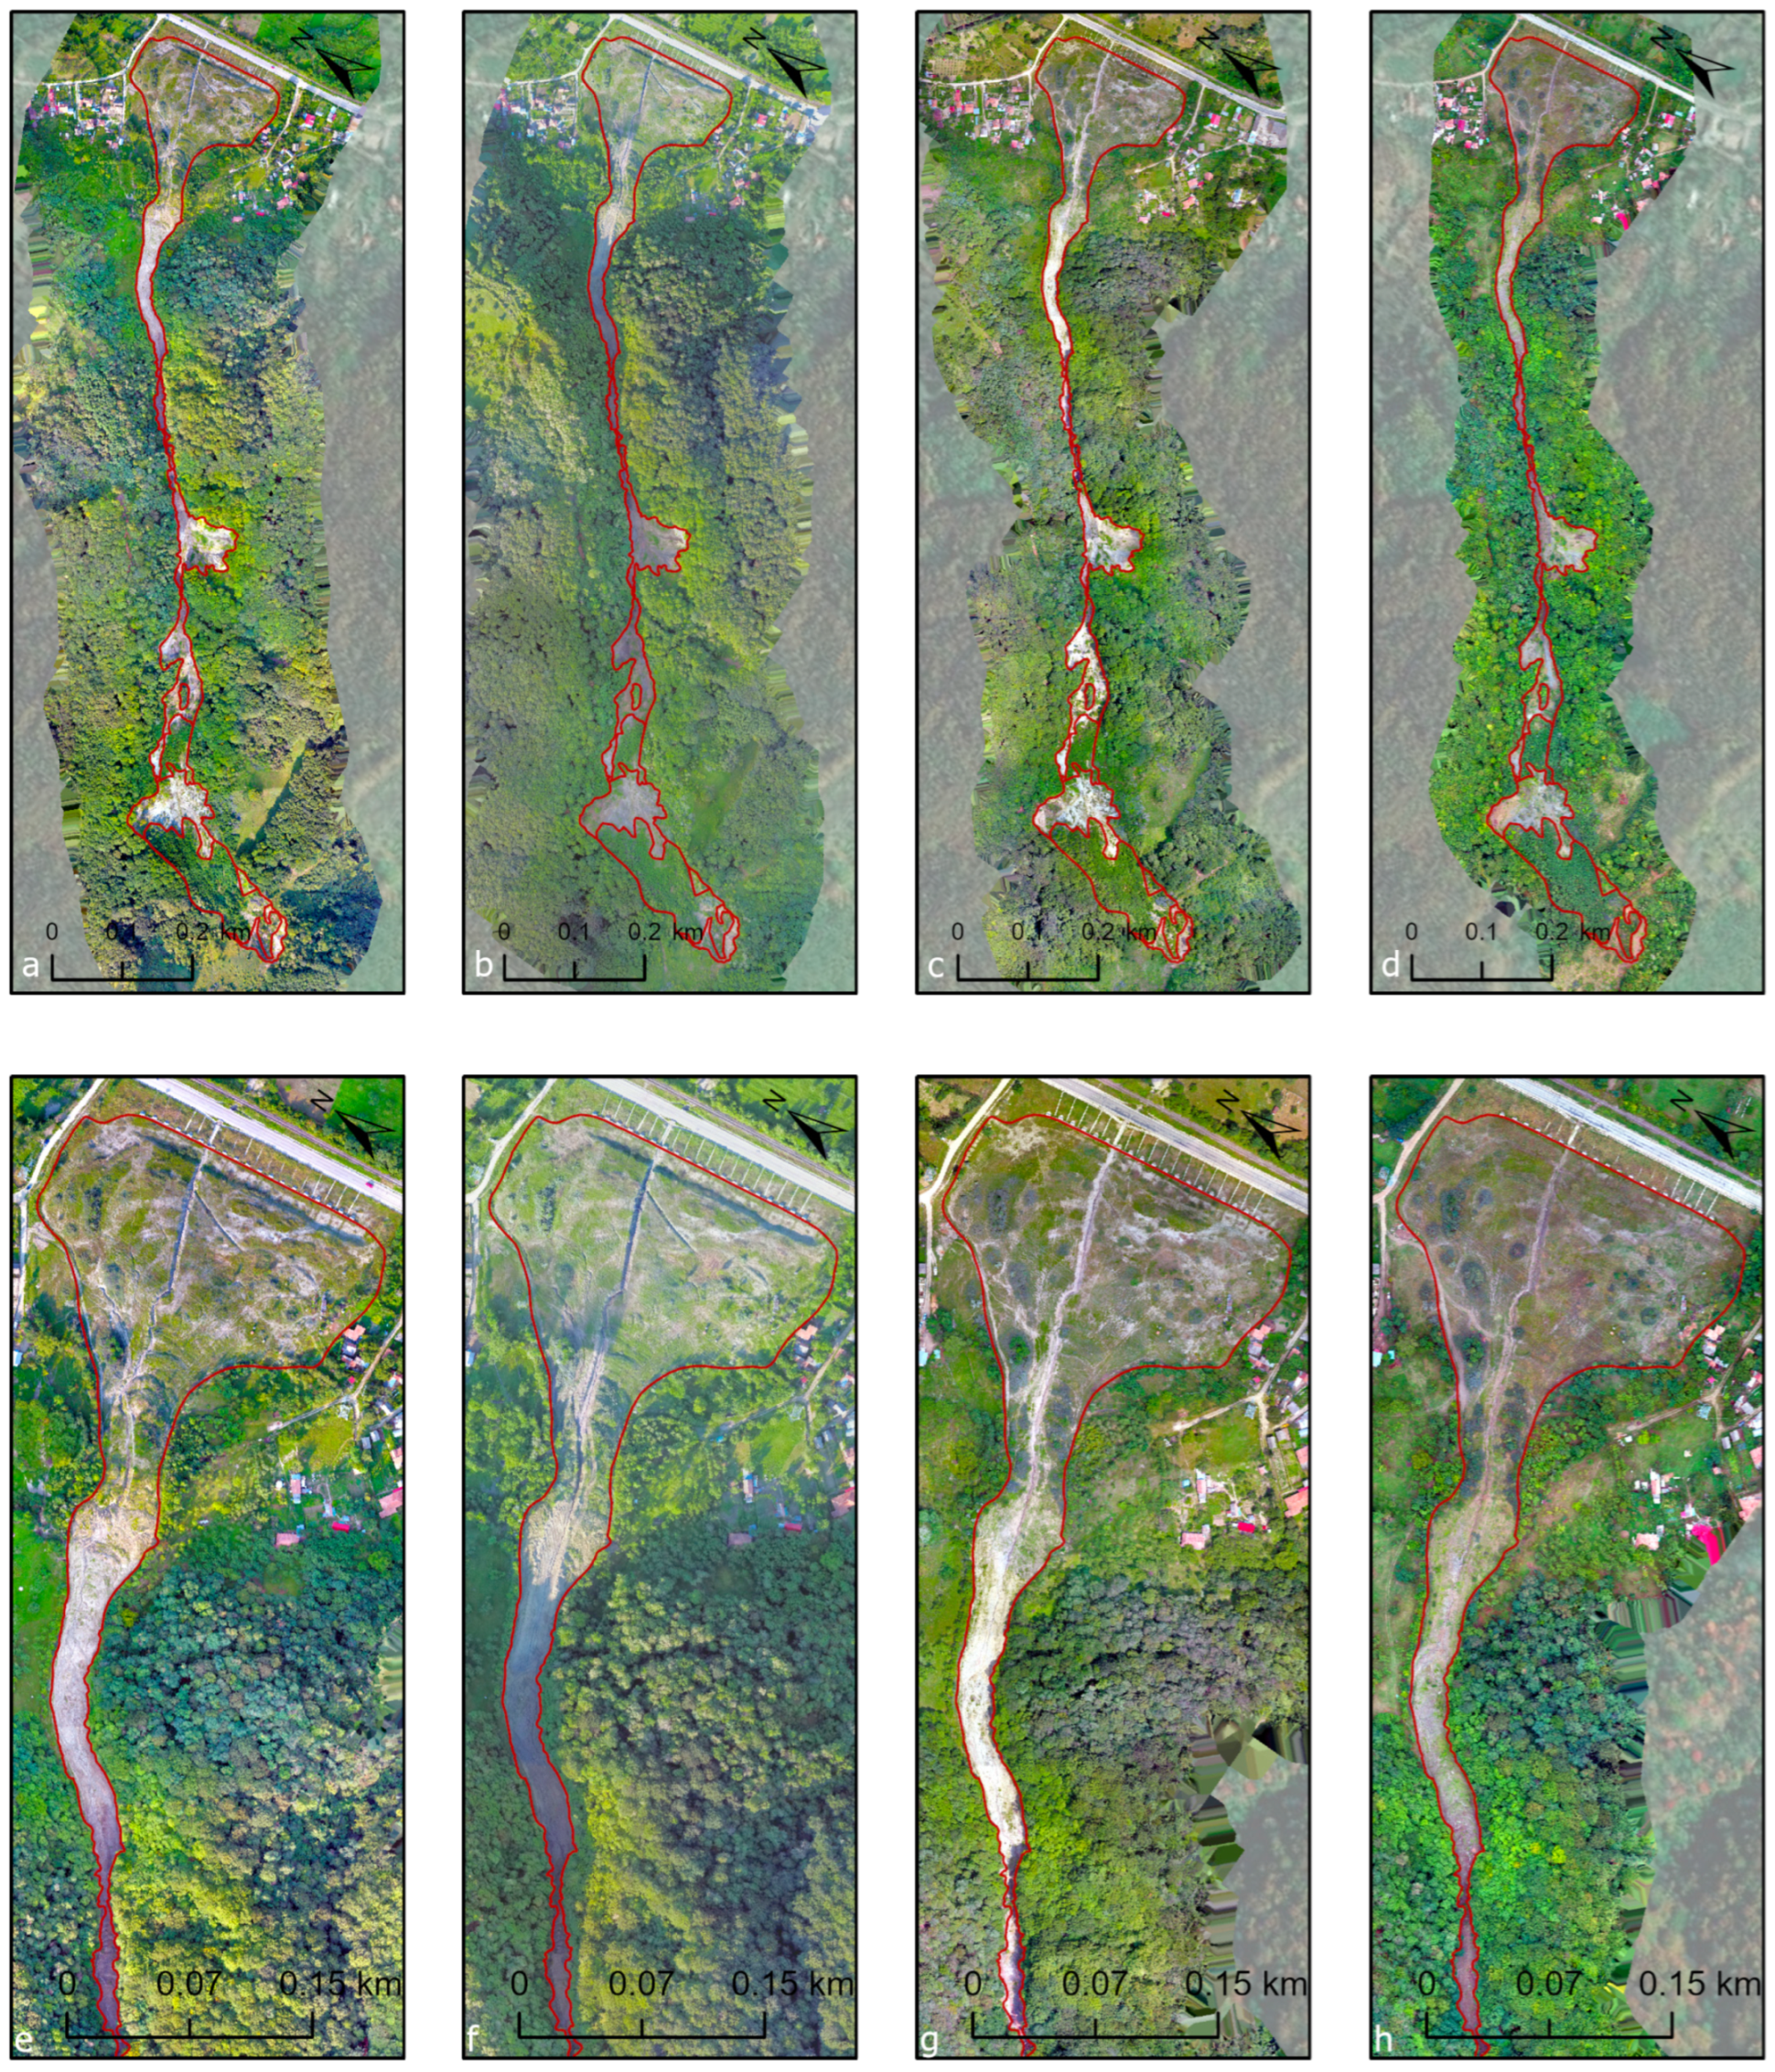
For each flight, an orthoimage, digital surface model, and digital elevation model were obtained (Figure 7). The digital elevation model was obtained by interpolating the ground point cloud dataset generated by the SfM process. The DSM and DEM were masked out using a vegetation layer manually digitised on all the images. Only the vegetation with medium-to-tall heights were digitised. The vegetation with low heights were considered as being accurately removed by the classification process of the point cloud data.

3.2. Landslide Kinematics Mapping

In general, the volume of a pixel (voxel) is estimated by multiplying the area by its height. The current case study evaluated the earth moved by the earthflow between two stages of the landslide dynamics, as recorded by the UAV flights. The landslide displacement has been assessed by multiplying the difference in height between two DEMs (MDoD) with the area of one pixel, according to Equation (1).
D i s p l a c e d   m a t e r i a l t 1 t 0 = M D o D     C e l l   s i z e 2
where MDoD is the DEM of Difference between two dates, t1 is the latest date, and t0 is the earliest date.
The changes in landslide surface and displaced material were assessed by pairing two consecutive flights. Thus, three landslide displacement changes were obtained. The maximum differences were evaluated by pairing the first and last flights. The recorded values are prone to high uncertainties in the areas with medium vegetation cover, as in the middle and upper parts of the Chirlești earthflow.
Because the earthflow boundaries were changed across the four years of monitoring, an assessment of changes within each flight’s overlapping and distinct areas was necessary. The overlapping area received a unique code, and another unique code was allocated for each of the distinct areas corresponding to each earthflow boundary from a certain date. Thus, three distinct codes were allocated and used for assessing landslide volume changes.
Calculating the changes within the overlapping areas and each flight’s unique area meant estimating to what degree the flow outside of the boundary influences the total displaced material estimation.

3.3. Uncertainty Propagation Modelling

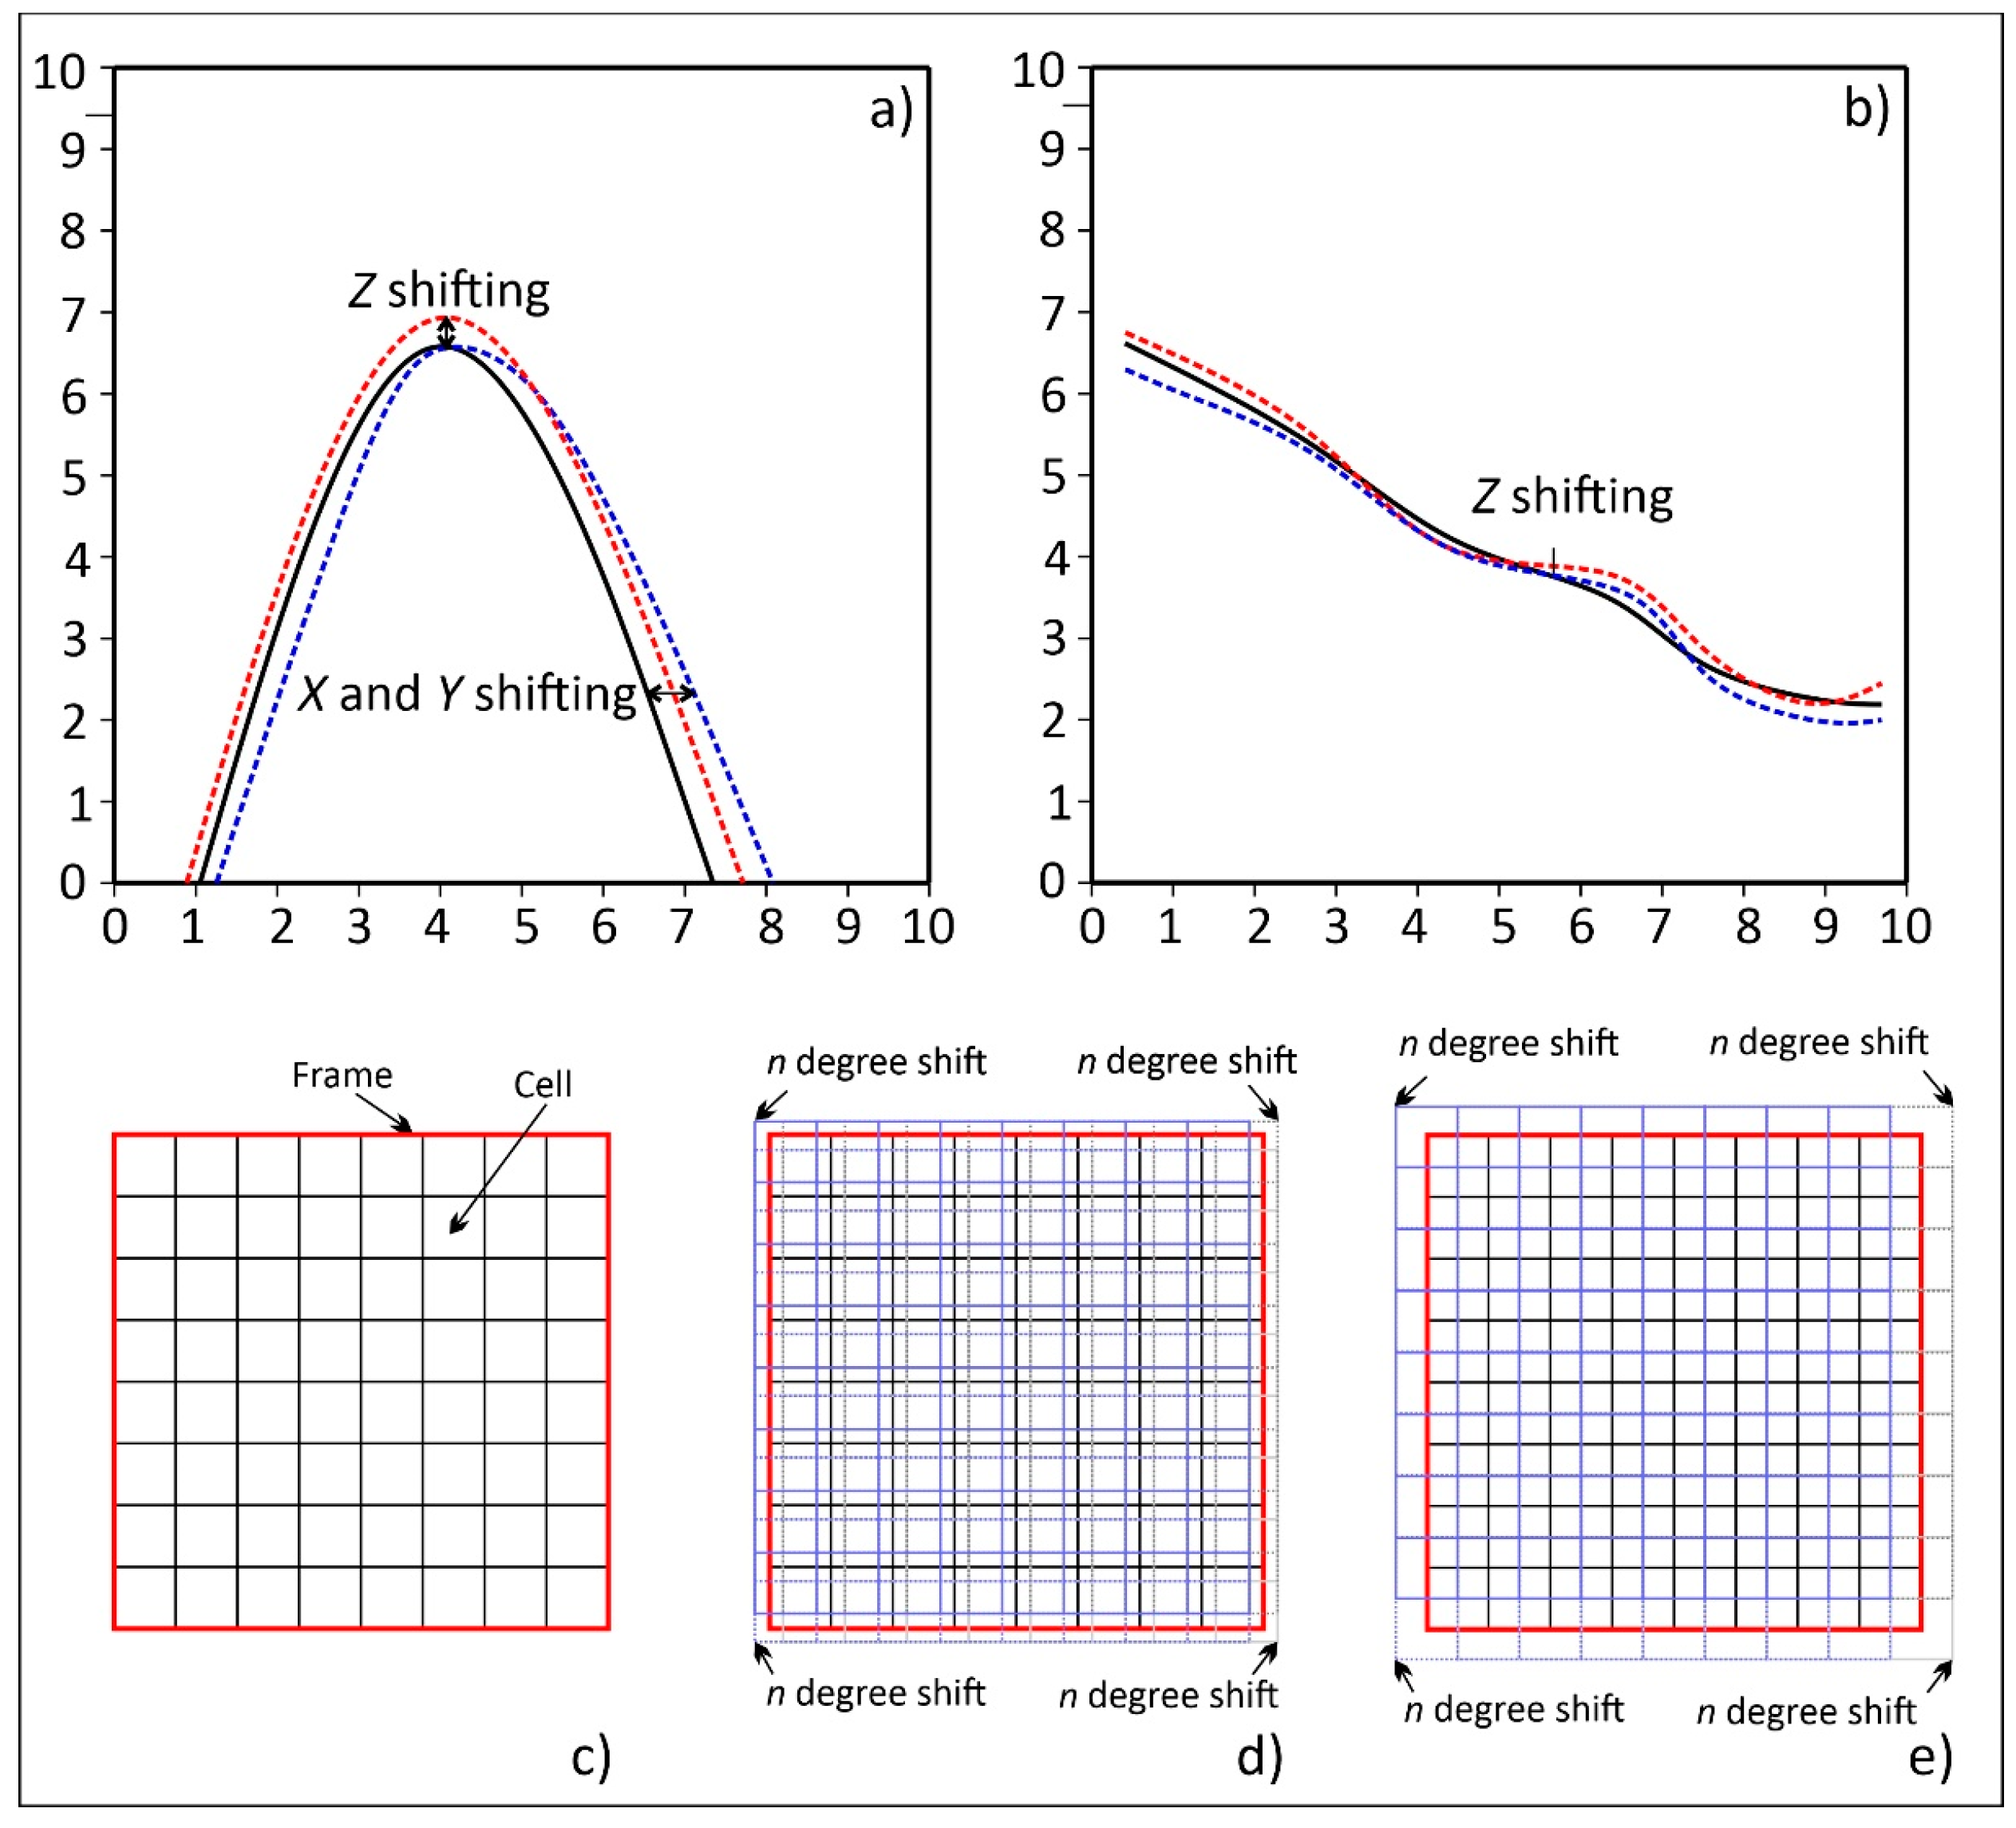
Horizontal and vertical accuracies are important in the estimations of landslide kinematics across space and time. The X and Y shifts automatically lead to errors in the Z-axis that further lead to uncertain estimations of the displaced earth (Figure 8). A conceptual uncertainty model was developed to account for all these scenarios with possible misalignments between DEMs. The model uses the RMS values of all three axes (X, Y, and Z) returned by the orthorectification process and applies random shifts on the X and Y axes to simulate various accuracy values for each DEM. These 360-degree random shifts automatically induce changes on the Z-axis.
The baseline for each simulation was considered the DEM obtained per each flight. The simulations were performed in respect of this reference. For each pair of consecutive flights, the displacement was mapped for the reference dataset and at the same time for all the pairs formed during the simulation process. Each simulated displacement was compared and analysed with the baseline, produced from the original datasets. By simulating random RMS values on all three axes (X, Y, and Z), it was possible to generate new DEMs and assess how much uncertainty these RMS values, returned by the orthorectification process, induce in the landslide kinematics assessment. Further, besides the changes in elevation induced by the horizontal shifts, the RMS values for the Z-axis are used to add shifts on a vertical scale leading to new changes in height. Thus, it was possible to generate random DEMs with different shifts [42], starting from low RMS values associated with highly accurate data and ending in high RMS values (with wider simulation intervals) associated with the low-accuracy data. The process was broken down into two stages: (i) the first stage consisted of building an array of closed intervals with possible RMS values; (ii) the second stage consisted of producing random RMS values for each closed interval and producing simulated DEMs by applying shifts on X, Y, and Z axes. The second stage is repeated several times, and for each DEM pair, the material displacement between two successive flight pairs is calculated. For each closed interval, the mean, minimum, maximum, and standard deviation values per pixel from all the simulations are calculated and stored as separate raster files.
A sensitivity analysis per closed interval was performed by comparing the mean estimates per pixel and total area with those obtained from the reference dataset (the initial assessment obtained with the original dataset). The difference between the reference dataset and the simulated ones was used to estimate the degree of uncertainty induced by each increase in the RMS values.
Because the uncertainty propagation was based on simulations of the RMS values that led to misalignments at the pixel level, a correlation coefficient was used to estimate the degree of misalignment between each pair of flights. This approach [26,43,44] allowed having an objective estimate of how RMS values influence the true earth material displaced during a period.

4. Results

Over a period of 4 years, four flights were flown over the Chirlești earthflow. The flights (Table 1) were distributed from spring to autumn, with a different season for each flight. The same UAV, DJI Phantom 4 non-RTK, was used for all the flights. Similarly, all the flights were flown at the same height above the ground, ensuring the same spatial resolution of the final products. Each flight was processed using Drone2Map software from ESRI, and for each flight, the following products were obtained: point cloud dataset, digital surface model, digital elevation model, and orthoimage. The maximum RMS values recorded on the control points were 0.33 m on X and Y and 0.56 m on Z, and they correspond to the last flight from 2022.
From 2018 to 2022, the Chirlești earthflow has constantly reactivated, as seen in Figure 7. Due to the regular maintenance of the transport channel, located at the contact with the accumulation area (visible in the middle part), a percentage of the transported material was moved out of the earthflow boundary. This percentage cannot be precisely estimated because maintenance works permanently removed the transported material.

4.1. Earthflow Kinematics Uncertainty Assessment

A Python script was developed to optimise the process for DEM simulations, volume calculation, and uncertainty propagation. The script implemented the workflow for assessing the landslide kinematics with shifts on the X, Y, and Z axes using the multiprocessing module from Python programming language. This module offers the necessary classes to run the entire workflow in parallel isolated processes [45] and significantly reduce the processing time.

4.1.1. DEM Simulations

For a comprehensive understanding of the impact of the RMS on the X, Y, and Z axes on the earth displacement estimations, a number of 719 scenarios were developed and implemented. These scenarios were generated for batches of RMS values between 0.05 and 9.95 m on all three axes, having simulation steps increasing progressively by a factor of 0.05. The number of scenarios per each simulation step is presented in Table 3.
The baseline for each simulation was the DEM obtained by processing the aerial images for each UAV flight. For each scenario, 10 DEMs were randomly generated by applying shifts on X, Y, and Z axes following the RMS margins of the corresponding scenario. In total, a number of 27,800 tiff files were generated for all scenarios, summing to 2.42 TB of data.

4.1.2. Earthflow Kinematics Analysis

The displaced earth material was calculated for each pair of flights, having consecutive acquisition dates, and using all the simulated DEMs. Thus, a total number of 4176 GeoTIFF files were obtained corresponding to mean earth material displacements for each scenario.
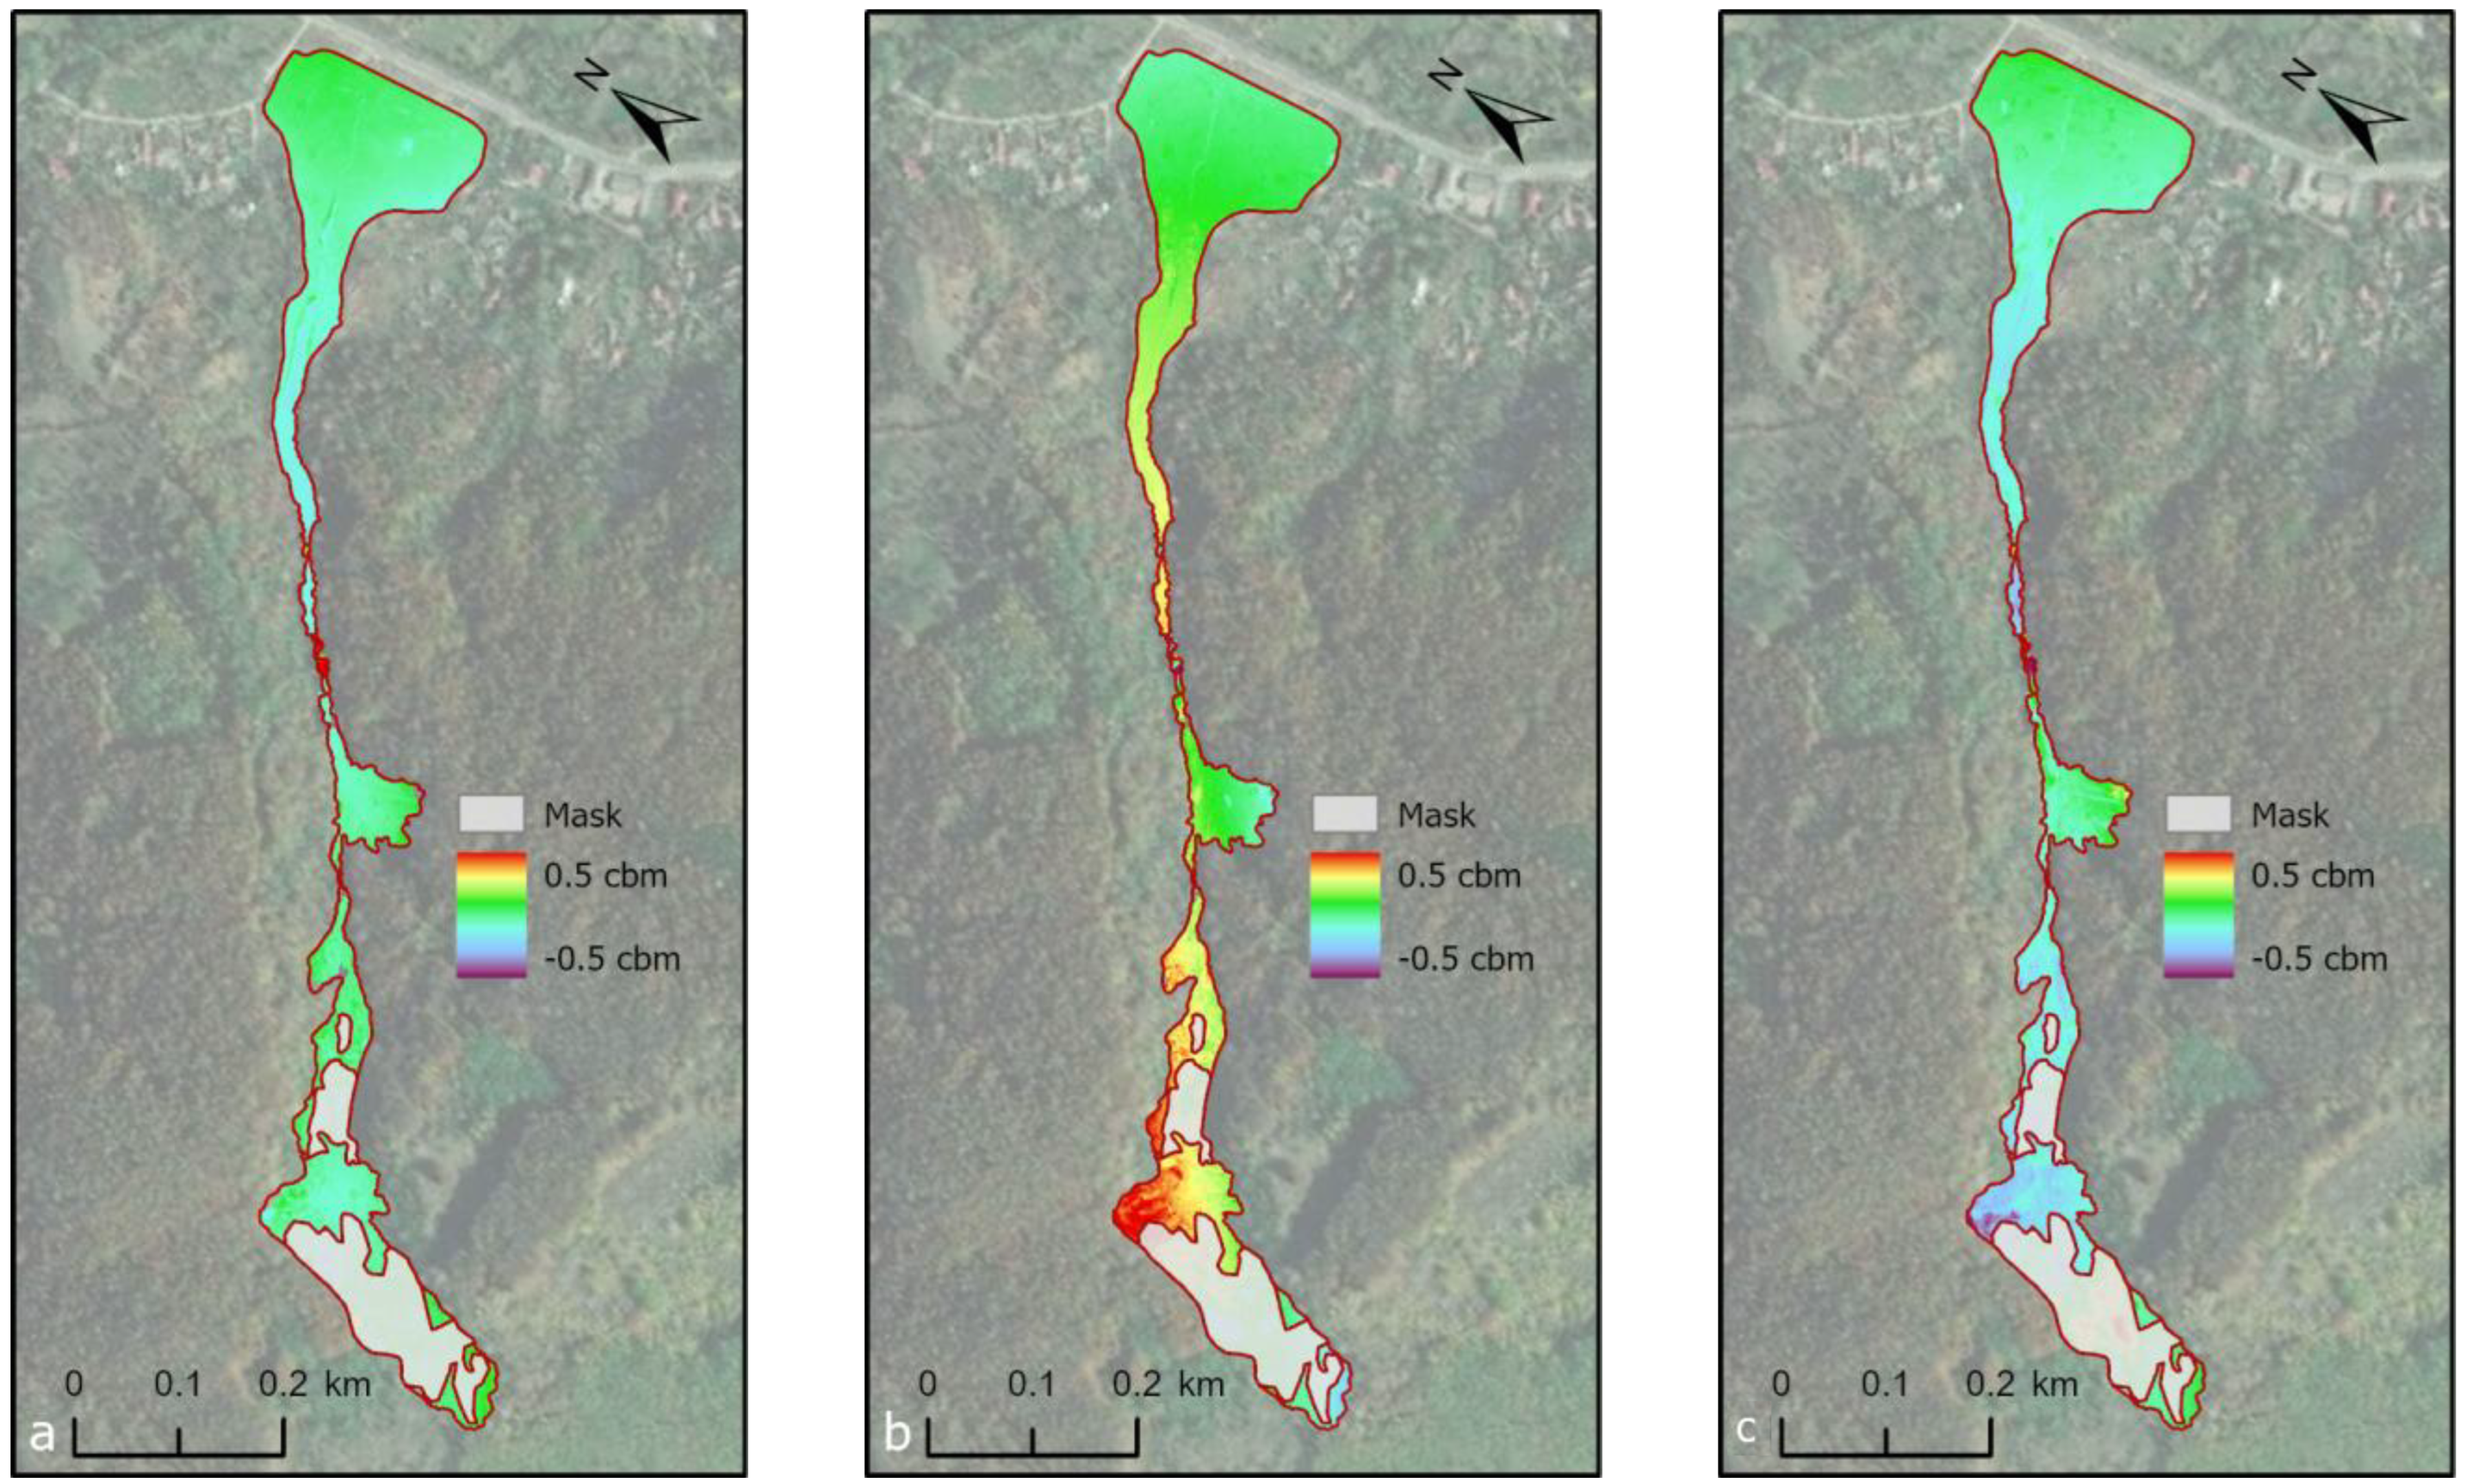
Overall, the earthflow evolved little between 2018 and 2019. The most active areas are located in the middle and lower sector, with material especially eroded from the secondary headscarp. A significant amount of eroded material can be observed in the transport area, explained by the maintenance works of the artificial transport channel located in the middle of the earthflow. The transported material was predominantly deposited in the northern extremity of the earthflow accumulation area (Figure 9).
The volume of earth displaced and transported in the period between 2018 and 2019 was approximately −5555 cbm for the common area for both years. Exclusively for 2018, the value was 0.03 cbm, and for 2019 1.95 cbm. The detailed analysis regarding the accumulated and eroded material indicated that for the year 2018, there was an increase in the accumulated material with a value of 0.036 cbm. For 2019, the accumulated material was 70 cbm and the displaced −71 cbm. For the common area of the limits from 2018 and 2019, the accumulated material was 6392 cbm, and the displaced material was −11,947 cbm.
Between 2019 and 2020, there was an intense accumulation of material eroded from the secondary headscarps and deposited in the transport area on both sides of the artificial channel. A smaller amount of eroded earth was transported and deposited in the accumulation area. The predominant direction of deposition remained similar to the evolution of the period between 2019 and 2018. In the upper part, the high values of accumulated earth material are explained by vegetation development. Therefore, those values are uncertain, not being considered as weathered and accumulated material in the flow area. However, a deep erosion can be observed on a large surface in the main headscarp area, which retreated by approximately 2–3 m (Figure 7).
The volume of earth displaced and transported in the period between 2019 and 2020 was approximately 56,717 cbm for the common area for both years. Exclusively for 2019, the value was 107 cbm, and for 2020 606 cbm. The detailed analysis regarding the accumulated and deployed material indicated that for the year 2019, there was a decrease in the accumulated material with a value of −12.75 cbm and an accumulation of 120 cbm. For 2020, the accumulated material was 664 cbm and the displaced −57.86 cbm. For the common area of the limits from 2019 and 2020, the accumulated material was 60,579 cbm, and the displaced material was −3862 cbm.
The period between 2020 and 2022 is the most active, with changes in earthflow material located in the entire study area. The pronounced erosion observed in the upper part of the earthflow’s middle part is uncertain because of dense vegetation cover and is not considered, similar to the previous situations. It can be seen how the main and secondary headscarps are very active, with retreats of several meters. An extremely active area is the transport area in the central and lower part of the earthflow, where an important amount of material was transported along the artificial drainage channel. It is estimated that the transported material was very fluid (mudflow), and the velocity was high, so there are no significant changes in the accumulation area. A good part of the transported material was deposited outside the earthflow toe, beyond the national road (Figure 9), through the culvert.
The volume of earth displaced and transported in the period between 2020 and 2022 (Figure 9) was approximately −30,504 cbm for the common area for both years. Exclusively for the year 2020, the value was 79 cbm, and for the year 2022 1200 cbm. The detailed analysis regarding the accumulated and displaced material indicated that for the year 2020, there was a decrease in the accumulated material with a value of −326.68 cbm and an accumulation of 405.73 cbm. For the year 2022, the accumulated material was 171.35 cbm, and the displaced −1371.71 cbm. For the common area of the limits from 2020 and 2022, the accumulated material was 12,347.14 cbm, and the displaced material was −42,851.5 cbm.
From the point of view of the simulations, the recorded values per simulation step were different by a maximum of 20% compared to those obtained in the analysis without the propagation of uncertainties. These differences were positive or negative, without having a certain tendency to increase or decrease in relation to the simulation step.

4.1.3. DEMs Misalignment and Associated Uncertainty

A correlation coefficient was used to estimate the degree to which the misalignment between temporal DEMs impacts the earthflow-displaced material. The values of the correlation coefficient for the displaced material analysis for the dataset without uncertainty propagation indicated a correlation above 0.99 for each time step without noticing a significant difference between the time steps. The maximum difference recorded was 0.006 for the period between 2018 and 2019.
The correlation values decreased very little for the ranges of simulated RMS values up to 1; the differences being 0.02. As the RMS values increased, the correlation values decreased, reaching values of approximately 0.8 for a simulated RMS of 5 and 0.6 for a simulated RMS of 9.95 (Table 3).
For a step shift of 0.5 m and simulated RMS values between 0.5 and 9.5, similar correlation values to those with a step shift of 0.05 were obtained. Overall, the correlation values are slightly smaller, with a minimum correlation of 0.97 between 2018 and 2019 and a maximum of 0.99 between 2020 and 2019 (Table 3).
The step shift values of 0.9 m led to obtaining correlation values above 0.9 for simulated RMS values in the range of 0.0–0.9 and lower values, between 0.7 and 0.84 for simulated RMS values of approximately 5.4 m. For simulated RMS values of 9.5 m, correlations distributed in a range between 0.51 and 0.85 can be observed (Table 3).
The intermediate values between steps shift distributed between 0.05, 0.5, and 0.9 and their corresponding RMS values, not presented in Table 3, are relatively evenly distributed between the values presented in Table 3, without extremes being recorded.
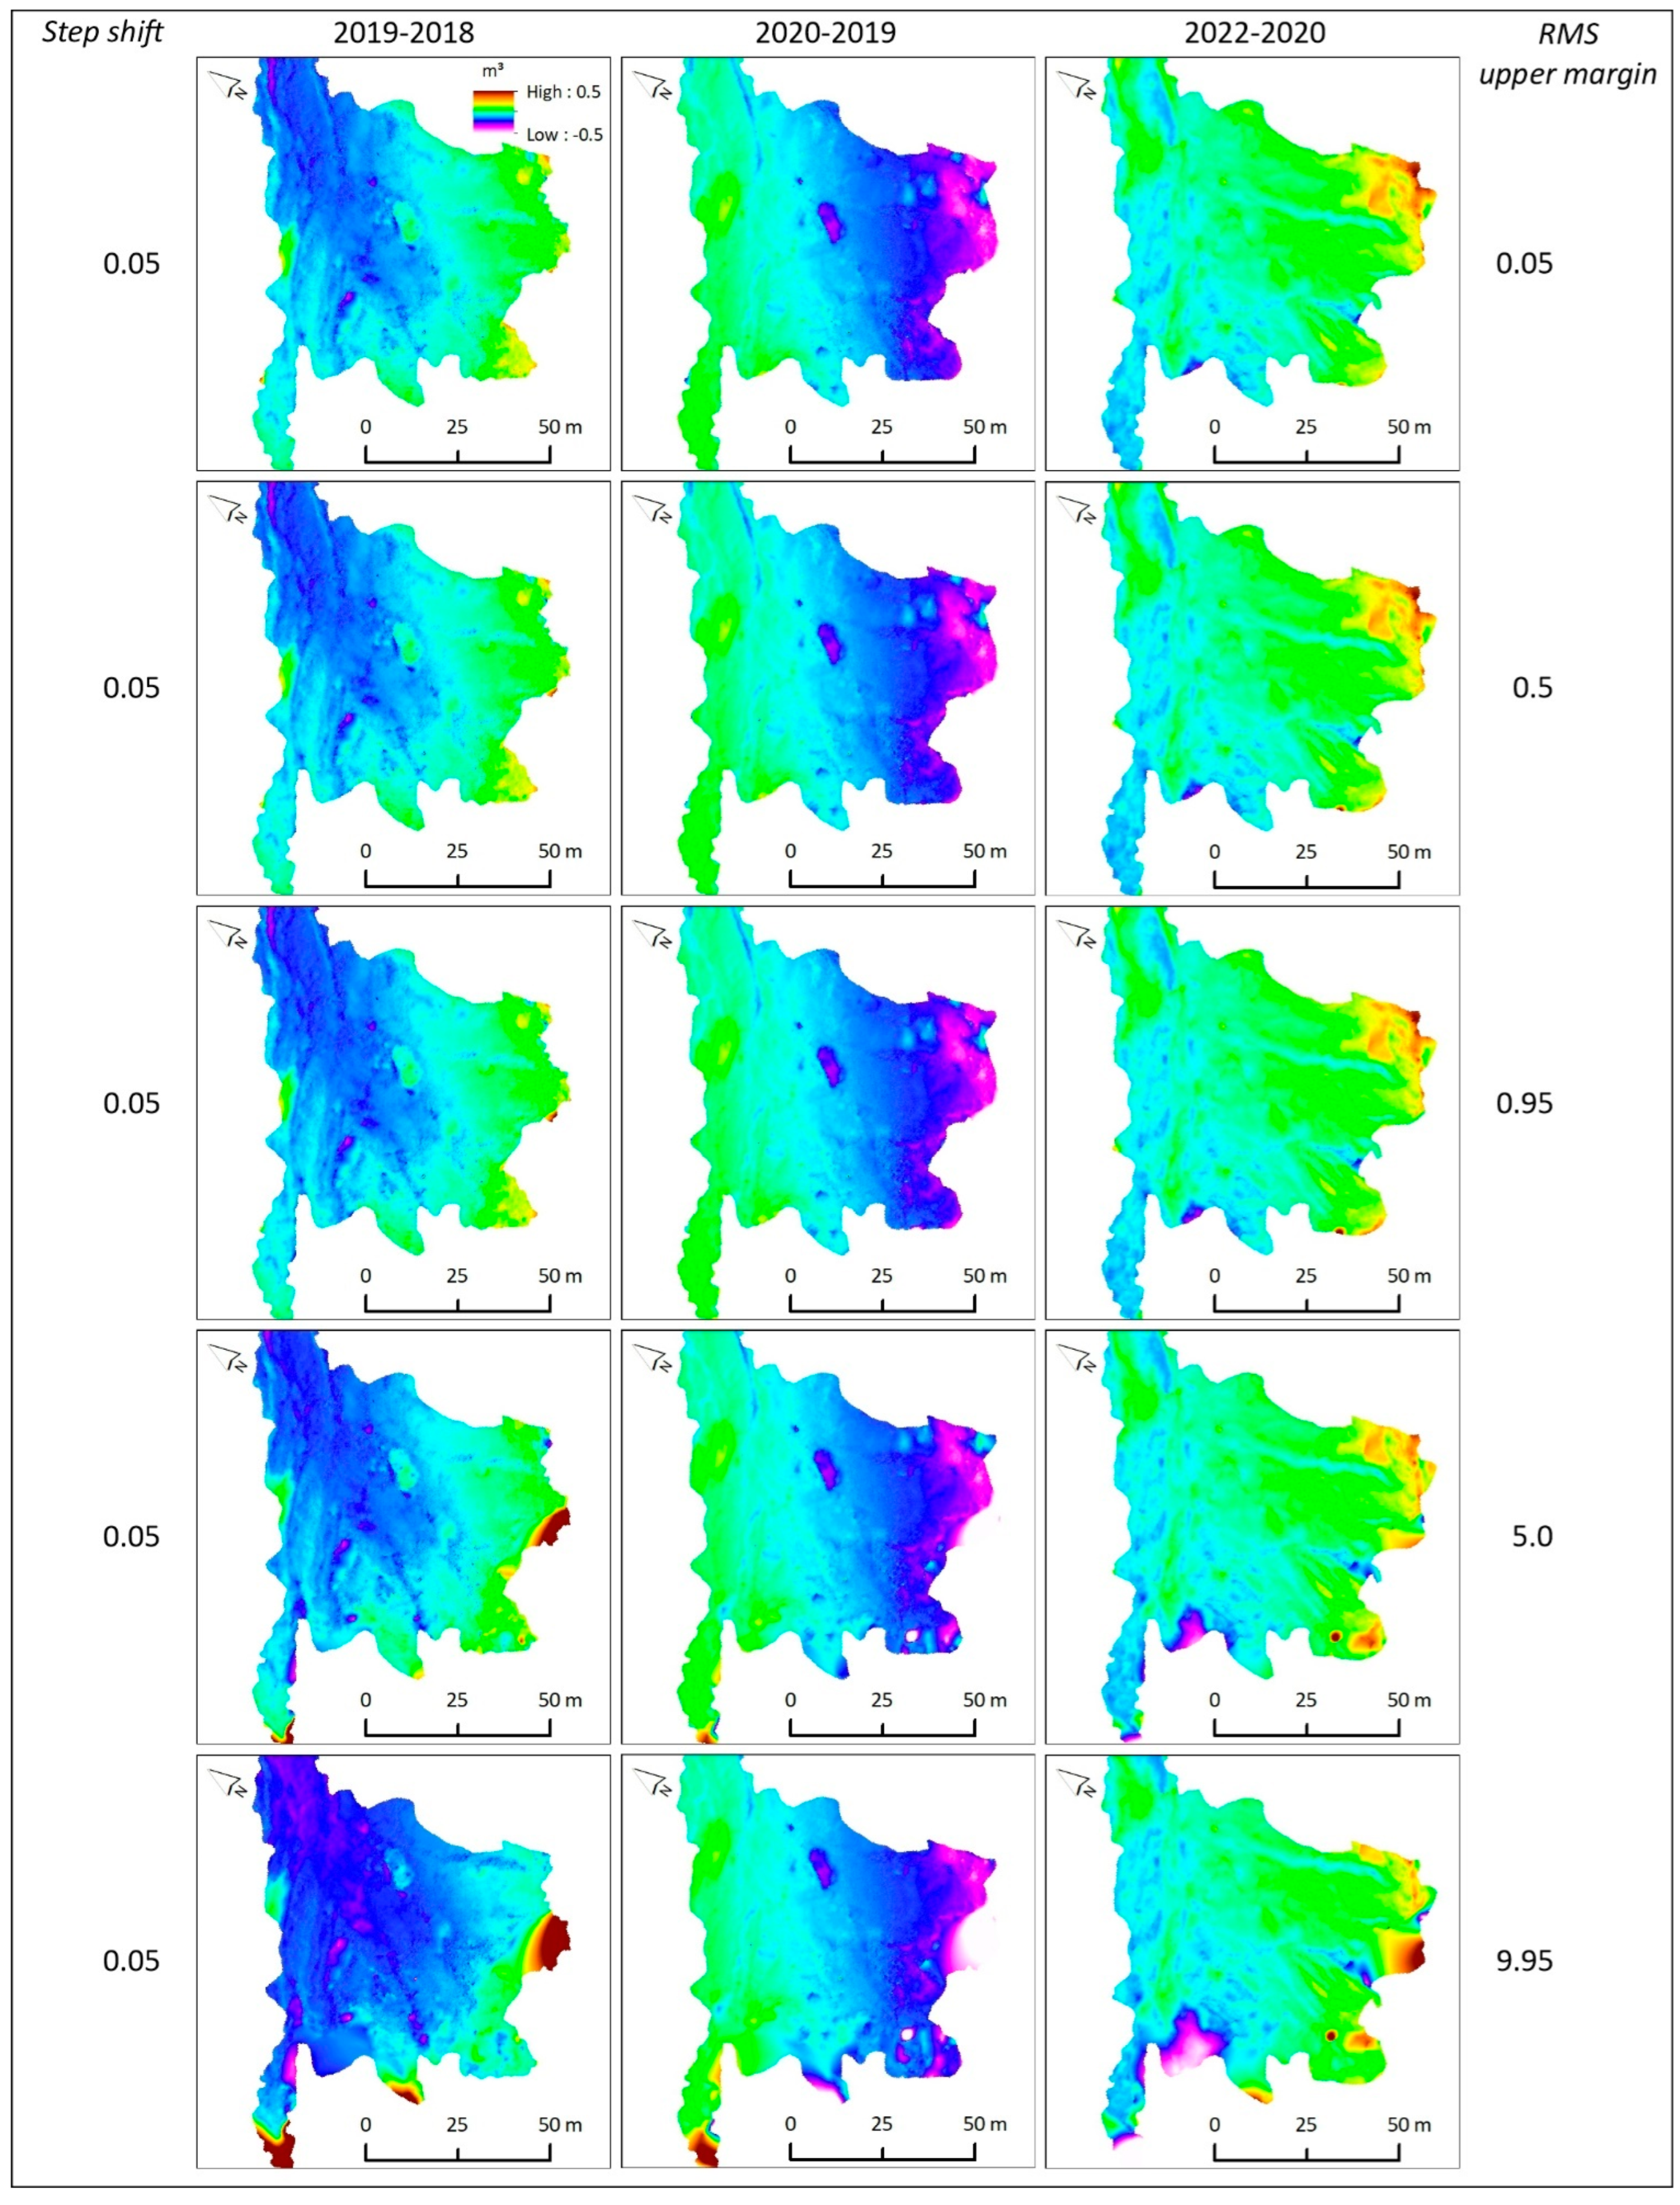
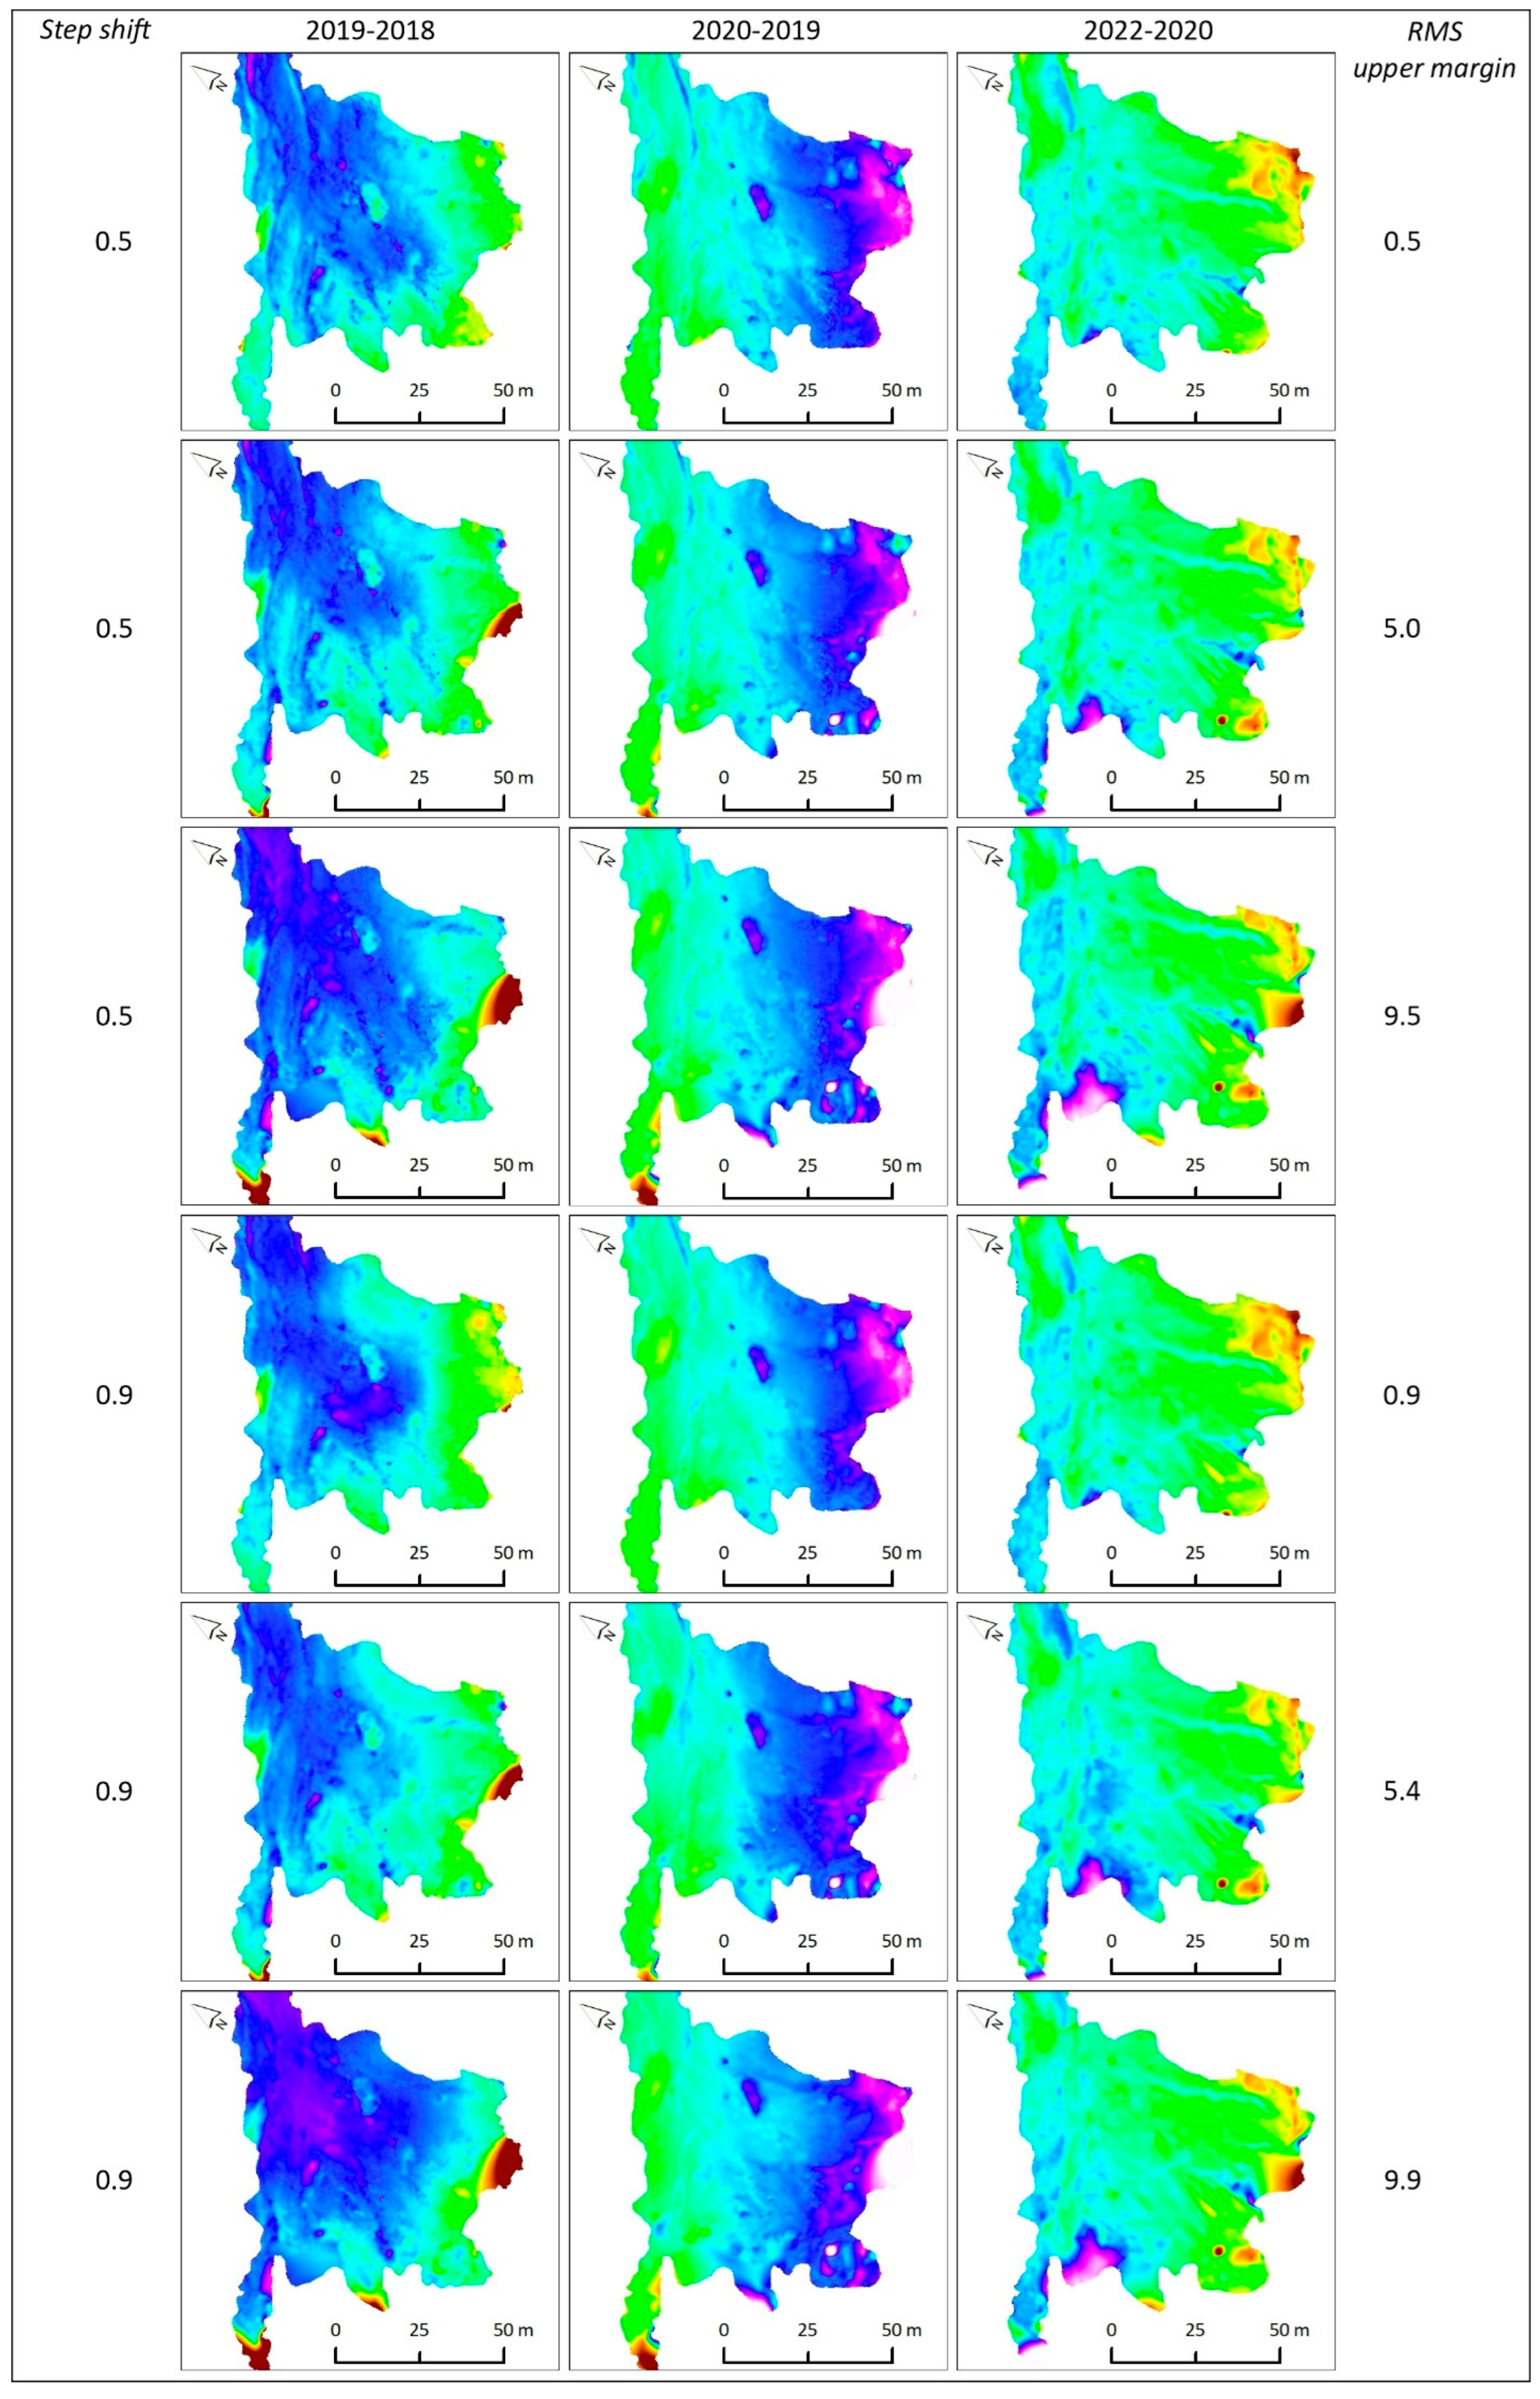
The spatial distribution of the simulated DEMs’ misalignments (Figure 10) shows the effect of the incorrect alignment of DEMs on estimating the material of eroded and transported weathered material. There are no significant changes visible at the pixel level for a shift step of 0.05 (Figure 10, the first three rows) where the RMS values are very small, up to 1 m and distributed over intervals of 0–0.05 m, 0.45–0.5 m, and 0.90–0.95 m. With the increased steps shift values, the next two rows from Figure 10, the material simulations recorded much higher RMS values between 4.5 and 5 m and 9.0 and 9.5 m. Changes are visible for these simulations with high RMS values and are mostly located at the earthflow border or in areas with steep slopes inside the earthflow.
The last six rows from Figure 10 show simulations with RMS values with a larger displacement step from 0.5 m to 9.9 m, respectively. In the case of high RMS values, the changes in displaced material become more visible, mostly inside and at the border of the earthflow where steep slopes are present.

5. Discussions

The current study presents a methodology for assessing the propagation of uncertainties related to digital elevation model misalignment into the estimations of material displaced by earthflows. The obtained results present in detail the relationships between the displaced material, reported throughout the study area and that at the local level, and the RMS values, associated with each DEM obtained from SfM. For a comprehensive analysis, several ranges of values were used (SM1); which, are considered to cover all possible situations. In addition, the research is carried out in several time intervals between 2018 and 2022.

5.1. UAV Flights

During drone flights between 2018 and 2022, a total of 1545 images were collected and processed. Each flight was processed individually using the ArcGIS Drone2Map software (ESRI), and the RMS values obtained for all flights were between a minimum of 1 cm and a maximum of 5 cm. These RMS values are the average values obtained using six GCPs in the SfM processing steps. The RMS values obtained for the GCPs used to check the quality of the final products (19 points) were somewhat higher, ranging from about 5 cm to about 34 cm in the X and Y directions. For the Z direction, the RMS values are higher, distributed in an interval between 42 cm and 56 cm. The values, consistent with similar studies [25,46,47], were obtained using accurate flight plans created with the Universal Ground Control System flight planning software (SPH Engineering (Company) and a constant height above the ground, calculated for a spatial resolution of 5 cm pixels. The number of GCPs used in processing the flights from 6 to 10 May 2021 is six [46]; considered sufficient to have consistent accuracy in the study area. It was impossible to use a larger number of GCPs due to the high density of trees located on the landslide body, which negatively influenced the accuracy of the GCPs collected in those areas. It was possible to collect the control points easily in the areas with wide openings and without vegetation; however, in the narrow sectors of the transport channel, the GPS and GSM signals were completely missing. Overall, the RMS values obtained for all flights were below 1 m.

5.2. Insights into Uncertainty Propagation Caused by DEMs Misalignment

The material displaced by the Chirlești landslide was analysed from two distinct perspectives: the total amount of the displacement material for the entire earthflow and the visual distribution of the local displaced material at the pixel level.
The first perspective consisted in understanding how the uncertainties induced by the degree of alignment between two DEMs are propagated in the numerical analysis of the kinematics of an earth flow. The simulation showed that there could be very large or very small, dislocated earth material differences. Still, these differences are neither associated with the RMS values nor could be objectively explained nor quantified numerically. Therefore, only the total value and the accumulated and eroded material values were analysed for each time interval. Surprisingly, as the simulated RMS values increased, there was no increase in the differences in values for all the displaced, accumulated, or eroded volumes. This is explained by the terrain’s morphology, which, alternates positive and negative forms on relatively small and medium distances between neighbouring pixels across the entire earthflow. Thus, any overlap error between two successive DEMs is not to be captured in the numerical values used to explain the volume of displaced material for the entire landslide. Considering those from above, there is no way of objectively estimating errors associated with the earthflow-displaced material by relying on the RMS values.
The second perspective consisted in evaluating the uncertainties induced by the misalignment between two DEMs from different time steps at the pixel-level spatial distribution of the displaced material. Unlike the previous situation, where the differences were reported for the entire earthflow, in the case of the spatial analysis, a clear relationship can be observed between the increase in the RMS values and the change in the spatial distribution of the displaced earth volume (Figure 10). The quantification of the influence of the RMS values on the spatial distribution of the displaced volume was achieved using the correlation coefficient between a baseline DEM and the simulated DEMs. Thus, for simulations with small step shifts up to 0.05 m and RMS values of a maximum of 1 m, a very good correlation can be seen between the baseline DEM and the average representation of the simulated DEMs. From a spatial point of view, a very small increase in the values of the displaced volume can be observed in the areas at the limit of the earthflow (Figure 10). These areas are also the most vulnerable to errors induced by misalignments; especially, when they are in contact with dense forest vegetation. The most negligible alignment errors in all directions (X, Y, and Z) can cause a significant change in the displaced material and must be treated with great care. As the simulations were carried out with larger ranges of values and with larger RMSs, these differences between the baseline DEM and the average of the simulated DEMs were accentuated mostly in the areas located at the boundary of the earthflow. A similar situation was observed in other areas from inside the earthflow body, where the slope of the terrain was steeper than the average slope of neighbouring pixels (Figure 10). The values of the correlation coefficient decreased significantly for simulations with large intervals of approximately 1 m and with RMS between 5 and 10 m.
It is important to highlight that RMS values on X and Y are equally important as those from the Z axis. A slight shift on X and Y automatically determines significant changes on the vertical scale; thus, amplifying the errors estimated on the Z axis. It leads to even more significant changes when at least one of the following conditions is met: terrain gradient with values above the average of the neighbouring pixels located at the boundary of a landslide or across the entire area; or when the landslide is at the contact with the area with medium and dense vegetation.
Changes in land use have a direct impact on the analysis performed for the current case study. This impact materialises by introducing false earth displacements where the land use has changed. The clearing of an area with dense vegetation or the development of vegetation in stabilised areas causes visible local changes and is identified as changes in the terrain’s morphology. These situations were eliminated by manually mapping the areas with dense and medium vegetation cover and eliminating them from the spatial analysis.
An important aspect to discuss is the situation in which a landslide undergoes radical morphological changes in the analysed time intervals. For these situations, using the correlation coefficient between two DEMs is insufficient to understand the spatial uncertainties induced by the misalignment values between them, and a detailed study through the visual interpretation of the entire study area is recommended.

6. Conclusions

From a landslide kinematics point of view, numerous studies pointed out the use of UAVs. Still, very few of them look in detail at the influence of DEM alignments in estimating the displaced earth material. The current study performed a detailed analysis of the landslide kinematics uncertainties related to UAV flight processing. The analysis used high-resolution DEMs obtained from UAV flights and statistical analysis to estimate the uncertainty propagation of the DEM misalignments between flights in evaluating landslides kinematics.
Using RMS values to simulate the propagation of uncertainties in the DEM made it possible to identify the correlation threshold of 0.95, beyond which, any analysis for landslide kinematics assessment becomes unusable. The 0.95 correlation coefficient corresponds to an RMS value of up to 1 unit.
Surprisingly, the increase in the RMS values did not determine an increase in the displaced earth between two UAV flights. Instead, combining the RMS values and the correlation coefficient clearly indicated the correspondence between the spatial distribution of the displaced earth material and the overall changes reported between two UAV flights.
The current methodology is reliable when studying slow-movement landslides, and when short intervals between DEMs are used. In the case of rapid movements or significant terrain changes, like translational and rotational landslides, careful analysis of the correlation coefficient in conjunction with the RMS values is recommended.
Despite the disadvantages of flying with non-RTK UAVs, the pixel alignment for all the products in the time series dataset was acceptable. Using UAVs equipped with RGB cameras proved to return satisfactory results, even in areas with medium vegetation cover when no LiDAR sensors are available.
Future investigations will focus on developing automated workflows capable of improving the space–time correlations between multitemporal DEMs obtained from UAVs, thus leading to an improved estimation of landslide kinematics.

Author Contributions

Conceptualization, I.Ș.; methodology, I.Ș. and V.I.; software, I.Ș., R.I. and V.I.; validation, I.Ș., R.I. and V.I.; formal analysis, I.Ș. and R.I.; data curation, V.I. and I.G.; writing—original draft preparation, I.Ș., V.I. and Z.C.; writing—review and editing, I.Ș. and V.I.; visualization, V.I., R.I. and I.Ș.; supervision, I.Ș.; project administration, I.Ș.; funding acquisition, I.Ș. and V.I. All authors have read and agreed to the published version of the manuscript.

Funding

This work was supported by a grant from the Ministry of Research, Innovation and Digitization, CNCS/CCCDI—UEFISCDI, project number 416PED within PNCDI III, project coordinator Ionuț Șandric (https://slidemap.gmrsg.ro), and by the project PN19450103 (project coordinator Viorel Ilinca, Geological Institute of Romania).

Conflicts of Interest

The authors declare no conflict of interest. The funders had no role in the design of the study; in the collection, analyses, or interpretation of data; in the writing of the manuscript; or in the decision to publish the results.

References

  1. Varnes, D.J. Landslide Types and Processes. In Landslides and Engineering Practice; Highway Research Board Special Report 29; Eckel, E.B., Ed.; NAS-NRC Publication: Washington, DC, USA, 1958; pp. 20–47. [Google Scholar]
  2. Varnes, D.J. Slope Movement Types and Processes. In Landslides-Analysis and Control: National Research Council, Washington D.C., Transportation Research Board, Special Report 176; Schuster, R.L., Krizek, R.J., Eds.; Transportation Research Board: Washington, DC, USA, 1978; pp. 11–33. [Google Scholar]
  3. Cruden, D.M.; Varnes, D.J. Landslide Types and Processes. In Landslide Investigation and Mitigation; Turner, A.K., Schuster, R.L., Eds.; Transportation Research Board Special Report; National Academy of Sciences: Washington, DC, USA, 1996; pp. 36–71. [Google Scholar]
  4. Keefer, D.K.; Johnson, A.M. Earth Flows: Morphology, Mobilization, and Movement; Professional Paper; United States Department of the Interior: Washington, DC, USA, 1983. [Google Scholar]
  5. Cruden, D.M.; Varnes, D.J. Landslide Types and Processes. In Landslides and Engineering Practice; Highway Research Board; NAS-NRC Publication: Washington, DC, USA, 1958; pp. 36–74. [Google Scholar]
  6. Skempton, A.W.; Hutchinson, J.N. Stability of Natural Slopes and Embankment Foundations. In Proceedings of the 7th International Conference on Soil Mechanics and Foundation Engineering, Mexico City, Mexico, 29 August 1969; pp. 291–340. [Google Scholar]
  7. Bovis, M.J. Earthflows in the Interior Plateau, Southwest British Columbia. Can. Geotech. J. 1985, 22, 313–334. [Google Scholar] [CrossRef]
  8. Fleming, R.W.; Johnson, A.M. Structures Associated with Strike-Slip Faults That Bound Landslide Elements. Eng. Geol. 1989, 27, 39–114. [Google Scholar] [CrossRef]
  9. Hungr, O.; Evans, S.G.; Bovis, M.J.; Hutchinson, J.N. A Review of the Classification of Landslides of the Flow Type. Environ. Eng. Geosci. 2001, VII, 221–238. [Google Scholar] [CrossRef]
  10. Hutchinson, M.F. A New Procedure for Gridding Elevation and Stream Line Data with Automatic Removal of Spurious Pits. J. Hydrol. 1989, 106, 211–232. [Google Scholar] [CrossRef]
  11. Wilson, J.P.; Gallant, J.C. Terrain Analysis: Principles and Applications; John Wiley & Sons Inc: Hoboken, NJ, USA, 2001. [Google Scholar]
  12. Kinsey-Henderson, A.E.; Wilkinson, S.N. Evaluating Shuttle Radar and Interpolated DEMs for Slope Gradient and Soil Erosion Estimation in Low Relief Terrain. Environ. Model. Softw. 2013, 40, 128–139. [Google Scholar] [CrossRef]
  13. Lanari, R.; Fornaro, G.; Riccio, D.; Migliaccio, M.; Papathanassiou, K.P.; Moreira, J.R.; Schwabisch, M.; Dutra, L.; Puglisi, G.; Franceschetti, G.; et al. Generation of Digital Elevation Models by Using SIR-C/X-SAR Multifrequency Two-Pass Interferometry: The Etna Case Study. IEEE Trans. Geosci. Remote Sens. 1996, 34, 1097–1114. [Google Scholar] [CrossRef]
  14. Ludwig, R.; Schneider, P. Validation of Digital Elevation Models from SRTM X-SAR for Applications in Hydrologic Modeling. ISPRS J. Photogramm. Remote Sens. 2006, 60, 339–358. [Google Scholar] [CrossRef]
  15. Van Den Eeckhaut, M.; Kerle, N.; Hervás, J.; Supper, R. Mapping of Landslides Under Dense Vegetation Cover Using Object-Oriented Analysis and LiDAR Derivatives. In Landslide Science and Practice; Springer: Berlin/Heidelberg, Germany, 2013; pp. 103–109. [Google Scholar]
  16. Mezaal, M.R.; Pradhan, B. An Improved Algorithm for Identifying Shallow and Deep-Seated Landslides in Dense Tropical Forest from Airborne Laser Scanning Data. CATENA 2018, 167, 147–159. [Google Scholar] [CrossRef]
  17. Mezaal, M.; Pradhan, B.; Rizeei, H. Improving Landslide Detection from Airborne Laser Scanning Data Using Optimized Dempster–Shafer. Remote Sens. 2018, 10, 1029. [Google Scholar] [CrossRef]
  18. Görüm, T. Landslide Recognition and Mapping in a Mixed Forest Environment from Airborne LiDAR Data. Eng. Geol. 2019, 258, 105155. [Google Scholar] [CrossRef]
  19. Garcia, G.P.B.; Grohmann, C.H.; Viana, C.D.; Gomes, E.B. Using Terrestrial Laser Scanner and RPA-Based-Photogrammetry for Surface Analysis of a Landslide: A Comparison. Bol. De Ciências Geodésicas 2022, 28. [Google Scholar] [CrossRef]
  20. Nereson, A.L.; Finnegan, N.J. Drivers of Earthflow Motion Revealed by an 80 Yr Record of Displacement from Oak Ridge Earthflow, Diablo Range, California, USA. GSA Bull. 2019, 131, 389–402. [Google Scholar] [CrossRef]
  21. Daehne, A.; Corsini, A. Kinematics of Active Earthflows Revealed by Digital Image Correlation and DEM Subtraction Techniques Applied to Multi-Temporal LiDAR Data: Kinematics of Active Earthflows. Earth Surf. Process. Landf. 2013, 38, 640–654. [Google Scholar] [CrossRef]
  22. Moine, M.; Puissant, A.; Malet, J. Detection of Landslides from Aerial and Satellite Images with a Semi-Automatic Method. Application to the Barcelonnette Basin (Alpes-de-Hautes-Provence, France). Proc. Landslide Process. Conf. A Tribut. Dr. Van Asch 2009, 63–68. [Google Scholar]
  23. Peternel, T.; Kumelj, Š.; Oštir, K.; Komac, M. Monitoring the Potoška Planina Landslide (NW Slovenia) Using UAV Photogrammetry and Tachymetric Measurements. Landslides 2017, 14, 395–406. [Google Scholar] [CrossRef]
  24. Conforti, M.; Mercuri, M.; Borrelli, L. Morphological Changes Detection of a Large Earthflow Using Archived Images, LiDAR-Derived DTM, and UAV-Based Remote Sensing. Remote Sens. 2020, 13, 120. [Google Scholar] [CrossRef]
  25. Ilinca, V.; Șandric, I.; Chițu, Z.; Irimia, R.; Gheuca, I. UAV Applications to Assess Short-Term Dynamics of Slow-Moving Landslides under Dense Forest Cover. Landslides 2022, 19, 1717–1734. [Google Scholar] [CrossRef]
  26. Van Niel, T.G.; McVicar, T.R.; Li, L.; Gallant, J.C.; Yang, Q. The Impact of Misregistration on SRTM and DEM Image Differences. Remote Sens. Environ. 2008, 112, 2430–2442. [Google Scholar] [CrossRef]
  27. Dumitrescu, I.; Săndulescu, M.; Lăzărescu, V.; Mirăuță, O.; Pauliuc, S.; Georgescu, C. Mémoire à La Carte Tectonique de La Roumanie. Anu. Com. Geol. 1962, XXXII, 5–73. [Google Scholar]
  28. Dumitrescu, I.; Săndulescu, M. Harta Tectonică Scara 1:1.000.000, România. Atlas Geologic, Foaia Nr. 6; Institutul Geologic al României: București, Romania, 1970. [Google Scholar]
  29. Săndulescu, M. Geotectonica României; Editura Tehnică: București, Romania, 1984; p. 335. [Google Scholar]
  30. Săndulescu, M. Cenozoic Tectonic History of the Carpathians. In The Pannonian Basin: A Study in Basin Evolution; Royden, L.H., Horváth, F., Eds.; AAPG MEMOIR; 1988; pp. 17–25. Available online: https://pubs.geoscienceworld.org/aapg/books/book/1357/chapter-abstract/107171938/Cenozoic-Tectonic-History-of-the-Carpathians?redirectedFrom=fulltext (accessed on 23 October 2021).
  31. Ștefănescu, M.; Working Group. Secțiune Geologică Tăul Zăului-Ungheni-Paloș-Aita Mare-Sfântu Gheorghe-Beceni-Horia-Spiru Hare—A16; Editura Institutului Geologic al României: București, Romania, 2018. [Google Scholar]
  32. Ștefănescu, M.; Popescu, I.; Melinte, M.; Ivan, V.; Ștefănescu, M.; Papaianopol, I.; Popescu, G.; Dumitrică, P. Harta Geologică a României Scara 1:50000, Foaia Nehoiu; Editura Institutului Geologic al Romaniei: București, Romania, 2018. [Google Scholar]
  33. Badea, L.; Posea, G. Torentul Noroios de La Chirlești. Natura 1953, V, 109–112. [Google Scholar]
  34. Tufescu, V. Torenți de Noroi În Vrancea. Comunicările Acad. R.P.R. 1959, IX, 67–72. [Google Scholar]
  35. Tufescu, V. Mudflows in the Flysch Carpathians and Bend Sub-Carpathians of Romania. Z. Für Geomorphol. 1970, 146–156. [Google Scholar]
  36. Constantin, M. Morphology and Environmental Impact of the Chirlești Mud Torrent. Trans. Jpn. Geomorphol. Union 2002, 23, 449–455. [Google Scholar]
  37. Bălteanu, D.; Micu, M. Morphodynamics of the Chirlești Mudflow (Buzău Mountains). Rev. Roum. De Géographie/Rom. J. Geogr. 2012, 56, 117–125. [Google Scholar]
  38. Lahousse, P.; Pierre, G.; Ene, M.; Diaconu, D.; Visan, M. Le Torrent de Boue de Chirlești (Carpates de La Courbure, Roumanie): Un Demi-Siècle d’activité. Physio-Géo 2016, 171–190. [Google Scholar] [CrossRef]
  39. Marinescu, I. Fenomene Fizico-Geologice În Bazinul Hidrografic al Buzăului. Stud. Teh. Și Econ. 1956, F2, 3–23. [Google Scholar]
  40. Micu, M.; Bălteanu, D.; Micu, D.; Zarea, R.; Raluca, R. Landslides in the Romanian Curvature Carpathians in 2010. In Geomorphological Impacts of Extreme Weather. Springer Geography; Lóczy, D., Ed.; Springer: Berlin/Heidelberg, Germany, 2013; pp. 251–264. ISBN 978-94-007-6301-2. [Google Scholar]
  41. SPH Engineering (Company). Ground Station Software|UgCS PC Mission Planning. Available online: https://www.ugcs.com/ (accessed on 23 October 2021).
  42. Sandric, I.; Ionita, C.; Chitu, Z.; Dardala, M.; Irimia, R.; Furtuna, F.T. Using CUDA to Accelerate Uncertainty Propagation Modelling for Landslide Susceptibility Assessment. Environ. Model. Softw. 2019, 115, 176–186. [Google Scholar] [CrossRef]
  43. Lin, K.; Zhang, Q.; Chen, X. An Evaluation of Impacts of DEM Resolution and Parameter Correlation on TOPMODEL Modeling Uncertainty. J. Hydrol. 2010, 394, 370–383. [Google Scholar] [CrossRef]
  44. Shentu, J.; Lin, B. A Novel Machine Learning Framework for Efficient Calibration of Complex DEM Model: A Case Study of a Conglomerate Sample. Eng. Fract. Mech. 2023, 279, 109044. [Google Scholar] [CrossRef]
  45. Şandric, I.; Satmari, A.; Zaharia, C.; Petrovici, M.; Cîmpean, M.; Battes, K.-P.; David, D.-C.; Pacioglu, O.; Weiperth, A.; Gál, B.; et al. Integrating Catchment Land Cover Data to Remotely Assess Freshwater Quality: A Step Forward in Heterogeneity Analysis of River Networks. Aquat. Sci. 2019, 81, 26. [Google Scholar] [CrossRef]
  46. Lindner, G.; Schraml, K.; Mansberger, R.; Hübl, J. UAV Monitoring and Documentation of a Large Landslide. Appl. Geomat. 2016, 8, 1–11. [Google Scholar] [CrossRef]
  47. Rossi, G.; Tanteri, L.; Tofani, V.; Vannocci, P.; Moretti, S.; Casagli, N. Multitemporal UAV Surveys for Landslide Mapping and Characterization. Landslides 2018, 15, 1045–1052. [Google Scholar] [CrossRef]
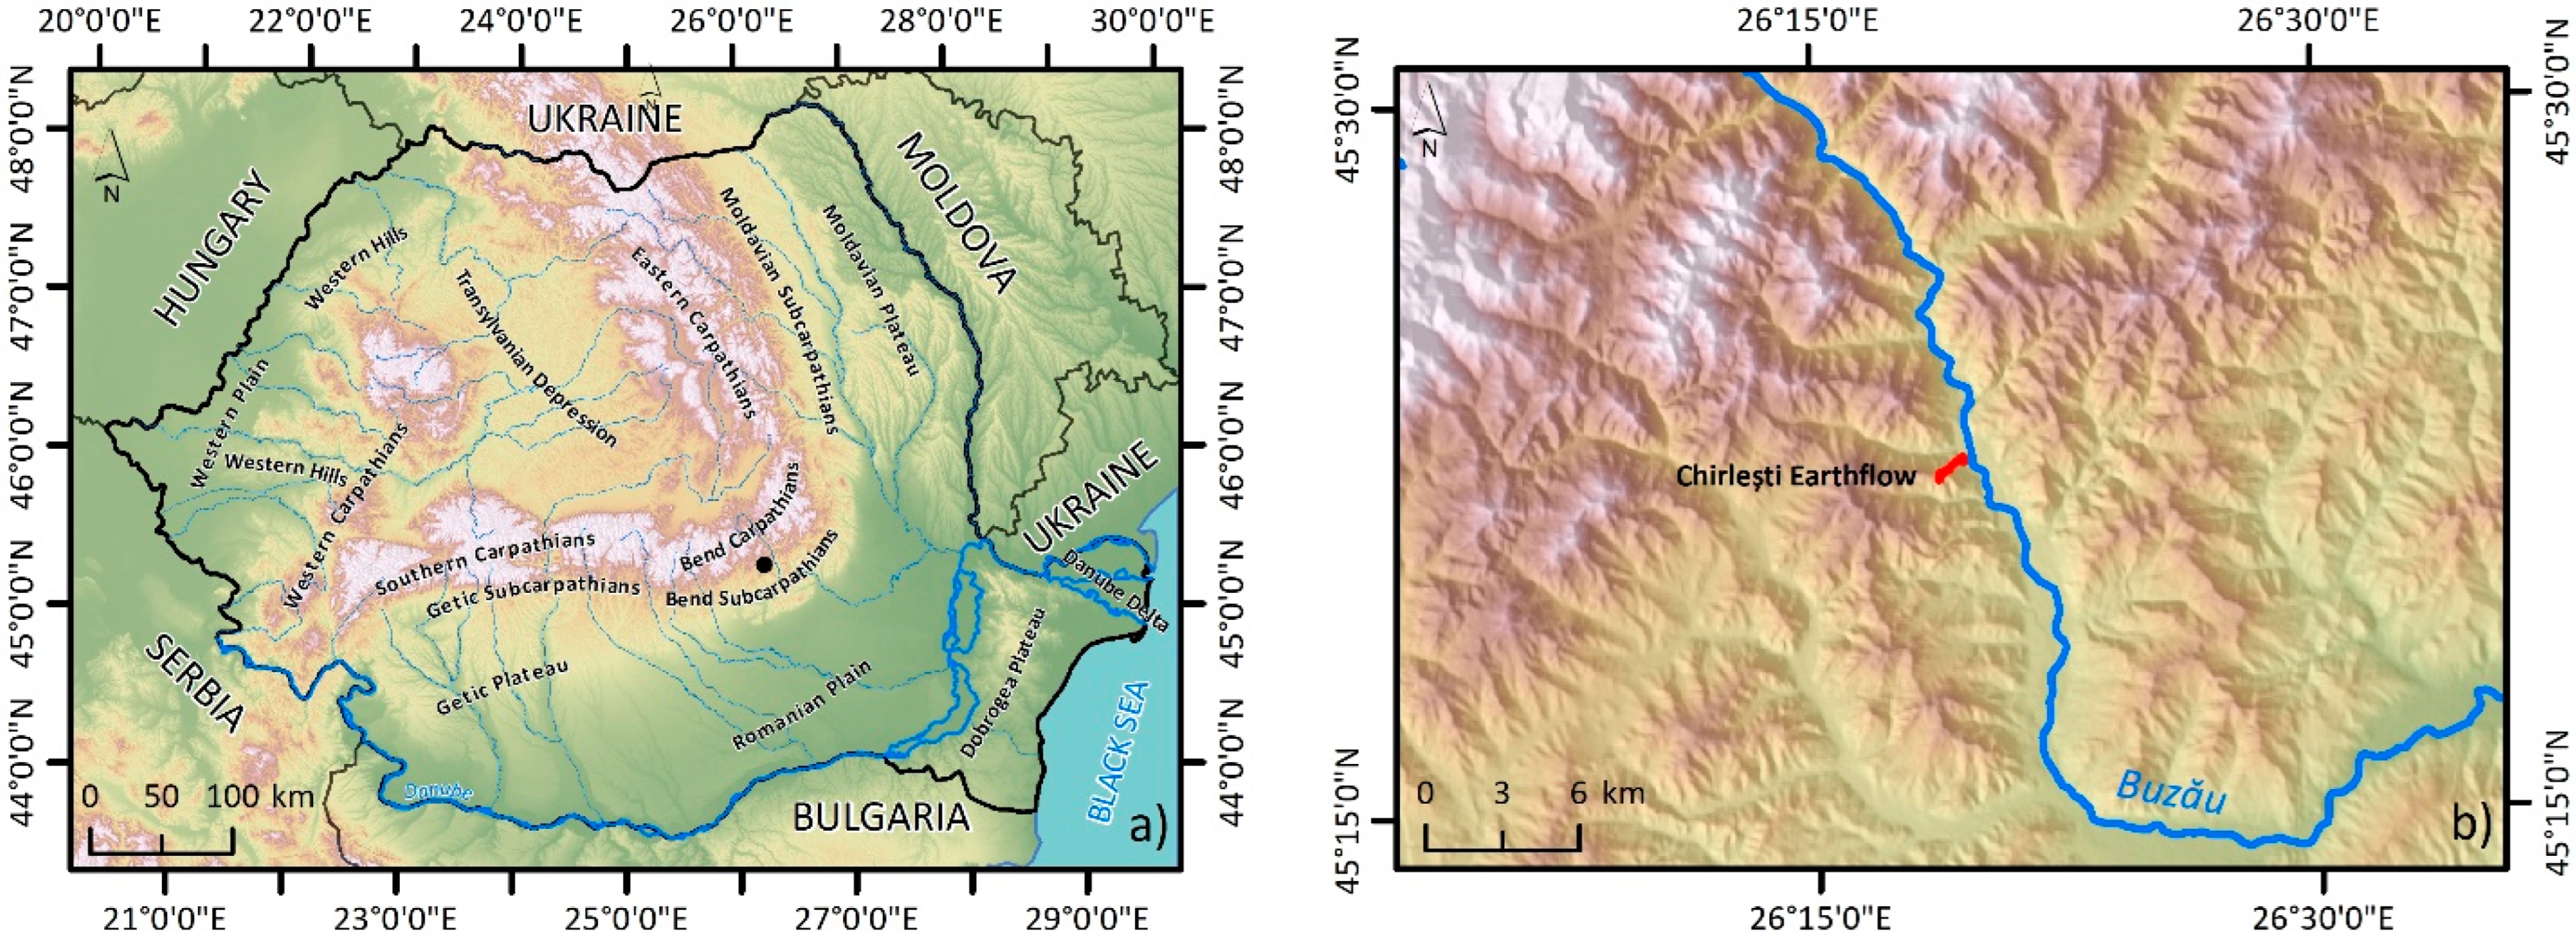
Figure 1. Location of Chirlești earthflow within Romania (a) and Bend Subcarpathians (b).
Remotesensing 15 02161 g001
Figure 2. Geology of the study area: geologic map (a); tectonic sketch (b); geological cross-section (c). Data from [32].
Remotesensing 15 02161 g002
Figure 3. Geomorphological sketch of the Chirlești earthflow.
Remotesensing 15 02161 g003
Figure 4. Outcrop in the upper part of the earthflow showing the fault zone and the contact between the two geologic formations. The picture was taken on 16 March 2019. Note that a landslide deposit covered the entire outcrop during the survey on 28 June 2020. The numbers indicate dip and dip angle values.
Remotesensing 15 02161 g004
Figure 5. Secondary headscarps of the Chirlești earthflow. The pictures were taken on 16 March 2019: (a) view of the main scarp from downslope to upslope; (b) view of the main scarp from profile.
Remotesensing 15 02161 g005
Figure 6. Methodological workflow for mapping landslide displacements using aerial imagery time series.
Remotesensing 15 02161 g006
Figure 7. Chirlești earthflow. In the first row, from left to right, each image represents a different acquisition date where: the entire earthflow, each flight from left to right corresponds to 2018 (a), 2019 (b), 2020 (c), and 2022 (d); on the second row, the contact between transport and accumulation area is presented. The same acquisition date is valid from left to right (2018 (e); 2019 (f); 2020 (g); 2022 (h)).
Remotesensing 15 02161 g007
Figure 8. Conceptual model displaying the RMS shifts on all three axes and their influences in the earth volume displacements. Upper row, RMS shifts are presented on transversal and longitudinal profiles. In the lower row, from left to right, RMS shifts with increasing values are presented: (a) vertical shifting seen from a transversal profile; (b) vertical shifting seen from a longitudinal profile; (c) original grid; (d) n degree shifted grid with low RMS; (e) n degree shifted grid with high RMS.
Remotesensing 15 02161 g008
Figure 9. Earthflow changes between 2018 and 2022. From left to right: (a) 2018 to 2019; (b) 2019 to 2020; (c) 2020 to 2022.
Remotesensing 15 02161 g009
Figure 10. Simulated earthflow material displacements for each pair of flights. On the left-hand side, the size of the simulation step is presented; on the right-hand side, the upper value of the simulation interval is presented; on the middle part, the maps illustrate simulated earthflow material displacements; the simulation intervals are between the RMS upper margin minus step shift and RMS upper margin.
Remotesensing 15 02161 g010aRemotesensing 15 02161 g010b
Table 1. UAV flights performed between 4 August 2018 and 2 September 2022 on the Chirlești earthflow.
Flight DateUAVPixel Resolution (m)Height Above Ground (m)Side and Forward OverlapImages Captured (no.)
4 August 2018DJI Phantom 4511470%396
30 May 2019DJI Phantom 4511470%318
28 June 2020DJI Phantom 4511470%539
2 September 2022DJI Phantom 4511470%292
Table 2. Overall accuracies of the SfM process. RMS for target and validation GCPs are presented in meters.
Flight DateOrthophoto
Resolution (m)
DSM
Resolution (m)
DEM
Resolution (m)
RMS (GCPs) (m)RMS (Validation GCPs) (m)
4 August 20180.050.050.25X: 0.025968
Y: 0.015673
Z: 0.025248
X: 0.168017
Y: 0.134719
Z: 0.468118
30 May 20190.050.050.25X: 0.049870
Y: 0.034859
Z: 0.013929
X: 0.183224
Y: 0.123498
Z: 0.440005
28 June 20200.050.050.25X: 0.012039
Y: 0.032294
Z: 0.012994
X: 0.140944
Y: 0.200490
Z: 0.424343
2 September 20220.050.050.25X: 0.034958
Y: 0.034343
Z: 0.012324
X: 0.231241
Y: 0.334245
Z: 0.565455
Table 3. Correlation values for each simulation step and RMS per period between the reference earthflow and simulated ones.
Step Shift2019–20182020–20192022–2020RMS
Upper Margin
0.050.990.990.990.05
0.980.990.990.5
0.950.980.980.95
0.730.910.855.0
0.480.840.699.95
0.50.970.990.980.5
0.750.920.865.0
0.510.850.729.5
0.90.920.960.960.9
0.730.910.845.4
0.510.850.729.5
Disclaimer/Publisher’s Note: The statements, opinions and data contained in all publications are solely those of the individual author(s) and contributor(s) and not of MDPI and/or the editor(s). MDPI and/or the editor(s) disclaim responsibility for any injury to people or property resulting from any ideas, methods, instructions or products referred to in the content.