Article

Wavelet Vegetation Index to Improve the Inversion Accuracy of Leaf V25cmax of Bamboo Forests

1
State Key Laboratory of Subtropical Silviculture, Zhejiang A & F University, Hangzhou 311300, China
2
Key Laboratory of Carbon Cycling in Forest Ecosystems and Carbon Sequestration of Zhejiang Province, Zhejiang A & F University, Hangzhou 311300, China
3
School of Environmental and Resources Science, Zhejiang A & F University, Hangzhou 311300, China
*
Author to whom correspondence should be addressed.
Remote Sens. 2023, 15(9), 2362; https://doi.org/10.3390/rs15092362
Submission received: 20 March 2023 / Revised: 26 April 2023 / Accepted: 27 April 2023 / Published: 29 April 2023

Abstract

:
Maximum carboxylation rate (Vcmax) is a key parameter to characterize the forest carbon cycle process. Hence, monitoring the Vcmax of different forest types is a hot research topic at home and abroad, and hyperspectral remote sensing is an important technique for Vcmax inversion. Moso bamboo is a unique forest type with a high carbon sequestration capacity in subtropical regions, but the lack of Vcmax data is a major limitation to accurately modeling carbon cycling processes in moso bamboo forests. Our study area was selected in the moso bamboo forest carbon sink research base in Shanchuan Township, Anji County, Zhejiang Province, China, which has a typical subtropical climate and is widely distributed with moso bamboo forests. In this study, the hyperspectral reflectance and V25cmax (Vcmax converted to 25 °C) of leaves of newborn moso bamboo (I du bamboo) and 2- to 3-year-old moso bamboo (II du bamboo) were measured at different canopy positions, i.e., the top, middle and bottom, in the moso bamboo forest. Then, we applied a discrete wavelet transform (DWT) to the obtained leaf hyperspectral reflectance to construct the wavelet vegetation index (WVI), analyzed the relationship between the WVI and moso bamboo leaf V25cmax, and compared the WVI to the existing hyperspectral vegetation index (HVI). The ability of the WVI to characterize the moso bamboo V25cmax was interpreted. Finally, the partial least squares regression (PLSR) method was used to construct a model to invert the V25cmax of moso bamboo leaves. We showed the following: (1) There are significant leaf V25cmax differences between I du and II du bamboo, and there are also significant leaf V25cmax differences between the top, middle and bottom canopy positions of I du bamboo. (2) Compared to that with the HVI, the detection wavelength of the V25cmax of the WVI expanded to the shortwave infrared region, and thus the WVI had a higher correlation with the V25cmax. The absolute value of the correlation coefficient between the V25cmax of I du bamboo and SR2148,2188 constructed by cD1 was 0.75, and the absolute value of the correlation coefficient between the V25cmax of II du bamboo and DVI2069,407 constructed by cD2 was 0.67. The highest absolute value of the correlation coefficient between V25cmax and WVI at the three different canopy positions was also 13–21% higher than that with the HVI. The longest wavelength used by the WVI was 2441 nm. (3) The validation accuracies of the V25cmax inversion models constructed with the WVI as a variable were all higher than those of the models constructed with the HVI as a variable for all ages and positions, with the highest R2 value of 0.97 and a reduction of 20–60% in the root mean square error (RMSE) value. After the wavelet decomposition of the hyperspectral reflectance of moso bamboo leaves, the low-frequency components contained no noise, and the high-frequency components highlighted the original spectral detail features. The WVI constructed by these components increases the wavelength range of V25cmax interpretation. Therefore, the V25cmax retrieval model based on the WVI encompasses different resolutions and levels of spectral characteristics, which can better reflect the changes in bamboo leaves and can provide a new method for the inversion of the V25cmax of moso bamboo forests based on hyperspectral remote sensing.

1. Introduction

Maximum carboxylation rate (Vcmax) is the rate of the carboxylation reaction in the vegetation photosynthesis process, which indicates the maximum number of moles of CO2 that can be fixed by leaves per unit area per unit time. This quantity was first used as a key biochemical parameter to describe the photosynthetic capacity of leaves in the Farquhar–von Caemmerer–Berry biochemical photosynthesis model (FvCB model), which was proposed in 1980 [1]. Because of its successful characterization of plant photosynthetic capacity, Vcmax is widely used in various terrestrial biosphere models to simulate the carbon cycle. Vcmax is sensitive to temperature, and most models convert it to a fixed value at 25 °C, i.e., V25cmax [2]. However, V25cmax greatly varies among different vegetation types, phenological periods and growth environments [2,3,4]. If the accurate V25cmax value of a given vegetation type is not available, this greatly affects the accurate simulation of the associated carbon cycle process and limits an understanding of the associated carbon formation mechanism [5]. Therefore, monitoring the V25cmax of different vegetation types has remained a research hotspot at home and abroad.
At present, Vcmax monitoring methods can be divided into direct and indirect measurement methods. Direct measurement methods include laboratory [6] and gas exchange measurement methods [7,8]. Indirect measurement methods mainly entail the use of relevant physiological and biochemical parameters [9,10], radiative transfer models [11,12] and satellite remote sensing technology for estimation purposes. Among these options, remote sensing, especially hyperspectral remote sensing technology, can interpret the differences in vegetation physiological and biochemical parameters at different temporal and spatial scales from tens or even hundreds of narrow and continuous electromagnetic spectral features. Therefore, hyperspectral remote sensing technology has become an important technical means to monitor vegetation physiological and biochemical parameters [13,14,15,16,17,18]: for example, this technology has been applied to retrieve the Vcmax of different species at different canopy positions and different leaf ages. Doughty et al. used the spectral characteristics of leaves and the partial least squares regression (PLSR) to build a model to predict the Vcmax of tropical forest leaves [19]; Serbin et al. established a Vcmax full-band hyperspectral PLSR inversion model to achieve accurate poplar Vcmax estimation [20]. Since then, the Vcmax full-band hyperspectral PLSR inversion method has been widely adopted to estimate the Vcmax of soybean [21], corn [22], wheat [23] and other crop leaves. The natural state is diverse, so predicting the Vcmax of leaves at different temperatures, different phenologies [24], different site conditions [25] and different ages [26] has become the focus of researchers. For this reason, methods that can be adapted to more complex scenes can be more effectively used in Vcmax inversion, such as radiative transfer models [11], integrated learning [27,28] and deep learning [29].
However, most studies using hyperspectral estimation of Vcmax have adopted raw hyperspectral data as the model input without considering the effects of information redundancy and data covariance resulting from tens or even hundreds of spectral bands on the model accuracy. Therefore, hyperspectral preprocessing methods and effective data mining techniques are essential to improve the accuracy of Vcmax inversion models. For example, building a spectral index based on an optimal band combination algorithm can reduce background noise and band multicollinearity, making this index more suitable for vegetation parameter estimation than one constructed based on full-band hyperspectral data [30,31]. The existing hyperspectral vegetation index (HVI) has achieved favorable results in inversion research on vegetation parameters such as Vcmax. For example, Wang et al. [32,33] showed that the simple ratio vegetation index (SR) and normalized difference vegetation index (NDVI) could better predict the Vcmax of the Japanese beech (Fagus crenata); Dillen et al. demonstrated that the red edge position (REP) is significantly correlated with Vcmax, the maximum electron transport capacity (Jmax) and chlorophyll content in a deciduous forest [3]. The discrete wavelet transform (DWT) is a mathematical transformation for local decomposition of space–time data. It obtains the temporal and frequency characteristics of signals through the translation and scaling of the mother wavelet. This decomposition in the time and frequency domains yields a multiresolution function with a wavelet transform, and this approach can separate high-frequency detail information from low-frequency macroscopic information to realize deep mining of data information [34]. Therefore, the DWT can be used to decompose vegetation hyperspectral data at multiple scales to obtain spectral characteristics at every scale and seek the optimal subinformation for the inversion of vegetation physiological and biochemical parameters. At present, the use of the DWT for hyperspectral data processing has also generated favorable results in the inversion of the vegetation net photosynthetic rate [15], leaf chlorophyll content [35], leaf nitrogen content [36,37], leaf area index [38] and other aspects. Hence, the study of V25cmax hyperspectral inversion of vegetation leaves based on the DWT represents a new and promising exploration direction.
Moso bamboo (Phyllostachys heterocycle) belongs to the subfamilies of Poaceae (Gramineae), which is widely distributed in the subtropical regions of China and exhibits the characteristics of fast growth, high productivity and high carbon sequestration capacity [39,40,41]. In contrast to other types of arbor species, moso bamboo has the obvious phenological characteristics of biennial on- and off-years. Large numbers of bamboo shoots grow into newborn moso bamboo (I du bamboo) in spring and summer in the on-years. The leaves of 2- to 3-year-old moso bamboo (II du bamboo) gradually turn yellow and fall off in the off-years. Ren Yujun et al. [42] showed that the photosynthetic efficiency of moso bamboo leaves significantly decreased in the aging process. The photosynthetic efficiency of I du bamboo leaves significantly differed from that of II du bamboo leaves. Other related studies also showed [43,44] that the seasonal variation in forest photosynthesis was driven by the replacement of older leaves with lower V25cmax values by new mature leaves with higher V25cmax values, thus affecting the total productivity of forest ecosystems. Bielczynski et al. [45] also explained that, at the physiological level, the age of leaves should be considered when quantifying photosynthetic characteristics. Wu et al. also verified that leaf age and canopy conditions should be simultaneously considered when simulating forest carbon cycle processes [46]. Therefore, leaf age and canopy conditions are crucial for V25cmax estimation.
Based on the above analysis, V25cmax is a key biochemical parameter to describe the vegetation photosynthesis process and the carbon cycle, and hyperspectral remote sensing is an important technical means for V25cmax inversion. Due to the unique phenological characteristics of moso bamboo, the use of hyperspectral remote sensing to invert the V25cmax of moso bamboo forests at different ages and canopy positions has important theoretical significance for the analysis of carbon sequestration capacity. In this study, we adopted I du and II du bamboo, which grow near the flux tower in Shanchuan Township, Anji County, Zhejiang Province, as examples. First, a full-range spectroradiometer (ASD FieldSpec 4 Standard Res; Analytical Spectral Devices) and a portable photosynthesis system (Li-6800; LICOR Biosciences) were used to measure the hyperspectral reflectance and V25cmax of leaves with different ages and at different canopy positions. Second, the relationship between the V25cmax of moso bamboo and the WVI, which was constructed by the hyperspectral reflectance after DWT treatment, was analyzed, and the WVI was compared to the HVI to explain the ability of the WVI to characterize the V25cmax of moso bamboo. Finally, a PLSR model was constructed to invert the V25cmax of moso bamboo leaves at different ages and canopy positions. The research results could provide a new method for high-precision inversion of the V25cmax of bamboo leaves and provide key parameters for evaluating the carbon cycle process in bamboo forests.

2. Materials and Methods
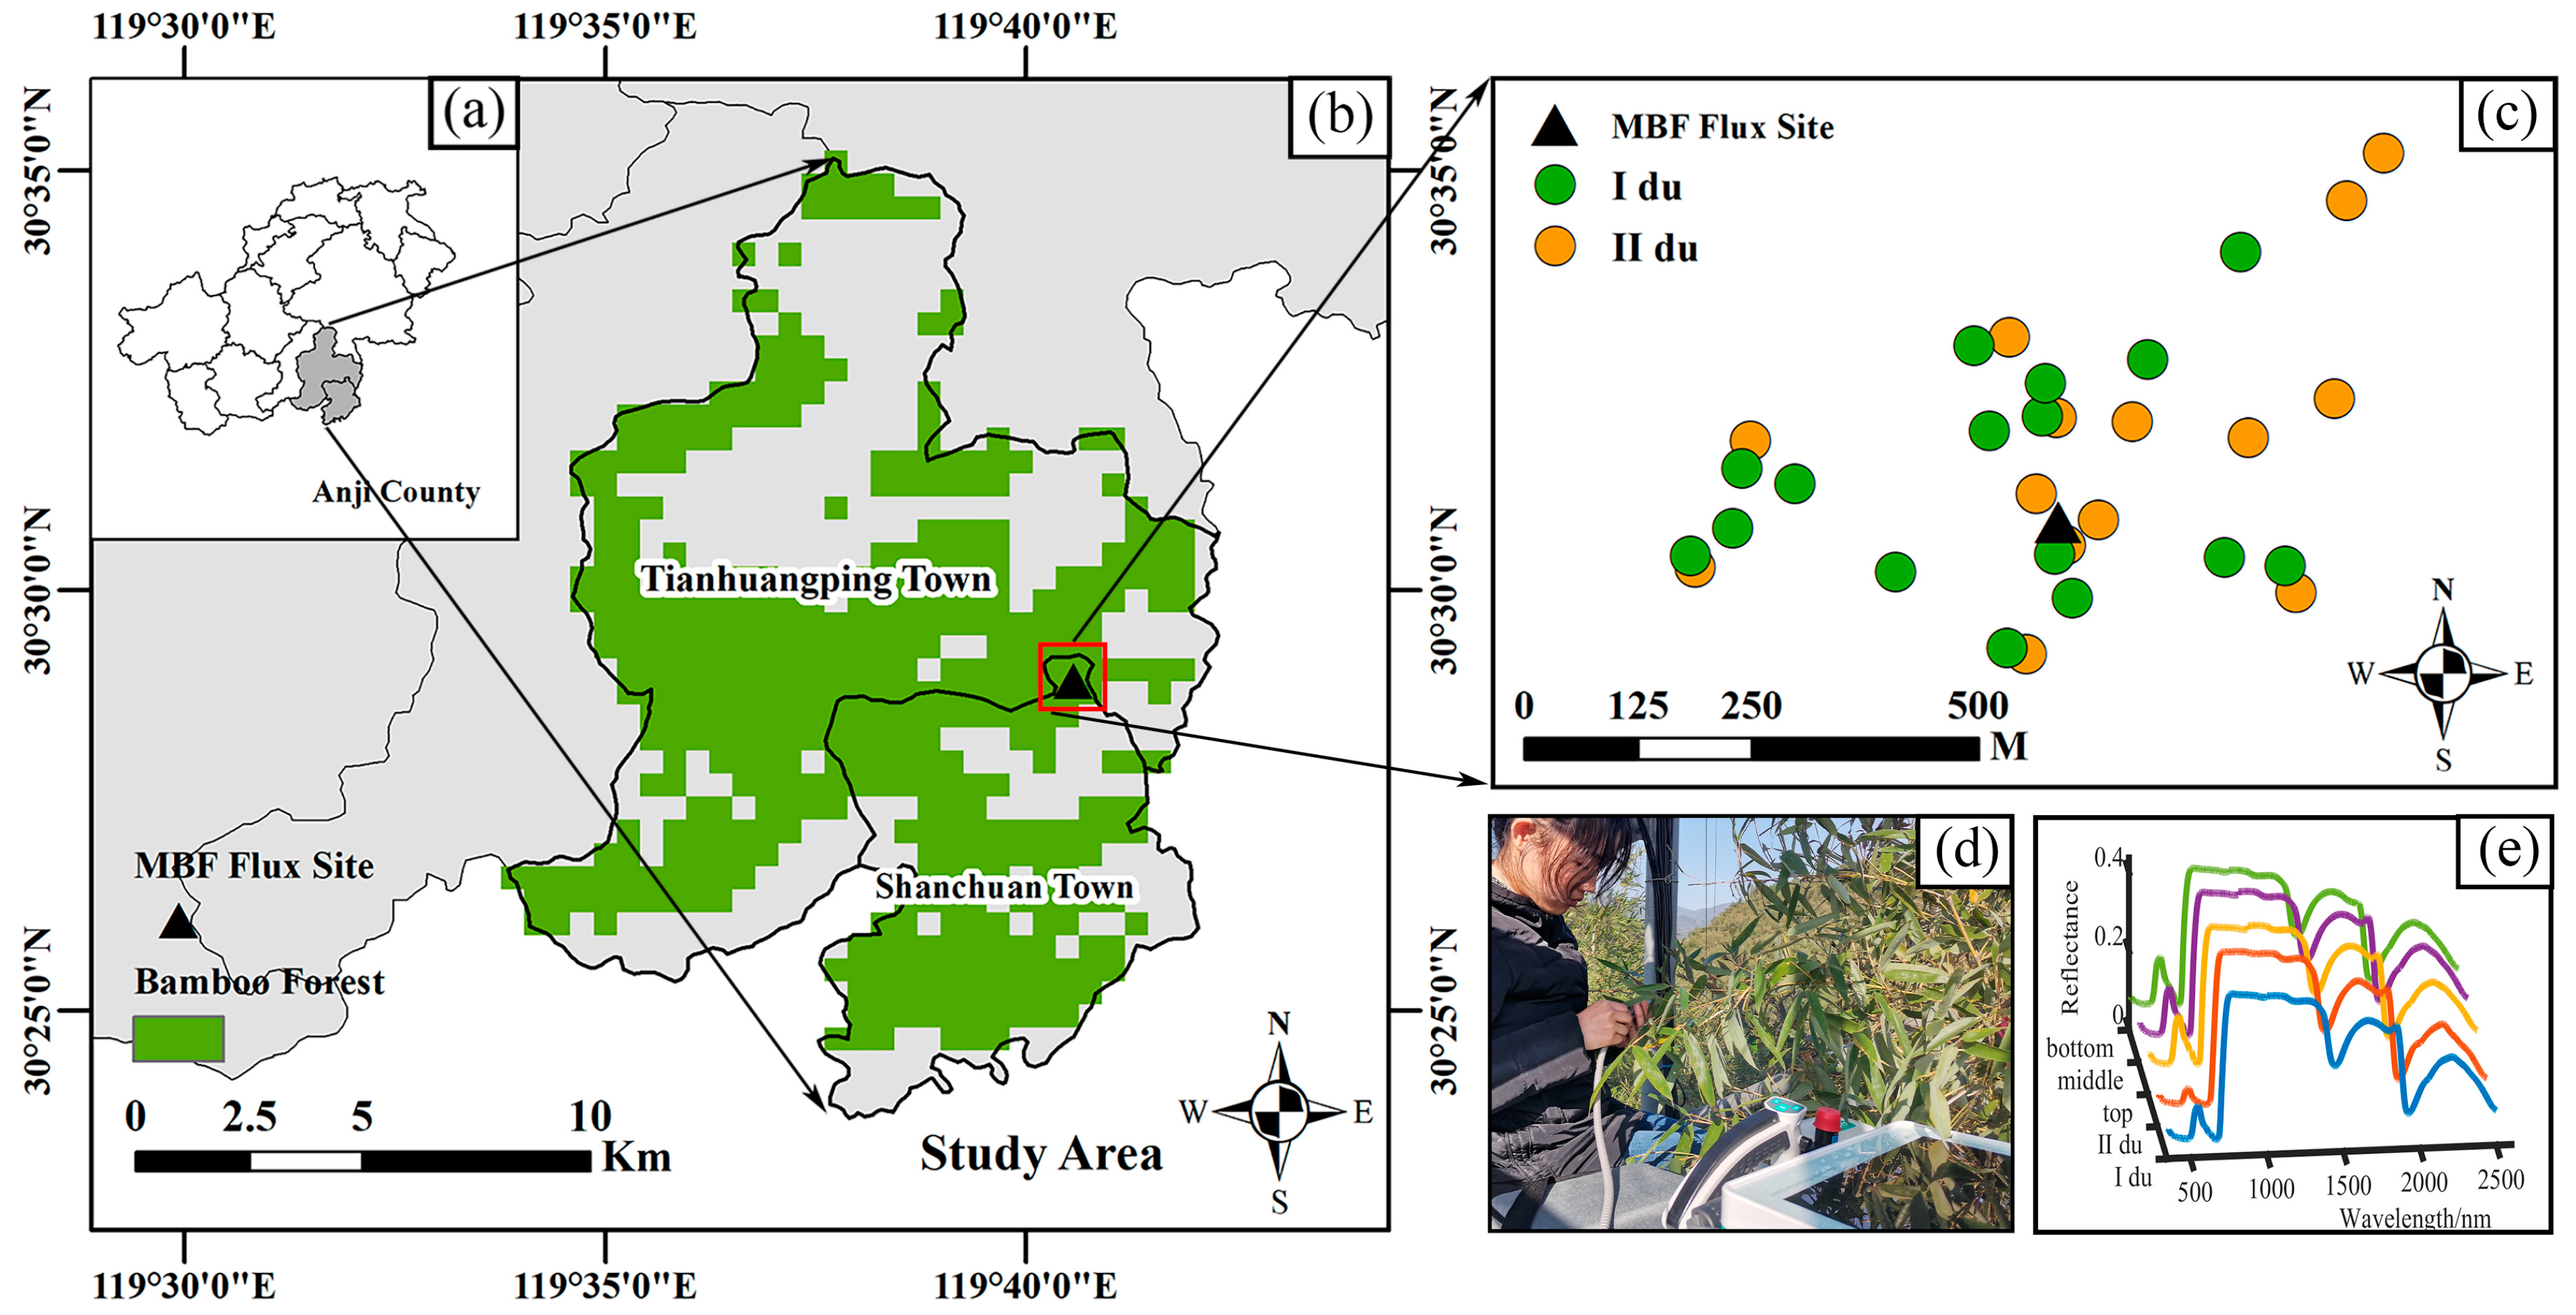
2.1. Study Area

As shown in Figure 1, the research area is located in the moso bamboo forest carbon sink research base in Shanchuan Township, Anji County, Huzhou city, Zhejiang Province, China. The area is located in the subtropical monsoon climate zone, with an altitude ranging from 500–1000 m, an average annual temperature of 14.7 °C, abundant precipitation and sufficient sunshine. Therefore, it is suitable for bamboo forest growth. There is a flux observation tower (119°40′E, 30°28′N) with a height of 40 m in the base. The main forest type within 1 km from the flux tower is pure moso bamboo forest, with a stand density of approximately 4500 plants/ha, mainly composed of I du bamboo and II du bamboo. The average diameter of bamboo at breast height is 9.3 cm, and canopy height ranges from 12–18 m, with a sparse understory of shrubs and herbs.

2.2. Measurement of the A–Ci Curve and Hyperspectral Reflectance of Moso Bamboo Leaves

In this study, from June to July 2021, seventeen I du bamboo plants and fifteen II du bamboo plants in good health were selected as sample bamboo plants within 1 km around the flux tower (Figure 1c). We selected at least two or more leaves from the top, middle and bottom canopy positions of each bamboo sample and recorded the age and canopy position of the bamboo in which each leaf sample was located. First, we measured the response curve of net photosynthetic rate ( A n ) to intercellular CO2 concentration ( C i ) using a Li-6800 portable photosynthesis system (Li-6800, Li-Cor, Lincoln, NE, USA), also known as the A–Ci curve. Immediately after, we measured the hyperspectral reflectance data of the leaf samples using an ASD FieldSpec Pro Spectroradiometer (ASD Inc., Boulder, CO, USA). After excluding data from failed measurements, we obtained a total of 95 leaf samples from I du moso bamboo (30 from the top canopy, 36 from the middle canopy and 29 from the bottom canopy) and 57 leaf samples from II du moso bamboo (19 from the top canopy, 18 from the middle canopy and 20 from the bottom canopy). During the measurement, sunny and cloudless weather conditions were chosen and continuously monitored from 8:30–11:00 a.m. and 14:00–17:30 p.m. every day (avoiding the “lunch break” period of leaves).

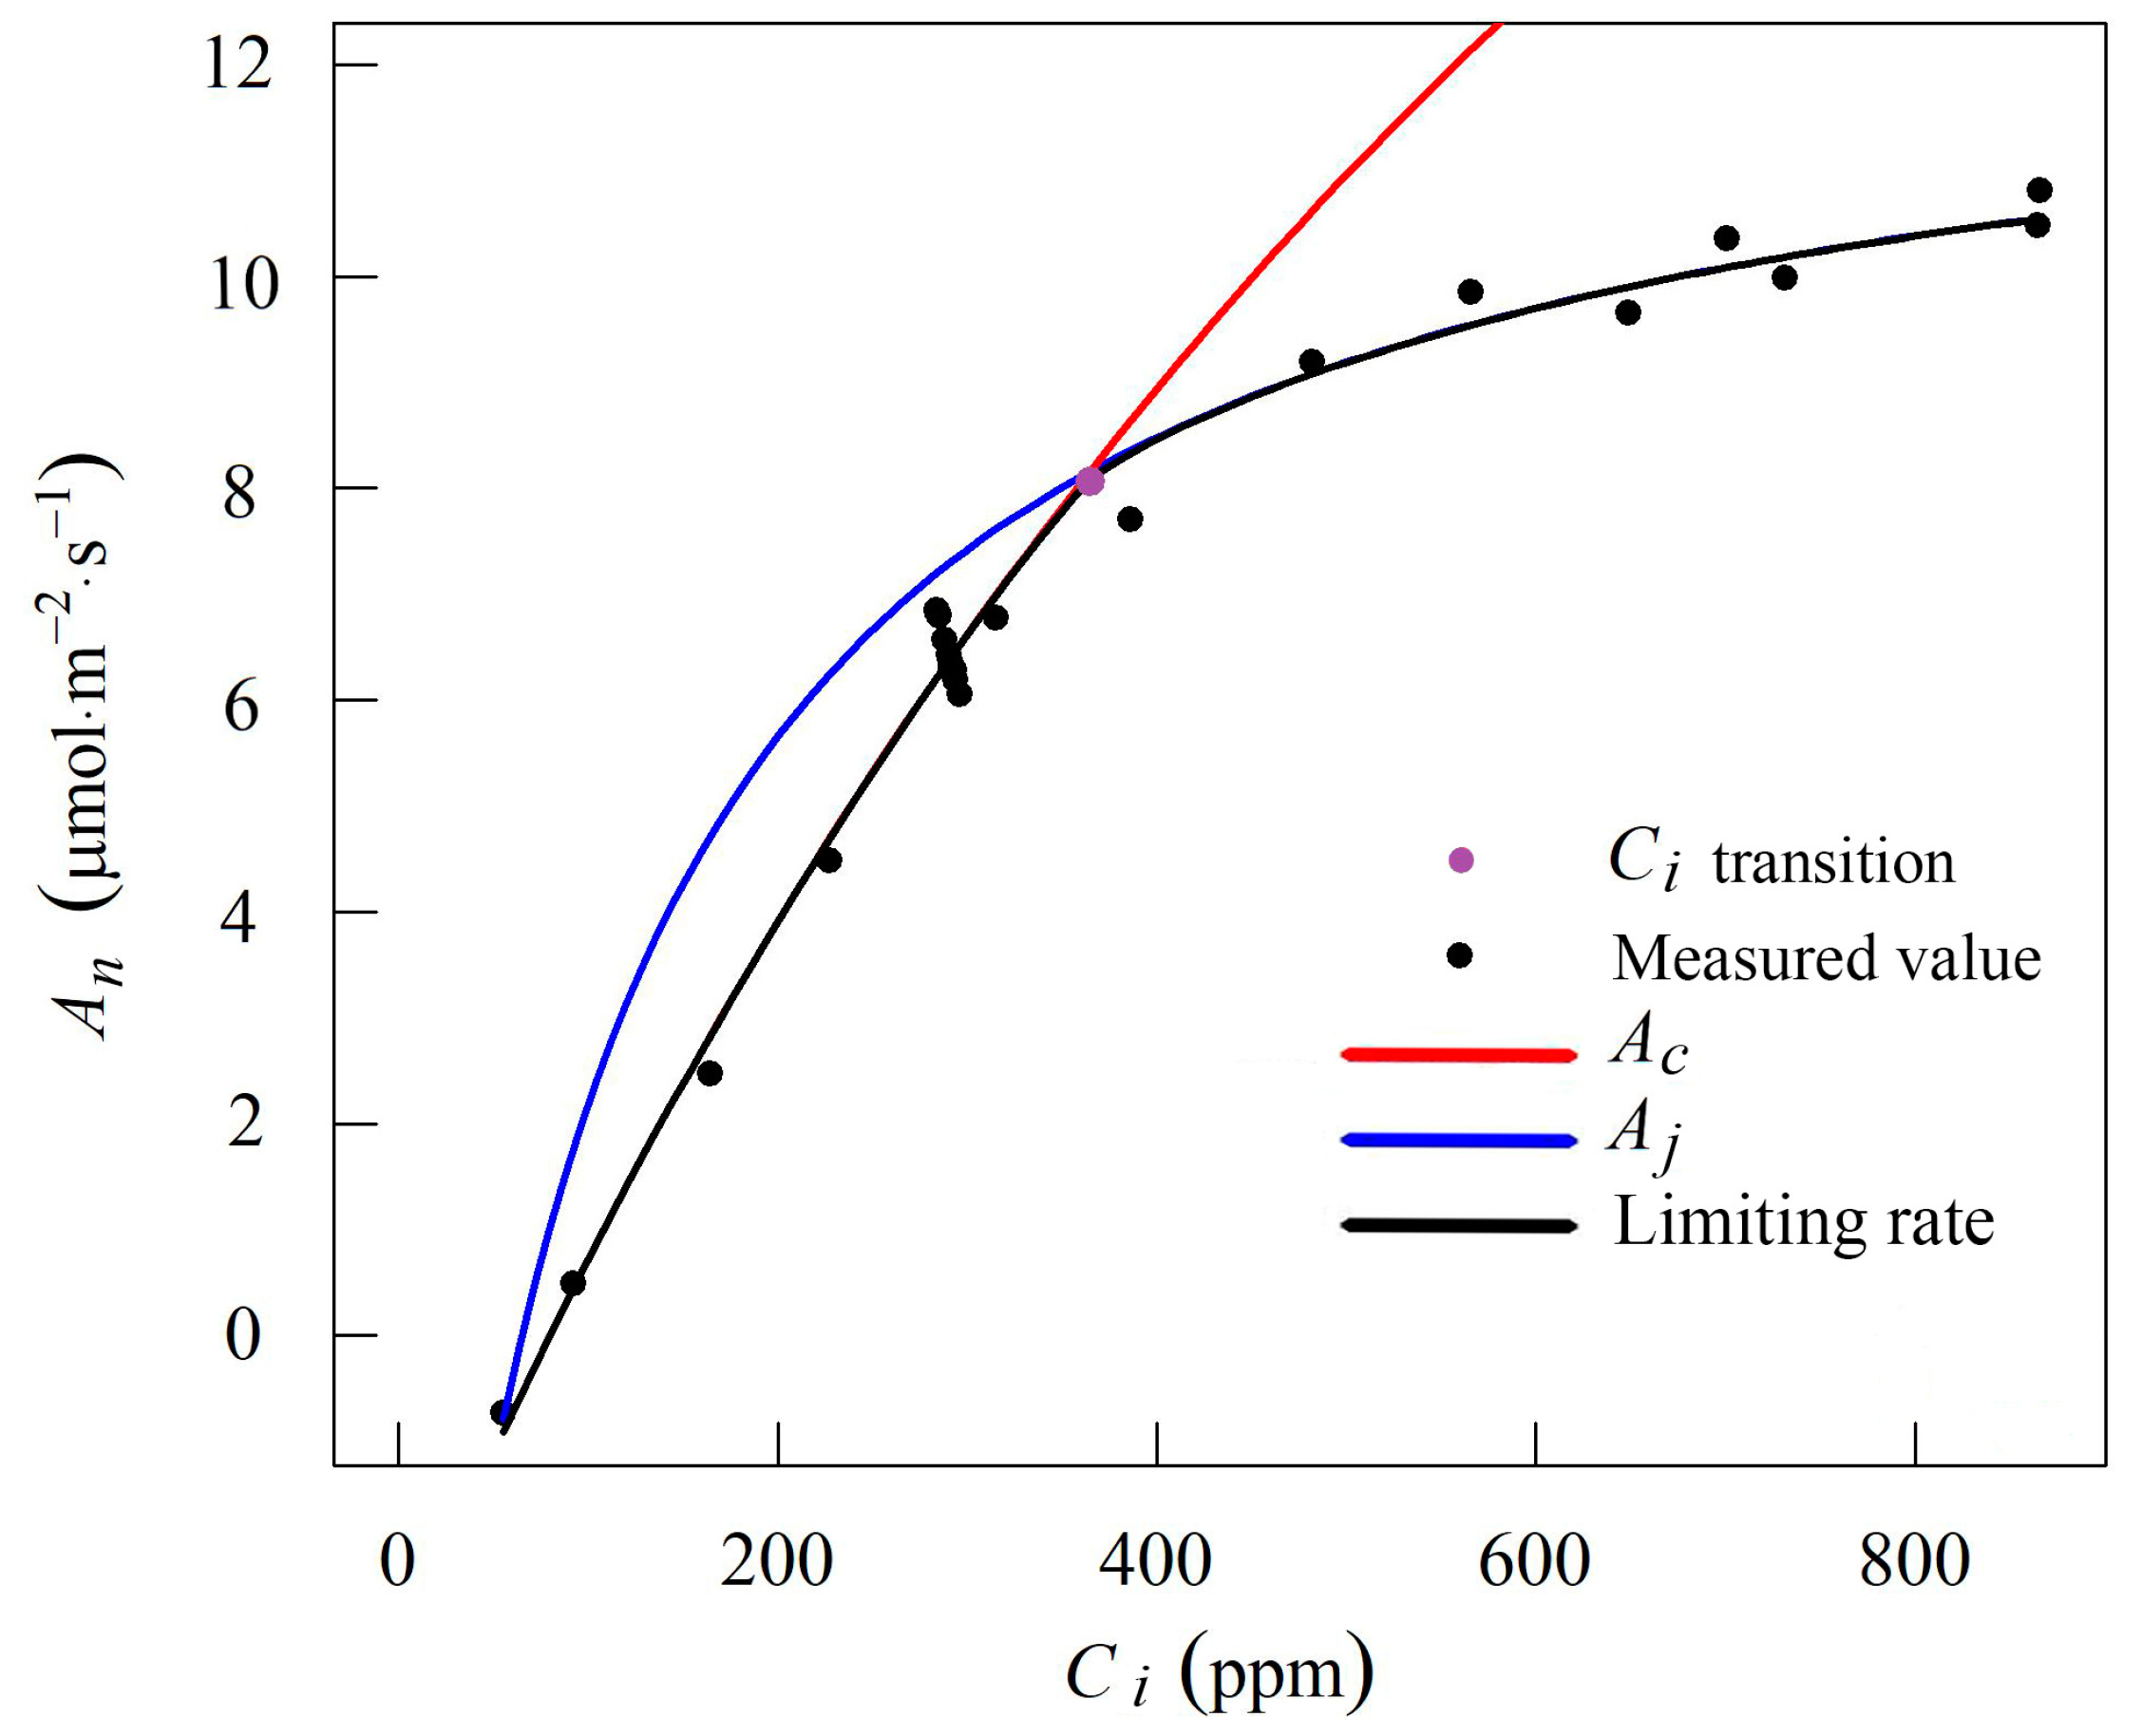
2.2.1. A–Ci Measurement

When fitting the A–Ci curve required for V25cmax calculation, the leaves should occur under saturated light conditions, but the saturation light intensity required for photosynthesis differs among different species [47]. Therefore, it is necessary to measure the light response curve in advance to determine the saturation light intensity of bamboo leaves. In this study, the photoresponse curves of one I du bamboo leaf and one II du bamboo leaf were used to determine the saturation light intensity value required for light induction by moso bamboo leaves. To ensure the effectiveness of this experiment, the CO2 concentration was set to 400 μ mol mol 1 , the temperature was 25 °C, and the leaves were exposed to light in a low-light environment for approximately 30 min using a 1400 μ mol m 2 s 1 light intensity before the measurement [48]. The light source was provided by the LED light of the Multiphase Flash TM Fluorometer, and the light intensity gradient was set to 2000, 1800, 1500, 1200, 1000, 800, 600, 400, 200, 150, 100, 50, 20 and 0 μ mol m 2 s 1 . Finally, the saturation light intensity of bamboo leaves was calculated as 1200 μ mol m 2 s 1 by correcting the rectangular hyperbolic model [49] and was used to determine the leaf A–Ci curve.
To obtain V25cmax, we used a Li-6800 device (with a temperature of 25 °C, a relative humidity of 50% and a light intensity of 1200 μ mol m 2 s 1 ) to measure A–Ci curves at the Rubisco-limited and RuBP-limited stages. Referring to the CO2 concentration gradient of Xingyun Liang [50], the CO2 concentration gradient was set as follows: 400, 300, 200, 100, 50, 400, 500, 600, 700, 800, 1000, 1200 and 1400 μ mol mol 1 . Each CO2 concentration was applied for 2–3 min, and the net photosynthetic rate was recorded after the value had stabilized. To ensure the validity of the measurement data, the minimum concentration in the leaf chamber was set to 50 μ mol mol 1 , and the residence time was short to prevent Rubisco inactivation.

2.2.2. Hyperspectral Reflectance Measurement

After A–Ci curve measurement of the bamboo leaves, the ASD portable field object spectrum analyzer was used to continue to measure the hyperspectral reflectance of the bamboo leaves. The measurement band range of the instrument is 350–2500 nm, the wavelength accuracy is ±1 nm, the spectral resolution in the 350–1000 nm band is 3 nm, and the spectral sampling interval is 1.4 nm. Moreover, the spectral resolution in the 1000–2500 nm band is 10 nm, and the spectral sampling interval is 2 nm. A standardized white BaSO4 panel (with 99% reflectance) was employed to calibrate the sensor before collecting the reflectance. The instrument is equipped with a built-in fiber optic light source to simulate sunlight, avoiding the influence of unstable external light sources. During the measurement, the spectral reflectance curves of 10 front surfaces of each leaf were repeatedly measured and then averaged as the actual measured spectral reflectance curve of the leaf.

2.3. V25cmax Calculation

On the basis of each A–Ci measurement curve, the FvCB model was used in this study to calculate V25cmax of the bamboo leaves. The FvCB model describes the response of photosynthetic parameters to CO2 under different environmental conditions, namely Rubisco enzyme activity-limited state, RuBP regeneration rate-limited state, TPU triose phosphate transport-limited stage, Rubisco-RuBP co-limited phase and RuBP-TUP co-limited phase [1,50]. When fitting the A–Ci curve, it is necessary to accurately estimate physiological and biochemical parameters such as V25cmax and photorespiration rate ( R d ) by evaluating the distribution at the different restriction stages. The specific process is as follows:
First, the net photosynthetic rate ( A n = A c ) at the carboxylase enzyme (Rubisco) activity-limited stage was fitted. When the intercellular CO2 concentration is low and the RuBP substrate is sufficient, the activity and quantity of the Rubisco enzyme become the main limiting factors of the net photosynthetic rate. The net photosynthetic rate A c at this stage can be calculated with Equation (1).
A c = V 25 c m a x C i Γ * C i + K c 1 + O i / K o R d ,
where V25cmax is the maximum carboxylation rate standardized to 25 °C, C i is the intercellular CO2 concentration, Γ * is the CO2 compensation point, R d is the respiration rate under light, K c = 27.24   P a is the Michaelis constant of the carboxylation reaction, K o = 16.58   k P a is the Michaelis constant of the oxidation reaction, and O i = 21   k P a is the oxygen partial pressure of the chloroplast carboxylation sites. The parameters used were standardized to 25 °C by the Arrhenius equation [51].
Second, the net photosynthetic rate ( A n = A j ) at the RuBP regeneration rate-limited stage was fitted. With the gradual increase in the intercellular CO2 concentration, the regeneration rate of substrate RuBP becomes lower than the consumption rate, limiting the photosynthetic rate. The net photosynthetic rate A j at this stage can be obtained with Equation (2).
A j = J m a x C i Γ * 4 C i + 8 Γ * R d ,
where Jmax is the maximum electron transfer rate, C i is the intercellular CO2 concentration, Γ * is the CO2 compensation point, and R d is the respiration rate under light. The light and parameters used were normalized to 25 °C by the Arrhenius equation.
Third, the A–Ci fitting curve and V25cmax were determined. The method of enumerate segmentation coupled with simultaneous comprehensive fitting of Gu [52] was adopted. First, the distributions at the Rubisco enzyme activity-limited stage and the RuBP regeneration rate-limited stage were enumerated by the linear fitting method. Second, the most suitable point ( C i transition in Figure 2) for fitting all data retrieved from all possible restricted state distributions was selected as the transition point between the two stages. The minimum distribution cost function of the A–Ci fitting curve determined by this transition point was the minimum of all distributions.
Finally, the V25cmax value corresponding to the best A–Ci fitting curve was determined as the final V25cmax calculation result. The example of the A–Ci fitting curve was shown in Figure 2. The specific operations were all performed using the R package “plantecophys” developed by Duursma [53].

2.4. Hyperspectral Vegetation Index

2.4.1. Hyperspectral Vegetation Index Calculation

The HVI of vegetation leaves is closely related to their nitrogen content, chlorophyll content and specific leaf weight. Therefore, we combined the spectral characteristics of moso bamboo leaves in this study, referred to related studies at home and abroad, and finally established three types of HVIs characterizing the leaf nitrogen content, leaf chlorophyll content and leaf specific gravity for V25cmax inversion, as summarized in Table 1.

2.4.2. Evaluation of the Correlation between HVI and V25cmax

In this study, the closeness of the relationship between V25cmax and HVI was evaluated by calculating the absolute value of the Pearson correlation coefficient (|r|) between them. Generally, correlation analysis is a statistical method that helps to define any dependency between variables. In this study, two variables with an absolute correlation coefficient below 0.3 are considered to have no correlation. Its results can be interpreted using the Chaddock scale (Table 2) [73].

2.5. Wavelet Transform and Wavelet Vegetation Index

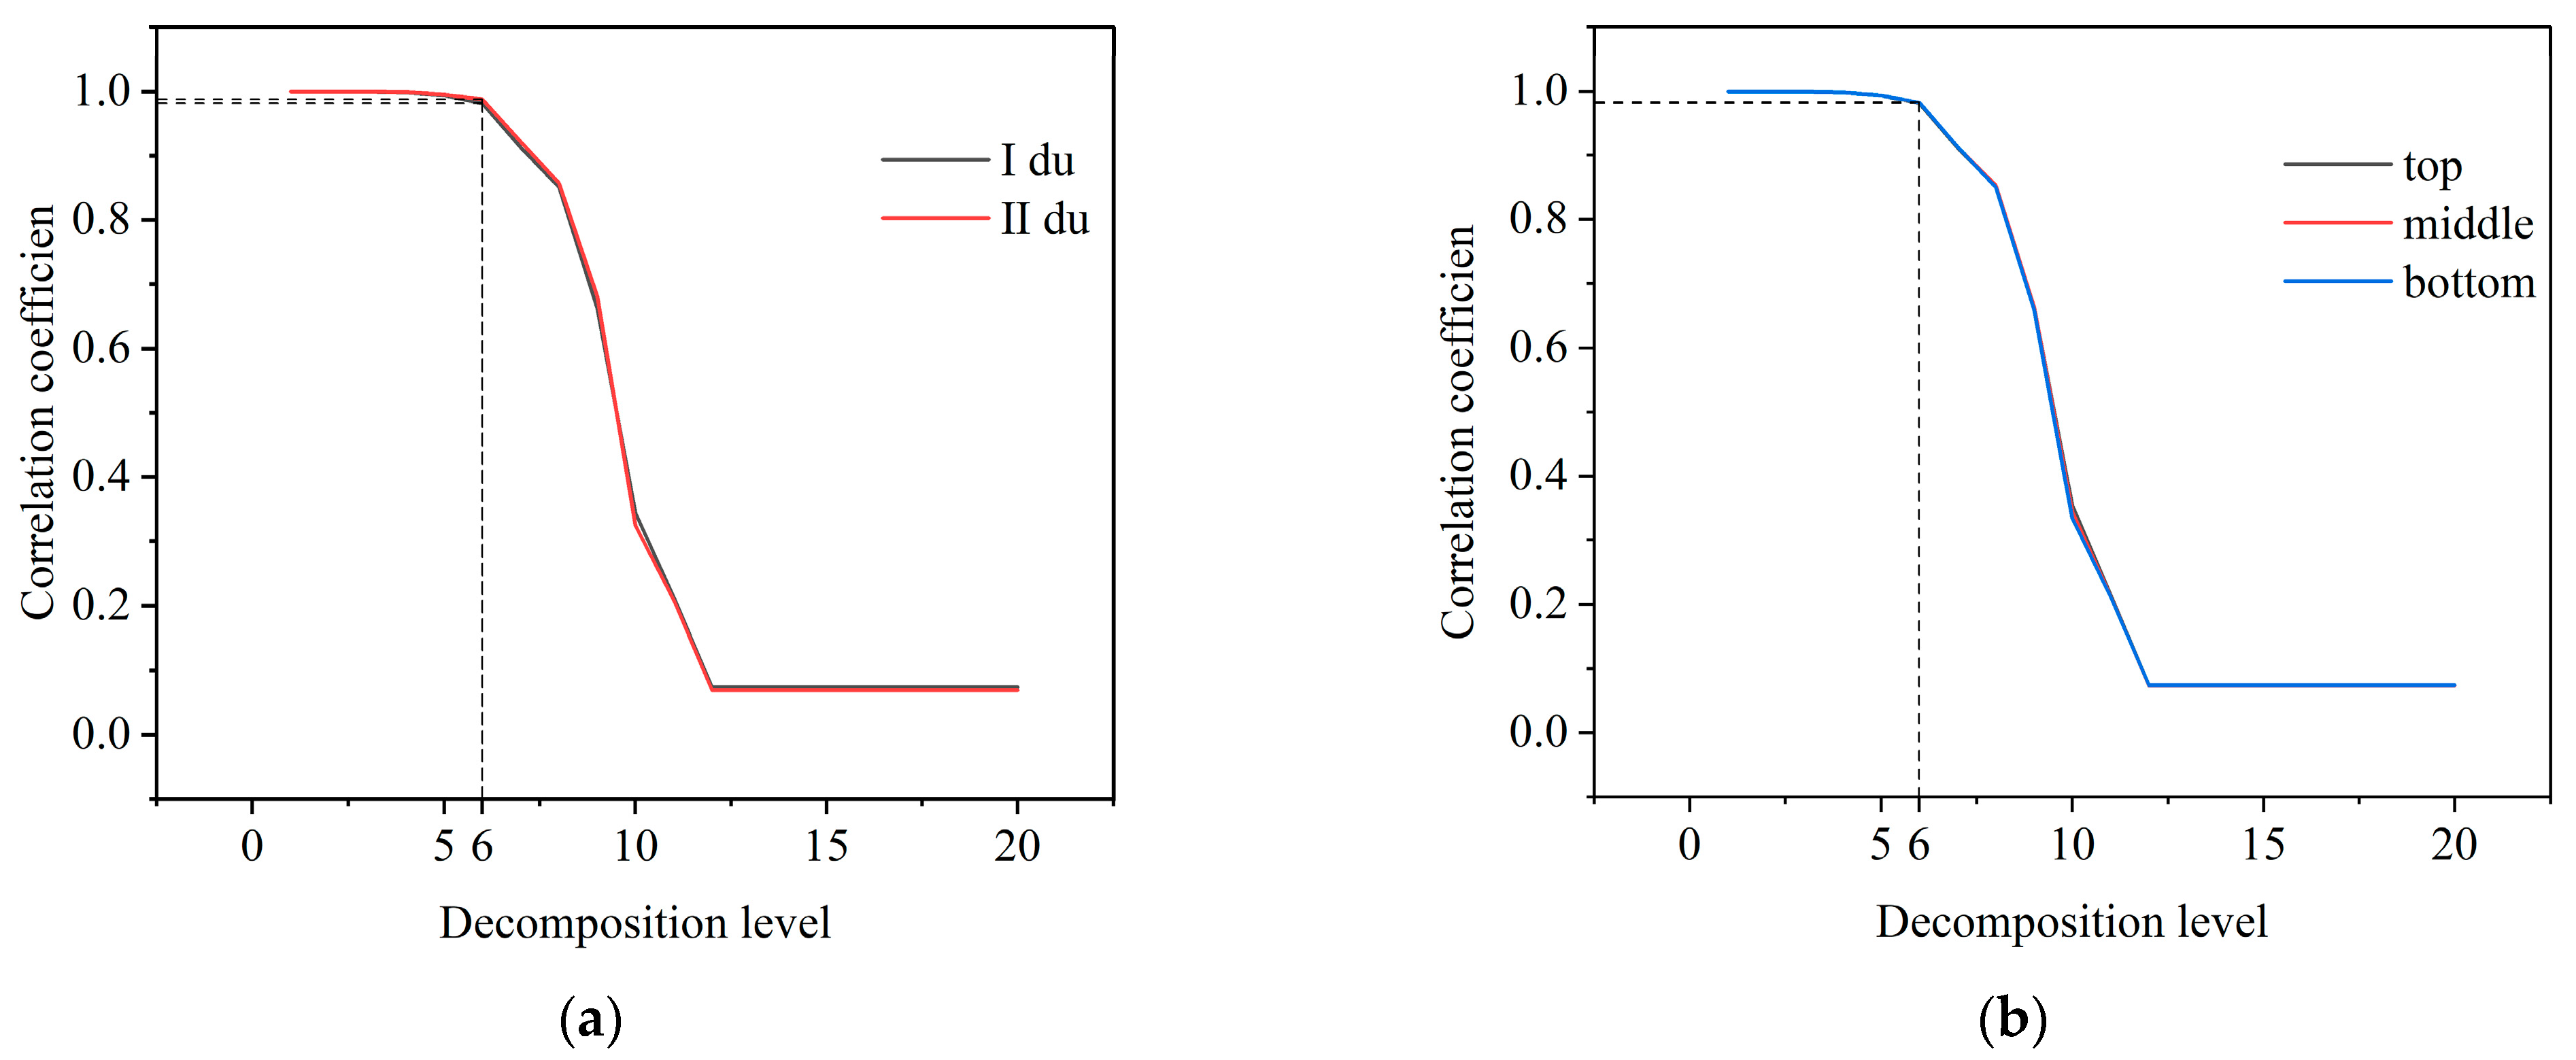
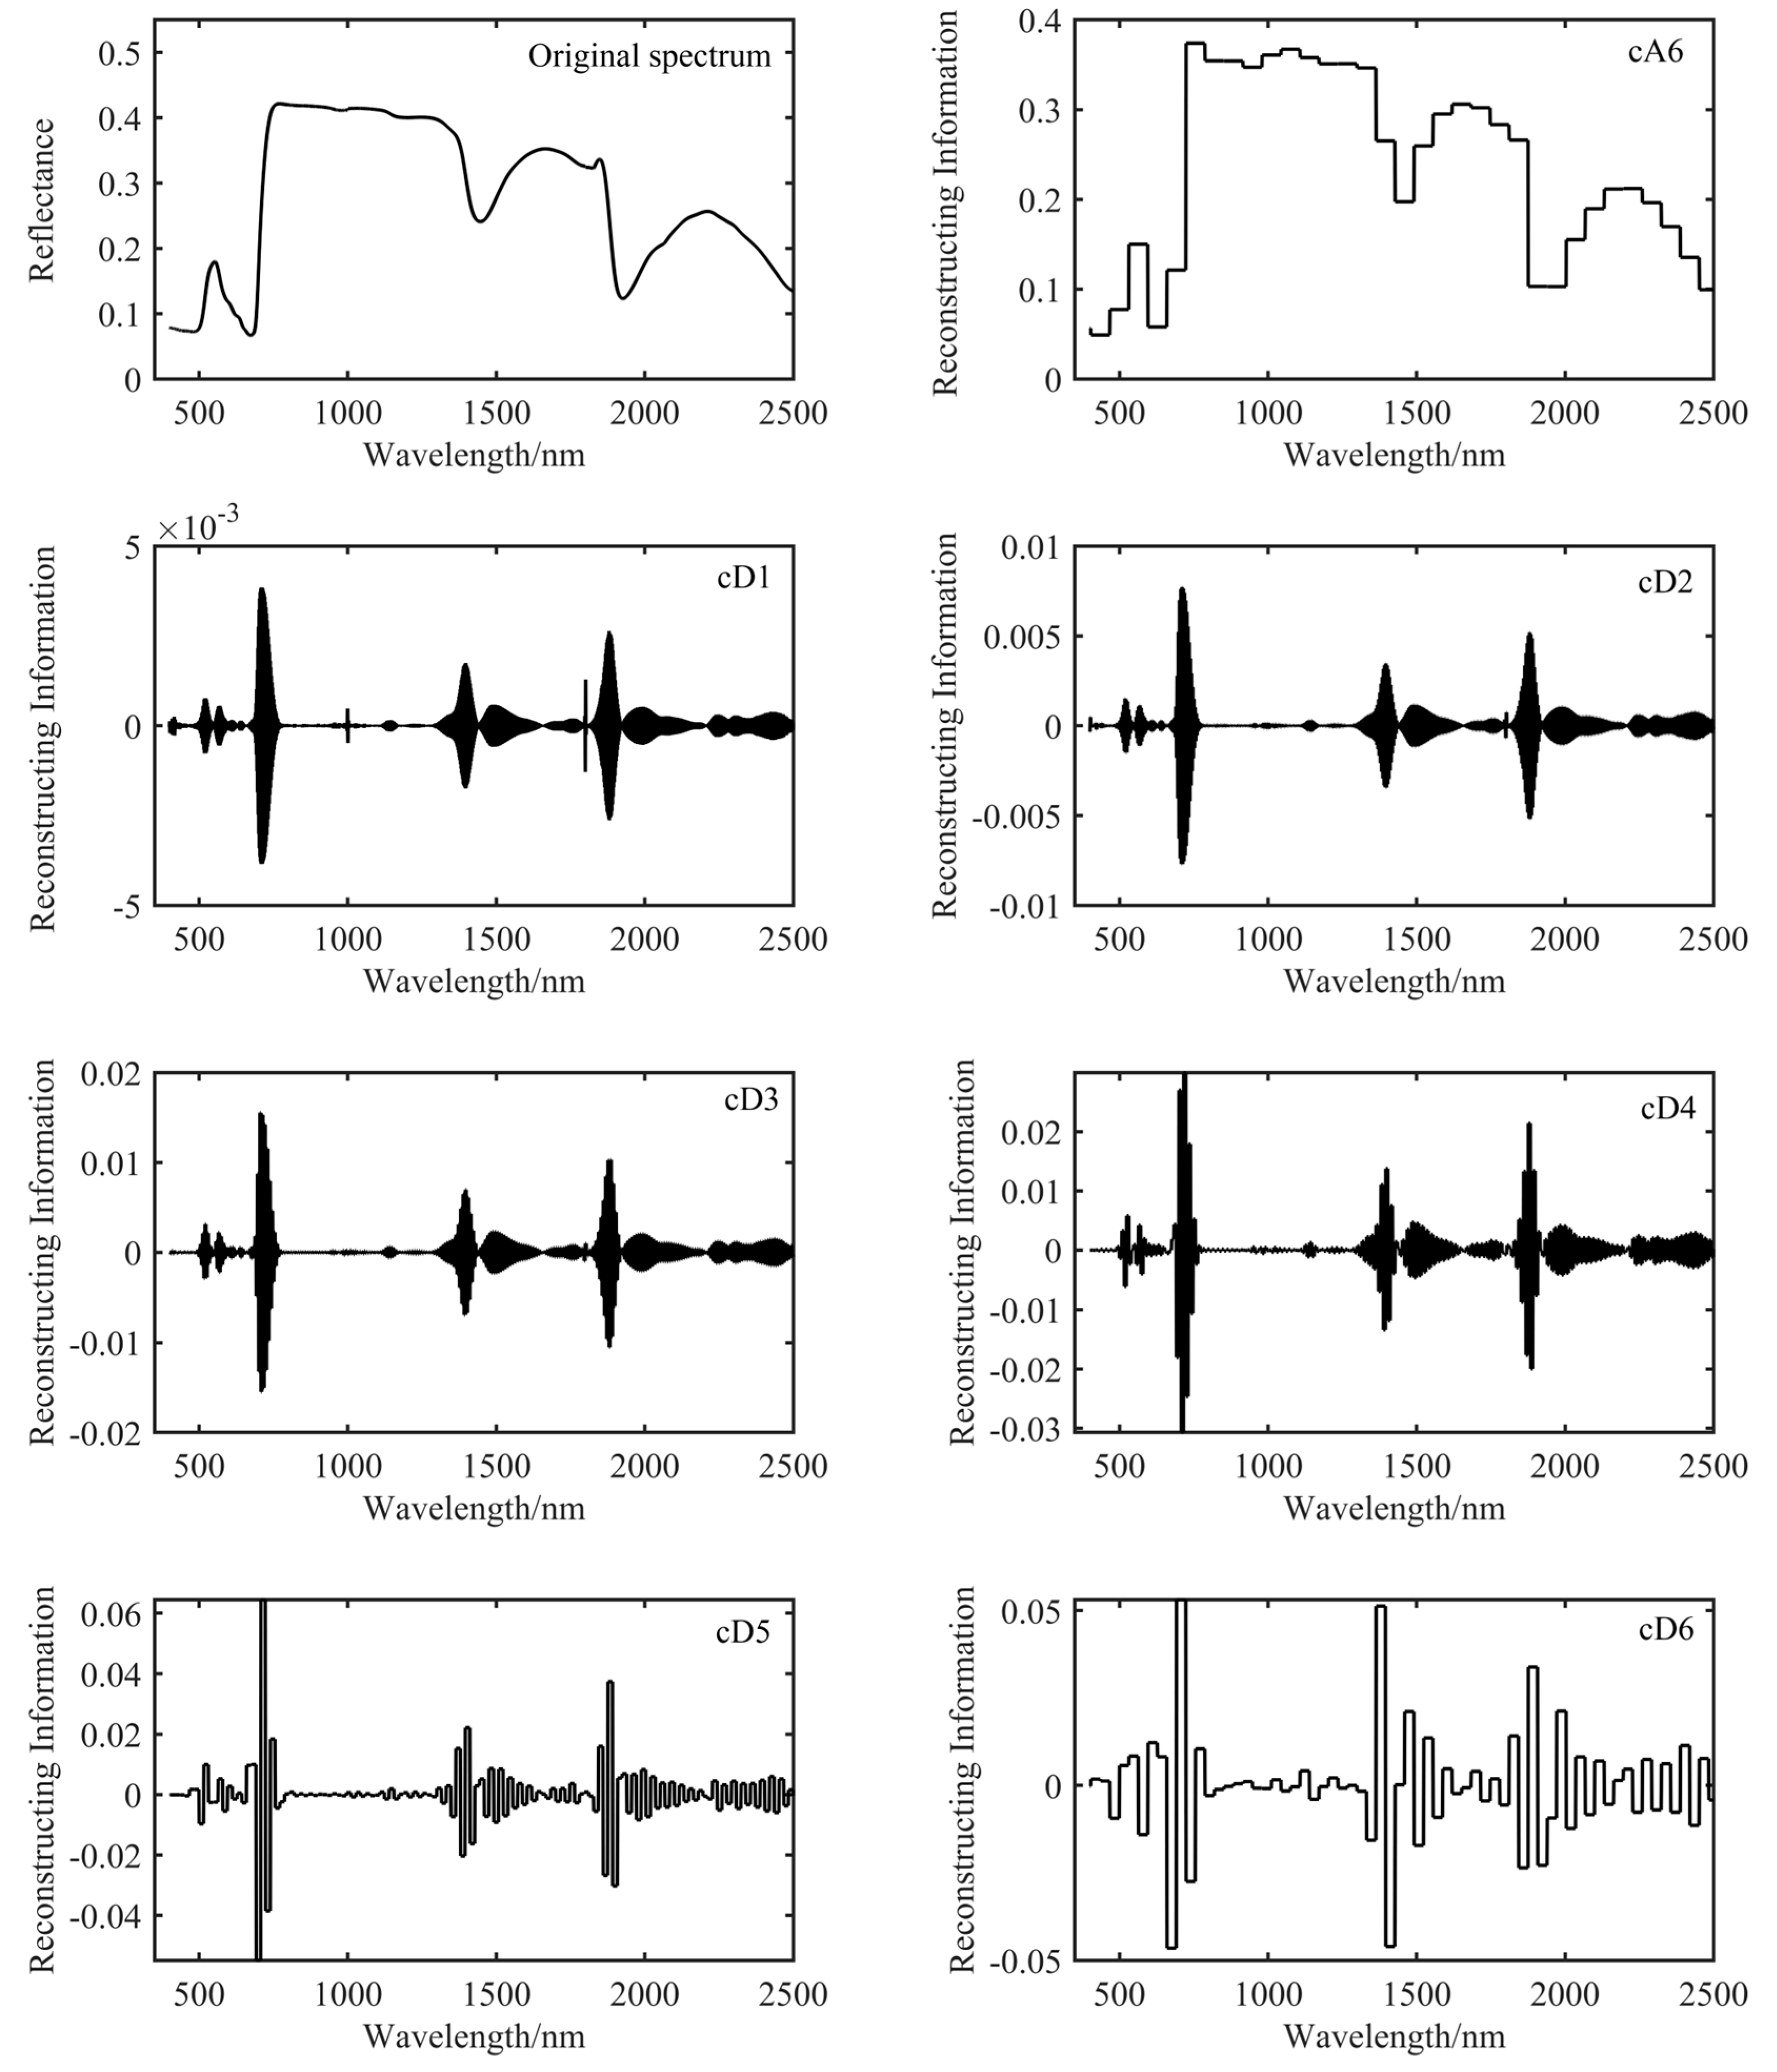
2.5.1. Wavelet Transform and Decomposition Level Selection of Hyperspectral Data

In this study, a DWT was used to decompose the original hyperspectral data of the moso bamboo leaves into coarse-scale approximation coefficients (cA) and fine-scale detail coefficients (cD). cA captures the overall situation of the original spectrum, reflecting the main trend in the original spectrum, while cD provides detailed information of the original spectrum. To maintain cA and cD in the same dimension as the original spectral data, we reconstructed the coefficient vector by upsampling and filtering. Figure 3 shows a schematic diagram of the three-layer DWT decomposition process. Through decomposition, the original spectral data S can be divided into a low-frequency coefficient component cA3 and three high-frequency coefficient components cD3, cD2 and cD1. After wavelet decomposition, the energy feature vector of the original signal can be obtained by calculating the energy information of each node, which can reflect the energy distribution of the signal on different scales [15].
DWT basis functions include the Haar wavelet, bior wavelet system, Daubechies wavelet system, symlets wavelet system, coiflets wavelet system and many other wavelets. Considering the advantages of the bior1.5 wavelet in signal decomposition and the determination of surface vegetation biochemical parameters [15], we chose this wavelet as the basis function to apply DWT treatment to the hyperspectral reflectance of the bamboo leaves in the study area, and the optimal number of wavelet decomposition layers was determined by the correlation coefficient between the low-frequency component cA of each layer and the original spectrum, as proposed by Kaewpijit [73].

2.5.2. Construction and Screening of the Wavelet Vegetation Index

In this study, the spectral vegetation index constructed by the wavelet-reconstructed spectral bands was referred to as the WVI, which mainly includes the difference wavelet vegetation index w D V I i , j , the simple ratio wavelet vegetation index w S R i , j and the normalized row wavelet vegetation index w N D V I i , j . First, the correlation between the WVI and V25cmax was calculated for each band combination in the reconstructed component of each level. Second, the best band combination corresponding to this WVI was determined according to the principle of the maximum absolute value of the correlation. Accordingly, the optimal WVI for each type was determined and used for V25cmax inversion model construction. The three WVI types can be calculated as follows:
w D V I i , j = w R i w R j
w S R i , j = w R i w R j
w N D V I i , j = w R i w R j w R i + w R j
where w R i and w R j are the reflectivity values at wavelengths i and j (nm), respectively, in the reconstructed spectrum.

2.6. Construction of the V25cmax Inversion Model Based on the PLSR Model

The PLSR model can reduce the dimensionality of data by compressing a large number of colinear variables into a few orthogonal principal components to avoid high covariance among multiple variables. It can achieve a better predictive performance than, for example, stepwise regression or principal component regression methods, and this method is therefore widely used in hyperspectral inversion of vegetation biochemical parameters [22,25,74].
The HVI, WVI and HVI + WVI were normalized as input features, and an inversion model based on the V25cmax of moso bamboo leaves was developed using the PLSR model. In this study, during PLSR model construction, the sample pair was randomly divided into training and testing data sets at a ratio of 7:3, and this process was repeated 50 times to evaluate the generalization performance of the inversion model. In the model training and testing phase, we employed the coefficient of determination (R2) and root mean square error (RMSE), as determined with Equations (6) and (7), respectively, to evaluate the model accuracy.
R 2 = 1 i = 1 n y i * y i 2 i = 1 n y i y 2 ,
R M S E = 1 n i = 1 n y i * y i 2 ,
where n is the number of samples, y i is the measured value of the i-th sample V25cmax, y i * is the estimated value of the i-th sample V25cmax, and y is the average value of the measured V25cmax values.

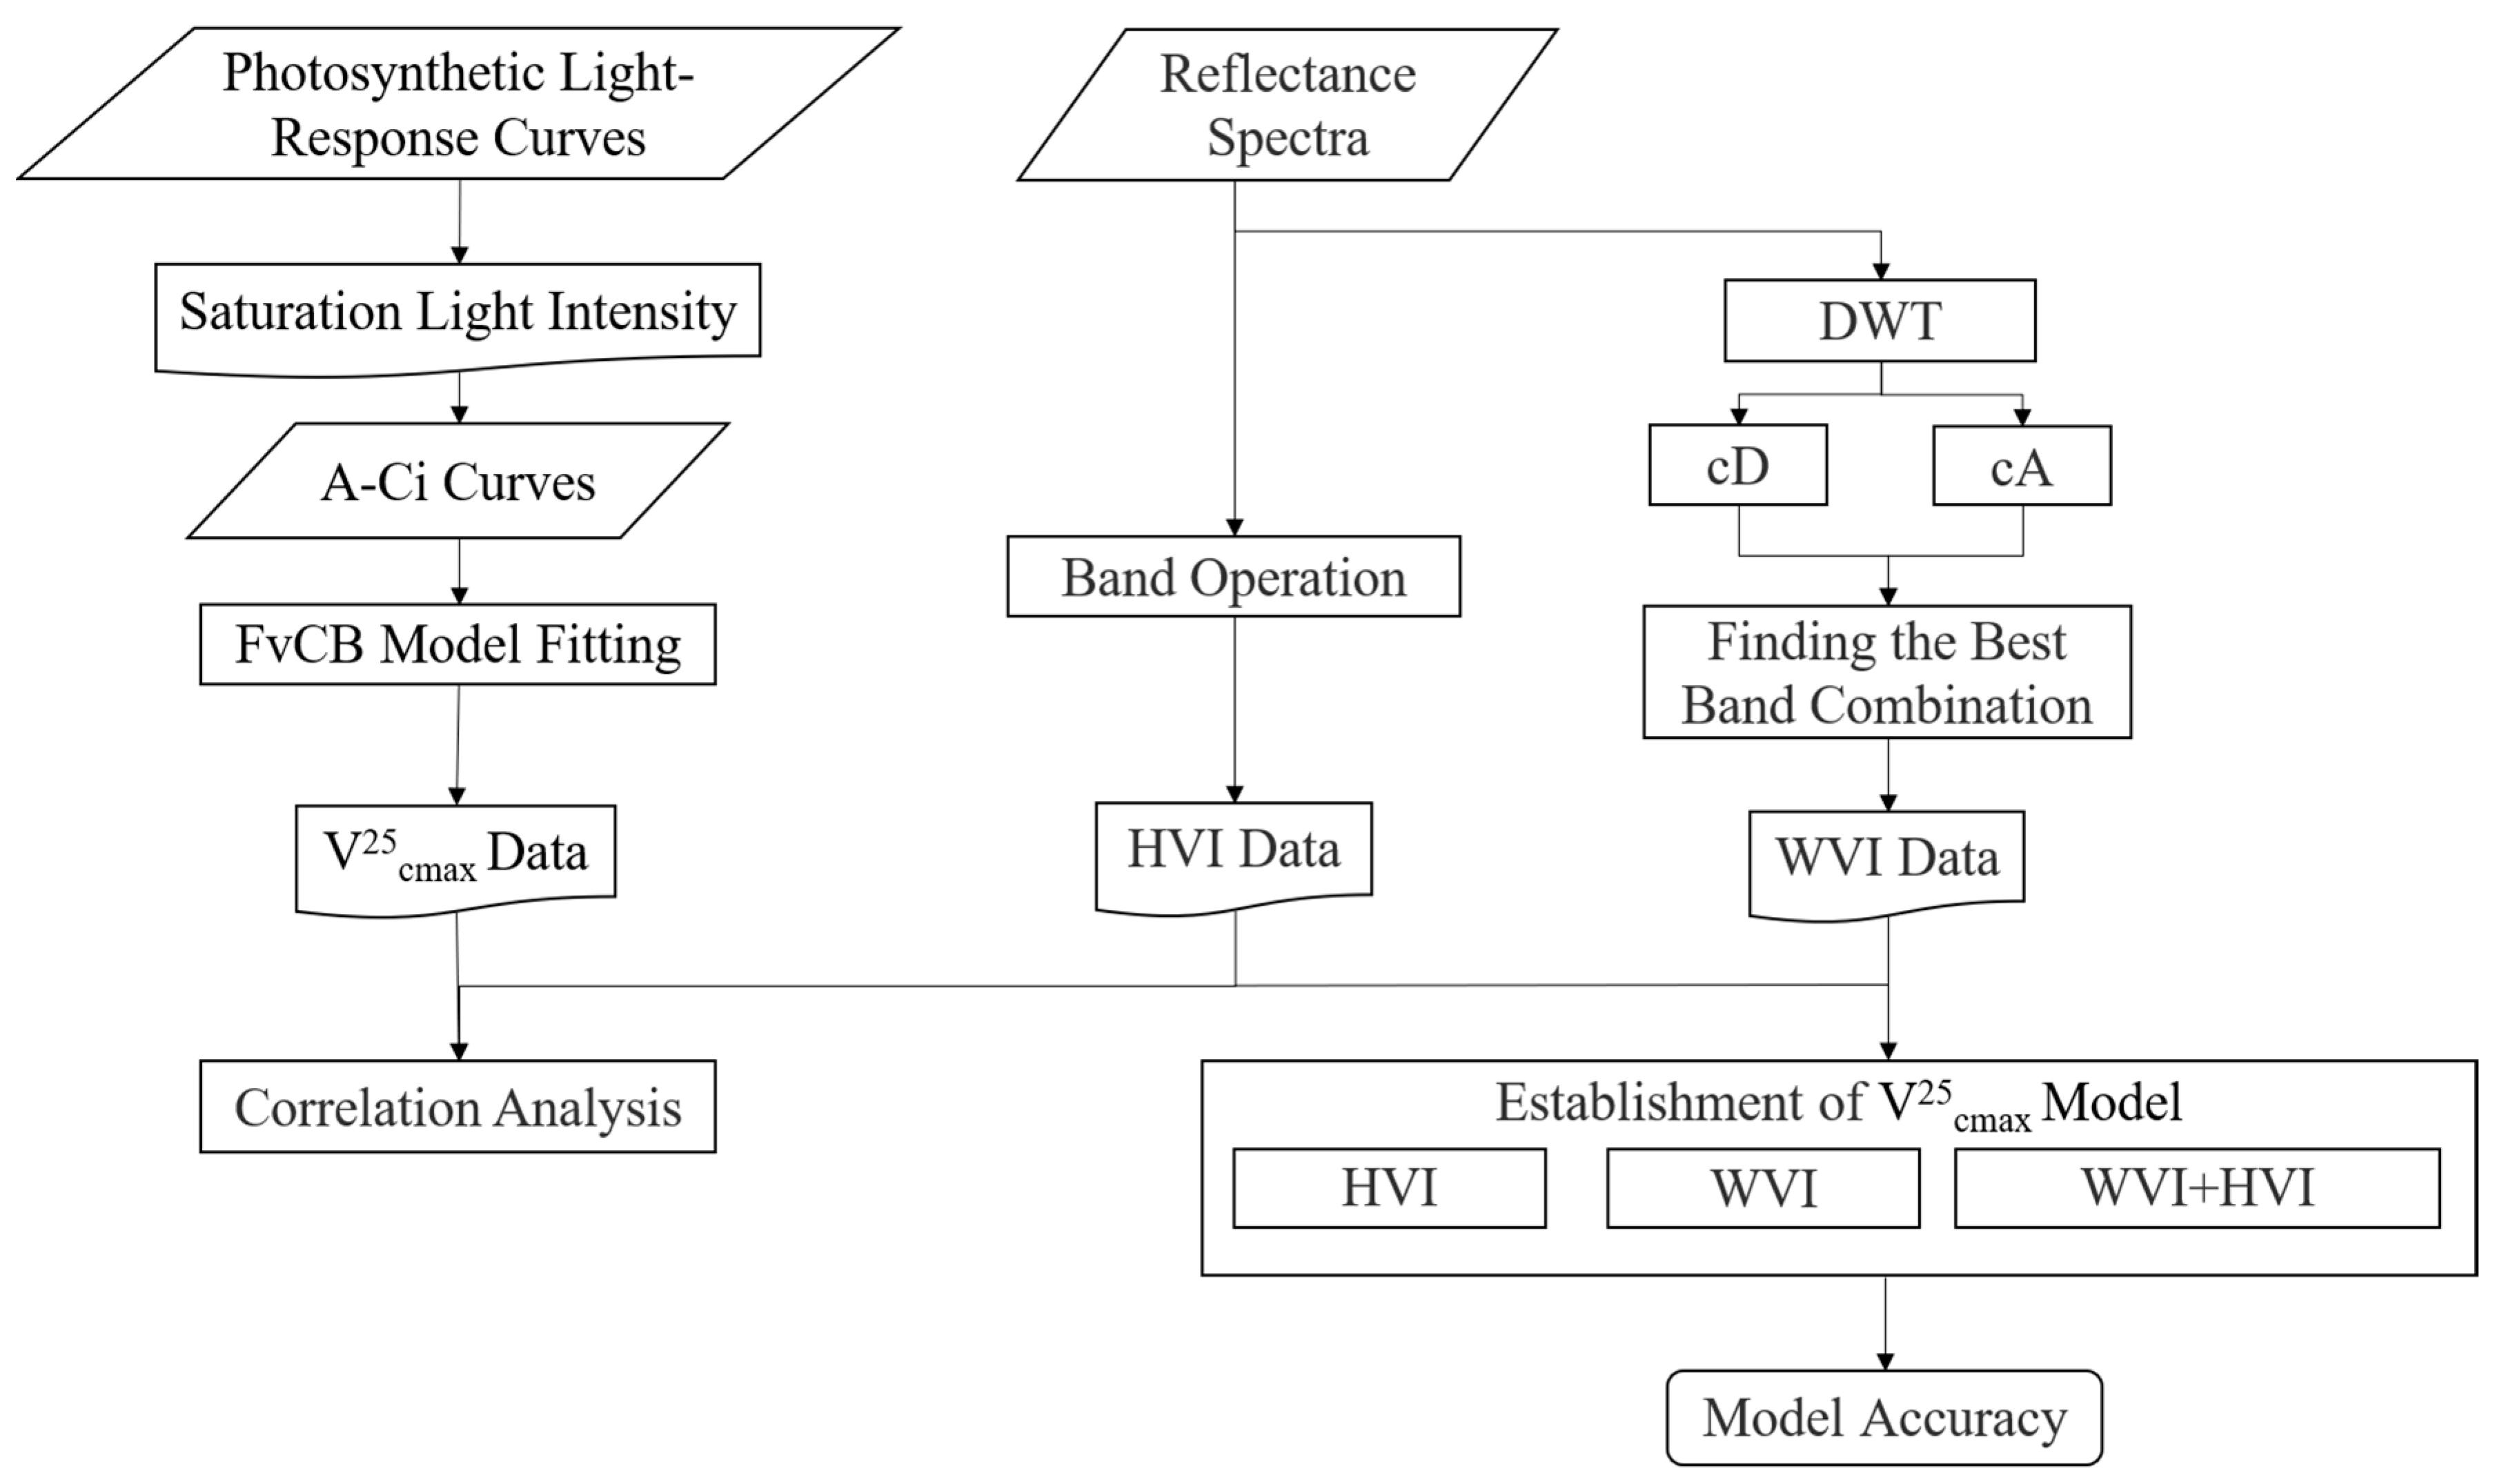
2.7. The Summary Scheme of Study

The summary scheme of this study is shown in Figure 4. Firstly, we obtained saturated light intensity through the light response curves and measured V25cmax data through A–Ci curves. Then, we obtained HVI data by performing band operation using hyperspectral data. At the same time, we used the DWT to process hyperspectral data to obtain cA and cD and then obtained WVI data by selecting the optimal combination of these components. Finally, we conducted a correlation analysis between V25cmax and HVI, WVI, respectively. We also used HVI, WVI, HVI + WVI as input features to establish an inversion model using the PLSR method, which demonstrated the effectiveness of the WVI in improving inversion accuracy.

3. Results and Analysis

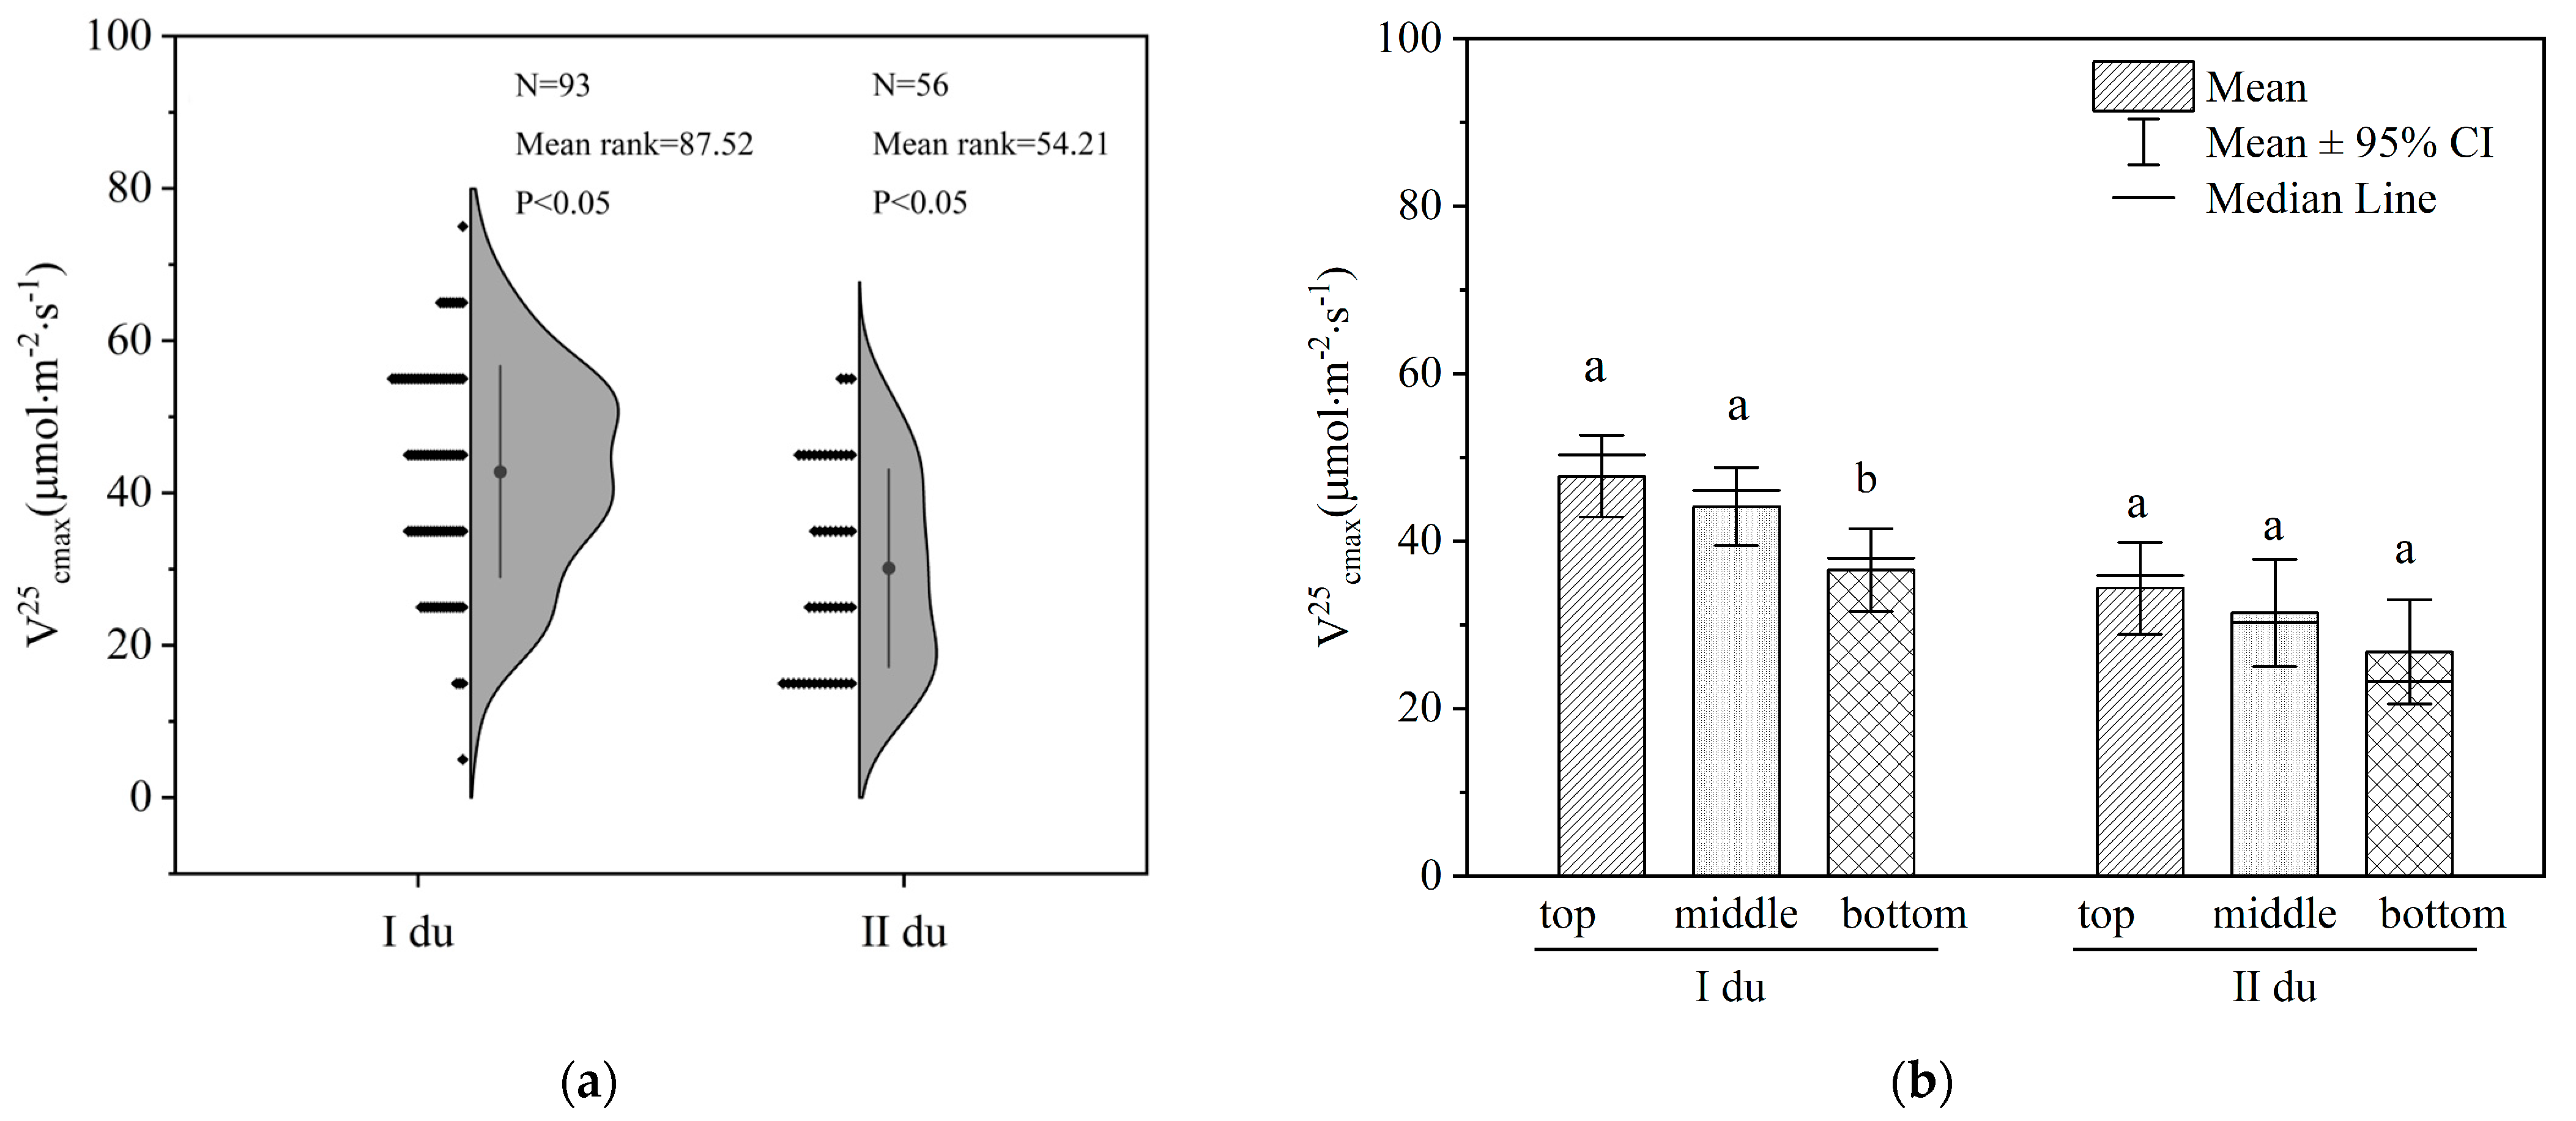
3.1. V25cmax Analysis of Moso Bamboo Leaves at the Different Ages and Canopy Positions

Figure 5a shows the Mann–Whitney test results of the V25cmax differences between the I du and II du moso bamboo leaves. The results showed that the mean rank (87.52) of V25cmax of the I du moso bamboo leaves is higher than the mean rank (54.21) of V25cmax of the II du moso bamboo leaves, and there was a significant difference. Figure 5b shows the V25cmax statistical results of the I du and II du moso bamboo leaves at the different canopy positions. Due to the small sample size and unknown type of data distribution of V25cmax measurements for the three canopy positions, we used the Kruskal–Wallis test for statistical analysis. All the results are summarized in Figure 5b with letter notation to indicate significant differences. The results indicated that the V25cmax of the I du and II du moso bamboo leaves gradually decreased from the top layer to the bottom layer of the canopy, but there was no significant difference in the V25cmax of the II du moso bamboo leaves between the different canopy positions. In regard to the I du moso bamboo, there was a significant V25cmax difference between the leaves at the top and middle positions and those at the bottom position (p < 0.05), but there was no significant difference between the leaves at the top and middle positions.

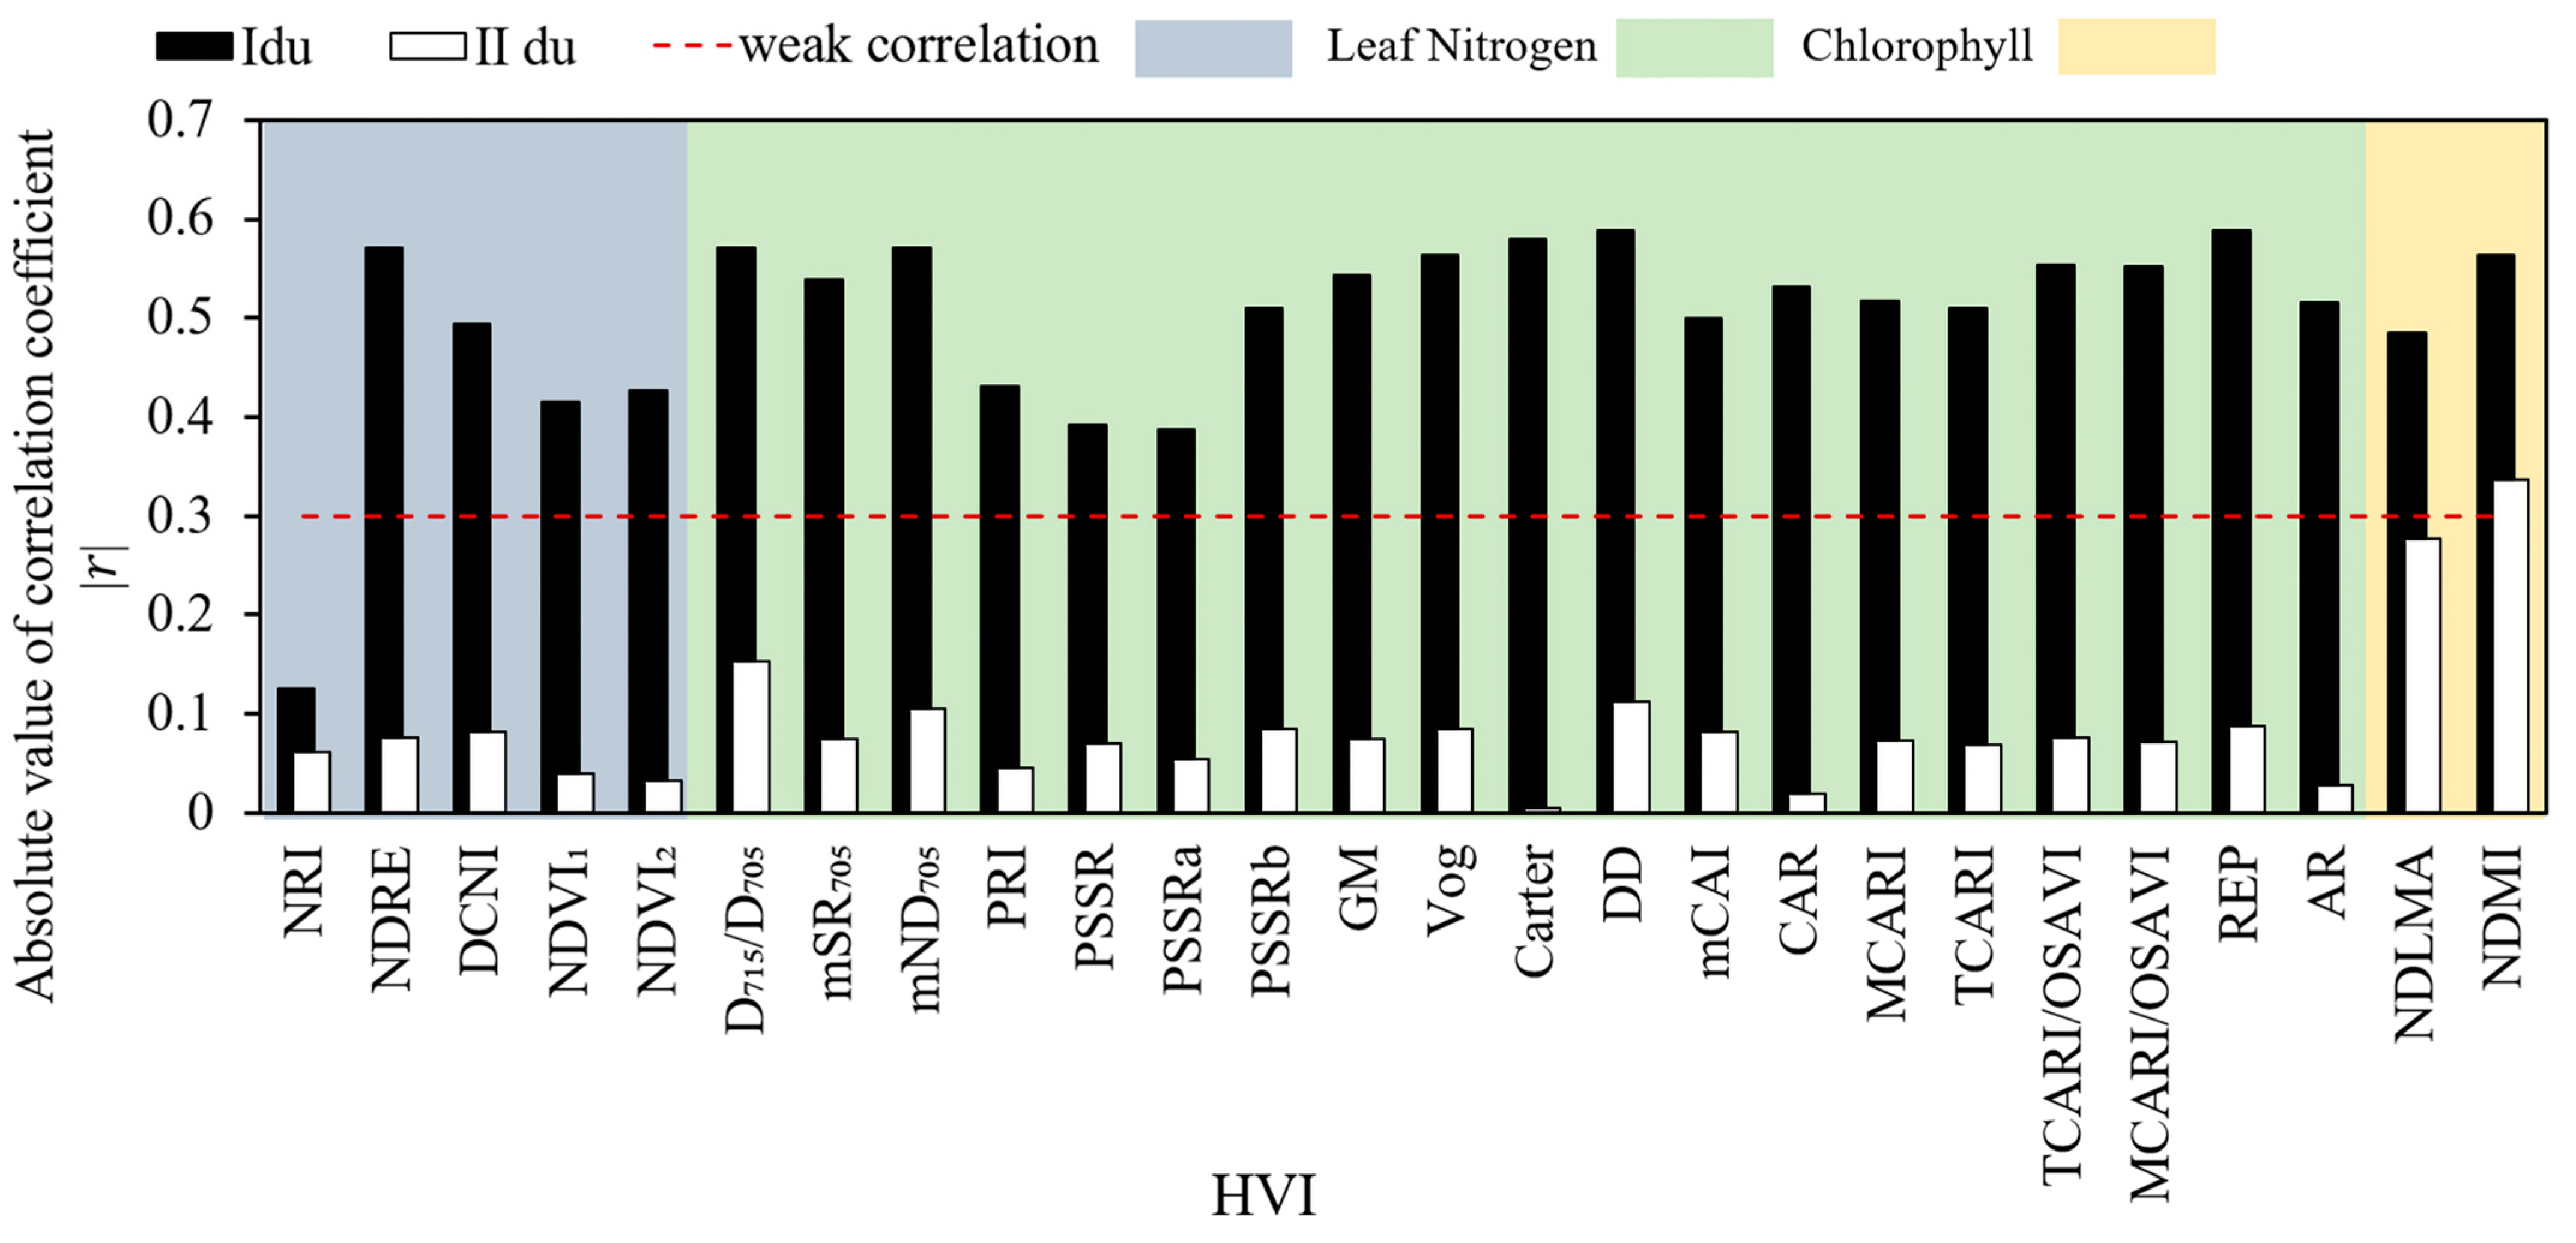
3.2. Correlation between the HVI and V25cmax of Moso Bamboo Leaves at the Different Ages

Figure 6 shows the correlation between the V25cmax and HVI of the I du and II du moso bamboo leaves. In this study, the closeness of the relationship between V25cmax and HVI was evaluated by calculating the absolute value of the Pearson correlation coefficient (|r|) between them. Figure 6 shows that in regard to the I du moso bamboo, there is only a negligible correlation between NIR and leaf V25cmax. The DCNI, NDVI1, NDVI2, PRI, PSSR, PSSRa, mCAI and NDLMA had weak correlations with leaf V25cmax. There were moderate correlations between other HVIs and leaf V25cmax. Among the HVIs sensitive to the nitrogen content, NDRE attained the highest correlation with leaf V25cmax, and the absolute value of the correlation coefficient reached 0.57. Among the HVIs sensitive to chlorophyll content, the correlation between REP and leaf V25cmax was the highest, and the absolute value of the correlation coefficient reached 0.59. Among the HVIs sensitive to leaf mass area, the correlation between NDMI and leaf V25cmax was the highest, and the absolute value of the correlation coefficient reached 0.56.
Regarding II du moso bamboo, except for the weak correlation between NDMI and V25cmax, the other HVIs exhibited only negligible correlation with the leaf V25cmax.
In addition, according to the calculation formulas of NDMI and NDLAM in Table 1, these two HVIs encompassed the 1722 nm shortwave infrared band, especially NDMI, which encompassed the 1649 nm and 1722 nm shortwave infrared bands and can be adopted as an important vegetation index to characterize the dry matter content of leaves [72].
Based on the above analysis, it can be observed that the HVIs utilizing the short-wave infrared region had greater potential in characterizing the V25cmax of II du bamboo leaves. This indicates that the information carried by the hyperspectral spectral bands in this region is worth further exploration using more approaches.

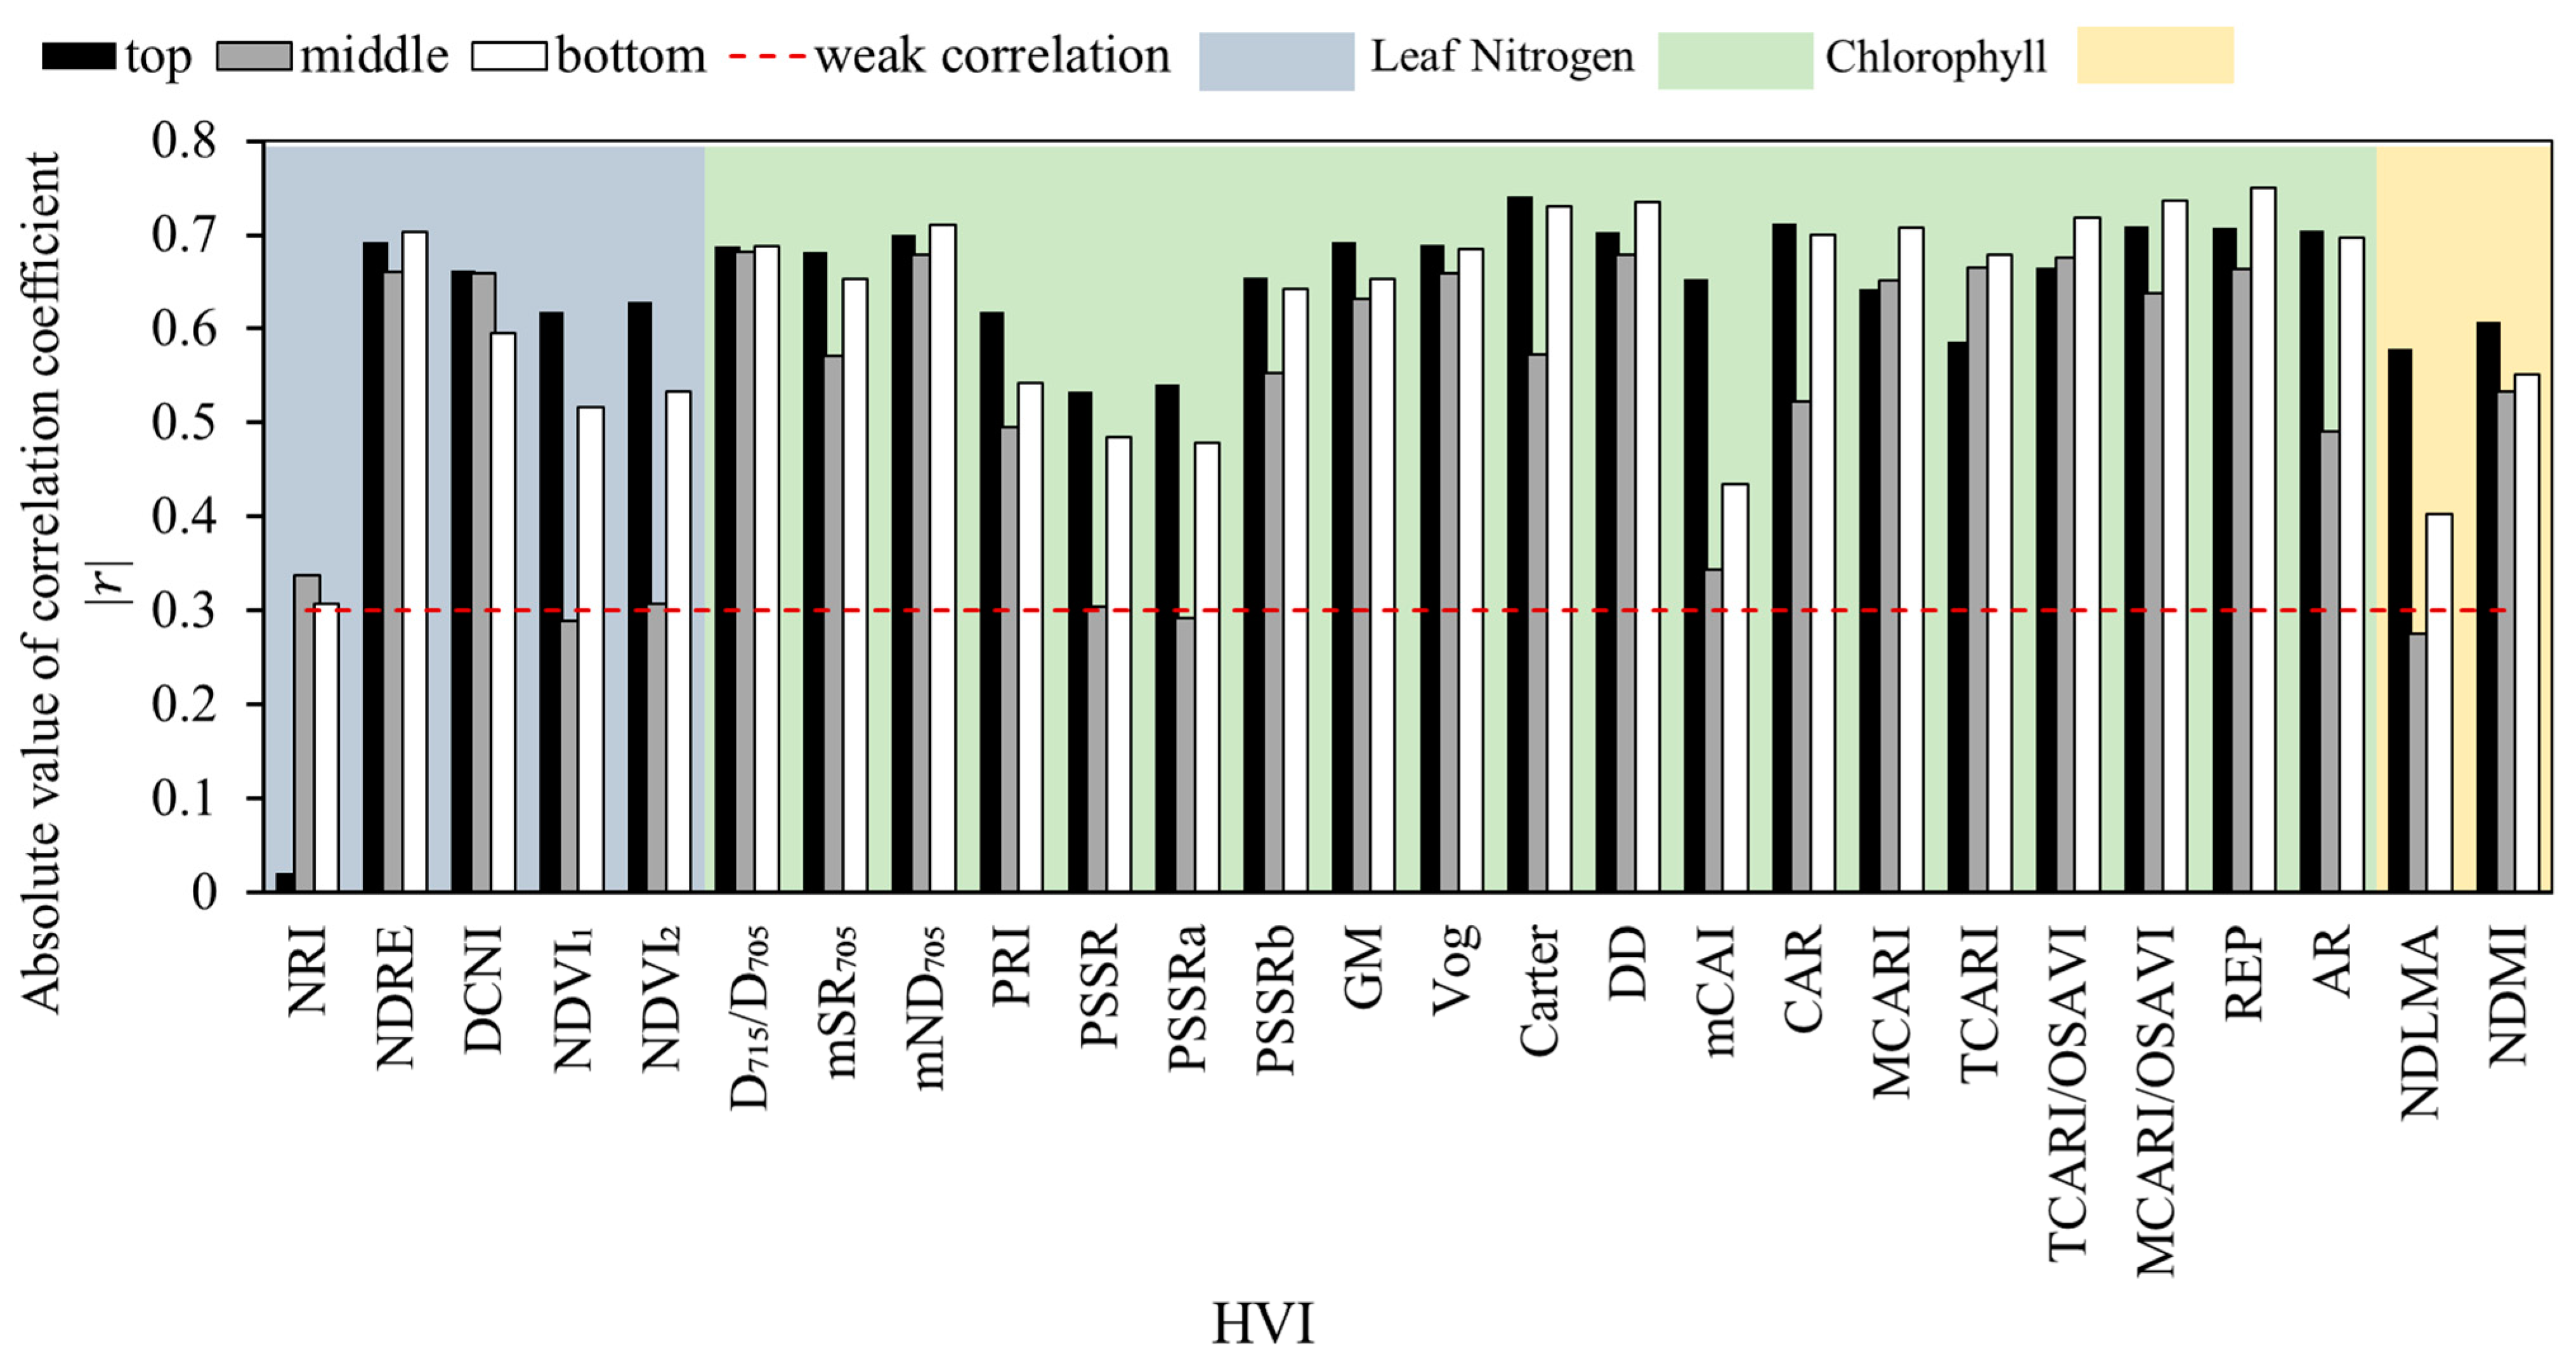
3.3. Correlation between the HVI and V25cmax of Moso Bamboo Leaves at the Different Canopy Positions

Because there was no significant difference in the V25cmax of the II du moso bamboo leaves at the different canopy positions (Figure 4b), only I du moso bamboo was considered in the correlation analysis between the HVI and V25cmax of the bamboo leaves at the different canopy positions in this study.
Figure 7 shows the correlation between the leaf V25cmax and HVI of I du moso bamboo at the top, middle and bottom canopy positions. Figure 7 shows that Carter, DD, CAR, MCARI/OSAVI, REP and AR have strong correlations with V25cmax at the top canopy positions, while the other HVIs (except NRI) have a moderate correlation with V25cmax. Except for NDVI1, PSSRa and NDLMA, the other HVIs have an undeniable correlation with leaf V25cmax at the middle canopy positions. For the bottom canopy positions, all the HVIs have undeniable correlations with leaf V25cmax.
Table 3 shows the HVIs with the highest absolute values of the correlation coefficients with the V25cmax of the I du moso bamboo leaves at the top, middle and bottom canopy positions. According to the analysis of Table 3, Carter, D715/D705 and REP, which are closely related to chlorophyll, were the most suitable for characterizing the V25cmax of I du moso bamboo leaves at the top, middle and bottom canopy positions, respectively. Among the HVIs closely related to the nitrogen content of leaves, NDRE was the most suitable for characterizing the V25cmax of I du moso bamboo leaves at the bottom canopy position. Among the HVIs closely related to the leaf mass area of leaves, NDMI and NDMI were the most suitable for characterizing the V25cmax of I du moso bamboo leaves at the top canopy position. The I du moso bamboo leaves occurred at the growth stage, and the contents of biophysical and chemical elements in the leaves differed among the different canopy positions, so there were also differences in the HVIs for V25cmax characterization, which provides an important reference for selecting the most suitable HVI for V25cmax retrieval at the different canopy positions and interpreting the differences in the vertical distribution of the carbon fixation capacity.

3.4. Correlation between the Wavelet Vegetation Index and V25cmax of Moso Bamboo Leaves

Figure 8 shows the correlation coefficients between the low-frequency component cA and the original spectrum obtained by wavelet coefficient single-branch reconstruction for 20 decomposition levels with the bior1.5 wavelet basis function. It can be seen from Figure 8 that there is almost no difference in the correlation coefficients between different ages and canopy positions, and after the original spectrum is decomposed to the 6th layer, the correlation between cA and the original spectrum began to decline. Thus, the results of the optimal decomposition level of the original spectrums at different bamboo ages and canopy positions were the same. The reason for these results may be that although these original spectrums come from different bamboo ages or canopy positions, they are all spectra of bamboo leaves, so their signal-to-noise ratios are similar, resulting in consistent results. Therefore, in this study, the original spectrum was decomposed into six layers, and the wavelet coefficients were reconstructed by a single branch to obtain cA6, cD1, cD2, cD3, cD4, cD5 and cD6.
With the use of the method introduced in Section 2.5.2, the optimal WVI at each decomposition level for the characterization of the V25cmax of I du and II du moso bamboo leaves was screened, as listed in Table 4. Table 4 shows that the correlation between V25cmax and the three WVI types of I du and II du moso bamboo constructed by the high-frequency information of layers 1–5 was generally higher than that constructed by the low-frequency information cA6 and the high-frequency information cD6, in which the absolute value of the correlation coefficient between SR2148,2188 and V25cmax constructed by cD1 was 0.75. The correlation between the three WVI types and the V25cmax of II du moso bamboo was generally the same as that with the V25cmax of I du moso bamboo. The absolute value of the correlation coefficient between DVI2069,407 constructed by cD2 and the V25cmax of II du moso bamboo was 0.67.
Comparing Table 4 and Figure 6, it can be found that almost all the correlations between the WVI and V25cmax were higher than those with the HVI. The DWT is known as a “mathematical microscope”, which suggests that when the hyperspectral reflectance data are subjected to the DWT, it increases the ability of the vegetation reflectance spectra to determine V25cmax. This occurs because information that is difficult to represent in the raw hyperspectral reflectance data is extracted in the low- and high-frequency domains after multilayer DWT application [15]. For example, after six-layer DWT decomposition, although the low-frequency information cA6 has been severely smoothed, noise has been filtered to the maximum extent (Figure 9). The correlation between the three WVI types constructed by cA6 and V25cmax was still higher than that with REP (0.59), which attained the highest correlation with V25cmax among the various HVIs. The high-frequency coefficient highlights the detailed information with notable spectral fluctuation and obvious feature change. In regard to I du moso bamboo, the correlation coefficient between the three WVI types and V25cmax constructed by the high-frequency information of layers 1–5 was approximately 20–30% higher than that with REP (0.59), which attained the highest correlation with V25cmax among the different HVIs. Regarding II du moso bamboo, the correlation coefficient between the three WVI types and V25cmax constructed by the high-frequency information of layers 1–5 was approximately 36–103% higher than that with NDMI (0.33), which attained the highest correlation with V25cmax among the various HVIs.
In addition, comparing Table 4 and Figure 6, it could be found that all HVIs, except NDLAM and NDMI, encompassed wavelength ranges in the visible and near-infrared spectra, while the wavelengths of all WVIs, except for a few indexes, encompassed the shortwave infrared spectrum with a longer wavelength range, and the longest wavelength was 2396 nm.
Similar to the HVI, we analyzed the correlation between the WVI and the leaf V25cmax of I du moso bamboo at the top, middle and bottom canopy positions, as summarized in Table 5. According to Table 5, the correlation between V25cmax and the WVI constructed by the high-frequency information was generally higher than that with the WVI constructed by the low-frequency information. The correlation between wDVI2243,477 and V25cmax constructed by cD2 in the top layer was the highest, and the absolute value of the correlation coefficient was 0.85. The absolute value of the correlation coefficient of wDVI2153,1225 and wSR1623,2153 constructed by cD1 in the middle layer was 0.82, and the absolute value of the correlation coefficient of wSR2146,2183 constructed by cD1 in the lower layer reached 0.87.
Comparing Table 3 and Table 5, the absolute values of the correlation coefficients between the WVI and leaf V25cmax at the three different canopy positions were generally higher than those with the HVI, with the maximum correlation values of the WVI increasing by 13–21% relative to the HVI. Similarly, the wavelengths of the WVI at the three locations were mostly within the shortwave infrared range, and the longest wavelength reached 2441 nm.
Noise in the hyperspectral reflectance data was filtered out after DWT treatment, highlighting the spectral details. The resulting WVI provided an expanded wavelength range for detection, thus significantly enhancing the ability of the HVI to interpret the V25cmax of moso bamboo leaves at the different ages and canopy positions. In summary, the WVI constructed from DWT-treated bamboo hyperspectral reflectance provides more advantages in leaf V25cmax interpretation.

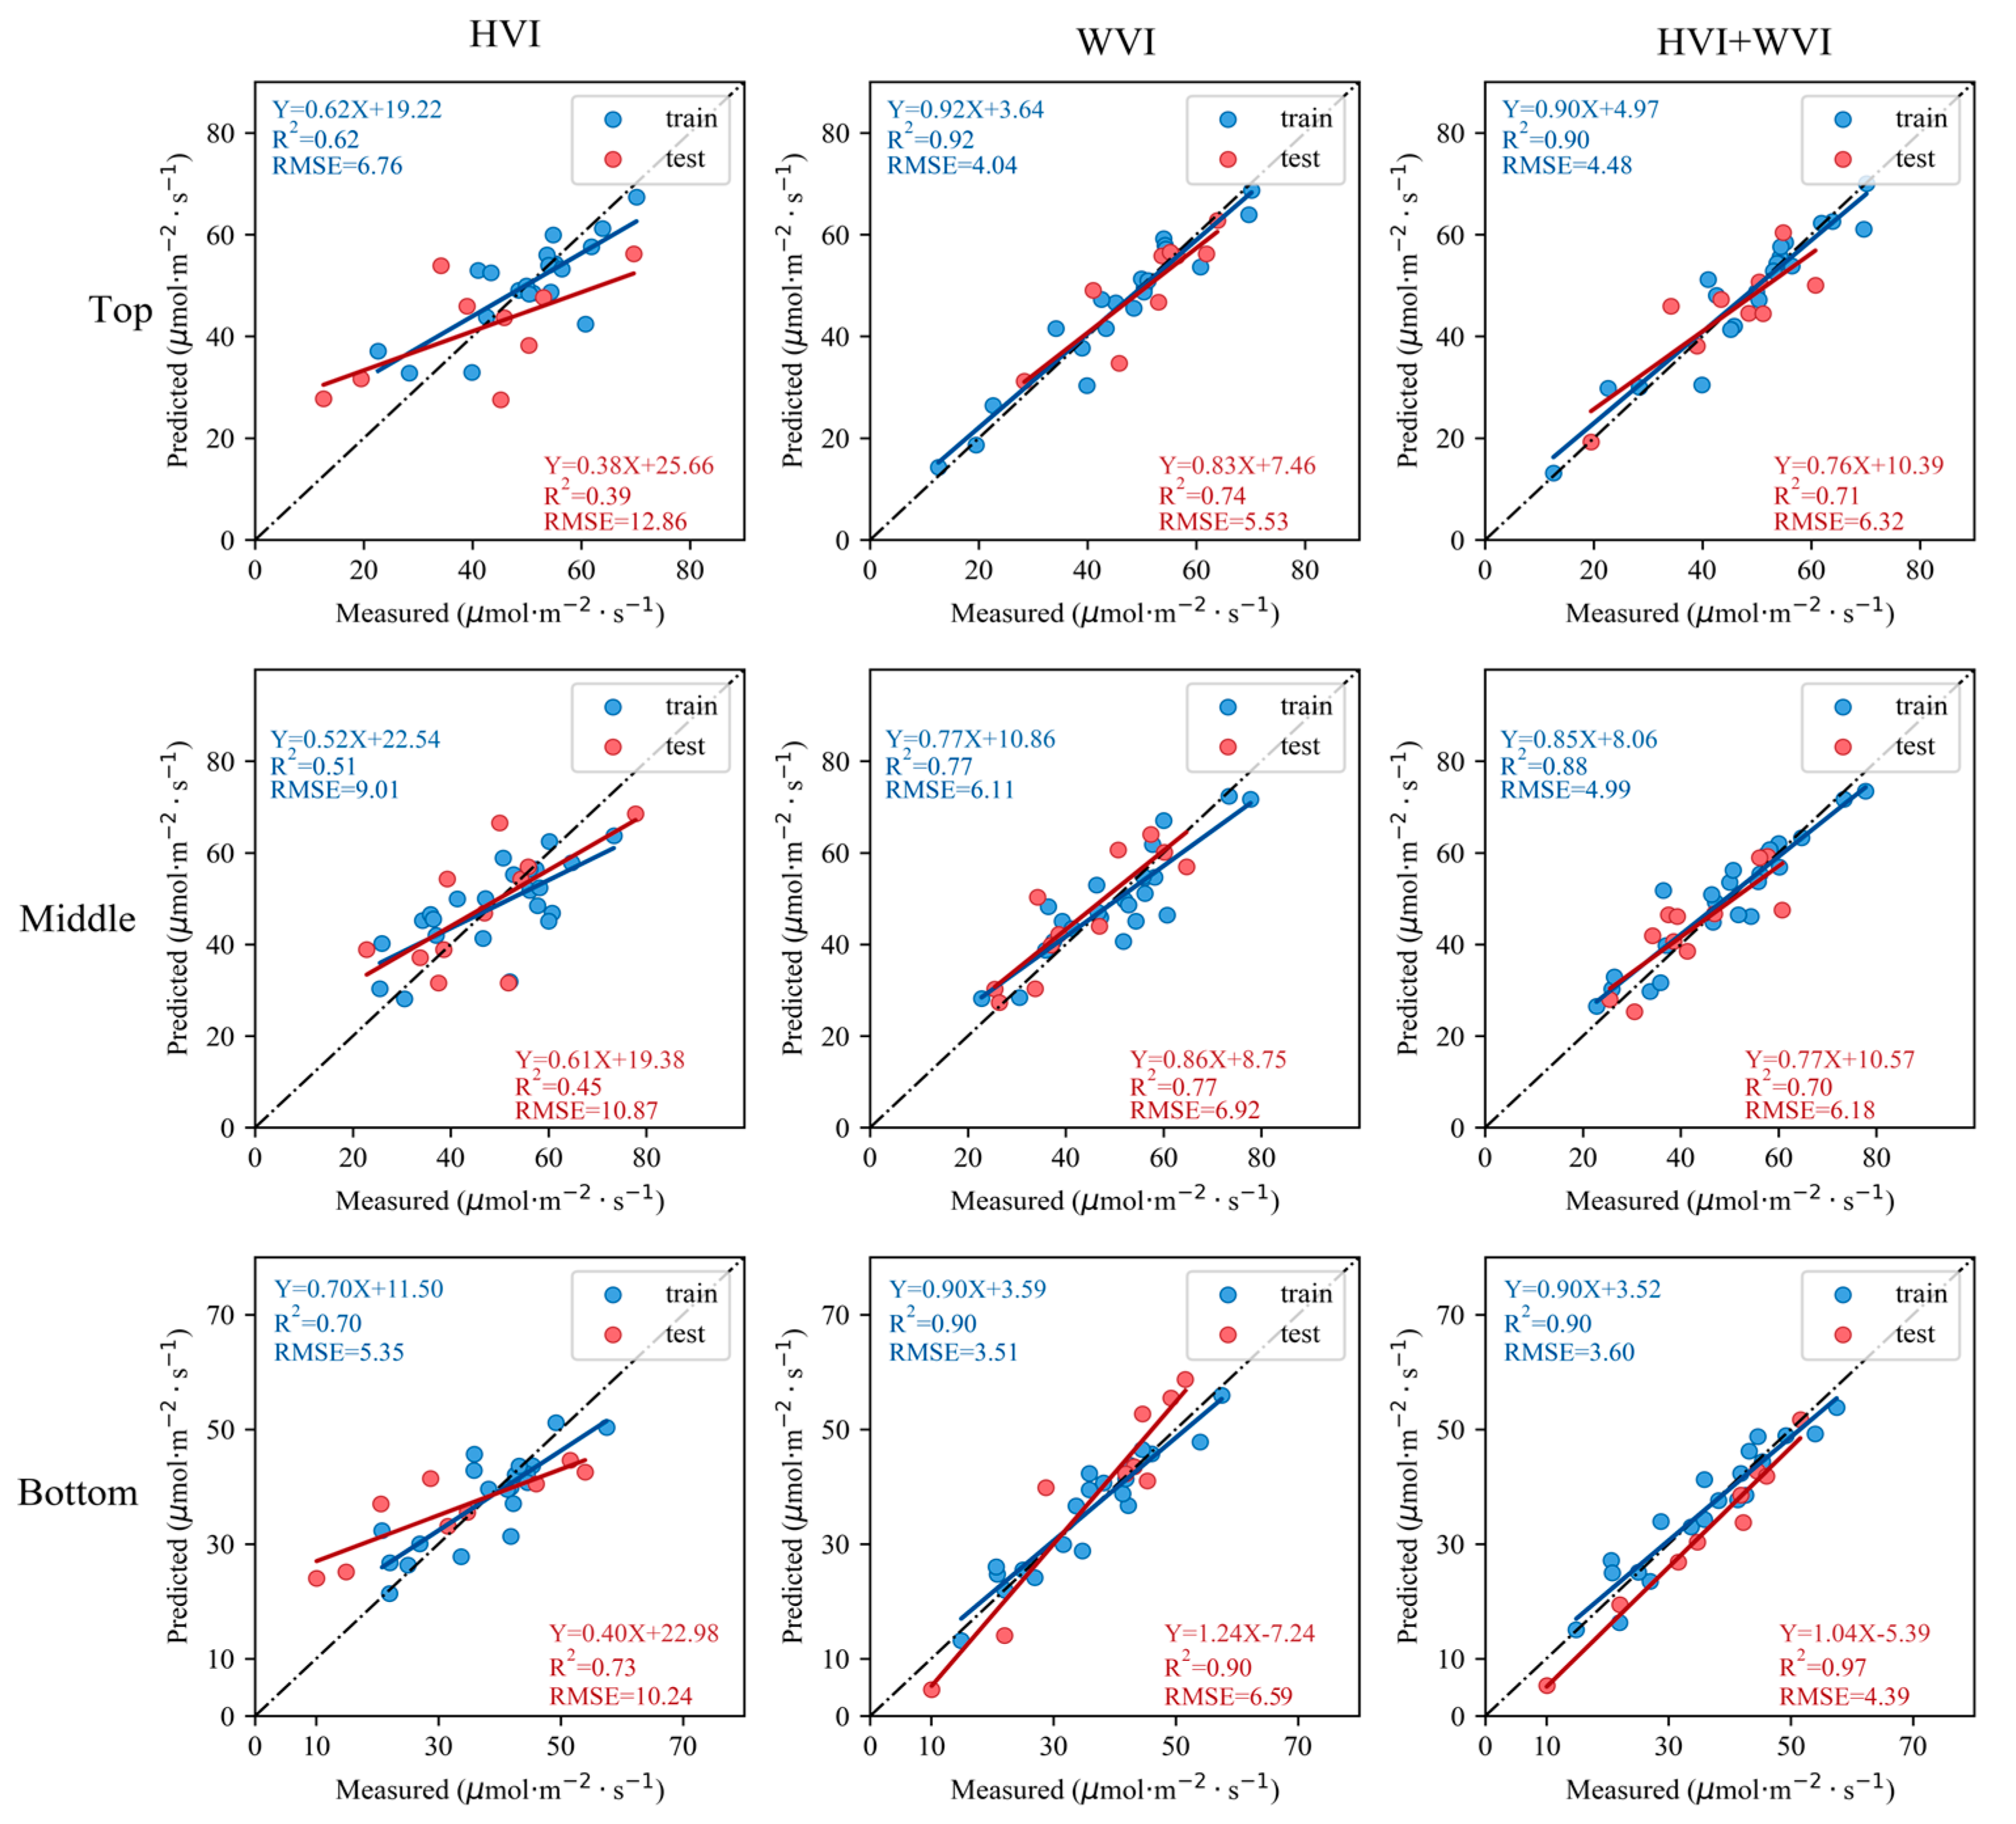
3.5. Inversion of V25cmax of Moso Bamboo Leaves

In this study, the HVI presented in Table 1, the constructed WVI provided in Table 4 and Table 5 and the combination of the HVI and WVI (HVI + WVI) were used as input variables of the PLSR model, and a V25cmax inversion model for moso bamboo leaves was constructed according to the different bamboo ages and canopy positions. Then, the V25cmax inversion model with the closest R2 and RMSE values to the median was selected.
Analysis of Figure 10 shows that the accuracy of the V25cmax inversion model with the WVI as a variable was higher than that of the inversion model with the HVI as a variable, both in terms of the model fitting accuracy (training samples) and model validation accuracy (validation samples). Based on the HVI, the validation accuracy R2 value of V25cmax of I du moso bamboo was 0.47, and the validation accuracy R2 value of II du moso bamboo was only 0.08. Compared to the HVI, the V25cmax validation accuracy was substantially improved when the WVI was used as the input variable. Specifically, the validation accuracy R2 value of the V25cmax of I du moso bamboo was 0.62, which increased by 32%, and the RMSE was 8.01 μ mol m 2 s 1 , which decreased by 22%. The validation accuracy R2 value of the V25cmax of II du moso bamboo was 0.7, which increased by 775%, and the RMSE was 9.44 μ mol m 2 s 1 , which decreased by 32%. Figure 10 also shows that after employing the combination of the WVI and HVI as a comprehensive variable, the inversion accuracy R2 and RMSE values of V25cmax were better than those when employing the HVI. This shows that the WVI could improve the accuracy of HVI inversion of V25cmax, and the model built based on the WVI achieved a high performance, which can be adopted to accurately retrieve the V25cmax of bamboo leaves.
Figure 11 shows the inversion results of the V25cmax of I du moso bamboo at the top, middle and bottom canopy locations. Similar to the V25cmax inversion results for moso bamboo at the different ages, the validation accuracy of V25cmax with the WVI as a variable was higher than that with the HVI as a variable. R2 increased by 90%, 71% and 23%, and the RMSE value decreased by 57%, 36% and 36%, respectively. The validation accuracy R2 of the model constructed by employing the combination of the WVI and HVI as a comprehensive variable was also higher than that when employing the HVI. The R2 values increased by 82%, 56% and 33%, respectively, and the RMSE values also significantly decreased by 51%, 43% and 57%, respectively.

4. Discussion

4.1. The V25cmax Differences among the Different Bamboo Ages and Canopy Positions

In this study, we analyzed distribution differences in leaf V25cmax at different bamboo ages and canopy positions. There was a significant difference in V25cmax between I du moso bamboo and II du moso bamboo, with the V25cmax of I du moso bamboo leaves being significantly higher than II du moso bamboo leaves. This finding is consistent with the conclusion of previous studies by Pantin, Albert and others, which also indicated that the physiological activities related to photosynthesis change with leaf age during leaf development [44,75]. This may be attributed to the fact that Rubisco activity in leaves decreases with increasing leaf age, which directly impacts the reduction in V25cmax [76].
Furthermore, there was a significant difference in leaf V25cmax between different canopy positions. This may be due to inconsistent light conditions received by leaves at different canopy positions, which can affect their photosynthetic capacity. The results of I du moso bamboo in this study are consistent with the research conclusion of Kenzo et al., which showed that leaf V25cmax tends to increase with increases in canopy height [77]. This could be attributed to the fact that the young leaves of I du moso bamboo occurred in the growing stage, so they are more sensitive to environmental factors, such as light, CO2 and temperature, that affect photosynthetic carbon fixation. There was no significant difference in the V25cmax of the II du moso bamboo leaves between the different canopy positions. This may be due to the II du moso bamboo leaves being 2–3 years old and having completely developed with stable physiological and structural parameters.

4.2. The V25cmax of Leaves at the Different Ages Are Sensitive to Different Types of HVIs

The reflectance characteristics of vegetation are mainly controlled by pigments, water content and leaf structure [78], so the inversion of leaf nitrogen content, chlorophyll, leaf area index, net photosynthetic rate, leaf biomass and other vegetation parameters based on the HVI is a hot research topic at home and abroad [79,80,81,82,83,84]. In this study, we analyzed the relationship between V25cmax and three types of HVIs, which represent the leaf nitrogen content, leaf chlorophyll content and leaf mass area. Regarding I du moso bamboo, the HVI which is commonly used to characterize chlorophyll, was more sensitive to leaf V25cmax. Regarding II du moso bamboo, the HVI which is commonly used to characterize leaf mass area, was more notably correlated with leaf V25cmax. That is to say, the V25cmax of leaves at the different ages are sensitive to different types of HVIs. This occurs because newly generated I du moso bamboo leaves are in a state of carbon starvation due to the urgent need to accumulate nutrients, and therefore their physiological parameter V25cmax is more sensitive to factors affecting carbon status. Since chlorophyll is directly involved in the physiological activities of plant carbon sequestration, the HVI which characterizes chlorophyll content, is more sensitive to V25cmax changes. The II du moso bamboo leaves were mature with stable physiological and structural parameters, and their physiological parameter V25cmax was more sensitive to factors related to leaf dry matter and water. The leaf mass area is the leaf dry matter mass per unit area after water removal, so it can better characterize the V25cmax of mature leaves.

4.3. The WVI Can Better Characterize V25cmax

To explain the ability of the WVI to characterize the V25cmax of moso bamboo, we analyzed the relationship between the WVI and HVI and the V25cmax of moso bamboo leaves in this study. Most correlations between the constructed WVI and the V25cmax of leaves at the different ages and canopy positions were higher than those with the HVI. For example, the absolute values of the correlation coefficients between the WVI and the V25cmax of I du moso bamboo improved by approximately 20–30% relative to the best performing REP among the HVIs, while the absolute values of the correlation coefficients between the WVI and the V25cmax of II du moso bamboo improved by approximately 36–103% relative to the best performing NDMI among the HVIs. The absolute values of the correlation coefficients between the WVI and the V25cmax of I du moso bamboo constructed by cD1-cD5 high-frequency information at each canopy position were 13–21% higher than those with the HVI. This occurred because after the original hyperspectral reflectance was processed by the DWT, the low-frequency information cA essentially captured the original spectrum after partial noise removal and resolution reduction. Moreover, the detailed features characterizing the peak and valley characteristics of the spectrum in the original hyperspectral reflectance were decomposed into high-frequency information cD (Figure 9). Therefore, the WVI comprising noise-free and detail-enhancing components could better reflect the variation in V25cmax. Blackburn [35] suggested that the more layers of decomposition there are, the more high-frequency components containing useful information are removed, resulting in a decrease in spectral information. Li [37] also found that using cD coefficients at decomposition levels of 6–10 can predict target parameters well. These findings support the results of our study, indicating that detail components (cD) also contain valuable information. Our study also demonstrated that a WVI constructed from cD coefficients is more sensitive to V25cmax in bamboo leaves, indicating the significant potential of spectral detail information for explaining V25cmax variation.
In addition, the constructed WVI could apply information to a wider range of bands. In contrast to the band combinations that constitute the HVI, which mainly remain within the visible and near-infrared reflectance shoulders of the spectrum, the band combinations that constitute the WVI include not only the visible and red edge regions but also extend to the near-mid-infrared region of the spectrum, with the longest band reaching 2441 nm (Table 4 and Table 5, respectively). The vegetation reflectance characteristics in the near-infrared and shortwave infrared regions are mainly influenced by moisture content and dry matter [78]. Moreover, related studies have reported that V25cmax is related not only to chlorophyll content but also to moisture and leaf dry matter [85,86]. Therefore, the long wavelength band is more advantageous in explaining the V25cmax of moso bamboo.

4.4. The Model Constructed by the WVIs Improved the Accuracy of Inverting V25cmax

The PLSR model can manage multicollinearity among variables. It organically combines multiple regression, principal component analysis and typical correlation analysis to simultaneously achieve regression modeling, data structure simplification and correlation analysis between two sets of variables under one algorithm. The PLSR model can achieve a higher model correlation analysis accuracy and an enhanced data resolution, and it has therefore become a commonly used model for hyperspectral remote sensing inversion of vegetation V25cmax [87]. In this study, PLSR-based inversion models of the V25cmax of moso bamboo leaves were constructed using the WVI, HVI and HVI + WVI as input variables. The study verified that the V25cmax inversion model of moso bamboo leaves at the different ages and canopy positions constructed by the WVI as a feature attained high accuracy and low error. For example, the V25cmax inversion model of II du moso bamboo constructed based on the HVI achieved a fitting accuracy R2 value of 0.22, and the validation accuracy R2 value was only 0.08, which indicates very poor model performance, i.e., the model can hardly be employed to correctly invert the V25cmax of moso bamboo leaves. In contrast, the fitting and validation accuracy R2 values of the WVI-based V25cmax inversion model were above 0.7, and the RMSE was significantly lower. According to the relevant analysis in Table 5 and Section 3.4, compared to the HVI, the wavelength of the band combination used to construct the WVI increased, and the spectral range was expanded. More importantly, cA6 reconstructed from the low-frequency component of the wavelet reduced the noise in the original spectrum, while cD1–cD6 reconstructed from the high-frequency component highlighted the detailed information of the bamboo leaf spectrum. Therefore, the V25cmax inversion model based on the WVI encompassed different resolutions and different levels of spectral characteristics, so it can better reflect changes in the V25cmax of moso bamboo leaves. The PLSR modeling approach effectively integrated the relevant information from the WVI, and the results of it explained 70% of the variation in V25cmax. Our method performs better in inverting V25cmax than the previously published results using the HVI to invert V25cmax, such as PRI (R2 = 0.04), RVSI (R2 = 0.15), EVI (R2 = 0.23) and DDn (R2 = 0.50) [88], and better than the DNN model proposed by Song et al. (R2 = 0.54) for estimating V25cmax [29].

5. Conclusions

In this study, we adopted I du and II du bamboo, which grow near the flux tower in Shanchuan Township, Anji County, Zhejiang Province, as examples. First, we analyzed distribution differences in leaf V25cmax at the different bamboo ages and canopy positions. Second, the relationship between the V25cmax of moso bamboo and the WVI, which was constructed by the hyperspectral reflectance after DWT treatment, was analyzed, and the WVI was compared to the HVI to explain the ability of the WVI to characterize the V25cmax of moso bamboo. Finally, a PLSR model was constructed to invert the V25cmax of moso bamboo leaves at different ages and canopy positions. The research results could provide a new method for high-precision inversion of the V25cmax of bamboo leaves and provide key parameters for evaluating the carbon cycle process in bamboo forests.
The results show that:
  • The V25cmax differences between the different bamboo ages and canopy positions largely reflects the actual photosynthesis situation during the growth of bamboo leaves, which lays an important foundation for V25cmax retrieval from hyperspectral reflectance data.
  • Most HVIs have not negligible correlation with the V25cmax of leaves of different ages and at different canopy positions, but their correlation is significantly lower than that between the WVI and V25cmax. The WVI comprising noise-free and detail-enhancing components can use information obtained from a wider range of bands and better reflect variation in V25cmax.
  • The V25cmax inversion model constructed based on the WVI contains spectral features at different resolutions and levels and can be used to invert the V25cmax of moso bamboo leaves of different ages and at different canopy positions with high accuracy and few errors.

Author Contributions

Conceptualization, H.D. and F.M.; methodology, K.G.; validation, K.G.; formal analysis, K.G.; investigation, K.G., C.N., Q.C. and Y.X.; data curation, K.G.; writing—original draft preparation, K.G.; writing—review and editing, X.L., H.D. and K.G.; visualization, K.G. and Z.H.; supervision, H.D. All authors have read and agreed to the published version of the manuscript.

Funding

This work was supported in part by the Leading Goose Project of Science Technology Department of Zhejiang Province under Grant (2023C02035), in part by the National Natural Science Foundation under Grant (32171785, 32201553, and 31901310), and in part by the Key Research and Development Program of Zhejiang Province under Grant (2021C02005).

Data Availability Statement

Not applicable.

Acknowledgments

The authors gratefully acknowledge the supports of various foundations. The authors are grateful to the editor and anonymous reviewers whose comments have contributed to improving the quality of this study.

Conflicts of Interest

The authors declare that they have no competing interest.

References

  1. Farquhar, G.D.; von Caemmerer, S.; Berry, J.A. A biochemical model of photosynthetic CO2 assimilation in leaves of C3 species. Planta 1980, 149, 78–90. [Google Scholar] [CrossRef] [PubMed]
  2. Kattge, J.; Knorr, W.; Raddatz, T.; Wirth, C. Quantifying photosynthetic capacity and its relationship to leaf nitrogen content for global-scale terrestrial biosphere models. Glob. Change Biol. 2009, 15, 976–991. [Google Scholar] [CrossRef]
  3. Dillen, S.Y.; de Beeck, M.O.; Hufkens, K.; Buonanduci, M.; Phillips, N.G. Seasonal patterns of foliar reflectance in relation to photosynthetic capacity and color index in two co-occurring tree species, Quercus rubra and Betula papyrifera. Agric. For. Meteorol. 2012, 160, 60–68. [Google Scholar] [CrossRef]
  4. Burnett, A.C.; Serbin, S.P.; Lamour, J.; Anderson, J.; Davidson, K.J.; Yang, D.; Rogers, A. Seasonal trends in photosynthesis and leaf traits in scarlet oak. Tree Physiol. 2021, 41, 1413–1424. [Google Scholar] [CrossRef] [PubMed]
  5. Rogers, A. The use and misuse of Vc,max in Earth System Models. Photosynth. Res. 2014, 119, 15–29. [Google Scholar] [CrossRef] [PubMed]
  6. Woodrow, I.; Berry, J. Enzymatic Regulation of Photosynthetic CO2, Fixation in C3 Plants. Annu. Rev. Plant Physiol. Plant Mol. Biol. 2003, 39, 533–594. [Google Scholar] [CrossRef]
  7. Song, G.; Wang, Q.; Jin, J. Exploring the instability of the relationship between maximum potential electron transport rate and maximum carboxylation rate in cool-temperate deciduous forests. Agric. For. Meteorol. 2021, 308-309, 108614. [Google Scholar] [CrossRef]
  8. Stinziano, J.R.; Morgan, P.B.; Lynch, D.J.; Saathoff, A.J.; McDermitt, D.K.; Hanson, D.T. The rapid A–Ci response: Photosynthesis in the phenomic era. Plant Cell Environ. 2017, 40, 1256–1262. [Google Scholar] [CrossRef]
  9. Rascher, U.; Alonso, L.; Burkart, A.; Cilia, C.; Cogliati, S.; Colombo, R.; Damm, A.; Drusch, M.; Guanter, L.; Hanus, J.; et al. Sun-induced fluorescence—A new probe of photosynthesis: First maps from the imaging spectrometer Hy Plant. Glob. Change Biol. 2015, 21, 4673–4684. [Google Scholar] [CrossRef]
  10. Croft, H.; Chen, J.M.; Luo, X.; Bartlett, P.; Chen, B.; Staebler, R.M. Leaf chlorophyll content as a proxy for leaf photosynthetic capacity. Glob. Change Biol. 2017, 23, 3513–3524. [Google Scholar] [CrossRef]
  11. Yu, Y.; Yang, X.; Fan, W. Remote Sensing Inversion of Leaf Maximum Carboxylation Rate Based on a Mechanistic Photosynthetic Model. IEEE Trans. Geosci. Remote Sens. 2021, 60, 1–12. [Google Scholar] [CrossRef]
  12. Camino, C.; Gonzalez-Dugo, V.; Hernandez, P.; Zarco-Tejada, P.J. Radiative transfer Vcmax estimation from hyperspectral imagery and SIF retrievals to assess photosynthetic performance in rainfed and irrigated plant phenotyping trials. Remote Sens. Environ. 2019, 231, 111186. [Google Scholar] [CrossRef]
  13. Ji, J.; Li, X.; Du, H.; Mao, F.; Fan, W.; Xu, Y.; Huang, Z.; Wang, J.; Kang, F. Multiscale leaf area index assimilation for Moso bamboo forest based on Sentinel-2 and MODIS data. Int. J. Appl. Earth Obs. Geoinf. 2021, 104, 102519. [Google Scholar] [CrossRef]
  14. Gu, C.; Du, H.; Mao, F.; Han, N.; Zhou, G.; Xu, X.; Sun, S.; Gao, G. Global sensitivity analysis of PROSAIL model parameters when simulating Moso bamboo forest canopy reflectance. Int. J. Remote Sens. 2016, 37, 5270–5286. [Google Scholar] [CrossRef]
  15. Sun, S.B.; Du, H.Q.; Li, P.H.; Zhou, G.M.; Xu, X.J.; Gao, G.L.; Li, X.J. Retrieval of leaf net photosynthetic rate of moso bamboo forests using hyperspectral remote sensing based on wavelet transform. Chin. J. Appl. Ecol. 2016, 27, 49–58. [Google Scholar]
  16. Li, Y.; Zhou, G.; Gu, C.; Xu, X.; Sun, S.; Gao, G. Chlorophyll content in Phyllostachys violascens related to hyper-spectral vegetation indices and development of an inversion model. J. Zhejiang AF Univ. 2015, 32, 335–345. [Google Scholar]
  17. Cheng-Yan, G.U.; Hua-Qiang, D.U.; Zhou, G.M.; Han, N.; Xiao-Jun, X.U.; Zhao, X.; Sun, X.Y. Retrieval of leaf area index of Moso bamboo forest with Landsat Thematic Mapper image based on PROSAIL canopy radiative transfer model. Chin. J. Appl. Ecol. 2013, 24, 2248–2256. [Google Scholar]
  18. Du, H.-Q.; Ge, H.-L.; Fan, W.-Y.; Jin, W.; Zhou, Y.-F.; Li, J. Study on relationships between total chlorophyll with hyperspectral features for leaves of Pinus massoniana forest. Spectrosc. Spectr. Anal. 2009, 29, 3033–3037. [Google Scholar]
  19. Doughty, C.E.; Asner, G.P.; Martin, R.E. Predicting tropical plant physiology from leaf and canopy spectroscopy. Oecologia 2011, 165, 289–299. [Google Scholar] [CrossRef]
  20. Serbin, S.P.; Dillaway, D.N.; Kruger, E.L.; Townsend, P.A. Leaf optical properties reflect variation in photosynthetic metabolism and its sensitivity to temperature. J. Exp. Bot. 2012, 63, 489–502. [Google Scholar] [CrossRef]
  21. Ainsworth, E.A.; Serbin, S.P.; Skoneczka, J.A. Using leaf optical properties to detect ozone effects on foliar biochemistry. Photosynth. Res. 2014, 119, 65–76. [Google Scholar] [CrossRef]
  22. Yendrek, C.R.; Tomaz, T.; Montes, C.M.; Cao, Y.; Morse, A.M.; Brown, P.J.; McIntyre, L.M.; Leakey, A.D.B.; Ainsworth, E.A. High-Throughput Phenotyping of Maize Leaf Physiological and Biochemical Traits Using Hyperspectral Reflectance. Plant Physiol. 2016, 173, 614–626. [Google Scholar] [CrossRef]
  23. Silva-Perez, V.; Molero, G.; Serbin, S.P.; Condon, A.G.; Reynolds, M.P.; Furbank, R.T.; Evans, J.R. Hyperspectral reflectance as a tool to measure biochemical and physiological traits in wheat. J. Exp. Bot. 2017, 69, 483–496. [Google Scholar] [CrossRef] [PubMed]
  24. Barnes, M.L.; Breshears, D.D.; Law, D.J.; van Leeuwen, W.J.D.; Monson, R.K.; Fojtik, A.C.; Barron-Gafford, G.A.; Moore, D.J.P. Beyond greenness: Detecting temporal changes in photosynthetic capacity with hyperspectral reflectance data. PLoS ONE 2017, 12, e0189539. [Google Scholar] [CrossRef]
  25. Dechant, B.; Cuntz, M.; Vohland, M.; Schulz, E.; Doktor, D. Estimation of photosynthesis traits from leaf reflectance spectra: Correlation to nitrogen content as the dominant mechanism. Remote Sens. Environ. 2017, 196, 279–292. [Google Scholar] [CrossRef]
  26. Wu, J.; Rogers, A.; Albert, L.P.; Ely, K.; Prohaska, N.; Wolfe, B.T.; Oliveira Jr, R.C.; Saleska, S.R.; Serbin, S.P. Leaf reflectance spectroscopy captures variation in carboxylation capacity across species, canopy environment and leaf age in lowland moist tropical forests. New Phytol. 2019, 224, 663–674. [Google Scholar] [CrossRef] [PubMed]
  27. Fu, P.; Meacham-Hensold, K.; Guan, K.; Wu, J.; Bernacchi, C. Estimating photosynthetic traits from reflectance spectra: A synthesis of spectral indices, numerical inversion, and partial least square regression. Plant Cell Environ. 2020, 43, 1241–1258. [Google Scholar] [CrossRef] [PubMed]
  28. Fu, P.; Meacham-Hensold, K.; Guan, K.; Bernacchi, C.J. Hyperspectral Leaf Reflectance as Proxy for Photosynthetic Capacities: An Ensemble Approach Based on Multiple Machine Learning Algorithms. Front. Plant Sci. 2019, 10, 730. [Google Scholar] [CrossRef]
  29. Song, G.; Wang, Q. Including Leaf Traits Improves a Deep Neural Network Model for Predicting Photosynthetic Capacity from Reflectance. Remote Sens. 2021, 13, 4467. [Google Scholar] [CrossRef]
  30. Im, J.; Jensen, J.R.; Jensen, R.R.; Gladden, J.; Waugh, J.; Serrato, M. Vegetation Cover Analysis of Hazardous Waste Sites in Utah and Arizona Using Hyperspectral Remote Sensing. Remote Sens. 2012, 4, 327–353. [Google Scholar] [CrossRef]
  31. Zhang, J.; Cheng, T.; Guo, W.; Xu, X.; Qiao, H.; Xie, Y.; Ma, X. Leaf area index estimation model for UAV image hyperspectral data based on wavelength variable selection and machine learning methods. Plant Methods 2021, 17, 49. [Google Scholar] [CrossRef]
  32. Wang, Q.; Iio, A.; Kakubari, Y. Broadband simple ratio closely traced seasonal trajectory of canopy photosynthetic capacity. Geophys. Res. Lett. 2008, 35, L07401. [Google Scholar] [CrossRef]
  33. Jin, P.; Wang, Q.; Iio, A.; Tenhunen, J. Retrieval of seasonal variation in photosynthetic capacity from multi-source vegetation indices. Ecol. Inform. 2012, 7, 7–18. [Google Scholar] [CrossRef]
  34. Bruce, L.M.; Koger, C.H.; Jiang, L. Dimensionality reduction of hyperspectral data using discrete wavelet transform feature extraction. IEEE Trans. Geosci. Remote Sens. 2002, 40, 2331–2338. [Google Scholar] [CrossRef]
  35. Blackburn, G.A.; Ferwerda, J.G. Retrieval of chlorophyll concentration from leaf reflectance spectra using wavelet analysis. Remote Sens. Environ. 2008, 112, 1614–1632. [Google Scholar] [CrossRef]
  36. Wang, J.; Chen, Y.; Chen, F.; Shi, T.; Wu, G. Wavelet-based coupling of leaf and canopy reflectance spectra to improve the estimation accuracy of foliar nitrogen concentration. Agric. For. Meteorol. 2018, 248, 306–315. [Google Scholar] [CrossRef]
  37. Li, F.; Wang, L.; Liu, J.; Wang, Y.; Chang, Q. Evaluation of Leaf N Concentration in Winter Wheat Based on Discrete Wavelet Transform Analysis. Remote Sens. 2019, 11, 1331. [Google Scholar] [CrossRef]
  38. Pu, R.; Gong, P. Wavelet transform applied to EO-1 hyperspectral data for forest LAI and crown closure mapping. Remote Sens. Environ. 2004, 91, 212–224. [Google Scholar] [CrossRef]
  39. Mao, F.; Li, P.; Zhou, G.; Du, H.; Xu, X.; Shi, Y.; Mo, L.; Zhou, Y.; Tu, G. Development of the BIOME-BGC model for the simulation of managed Moso bamboo forest ecosystems. J. Environ. Manag. 2016, 172, 29–39. [Google Scholar] [CrossRef] [PubMed]
  40. Mao, F.; Du, H.; Li, X.; Ge, H.; Cui, L.; Zhou, G. Spatiotemporal dynamics of bamboo forest net primary productivity with climate variations in Southeast China. Ecol. Indic. 2020, 116, 106505. [Google Scholar] [CrossRef]
  41. Kang, F.; Li, X.; Du, H.; Mao, F.; Zhou, G.; Xu, Y.; Huang, Z.; Ji, J.; Wang, J. Spatiotemporal Evolution of the Carbon Fluxes from Bamboo Forests and their Response to Climate Change Based on a BEPS Model in China. Remote Sens. 2022, 14, 366. [Google Scholar] [CrossRef]
  42. Ren, Y.; Yang, S.; Dongxiong, W.U.; Huang, C.; Guan, Y.; Miao, Y. Leaf senescence characteristics and the screen and identification of leaf senescence associated genes in moso bamboo. J. Fujian Agric. For. Univ. (Nat. Sci. Ed.) 2017, 46, 630–640. [Google Scholar]
  43. Wu, J.; Albert, L.P.; Lopes, A.P.; Restrepo-Coupe, N.; Hayek, M.; Wiedemann, K.T.; Guan, K.; Stark, S.C.; Christoffersen, B.; Prohaska, N.; et al. Leaf development and demography explain photosynthetic seasonality in Amazon evergreen forests. Science 2016, 351, 972–976. [Google Scholar] [CrossRef] [PubMed]
  44. Loren, P.A.; Jin, W.; Neill, P.; Plinio, B.d.C.; Travis, E.H.; Edgard, S.T.; Valeriy, Y.I.; Rafael, S.O.; Sabrina, G.; Marielle, N.S.; et al. Age-dependent leaf physiology and consequences for crown-scale carbon uptake during the dry season in an Amazon evergreen forest. New Phytol. 2018, 219, 870–884. [Google Scholar]
  45. Bielczynski, L.W.; Łącki, M.K.; Hoefnagels, I.; Gambin, A.; Croce, R. Leaf and Plant Age Affects Photosynthetic Performance and Photoprotective Capacity. Plant Physiol. 2017, 175, 1634–1648. [Google Scholar] [CrossRef] [PubMed]
  46. Wu, Q.; Song, C.; Song, J.; Wang, J.; Chen, S.; Yang, L.; Xiang, W.; Zhao, Z.; Jiang, J. Effects of leaf age and canopy structure on gross ecosystem production in a subtropical evergreen Chinese fir forest. Agric. For. Meteorol. 2021, 310, 108618. [Google Scholar] [CrossRef]
  47. Chen, G.-Y.; Yu, G.-L.; Chen, Y.; Xu, D.-Q. Exploring the observation methods of photosynthetic responses to light and carbon dioxide. Zhi Wu Sheng Li Yu Fen Zi Sheng Wu Xue Xue Bao J. Plant Physiol. Mol. Biol. 2006, 32, 691–696. [Google Scholar]
  48. Xia, N.; Yong-hui, C.; Ben-zhi, Z.; Xiao-zhen, L.; Yan, Z. Light Response of Phyllostachys edulis under Drought Stress: Based on 4 Models. For. Res. 2017, 30, 465–471. [Google Scholar]
  49. YE, Z.-P.; Yu, Q. Comparison of new and several classical models of photosynthesis in response to irradiance. Chin. J. Plant Ecol. 2008, 32, 1356. [Google Scholar]
  50. Liang, X.-Y.; Liu, S.-R. A review on the FvCB biochemical model of photosynthesis and the measurement of A-Ci curves. Chin. J. Plant Ecol. 2017, 41, 693–706. [Google Scholar]
  51. Sharkey, T.D.; Bernacchi, C.J.; Farquhar, G.D.; Singsaas, E.L. Fitting photosynthetic carbon dioxide response curves for C3 leaves. Plant Cell Environ. 2007, 30, 1035–1040. [Google Scholar] [CrossRef]
  52. Gu, L.; Pallardy, S.G.; Tu, K.P.; Law, B.E.; Wullschlrger, S.D. Reliable estimation of biochemical parameters from C3 leaf photosynthesis–intercellular carbon dioxide response curves. Plant Cell Environ. 2010, 33, 1852–1874. [Google Scholar] [CrossRef]
  53. Duursma, R.A. Plantecophys-An R Package for Analysing and Modelling Leaf Gas Exchange Data. PLoS ONE 2015, 10, e0143346. [Google Scholar] [CrossRef] [PubMed]
  54. Filella, I.; Serrano, L.; Serra, J.; Peñuelas, J. Evaluating Wheat Nitrogen Status with Canopy Reflectance Indices and Discriminant Analysis. Crop Sci. 1995, 35, 1400–1405. [Google Scholar] [CrossRef]
  55. Barnes, E.; Clarke, T.; Richards, S.; Colaizzi, P.; Haberland, J.; Kostrzewski, M.; Waller, P.; Choi, C.; Riley, E.; Thompson, T. Coincident detection of crop water stress, nitrogen status and canopy density using ground based multispectral data. Proceedings of 5th International Conference on Precision Agriculture, Bloomington, MN, USA, 16–19 July 2000; p. 6. [Google Scholar]
  56. Chen, P.; Haboudane, D.; Tremblay, N.; Wang, J.; Vigneault, P.; Li, B. New spectral indicator assessing the efficiency of crop nitrogen treatment in corn and wheat. Remote Sens. Environ. 2010, 114, 1987–1997. [Google Scholar] [CrossRef]
  57. Zarco-Tejada, P.J.; Miller, J.R.; Mohammed, G.H.; Noland, T.L.; Sampson, P.H. Canopy optical indices from infinite reflectance and canopy reflectance models for forest condition monitoring: Application to hyperspectral CASI data. In Proceedings of the IEEE 1999 International Geoscience and Remote Sensing Symposium, IGARSS’99 (Cat. No.99CH36293), Hamburg, Germany, 28 June–2 July 1999; Volume 1873, pp. 1878–1881. [Google Scholar]
  58. Rouse Jr, J.W.; Haas, R.H.; Deering, D.W.; Schell, J.A.; Harlan, J.C. Monitoring the Vernal Advancement and Retrogradation (Green Wave Effect) of Natural Vegetation; RSC-1978-4; NASA Goddard Space Flight Center: Greenbelt, MD, USA, 1974.
  59. Vogelmann, J.E.; Rock, B.N.; Moss, D.M. Red edge spectral measurements from sugar maple leaves. Int. J. Remote Sens. 1993, 14, 1563–1575. [Google Scholar] [CrossRef]
  60. Sims, D.A.; Gamon, J.A. Relationships between leaf pigment content and spectral reflectance across a wide range of species, leaf structures and developmental stages. Remote Sens. Environ. 2002, 81, 337–354. [Google Scholar] [CrossRef]
  61. Gamon, J.A.; Peñuelas, J.; Field, C.B. A narrow-waveband spectral index that tracks diurnal changes in photosynthetic efficiency. Remote Sens. Environ. 1992, 41, 35–44. [Google Scholar] [CrossRef]
  62. Blackburn, G.A. Spectral indices for estimating photosynthetic pigment concentrations: A test using senescent tree leaves. Int. J. Remote Sens. 1998, 19, 657–675. [Google Scholar] [CrossRef]
  63. Gitelson, A.A.; Merzlyak, M.N. Remote estimation of chlorophyll content in higher plant leaves. Int. J. Remote Sens. 1997, 18, 2691–2697. [Google Scholar] [CrossRef]
  64. Carter, G.A. Ratios of leaf reflectances in narrow wavebands as indicators of plant stress. Int. J. Remote Sens. 1994, 15, 697–703. [Google Scholar] [CrossRef]
  65. le Maire, G.; François, C.; Dufrêne, E. Towards universal broad leaf chlorophyll indices using PROSPECT simulated database and hyperspectral reflectance measurements. Remote Sens. Environ. 2004, 89, 1–28. [Google Scholar] [CrossRef]
  66. Oppelt, N.; Mauser, W. The Chlorophyll Content of Maize (zea mays) Derived with the Airborne Imaging Spectrometer AVIS. In Proceedings of the Mesures physiques et signatures en télédétection, Aussois, France, 8–12 January 2001; pp. 407–412. [Google Scholar]
  67. Broge, N.H.; Leblanc, E. Comparing prediction power and stability of broadband and hyperspectral vegetation indices for estimation of green leaf area index and canopy chlorophyll density. Remote Sens. Environ. 2001, 76, 156–172. [Google Scholar] [CrossRef]
  68. Daughtry, C.S.T.; Walthall, C.L.; Kim, M.S.; de Colstoun, E.B.; McMurtrey, J.E. Estimating Corn Leaf Chlorophyll Concentration from Leaf and Canopy Reflectance. Remote Sens. Environ. 2000, 74, 229–239. [Google Scholar] [CrossRef]
  69. Haboudane, D.; Miller, J.R.; Tremblay, N.; Zarco-Tejada, P.J.; Dextraze, L. Integrated narrow-band vegetation indices for prediction of crop chlorophyll content for application to precision agriculture. Remote Sens. Environ. 2002, 81, 416–426. [Google Scholar] [CrossRef]
  70. Miller, J.R.; Hare, E.W.; Wu, J. Quantitative characterization of the vegetation red edge reflectance 1. An inverted-Gaussian reflectance model. Int. J. Remote Sens. 1990, 11, 1755–1773. [Google Scholar] [CrossRef]
  71. Feret, J.-B.; François, C.; Asner, G.P.; Gitelson, A.A.; Martin, R.E.; Bidel, L.P.R.; Ustin, S.L.; le Maire, G.; Jacquemoud, S. PROSPECT-4 and 5: Advances in the leaf optical properties model separating photosynthetic pigments. Remote Sens. Environ. 2008, 112, 3030–3043. [Google Scholar] [CrossRef]
  72. Wang, L.; Hunt, E.R.; Qu, J.J.; Hao, X.; Daughtry, C.S.T. Towards estimation of canopy foliar biomass with spectral reflectance measurements. Remote Sens. Environ. 2011, 115, 836–840. [Google Scholar] [CrossRef]
  73. Borovskaya, R.; Krivoguz, D.; Chernyi, S.; Kozhurin, E.; Khorosheltseva, V.; Zinchenko, E. Surface Water Salinity Evaluation and Identification for Using Remote Sensing Data and Machine Learning Approach. J. Mar. Sci. Eng. 2022, 10, 257. [Google Scholar] [CrossRef]
  74. Heckmann, D.; Schlüter, U.; Weber, A.P.M. Machine Learning Techniques for Predicting Crop Photosynthetic Capacity from Leaf Reflectance Spectra. Mol. Plant 2017, 10, 878–890. [Google Scholar] [CrossRef] [PubMed]
  75. Pantin, F.; Simonneau, T.; Muller, B. Coming of leaf age: Control of growth by hydraulics and metabolics during leaf ontogeny. New Phytol. 2012, 196, 349–366. [Google Scholar] [CrossRef]
  76. Peng, C.; Song, Y.; Li, C.; Mei, T.; Wu, Z.; Shi, Y.; Zhou, Y.; Zhou, G. Growing in Mixed Stands Increased Leaf Photosynthesis and Physiological Stress Resistance in Moso Bamboo and Mature Chinese Fir Plantations. Front. Plant Sci. 2021, 12, 649204. [Google Scholar] [CrossRef]
  77. Kenzo, T.; Ichie, T.; Watanabe, Y.; Yoneda, R.; Ninomiya, I.; Koike, T. Changes in photosynthesis and leaf characteristics with tree height in five dipterocarp species in a tropical rain forest. Tree Physiol. 2006, 26, 865–873. [Google Scholar] [CrossRef]
  78. Curran, P.J. Remote sensing of foliar chemistry. Remote Sens. Environ. 1989, 30, 271–278. [Google Scholar] [CrossRef]
  79. Zhou, Y.; Ju, W.; Sun, X.; Hu, Z.; Han, S.; Black, T.A.; Jassal, R.S.; Wu, X. Close relationship between spectral vegetation indices and Vcmax in deciduous and mixed forests. Tellus B Chem. Phys. Meteorol. 2014, 66, 23279. [Google Scholar] [CrossRef]
  80. McDonald, A.J.; Gemmell, F.M.; Lewis, P.E. Investigation of the Utility of Spectral Vegetation Indices for Determining Information on Coniferous Forests. Remote Sens. Environ. 1998, 66, 250–272. [Google Scholar] [CrossRef]
  81. Houborg, R.; Soegaard, H.; Boegh, E. Combining vegetation index and model inversion methods for the extraction of key vegetation biophysical parameters using Terra and Aqua MODIS reflectance data. Remote Sens. Environ. 2007, 106, 39–58. [Google Scholar] [CrossRef]
  82. Wang, X.; Cai, G.; Lu, X.; Yang, Z.; Zhang, X.; Zhang, Q. Inversion of Wheat Leaf Area Index by Multivariate Red-Edge Spectral Vegetation Index. Sustainability 2022, 14, 15875. [Google Scholar] [CrossRef]
  83. Du, H.; Zhou, G.; Mao, F.; Han, N. Quantitative Retrieval of Bamboo Forest Parameters by Multi-Source Remote Sensing; China Science Publishing & Media Ltd.: Beijing, China, 2022. [Google Scholar]
  84. Pu, R.; Gong, P. Hyperspectral Remote Sensing and Its Application; High Education Press: Beijing, China, 2000. [Google Scholar]
  85. Quebbeman, J.A.; Ramirez, J.A. Optimal allocation of leaf-level nitrogen: Implications for covariation of Vcmax and Jmax and photosynthetic downregulation. J. Geophys. Res. Biogeosciences 2016, 121, 2464–2475. [Google Scholar] [CrossRef]
  86. Jauregui, I.; Pozueta-Romero, J.; Córdoba, J.; Avice, J.-C.; Aparicio-Tejo, P.M.; Baroja-Fernández, E.; Aranjuelo, I. Unraveling the role of transient starch in the response of Arabidopsis to elevated CO2 under long-day conditions. Environ. Exp. Bot. 2018, 155, 158–164. [Google Scholar] [CrossRef]
  87. Du, H.; Zhou, G.; Ge, H.; Fan, W.; Xu, X.; Fan, W.; Shi, Y. Satellite-based carbon stock estimation for bamboo forest with a non-linear partial least square regression technique. Int. J. Remote Sens. 2012, 33, 1917–1933. [Google Scholar] [CrossRef]
  88. Jin, J.; Arief Pratama, B.; Wang, Q. Tracing Leaf Photosynthetic Parameters Using Hyperspectral Indices in an Alpine Deciduous Forest. Remote Sens. 2020, 12, 1124. [Google Scholar] [CrossRef]
Figure 1. (a) Boundary of Anji County in the study area; (b) bamboo forest distribution and flux tower location; (c) map of the spatial distribution of the sample bamboo; (d) using Li-6800 to measure the A–Ci curve of I du bamboo leaves; (e) leaf spectral curve.
Remotesensing 15 02362 g001
Figure 2. Curve of the moso bamboo assimilation rate response to the intercellular CO2 concentration fitted by the FvCB model.
Remotesensing 15 02362 g002
Figure 3. Schematic diagram of three-level discrete wavelet decomposition.
Remotesensing 15 02362 g003
Figure 4. Flowchart of steps used in our study.
Remotesensing 15 02362 g004
Figure 5. (a) Statistical diagram of the V25cmax of the I du and II du moso bamboo leaves. (b) Statistical diagram of the V25cmax of the I du and II du moso bamboo leaves at the different canopy positions. Letters are the result of multiple comparisons, and different letters represent differences between variables.
Remotesensing 15 02362 g005
Figure 6. Absolute values of the correlation coefficients between V25cmax and the HVI of the I du and II du Moso bamboo leaves. The correlation below the dashed line can be ignored.
Remotesensing 15 02362 g006
Figure 7. Absolute values of the correlation coefficients between V25cmax and HVI of the I du moso bamboo leaves at the different canopy positions. The correlation below the dashed line can be ignored.
Remotesensing 15 02362 g007
Figure 8. (a) Correlation between the reconstructed signal cA and the original spectrum at the different decomposition levels of the spectra of the I du and II du moso bamboo leaves; (b) correlation between the reconstructed signal cA and the original spectrum at the different decomposition levels of the spectra of the I du moso bamboo leaves at the top, middle and bottom canopy positions.
Remotesensing 15 02362 g008
Figure 9. cA and cD obtained from six-layer wavelet decomposition and reconstruction of the bamboo reflection spectrum.
Remotesensing 15 02362 g009
Figure 10. Inversion results of the V25cmax of leaves based on the HVI, WVI and HVI + WVI for the different bamboo ages.
Remotesensing 15 02362 g010
Figure 11. Inversion results of the V25cmax of leaves based on the HVI, WVI and HVI + WVI at the different canopy positions.
Remotesensing 15 02362 g011
Table 1. Hyperspectral vegetation index computational formulas.
TypeHVIFormulaReference
Leaf NitrogenNitrogen reflectance index (NRI)(R570 − R670)/(R570 + R670)Filella et al., 1995 [54]
Normalized difference red edge index (NDRE)(R790 − R720)/(R790 + R720)Barnes et al., 2000 [55]
Double-peak canopy nitrogen index (DCNI) ( R 720 R 700 ) ( R 700 R 670 )   ×   ( R 720 R 670   + 0.03 ) Chen et al., 2010 [56]
Normalized difference vegetation index (NDVI1)(R774 − R677)/(R774 + R677)Zarco et al., 1999 [57]
Normalized difference vegetation index (NDVI2)(R800 − R670)/(R800 + R670)Rouse et al., 1974 [58]
ChlorophyllRatio of first derivative (D715/D705)(R716 − R714)/(R706 − R704)Vogelmann et al., 1993 [59]
Modified simple ratio (mSR705)(R750 − R445)/(R705 + R445)Sims et al., 2002 [60]
Modified NDVI (mND705)(R750 − R705)/(R750 + R705 − 2 ∗ R445)Sims et al., 2002 [60]
Physiological reflectance index (PRI)(R570 − R539)/(R570 + R539)Gamon et al., 1992 [61]
Pigment specific simple ratio (PSSR)R810/R674Zarco et al., 1999 [57]
Pigment specific simple ratio Chla (PSSRa)R800/R680Blackburn et al., 1998 [62]
Pigment specific simple ratio Chlb (PSSRb)R800/R635Blackburn et al., 1998 [62]
Gitelson and Merzlyak index (GM)R750/R700Gitelson et al.,1997 [63]
Vogelmann index (Vog)R740/R720Vogelmann et al., 1993 [59]
Carter index (Carter)R695/R760Carter et al., 1994 [64]
Double difference index (DD)(R750 − R720) − (R700 − R670)le Mairet et al., 2004 [65]
Modified chlorophyll absorption integral (mCAI) R 545 +   R 752 2   ×   ( 752     545 )   R 545 R 752 R Oppelt et al., 2001 [66]
Distance from the base line spanned by the green reflectance peak (CAR) CAR = | α   ×   670 + R 670 + β | α 2 + 1
α = R 700 R 550 150   β =   R 550 550 α
Broge et al., 2001 [67]
Modified chlorophyll absorption ratio index (MCARI) [ ( R 700 R 670 )     0.2 ( R 700 R 550 ) R 700 R 670 ] Daughtry et al., 2000 [68]
Transformed chlorophyll absorption in reflectance index (TCARI) 3   ×   [ ( R 700 R 670 )     0.2 ( R 670 R 700 ) R 700 R 670 ] Haboudane et al., 2002 [69]
TCARI/Optimized soil-adjusted vegetation index (TCARI/OSAVI)TCARI/OSAVI
OSAVI = 1.16   ×   R 800 R 670 R 800 + R 670 + 0.16
Haboudane et al., 2002 [69]
MCARI/OSAVIMCARI/OSAVIDaughtry et al., 2000 [68]
Red edge position (REP) 700 + 40   ×   ( R rededge R 700 ) R 740 R 700
R redege = ( R 670 + R 780 ) 2
Miller et al., 1990 [70]
Integration of reflectivity at 450–680 nm (AR) 450 680 R Zarco et al., 1999 [57]
Leaf Mass AreaNormalized dry leaf mass area index (NDLMA)(R1368 − R1722)/(R1368 + R1722)Feret et al., 2008 [71]
Normalized dry matter index (NDMI)(R1649 − R1722)/(R1649 + R1722)Wang et al., 2011 [72]
Table 2. Chaddock scale for interpretation of correlation analysis results.
Absolute Value of Correlation, |R|Interpretation
0.00–0.30Negligible correlation
0.30–0.50Weak correlation
0.50–0.70Moderate correlation
0.70–0.90Strong correlation
0.90–1.00Very strong correlation
Table 3. HVIs with the highest absolute values of the correlation coefficients with the V25cmax of I du Moso bamboo leaves at the different canopy positions.
Leaf NitrogenChlorophyllLeaf Mass Area
TopNDRE
(0.69)
Carter
(0.74)
NDMI
(0.61)
MiddleNDRE
(0.66)
D715/D705
(0.68)
NDMI
(0.53)
BottomNDRE
(0.70)
REP
(0.75)
NDMI
(0.55)
Table 4. Correlation between the optimal WVI and V25cmax of the bamboo leaves of different ages.
CoefficientsI du II du
WVI|r|WVI|r|
cA6wDVI692,8200.61wDVI2292,18440.32
wSR1460,22920.60wSR1652,17800.35
wNDVI2292,14600.60wNDVI1780,16520.35
cD1wDVI2185,21530.73wDVI1161,8190.62
wSR2148,21880.75wSR1684,22210.57
wNDVI2185,21470.74wNDVI2343,17140.59
cD2wDVI2178,21540.74wDVI2069,4070.67
wSR2154,21860.74wSR407,4430.66
wNDVI2186,21540.74wNDVI2441,4070.61
cD3wDVI2182,21580.71wDVI910,8780.60
wSR2158,21780.72wSR2362,23300.49
wNDVI2130,14180.71wNDVI2342,11540.54
cD4wDVI2176,21600.72wDVI2224,16960.51
wSR2152,21840.73wSR1696,22240.54
wNDVI2184,21520.73wNDVI2312,11520.50
cD5wDVI2140,16280.72wDVI2396,11480.45
wSR2156,21880.73wSR1516,23160.46
wNDVI2188,21560.73wNDVI2380,11480.48
cD6wDVI1604,8360.60wDVI2372,11560.40
wSR2084,7400.60wSR1731,23720.40
wNDVI2084,7400.60wNDVI2372,11240.46
Table 5. Correlation between the wavelet vegetation index comprising the best band combination and V25cmax of the leaves at the different canopy positions.
CoefficientsTop Middle Bottom
WVI|r|WVI|r|WVI|r|
cA6wDVI2420,14600.75wDVI820,7560.66wDVI1076,5640.76
wSR692,8200.73wSRC756,8200.67wSR500,19080.75
wNDVI756,6920.73wNDVI820,7560.66wNDVI1908,5000.74
cD1wDVI1827,4900.84wDVI2153,12250.82wDVI2205,6300.86
wSR667,16670.84wSR1623,21530.82wSR2146,21830.87
wNDVI2234,13090.82wNDVI2153,16230.81wNDVI2196,21460.85
cD2wDVI2243,4770.85wDVI1675,12910.80wDVI2205,6310.86
wSR629,16750.82wSR1359,17390.78wSR1995,7190.85
wNDVI1665,4790.83wNDVI1739,13590.78wNDVI1995,7190.85
cD3wDVI2286,4820.83wDVI2174,21560.78wDVI2186,21620.85
wSR486,20620.82wSR2178,21560.78wSR2158,21860.85
wNDVI2062,4860.81wNDVI2174,21560.76wNDVI1994,7180.85
cD4wDVI2288,4880.79wDVI2144,16320.75wDVI1424,6400.86
wSR504,10960.80wSR528,5840.74wSR2160,21920.83
wNDVI2240,9520.78wNDVI2144,14160.74wNDVI2000,7280.83
cD5wDVI1820,7320.76wDVI2140,16280.76wDVI1420,6520.84
wSR636,10680.79wSR2140,14200.76wSR2156,21880.82
wNDVI2092,7320.79wNDVI2140,14200.76wNDVI2188,21560.83
cD6wDVI2044,8040.74wDVI2148,8360.71wDVI1892,5160.82
wSR484,22760.77wSR2148,7400.74wSR516,19240.80
wNDVI2436,4200.77wNDVI2148,7400.74wNDVI1924,4000.80
Disclaimer/Publisher’s Note: The statements, opinions and data contained in all publications are solely those of the individual author(s) and contributor(s) and not of MDPI and/or the editor(s). MDPI and/or the editor(s) disclaim responsibility for any injury to people or property resulting from any ideas, methods, instructions or products referred to in the content.

