Article

Effects of Potential Large-Scale Irrigation on Regional Precipitation in Northwest China

1
State Key Laboratory of Hydrology-Water Resources and Hydraulic Engineering, Hohai University, Nanjing 210098, China
2
College of Oceanography, Hohai University, Nanjing 210098, China
3
State Key Laboratory of Simulation and Regulation of Water Cycle in River Catchment, China Institute of Water Resources and Hydropower Research, Beijing 100038, China
4
Information Center (Hydrology Monitor and Forecast Center), Ministry of Water Resources, Beijing 100053, China
*
Author to whom correspondence should be addressed.
Remote Sens. 2024, 16(1), 58; https://doi.org/10.3390/rs16010058
Submission received: 9 November 2023 / Revised: 18 December 2023 / Accepted: 18 December 2023 / Published: 22 December 2023
(This article belongs to the Section Atmospheric Remote Sensing)

Abstract

:
Understanding the impact of irrigation on the spatiotemporal characteristics of precipitation is important for the ecological stability of the arid region of Northwest China (NWC). In this study, the global climate model MPI-ESM-MR is utilized to provide the initial and lateral boundary conditions for the regional climate model RegCM4, enabling the simulation of the long-term climate of the arid NWC region under two Representative Concentration Pathways (RCPs). The study focuses on analyzing the differences in the spatiotemporal distribution, intensity, and frequency of precipitation before and after irrigation. Furthermore, the study explores the primary factors influencing changes in the spatiotemporal distribution characteristics of precipitation in the irrigation district and its downwind region. The results indicate that RegCM4 performs well in simulating the climatology and diurnal cycle of precipitation in the NWC, particularly excelling during the summer. Large-scale irrigation significantly impacts the structure of summer precipitation, leading to a notable increase in convective precipitation near the irrigation district and surrounding mountain ranges. Anomalous cyclonic circulation and enhanced vertical velocity enhancement provide dynamic conditions for increased precipitation in the irrigation district and surrounding mountainous regions. Furthermore, the evaporation of water vapor resulting from large-scale irrigation serves as an additional source of moisture, contributing to increased precipitation in the irrigation district and its downwind region. Due to the difference in climatic conditions between the western and eastern regions around the irrigated areas, the summer extreme precipitation in the west predominantly increases. At the same time, in the east, it predominantly decreases due to irrigation. The findings of this study contribute to a deeper understanding of the physical mechanisms through which agricultural irrigation influences precipitation in the arid region of the NWC, thereby providing scientific evidence for the sustainable utilization of water resources in the region.

1. Introduction

As the global population continues to grow and economies progress, the demand for water by humanity is increasing at a rapid pace, leading to a scarcity of water resources in many regions and highlighting the importance of water as a precious natural asset [1,2]. To alleviate the shortage of water resources, many countries have adopted inter-basin water transfer projects to spatially and temporally redistribute water resources, aiming to mitigate conflicts between agricultural, industrial, residential, and ecological water requirements. According to incomplete statistics, there have been over 160 completed or ongoing inter-basin water transfer projects worldwide, primarily distributed in more than 20 countries and regions, including the United States, Canada, the former Soviet Union, India, Pakistan, and China until 2015 [3]. Inter-basin water transfers typically involve diverting water from water-rich areas to water-scarce regions, with a significant portion allocated for agricultural irrigation. Irrigation, as a crucial agricultural activity, profoundly impacts the natural water cycle and the distribution of surface energy, exerting influence on regional climate through alterations in land–atmosphere interactions, boundary layer processes, and precipitation system dynamics [4,5,6,7,8,9]. Understanding the feedback between irrigation and climate and its impact on the water cycle is vital for the sustainable socioeconomic development of water-deficient regions.
Abundant research, including observational, statistical, and model simulation analyses, on the climatic effects of agricultural irrigation has revealed its influence on precipitation [10], near-surface temperature [11], surface fluxes [12], evapotranspiration [13], and cloud cover [14]. The evaporative cooling effect of irrigation has become widely recognized in academic circles. However, the impact of irrigation on precipitation exhibits diversity and complexity, contingent upon the net effects of various positive and negative feedback processes within the complex climate system. From a local perspective, irrigation increases low-level atmospheric humidity, enhancing convective available potential energy, thereby favoring the generation of convective precipitation [15,16]. Simultaneously, irrigation’s cooling and moistening effects induce a more stable and moist boundary layer, suppressing convection and negatively affecting convective precipitation [4]. From a non-local scale, irrigation can transport water vapor to downwind areas and influence precipitation in regions beyond the irrigation district through the occurrence of regional cyclonic circulation anomalies induced by irrigation [17]. Moreover, irrigation can alter soil moisture memory and low-level jets, impacting seasonal and extreme precipitation in irrigated and surrounding regions [18]. The net effects of irrigation on precipitation are highly intricate, leading to considerable uncertainty regarding the precipitation variations caused by the same irrigation processes in different regions.
The arid region of Northwest China (NWC), situated in the mid-latitude Eurasian continent, is recognized as one of the most climate-sensitive areas to global climate change [19]. The persistent aridity and limited water resources in this region pose significant challenges for the sustainable development of agriculture. Therefore, Chinese scholars have proposed diverting the water sources of the “Five Rivers and One River” (Yarlung Tsangpo River, Nu River, Lancang River, Jinsha River, Yalong River, and Dadu River) to the NWC to alleviate agricultural water shortages and improve the ecological environment [20,21]. Abundant water resources enhance the ecological stability of oases in the arid region of NWC (Xu and Lin, 2021) and provide favorable conditions for the development of irrigation agriculture [22]. However, large-scale agricultural irrigation can alter the regional water balance and water vapor circulation, impacting the region’s extreme and seasonal precipitation [23,24,25]. Li et al. [26] and Zou et al. [27] have previously indicated that the South-to-North Water Diversion Project has changed the climatic environment in irrigated areas of northern China and affected adjacent regions through momentum, heat, and water vapor exchanges. In recent years, the influence of irrigation on the regional climate in the NWC has become increasingly apparent. Existing studies have indicated alterations in precipitation’s spatial and temporal distribution, temperature decrease, and enhanced evaporation due to agricultural irrigation in the NWC. However, limited attention has been given to the impact of irrigation on extreme precipitation [28,29,30,31,32,33,34]. Furthermore, previous research results have shown uncertainty due to variations in model types, soil moisture conditions, and the influence of climate and geographical differences in simulated regions [5,14]. With the future advancement of water network engineering within China, the scale of irrigation in the NWC will further expand. However, there is a significant lack of research on the impact of agricultural irrigation, particularly on extreme precipitation, after the establishment of large-scale irrigation agriculture patterns.
In summary, previous studies on the regional climate effects of irrigation in the NWC have primarily focused on short-term simulations of current conditions, with limited research on the long-term impacts of extensive irrigation on local extreme precipitation. Therefore, this study focuses on the arid region of NWC and utilizes the regional climate model RegCM4 with a coupled irrigation scheme to conduct numerical simulation experiments. The aim is to quantitatively assess the impact of irrigation on extreme precipitation and systematically uncover the response mechanisms of local precipitation to irrigation. Section 2 overviews the study area, data sources, and modeling. The main research findings are presented in Section 3, followed by discussions in Section 4, and conclusions in Section 5. The results of this study can provide a reference for optimizing the layout of irrigation agriculture in the NWC and fine-tuning the allocation of water resources.

2. Model Description and Experimental Design
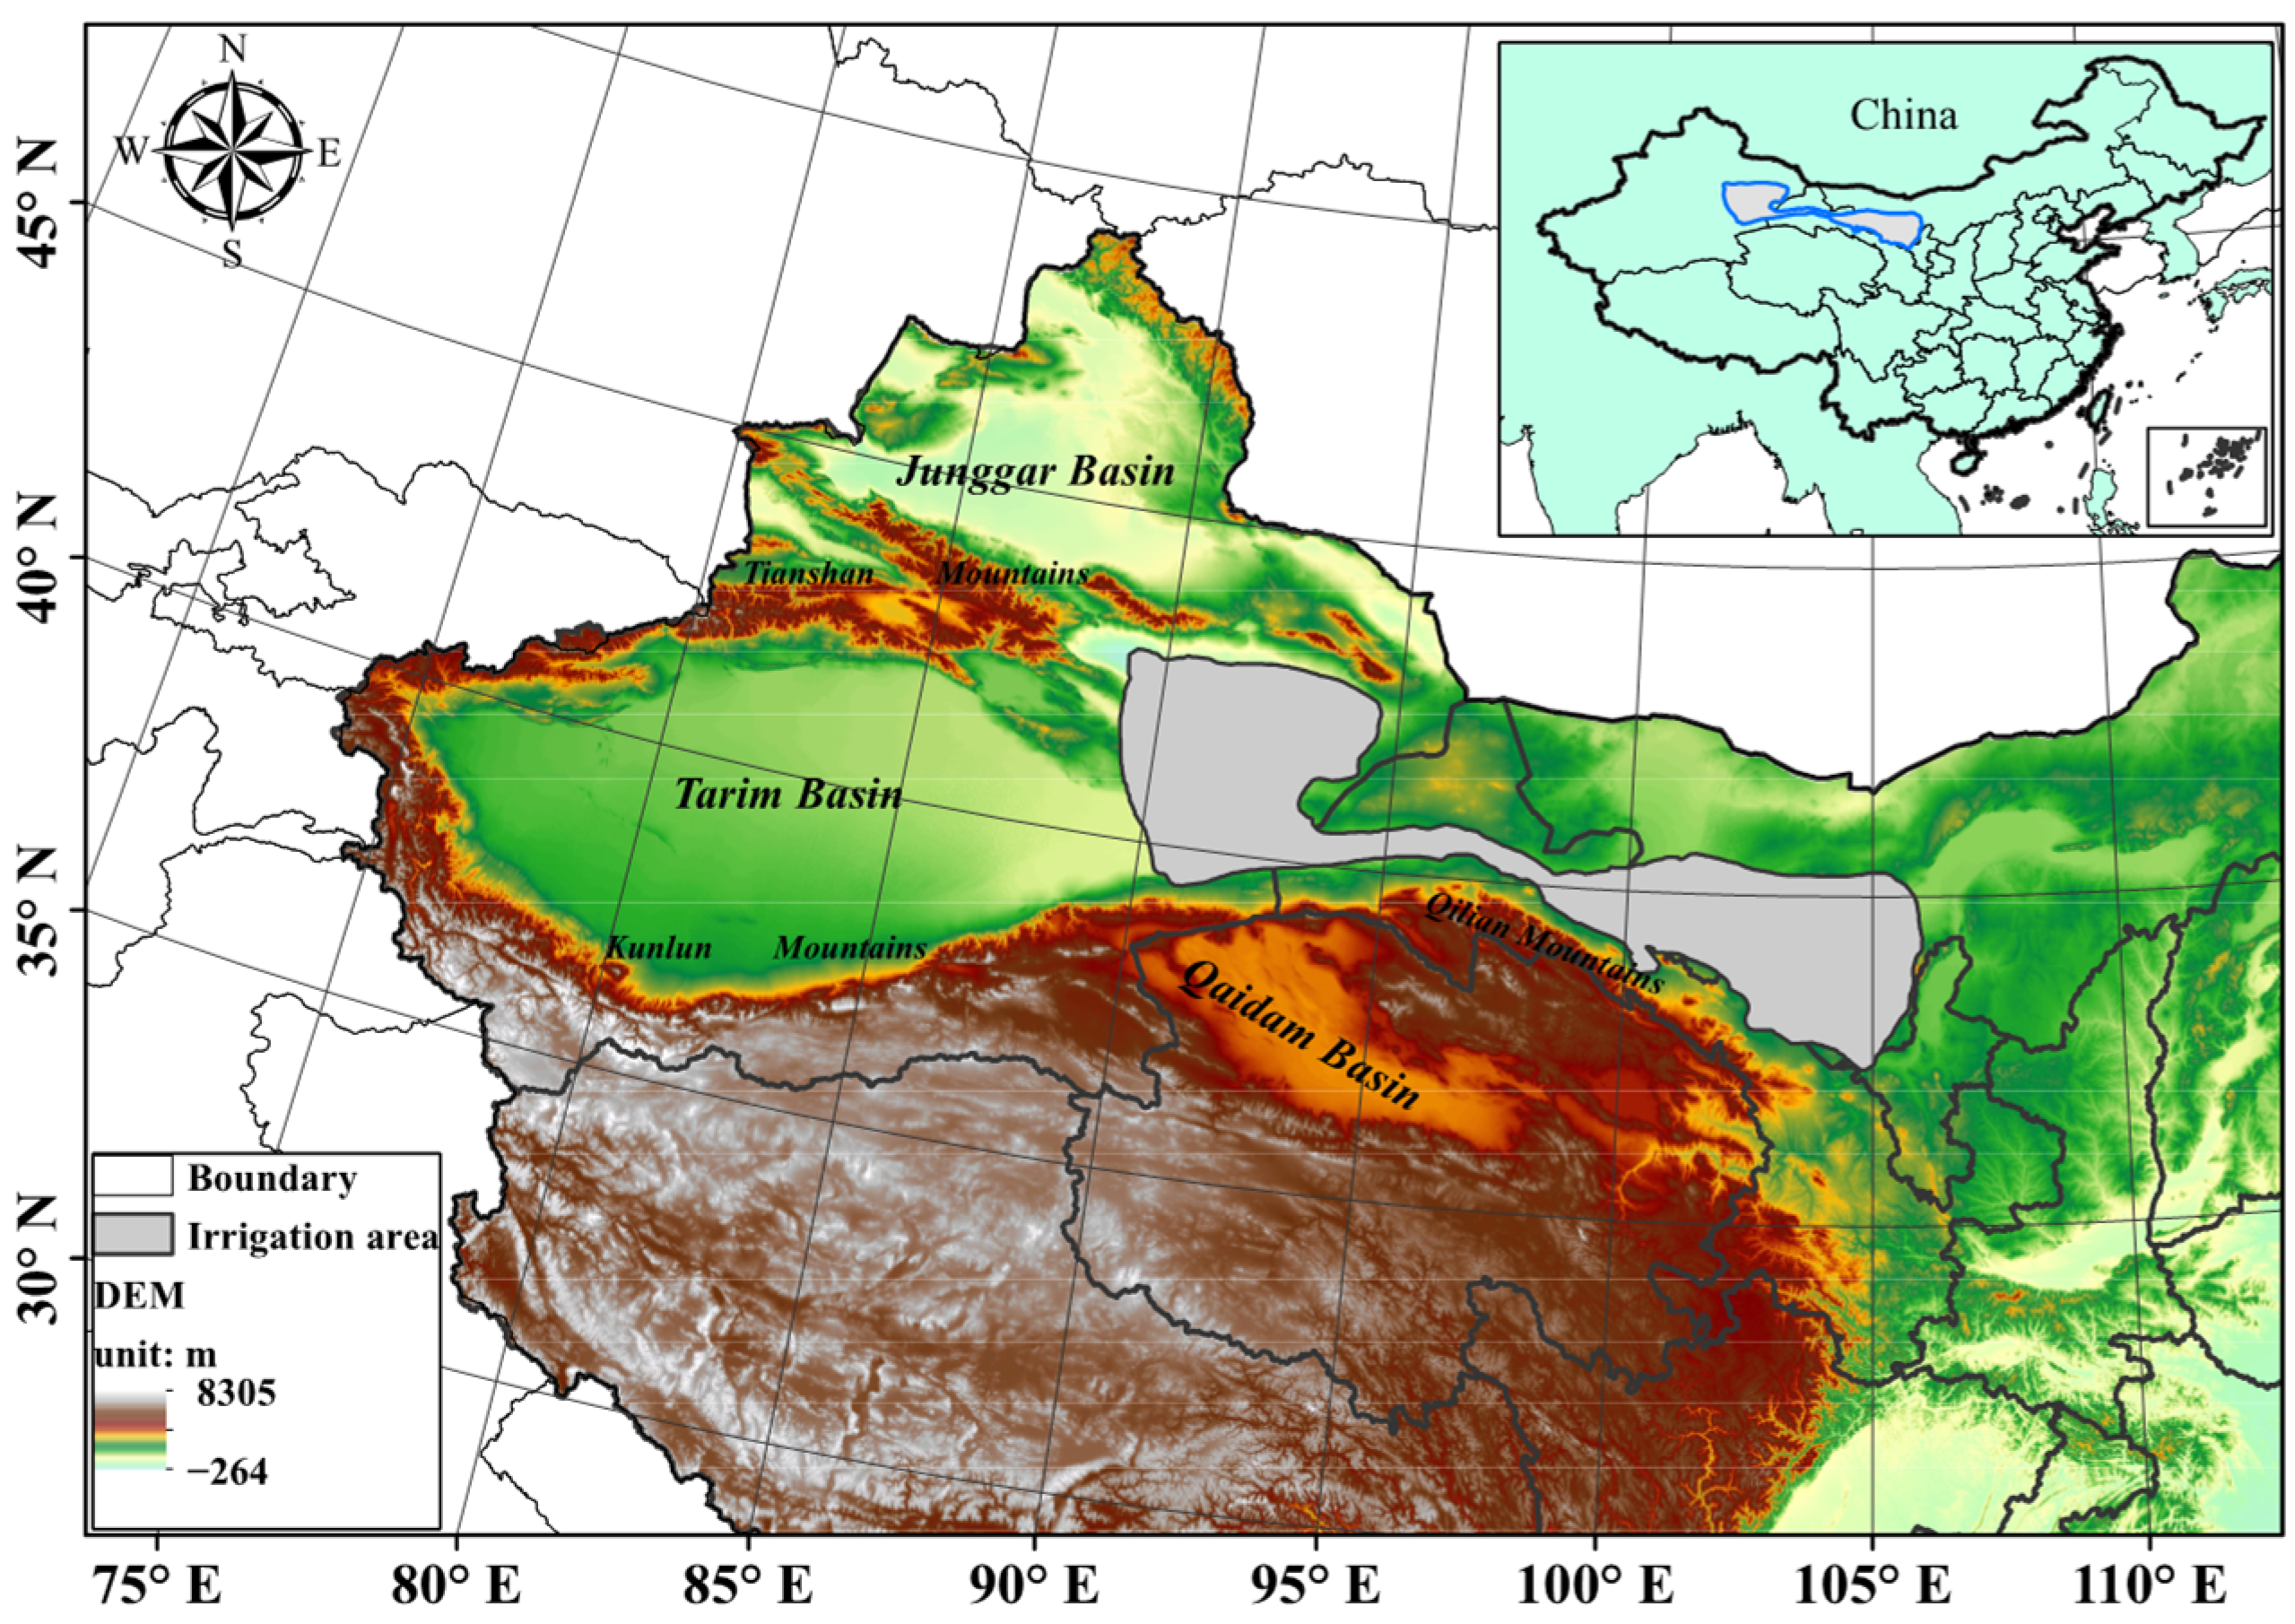
2.1. Study Area

The NWC possesses intricate geographical and climatic characteristics, harboring numerous mountain ranges such as the Altai Mountains, Tianshan Mountains, Qilian Mountains, and the Kunlun Mountains, alongside expansive desert basins, including the Junggar, Tarim, and Qaidam (Figure 1). The climate in this area gradually transitions from a continental semiarid climate in the east to a continental arid climate in the west. It is characterized by perennial aridity and scarce rainfall, with precipitation primarily concentrated in mountainous areas such as Tianshan and Qilian. Among them, the Tianshan Mountain range located in central Xinjiang is considered the “Central Asian Water Tower” due to its abundant precipitation, while the Qilian Mountains are often referred to as the “Oasis Water Tower” [35]. Figure 1 illustrates a potentially exploitable latent irrigated zone (highlighted in gray), located to the north of the Qilian Mountains and to the south of the Tianshan Mountains. This area has an average elevation of around 1300 m and receives an annual average precipitation of approximately 36 mm to 200 mm. Moreover, the region experiences an annual average temperature ranging from 6 °C to 10 °C, the annual evaporation exceeds 2000 mm to 3500 mm. Encompassing a total area of about 270,000 km2, this region mainly corresponds to a semi-desert land use type, according to the default land use/land cover (LULC) classification in RegCM4. Due to the lower altitudes prevailing in this region compared to the surrounding mountain ranges, it is highly suitable for utilizing elevation differences to support oasis agriculture through gravity-driven irrigation.

2.2. Model Description and Irrigation Scheme Implementation

This study utilized the RegCM4 model to simulate and investigate the impact of agricultural irrigation on local precipitation in the arid regions of NWC. RegCM4 is a regional climate model developed by the International Centre for Theoretical Physics in Italy, which has been widely used for climate change simulations in East Asia and has demonstrated good performance in previous studies [36,37]. This study configured the model with a domain encompassing the entire East Asia region, following the East Asia domain in phase II of the International Coordinated Regional Climate Downscaling Experiment framework (CORDEX-EA; [38]. This study’s physical parameterization schemes in RegCM4 were primarily derived from Gao’s scheme [39,40], demonstrating excellent simulation performance for China’s climate. In Gao’s scheme, the convective parameterization scheme and the land surface process scheme were the Emanuel scheme and the CLM3.5, respectively. The planetary boundary layer scheme and radiation scheme adopted the Holtslag scheme and NCAR CCM3 scheme, respectively. For more comprehensive details regarding the physical parameterization schemes and other model configurations utilized in this study, please refer to Table S1.
Due to the absence of an irrigation scheme in the default version of RegCM4, this study incorporates irrigation as an additional net rainfall input into the surface water cycle, which is expressed as follows:
P n e t = P r + P i + S m E
where Pnet represents the final net rainfall reaching the surface, Pr is precipitation, Pi is the irrigation amount, Sm is snowmelt, and E is evapotranspiration. In this study, the aforementioned irrigation mechanism was coupled with the CLM3.5 land surface scheme of RegCM4. This approach, which was previously implemented in the BATS1e land surface modules of RegCM3, has been used to simulate the regional climate effects of the South-to-North Water Diversion Project [27].

2.3. Data Resources

In this study, the initial and lateral boundary conditions for the dynamical downscaling simulations of RegCM4 are derived from the historical experiments with a 6-hourly time step and climate change projections (RCP4.5 and RCP8.5) from the MPI-ESM-MR model in CMIP5 [41]. The MPI-ESM-MR exhibits good simulation performance for the climate of China [42]. Developed by the Max Planck Institute for Meteorology in Germany [43], the model has a data resolution of 1.875° × 1.875°, with a historical time series spanning from 1949 to 2005 and a future projection spanning from 2006 to 2100. Conducting this study under the estimated climate conditions from 2020 to 2050 holds significant practical significance for medium- to long-term water resource planning in the NWC, while the historical reference group covers the period from 1970 to 2000. To validate the performance of RegCM4 in simulating historical climatology, this study also compares the dynamical downscaling results of ERA-Interim reanalysis data in RegCM4 with those of the MPI-ESM-MR. ERA-Interim, developed by the European Centre for Medium-Range Weather Forecasts, has a spatial resolution of 1.5° × 1.5° and has been widely utilized in dynamical downscaling simulations for the climate of China [44].
To assess the model’s performance in simulating precipitation, this study employed the CN05 precipitation observation dataset developed by the China Meteorological Administration for validation [45]. This dataset incorporates daily precipitation observations from 2416 meteorological stations in China and applies an interpolation method to generate a gridded dataset with a resolution of 0.5° × 0.5°. The dataset has been widely used to evaluate the performance of regional climate models in simulating the climate of China [46]. In this study, the output results of RegCM4 were interpolated to the grid centers with the same resolution as the CN05 dataset for comparative analysis.

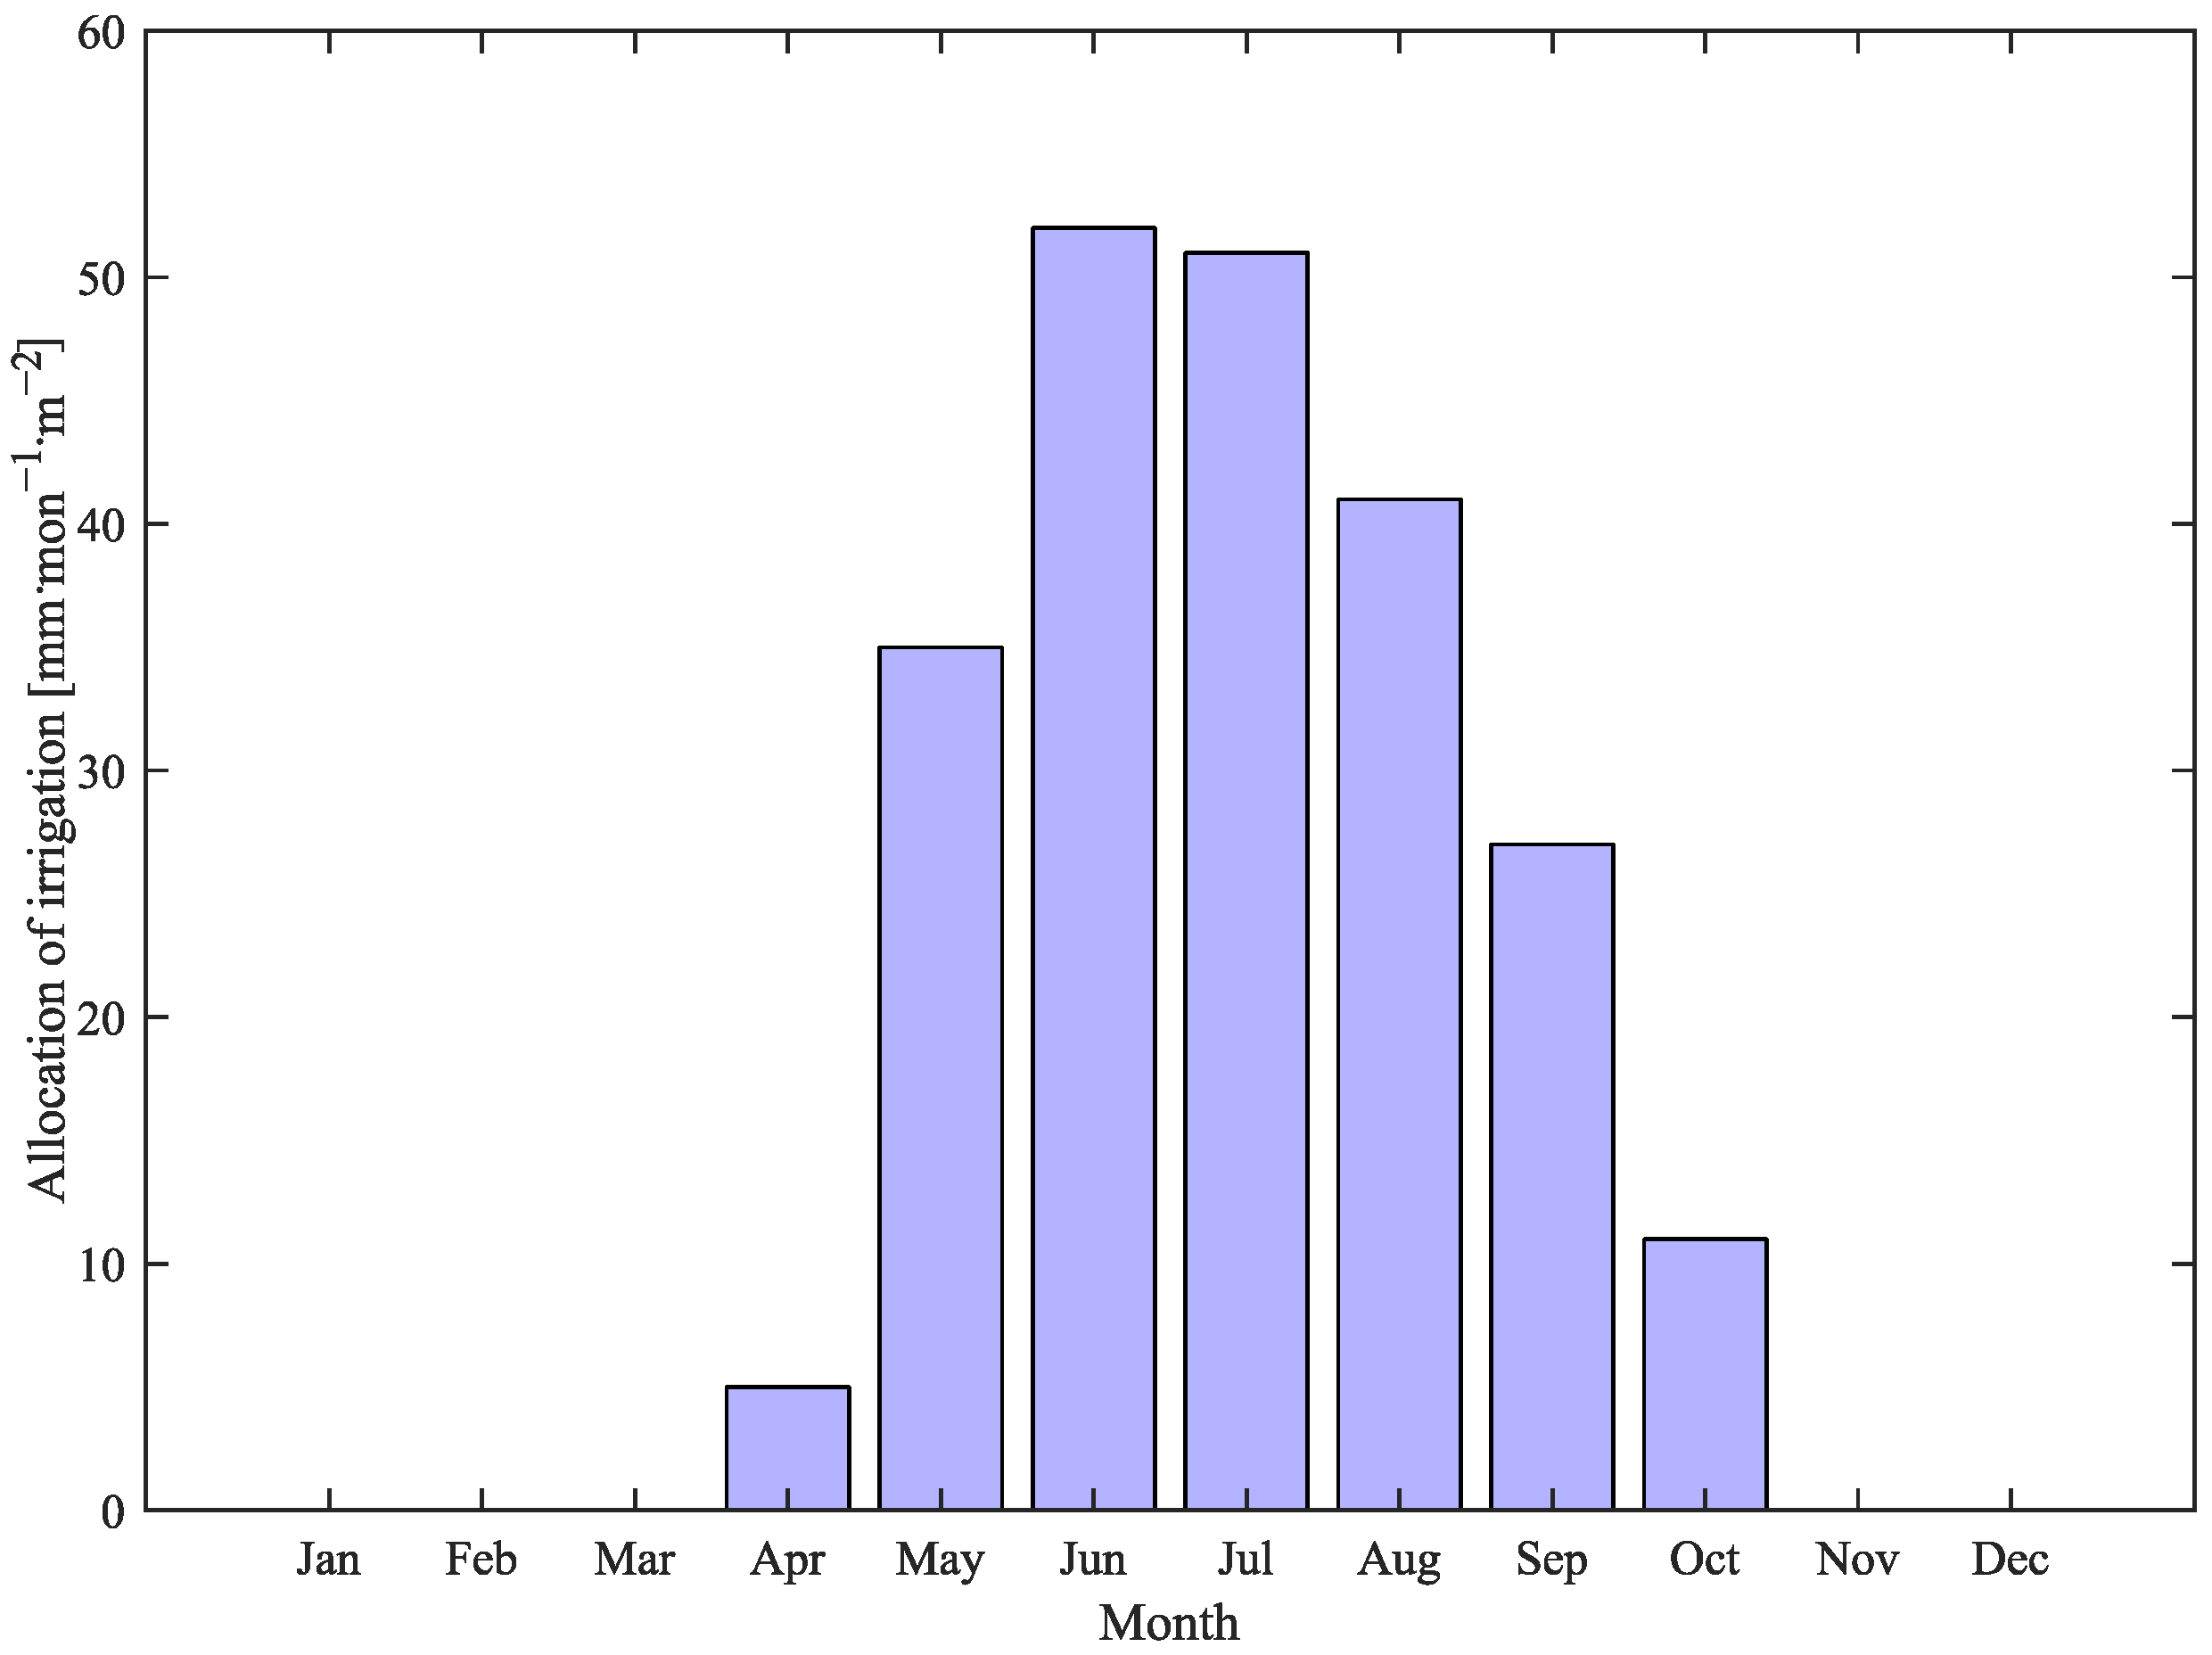
2.4. Experimental Design

Currently, representative hypothetical scenarios for water diversion in the NWC primarily focus on the “Five Rivers and One River” as water sources [20,21]. Depending on different water diversion elevations, the available water resources range from 30 billion m3 to 300 billion m3. Considering various factors, such as regional socioeconomic conditions and the ecological environment, the maximum water diversion capacity is estimated to be 40–60 billion m3 [20]. Therefore, this study proposes using 60 billion m3 as the maximum irrigation water amount and allocating it throughout the proportion of monthly evaporation in the total annual evaporation of the irrigated area (Figure 2). Assuming an equal irrigation water amount for each computational grid within the same period, the annual irrigation amount per unit area in the irrigation district is 224 mm·m−2, with the maximum irrigation amount in June being 50 mm·m−2.
As shown in Table 1, this study conducted six sets of experiments, among which EXP_RF1 and EXP_RF2 were designed to assess the simulation performance of the model in reproducing historical precipitation climatology. EXP_RF2 is the historical control experiment, compared with EXP_NR45 and EXP_NR85 used to analyze the precipitation changes under the RCP4.5 and RCP8.5. The impact of irrigation on precipitation is inferred from the differences between EXP_YR45 and EXP_NR45 under the RCP4.5 scenario, as well as between EXP_YR85 and EXP_NR85 under the RCP8.5 scenario. The default semiarid land type in the land surface process scheme for the irrigation-based experiments is modified to the C4 type.

2.5. Extreme Precipitation Indices

The climate science community widely acknowledges that the more indicators used in the analysis, the more reliable the characterization of changes in extreme precipitation events in specific regions [47]. The climate indices recommended by the Expert Team on Climate Change Detection, Monitoring, and Indices (ETCCDI) have been extensively employed to assess the changing characteristics of extreme precipitation events in various parts of the world [48,49,50], this study adopts nine extreme precipitation indices based on the ETCCDI recommendations. These indices aim to depict the impacts of widespread irrigation in the NWC on the intensity, frequency, and duration of extreme precipitation events. Examples of these indices include the Simple Daily Intensity Index (SDII), Consecutive Dry Days (CDD), and Extreme Wet Day Precipitation (R90p) (Table 2).

2.6. Distribution Functions Selected

In studying extreme precipitation events in the NWC, statistical distribution functions were employed to analyze their statistical variation characteristics. Various widely used distributions, such as the gamma, exponential, GEV (Generalized Extreme Value), and Gumbel distributions, were considered for modeling extreme events in hydrometeorological and other relevant fields [51,52,53,54]. The probability distribution function (PDF) and cumulative distribution functions (CDF) of the GEV, Gumbel, gamma, and exponential distributions can be found in Table 3. The parameters for these distributions were estimated using the L-moments method [55]. Moreover, the Kolmogorov–Smirnov (KS) statistical test and Akaike Information Criterion (AIC) were utilized to determine the best-fitting distribution. Through the KS test and AIC, the most suitable statistical distribution for extreme precipitation was selected, enabling precise analysis of the statistical variation characteristics of extreme precipitation indices (Table S2).

2.7. Moist Static Energy Analysis

In this study, moist static energy (MSE) was utilized to analyze the potential impacts of extensive irrigation on convection activity in the NWC. MSE (unit: kJ/kg) is a thermodynamic variable computed using temperature, potential height, and a water vapor mixing ratio. It provides a valuable assessment of possible changes in convection activity [56,57,58,59]. The formula for calculating MSE is as follows:
M S E = C p · T + g · z + L v · q
where T represents temperature, q denotes the mixing ratio of water vapor, z represents height, Cp represents the specific heat of air, Lv signifies the latent heat of evaporation, and g denotes the gravitational acceleration.

3. Results

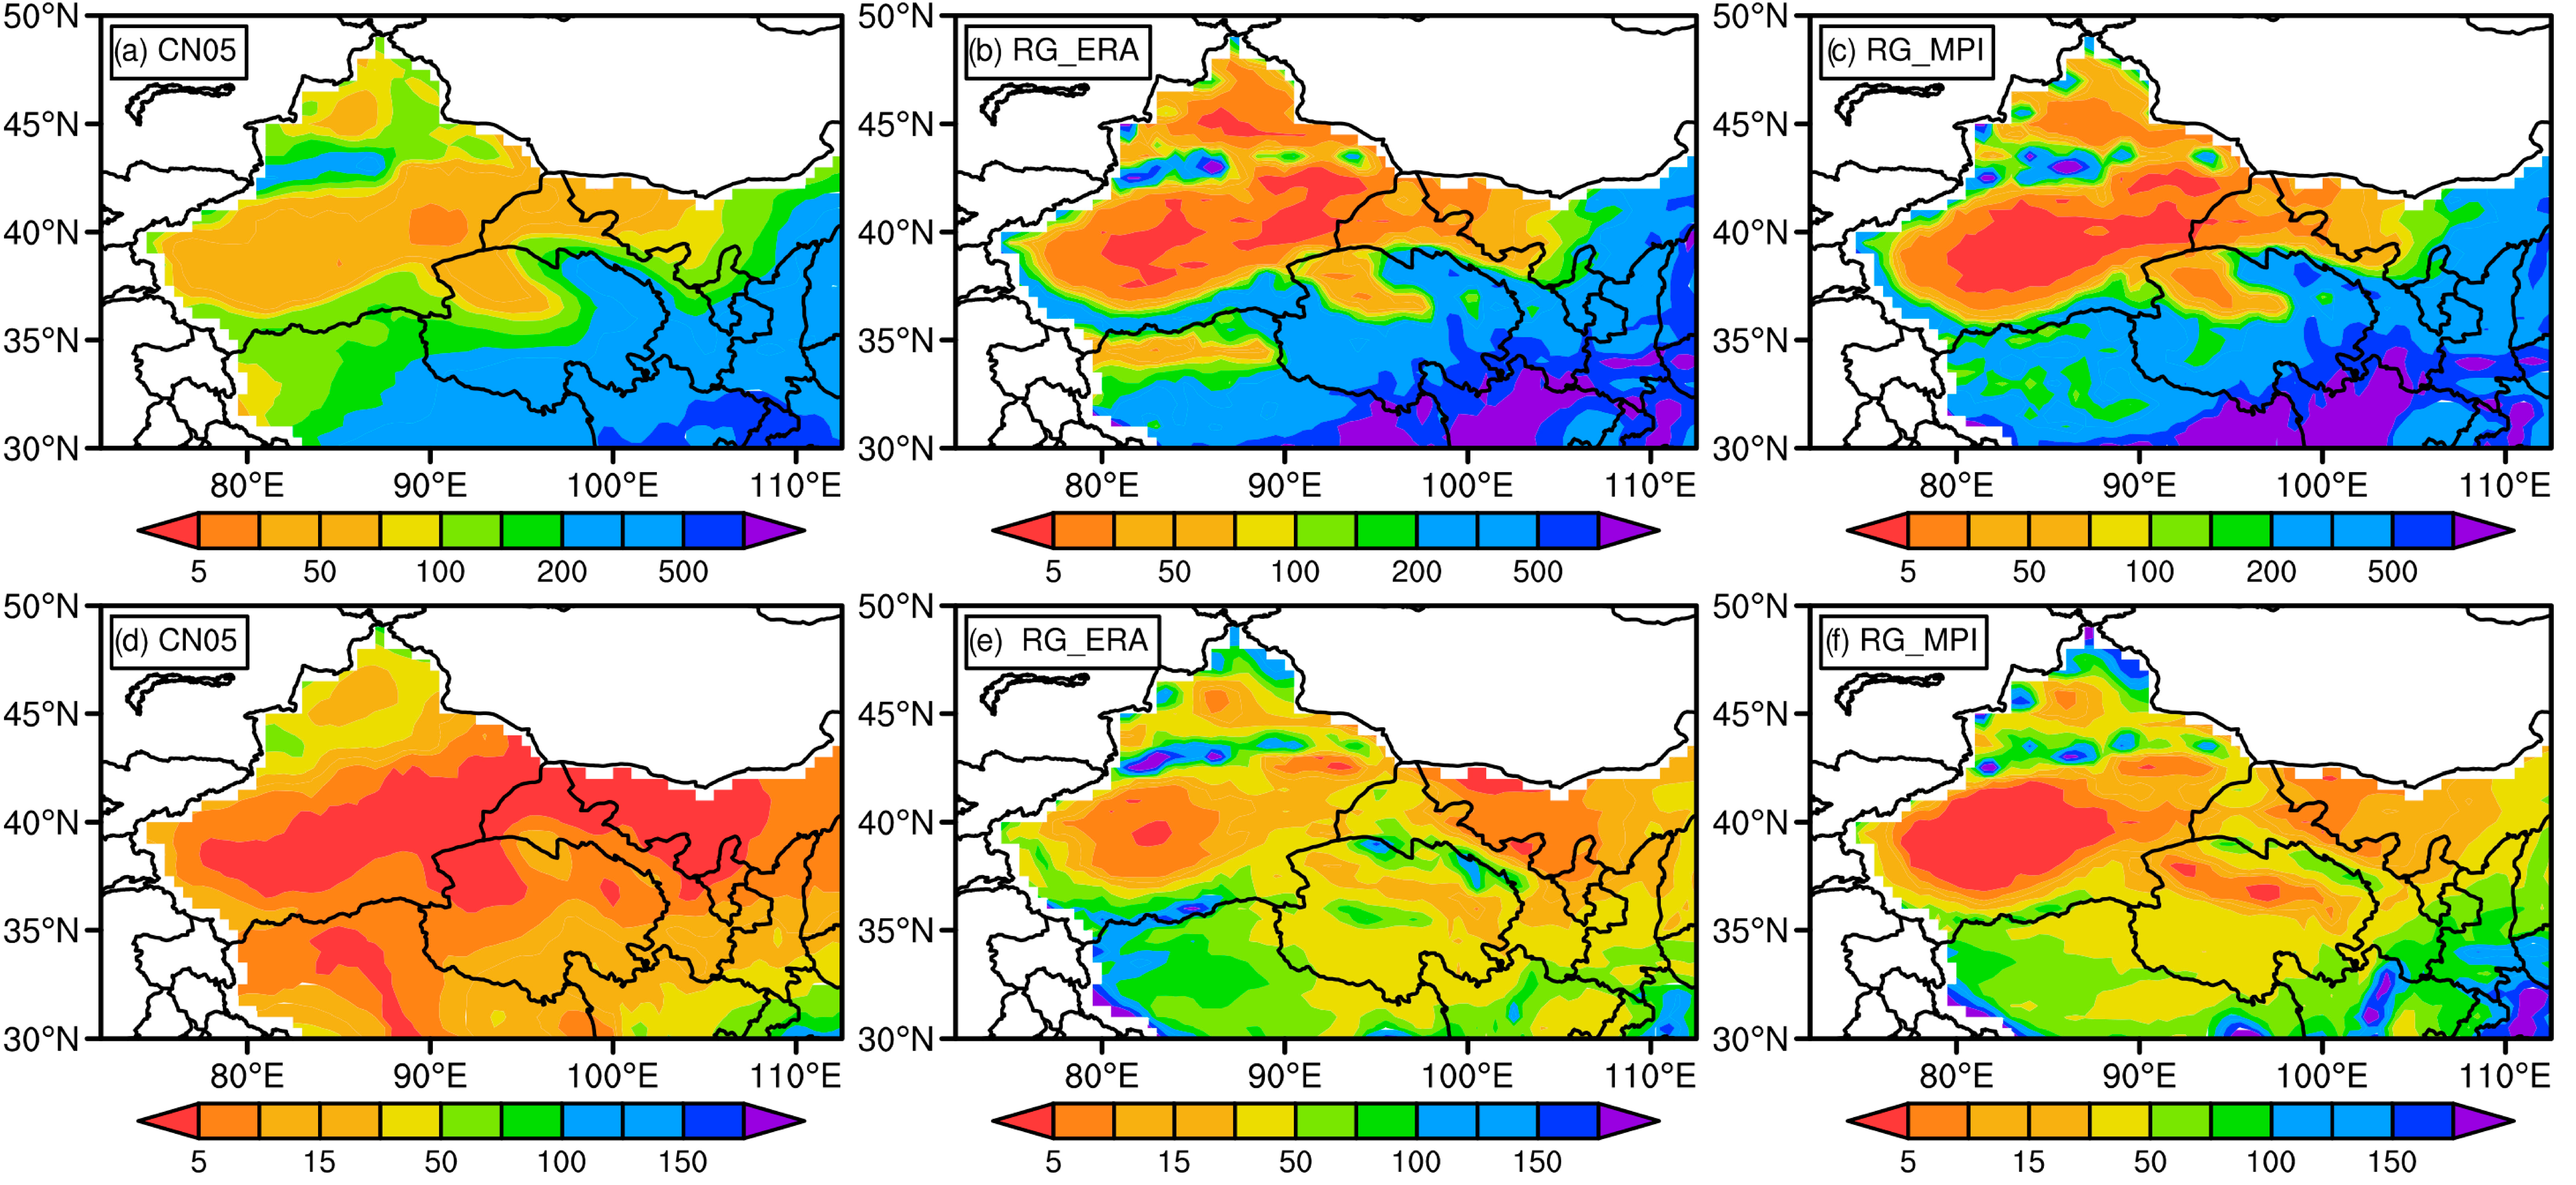
3.1. Performance of RegCM4 on Precipitation Climatology

Before analyzing irrigation’s impact on precipitation in the NWC, a comparison was made between the simulated precipitation from two historical experiments (EXP_RF1 and EXP_RF2) and the observed precipitation (CN05). This evaluation aimed to assess the simulation performance of RegCM4 in capturing the climatology of precipitation in the study area. As depicted in Figure 3a, the observed summer precipitation in the NWC gradually diminishes from southeast to northwest, exhibiting distinct rain belts in mountainous areas such as the Tianshan and Qilian Mountains. EXP_RF1 and EXP_RF2 adequately simulate the spatial patterns of summer precipitation in the NWC, with spatial correlation coefficients of 0.73 and 0.76, respectively, compared to the observed precipitation (Table 4). The two historical experiments accurately reproduce the distribution of rain belts along the Altai, Tianshan, Kunlun, and Qilian Mountains. However, RegCM4 tends to overestimate precipitation in mountain regions like the Tianshan and Kunlun Mountains, while underestimating precipitation in basins such as the Tarim and Junggar (Figure 3b,c). Similarly, the two historical experiments simulate winter precipitation patterns similar to observations but exhibit a wet bias in mountain regions (Figure 3d–f). The spatial correlation coefficients between the winter precipitation simulated by EXP_RF1 and EXP_RF2 and the observed precipitation reach 0.36 and 0.45, respectively (Table 4). CN05 as an observational analysis datum derives precipitation and temperature distribution based on interpolation of meteorological station observations. However, the western region of China often suffers from sparse and unevenly distributed observation stations, which hampers the ability of CN05 to accurately represent the precipitation distribution in that area. Due to the geographical complexity and mountainous environment in western China, precipitation exhibits significant variability and unevenness spatially associated with orography. These geographical details play a crucial role in precipitation distribution, but due to the uneven distribution of observation stations, CN05 data may not fully capture these details. When comparing our simulation results with CN05, we should bear these in mind. Overall, RegCM4 demonstrates a relatively good performance in reproducing the historical spatial patterns of precipitation climatology in the NWC, with a generally better ability to simulate summer precipitation than winter.

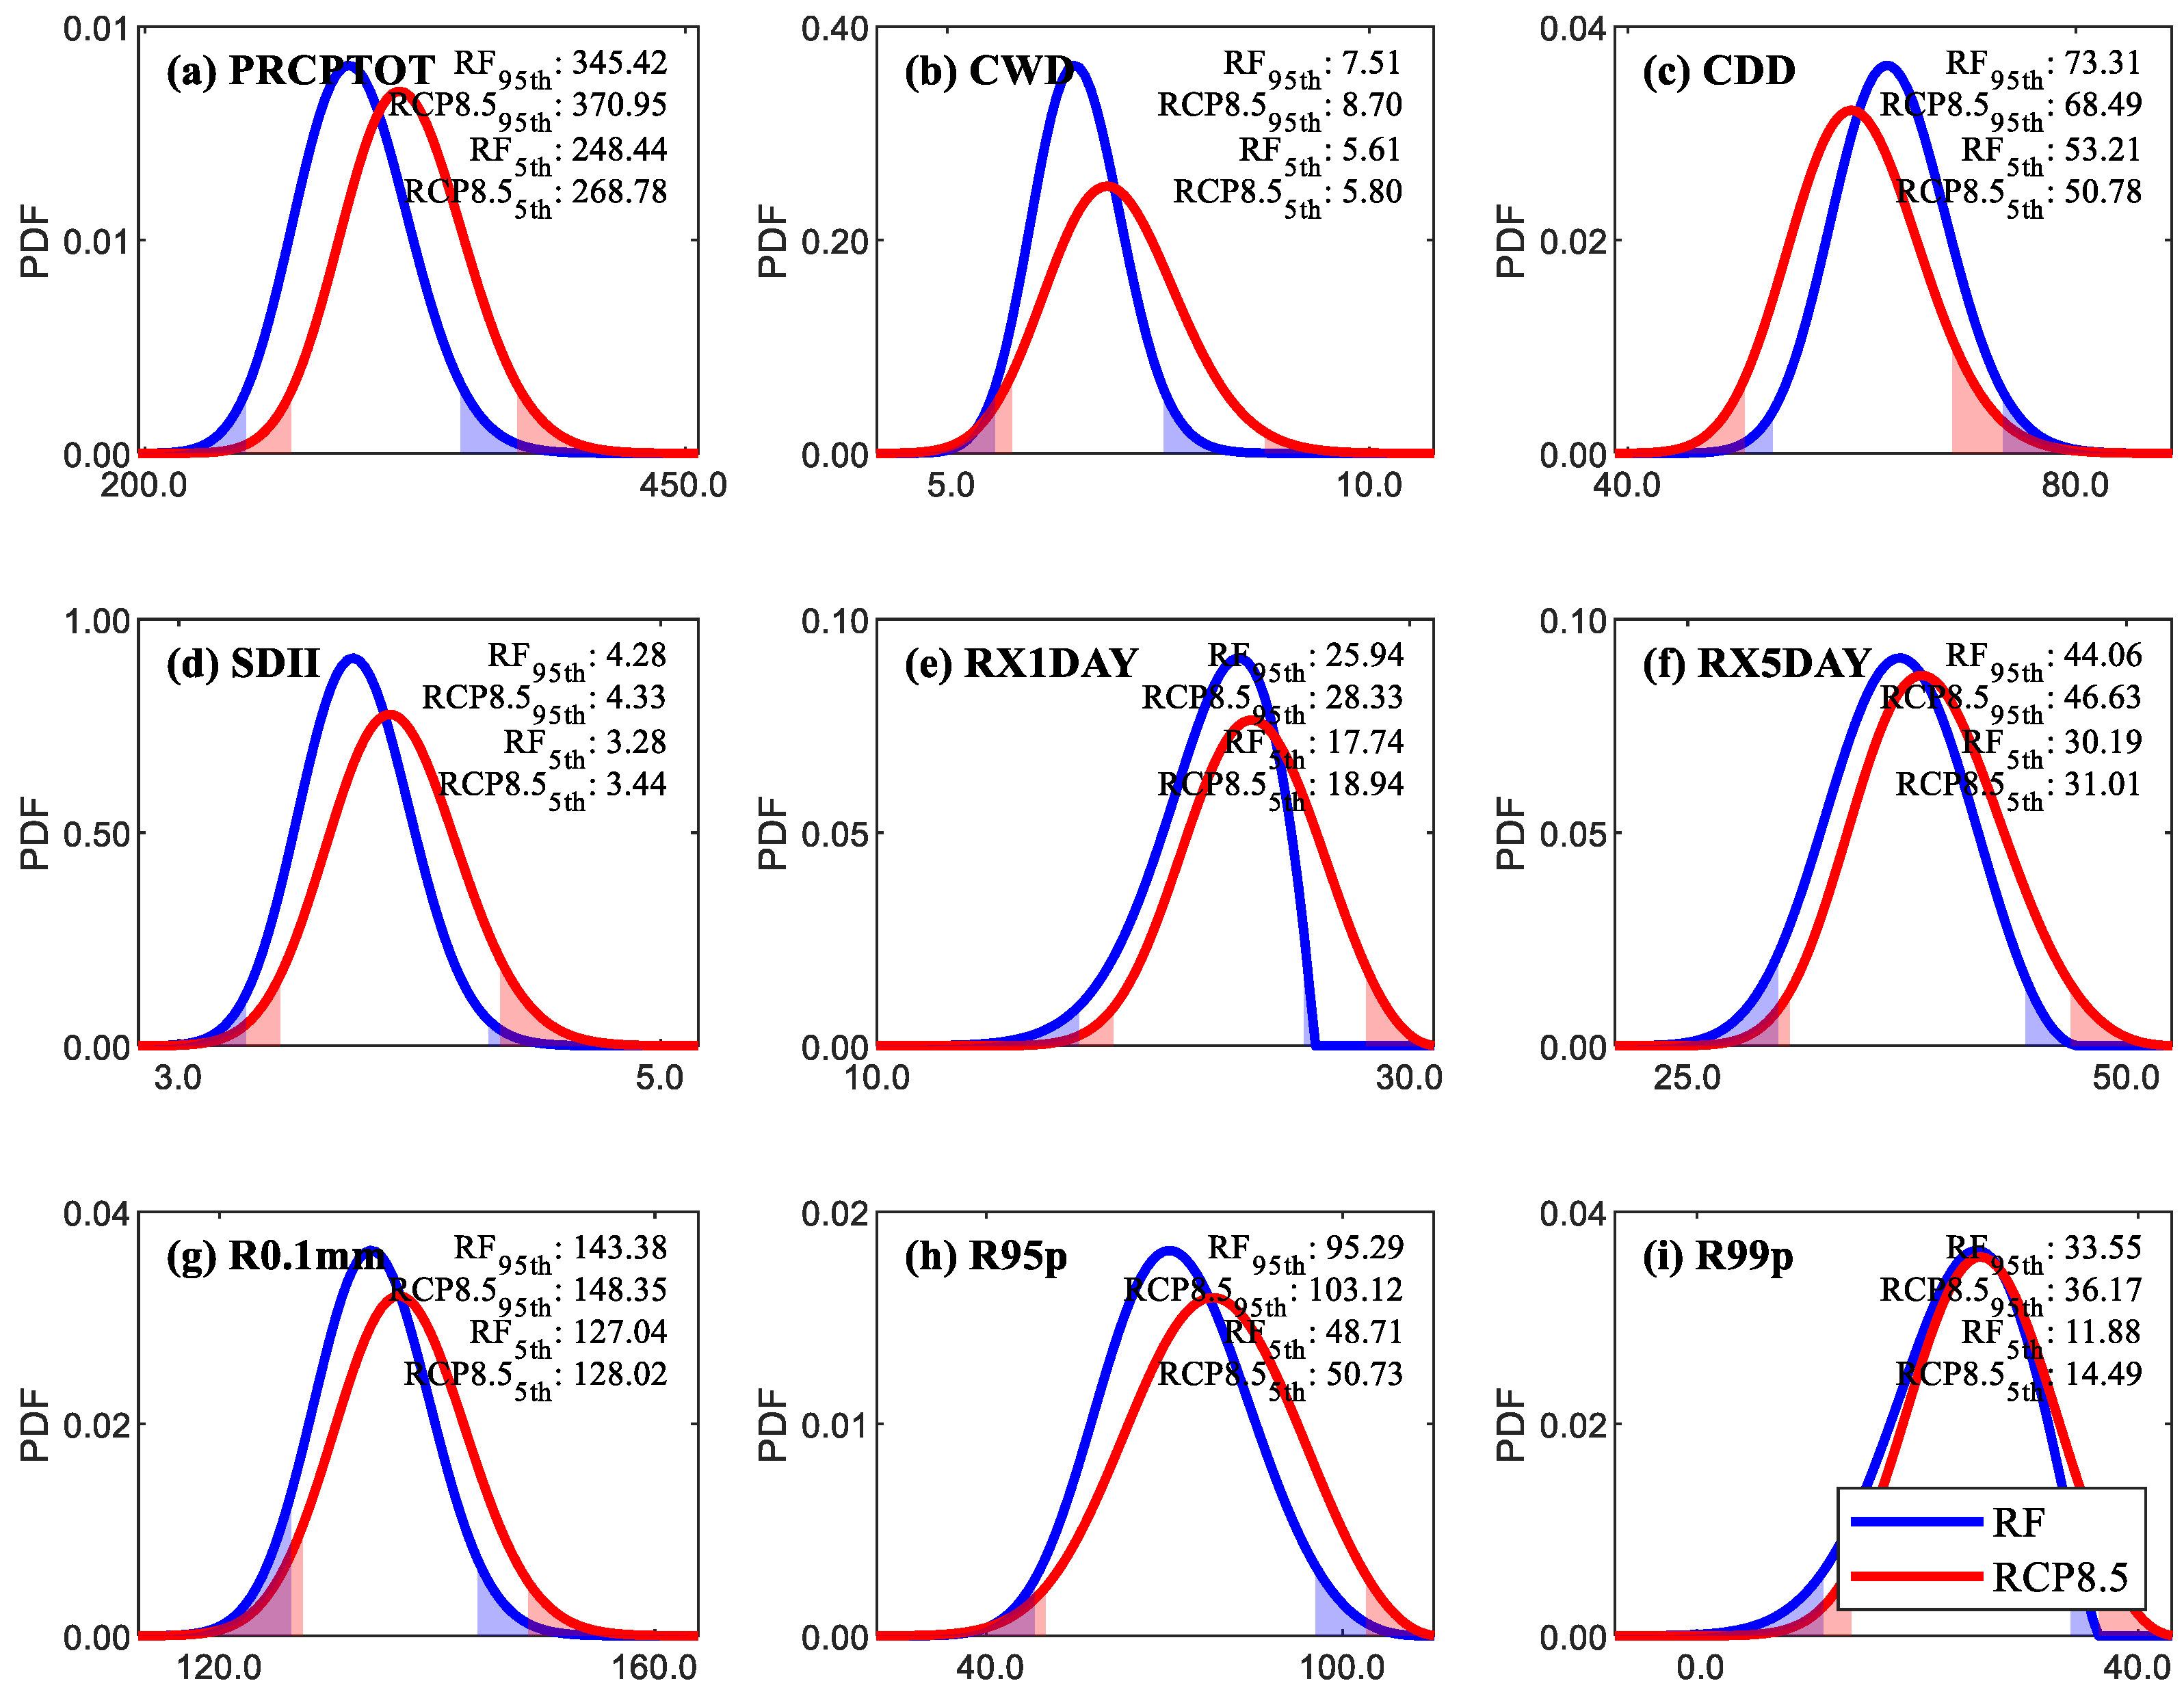
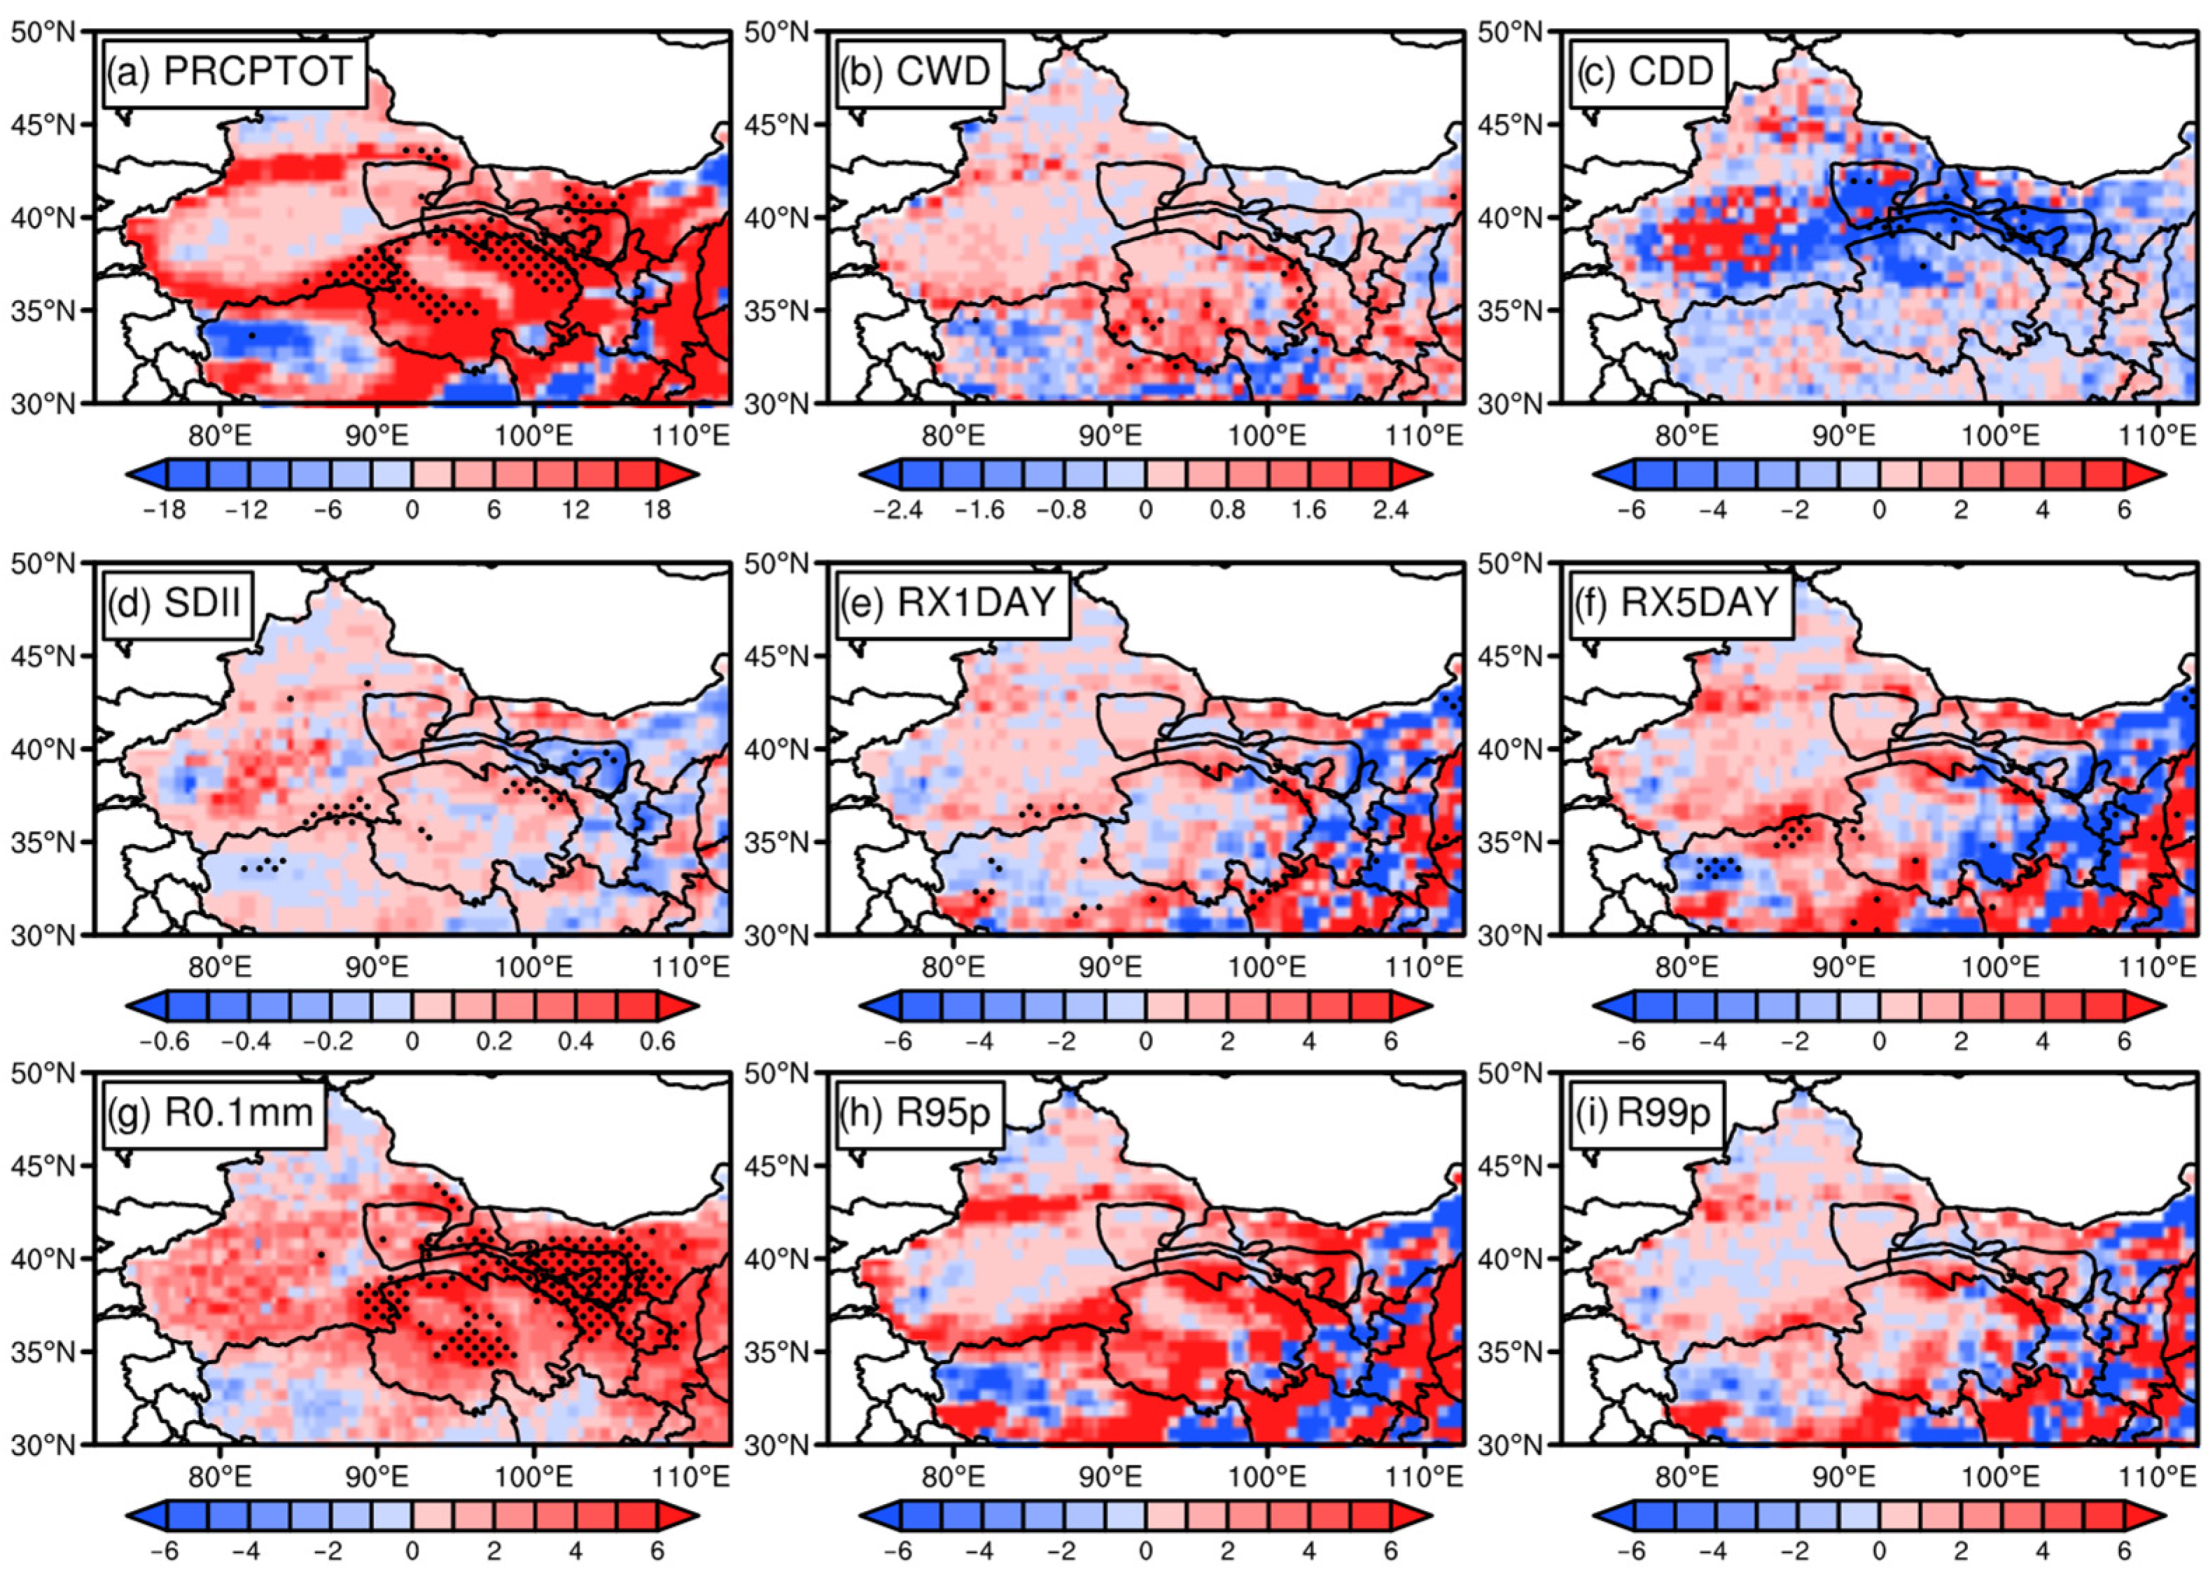
3.2. Impact of Climate Change on Precipitation Climatology

Figure 4 presents the spatial pattern of multi-year average changes in extreme precipitation indices in the NWC during the mid-21st century (2021–2050) under RCP8.5. This pattern is compared to the 1971–2000 reference period. As per Figure S1 and Figure 4, the two RCPs forecast an enhanced intensity and frequency of extreme precipitation, leading to an overall trend in the NWC towards a wetter climate in the future. Notably, significant increases in PRCPTOT are observed in mountainous areas like the Altai Mountains, Tianshan Mountains, Qilian Mountains, and Kunlun Mountains (p < 0.05), as shown in Figure 4a. However, regions with lower elevation such as the Qaidam Basin, Junggar Basin, and Tarim Basin register less precipitation increase. The spatial patterns of extreme precipitation indices, namely SDII, RX1DAY, RX5DAY, R95p, and R99p, are largely consistent with PRCPTOT, showing more significant increases in mountainous areas and slight decreases in lower-elevation basins. Particularly, in the eastern part of Gansu, Ningxia, and Inner Mongolia Autonomous Region, despite an overall increase in precipitation and a decrease in CDD, the extreme precipitation indices (R99p, RX5DAY, RX1DAY) show a decreasing trend under the warming scenarios (RCP8.5 and RCP4.5). This can be attributed to the circulation changes induced by warming, as this region is located at the boundary between the East Asian summer monsoon and the westerlies, making it highly sensitive to circulation changes associated with climate variability. Extreme precipitation in this region is often closely related to the intensity of the East Asian summer monsoon. The intensity of the East Asian summer monsoon is negatively correlated with the Western Pacific Subtropical High (WPSH). In the future climate projection experiments, both the area and intensity of the WPSH are expected to increase, with a significant westward extension. The linear increasing trend is highest under the RCP8.5 scenario. This will likely reduce the intensity of the East Asian summer monsoon and decrease the moisture transport in this transitional zone, leading to a decline in extreme precipitation indices. Therefore, despite the overall increase in precipitation and a decrease in CDD due to increased irrigation input, the downward trend in extreme precipitation indices in the mentioned regions can be attributed to circulation changes induced by warming. This highlights the high sensitivity of this region to circulation changes associated with climate variability and emphasizes the important influence of the intensity of the East Asian summer monsoon and the changes in the Western Pacific Subtropical High on precipitation characteristics in this area. In conclusion, the projected future climate points towards a more severe impact from extreme precipitation in mountainous regions of NWC, while the impact in lower-elevation basins is relatively mild.
To further understand the changing characteristics of extreme precipitation in the NWC under the two RCPs during the mid-21st century (2021–2050) compared to the historical reference period (1971–2000), the PDF of two sub-periods of equal length for extreme precipitation indices was analyzed using the optimal distribution (Figure S2 and Figure 5). Figure S2 and Figure 5 show that most extreme precipitation indices exhibited a rightward shift in their PDF, except for CDD. For example, under the RCP8.5, the PDF of PRCPTOT, representing the 95th percentile, increased from 345.42 mm/year during the period from 1971 to 2000 to 370.95 mm/year during the timeframe from 2021 to 2050 (Figure 5a). Similarly, the PDF value of SDII, corresponding to the 95th percentile, showed a slight rise from 4.28 mm/day from 1971 to 2000 to 4.33 mm/day from 2021 to 2050 (Figure 5d). Furthermore, the PDF value of R0.1, also associated with the 95th percentile, increased from 143.38 days/year between 1971 and 2000 to 148.35 days/year from 2021 to 2050 (Figure 5g). Moreover, compared to the reference period, the PDFs of extreme precipitation indices under the two RCPs were flatter and exhibited a wider distribution range, indicating a larger interannual variation of extreme precipitation under future climate change. All the results above indicate that the NWC is projected to become wetter with increased frequency and intensity of extreme precipitation events. Notably, although the overall trend of extreme precipitation indices in the NWC under the two RCPs shows a rightward shift, indicating a tendency towards increased wetness in the future, most extreme precipitation indices in the irrigated areas do not exhibit a consistent rightward or leftward shift (Figures S3 and S4).

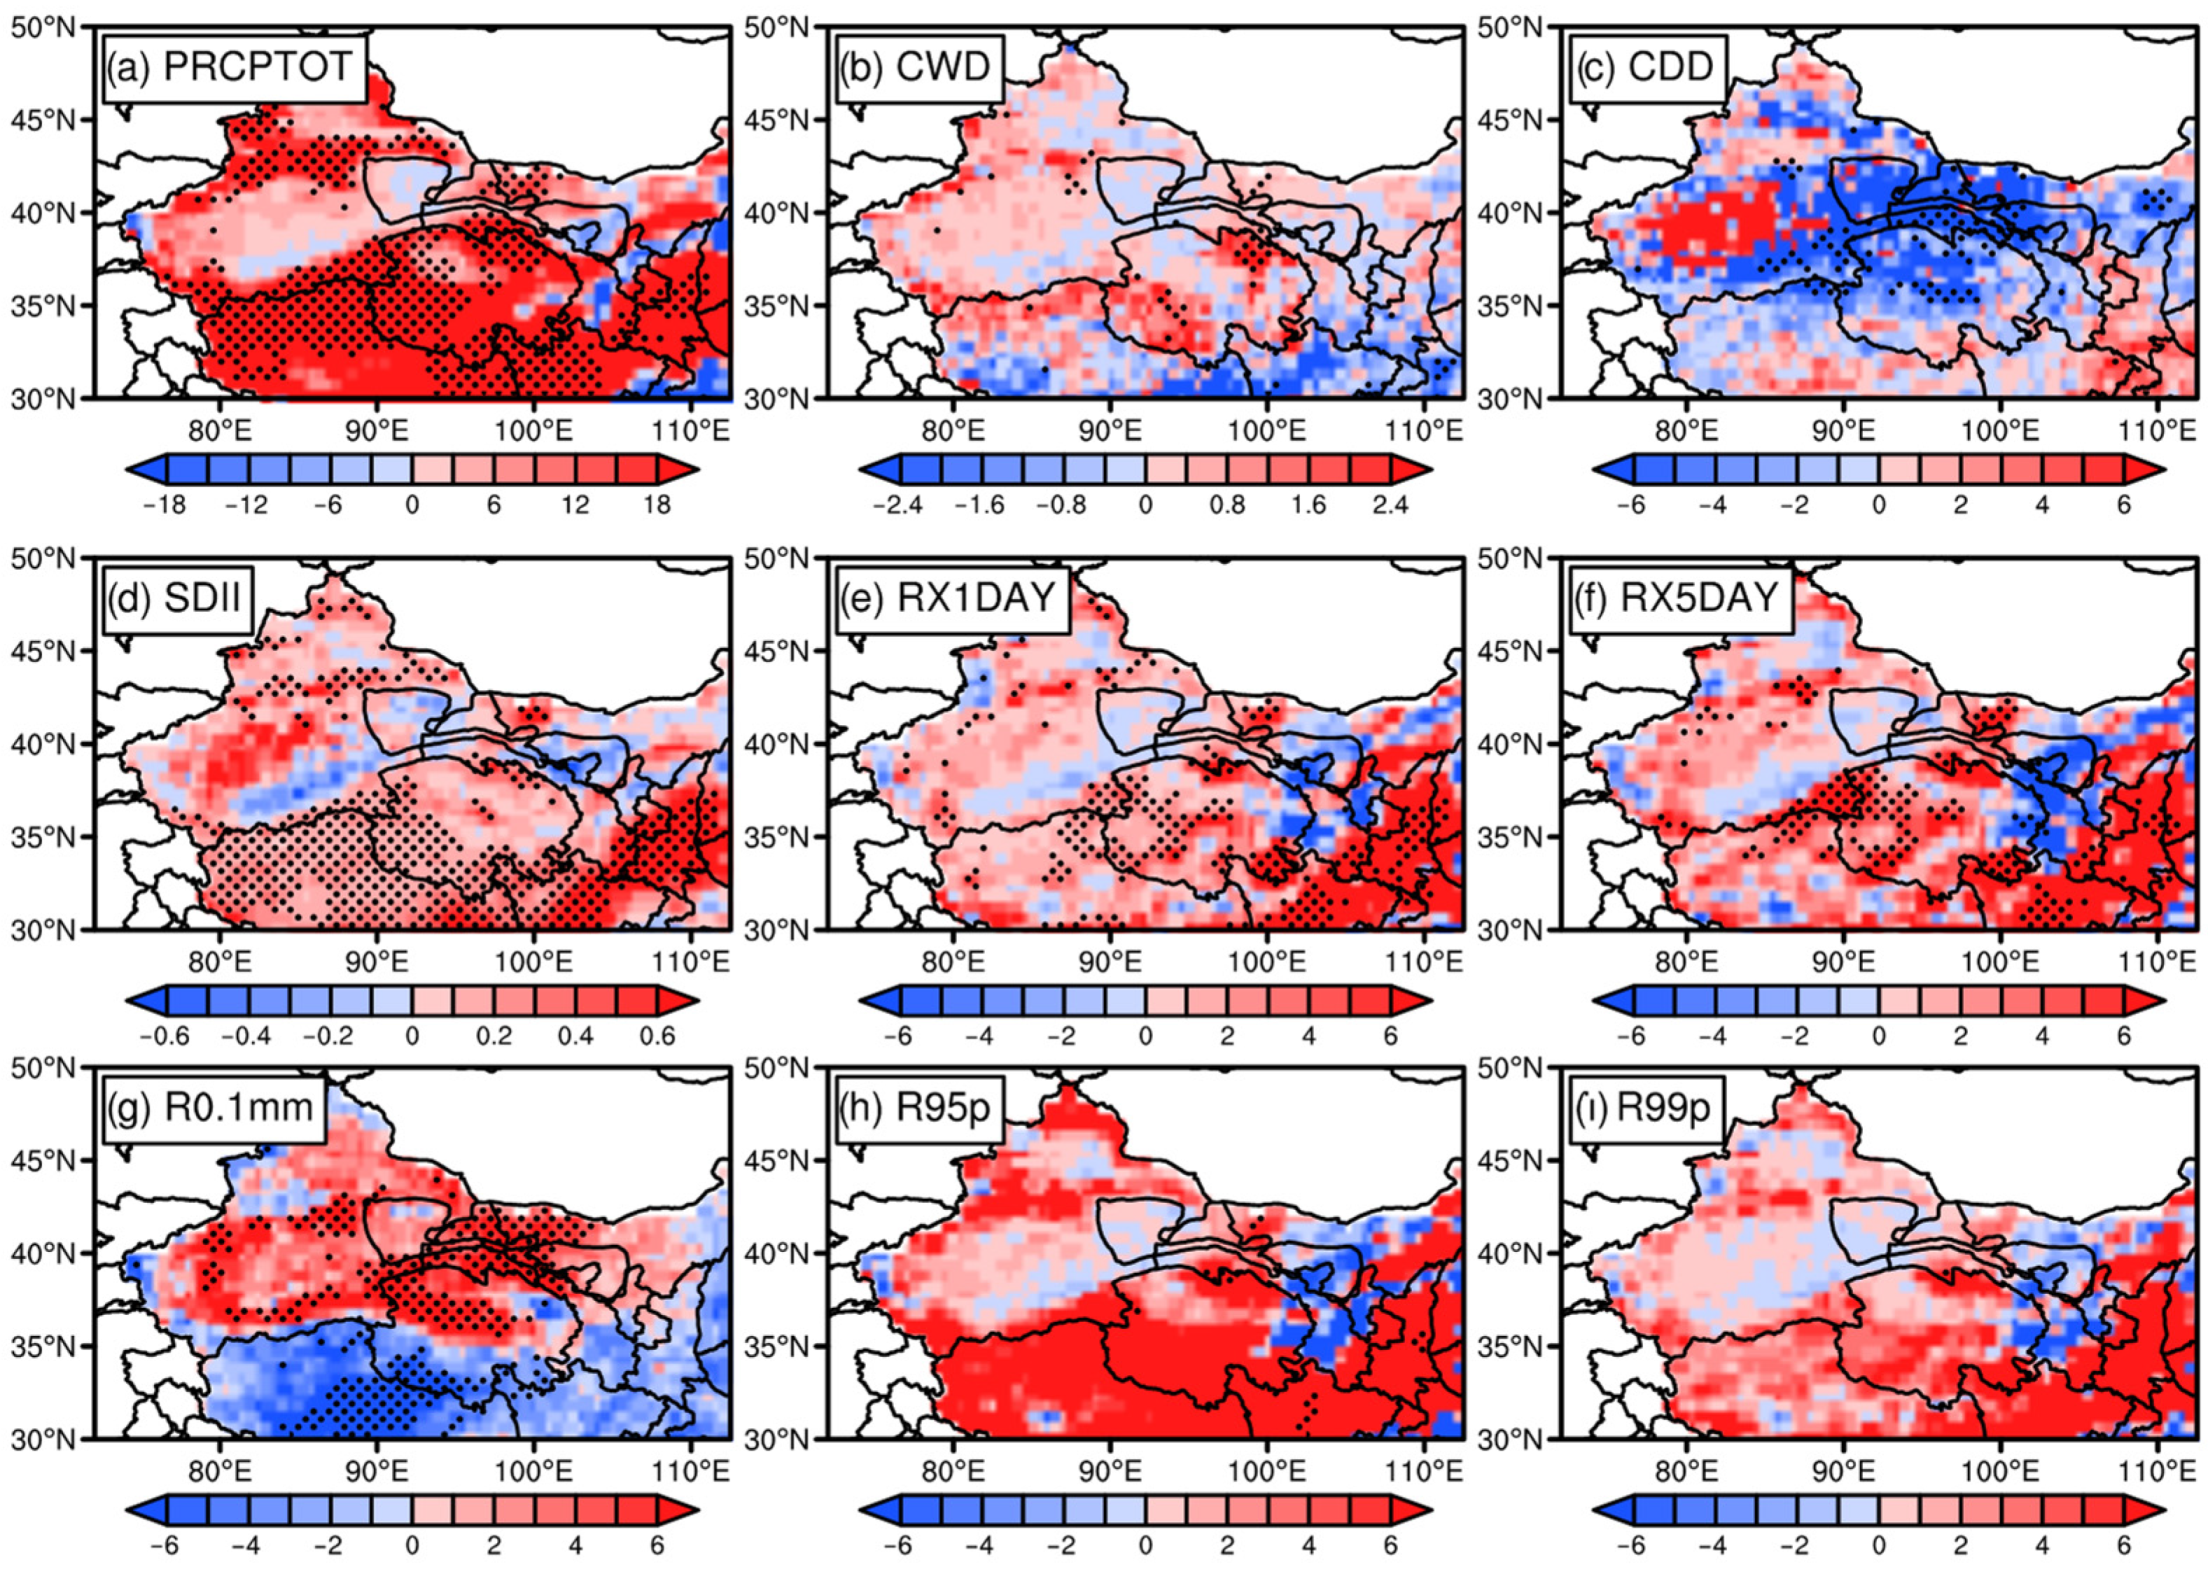
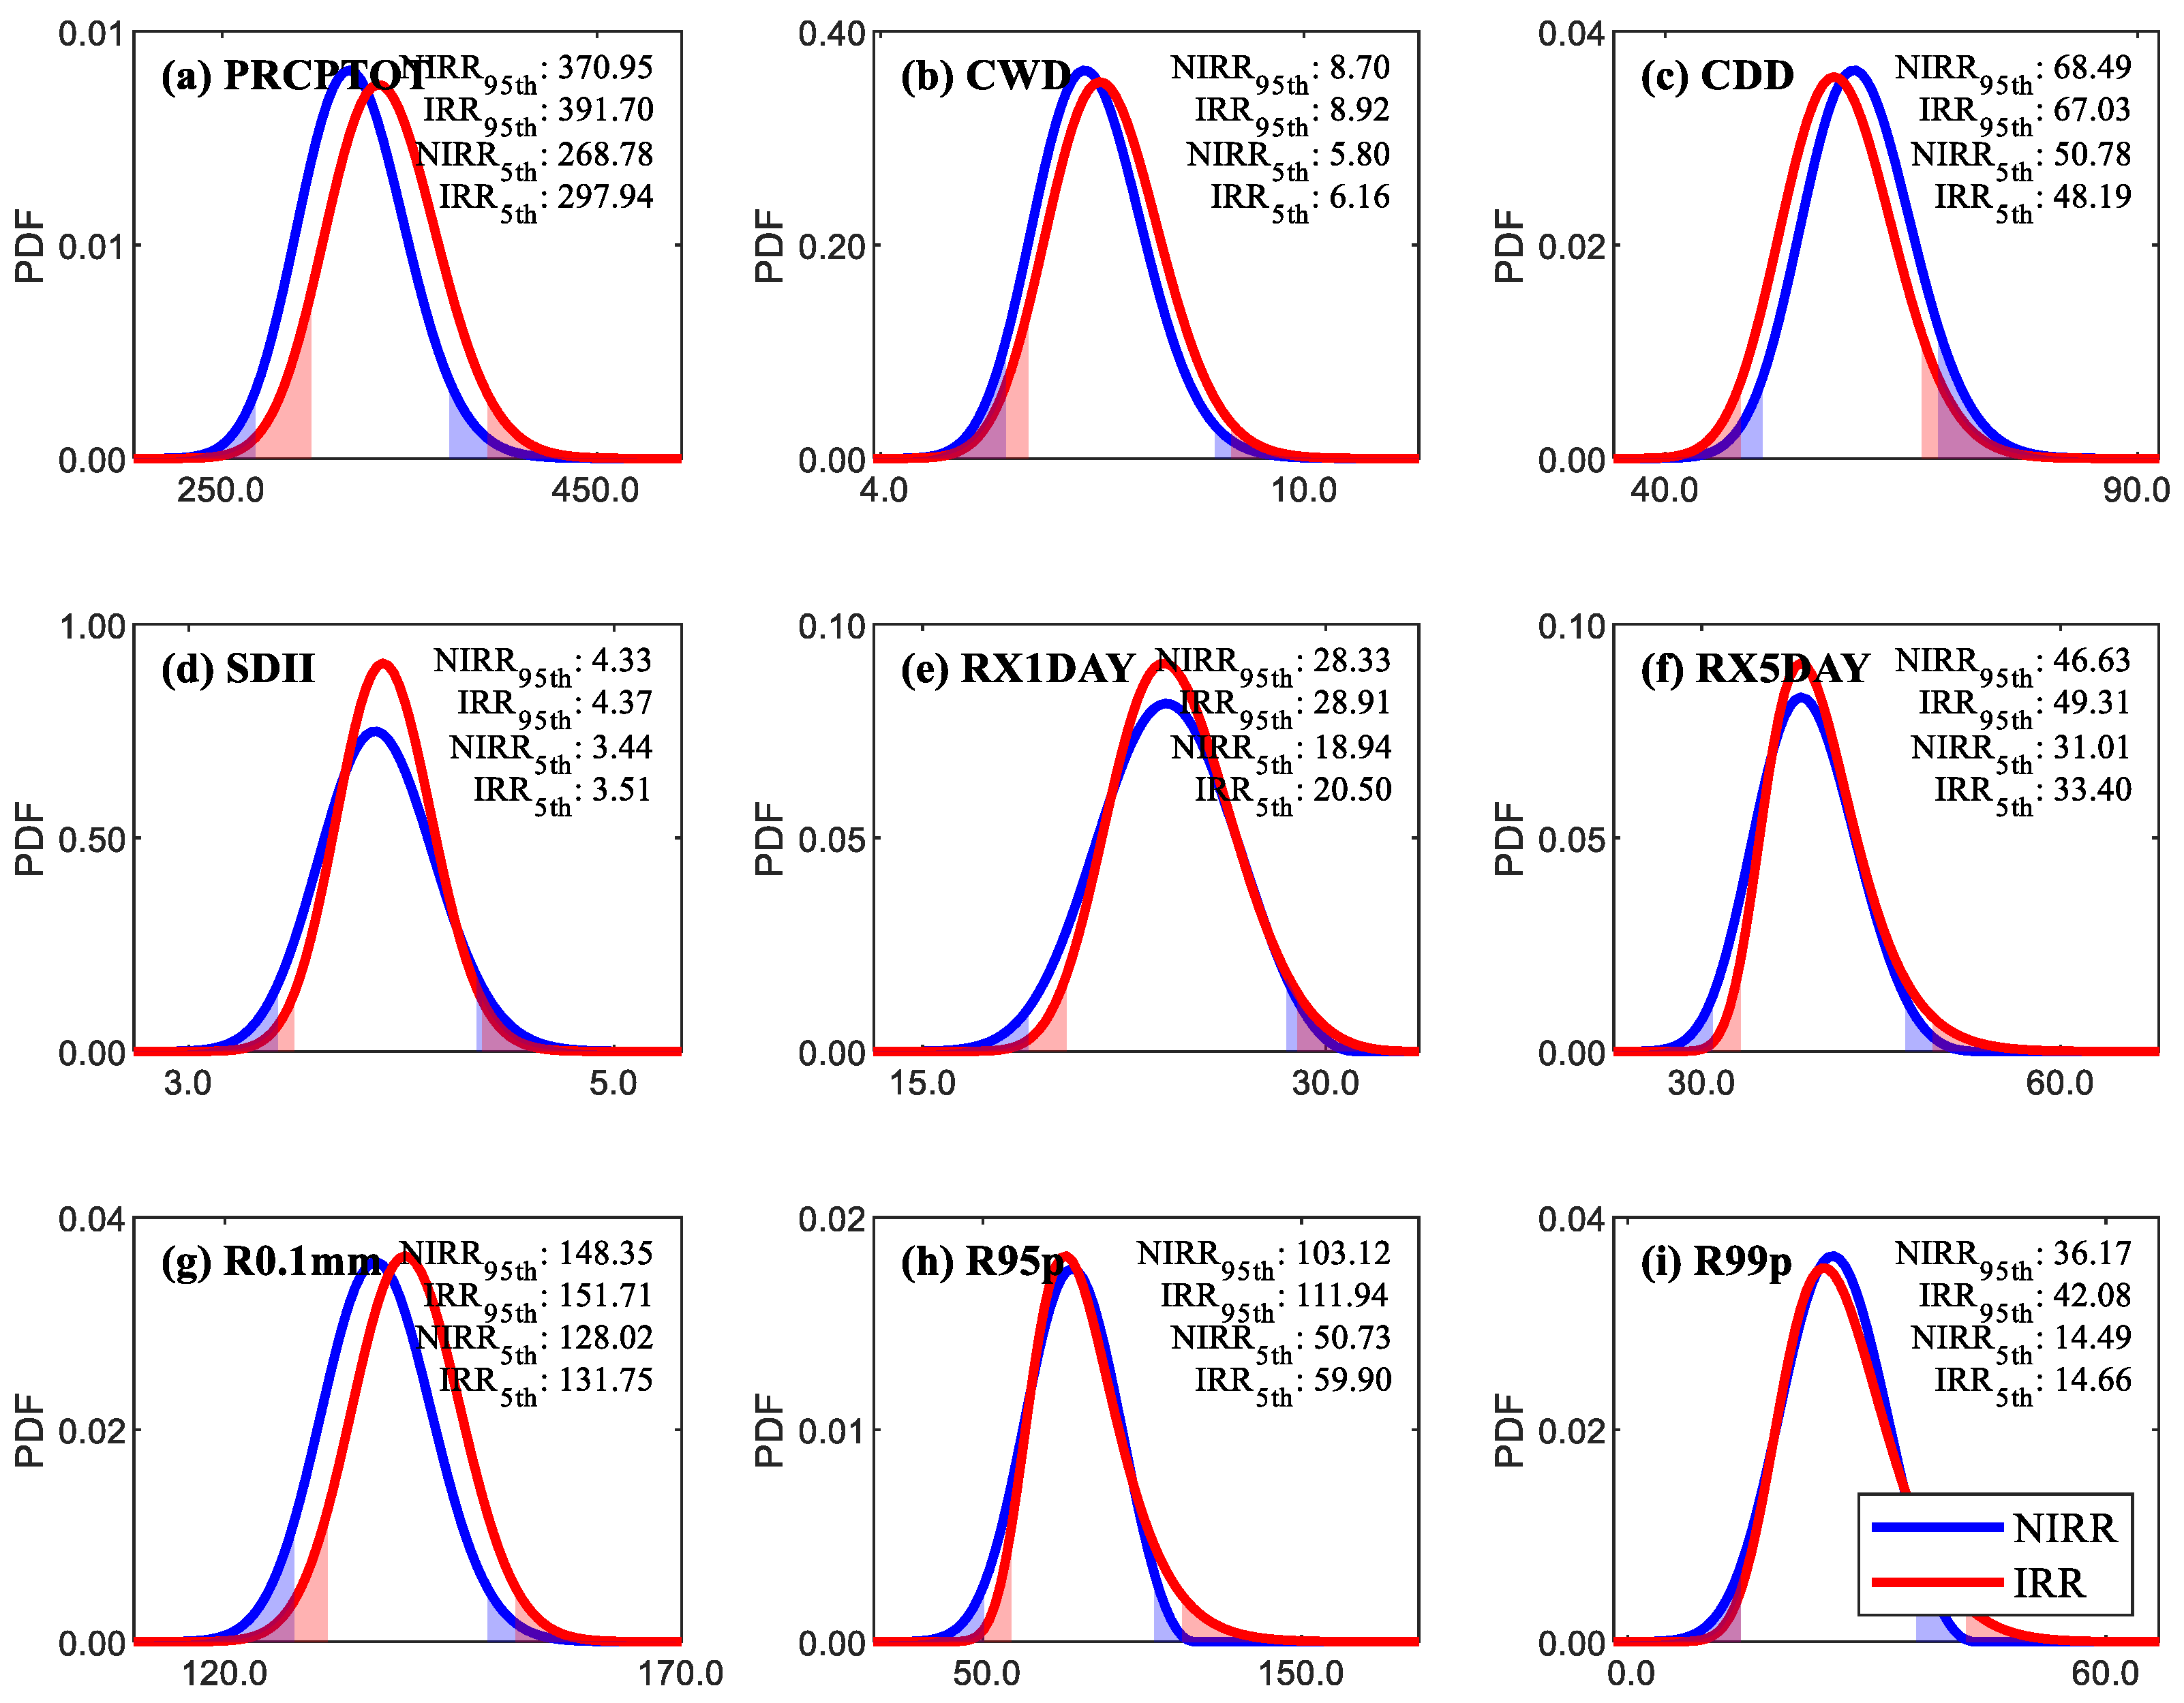
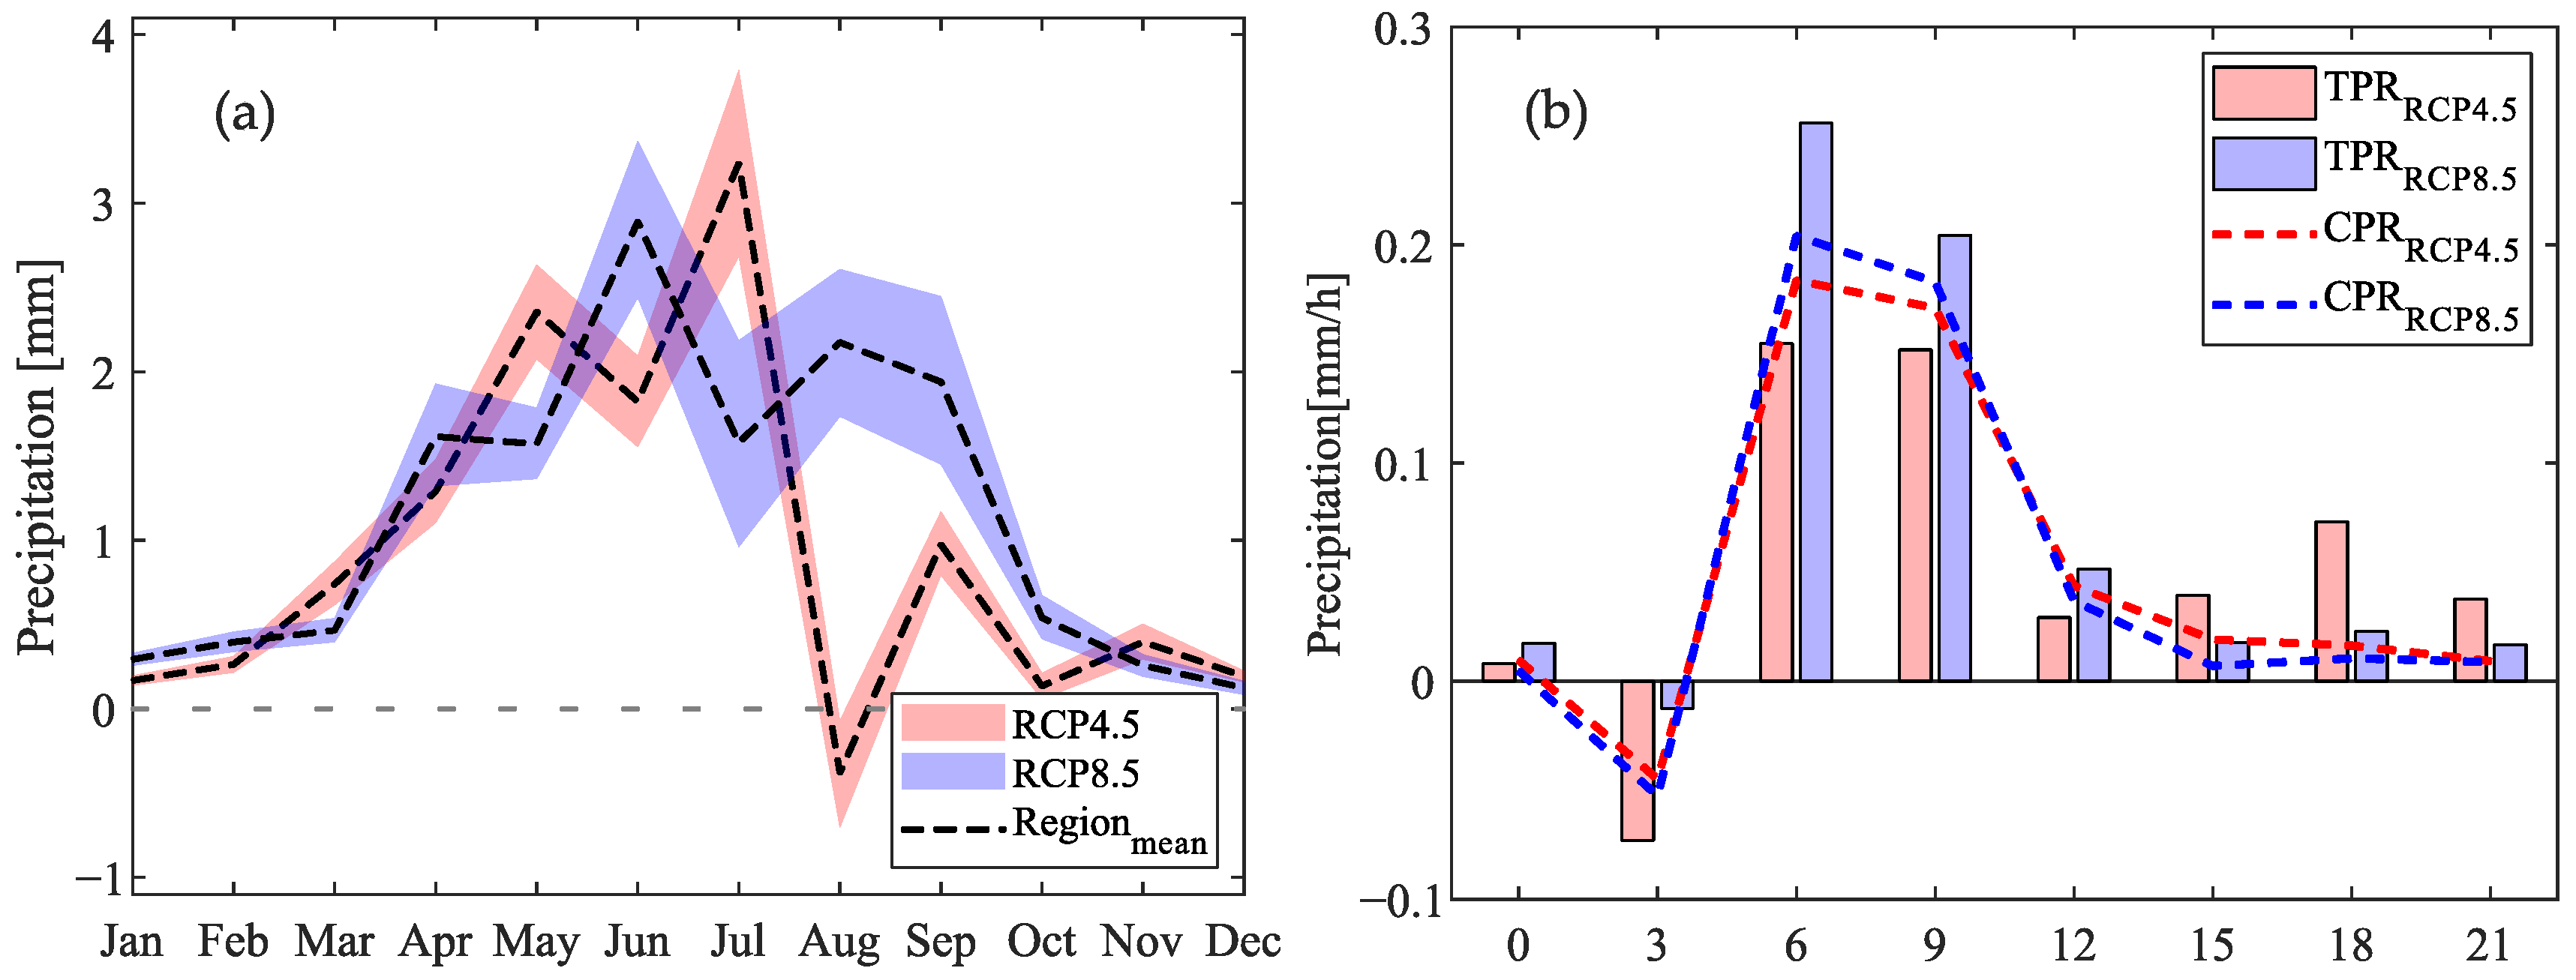
3.3. Influence of Irrigation on the Spatiotemporal Characteristics of Precipitation

Figure 6 illustrates the spatial distribution of changes in extreme precipitation indices in the NWC under the RCP8.5 scenario, both with and without irrigation. The introduction of irrigation is projected to result in more severe extreme precipitation events in most areas of the NWC. Significant changes in extreme precipitation indices are observed, particularly in mountainous regions such as the Tianshan, Kunlun Mountains, and Qilian Mountains (p < 0.05), while the changes in extreme precipitation in the relatively lower-altitude Junggar, Tarim, and Qaidam basins are less pronounced. Under the RCP8.5 scenario, the PRCPTOT index shows a significant increase in the mountainous areas. For example, near the Tianshan and Kunlun Mountains, PRCPTOT exhibits an approximately 50 mm/year increase, while on the eastern side of the Qilian Mountains, the increase is even larger, at approximately 100 mm/year. In the basin areas, there is a slight increase in PRCPTOT, but the magnitude of the increase is generally less than 5 mm/year. The spatial characteristics of other extreme precipitation indices, except for CDD, follow a similar pattern to PRCPTOT, primarily characterized by an increase.
Notably, SDII, RX1DAY, RX5DAY, R95p, R99p, and other extreme precipitation indices show opposite changes between the eastern and western regions around the irrigated areas. For instance, in the eastern part around the irrigated areas, SDII decreases by approximately 0.2 mm/day. RX5DAY and R99p show a southwest–northeast strip of decrease in extreme precipitation to the east of the irrigation region. In contrast, R0.1mm and PRCPTOT consistently increase, indicating that the higher PRCPTOT in the western part of the irrigated areas is mainly due to a higher frequency of precipitation events. Similar patterns of these changes can also be observed in the RCP4.5 scenario (Figure S5). The patterns of change differ between the eastern and western parts of the irrigated areas, highlighting the complex interactions between irrigation, topography, and extreme precipitation characteristics.
To further investigate the impact of irrigation on extreme precipitation, this study analyzed the PDF of all extreme precipitation indices before and after irrigation. Figure 7 shows the PDFs of extreme precipitation for the irrigated (red line, IRR) and non-irrigated (blue line, NIRR) scenarios in the NWC under RCP8.5. Compared to non-irrigated conditions, although there are some slight leftward shifts in the PDFs after irrigation, the dominant trend shows a rightward shift for PRCPTOT, CWD, SDII, RX1DAY, RX5DAY, and R0.1mm. For instance, under the RCP8.5, the PDF value of SDII corresponding to the 95th percentile was 4.33 mm/day without irrigation, while it increased to 4.37 mm/day with irrigation (Figure 7d). Similarly, under the RCP4.5 (Figure S6d), irrigated and non-irrigated conditions had PDF values of SDII corresponding to the 95th percentile close to 4.44 mm/day. It is worth noting that although the overall right shift of most extreme precipitation indices is slight under both RCPs, the right tail of the PDFs for R95p and R99p shows a slightly larger rightward shift after irrigation, with a more elongated shape compared to the non-irrigated scenario, indicating an increase in the occurrence of extreme events in the irrigated regions of the NWC. Additionally, Figures S7 and S8 illustrate the changes in PDFs for irrigation district-averaged extreme precipitation indices under the RCP4.5 and RCP8.5, respectively. The PDF changes in extreme precipitation indices within the irrigation districts exhibit a consistent pattern with the NWC, characterized by a dominant rightward shift. Except for R0.1mm, most extreme precipitation indices in the irrigation district exhibited more minor rightward shifts in their PDFs compared to the NWC. All the above results indicate that, compared to the non-irrigated scenario, the entire NWC experienced a tendency to be wetter and had a higher precipitation frequency after irrigation.
Figure 8 depicts the annual and diurnal cycles of irrigation district-averaged precipitation before and after irrigation under the RCP4.5 and RCP8.5. From the annual cycle perspective, except for a decrease in August precipitation under the RCP4.5, precipitation shows an overall increase in other months under the two RCPs (Figure 8a). In the RCP4.5, the maximum annual variation in precipitation occurs in July, with a magnitude of 3.24 mm, while in the RCP8.5, the maximum annual variation in precipitation occurs in June, with a magnitude of 2.89 mm. In the two RCPs, the contribution of total summer precipitation (TPR) variation to the annual total precipitation variation reaches 41.78% and 47.97%, respectively, indicating that irrigation’s impact on precipitation primarily occurs during the summer. Furthermore, during the crop-growing season from April to October, variations in precipitation contribute to more than 80% of the annual precipitation variability. As for the diurnal cycle, the variation in precipitation mainly concentrates from 6:00 to 9:00 UTC. In the two RCPs, the contribution of precipitation variation during the 6:00 to 9:00 UTC period to the daily total precipitation variation reaches 72.88% and 80.22%, respectively. Approximately 70.07% to 96.87% of the precipitation variation during this period is attributed to convective precipitation (CPR), indicating a close connection between precipitation changes in the irrigated regions and convective activities.

4. Discussion

4.1. Impact of Irrigation on Precipitation Types and Its Driving Mechanisms

As shown in Figure 9, the multiyear average CPR during the reference period (1971–2000) was 23.95 mm, accounting for approximately 68.8% of the TPR. In the RCP4.5 and RCP8.5 without irrigation, the average TPR was 35.93 mm and 35.47 mm, respectively, with CPR constituting 72.8% and 74.4% of the TPR. Compared to the reference period, the TPR in the RCP4.5 and RCP8.5 increased by 1.14 mm and 0.68 mm, respectively, with CPR contributing 67.4% and 62.39% to the TPR changes. Furthermore, the impacts of irrigation led to a substantial augmentation in TPR, with an increase of 4.87 mm and 5.65 mm (p < 0.1) observed in the RCP4.5 and RCP8.5, respectively. CPR played a prominent role in these changes, accounting for 96.68% and 82.76% of the TPR variations. Additionally, the Pearson correlation coefficients between the TPR and CPR in the temporal series of annual and interannual variations under the two RCPs were all above 0.85 (p < 0.01), indicating a close correlation between the variations of TPR and CPR.
Figure 10 depicts the irrigation district-averaged vertical profiles of atmospheric element changes, including the u- and v-components of wind (u and v), relative humidity (RH), temperature (T), mixing ratio (q), and MSE, for winter and summer under the two RCPs. The atmospheric elements in the lower troposphere exhibit significant changes due to irrigation, particularly during the summer. Except for the temperature, all atmospheric elements show an increase near the surface at the 850 hPa level. The increase in RH and q indicates that irrigation enhances atmospheric moisture in the irrigation district and its surrounding areas (Figure 10c,e), particularly in the downwind region of the irrigation district (Figure S9), explaining the observed increase in remote precipitation [60]. Figure 10d shows that the summer temperature decreases in the 600–850 hPa level but increases in the 200–600 hPa level, which could be attributed to the condensation of latent heat and the release of heat associated with precipitation formation in the upper atmosphere. The increase in atmospheric moisture in the irrigation district and the downwind region during summer increases cloud cover, particularly low clouds, thereby increasing the probability of precipitation events [61]. As shown in Figure 10f, both summer and winter exhibit an increase in MSE, with a larger increase observed during the summer. This suggests that the stability of the lower troposphere in the irrigation district becomes more unstable after irrigation [62].
Figure 11 provides vertical cross-sections along 87°E, 92°E, 97°E, and 102°E, demonstrating the variations in summer meridional circulations and MSE under the RCP8.5 scenario. Generally, there is an overall increase in the entire tropospheric MSE during summers from south to north, particularly in the lower troposphere, which is also evident in the RCP4.5 scenario (Figure S11). This suggests that the irrigated regions in the NWC will experience heightened instability in the troposphere and an increased likelihood of convective precipitation (CPR) compared to non-irrigated conditions. In mountainous areas such as the Kunlun Mountains and Qilian Mountains, several factors including increased atmospheric moisture, terrain uplift, and enhanced MSE contribute to orographic and convective precipitation. Additionally, westerly winds dominate in the NWC, and a significant amount of atmospheric moisture accumulates near the Tianshan Mountains (Figure S9a,b). Previous research by Wu et al. [63] reveals that strong westerly circulation impedes moisture accumulation in the NWC. However, irrigation introduces anomalous southerly winds that weaken the dominant westerly circulation. As a result, moisture from the northwest can more easily accumulate near the Tianshan Mountains, leading to increased precipitation (Figure S9c,d).
It is important to note that the response of meridional circulation to irrigation varies from west to east (Figure 11a–d). At the lowest level, all cross-sections exhibit southerly anomalies, but at higher levels (above 700 hPa) along 87°E, 92°E, and 97°E, the anomalies reverse to northerly (Figure 11a–c). In the eastern part of the irrigation region, the southerly anomaly extends to higher levels (600 hPa, Figure S10). This corresponds to a large-scale anticyclonic circulation anomaly at 700 hPa covering extensive areas east of 100°E, as shown in Figure S9d. This circulation pattern may negatively impact the intensity and frequency of precipitation in the region, as it enhances the flow from higher elevations south of the irrigation region and creates northerly anomaly flow to the east of the irrigation region, both of which are unfavorable for extreme precipitation despite the locally enhanced moisture due to irrigation.

4.2. Limitations and Uncertainties

This study utilized the RegCM4 model to analyze extensive irrigation activities’ potential impacts on precipitation of the NWC. By comparing the simulated precipitation during the reference period with observed precipitation, the performance of the RegCM4 in simulating precipitation was validated. The results indicate that the model captures the spatial distribution characteristics of precipitation well. However, it exhibits a wet bias in mountainous areas such as the Tianshan Mountains, Qilian Mountains, and Kunlun Mountains, which can be attributed to inherent systematic errors in the model. Previous studies have also shown that RegCM4 tends to overestimate precipitation in mountainous regions [64]. To address the humidity bias in mountainous areas, potential improvements include enhancing microscale modeling, obtaining finer observational data, refining terrain and surface parameters, and conducting multi-model comparisons to assess and enhance model accuracy [65]. Additionally, the uncertainties in observational data could also affect the assessment of model performance. Observational stations are typically located in low-elevation areas, and there is a lack of data on extreme precipitation events in high-elevation mountainous regions. Moreover, while a resolution of 50 km captures the spatiotemporal variations of regional precipitation, it may have limitations in capturing finer-scale changes. The dynamical downscaling results from the MPI-ESM-MR suggest a warm and humid trend in most parts of the NWC for 2021–2050 compared to 1971–2000, which is consistent with previous studies [66,67,68]. However, different global climate models, regional climate models, study periods, and emission scenarios can introduce significant uncertainties in the assessment of future climate change, thereby affecting the evaluation of the impact of extensive irrigation on regional precipitation in the NWC [69]. Furthermore, the irrigation districts were primarily determined based on elevation to identify suitable low-elevation areas for gravity irrigation, and only a single vegetation type was considered. The irrigation amount of 60 billion m3 used in the irrigation scheme was based on estimations of the “Five Rivers and One River” in some hypothetical scenarios, and there is still considerable controversy regarding the actual maximum available water amount. In addition, the irrigation scheme in this study has limitations in considering specific crop water requirements, as the irrigation water needs vary among different crops. Therefore, this study only focuses on the impact of irrigation on precipitation in the NWC under specific model settings, scenarios, and irrigation schemes. In the future, it is necessary to further improve irrigation schemes in regional climate models and combine them with the latest climate prediction achievements to study the effects of irrigation on the regional climate in the NWC while conducting in-depth analyses of the key processes influencing regional climate elements.

5. Conclusions

This paper conducts an in-depth investigation into the impact of large-scale irrigation on precipitation in the NWC region. Additionally, it further explores the key driving mechanisms behind the spatiotemporal distribution changes of precipitation influenced by irrigation. The main research findings are as follows:
The RegCM4 model incorporating the Emanuel cumulus convection scheme and CLM3.5 land surface scheme exhibits commendable capabilities in simulating precipitation. It effectively captures the climatology and diurnal cycle of precipitation, with better performance observed in simulating summer precipitation than winter.
Under the two RCPs, it is projected that the NWC will tend to become wetter from 2021 to 2050, compared to the reference period. The intensity and frequency of extreme precipitation in mountainous areas such as the Tianshan, Qilian, and Kunlun Mountains show a significant increase (p < 0.05), while the precipitation changes in basins like Qaidam, Tarim, and Junggar exhibit less noticeable changes. The extreme precipitation indices tend to decrease in the peripheral region between the westerly and East Asian Summer Monsoon under both RCP4.5 and RCP8.5.
Large-scale irrigation activities alter the district’s climatic elements and surroundings. It amplifies atmospheric moisture in the irrigation district and downwind regions, as well as enhances the MSE in the lower troposphere, consequently leading to increased convective precipitation events in mountainous regions. Moreover, the cooling effect of irrigation near the surface partially offsets the positive impact of increased atmospheric moisture on precipitation, which may have adverse effects on the intensity and frequency of the precipitation irrigation district. Another important finding of our research is the irrigation-induced anomalous cyclonic circulation at the lower atmosphere. This circulation pattern interacts with the background circulation, resulting in diverse effects on summer extreme precipitation between the western and eastern regions surrounding the irrigated areas. The surface cooling-induced circulation affects the west and east parts of irrigation region differently due to its interaction with the background circulation. The anomalous anticyclonic circulation east of 100°E extends higher and is consistent with less extreme precipitation under irrigation influence.
By elucidating these intricate dynamics, our study sheds light on the complex relationship between large-scale irrigation and regional precipitation patterns, offering valuable insights for water resource management and climate modeling in arid regions. The NWC heavily relies on mountainous water sources for runoff replenishment, and variations in precipitation directly impact the local natural ecosystems. This study’s significant findings underscore the high sensitivity of precipitation in mountainous to irrigation activities. Large-scale irrigation may marginally increase the overall precipitation in certain areas, thus providing relief from aridity and insufficient rainfall. This research outcome contributes to a deeper understanding of the mechanisms underlying the influence of irrigation on precipitation in the arid region of NWC and provides a scientific basis for the sustainable utilization of local water resources.

Supplementary Materials

The following supporting information can be downloaded at: https://www.mdpi.com/article/10.3390/rs16010058/s1, Figure S1: Multiyear average changes of extreme precipitation indices under the RCP4.5 compared to the reference period; Figure S2: Annual probability density function (PDF) of Northwest China averaged extreme precipitation indices from 1971 to 2000 (blue line, RF) and from 2021 to 2050 (red line, RCP4.5); Figure S3: Annual probability density function (PDF) of the irrigation district averaged extreme precipitation indices from 1971 to 2000 (blue line, RF) and from 2021 to 2050 (red line, RCP4.5); Figure S4: Annual probability density function (PDF) of the irrigation district averaged extreme precipitation indices from 1971 to 2000 (blue line, RF) and from 2021 to 2050 (red line, RCP8.5); Figure S5: Multiyear average changes of extreme precipitation indices with and without irrigation under the RCP4.5; Figure S6: Annual probability density function (PDF) of Northwest China averaged extreme precipitation with (red line, IRR) and without (blue line, NIRR) irrigation under the RCP4.5; Figure S7: Annual probability density function (PDF) of the irrigation district averaged extreme precipitation with (red line, IRR) and without (blue line, NIRR) irrigation under the RCP4.5; Figure S8: Annual probability density function (PDF) of the irrigation district averaged extreme precipitation with (red line, IRR) and without (blue line, NIRR) irrigation under the RCP8.5; Figure S9: Upper panels: Summer climatology (2021–2050) of vertically integrated water vapor transport and low-level circulation at 700 hPa for two different scenarios. Bottom panels: Difference in the distribution of vertically integrated water vapor transport and low-level circulation at 700 hPa between irrigated and non-irrigated for scenarios; Figure S10: Upper panels: Summer climatology (2021–2050) of vertically integrated temperature and low-level circulation at 600 hPa for two different scenarios. Bottom panels: Difference in the distribution of vertically integrated temperature and low-level circulation at 600 hPa between irrigated and non-irrigated for scenarios; Figure S11: Vertical cross-section as a function of latitude for the difference of summer meridional circulations and MSE under the RCP4.5; Table S1: The RegCM4 model configuration used in this study; Table S2: The KS test statistics and AIC values for the extreme precipitation indices under different distributions.

Author Contributions

Y.H.: Conceptualization, methodology, software, writing—original draft preparation; Y.Z.: conceptualization, supervision; B.G.: analyzed the data, writing—review and editing; J.Y.: analyzed the data, writing—review and editing; Y.L.: validation, funding, writing—review and editing. All authors have read and agreed to the published version of the manuscript.

Funding

The study was funded by the Natural Science Foundation of Jiangsu Province (BK20230957), the National Key Research and Development Program of China (2021YFC3200204), the Open Research Fund of State Key Laboratory of Simulation and Regulation of Water Cycle in River Basin, China Institute of Water Resources and Hydropower Research (IWHR-SKL-KF202204), the Jiangsu Funding Program for Excellent Postdoctoral Talent (2022ZB147), the Key Scientific and Technological Project of the Ministry of Water Resources. P.R.C (SKS-2022001), the Systematic Project of Guangxi Key Laboratory of Disaster Prevention and Engineering Safety (2022ZDK026), the Natural Science Foundation of China (51909275), and the TianHe Qingsuo Project special fund project in the field of climate, meteorology and ocean.

Data Availability Statement

All the data are freely available. The MPI-ESM-MR forcing data from the International Center for Theoretical Physics (http://clima-dods.ictp.it/Data/RegCM_Data/, accessed on 1 December 2023). The CN05 observation data from Climate Change Research Center, Chinese Academy of Sciences (https://ccrc.iap.ac.cn/resource/detail?id=228, accessed on 1 December 2023).

Acknowledgments

The authors greatly appreciate the data availability and service provided by China Meteorological Administration and the RegCM4 science team. Special thanks to Zixiu Yu (the College of Hydrology and Water Resources, Hohai University), for his valuable technical support during the research process.

Conflicts of Interest

The authors declare no conflicts of interest.

References

  1. Konikow, L.-F.; Kendy, E. Groundwater depletion: A global problem. Hydrogeol. J. 2005, 1, 317–320. [Google Scholar] [CrossRef]
  2. Shah, T.; Roy, A.-D.; Qureshi, A.-S.; Wang, J. Sustaining Asia’s groundwater boom: An overview of issues and evidence. Nat. Resour. Forum 2003, 2, 130–141. [Google Scholar] [CrossRef]
  3. Zhuang, W. Eco-environmental impact of inter-basin water transfer projects: A review. Environ. Sci. Pollut. Res. 2016, 13, 12867–12879. [Google Scholar] [CrossRef]
  4. DeAngelis, A.; Dominguez, F.; Fan, Y.; Robock, A.; Kustu, M.-D.; Robinson, D. Evidence of enhanced precipitation due to irrigation over the Great Plains of the United States. J. Geophys. Res. Atmos. 2010, 115, D15115. [Google Scholar] [CrossRef]
  5. Harding, K.-J.; Snyder, P.-K. Modeling the atmospheric response to irrigation in the Great Plains. Part II: The precipitation of irrigated water and changes in precipitation recycling. J. Hydrometeorol. 2012, 6, 1687–1703. [Google Scholar] [CrossRef]
  6. Kueppers, L.-M.; Snyder, M.-A.; Sloan, L.-C. Irrigation cooling effect: Regional climate forcing by land-use change. Geophys. Res. Lett. 2007, 34, L3703. [Google Scholar] [CrossRef]
  7. Qian, Y.; Huang, M.-Y.; Yang, B.; Berg, L.-K. A Modeling Study of Irrigation Effects on Surface Fluxes and Land–Air–Cloud Interactions in the Southern Great Plains. J. Hydrometeorol. 2013, 3, 700–721. [Google Scholar] [CrossRef]
  8. Saeed, F.; Hagemann, S.; Jacob, D. Impact of irrigation on the South Asian summer monsoon. Geophys. Res. Lett. 2009, 20, 1437–1454. [Google Scholar] [CrossRef]
  9. Zou, J.; Xie, Z.-H.; Yu, Y.; Zhan, C.-S.; Sun, Q. Climatic responses to anthropogenic groundwater exploitation: A case study of the Haihe River Basin, Northern China. Clim. Dyn. 2014, 42, 2125–2145. [Google Scholar] [CrossRef]
  10. Niyogi, D.; Kishtawal, C.; Tripathi, S.; Govindaraju, R.-S. Observational evidence that agricultural intensification and land use change may be reducing the Indian summer monsoon rainfall. Water Resour. Res. 2010, 46, W3533. [Google Scholar] [CrossRef]
  11. Lobell, D.-B.; Bonfils, C.-J.; Kueppers, L.-M.; Snyder, M.-A. Irrigation cooling effect on temperature and heat index extremes. Geophys. Res. Lett. 2008, 35, L9705. [Google Scholar] [CrossRef]
  12. Boucher, O.; Myhre, G.; Myhre, A. Direct human influence of irrigation on atmospheric water vapour and climate. Clim. Dyn. 2004, 6, 597–603. [Google Scholar] [CrossRef]
  13. Sorooshian, S.; Li, J.-L.; Hsu, K.-L.; Gao, X.-G. Influence of irrigation schemes used in regional climate models on evapotranspiration estimation: Results and comparative studies from California’s Central Valley agricultural regions. J. Geophys. Res. Atmos. 2012, 117, D6107. [Google Scholar] [CrossRef]
  14. Kueppers, L.-M.; Snyder, M.-A.; Sloan, L.-C.; Cayan, D.; Jin, J.; Kanamaru, H.; Kanamitsu, M.; Miller, N.-L.; Tyree, M.; Du, H.; et al. Seasonal temperature responses to land-use change in the western United States. Glob. Planet. Chang. 2008, 3, 250–264. [Google Scholar] [CrossRef]
  15. Yang, Z.; Dominguez, F.; Zeng, X.-B.; Hu, H.-C.; Gupta, H.; Yang, B. Impact of irrigation over the California Central Valley on regional climate. J. Hydrometeorol. 2017, 5, 1341–1357. [Google Scholar] [CrossRef]
  16. Zeng, Y.-J.; Xie, Z.-H.; Liu, S. Seasonal effects of irrigation on land–atmosphere latent heat, sensible heat, and carbon fluxes in semiarid basin. Earth Syst. Dyn. 2017, 1, 113–127. [Google Scholar] [CrossRef]
  17. Pei, L.-S.; Moore, N.; Zhong, S.-Y.; Kendall, A.-D.; Gao, Z.-Q.; Hyndman, D.-W. Effects of Irrigation on Summer Precipitation over the United States. J. Clim. 2016, 10, 3541–3558. [Google Scholar] [CrossRef]
  18. Yang, Z.; Qian, Y.; Liu, Y.; Berg, L.-K.; Gustafson, W.-I.; Feng, Z.; Sakaguchi, K.; Fast, J.-D.; Tai, S.; Yang, B.; et al. Understanding irrigation impacts on low-level jets over the Great Plains. Clim. Dyn. 2020, 55, 925–943. [Google Scholar] [CrossRef]
  19. Wang, X.-M.; Dong, Z.-B.; Zhang, J.-W.; Liu, L.-C. Modern dust storms in China: An overview. J. Arid. Environ. 2004, 4, 559–574. [Google Scholar] [CrossRef]
  20. Deng, M.-J. “Three Water Lines” strategy: Its spatial patterns and effects on water resources allocation in northwest China. Acta Geogr. Sin. 2018, 73, 1189–1203. [Google Scholar]
  21. Zhang, H. Discussion on water resources development and utilization of Tibet. Water Resour. Plan. Des. 2011, 1, 1–4. [Google Scholar]
  22. Wang, T.-Y.; Wang, Z.-H.; Guo, L.; Zhang, J.-Z.; Li, W.-H.; He, H.-J.; Zong, R.; Wang, D.-W.; Jia, Z.-C.; Wen, Y. Experiences and challenges of agricultural development in an artificial oasis: A review. Agric. Syst. 2021, 193, 103220. [Google Scholar] [CrossRef]
  23. Cai, P.; Hamdi, R.; Luo, G.; He, H.; Zhang, M.; Termonia, P.; De Maeyer, P. Agriculture intensification increases summer precipitation in Tianshan Mountains, China. Atmos. Res. 2019, 227, 140–146. [Google Scholar] [CrossRef]
  24. Yang, Z.; Qian, Y.; Liu, Y.; Berg, L.-K.; Hu, H.-C.; Dominguez, F.; Yang, B.; Feng, Z.; Gustafson, W.-I., Jr.; Huang, M.-Y.; et al. Irrigation Impact on Water and Energy Cycle During Dry Years Over the United States Using Convection-Permitting WRF and a Dynamical Recycling Model. J. Geophys. Res. Atmos. 2019, 21, 11220–11241. [Google Scholar] [CrossRef]
  25. Zhang, M.; Luo, G.; Cao, X.; Hamdi, R.; Li, T.; Cai, P.; Ye, H.; He, H. Numerical simulation of the irrigation effects on surface fluxes and local climate in typical mountain-oasis-desert systems in the Central Asia arid area. J. Geophys. Res. Atmos. 2019, 23, 12485–12506. [Google Scholar] [CrossRef]
  26. Li, J.; Wang, J. Regional cli mate effects of large-scale agricultural irrigation related to South-to-North Water Transfer Project in China. Adv. Water Sci. 2009, 3, 343–349. [Google Scholar]
  27. Zou, J.; Zhan, C.-S.; Xie, Z.-H.; Qin, P.-H.; Jiang, S.-S. Climatic impacts of the Middle Route of the South-to-North Water Transfer Project over the Haihe River basin in North China simulated by a regional climate model. J. Geophys. Res. Atmos. 2016, 15, 8983–8999. [Google Scholar] [CrossRef]
  28. Gao, Y.; Chen, Y.; Lv, S. Numerical Simulation of Different Irrigation Scheduling on Oasis in Northwest China. Prog. Geogr. 2004, 23, 38–50. [Google Scholar]
  29. Han, C.-Y.; Zhang, B.-Z.; Han, S.-J. Quantitative effects of changes in agricultural irrigation on potential evaporation. Hydrol. Process. 2021, 2, e14057. [Google Scholar] [CrossRef]
  30. Han, S.-J.; Yang, Z.-Y. Cooling effect of agricultural irrigation over Xinjiang, Northwest China from 1959 to 2006. Environ. Res. Lett. 2013, 8, 24039. [Google Scholar] [CrossRef]
  31. Wen, L.-J.; Jin, J.-M. Modelling and analysis of the impact of irrigation on local arid climate over northwest China. Hydrol. Process. 2012, 3, 445–453. [Google Scholar] [CrossRef]
  32. Zhang, X.-Z.; Xiong, Z.; Tang, Q.-H. Modeled effects of irrigation on surface climate in the Heihe River Basin, Northwest China. J. Geophys. Res. Atmos. 2017, 15, 7881–7895. [Google Scholar] [CrossRef]
  33. Zhao, Y.; Fang, Y.-J.; Cui, C.-X.; Huang, A.-N. Effects of irrigation on precipitation in the arid regions of Xinjiang, China. J. Arid. Land 2012, 2, 132–139. [Google Scholar] [CrossRef]
  34. Zhao, Y.; Huang, Y.; Wang, H.; Xiao, W.; Wang, H. Study on regional climate effect under water diversion in Northwest China. J. Hydraul. Eng. 2022, 3, 270–283+295. [Google Scholar]
  35. Meng, X.-Y.; Wang, H.; Wu, Y.-P.; Long, A.-H.; Wang, J.-H.; Shi, C.-X.; Ji, X.-N. Investigating spatiotemporal changes of the land-surface processes in Xinjiang using high-resolution CLM3.5 and CLDAS: Soil temperature. Sci. Rep. 2017, 7, 13286. [Google Scholar] [CrossRef] [PubMed]
  36. Giorgi, F.; Coppola, E.; Solmon, F.; Mariotti, L.; Sylla, M.; Bi, X.; Elguindi, N.; Diro, G.; Nair, V.; Giuliani, G. RegCM4: Model description and preliminary tests over multiple CORDEX domains. Clim. Res. 2012, 52, 7–29. [Google Scholar] [CrossRef]
  37. Giorgi, F.; Anyah, R.-O. The road towards RegCM4. Clim. Res. 2012, 52, 3–6. [Google Scholar] [CrossRef]
  38. Giorgi, F.; Jones, C.; Asrar, G.-R. Addressing climate information needs at the regional level: The CORDEX framework. World Meteorol. Organ. Bull. 2009, 3, 175–183. [Google Scholar]
  39. Gao, X.-J.; Ying, S.; Giorgi, F. Comparison of convective parameterizations in RegCM4 experiments over China with CLM as the land surface model. Atmos. Ocean. Sci. Lett. 2016, 4, 246–254. [Google Scholar] [CrossRef]
  40. Gao, X.-J.; Shi, Y.; Han, Z.-Y.; Wang, M.-L.; Wu, J.; Zhang, D.-F.; Xu, Y.; Giorgi, F. Performance of RegCM4 over Major River Basins in China. Adv. Atmos. Sci. 2017, 4, 441–455. [Google Scholar] [CrossRef]
  41. van Vuuren, D.-P.; Edmonds, J.; Kainuma, M.; Riahi, K.; Thomson, A.; Hibbard, K.; Hurtt, G.-C.; Kram, T.; Krey, V.; Lamarque, J.-F.; et al. The representative concentration pathways: An overview. Clim. Chang. 2011, 109, 5–31. [Google Scholar] [CrossRef]
  42. Zhang, D.; Gao, X. Climate change of the 21st century over China from the ensemble of RegCM4 simulations. Chin. Sci. Bull. 2020, 23, 2516–2526. [Google Scholar] [CrossRef]
  43. Marsland, S.-J.; Haak, H.; Jungclaus, J.-H.; Latif, M.; Röske, F. The Max-Planck-Institute global ocean/sea ice model with orthogonal curvilinear coordinates. Ocean Model. 2003, 2, 91–127. [Google Scholar] [CrossRef]
  44. Dee, D.-P.; Uppala, S.-M.; Simmons, A.-J.; Berrisford, P.; Poli, P.; Kobayashi, S.; Andrae, U.; Balmaseda, M.-A.; Balsamo, G.; Bauer, P. The ERA-Interim reanalysis: Configuration and performance of the data assimilation system. Q. J. R. Meteorol. Soc. 2011, 656, 553–597. [Google Scholar] [CrossRef]
  45. Wu, J.; Gao, X.-J. A gridded daily observation dataset over China region and comparison with the other datasets. Chin. J. Geophys. 2013, 56, 1102–1111. [Google Scholar]
  46. Shi, Y.; Wang, G.-L.; Gao, X.-J. Role of resolution in regional climate change projections over China. Clim. Dyn. 2018, 51, 2375–2396. [Google Scholar] [CrossRef]
  47. Croitoru, A.; Chiotoroiu, B.; Ivanova Todorova, V.; Torică, V. Changes in precipitation extremes on the Black Sea Western Coast. Glob. Planet. Chang. 2013, 102, 10–19. [Google Scholar] [CrossRef]
  48. Alexander, L.-V.; Zhang, X.; Peterson, T.-C.; Caesar, J.; Gleason, B.; Klein Tank, A.-M.-G.; Haylock, M.; Collins, D.; Trewin, B.; Rahimzadeh, F.; et al. Global observed changes in daily climate extremes of temperature and precipitation. J. Geophys. Res. Atmos. 2006, 111, D5109. [Google Scholar] [CrossRef]
  49. Sun, W.-Y.; Mu, X.-M.; Song, X.-Y.; Wu, D.; Cheng, A.-F.; Qiu, B. Changes in extreme temperature and precipitation events in the Loess Plateau (China) during 1960–2013 under global warming. Atmos. Res. 2016, 168, 33–48. [Google Scholar] [CrossRef]
  50. You, Q.; Kang, S.; Aguilar, E.; Pepin, N.; Flügel, W.; Yan, Y.; Xu, Y.; Zhang, Y.; Huang, J. Changes in daily climate extremes in China and their connection to the large scale atmospheric circulation during 1961–2003. Clim. Dyn. 2011, 11, 2399–2417. [Google Scholar] [CrossRef]
  51. Chen, Y.-D.; Zhang, Q.; Xiao, M.-Z.; Singh, V.-P.; Leung, Y.; Jiang, L.-G. Precipitation extremes in the Yangtze River Basin, China: Regional frequency and spatial–temporal patterns. Theor. Appl. Climatol. 2014, 3, 447–461. [Google Scholar] [CrossRef]
  52. Liang, L.; Zhao, L.-N.; Gong, Y.-F.; Tian, F.-Y.; Wang, Z. Probability distribution of summer daily precipitation in the Huaihe basin of China based on Gamma distribution. Acta Meteorol. Sin. 2012, 26, 72–84. [Google Scholar] [CrossRef]
  53. Shin, J.; Lee, T.; Park, T.; Kim, S. Bias correction of RCM outputs using mixture distributions under multiple extreme weather influences. Theor. Appl. Climatol. 2019, 137, 201–216. [Google Scholar] [CrossRef]
  54. Yang, T.; Shao, Q.-X.; Hao, Z.-C.; Chen, X.; Zhang, Z.-X.; Xu, C.-Y.; Sun, L.-M. Regional frequency analysis and spatio-temporal pattern characterization of rainfall extremes in the Pearl River Basin, China. J. Hydrol. 2010, 3, 386–405. [Google Scholar] [CrossRef]
  55. Hosking, J.; Wallis, J. Regional Frequency Analysis: An Approach Based on L-Moments; Cambridge University Press: Cambridge, UK, 1997. [Google Scholar]
  56. Hannah, W.-M.; Maloney, E.-D. The Role of Moisture–Convection Feedbacks in Simulating the Madden–Julian Oscillation. J. Clim. 2011, 11, 2754–2770. [Google Scholar] [CrossRef]
  57. Hohenegger, C.; Brockhaus, P.; Bretherton, C.-S.; Schär, C. The Soil Moisture–Precipitation Feedback in Simulations with Explicit and Parameterized Convection. J. Clim. 2009, 19, 5003–5020. [Google Scholar] [CrossRef]
  58. Holloway, C.-E.; Wing, A.-A.; Bony, S.; Muller, C.; Masunaga, H.; L’Ecuyer, T.-S.; Turner, D.-D.; Zuidema, P. Observing Convective Aggregation. Surv. Geophys. 2017, 6, 1199–1236. [Google Scholar] [CrossRef]
  59. Oh, S.-G.; Suh, M.-S. Changes in seasonal and diurnal precipitation types during summer over South Korea in the late twenty-first century (2081–2100) projected by the RegCM4.0 based on four RCP scenarios. Clim. Dyn. 2018, 51, 3041–3060. [Google Scholar] [CrossRef]
  60. Zeng, Y.; Milly, P.-C.-D.; Shevliakova, E.; Malyshev, S.; van Huijgevoort, M.-H.-J.; Dunne, K.-A. Possible Anthropogenic Enhancement of Precipitation in the Sahel-Sudan Savanna by Remote Agricultural Irrigation. Geophys. Res. Lett. 2022, 6, e2021GL096972. [Google Scholar] [CrossRef]
  61. Wei, J.-F.; Dirmeyer, P.-A.; Wisser, D.; Bosilovich, M.-G.; Mocko, D.-M. Where Does the Irrigation Water Go? An Estimate of the Contribution of Irrigation to Precipitation Using MERRA. J. Hydrometeorol. 2013, 14, 275–289. [Google Scholar] [CrossRef]
  62. Im, E.; Marcella, M.-P.; Eltahir, E.-A.-B. Impact of Potential Large-Scale Irrigation on the West African Monsoon and Its Dependence on Location of Irrigated Area. J. Clim. 2014, 3, 994–1009. [Google Scholar] [CrossRef]
  63. Wu, Y.-P.; Shen, Y.-P.; Larry Li, B. Possible physical mechanism of water vapor transport over Tarim River Basin. Ecol. Complex. 2012, 9, 63–70. [Google Scholar] [CrossRef]
  64. Gao, X.-J.; Shi, Y.; Song, R.; Giorgi, F.; Wang, Y.; Zhang, D.-F. Reduction of future monsoon precipitation over China: Comparison between a high resolution RCM simulation and the driving GCM. Meteorol. Atmos. Phys. 2008, 100, 73–86. [Google Scholar] [CrossRef]
  65. Gu, C.; Huang, A.; Zhang, Y.; Yang, B.; Cai, S.; Xu, X.; Luo, J.; Wu, Y. The Wet Bias of RegCM4 Over Tibet Plateau in Summer Reduced by Adopting the 3D Sub-Grid Terrain Solar Radiative Effect Parameterization Scheme. J. Geophys. Res. Atmos. 2022, 21, e2022JD037434. [Google Scholar] [CrossRef]
  66. Li, B.-F.; Chen, Y.-N.; Chen, Z.-S.; Xiong, H.-G.; Lian, L.-S. Why does precipitation in northwest China show a significant increasing trend from 1960 to 2010? Atmos. Res. 2016, 167, 275–284. [Google Scholar] [CrossRef]
  67. Peng, D.-D.; Zhou, T.-J. Why was the arid and semiarid northwest China getting wetter in the recent decades? J. Geophys. Res. Atmos. 2017, 17, 9060–9075. [Google Scholar] [CrossRef]
  68. Shi, Y.-F.; Shen, Y.-P.; Kang, E.; Li, D.-L.; Ding, Y.-J.; Zhang, G.-W.; Hu, R.-J. Recent and Future Climate Change in Northwest China. Clim. Chang. 2007, 80, 379–393. [Google Scholar] [CrossRef]
  69. Knutti, R.; Sedláček, J. Robustness and uncertainties in the new CMIP5 climate model projections. Nat. Clim. Chang. 2013, 4, 369–373. [Google Scholar] [CrossRef]
Figure 1. Study area and topography (m).
Remotesensing 16 00058 g001
Figure 2. Monthly unit area irrigation allocation scheme in the RegCM4 model.
Remotesensing 16 00058 g002
Figure 3. Spatial distribution of the observed (CN05) and simulated summer (ac) and winter (df) precipitation (unit: mm) for the reference period (1991–2000) over the study area. ((a) CN05; (b) RegCM4 forced by ERA-Interim (EXP_RF1); (c) RegCM4 forced by MPI-ESM-MR (EXP_RF2). (df) is similar to (ac) but for winter).
Remotesensing 16 00058 g003
Figure 4. Multiyear average changes of extreme precipitation indices under the RCP8.5 compared to the reference period. The black dots represent statistically significant differences at the 95% significance level based on Student’s t-test.
Remotesensing 16 00058 g004
Figure 5. The annual PDF of the NWC average extreme precipitation indices from 1971 to 2000 (blue line, RF) and from 2021 to 2050 (red line, RCP8.5)—consideration of portions exceeding the 95th percentile and below the 5th percentile.
Remotesensing 16 00058 g005
Figure 6. Multiyear average changes of extreme precipitation indices with and without irrigation under the RCP8.5 (defined as with irrigation minus without irrigation). The black dots represent statistically significant differences at the 95% significance level based on Student’s t-test.
Remotesensing 16 00058 g006
Figure 7. The annual probability density function (PDF) of the NWC average extreme precipitation with (red line, IRR) and without (blue line, NIRR) irrigation under the RCP8.5—consideration of portions exceeding the 95th percentile and below the 5th percentile.
Remotesensing 16 00058 g007
Figure 8. Changes in the irrigation district average annual (a) and diurnal (b) cycles of precipitation under the RCP4.5 (red) and RCP8.5 (blue). The dotted lines indicate CPR. (Note: Figure (b) utilizes the Coordinated Universal Time format, UTC).
Remotesensing 16 00058 g008
Figure 9. TPR (blue) and CPR (red) under different RCPs. (NIRR and IRR represent the scenarios without irrigation and with irrigation, respectively. The bold font in parentheses indicates the proportion of CPR to the TPR).
Remotesensing 16 00058 g009
Figure 10. Changes in the irrigation district’s vertical profiles average climate elements under the two RCPs.
Remotesensing 16 00058 g010
Figure 11. Vertical cross-section as a function of latitude for the difference (defined as with irrigation minus without irrigation) of summer meridional circulations (arrows; unit: m/s) and MSE (shaded; unit: J/kg) under the RCP8.5. ((ad) is the vertical cross-section of 87°E, 92°E, 97°E, and 102°E, respectively. The black-shaded areas indicate the topography. The vertical component of wind velocity is exaggerated by a factor of 100).
Remotesensing 16 00058 g011
Table 1. Description of irrigation and non-irrigation experiments in this study.
No.Initial and Lateral Boundary ConditionsLULC Types and Irrigation Scenarios
EXP_RF1ERADefault LULC types (without irrigation)
EXP_RF2MPI-ESM-MRDefault LULC types (without irrigation)
EXP_NR45MPI-ESM-MR (RCP4.5)Default LULC types (without irrigation)
EXP_YR45MPI-ESM-MR (RCP4.5)Modified to cropland type (with 60 billion m3/year irrigation)
EXP_NR85MPI-ESM-MR (RCP8.5)Default LULC types (without irrigation)
EXP_YR85MPI-ESM-MR (RCP8.5)Modified to cropland type (with 60 billion m3/year irrigation)
Table 2. Definitions of the nine extreme precipitation indices used in this study.
IndexDescriptive NameDefinitionUnits
PRCPTOTWet-day precipitationAnnual total precipitation based wet daysmm
SDIISimple daily intensity indexAverage precipitation on wet daysmm/day
RX1dayMaximum 1-day precipitationAnnual maximum 1-day precipitationmm
RX5dayMaximum 5-day precipitationAnnual maximum 5-day precipitationmm
R95Very wet dayAnnual total precipitation when RR > 95th percentilemm
R99Extreme very-wet dayAnnual total precipitation when RR > 99th percentilemm
CDDConsecutive dry daysMaximum number of consecutive dry daysdays
CWDConsecutive wet daysMaximum number of consecutive wet daysdays
R0.1Number of precipitation daysAnnual count of days when RR ≥ 0.1 mmdays
Table 3. The PDF and CDF used in this study.
DistributionPDFCDF
GEV F V ( x ) = exp 1 + k x τ σ 1 / k F V ( x ) = exp 1 + k x τ σ 1 / k
Gumbel F U ( x ) = 1 exp exp x τ σ F U ( x ) = 1 exp exp x τ σ
Gamma F G ( x ) = 0 x σ k Γ ( k ) x k 1 exp ( x σ ) d x F G ( x ) = 0 x σ k Γ ( k ) x k 1 exp ( x σ ) d x
Exponential F E ( x ) = 1 exp ( x μ ) F E ( x ) = 1 exp ( x μ )
k, σ, and τ represent the shape, scale, and location parameters of the GEV, Gumbel, and gamma distributions, respectively, and μ is equal to the standard deviation of the exponential distribution.
Table 4. The performance of the RegCM4 model in simulating precipitation.
SeasonData SourceMultiyear Average Precipitation
(mm·day−1)
Correlation Coefficient
SummerCN050.65
EXP_RF10.410.73 *
EXP_RF20.490.76 *
WinterCN050.04
EXP_RF10.110.36
EXP_RF20.130.45
* indicates significance at a significance level of 0.05.
Disclaimer/Publisher’s Note: The statements, opinions and data contained in all publications are solely those of the individual author(s) and contributor(s) and not of MDPI and/or the editor(s). MDPI and/or the editor(s) disclaim responsibility for any injury to people or property resulting from any ideas, methods, instructions or products referred to in the content.

