Abstract
In the atmospheric system of Mars, vertical interactions are crucial, yet quantitative studies addressing this issue remain scarce. Based on simulations using the Mars PCM-LMDZ, we present the first frequency-domain quantitative analysis of the vertical interactions among Martian atmospheric dust, zonal circulation, and the migrating diurnal tide (DW1), employing Partial Directed Coherence (PDC) techniques to quantify the strength of associations between different variables. Our findings reveal a chain of influence where sub-seasonal-scale dust signals in the troposphere, through the Doppler effect of middle atmospheric zonal winds, transmit modulated energy to the DW1 in the upper mesosphere, thereby facilitating interlayer atmospheric interactions. The radiative heating from dust activities enhances the residual mean meridional circulation, which, under the influence of the Coriolis force, further accelerates the westerlies. Although gravity wave activity also contributes to the acceleration of the westerlies, its forcing generally remains below 5 m/s, which is relatively weak compared to the impact of intense dust activities in the warm scenario experiments (approximately 20 m/s). Overall, this study quantifies the interactions among atmospheric layers by means of PDC technology and analytically demonstrates how dust energy is transferred to mesospheric tides by shaping the zonal winds in between.
1. Introduction
Substantial qualitative research has been conducted on the interlayer interactions in the Martian atmosphere, but quantitative studies are less common. Several observation-based studies suggest that atmospheric layer interactions on Mars are at least as significant as those on Earth, if not stronger [1,2,3]. The importance of atmospheric layer interactions on Mars is attributed to the more extreme weather conditions, such as a lower atmospheric pressure, a rougher terrain, a smaller planetary radius, stronger zonal winds, and more persistent diurnal slope flows [4]. Martian mid-atmospheric interactions with the lower atmosphere are facilitated through waves (e.g., gravity waves, planetary waves, and tides), dust, circulation, and atmospheric seasonal expansion/contraction related to the Martian carbon cycle. Vertical interactions on Mars lead to the redistribution of chemical species (such as water and ozone), thermal structures (such as polar warming), and mesoscale clouds (such as water and carbon dioxide). While these conclusions have a qualitative physical basis, a quantitative frequency-domain analysis is necessary to enhance our understanding of the strength and periodicity of interlayer interactions in the Martian atmosphere.
The lack of quantitative frequency-domain analyses in studies of vertical interactions has left the frequency-dependent interactions between dust, migrating diurnal tide (DW1), and zonal circulation inadequately explored. The meridional circulation in the Martian atmosphere typically receives more attention than the zonal circulation, primarily due to the more observable dynamical phenomena, including the global-scale Hadley circulation [1,3,5,6,7] and its thermodynamic effects in the thermosphere through polar warmings [8,9,10].
Zonal winds have also been found to be critical in the vertical interactions of the Martian atmosphere, possibly playing a mediating role in dynamical processes. As a major momentum-containing component of atmospheric circulation [5], zonal winds are crucial for distributing heat and momentum. They modulate DW1 through the Doppler frequency shift effect [2,11]; affect the outbreak, propagation, and development of dust storms [7,12]; and absorb momentum and energy from gravity wave drag [13,14], thereby filtering gravity waves to specific frequencies [15]. Gravity waves, dust, and DW1, in turn, influence zonal winds. The convergence of tidal heat and momentum fluxes exerts a strong forcing on zonal winds [16,17,18,19]. These forcings on Mars are stronger than on Earth, especially during the Martian dust storm season, when the zonal-mean convergence of tidal fluxes is enhanced globally by dust radiative forcing [20]. Furthermore, the damping effect of gravity wave drag is closely related to zonal winds [21,22], with Gilli finding particularly strong gravity wave drag where there is a large difference between the mean flow speed and the given phase speed (the speed of the flow being decelerated/accelerated), such as the upper part of the zonal winter jet stream [22]. Miyamoto suggests that zonal winds are significantly influenced by planetary-scale dust events, transmitting their effects from the lower to the middle atmosphere [23].
These vertical interactions are typically nonlinear and challenging to discern in the time domain, where significant phenomena may not be readily apparent. In contrast, frequency-domain analysis excels at isolating unrelated signals, thereby enhancing the visibility of the interactions of interest. This analytical shift allows for a clearer observation of the dynamics at play, providing a more nuanced understanding of the complex interactions between atmospheric layers. However, frequency-domain analyses of dust, DW1, and zonal circulation have not yet been conducted.
Consequently, while traditional views have qualitatively demonstrated the vertical interactions, we will quantitatively address the frequency domain, conditions, and strength of interactions between signals of dust and DW1 and the specific role of zonal winds in this context. Based on the experiments conducted using the Martian planetary climate model of the Laboratoire de météorologie dynamique Zoom (Mars PCM-LMDZ) [24], our Partial Directed Coherence (PDC) analysis revealed sub-seasonal-scale dust signals caused by variations in dust activity. Here, the sub-seasonal scale indicates signals with periods shorter than a Martian season [24], which lasts approximately 193.47 sols in spring, 178.52 sols in summer, 142.77 sols in fall, and 154.24 sols in winter. Through zonal winds as an intermediary, sub-seasonal dust signals are transmitted to the DW1. When the background dust content is high enough, the dust signal strengthens to be equally important to the semiannual oscillation’s signal. Gravity wave drag can reduce zonal wind signals in the sub-seasonal range, countering their modulation by dust, but it is not significant on semiannual and longer scales. In summary, in the vertical interactions between dust and DW1, zonal winds are a crucial link in signal transmission, while gravity waves counteract the modulation of zonal winds by dust by decelerating the winds.
Addressing the current shortfall in research on vertical interactions within the Martian atmospheric structure, we conduct targeted experiments using the Mars PCM-LMDZ to investigate the interactions between dust, DW1, and zonal circulation. Through the application of PDC analysis, this study explores sub-seasonal-scale dust signals induced by variations in dust activity. A focal point of this research is the transmission of dust signals to DW1 through zonal winds as the intermediary medium, alongside an examination of the effects of gravity waves on this interaction. We also discuss the roles that zonal winds and gravity waves play in these vertical interactions.
2. Materials and Methods
2.1. Experimental Design
In this study, we conducted six Martian atmospheric simulation experiments spanning 10 Martian years each, utilizing the Mars PCM-LMDZ model to simulate the interactions between atmospheric layers. These simulations were based on three initial conditions (cold, warm, and climatology states) derived from the widely used Martian Climate Database [25] (MCD). By toggling the presence of gravity waves (with/without gravity wave influences) through the control of the gravity wave module, we aimed to simulate the interactions of signals between atmospheric layers.
Secondly, drawing on the simulation outcomes, we employed generalized Partial Directed Coherence [26,27] (gPDC) to identify correlations between the dust content within the troposphere (<~40 km) and zonal winds in the upper troposphere and lower mesosphere (UTLM, 20~50 km), as well as DW1 within the middle atmosphere (50~100 km). This exploration seeks to characterize the representation of layer interactions within the frequency domain by comparing these dynamics against inherent atmospheric phenomena. Considering the variable DW1 as , dust as , and zonal winds as , we used Equation (1) with the input of , while and are adjusted accordingly (detailed in Section 2.3). All data were vertically weighted by mass, with a meridional weighting factor of , where is the latitude before conducting the PDC analysis. Then, utilizing a vector autoregressive (VAR) [3] process of gPDC, we aimed to elucidate the interconnections among Martian atmospheric processes (dust, zonal winds, and DW1). Herein, gPDC calculations were conducted using the AsympPDC version 3.0 package in the MATLAB toolbox.
2.2. Numerical Simulation Experiments
In our study, we performed six global simulations using the Mars PCM-LMDZ model, encompassing a grid with 64 × 48 × 29 points across two horizontal and one vertical dimension (with the model top at approximately 102.5 km above the surface). The resolution was as follows: spatial resolution at 5.625° longitude by 3.75° latitude, with 29 hybrid sigma-pressure layers; the temporal resolution was set at every 1.5 Martian hours. The core version of the model was LMDZ5, which is more stable, reliable (verified through years of usage), and operationally efficient than the newest LMDZ6, and it was enough for our experiments.
The initial conditions for the six simulations were based on three dust scenarios—climatology, cold, and warm dust backgrounds—as modeled for the seasonal evolution and spatial variability of dust column opacity in the MCD [25]. The standard ‘climatology’ dust scenario synthesizes observations from Martian years without global dust storms (i.e., MY 24, 26, 27, 29, 30, and 31), creating a composite scenario from these observationally average years. In the ‘cold’ scenario, dust opacity at each location is set to 50% of the minimum values observed during MY 24–31, representing an exceptionally clear atmosphere. The ‘warm’ scenario corresponds to atmospheric layers with dust but without global dust storms, where opacity due to sunlight at each location and throughout the year is set to the maximum values observed during MY 24–31. Dust observations for these Martian years in MCD v6.1 were compiled by Montabone [28].
The terrain used to generate orographic gravity waves in the PCM was smoothed to the model’s horizontal resolution. Sub-grid-scale mountain effects were parameterized along with low-level drag schemes [24,29] and gravity wave drag schemes [30,31]. These schemes assume that all observed stress reductions above mountaintops are due to wave breaking, although, at times, partially trapped non-orographic gravity waves also explain the stress reduction. Furthermore, it is assumed that the area-averaged momentum flux is comparable to the line average measured above the central cross-section. Thus, the scheme’s simulation of momentum flux aligns qualitatively with observations. The gravity wave drag scheme employs a single gravity wave hypothesis, with gravity waves propagating vertically from the model surface in the vertical plane. We adopted a stochastic parameterization scheme for non-orographic gravity waves on the Mars PCM-LMDZ as described by Liu [32], which is an improvement upon the original scheme described by Gilli [22]. This scheme assumes that the sources are located above typical convective cells (~250 Pa) and operate continuously.
Overall, we conducted six experiments (‘cold’, ‘warm’, and ‘climatic state’ scenarios with and without gravity waves, Experiments 1 to 6) using the Mars PCM-LMDZ, as outlined in Table 1.

Table 1.
Model configuration of Experiments (Exp) 1 to 6.
This detailed configuration enables a comprehensive analysis of Martian atmospheric dynamics by contrasting conditions across a range of dust scenarios and gravity wave influences, providing insights into the complex interactions within the Martian atmosphere.
2.3. Partially Directed Coherence Analysis
Mars’s extreme weather, such as lower atmospheric pressure and stronger zonal winds, suggests more robust vertical interactions than Earth. These interactions, involving waves, dust, and seasonal atmospheric changes, affect the distribution of chemical species and thermal structures. Quantitative studies on interlayer interactions in the Martian atmosphere are scarce despite qualitative research indicating their significance. To address this gap, our study employed PDC analysis on data from the Mars PCM-LMDZ model. PDC is well-suited for this task as it effectively isolates and quantifies directional influences between multiple time series data in the frequency domain. This method allows us to discern complex, nonlinear interactions that are difficult to detect in the time domain. By employing PDC analysis, we quantitatively elucidated the frequency, conditions, and strength of interactions between dust, DW1, and zonal winds, enhancing our understanding of Martian atmospheric dynamics.
PDC is a multivariate time series technique derived from the factorization of partial coherence [33]. Research indicates that PDC captures certain types of nonlinear interactions [34,35]. It has been successfully applied in highly nonlinear time series data in fields such as neuroscience [36,37] and meteorology [38]. The definition of causality related to the predictability of two or more different processes is currently known as Granger causality [34]. Granger causality can determine the direction and spectrum of interactions. For instance, interactions between the stratosphere and the tropical troposphere on Earth have been studied based on Granger causality [38]. PDC, derived from the factorization of partial coherence [33], closely embodies the concept of Granger causality in the frequency domain [34]. When analyzing interactions and identifying correlations between different spectral characteristic variables (e.g., dust and wind on Mars) across atmospheric layers, gPDC is an effective tool [27]. PDC’s multivariate analysis evaluates each possible direction of interaction between the mesosphere and the troposphere, revealing influences received or transmitted by the atmosphere, thereby even identifying feedback effects. Notably, PDC shares duality with Granger causality, where a zero corresponds to the absence of a connection, similar to the conditions of Granger causality.
The following definitions were used for the three time series variables in this study, i.e., DW1 , dust , and zonal winds . Here, we consider a vector-valued signal using a p-order vector autoregressive model, VAR(p), defined by the following equation:
where are the VAR(p) coefficients representing the k-order lagged effect of on , with t denoting the time series variable. The random component is a zero-mean novelty process with a covariance matrix :
If and is statistically significant, then is a Granger cause of . This causality implies that indeed helps predict , and vice versa. The VAR(p) model was used to formulate and test the null hypothesis.
If in the past helps predict in the future, then is considered a Granger cause of . Again, we consider a binary time series with a p-order vector autoregressive process VAR(p), as defined in Equation (1), where coefficients describe the lagged effects of on . The frequency-domain representation of A(k) can be denoted as , with
where is the Kronecker delta, , p is the model order, and is the Fourier frequency (Hz). The gPDC information flow of to at a specific frequency is denoted as , indicating
where is , the columns of are denoted as , represents the Hermitian transpose, and is for PDC, where is a identity matrix (with being the variable number of signals), and is the covariance matrix of random components. The 95% confidence interval is computed based on the asymptotic normal distribution of :
where is the number of available observations, and the frequency-related . When the covariance matrix is given as being a priori known from the previous , it is known that
and
For
in which and are matrices.
The vector is given by
where
Here, is an N N identity matrix, has coefficients equal to 1 only at , and has non-zero coefficients only at . The operator denotes the matrix-to-column stacking operator, and had been defined in Equation (1).
The significance level is calculated through the convergence of the following distribution:
where and are weights that can be estimated from the data, and and are two independent distributed random variables, presented under the null hypothesis .
PDC analysis, while sometimes underperforming in the context of linear interactions [35], has been shown to effectively reflect the characteristics of nonlinear interactions despite its various limitations with long time intervals or non-Gaussian processes. PDC operates similarly to the concept of the Mutual Information Rate (MIR) in Gaussian processes, elucidating all information flows between two or more signals, thereby quantitatively reflecting the mutual dependencies between the signals. Conversely, in non-Gaussian scenarios, a boundary exists between the estimated MIR by PDC and the actual MIR, within which the differences are deemed acceptable, allowing PDC results to reflect real interactions to a certain extent [39]. Moreover, PDC has been successfully applied in the analysis of highly nonlinear time series data in fields such as neuroscience, demonstrating its efficacy in revealing the intricate dynamics of complex systems [37]. Thus, PDC is also suitable for analyzing nonlinear problems like the vertical interactions in the Martian atmosphere, offering a quantitative depiction of how different layers within the Martian atmosphere interact and influence each other.
3. Results
3.1. Numerical Simulation Experiment Results
Before proceeding with the PDC analysis, we first examined the general distribution of dust, DW1, and zonal circulation. As outlined in the experimental design, our primary focus was on the distribution of tropospheric dust, the zonal winds in the UTLM, and DW1 in the mesosphere.
For DW1, the simulation results within both solar longitude (Ls) ranges are broadly consistent with previous studies. In the ‘climatology’ scenario, for Ls = 180°–210° (Figure 1i) and Ls = 270°–300° (Figure 2i), the morphology, structure, and amplitude distribution of DW1 closely resemble those depicted in Figure 2c of Forbes et al. [2], Figure 5 of Lee et al. [40], and Figure 4 of Scott et al. [41].
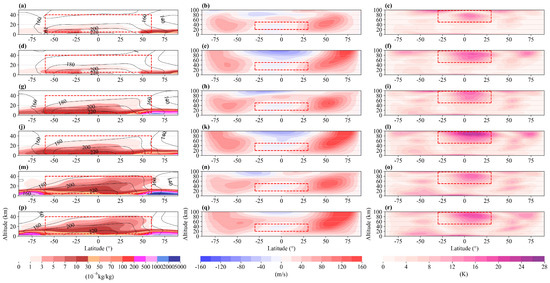
Figure 1.
Vertical profiles of dust, zonal winds, and DW1 amplitude during the first Martian year at Ls = 180°–210° across Experiments 1 to 6. The profiles include the average dust mass mixing ratio (10−6 kg/kg, left), zonal winds (m/s, middle), and amplitude of the diurnal migrating tide DW1 (K, right), with (a–c) showing results from EXP1, (d–f) from EXP2, (g–i) from EXP3, (j–l) from EXP4, (m–o) from EXP5, and (p–r) from EXP6. The red dashed boxes in the images highlight the data ranges selected for the PDC analysis: dust at 5–40 km within ±60° latitude, zonal winds at 20–50 km within ±30° latitude, and DW1 at 50–97.5 km within ±30° latitude. Temperatures below 50 km (contour lines) are indicated by the shaded area of dust mass mixing ratio in the left column, while zonal winds and tidal effects below 100 km are shown in the middle and right columns, respectively. Ls = 180° corresponds to the 372nd Martian sol, and Ls = 210° corresponds to the 422nd Martian sol.
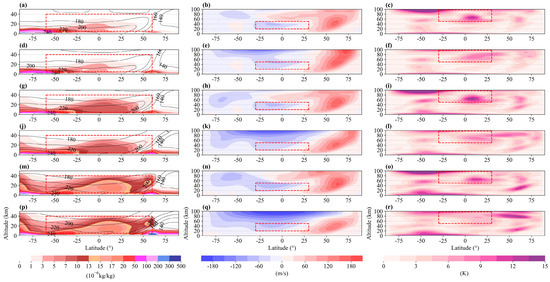
Figure 2.
Similar to Figure 1 but at Ls = 270°–300° during the first Martian year in Experiments 1 to 6. Ls = 270° corresponds to the 515th Martian sol, and Ls = 300° to the 562nd Martian sol.
It is illustrated that during the southern spring, the equatorial amplitude maxima of DW1 are located around 70 km, with smaller non-equatorial maxima at high latitudes at the same altitude (Figure 1). The seasonal variation in the height of the amplitude maxima of DW1, as observed in the MCS data (Wu et al. [42]), is reproduced by the model, with the springtime maxima in the Southern Hemisphere (Figure 2i) being lower than the summertime maxima (Figure 1i). Additionally, the modeled distribution of dust aligns well with observations. At Ls = 180°–210° and 270°–300°, dust development in the Southern Hemisphere reaches higher altitudes compared to the Northern Hemisphere (Figure 1g and Figure 2g), the latter experiencing more vigorous growth due to stronger solar radiation. Our findings also indicate that under a ‘warm’ dust background (Figure 1m,p), regardless of the presence of gravity waves, the average dust mass mixing ratio can reach nearly 5 × 10⁻⁶ kg/kg at 40 km altitude. The dust reaching the upper levels of the tropical troposphere imposes significant thermodynamic forcing on the circulation and tidal patterns, as supported by [43,44].
3.2. Vertical Interactions among Dust, Zonal Winds, and DW1
In the ‘warm’ scenario with a high background dust content, the energy of zonal winds is modulated by dust due to the impact of temperature changes caused by dust absorption of solar radiation. The resulting zonal winds allow DW1 of specific frequency ranges to propagate upwards, filtering out other tides in the process. During this filtering, energy from the zonal winds is transferred to the tides, a portion of which originally stems from dust. Filtering occurs regardless of dust presence, but dust alters the effectiveness of filtering within certain frequency ranges, thereby facilitating interactions across different atmospheric layers. To study the vertical interactions between dust, zonal winds, and DW1, we employ the PDC technique for frequency domain analysis.
In the Martian atmosphere, the primary sources of thermal tide generation are dust and water ice clouds, with dust being the more significant source due to the sparse and cold nature of the Martian atmosphere that limits the formation of water ice clouds [45]. Moreover, the forcing effect of dust on zonal winds and diurnal migrating tidal wave DW1 is stronger than their mutual opposing effects. Our study thus focuses on the interactions among dust, zonal winds, and tides beyond seasonal factors within the same frequency range. We identify energy transfer from dust to zonal winds and tides, with sub-seasonal scales (periods less than 200 Martian days) of dust energy successively transferred to zonal winds and DW1. To corroborate the specific relationship with dust, controlled variable experiments were conducted. An increase in the background dust content led to a simultaneous increase in the Power Spectral Density (PSD) of dust, zonal winds, and DW1 at sub-seasonal scales (Figure 3). The increase is more pronounced without disturbances (Figure 4), as gravitational wave drag partially offsets dust energy, reducing its impact on zonal winds. Besides sub-seasonal dust energy, there are also annual and semi-annual interactions and energy peaks, primarily driven by Mars’s orbital and climatic system rhythms, which are not the focus of this study.
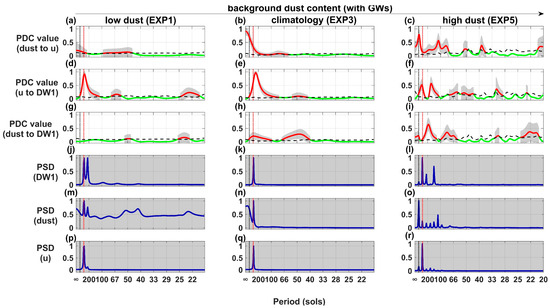
Figure 3.
The distribution of PDC values and PSD in the frequency domain in Experiments 1 (left), 3 (center), and 5 (right) involving gravity waves. The sequence from top to bottom (a–c) shows the PDC values from dust to zonal winds (u); (d–f) illustrate the PDC values from zonal winds to the diurnal migrating tidal wave DW1; (g–i) depict the PDC values from dust to DW1; (j–l) display DW1’s PSD; (m–o) showcase the PSD of dust; (p–r) present the PSD of zonal winds. The data represented in these figures correspond to the averages within the areas of focus described in the experimental chapters. In the top three rows, red (green) lines indicate PDC values with (without) Granger statistical significance, with the shaded gray area representing the 99% confidence interval and the black curved dashed line marking the confidence lower limit. The bottom three rows feature blue lines for the PSD. Dashed vertical red and black lines denote semiannual and annual cycles, respectively.
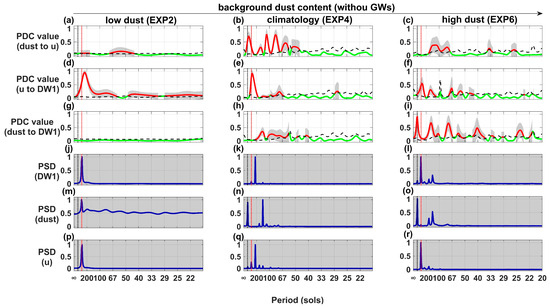
Figure 4.
Same as Figure 3, but for Experiment 2, Experiment 4, and Experiment 6.
Figure 3 and Figure 4 illustrate the distribution of PDC values and PSD in the frequency domain for experiments with and without gravity waves, respectively. The middle layer’s zonal winds act as an intermediate bridge in the energy transfer chain, conveying energy upwards while retaining little themselves. In high dust background scenarios, multiple energy peaks at sub-seasonal scales were observed for dust and DW1, with zonal winds showing few such peaks. Despite absorbing minimal energy at sub-seasonal scales, zonal winds significantly affect DW1 at these frequencies, acting like an energy transfer bridge. The convective layer’s dust energy cannot directly reach the middle layer’s DW1 energy; an intermediate energy transfer bridge is required to convey energy upwards, with zonal winds serving as that bridge. Without gravity wave interference, the PSD consistency between dust and DW1 at sub-seasonal frequencies improves.
According to the theory of the Doppler filtering effect, zonal winds modulate the wavelength of thermal tidal waves, facilitating their dissipation when the propagating directions coincide and aiding their upward propagation when the directions oppose each other. Thus, mid-layer zonal winds convey sub-seasonal-scale dust storm signals from the lower atmosphere (below 40 km) to mid-layer tides (50–100 km) via Doppler shifting the upward-propagating DW1’s frequency. With a higher background dust content, enhanced dust radiative heating transfers more sub-seasonal-scale dust signal energy upwards, making this impact chain more pronounced. This is observed in the PDC value, which indicates the consistent effects of dust on zonal winds and of zonal winds on DW1 at sub-seasonal scales.
3.3. Mechanism Analysis
In this study, we focus on the Southern Hemisphere’s spring season (Ls = 180°–270°) to elucidate the entire chain of impacts, as the effects of chosen dust scenarios in our experiments are most pronounced during the dust seasons.
The zonal wind’s filtering effect on DW1 can be observed by comparing the activity of lower-level DW1 (Figure 5c) against upper-level DW1 (Figure 5d). The unfiltered lower-level DW1 is predominantly driven by dust radiative heating wave sources, as evidenced by the significant rise in the average DW1 amplitude with an increasing background dust content (‘Cold’: 2.3 K, ‘Climatology’: 4.1 K, ‘Warm’: 6.1 K) (Figure 5c). However, DW1 reaching the upper levels is primarily influenced by mid-level zonal winds, rather than solely by lower-level dust heating. Prior to Ls = 180°–270°, the ‘Warm’ scenario exhibits the strongest westerlies, thereby shifting the westward-propagating DW1 to the highest frequencies (Figure 3l), aligning closely with the sub-seasonal-scale dust’s intrinsic frequency (Figure 3o). Similarly, post-Ls = 210°, scenarios with the highest zonal wind speeds consistently correspond with the greatest DW1 magnitudes, as evidenced by the alignment of the maximum bars (ordinate axis labels) in Figure 5b,d.
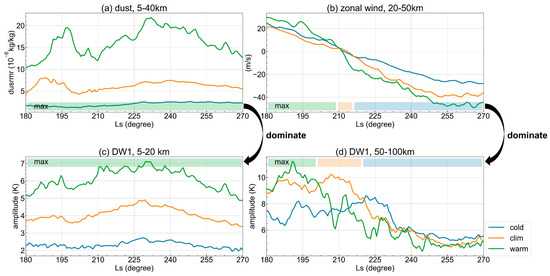
Figure 5.
Numerical simulation results for the Northern Hemisphere’s autumn (Ls = 180°–270°) display the average dust mass mixing ratio, zonal wind, and DW1 amplitude across latitudes 60°S–60°N. (a) Dust mass mixing ratio within the troposphere (5–40 km altitude); (b) zonal wind within the UTLM (20–50 km altitude) across 30°S–30°N; (c) DW1 amplitude in the lower-to-middle troposphere (5–20 km altitude); (d) and in the upper stratosphere (50–100 km altitude) across 30°S–30°N. The ‘max’ color bar corresponds to the maximum value line color.
The Doppler shift effect is encapsulated by Equation (13):
with denoting the Doppler frequency shift, denoting the rotational rate of Mars, denoting the zonal wind speed, denoting the co-latitude, and denoting the equatorial wave phase speed. A simplified version of the dispersion relation for tidal waves in a rotating atmosphere [46] is
where is the horizontal wavenumber, is the Coriolis parameter, and is the buoyancy frequency. The vertical wavenumber is related to the vertical wavelength by , so Equation (14) means that is positively related to frequency . Given that is constant and is always positive, if the zonal wind and wave phase speed are in opposite directions, DW1 will experience a shift to higher frequencies and longer vertical wavelengths upon traversing the UTLM region, ultimately resulting in greater amplitudes by the time it reaches the upper stratosphere.
The first link in the impact chain is the influence of dust on zonal winds. As depicted in Figure 5, lower-level dust can only directly affect the lower-level DW1 and mid-level zonal winds, not directly impacting DW1 in the middle to upper mesosphere. Hence, the upward propagation of dust signals must first modulate the UTLM’s zonal winds. Dust influences by enhancing the Hadley circulation, altering vorticity advection and thus modulating zonal winds, and providing an eastward torque to the equatorial mean zonal winds at the solstice [12,47], as shown in Equation (15). This transformation in the form of the Transformed Eulerian Mean [48] (TEM) equation estimates the impact of meridional (), vertical circulation (), and gravity waves on the acceleration of the mean zonal winds:
The terms and represent the acceleration of westerlies due to meridional and vertical circulations [49,50]. The impact of meridional circulation is at least two orders of magnitude greater than that of vertical circulation, as the average in Figure 6 is almost two orders of magnitude larger than in Figure 7. At the onset of the Northern Hemisphere’s autumn, westerlies dominate (Figure 5b); however, given that is positive in the Northern Hemisphere’s autumn [23] and is a constant, Equation (15) suggests that a larger near-equatorial would result in stronger easterlies, evident from the concurrent rise in in Figure 6a and easterly wind speeds in Figure 5b, correlating with increasing background dust levels. Furthermore, shows a positive correlation with the background dust content, consistent with the enhancements in meridional circulation during periods of intense dust activity found in previous studies [50]. Thus, dust’s modulation of zonal winds primarily originates from dust radiative heating-induced changes in meridional winds.
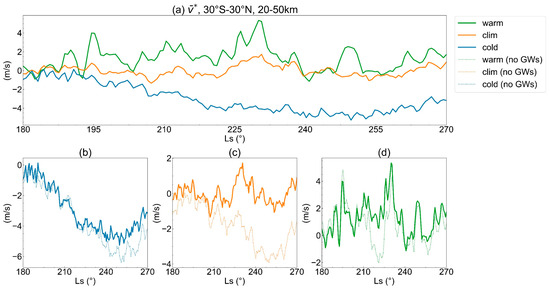
Figure 6.
Numerical simulation results for the Northern Hemisphere’s autumn (Ls = 180°–270°) within the UTLM across 30°S–30°N, showcasing residual mean meridional wind () outcomes for (a) ‘cold’, ‘climatology’, and ‘warm’ dust scenarios with conventional gravity wave parameterization, and with/without gravity wave impacts in (b) ‘cold’, (c) ‘climatology’, and (d) ‘warm’ scenarios.
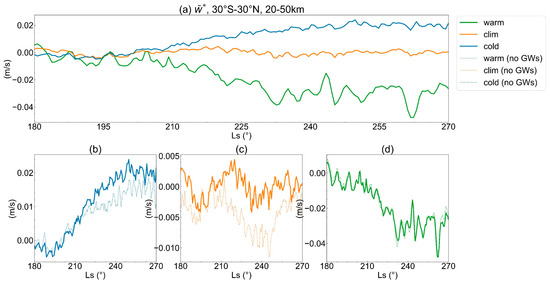
Figure 7.
These numerical simulation results are analogous to Figure 6 but focus on the residual mean vertical wind ().
The influence of gravity waves on the acceleration of mean zonal winds, represented by , can be estimated by directly controlling the gravity wave parameterization scheme in the model. Gravity waves facilitate easterly acceleration in the ‘Climatological’ and ‘Warm’ dust scenarios, while they decelerate easterlies in the ‘Cold’ scenario, though the forcing of gravity waves on the zonal wind field typically remains below 5 m/s, significantly lower than the forcing from dust on the zonal wind field (approximately 20 m/s), as shown in Figure 8. Notably, while the forcing from gravity waves plays a less significant role in shaping the zonal wind field, it markedly alters the and in the ‘Climatological’ scenario, as depicted in Figure 6c and Figure 7c.
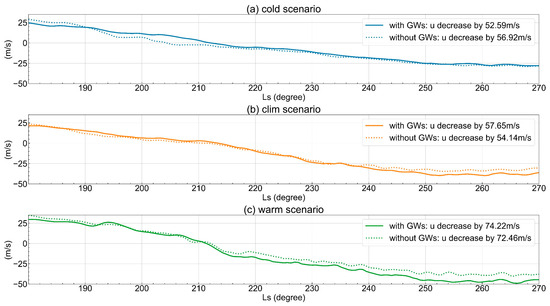
Figure 8.
Numerical simulation results within the UTLM across 30°S–30°N for ‘cold’, ‘climatological’, and ‘warm’ scenarios, with/without gravity wave impacts. The legend indicates the change in zonal wind speeds from 180 Ls to 270 Ls.
In summary, sub-seasonal-scale dust energy in the low-latitude regions, through thermodynamic effects, enhances the residual mean meridional circulation (), strengthens the Hadley circulation, and alters vorticity advection. This provides an eastward torque to the equatorial mean zonal winds, augmenting easterlies and leading to a greater dissipation of DW1 in the UTLM region through the Doppler shift effect. Thus, although an increase in the background dust content boosts the excitation of lower-level thermal tidal fluctuations, the thermal tides that reach the middle to upper mesosphere are reduced. In this process, DW1 reaching upper levels undergoes more extensive modulation by zonal winds, with the modulating energy initially stemming from dust energy in the lower-to-middle troposphere. This outlines the complete chain of impacts among dust, zonal winds, and tides.
4. Discussion
This study quantitatively analyzes the vertical interactions between dust, zonal winds, and the migrating diurnal tide DW1 in the Martian atmosphere using a frequency-domain approach based on PCM-LMDZ simulations and Partial Directed Coherence (PDC) techniques. Our findings reveal an important chain of influence, where sub-seasonal-scale dust signals originating from the troposphere are transmitted upward through the modulation of middle atmospheric zonal winds, facilitating the transfer of energy to DW1 in the upper mesosphere. This mechanism highlights the crucial role of zonal winds in linking different atmospheric layers on Mars.
While previous studies have qualitatively demonstrated such vertical coupling, our work provides quantitative insights into the frequency dependence, conditions, and relative strengths of these interactions. Notably, the influence of dust on DW1 becomes increasingly pronounced under high dust-loading scenarios, rivaling the prominent semiannual oscillation signal. Gravity waves, on the other hand, exert a relatively weak forcing on zonal winds (below 5 m/s), partially counteracting the modulating effects of dust (approximately 20 m/s) at sub-seasonal scales. This distinction underlines dust significance and the varying scales of impact that different atmospheric phenomena have on Martian atmospheric dynamics.
Despite these significant findings, this study has several limitations that should be addressed in future research. First, our simulations rely on parameterized representations of dust activities [28] and gravity wave processes [32], which may not fully capture the complexity of these phenomena. Incorporating more observational constraints and advanced parameterization schemes could improve the model’s fidelity. Second, our analysis primarily focuses on the interactions between dust, zonal winds, and DW1, while other secondary potential mechanisms, such as the role of planetary waves, are not considered. A more comprehensive investigation of various coupling pathways is warranted. Furthermore, our study primarily examines the general behavior and averages over latitudes. However, it is crucial to recognize that the Martian atmosphere exhibits longitudinal variations due to topographical characteristics, which may also influence the strength and patterns of vertical interactions. Although topography is not the focus of this study, future studies could explore these spatial and temporal differences in detail, potentially revealing new insights.
Looking ahead, several promising research directions emerge. Combining our modeling efforts with enhanced observational data from ongoing and future Mars missions could lead to improved parameterizations and validation of the simulated processes. Additionally, exploring the impacts of other atmospheric coupling mechanisms, such as planetary waves, on zonal winds, tides, and dust dynamics would provide a more holistic understanding of the Martian atmospheric system. Moreover, investigating the scale dependence of atmospheric layer coupling could yield valuable insights. Our study primarily focused on sub-seasonal scales, but interactions at longer timescales, such as interannual or decadal variations, may exhibit distinct characteristics and influence large-scale climate patterns on Mars. Conversely, examining the coupling mechanisms at smaller spatial and temporal scales could unravel the intricate dynamics governing mesoscale phenomena like dust devils and slope winds. However, scaling up requires support from longer-duration observational data, while scaling down demands higher-resolution data.
In conclusion, this study represents a significant step forward in quantifying the vertical interactions within the Martian atmosphere. By employing advanced frequency-domain techniques, we elucidated the crucial role of zonal winds in facilitating energy transfer from dust activities to the migrating diurnal tide. However, our findings also underscore the need for further research to address remaining uncertainties, incorporate additional coupling mechanisms, and explore the scale dependence of these interactions. Such efforts will not only deepen our understanding of the Martian climate system but also contribute to the broader field of comparative planetary atmospheric dynamics.
5. Conclusions
This work addresses the existing shortcomings in quantitative studies on vertical interactions within the Martian atmospheric structure by conducting targeted experiments with the Mars PCM-LMDZ. Through PDC analysis, it explores sub-seasonal-scale dust signals induced by variations in dust activity. It focuses on the process by which dust signals are transmitted to DW1 through zonal winds as the intermediary medium and examines the effects of gravity waves on this interaction. The roles of zonal winds and gravity waves in these vertical interactions are also discussed.
Our findings emphasize the importance of employing frequency-domain analysis to quantify vertical interactions in studies of Martian atmospheric dynamics. Through detailed analysis of the interactions among dust, DW1, and zonal circulation, this study not only advances our understanding of the dynamic interplay between different atmospheric layers on Mars but also lays a novel methodological foundation for future Martian climate modeling. Moreover, we showcase the potential of PDC techniques in analyzing complex atmospheric systems’ nonlinear interactions, offering a valuable tool for similar studies in other planetary atmospheres.
Author Contributions
Conceptualization, J.Z. and Z.S.; methodology, J.Z.; software, J.Z.; validation, J.Z., M.H. and Z.S.; formal analysis, J.Z. and Z.S.; investigation, J.Z. and M.H.; resources, J.Z.; data curation, M.H.; writing—original draft preparation, J.Z.; writing—review and editing, J.Z. and M.H.; visualization, J.Z.; supervision, Z.S.; project administration, Z.S.; funding acquisition, Z.S. All authors have read and agreed to the published version of the manuscript.
Funding
This work is supported by the National Natural Science Foundation of China grant 42275060; the Outstanding Youth Scientist Foundation of Hunan Province grant 2021JJ10048; and the ‘Western Light’ Cross-Team Project of the Chinese Academy of Sciences, Key Laboratory Cooperative Research Project.
Data Availability Statement
The Mars PCM-LMDZ is freely distributed and available to the community at http://www-planets.lmd.jussieu.fr/ (accessed on 16 March 2024) and can be downloaded and installed by following the instructions given in the User Manual found on the web site. The AsympPDC version 3.0 package in the MATLAB toolbox is freely distributed and available to the community at https://ww2.mathworks.cn/matlabcentral/fileexchange/116290-asymppdc-package (accessed on 23 March 2024), and the user guidance right on the main page is very detailed.
Conflicts of Interest
The authors declare no conflicts of interest.
References
- Leovy, C. Weather and climate on Mars. Nature 2001, 412, 245–249. [Google Scholar] [CrossRef]
- Forbes, J.M.; Zhang, X.; Forget, F.; Millour, E.; Kleinböhl, A. Solar tides in the middle and upper atmosphere of Mars. J. Geophys. Res. Space Phys. 2020, 125, 8140–8145. [Google Scholar] [CrossRef]
- Wilson, R.J. A general circulation model simulation of the Martian polar warming. Geophys. Res. Lett. 1997, 24, 123–126. [Google Scholar] [CrossRef]
- Banfield, D.; Spiga, A.; Newman, C.; Forget, F.; Lemmon, M.; Lorenz, R.; Murdoch, N.; Viudez-Moreiras, D.; Pla-Garcia, J.; Garcia, R.F.; et al. The atmosphere of Mars as observed by InSight. Nat. Geosci. 2020, 13, 190–198. [Google Scholar] [CrossRef]
- Haberle, R.M.; Pollack, J.B.; Barnes, J.R.; Zurek, R.W.; Leovy, C.B.; Murphy, J.R.; Lee, H.; Schaeffer, J. Mars atmospheric dynamics as simulated by the NASA Ames General Circulation Model: 1. The zonal-mean circulation. J. Geophys. Res. Planets 1993, 98, 3093–3123. [Google Scholar] [CrossRef]
- Wang, H. Cyclones, tides, and the origin of a cross-equatorial dust storm on Mars. Geophys. Res. Lett. 2003, 30, 3–5. [Google Scholar] [CrossRef]
- Haberle, R.M.; Leovy, C.B.; Pollack, J.B. Some effects of global dust storms on the atmospheric circulation of Mars. Icarus 1982, 50, 322–367. [Google Scholar] [CrossRef]
- Medvedev, A.S.; Hartogh, P. Winter polar warmings and the meridional transport on Mars simulated with a general circulation model. Icarus 2007, 186, 97–110. [Google Scholar] [CrossRef]
- Barnes, J.R.; Haberle, R.M.; Wilson, R.J.; Lewis, S.R.; Murphy, J.R.; Read, P.L. The Global Circulation; Cambridge University Press: Cambridge, UK, 2017; pp. 229–294. [Google Scholar]
- McCleese, D.; Schofield, J.; Taylor, F.; Abdou, W.; Aharonson, O.; Banfield, D.; Calcutt, S.; Heavens, N.; Irwin, P.; Kass, D.; et al. Intense polar temperature inversion in the middle atmosphere on Mars. Nat. Geosci. 2008, 1, 745–749. [Google Scholar] [CrossRef]
- Forbes, J.M.; Vincent, R.A. Effects of mean winds and dissipation on the diurnal propagating tide: An analytic approach. Planet. Space Sci. 1989, 37, 197–209. [Google Scholar] [CrossRef]
- Schneider, E.K. Martian great dust storms: Interpretive axially symmetric models. Icarus 1983, 55, 302–331. [Google Scholar] [CrossRef]
- Medvedev, A.S.; Yiğit, E.; Hartogh, P. Estimates of gravity wave drag on Mars: Indication of a possible lower thermospheric wind reversal. Icarus 2011, 211, 909–912. [Google Scholar] [CrossRef]
- Medvedev, A.S.; Yiğit, E.; Hartogh, P.; Becker, E. Influence of gravity waves on the Martian atmosphere: General circulation modeling. J. Geophys. Res. Planets 2011, 116, E10004. [Google Scholar] [CrossRef]
- Kuroda, T.; Medvedev, A.S.; Yiğit, E. Gravity Wave Activity in the Atmosphere of Mars during the 2018 Global Dust Storm: Simulations with a High-Resolution Model. J. Geophys. Res. Planets 2020, 125, e2020JE006556. [Google Scholar] [CrossRef]
- Fels, S.B.; Lindzen, R.S. The interaction of thermally excited gravity waves with mean flows. Geophys. Fluid Dyn. 2008, 6, 149–191. [Google Scholar] [CrossRef]
- Hamilton, K.P. Numerical Studies of Wave-Mean Flow Interaction in the Stratosphere, Mesosphere and Lower Thermosphere; Princeton University: Princeton, NJ, USA, 1981. [Google Scholar]
- Miyahara, S. Zonal Mean Winds Induced by Solar Diurnal Tides in the Lower Thermosphere. J. Meteorol. Soc. Japan Ser. II 1981, 59, 303–319. [Google Scholar] [CrossRef][Green Version]
- He, Y.; Zhu, X.; Sheng, Z.; Zhang, J.; Zhou, L.; He, M. Statistical Characteristics of Inertial Gravity Waves over a Tropical Station in the Western Pacific Based on High-Resolution GPS Radiosonde Soundings. J. Geophys. Res. Atmos. 2021, 126, e2021JD034719. [Google Scholar] [CrossRef]
- Zurek, R.W. Atmospheric Tidal Forcing of the Zonal-Mean Circulation: The Martian Dusty Atmosphere. J. Atmos. Sci. 1986, 43, 652–670. [Google Scholar] [CrossRef]
- Medvedev, A.S.; González-Galindo, F.; Yiğit, E.; Feofilov, A.G.; Forget, F.; Hartogh, P. Cooling of the Martian thermosphere by CO2 radiation and gravity waves: An intercomparison study with two general circulation models. J. Geophys. Res. Planets 2015, 120, 913–927. [Google Scholar] [CrossRef]
- Gilli, G.; Forget, F.; Spiga, A.; Navarro, T.; Millour, E.; Montabone, L.; Kleinböhl, A.; Kass, D.M.; McCleese, D.J.; Schofield, J.T. Impact of Gravity Waves on the Middle Atmosphere of Mars: A Non-Orographic Gravity Wave Parameterization Based on Global Climate Modeling and MCS Observations. J. Geophys. Res. Planets 2020, 125, 1–31. [Google Scholar] [CrossRef]
- Miyamoto, A.; Nakagawa, H.; Kuroda, T.; Takami, K.; Murata, I.; Medvedev, A.S.; Yoshida, N.; Aoki, S.; Sagawa, H.; Kasaba, Y.; et al. Intense zonal wind in the martian mesosphere during the 2018 planet-encircling dust event observed by ground-based infrared heterodyne spectroscopy. Geophys. Res. Lett. 2021, 48, 0094–8276. [Google Scholar] [CrossRef]
- Forget, F.; Hourdin, F.; Fournier, R.; Hourdin, C.; Talagrand, O.; Collins, M.; Lewis, S.R.; Read, P.L.; Huot, J.P. Improved general circulation models of the Martian atmosphere from the surface to above 80 km. J. Geophys. Res. Planets 1999, 104, 24155–24175. [Google Scholar] [CrossRef]
- Millour, E.; Forget, F.; Spiga, A.; Vals, M.; Zakharov, V.; Montabone, L. Mars climate database. In From Mars Express to ExoMars, 27–28 February 2018, Madrid, Spain; LMD: Paris, France, 2018. [Google Scholar]
- Schelter, B.; Timmer, J.; Eichler, M. Assessing the strength of directed influences among neural signals using renormalized partial directed coherence. J. Neurosci. Methods 2009, 179, 121–130. [Google Scholar] [CrossRef] [PubMed]
- Baccala, L.A.; Sameshima, K.; Takahashi, D.Y. Generalized Partial Directed Coherence. In Proceedings of the 2007 15th International Conference on Digital Signal Processing, Wales, UK, 1–4 July 2007; pp. 163–166. [Google Scholar]
- Montabone, L.; Forget, F.; Millour, E.; Wilson, R.J.; Lewis, S.R.; Cantor, B.; Kass, D.; Kleinböhl, A.; Lemmon, M.T.; Smith, M.D.; et al. Eight-year climatology of dust optical depth on Mars. Icarus 2015, 251, 65–95. [Google Scholar] [CrossRef]
- Lott, F.; Miller, M.J. A new subgrid-scale orographic drag parametrization: Its formulation and testing. Q. J. R. Meteorol. Soc. 1997, 123, 101–127. [Google Scholar] [CrossRef]
- Baines, P.G.; Palmer, T. Rationale for a New Physically-Based Parameterization of Subgridscale Orographic Effects; ECMWF: Reading, UK, 1990. [Google Scholar]
- Miller, M.J.; Palmer, T.N.; Swinbank, R. Parametrization and influence of subgridscale orography in general circulation and numerical weather prediction models. Meteorol. Atmos. Phys. 1989, 40, 84–109. [Google Scholar] [CrossRef]
- Liu, J.; Millour, E.; Forget, F.; Lott, F.; Bierjon, A.; Martinez, A.; Lebonnois, S.; Gilli, G. New Parameterization of Non-Orographic Gravity Wave Scheme for LMD Mars GCM and its Impacts on the Upper Atmosphere. In Proceedings of the Seventh International Workshop on the Mars Atmosphere: Modelling and Observations, Paris, France, 1 June 2022; pp. 2105–2110. [Google Scholar]
- Baccalá, L.A.; Sameshima, K. Partial directed coherence: A new concept in neural structure determination. Biol. Cybern. 2001, 84, 463–474. [Google Scholar] [CrossRef]
- Granger, C. Investigating causal relations by econometric models and cross-spectral methods. Econometrica 1969, 37, 424–438. [Google Scholar] [CrossRef]
- Sugihara, G.; May, R.; Ye, H.; Hsieh, C.H.; Deyle, E.; Fogarty, M.; Munch, S. Detecting Causality in Complex Ecosystems. Science 2012, 338, 496–500. [Google Scholar] [CrossRef]
- Sato, J.R.; Takahashi, D.Y.; Arcuri, S.M.; Sameshima, K.; Baccalá, L. Frequency domain connectivity identification: An application of partial directed coherence in fMRI. Hum. Brain Mapp. 2010, 30, 452–461. [Google Scholar] [CrossRef]
- Biazoli, C.; Sturzbecher, M.; White, T.; Onias, H.; Andrade, K.; de Araujo, D.; Sato, J. Application of Partial Directed Coherence to the analysis of Resting-State EEG-fMRI data. Brain Connect. 2013, 3, 563–568. [Google Scholar] [CrossRef] [PubMed]
- Raphaldini, B.; Teruya, A.S.W.; Leite da Silva Dias, P.; Massaroppe, L.; Takahashi, D.Y. Stratospheric ozone and quasi-biennial oscillation (QBO) interaction with the tropical troposphere on intraseasonal and interannual timescales: A normal-mode perspective. Earth Syst. Dyn. 2021, 12, 83–101. [Google Scholar] [CrossRef]
- Takahashi, D.Y.; Baccalá, L.A.; Sameshima, K. Information theoretic interpretation of frequency domain connectivity measures. Biol. Cybern. 2010, 103, 463–469. [Google Scholar] [CrossRef] [PubMed]
- Lee, C.; Lawson, W.G.; Richardson, M.I.; Heavens, N.G.; Kleinbohl, A.; Banfield, D.; McCleese, D.J.; Zurek, R.; Kass, D.; Schofield, J.T.; et al. Thermal tides in the Martian middle atmosphere as seen by the Mars Climate Sounder. J. Geophys. Res. 2009, 114, E03005. [Google Scholar] [CrossRef] [PubMed]
- Guzevich, S.D.; Tallat, E.R.; Waugh, D.W. Observations of planetary waves and nonmigrating tides by the Mars Climate Sounder. J. Geophys. Res. Planets 2012, 117, E03010. [Google Scholar]
- Wu, Z.; Li, T.; Dou, X. Seasonal variation of Martian middle atmosphere tides observed by the Mars Climate Sounder. J. Geophys. Res. Planets 2015, 120, 2206–2223. [Google Scholar] [CrossRef]
- Guzewich, S.D.; Wilson, R.J.; McConnochie, T.H.; Toigo, A.D.; Banfield, D.J.; Smith, M.D. Thermal tides during the 2001 Martian global-scale dust storm. J. Geophys. Res. Planets 2014, 119, 506–519. [Google Scholar] [CrossRef]
- Wu, Z.; Li, T.; Zhang, X.; Li, J.; Cui, J. Dust tides and rapid meridional motions in the Martian atmosphere during major dust storms. Nat. Commun. 2020, 11, 614–616. [Google Scholar] [CrossRef] [PubMed]
- Wu, Z.; Li, T.; Li, J.; Zhang, X.; Yang, C.; Cui, J. Abnormal Phase Structure of Thermal Tides during Major Dust Storms on Mars: Implications for the Excitation Source of High-altitude Water Ice Clouds. J. Geophys. Res. Planets 2021, 126, e2020JE006758. [Google Scholar] [CrossRef]
- Marshall, J.; Plumb, A. Circulation of the Atmosphere and Ocean. Available online: https://ocw.mit.edu/courses/12-333-atmospheric-and-ocean-circulations-spring-2004/resources/full/ (accessed on 19 May 2024).
- Kuroda, T.; Medvedev, A.S.; Hartogh, P.; Takahashi, M. Semiannual oscillations in the atmosphere of Mars. Geophys. Res. Lett. 2008, 35, L23202. [Google Scholar] [CrossRef]
- Plumb, R.A.; Ferrari, R. Transformed Eulerian-Mean Theory. Part I: Nonquasigeostrophic Theory for Eddies on a Zonal-Mean Flow. J. Phys. Oceanogr. 2005, 35, 165–174. [Google Scholar] [CrossRef]
- Wilson, R.J. Evidence for diurnal period Kelvin waves in the Martian atmosphere from Mars Global Surveyor TES data. Geophys. Res. Lett. 2000, 27, 3889–3892. [Google Scholar] [CrossRef]
- Medvedev, A.S.; Yiğit, E.; Kuroda, T.; Hartogh, P. General circulation modeling of the Martian upper atmosphere during global dust storms. J. Geophys. Res. Planets 2013, 118, 2234–2246. [Google Scholar] [CrossRef]


Disclaimer/Publisher’s Note: The statements, opinions and data contained in all publications are solely those of the individual author(s) and contributor(s) and not of MDPI and/or the editor(s). MDPI and/or the editor(s) disclaim responsibility for any injury to people or property resulting from any ideas, methods, instructions or products referred to in the content. |
© 2024 by the authors. Licensee MDPI, Basel, Switzerland. This article is an open access article distributed under the terms and conditions of the Creative Commons Attribution (CC BY) license (https://creativecommons.org/licenses/by/4.0/).