Article

Analysis of Road Surface Texture for Asphalt Pavement Adhesion Assessment Using 3D Laser Technology

1
Key Laboratory of Road and Traffic Engineering, Ministry of Education, Tongji University, Shanghai 201804, China
2
Department of Civil, Computer Science and Aeronautical Technologies Engineering, Roma TRE University, 00146 Rome, Italy
3
Technology, Innovation, and Digital Spoke—ANAS Spa, 00185 Rome, Italy
*
Author to whom correspondence should be addressed.
Remote Sens. 2024, 16(11), 1943; https://doi.org/10.3390/rs16111943
Submission received: 6 April 2024 / Revised: 25 May 2024 / Accepted: 27 May 2024 / Published: 28 May 2024

Abstract

:
Pavement adhesion plays a crucial role in driving safety, while traditional test methods exhibit some limitations. To improve the efficiency and accuracy of asphalt pavement texture characterization and adhesion assessments, this paper uses three-dimensional (3D) laser technology to detect the continuous point cloud data of road surface and reconstruct the 3D topography of pavement texture. On this basis, a volume parameter Volume of peak materials (Vmp) is innovatively proposed to comprehensively characterize the 3D spatial characteristics of road surface texture. The correlation analysis between the proposed Vmp and the traditional adhesion evaluation index Transversal Adhesion Coefficient (CAT) is conducted, and then refined graded adhesion prediction models based on the proposed Vmp are proposed. Results show that the proposed volume parameter Vmp can reliably and accurately characterize the asphalt pavement texture by considering more structural properties of the road surface texture. According to the research findings of this paper, it is feasible to achieve rapid and correct assessment of asphalt pavement adhesion using 3D laser detection technology by comprehensively considering the 3D characteristics of the road surface texture.

1. Introduction

Pavement adhesion plays an important role in providing skid resistance and ensuring driving safety. It provides the grip required to maintain control of the vehicle and brake in case of emergency [1]. Many studies indicated that crash rate increases when roadway sections have low adhesion [2,3,4,5]. Pavement adhesion is the result of a complex interplay between pavement texture and vehicle tire, which is prone to variation due to rainfall, ice and snow, environmental temperature, and texture decay, thus influencing vehicular travel safety [6,7]. Therefore, fast, correct, and real-time assessment of pavement adhesion is an important task faced by transportation agencies all over the world, many have performed pavement adhesion testing on their highways to monitor the safety and condition for years.
Traditionally, several types of equipment have been developed to measure pavement adhesion which can be classified into two types. One is to directly measure road pavement adhesion or measure the braking force to assess the adhesion, including the British Pendulum Tester [8], Dynamic Adhesion Tester [9], Locked-Wheel Skid Trailer [10], Grip Tester [11], and Side-Force Coefficient Routine Investigation Machine (S.C.R.I.M.). All these direct test devices have been widely used in many studies [12,13,14]. However, due to the requirement of water and testing tires or rubber slides in adhesion devices, collecting adhesion by these devices is always affected by water film depth and temperature. Another is to calculate pavement adhesion by measuring the depth of the road texture. Exemplars include using the volumetric “sand patch” test, the circular track meter, or a high-speed profiler to detect the Mean Texture Depth (MTD) and Mean Profile Depth (MPD) [15,16,17]. The operation of most of these devices is manual, which is time-consuming, spot-based, and labor-intensive [18,19]. Nevertheless, these methods can measure adhesion only periodically, it hardly meets the requirements of the real-time inspection for pavement adhesion while the adhesion varies.
The advance in computer science has greatly promoted the development of image processing technology in extracting texture information from two-dimensional (2D) road surface images. Which is non-contact, fast, low cost, and quickly become the prevailing pavement texture detection method nowadays [20]. Lots of image processing technologies have been applied to enhance the pavement texture detection from 2D images. Traditional image processing methods include threshold methods [21], Wavelet-based methods [22], and texture-anisotropy approach [23], etc. The developing machine learning methods include artificial neural networks [24], support vector machines [25], and Logistic regression [26], etc. The innovation of CNN-based deep learning methods has been driving advances in large-scale image processing [27,28]. All these methods improve the detection speed of pavement texture, but the 2D technologies extract the pavement texture information relying strongly on the image greyscale, the identification result is easily impacted by oil spills, spots, shadows, etc. [29]. Moreover, pavement adhesion evaluation relies on comprehensive three-dimensional (3D) pavement surface properties. Using the 2D methods will lead to the loss of key information on texture morphology, thus affecting the accuracy of pavement texture extraction and the reliability of the pavement adhesion assessment.
The emerging laser-based technology can yield high-resolution, high-density, full-lane pavement 3D data, and has been used extensively in the detection and evaluation, of cracks, rutting, pothole, and faulting [30,31,32,33,34]. In recent years, some studies have applied this technology to measure and evaluate pavement texture automatically [35]. 3D data of a road pavement surface were obtained, and the MTD and MPD of the road segment were calculated Liang et al. [13], Alamdarlo and Hesami [36], Chen et al. [37]. The estimated model of pavement adhesion can be analyzed by investigating the relationship between the adhesion index and surface texture [38,39]. Ref. [40] applied a deep learning technique to predict adhesion numbers based on the macrotexture information collected on different pavement surfaces in situ and achieved good prediction accuracy. Ref. [41] established an adhesion prediction model incorporating the pavement texture of asphalt pavement samples prepared in the laboratory. Ref. [42] conducted a multi-resolution analysis using three-dimensional (3D) asphalt pavement texture data to correlate pavement texture to adhesion measurements. Ref. [43] used a novel 0.1 mm 3D Safety Sensor to collect the pavement texture and estimated the pavement adhesion based on the detected texture characteristics by using an artificial neural network, ref. [44] conducted a field evaluation of pavement texture under actual traffic polishing using 3D areal parameters. However, these methods generate limited success primarily due to data from MPD and MTD processes that only include a small portion of pavement surface characteristics, and other important surface characteristics (such as spatial, hybrid, and so on) relevant to adhesion are ignored in the index.
To improve existing asphalt pavement adhesion measurement surveys and Motivated by the recent achievements of 3D laser technology, this study aims to propose a novel method to comprehensively characterize the asphalt pavement texture using 3D technology. We reconstruct the 3D morphology of asphalt pavement texture by using the collected 3D point cloud data. Then we used the volume parameter, which can fully consider the three-dimensional morphology of the road surface, to characterize the pavement texture. Finally, we innovatively established the graded adhesion evaluation models based on the proposed volume parameter. Then we conduct the correlation analysis between the proposed Vmp and the traditional adhesion evaluation index Transversal Adhesion Coefficient (CAT). Finally, we innovatively established the graded adhesion evaluation models based on the proposed volume parameter. Results show that the proposed Vmp can more accurately characterize the structural properties of the road surface texture from a three-dimensional perspective. The research findings of this paper can provide technical support for the fast, real-time, and accurate prediction of saphalt pavement adhesion.
The rest of this paper is organized as follows: In Section 2, the methodology adopted in this paper is presented, including experimental equipment, data collection, and processing methods, as well as the calculation methods of the volume parameter. Section 3 presents the experiment processes and experimental results. In Section 4, we discuss the advancement of the proposed method. The paper is concluded with some remarks in Section 5. Based on the result found in the paper, future development of the research is discussed.

2. Methodology

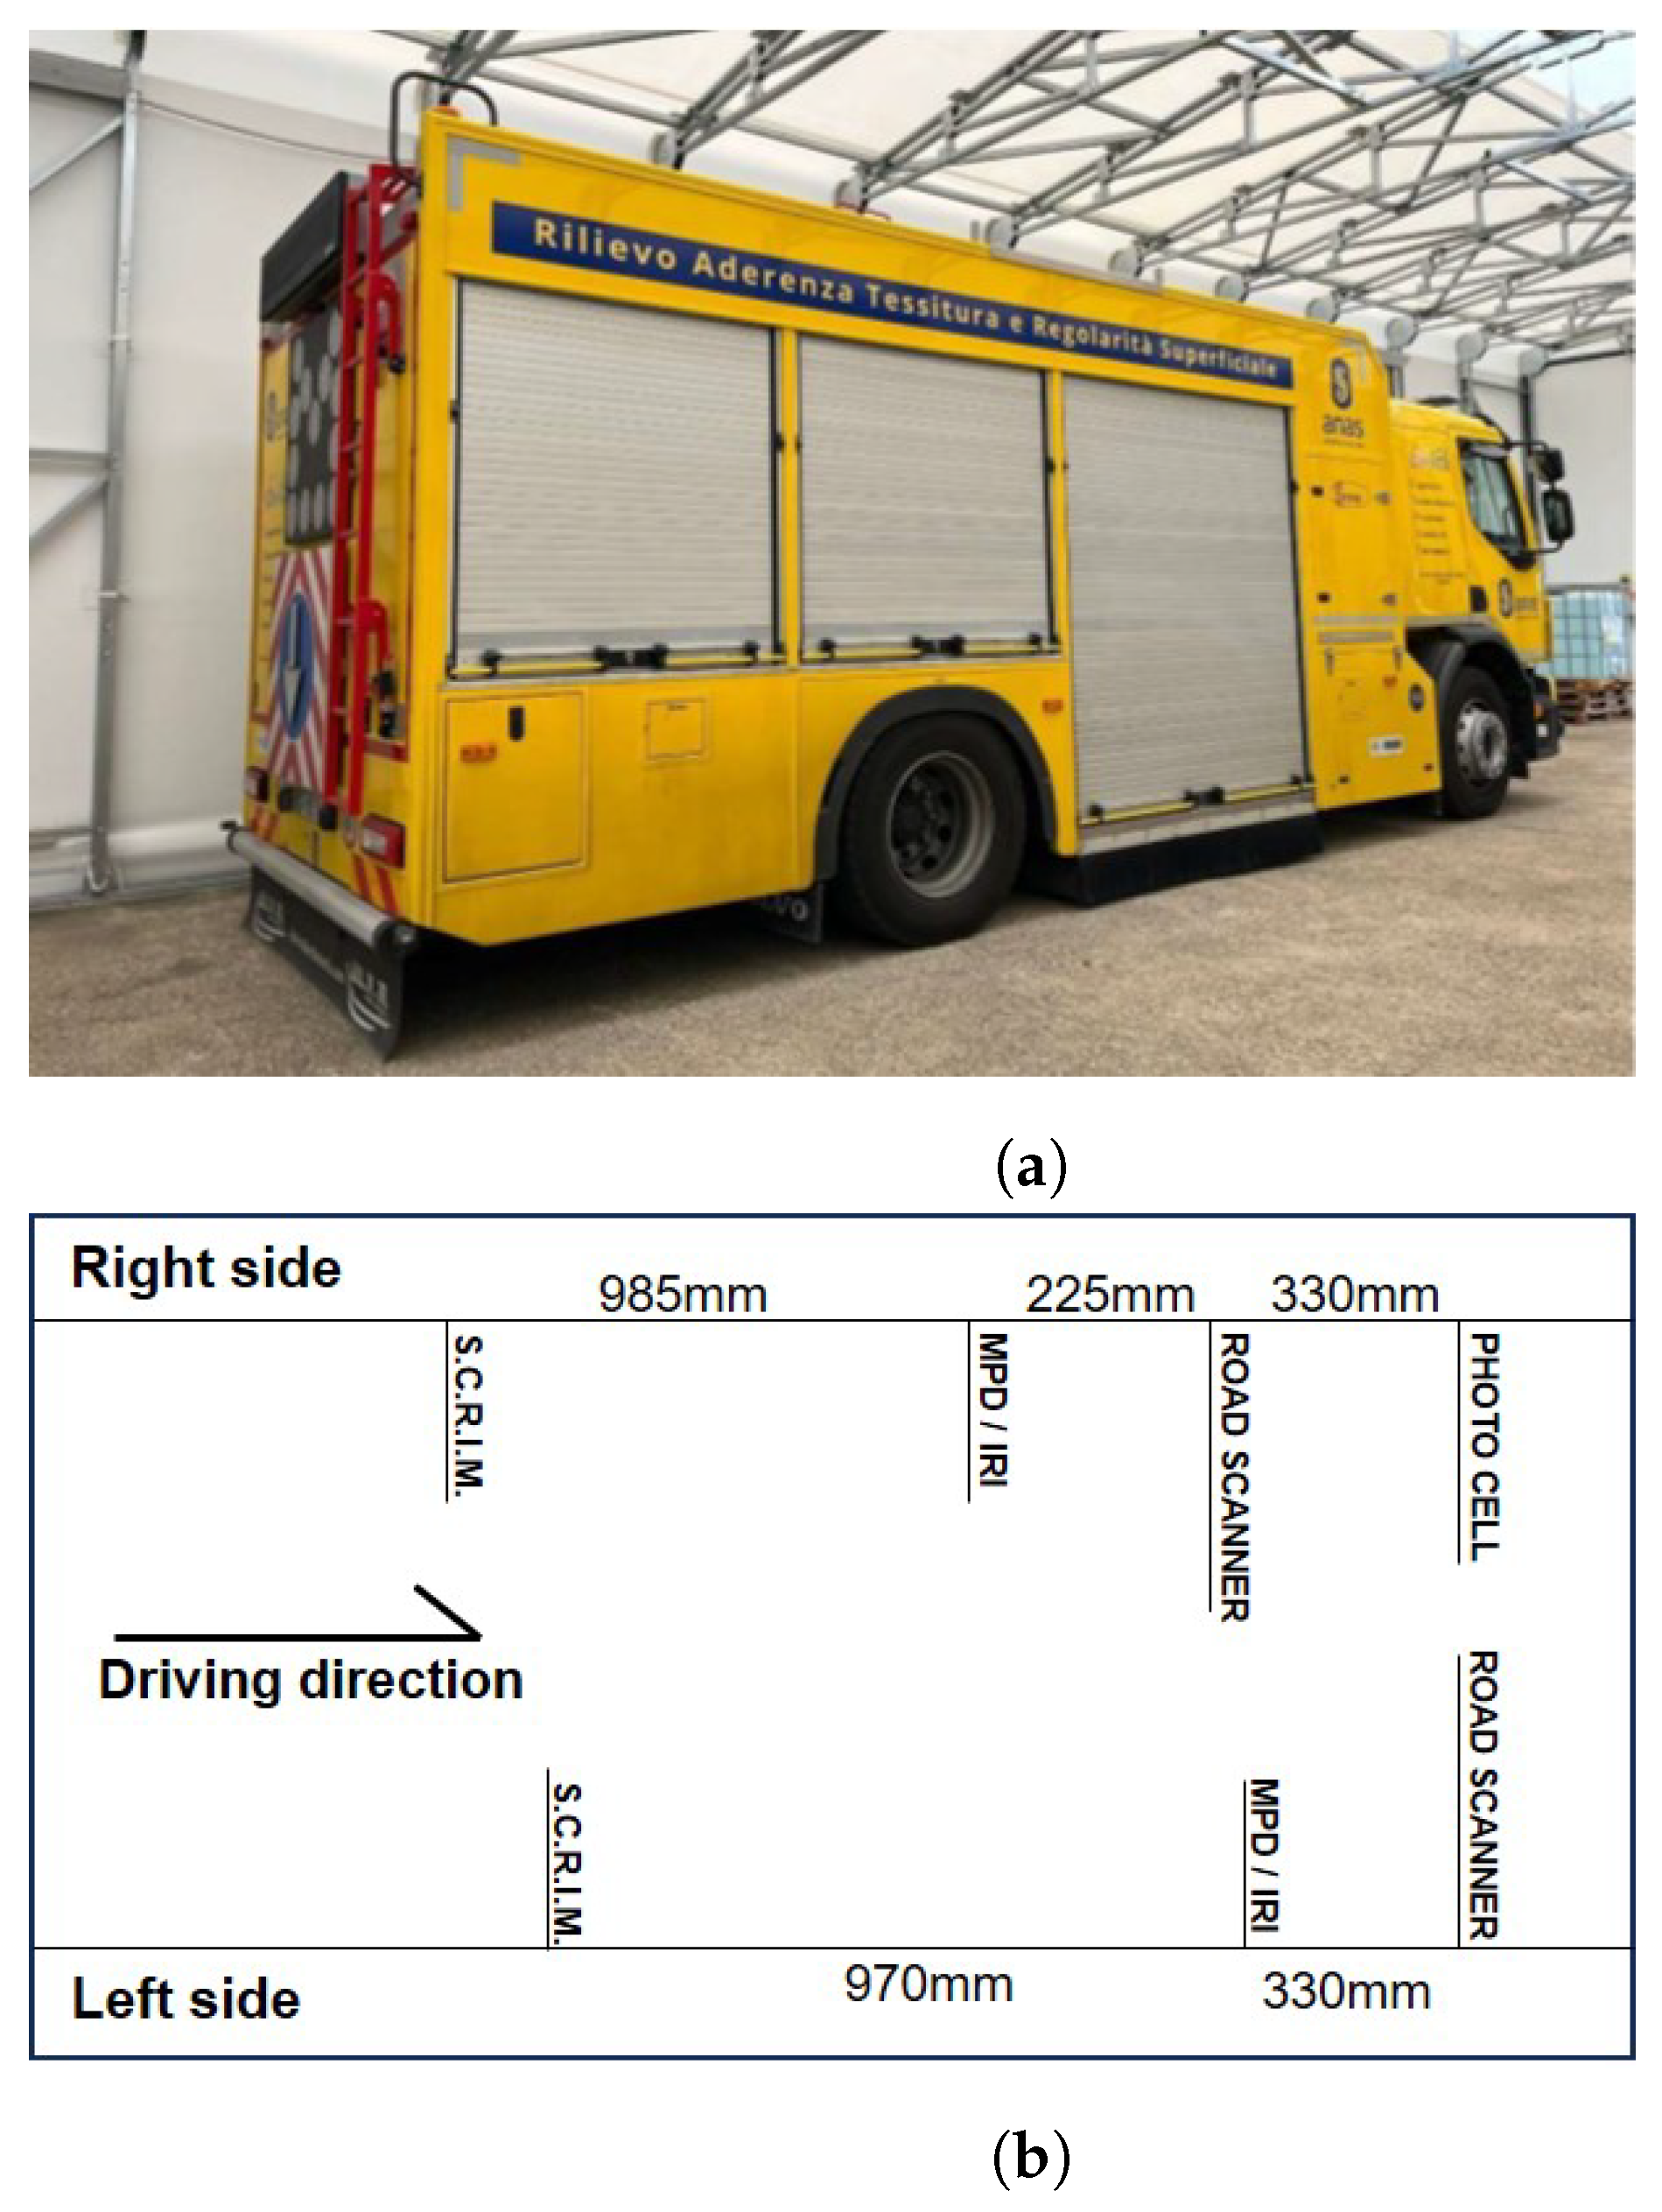
2.1. E.R.M.E.S. Instrument

According to the research aim of this study of characterize pavement surface texture and access pavement adhesion by using 3D laser technology. 3D point cloud data of pavement surface texture should be collected, and the adhesion data at the same detected surface should be acquired to conduct the verification. In the previous study, correlating the data from different detecting methods is very tedious [40]. In this study, we conduct the field test and data collection by using the E.R.M.E.S. (Figure 1a), a high-performance multifunctional equipment that allows to detection of multiple kinds of survey data relating to the surface characteristics of road pavements in a single pass. The E.R.M.E.S. is integrated by the Road Experimental Center of Anas S.p.A [45], who used it for routine evaluation of macrotexture, evenness, and skid resistance in approximately 32 thousand km of roads and motorways in Italy. As shown in Figure 1b. E.R.M.E.S. is equipped with two adhesion testers S.C.R.I.M, two sets of road scanners for 3D data collection, two sets of point laser units for MPD and IRI detection, and one photocell for 2D picture collection. In addition, a GNSS system is installed for position correction. All information is archived in a georeferential database with DGNSS (Differential global Navigation Satellite System) and kilo-metric progression.

2.2. S.C.R.I.M System for Pavement Adhesion Collection

S.C.R.I.M is a self-contained machine for the measurement of skid resistance under wet road conditions (Figure 2). The equipment is mounted on the E.R.M.E.S. truck, with a large capacity water tank. It is specifically designed to allow large lengths of road network to be continuously tested by the Road Experimental Center of Anas S.p.A. The test wheel is contained within a loading frame that is mounted mid-machine, between the front and rear axles of the truck. As shown in Figure 2a. It is capable of maintaining a constant test speed when conducting pavement adhesion measurements. Two S.C.R.I.M (Sideways-force Coefficient Routine Investigation Machine) systems are installed near the rear wheels of the E.R.M.E.S. vehicle (Figure 1b) to measure the adhesion coefficient of both wheel track paths independently in one drive. The S.C.R.I.M. device uses the sideway force principle to measure the skid resistance on both wheel paths: two freely rotating wheels, fitted with a smooth rubber tire, are mounted in line with the nearside wheel track and with a 20° slip angle to the travel direction of the vehicle. The width of the tire’s contact with the road surface is 154 mm. When the test vehicle moves forward along the road section, the test wheel is rotating, but slides in the forward direction due to the angular difference. The slip angle causes adhesion between the tire and the pavement. Following the Italian Guide Line—CNR Bulletin N. 147/1992 [46], the resulting force of the sideway force is recorded at the test speed of 50 km/h. In this study, the Transversal Adhesion Coefficient (CAT) to evaluate the pavement adhesion, which is expressed as the ratio between the tangential force normal to the plane of the wheel F t and the vertical load on the tire F n . Figure 2b describes the F t and F n collected. And the calculation of CAT is As shown in Equation (1).
CAT = F t F n
where F t is the tangential force normal to the plane of the wheel, F n is the vertical load on the tire, the adhesion coefficient CAT is expressed as the ratio between F t and F n . In general, The software inside the S.C.R.T.M. automatically returns the cat value every 10 m or 1 m. In this study, the purpose is to perform matching verification and correlation analysis between CAT values and texture index values. We parse out the original data and perform more intensive extraction and calculation of CAT to irrelevant specific differences in the pavement.

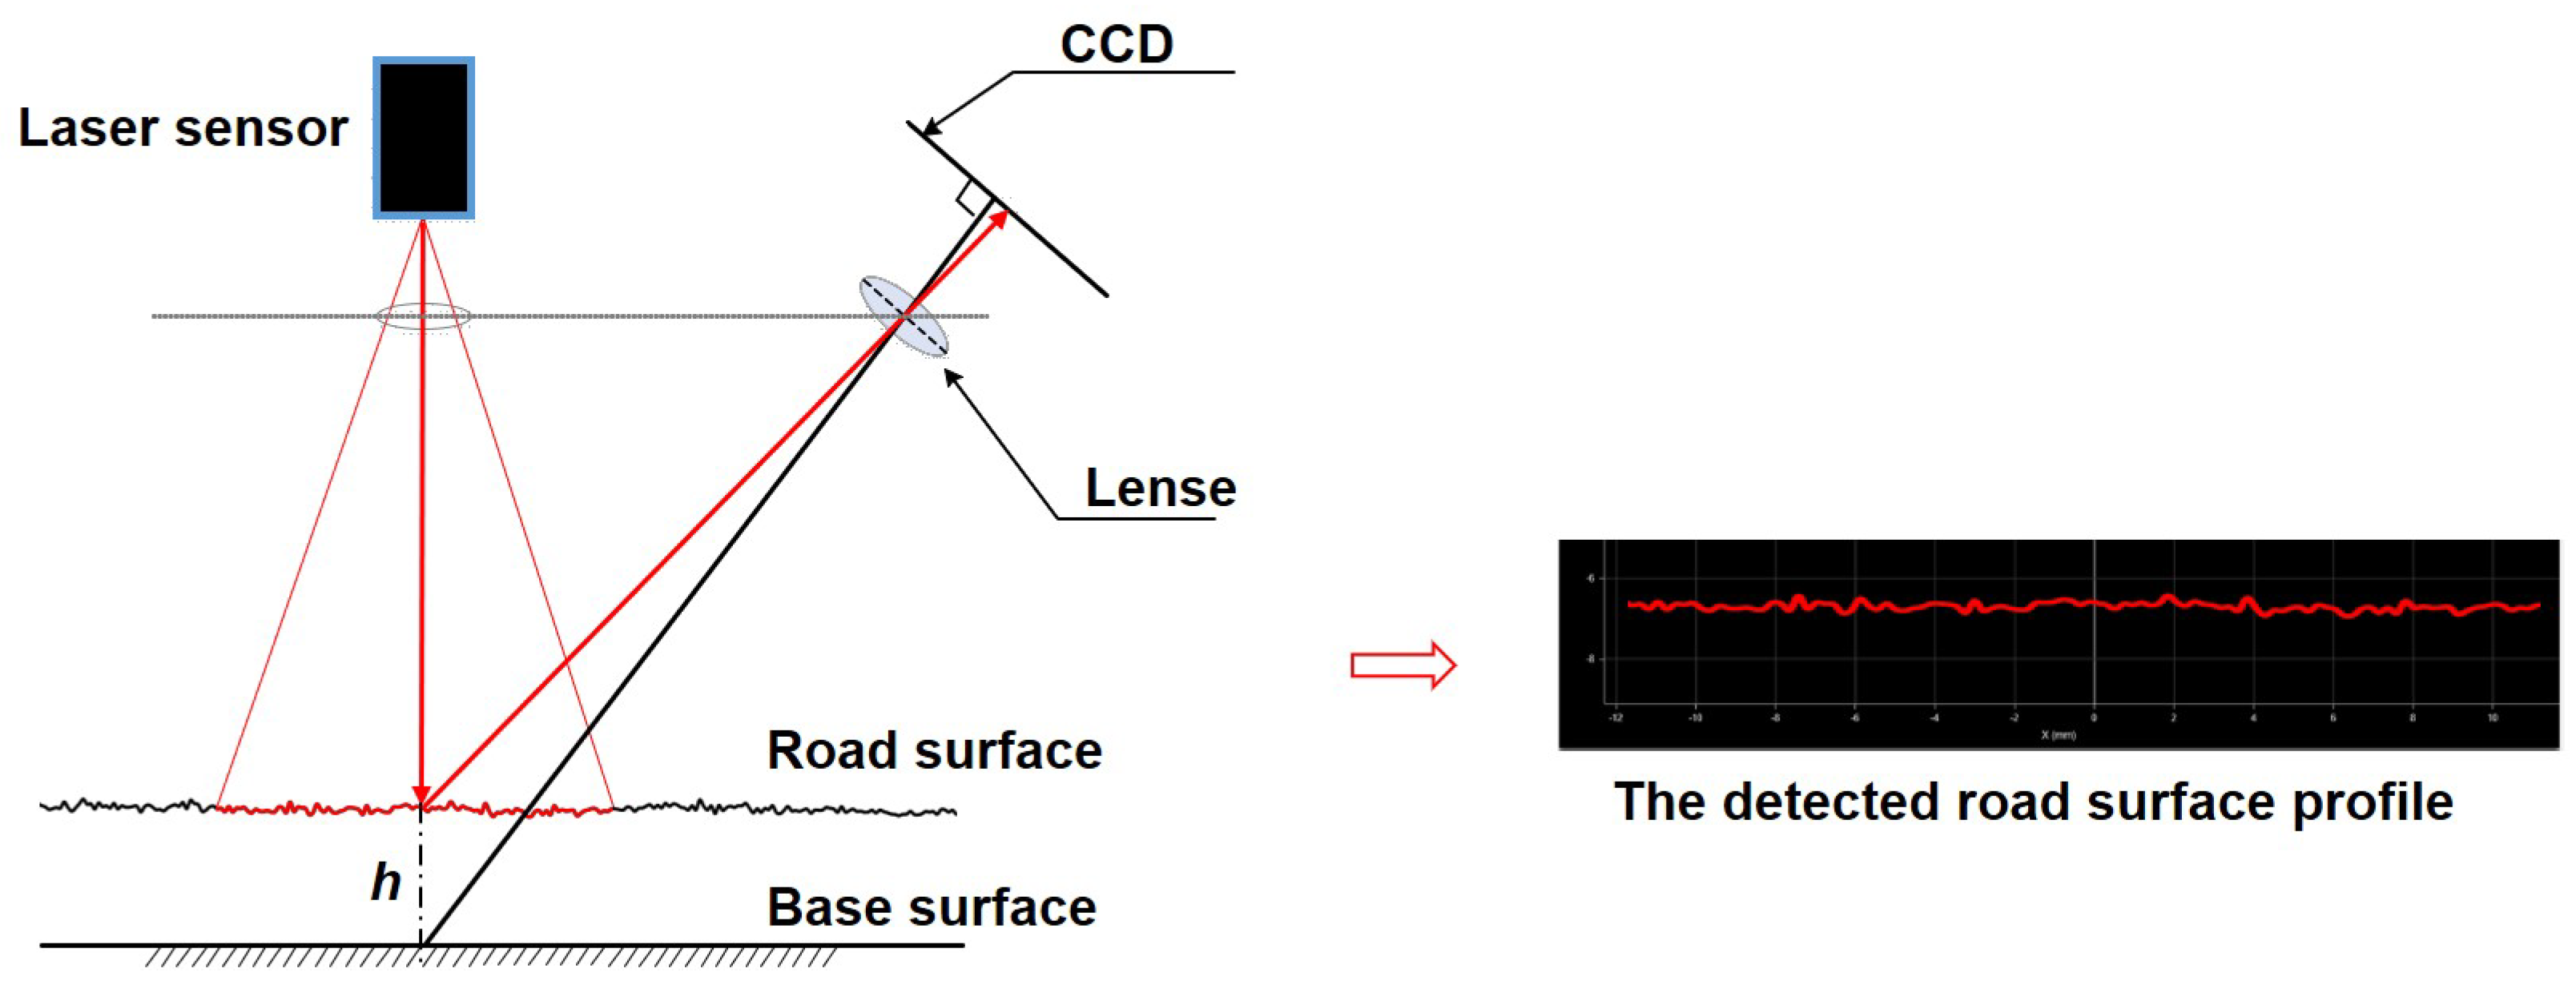
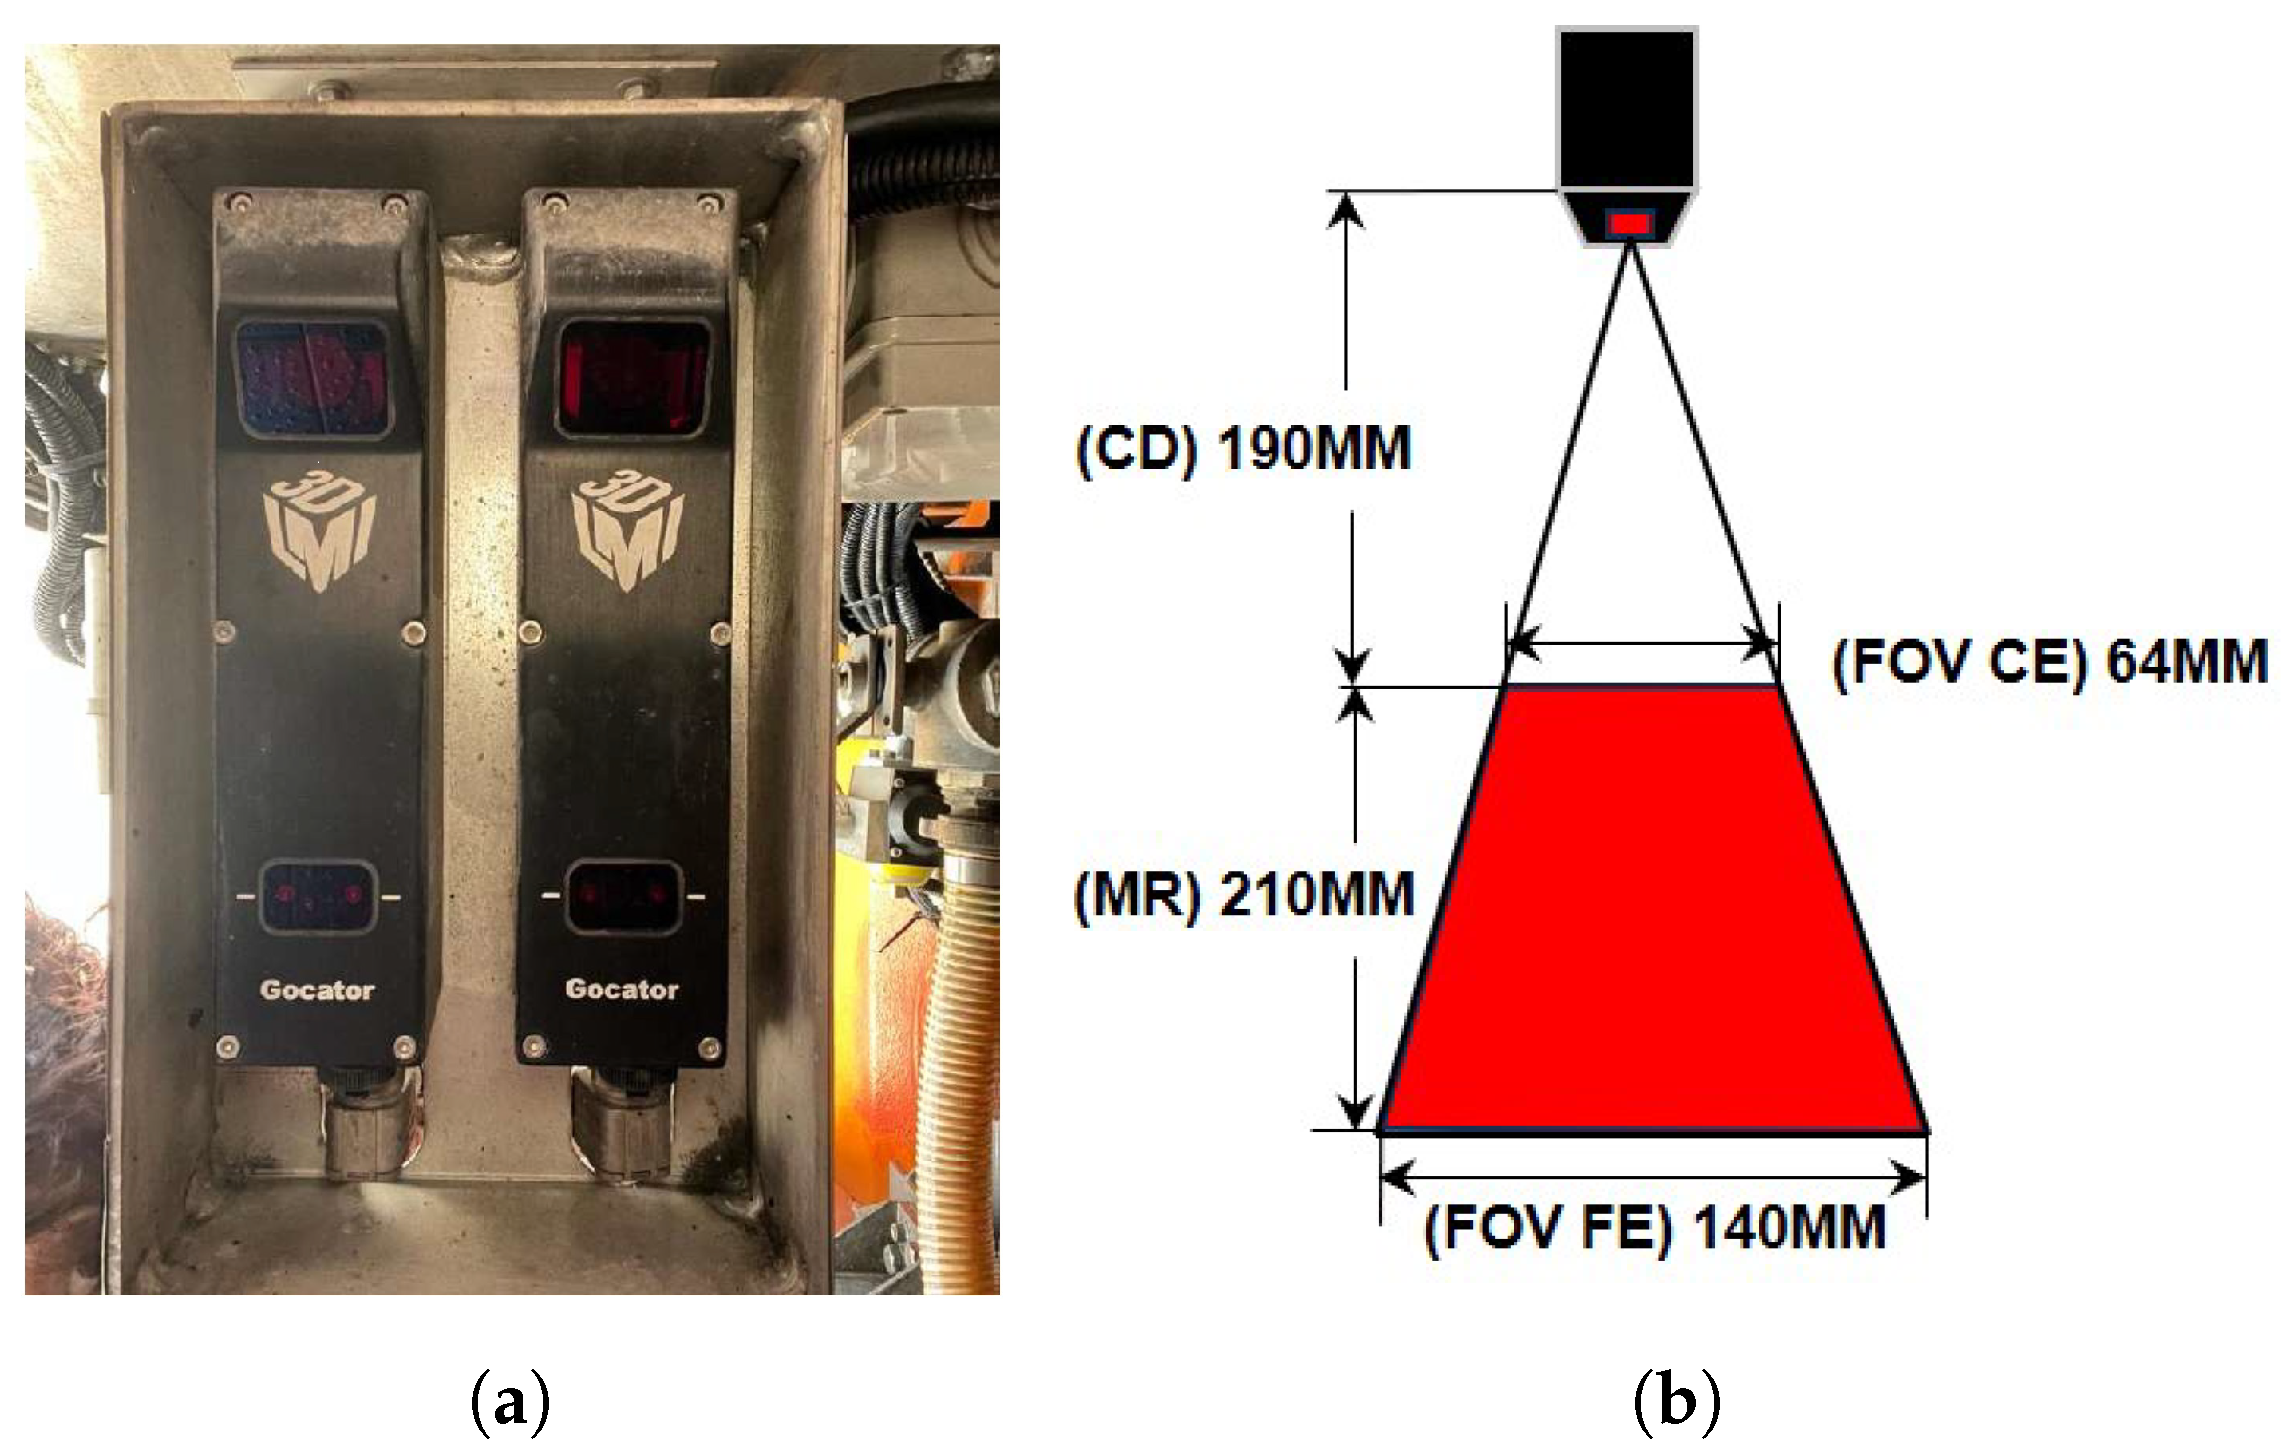
2.3. Road Scanner System for 3D Data Collection

3D laser scanners have been widely used to detect road surface characteristics in the recent decades. As shown in Figure 3, a 3D laser scanner emits a fan-shaped laser beam composed of many laser points onto the road surface at once. Based on the principle of triangulation, each laser point can capture the height between the scanned point on the road surface and the preset base surface by the CCD camera in the laser scanner. The captured height h (Figure 3) is recorded as the point cloud value of the scanned road surface point. A single scan can obtain a cross-sectional profile of the road surface, and the range of the obtained profile depends on the mounting height of the sensor and the number of laser points.
The Gocator series 3D laser sensors have been very popular in generating road detection systems in recent years for pavement 3D point cloud data collection. Incorporating the success of the RoLine technology, the Gocator 2342 delivers high-density road profile scanning for roughness measurement with superior ambient light handling. As explicated in Figure 4 and Table 1. The road scanner system is integrated with two Gocator 2342 sensors (Figure 4a). The sensor scans up to 5000 profiles in one second and generates 1280 3D points by one profile. The resolution in the X and Z directions is up to 0.095 mm and 0.015 mm, respectively. The field of view (FOV) is from 64 mm to 140 mm, the clearance distance (CD) is 190 mm, and the measurement range (MR) is 210 mm. The description of the FOV, MR, and CD is shown in Figure 4b. Based on these parameters, the number and positions of sensors can be carefully planned according to the experimental objectives to achieve a satisfactory detection range and accuracy.
In each road scanner system, two Gocator 2342 sensors are systematically assembled to control detection accuracy and detection range. The layout of Gocator 2342 sensors in the road scanner system is shown in Figure 5a. Two sensors are placed in one line at a height of 245 mm and a transverse distance of 70 mm to generate the 154 mm detecting field to accommodate the detecting field restricted by the tire-pavement contact area. Two road scanner systems are implemented near two front wheels of the E.R.M.E.S. vehicle (Figure 1b) to detect the 3D point cloud data corresponding to the wheel path area that will be detected by S.C.R.I.M. As shown in Figure 5b, Within each pair of sensors, the 3D point clouds acquired by two sensors are calibrated to each other to return a single union profile of those generated individually by the sensors themselves.

2.4. 3D Texture Data Collection and Processing

2.4.1. 3D Data Extraction and Pavement Reconstruction

Figure 6 shows the extraction details of 3D laser data and 3D reconstruction of the road pavement surface. With the sensor layout in this study, the resolution of the transverse direction (X) of the collected 3D data is fixed at 0.095 mm, and the resolution of detection depth (Z) is 0.015 mm. And by fixing the detecting speed to 50 km/h, The resolution in the longitudinal direction is 0.095 m (Figure 6a). Influenced by the detection environment, there are certain missing values and outliers in the raw 3D data, which need to be pre-processed. We removed the incorrect data by implementing an iterative closest point (ICP) algorithm. The iterative closest point (ICP) algorithm, originally proposed by Besl and McKay [47], is one of the most popular methods used for pre-processing 3D data sets [48]. We then put the processed 3D data into the Digital Surf [49] to reconstruct the 3D surface of the pavement texture surface, Figure 6b shows one of the reconstructed samples.

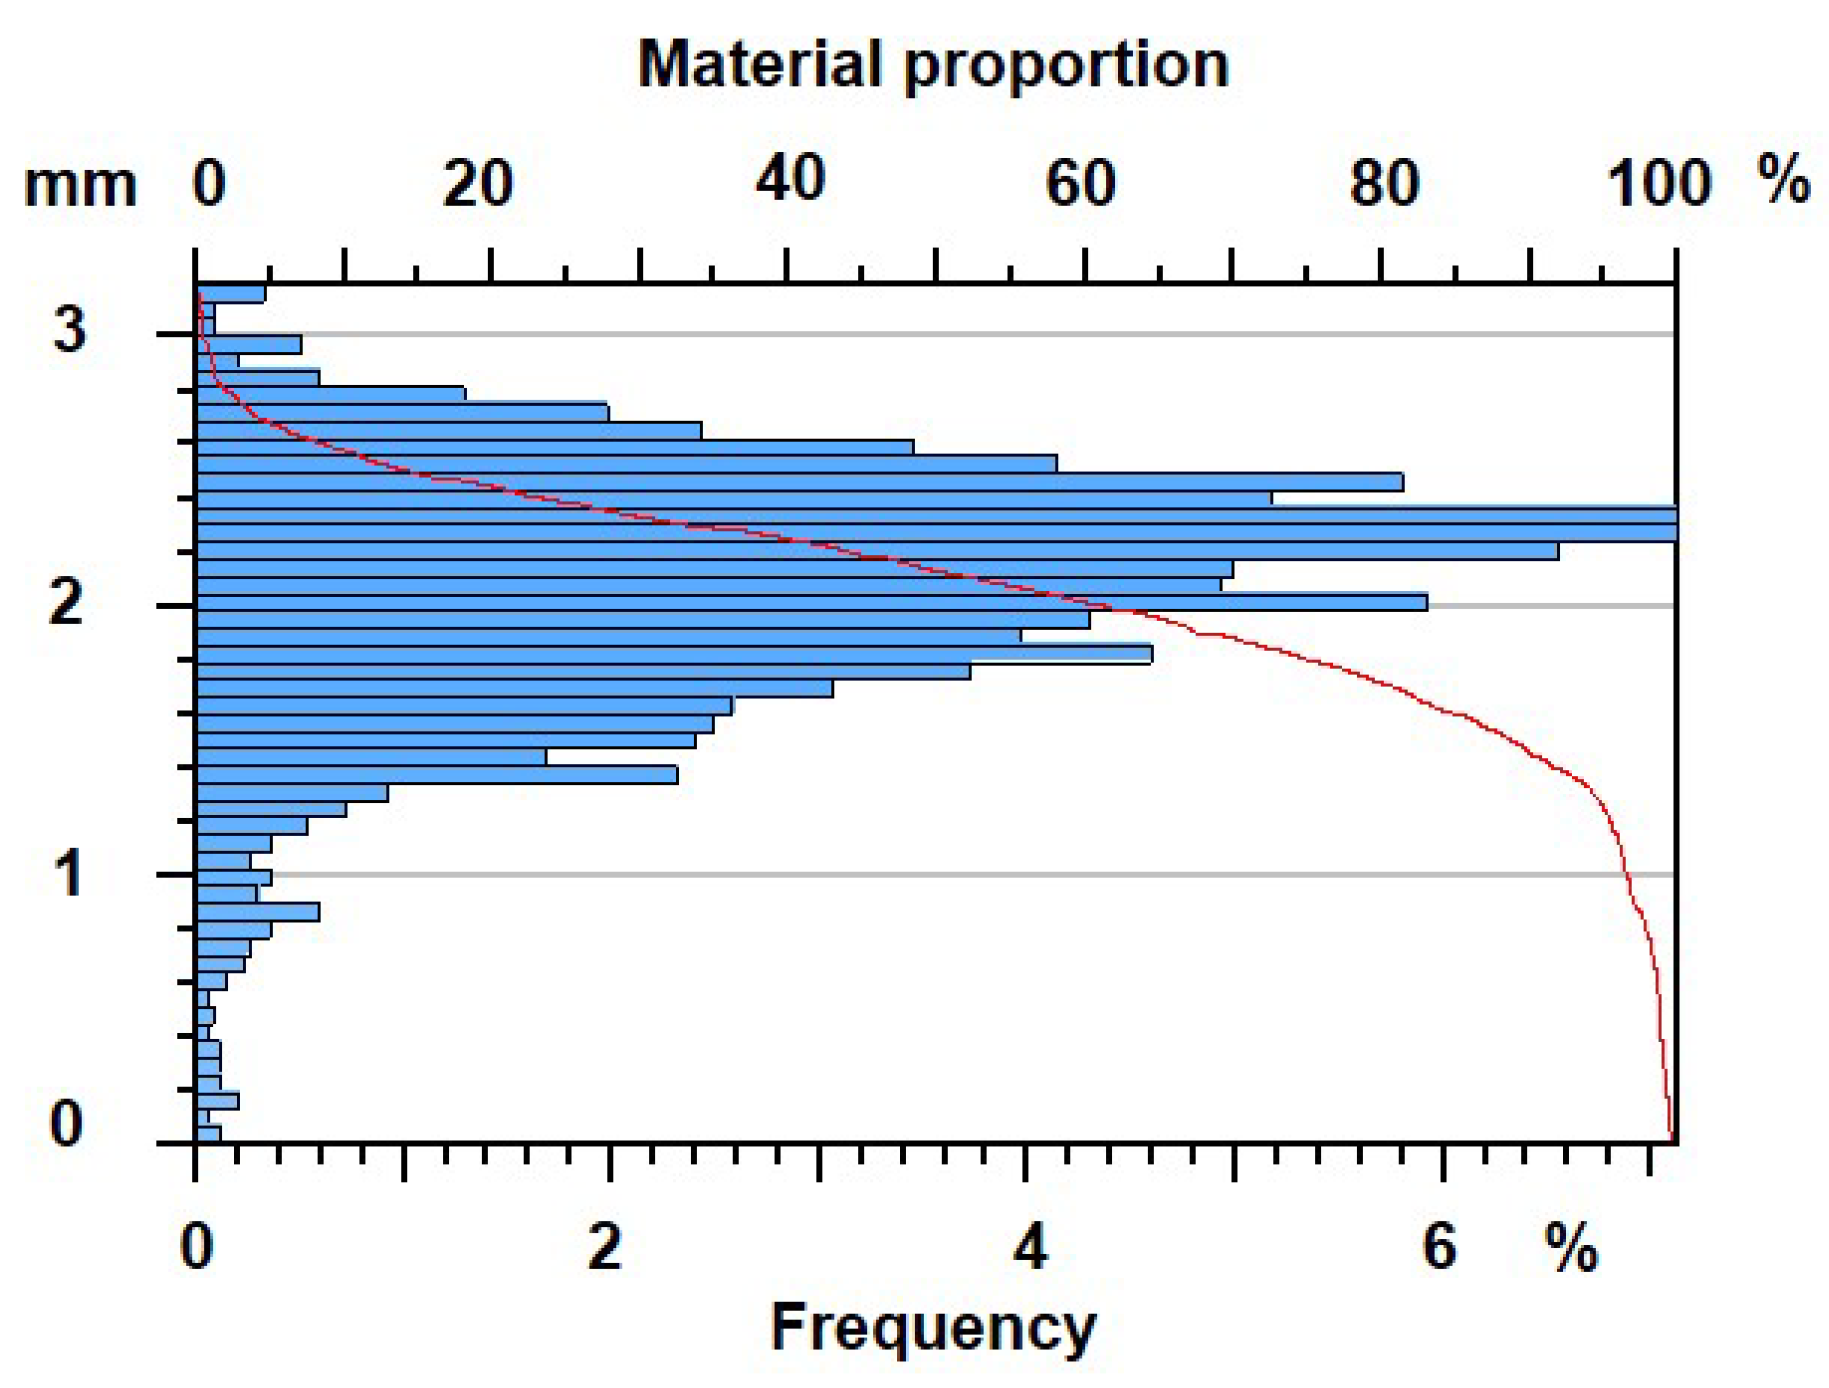
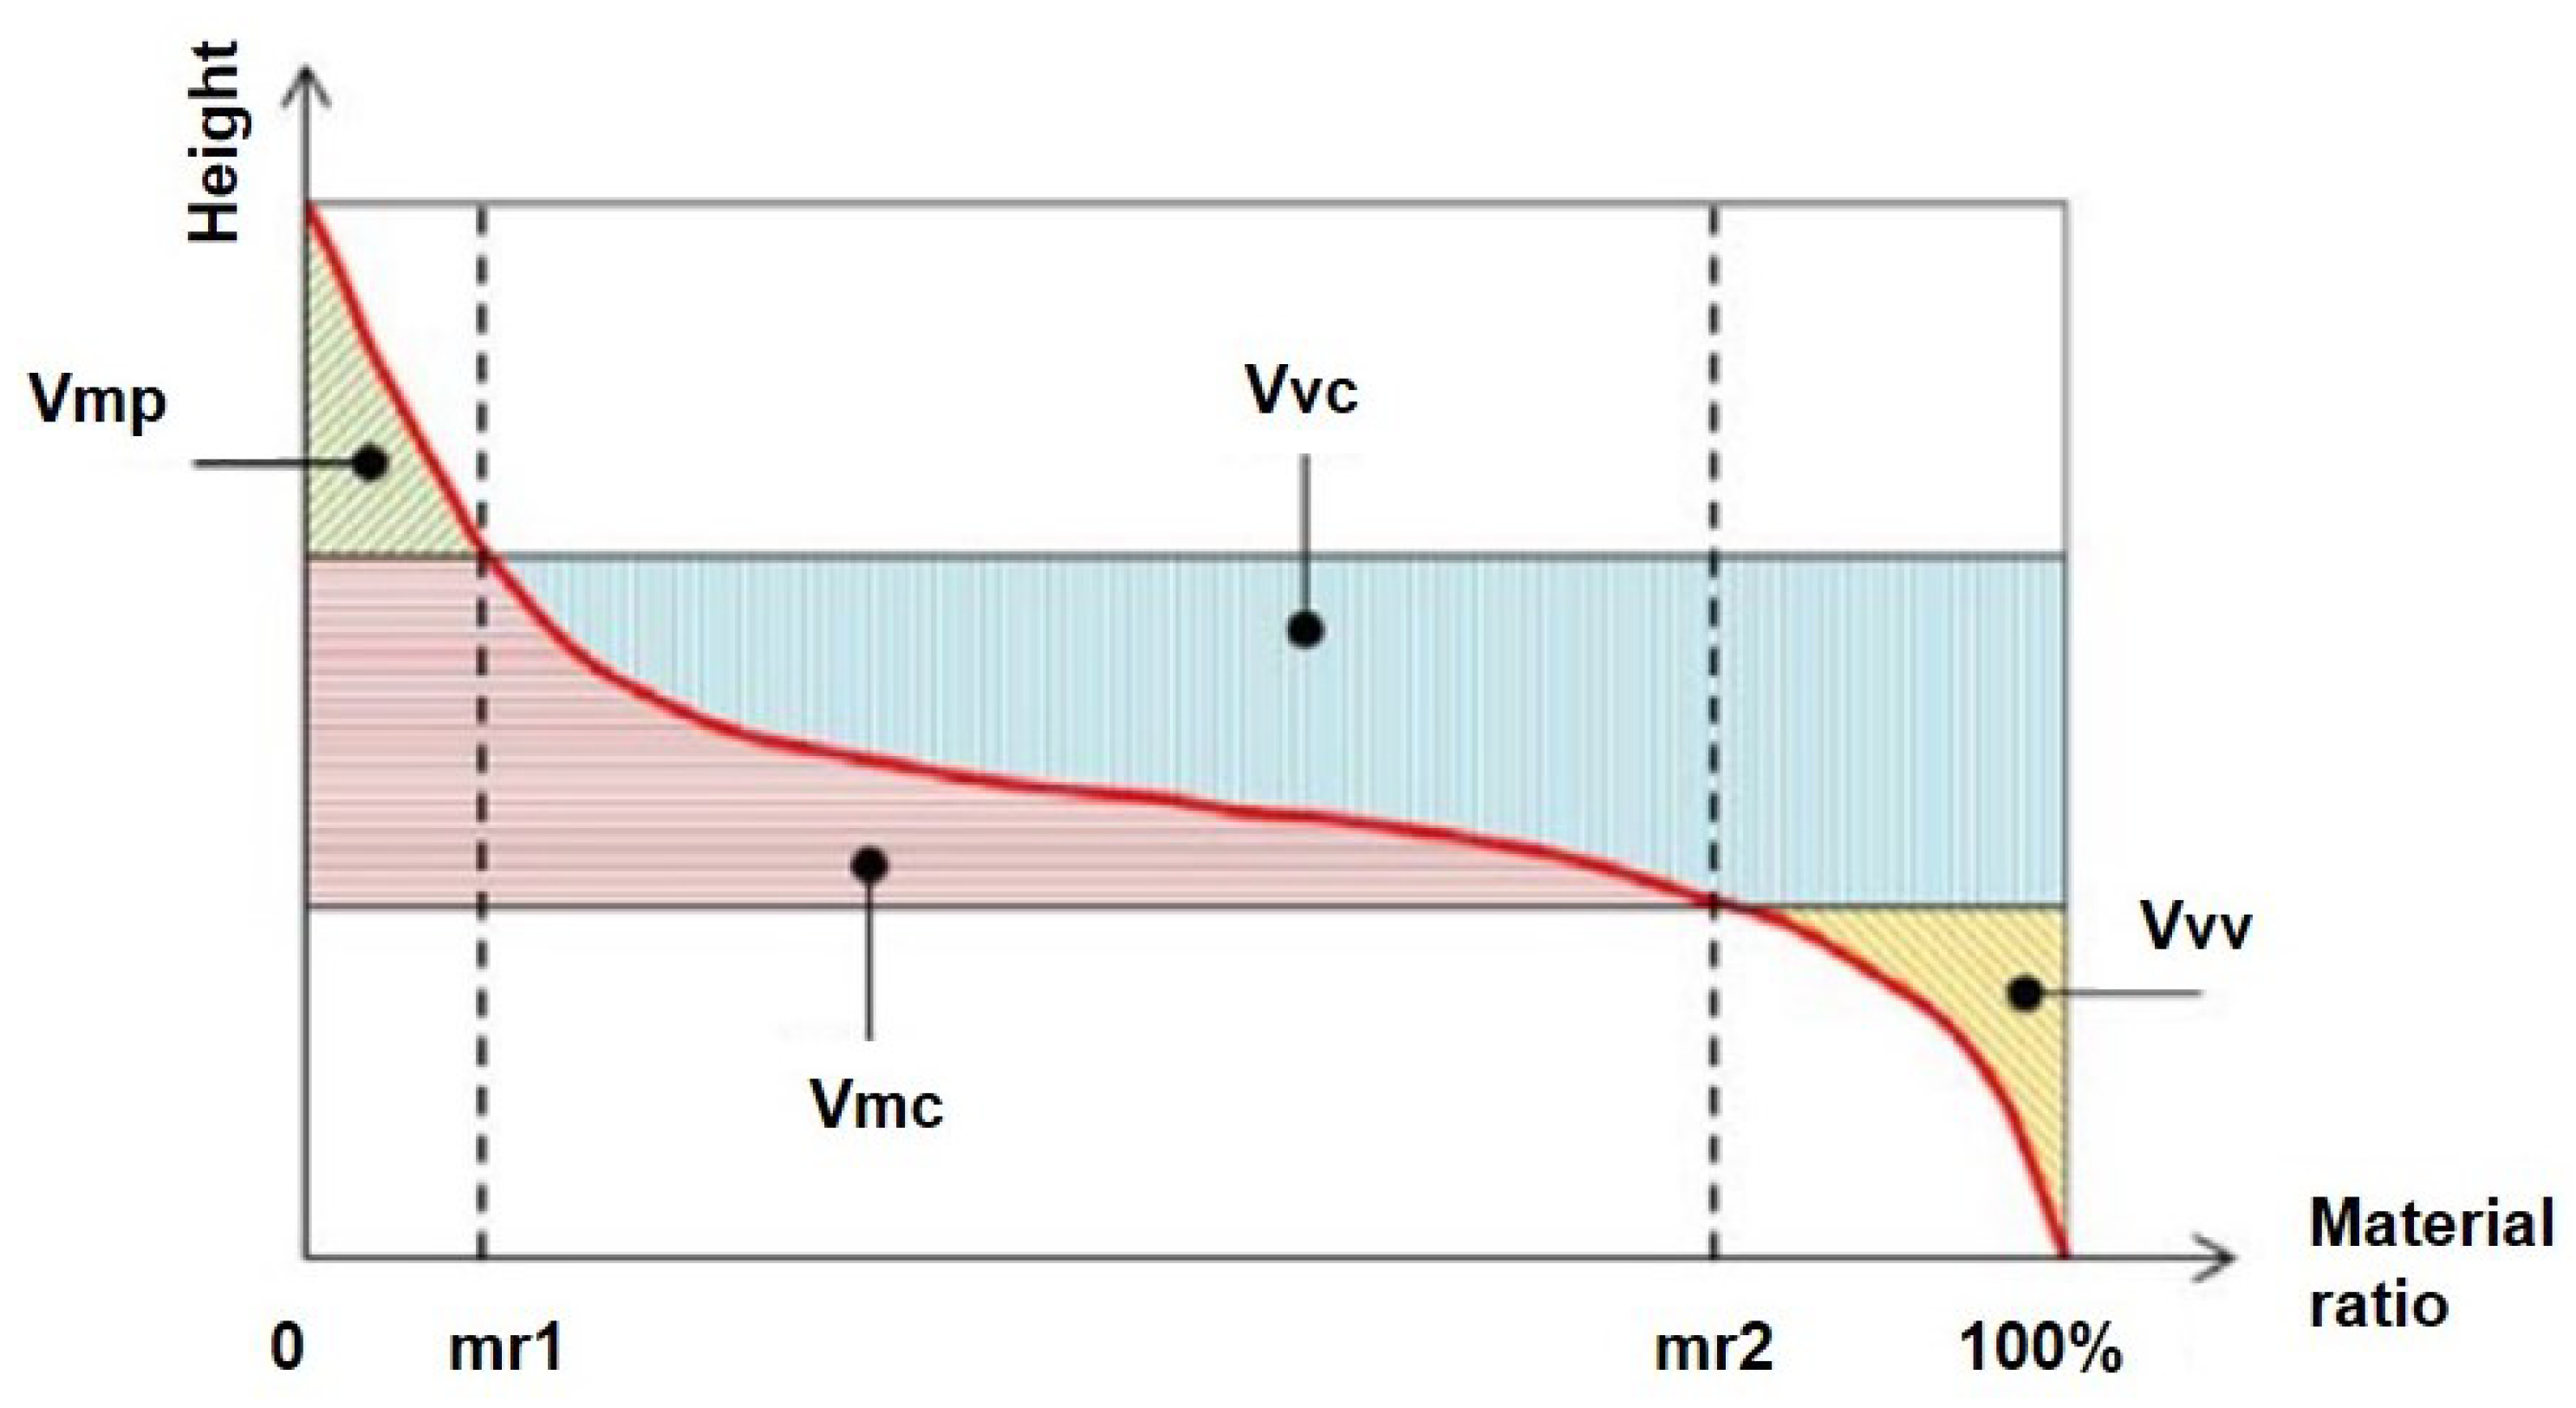
2.4.2. Volume Parameters for Characterizing 3D Road Surface

In order to comprehensively consider the three-dimensional properties of road pavement surface, we introduce the function-related volume parameters to characterize the pavement surface texture. The function-related volume parameters [50], including the peak material volume ( V m p ), the core material volume ( V m c ), the core void volume ( V v c ), and the dales void volume ( V v v ), can characterize wear and rolling properties during a running-in procedure, they are suitable for evaluating the road pavement surface texture evolution.
The material ratio ( m r ), as shown in Equation (2) and Figure 7, is the ratio, in percentage, of the length of the bearing surface at any specified depth cutting by a horizontal plane in a profile [51]. m r simulates surface wear of a 3D pavement surface that provides a bearing surface for vehicle tires. The value of the material ratio depends on the position of the cutting plane. The deeper the cutting plane position, the larger the mr, indicating consideration of a larger volume of material for engaging in contact with the road tire. As the cutting plane moves down from the highest peak to the lowest valley of a profile, the material ratio will increase along with the bearing surface and range up to 100%.
m r = 100 % d 1 + d 2 + + d n D
where d 1 , d 2 , and d n were the 1st, 2nd, and the n-th intersection lengths of the profile cut by the cutting plane. D is the total length of the road surface profile.
As specified in UNI ISO EN 25178:2 [51], each surface can be characterized by a curve that represents the heights at which the areal material ratio changes from 0% to 100%, i.e., the “areal material ratio curve”. Another curve is important in the analysis of 3D surfaces and is the “height density curve”, i.e., the curve that represents the density of the points lying on the surface. Specifically. As shown in Figure 8, a single curve can be formed to have information on both the areal material ratio curve and height density curve, which is the cumulative height curve. The curve is formed by the accumulated material distribution at different heights, which shows the ratio of the material as a function of the height. Material ratio is the percentage of surface area above a given height. The cumulative height curve makes it possible to visualize in a real way the distribution of the heights of the peaks (peaks) and valleys (valleys) in the profile. The cumulative height curve is the most appropriate tool to analyze the 3D functional characteristics of a surface as numerous researches show [44].
The description of functional volume parameters is shown in Figure 9. Volume parameters divide the surface texture into peak, core, and valley based on the area material ratio curve. The m r 1 and m r 2 are specified as thresholds of the accumulated height to define the peak and void of a surface texture [51]. V v c ( V m c ) is the difference between two void (material) volume values calculated at different heights corresponding to m r 1 ( m r 2 ), and V m p ( V v v ) is the material (void) volume calculated at the height corresponding to m r 1 ( m r 2 ). In this way, the V m p can be understood as the volume of material that interacts with the tire and represents the material volume that is most likely to be removed by traffic polish. Therefore, we use the V m p as the evaluation metric to characterize the pavement 3D texture. The calculation of V m p is as shown in Equation (3). And we use the material ratios, 10%, and 80%, to determine m r 1 and m r 2 to define surface peak and valley.
V m p = V m ( 10 % )
where, V m for a material ratio is calculated by integrating the volume enclosed above the 3D texture image and below the horizontal cutting plane at the height corresponding to m r . For example, a V m (10%) = 0.33 µm3/µm2 would indicate (note how the units µm3/µm2 reduce to µm) that a layer 0.45 µm thick of material over the measured cross section would account for all the material from the highest peak to the 10% point on the bearing area curve.
The analysis and calculation of volume parameters are based on the Mountains Map, which is a software used to analyze various types of surface topography and calculate volume parameters [51]. The Mountains Map has been successfully used in marine, industrial, noise analysis, and other fields [49]. The calculated V m p and C A T are analyzed in correlation to further evaluate the road adhesion performance.

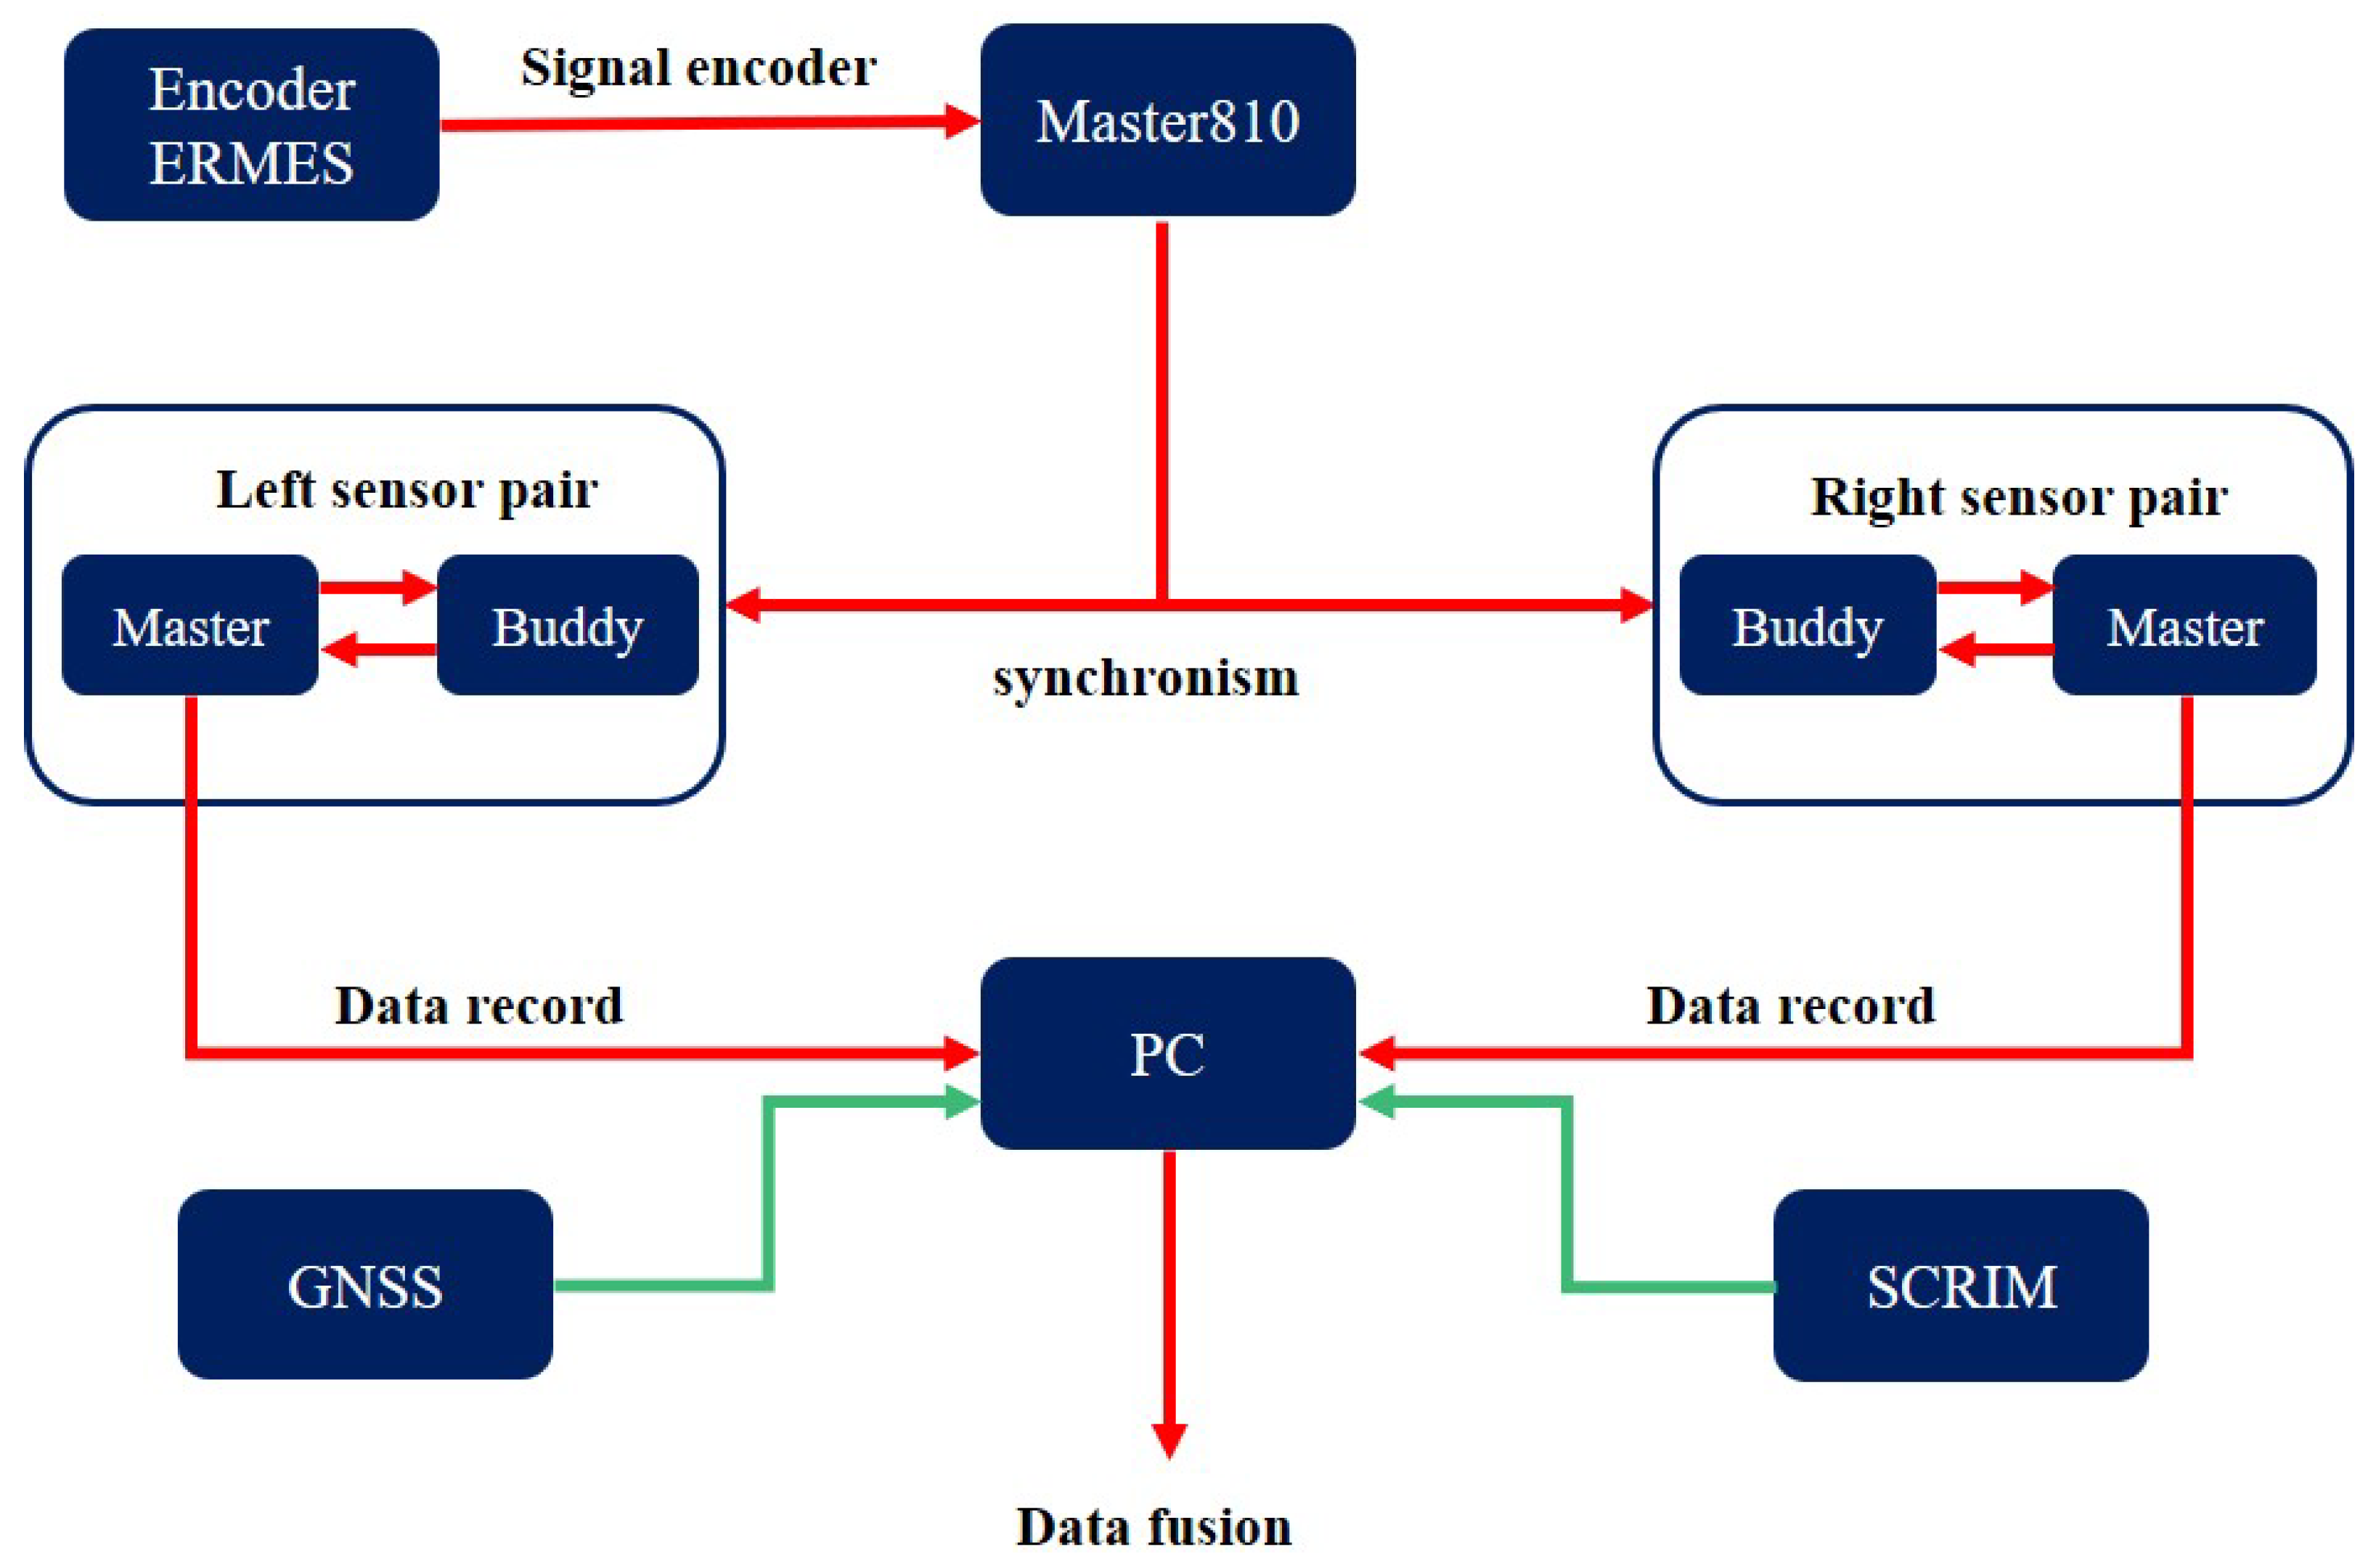
2.5. Data Transmit and Fusion of E.R.M.E.S System

The information obtained during the surveys with the E.R.M.E.S. are transmitted together with a PC which allows the data to be reprocessed. During the detection, the information is immediately recorded in the form of a binary file. With the help of the software Ravcon 7.1, also called “Road Assessment Vehicle Data Converter”, we split each piece of information in the form of different ASCII files, each of which returns information about different geometric parameters such as the CAT, other ASCII files allow it to identify information about GNSS coordinates or information about the temperature at which the measurements of the quantities in the survey took place. Figure 10 shows the flow chart of data transmission and fusion of the E.R.M.E.S system. The data acquired by the lasers are recorded on a PC, which receives the data from the laser profilers and in turn are synchronized by an encoder signal. The GNSS coordinates the point cloud with the CAT measurements.

3. Experiments and Results

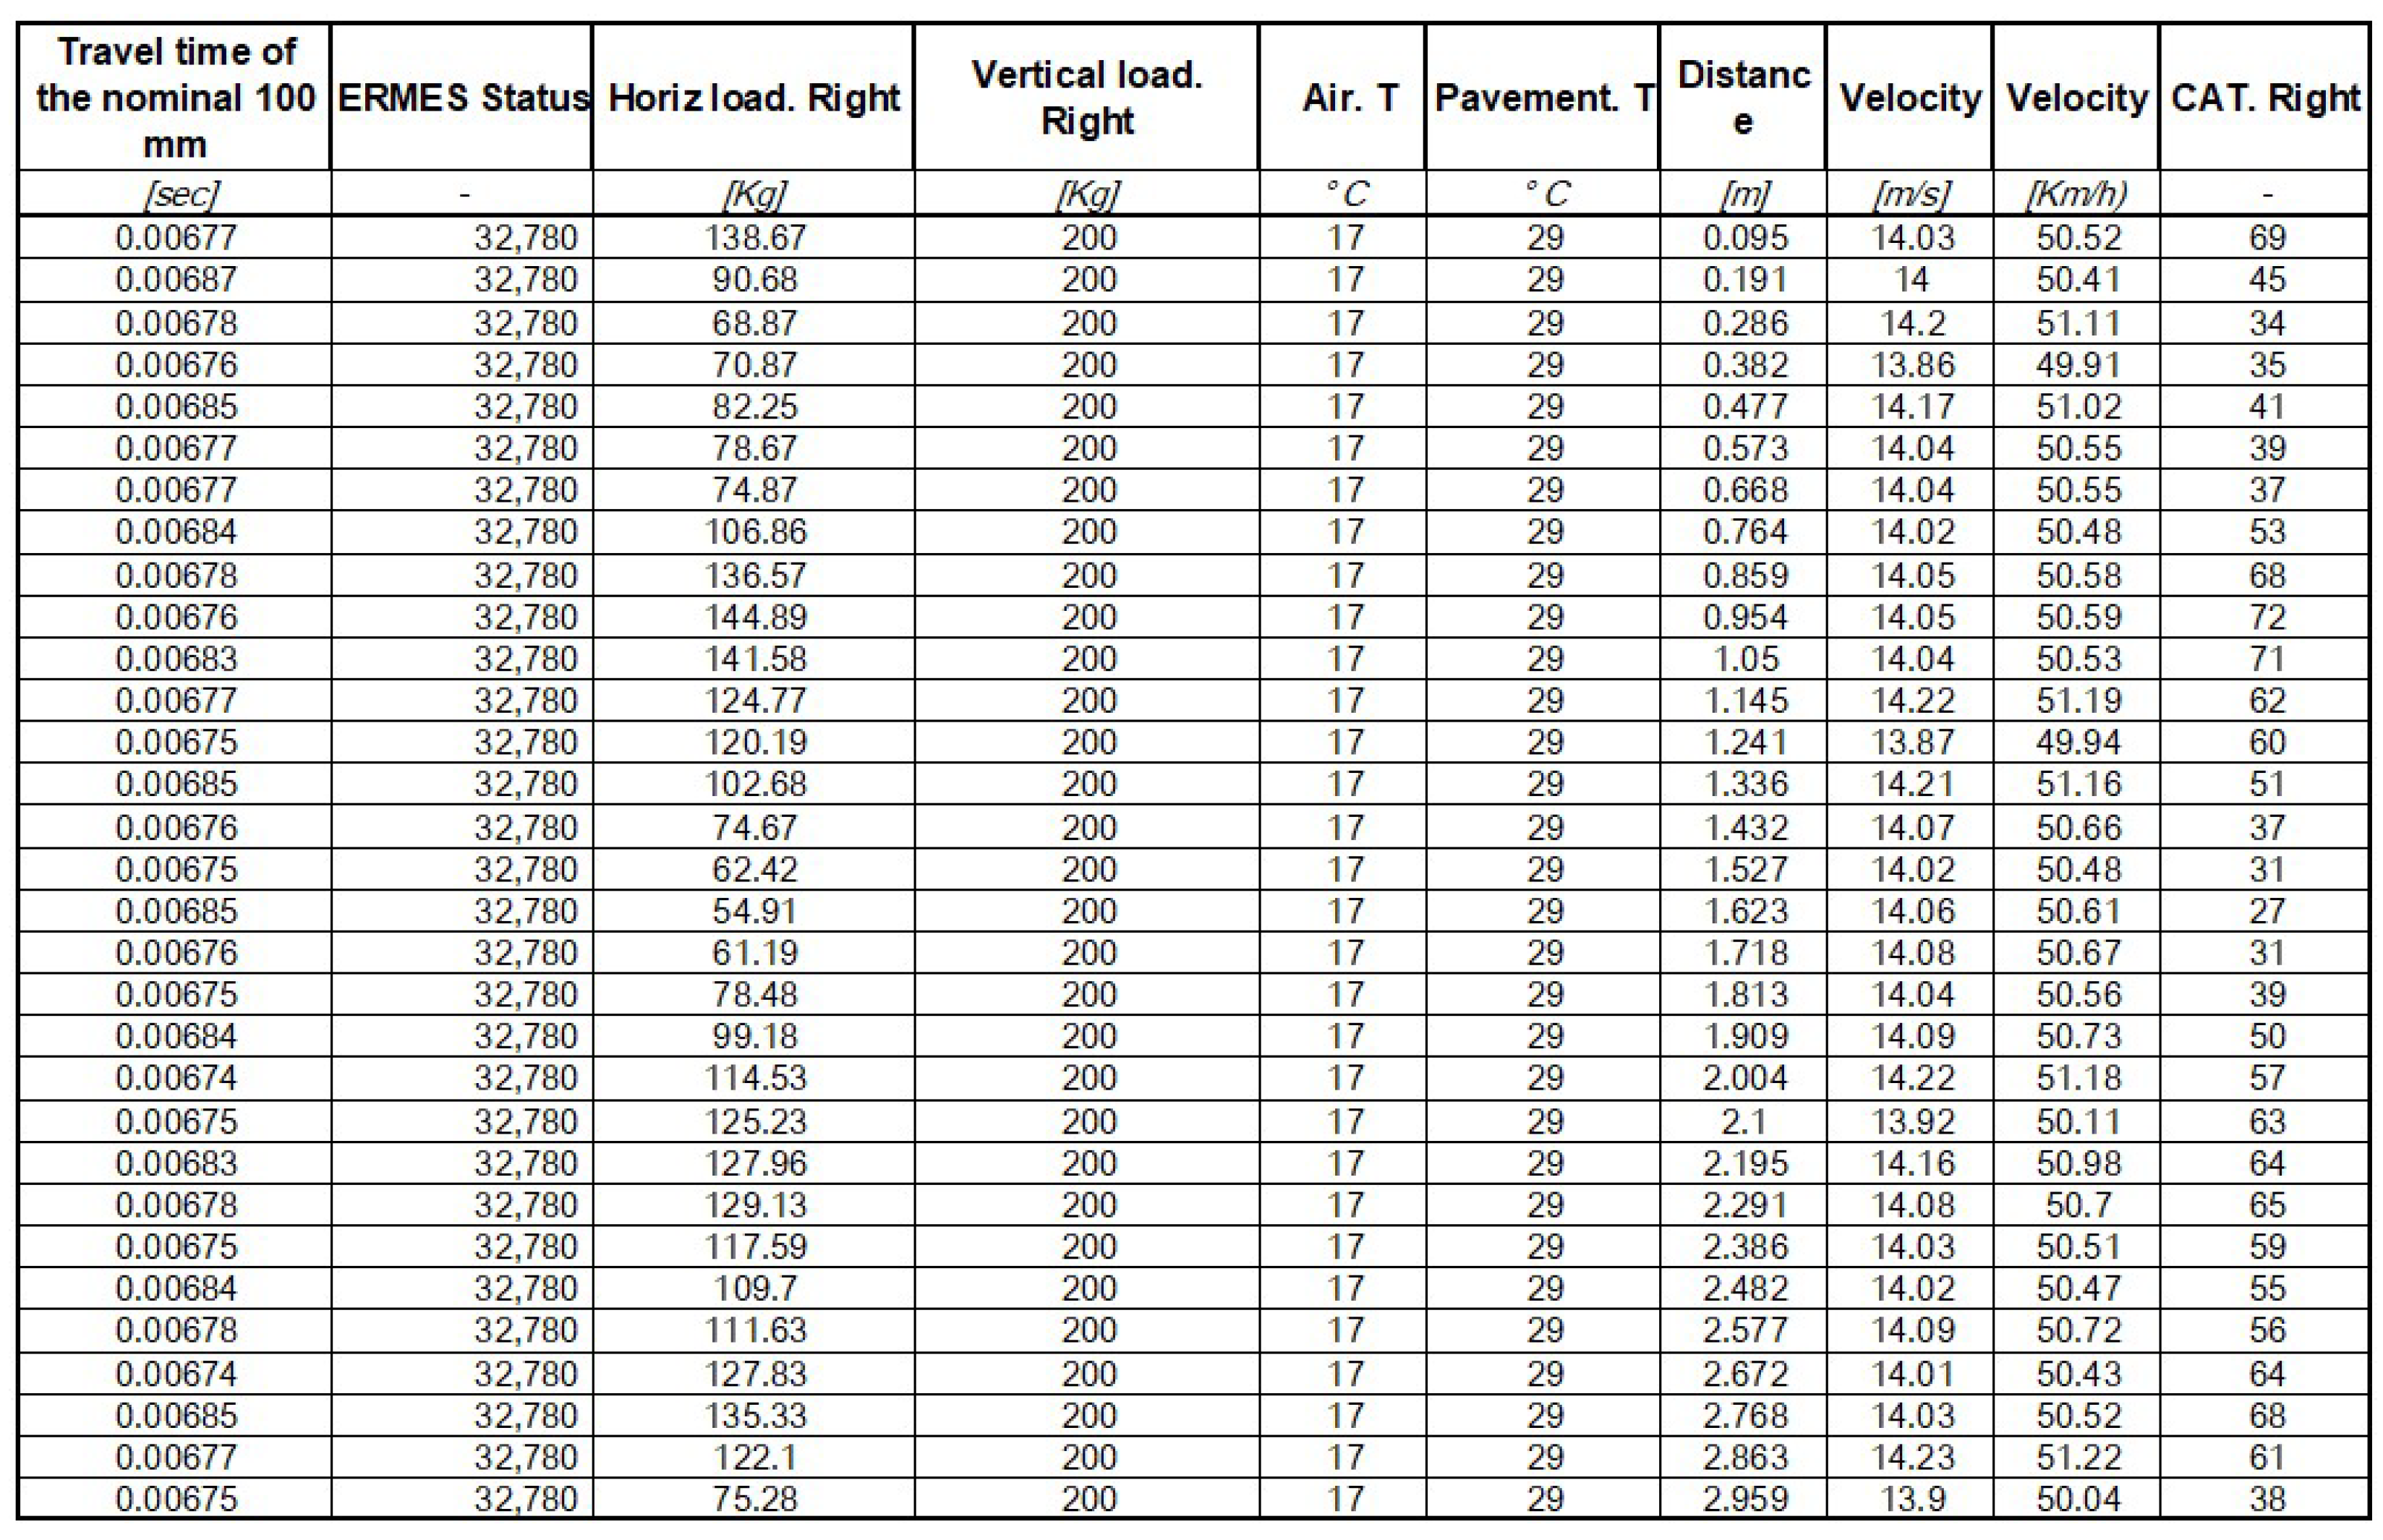
3.1. Field Experiments

The field experiments in this paper were carried out on a test road constructed by ANAS, using the E.R.M.E.S vehicle. The experiment sketch is shown in Figure 11, the test asphalt pavement is over 2 km and is divided into a series of 20-m investigation segments. Each segment contains two barycenters that contact with the S.C.R.I.M tires. Considering that the wheel track zone is frequently subjected to complex vehicle loads, and the changes in texture topography are more obvious than in other areas of the road surface thus facilitating investigation, the barycenters are located in the wheel track zone. 3D laser data and the pavement adhesion data of each segment are collected in the same run. All the data investigated in this study is from the investigation area, which is one of the segments (Figure 11). In this segment, a total of 1600 samples are collected in the wheel track zone. Consider the scanning properties of the 3D laser and the contact area between the road and the tire. All the samples are in the size of 154 mm × 95 mm. The 154 mm matches the S.C.R.I.M tire width, and the 95 mm is the distance of two adjacent laser profiles. The C A T and V m p of each sample are calculated to conduct the surface texture analysis for pavement adhesion.
Traditional pavement adhesion evaluations directly apply the CAT values automatically calculated by the SCRIM system (returns one CAT value per 10 m) to assess the pavement, disregarding many surface texture details. Additionally, it is challenging to correlate with pavement texture indicators as the volume parameter V m p is only calculated in every 95 mm. In this study, to carry out a homogeneous comparison with 3D laser data, the CAT value returned by the instrument calculated as an average over 10 m was not used for the comparison, but rather the raw values detected every 95 mm were extracted. The calculation details are as shown in Figure 12.

3.2. Results

3.2.1. Trend of CAT

In order to initially evaluate the representativeness of the adhesion performance of the asphalt pavement texture in the investigation area, the trend of the CAT values of the wheel tracks was analyzed. Figure 13 shows the trend of CAT values of the left and right wheel tracks. It can be seen from the figure that the value of CAT changes with the change of the test position, which directly indicates that the pavement adhesion performance is different at different positions along the wheel track in the investigation area. And further shows that, under the effects of vehicle load and the external environment during use. The pavement texture in the wheel track has changed from a uniform state when it was newly built to a heterogeneous state, which is more conducive to the study of the impact of texture changes on pavement adhesion in this paper.

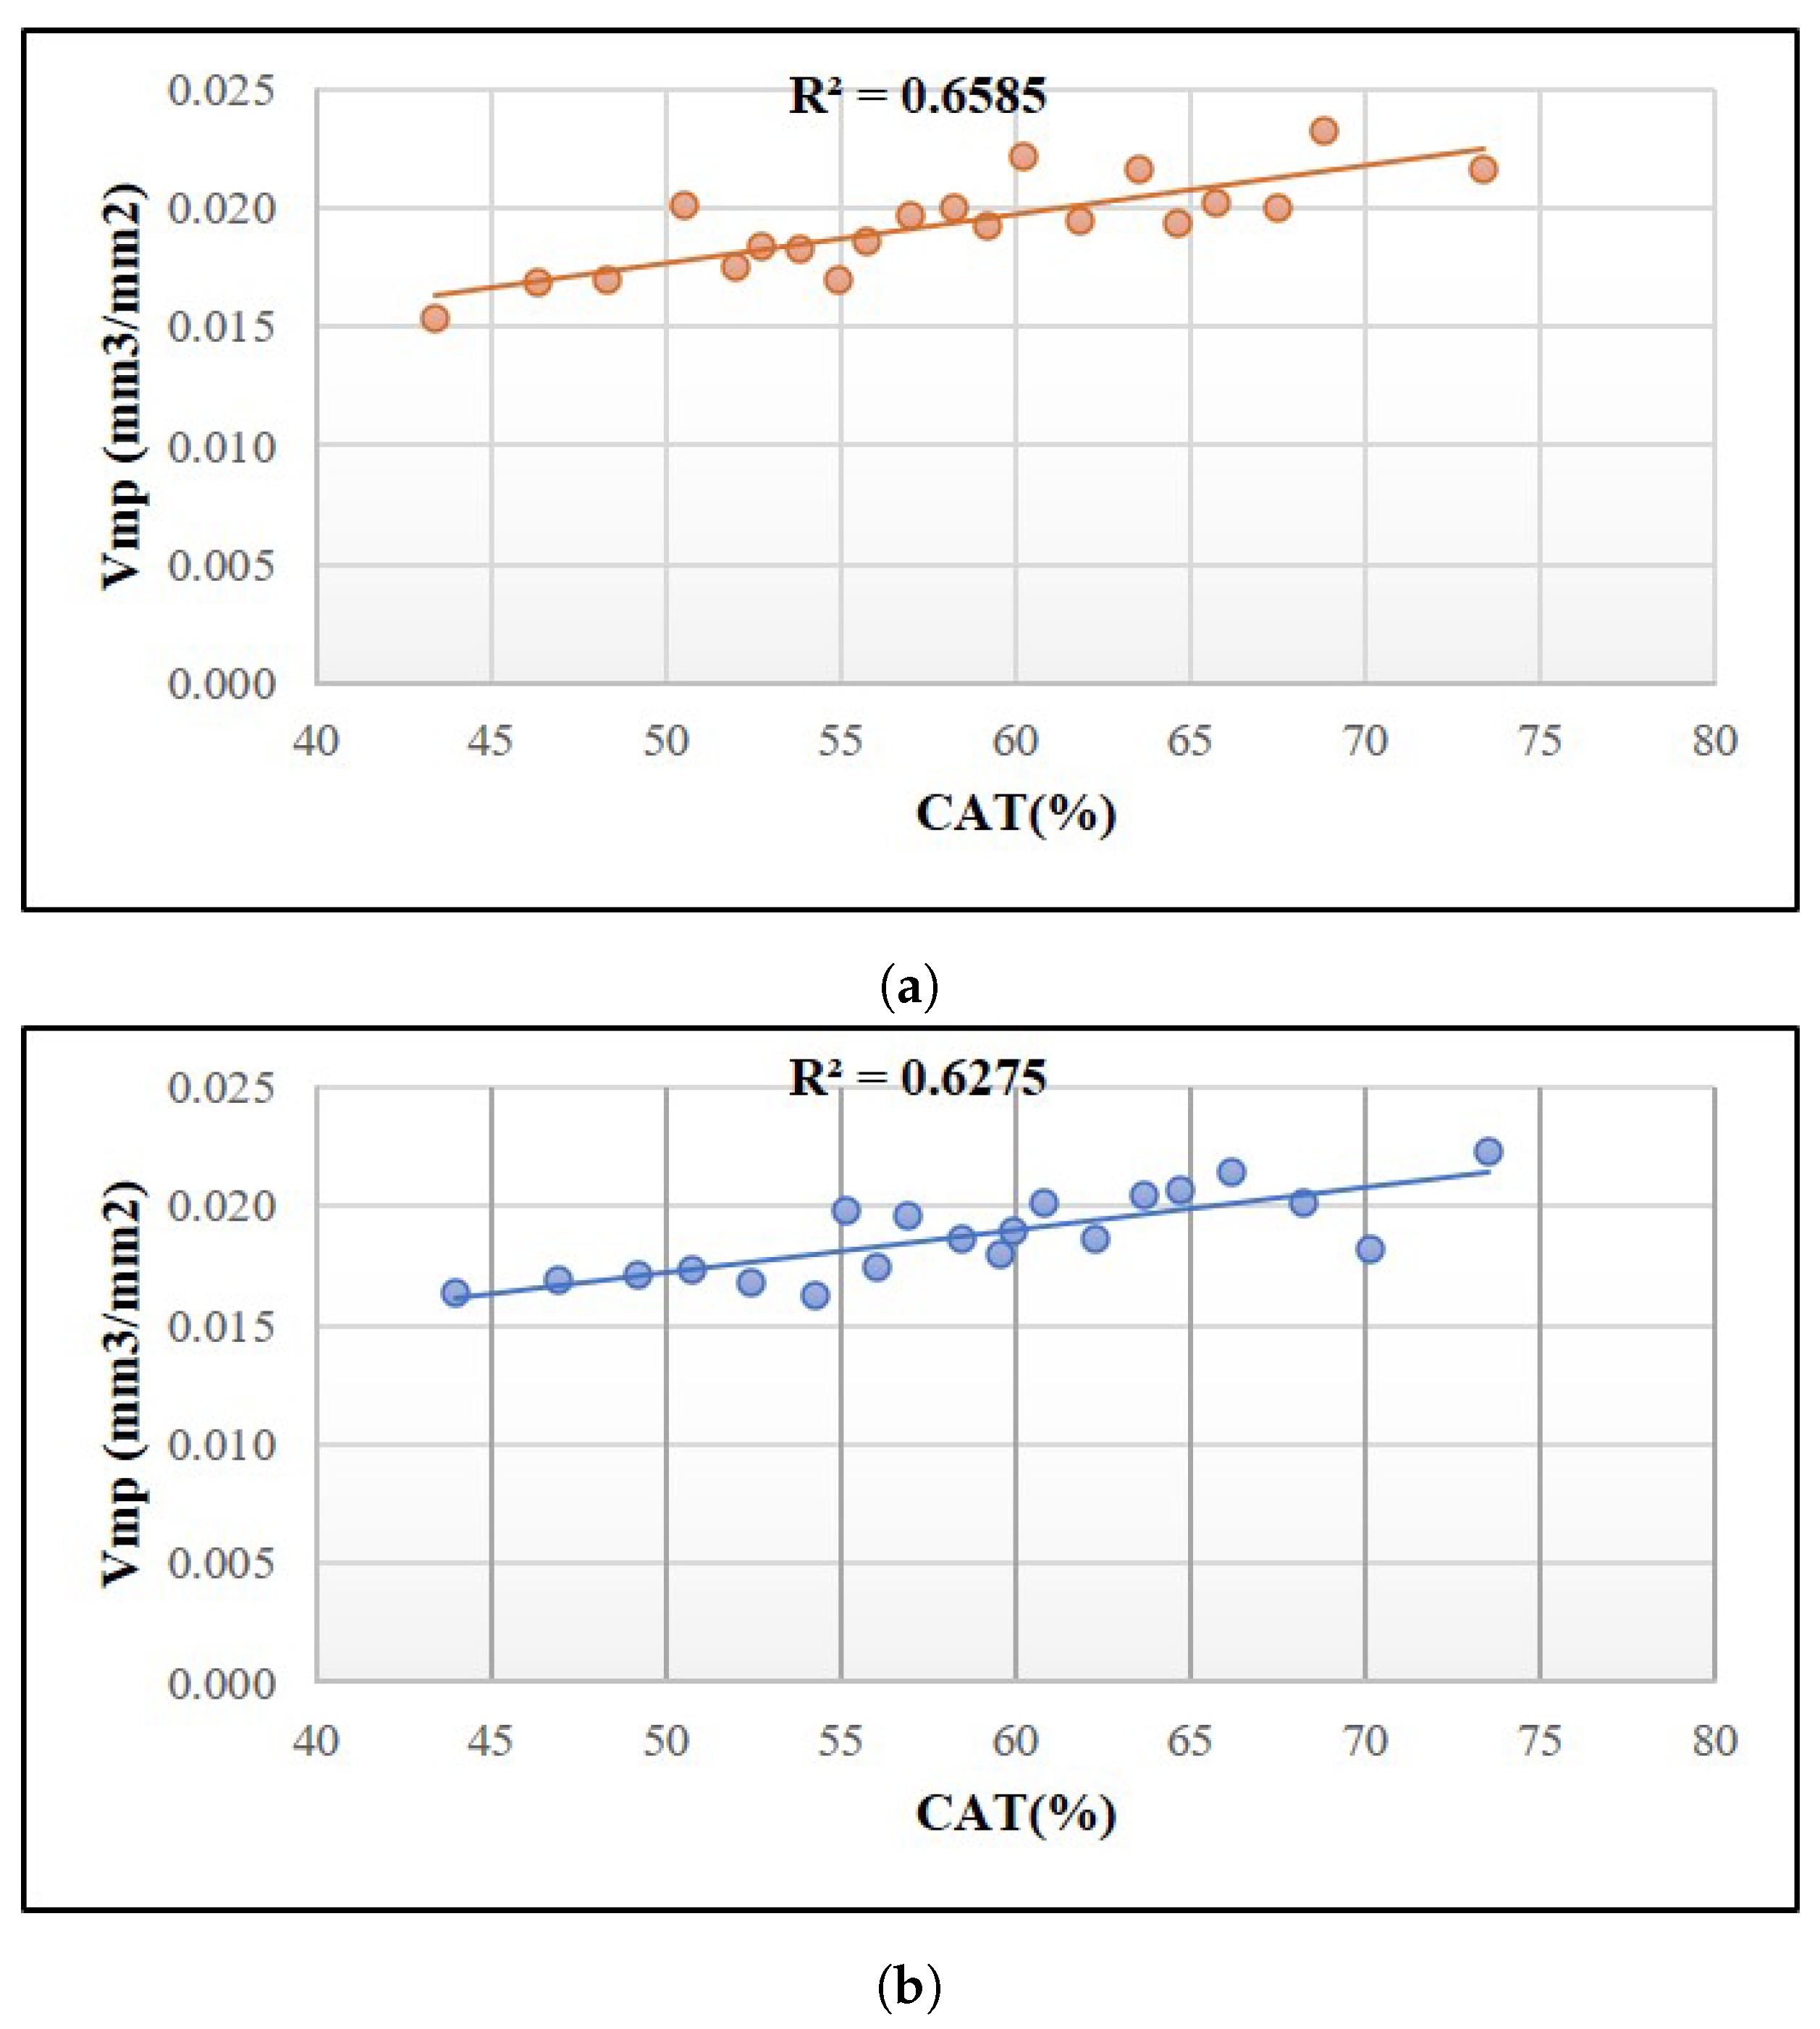
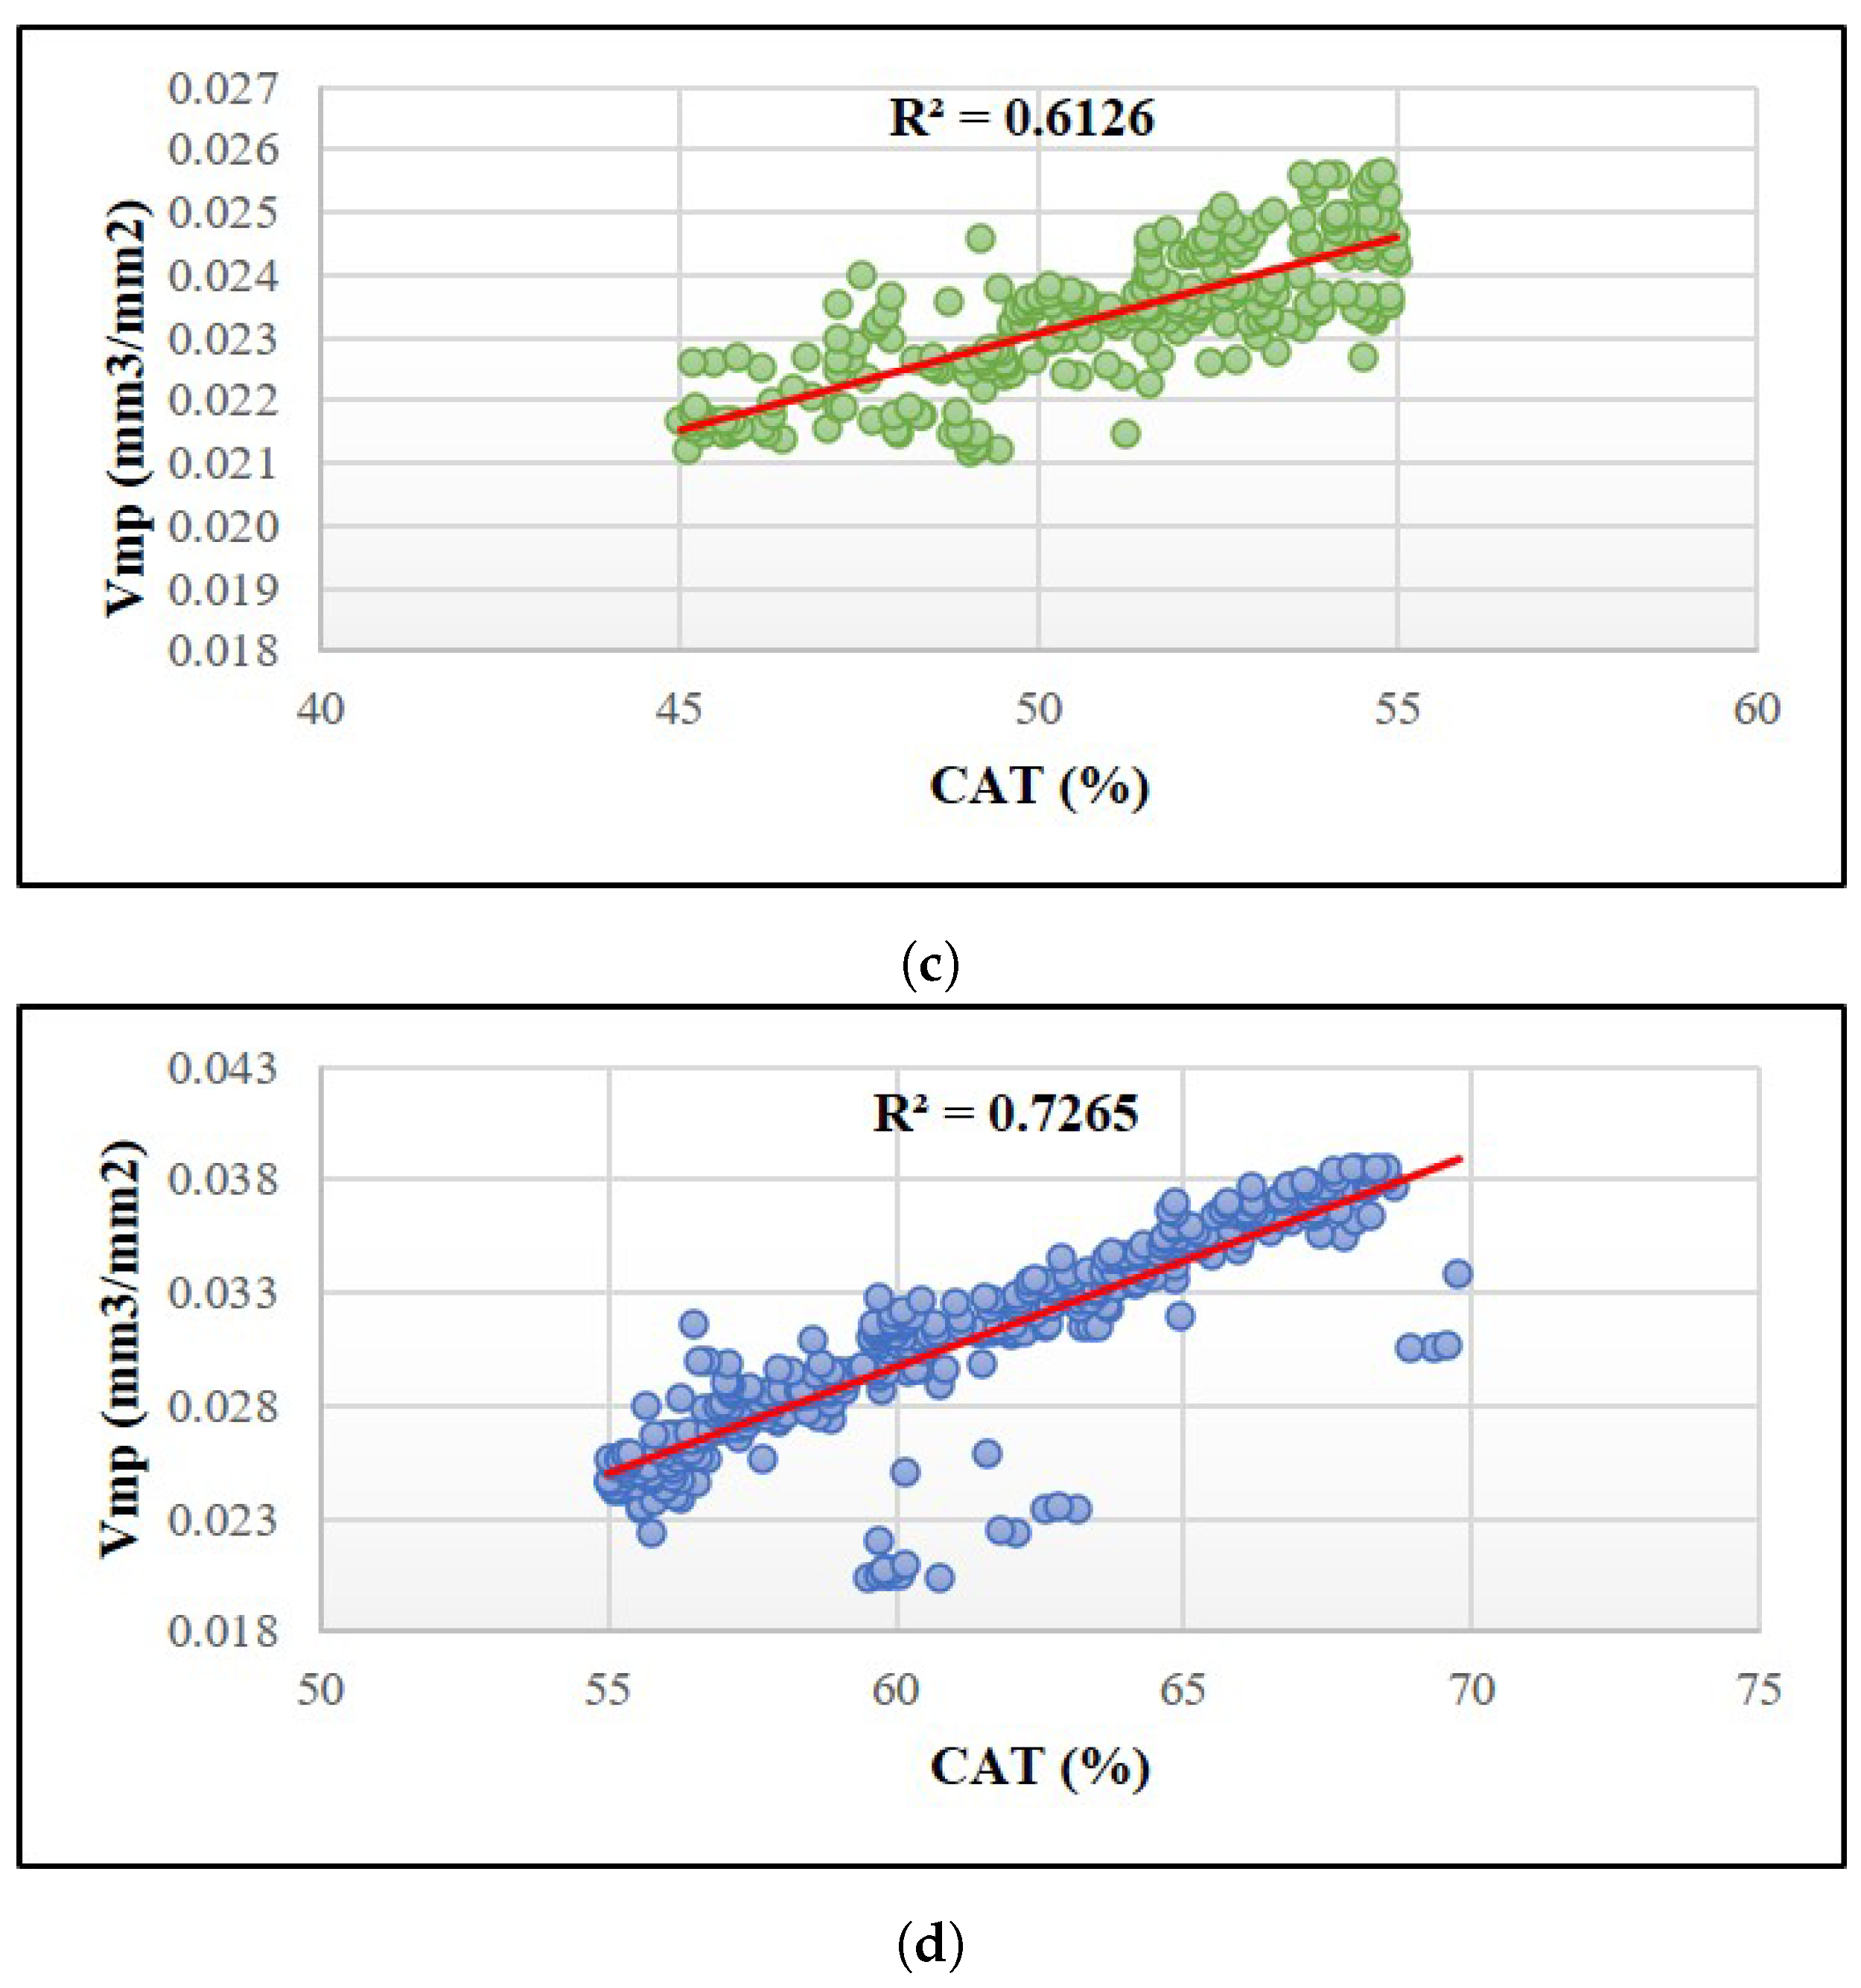
3.2.2. Correlation between CAT and V m p

We further correlated the pavement adhesion coefficient CAT and the pavement texture index V m p to preliminarily analyze the impact of the 3D topography characteristics of the pavement texture on the pavement adhesion performance. According to the traditional side force test method, the pavement is considered to have good adhesion performance when the side force coefficient (SFC, ie, CAT in this paper) is greater than 0.45 [52]. On the contrary, it is considered an insufficient skid-resistance quality when SFC is under 0.45. In this study, the CAT values on both wheel track zones greater than 0.45 are selected to correlate the pavement texture index V m p . After the data that were in insufficient adhesion were filtered out. The statistical significance of the left data was verified through mean and standard deviation. Finally, a total of 1585 samples were compared. Figure 14 shows the correlation analysis results of the left and right wheel tracks.
As can be seen from Figure 14, the correlation coefficients R 2 between CAT and V m p are calculated. The R 2 of the right and left wheel tracks are 0.6585 and 0.6275, respectively. According to previous research on the correlation between road pavement texture and pavement adhesion [53], the result of this study shows a high correlation, which means that the volume parameter V m p used in this study is a reliable index to characterize the 3D aspahlt pavement texture. By observing the correlation trend in the figure, we can see that the CAT values on the left and right sides have a consistent change pattern. The correlation coefficients R 2 of CAT and V m p on the left and right sides are similar (0.6585 and 0.6275), indicating that the road texture characteristics and adhesion performance are hardly affected by the left and right wheel tracks. Moreover, when we further observe the data distribution in the figure, we can find that the V m p value that characterizes the road texture has different changing trends within different adhesion thresholds. When the CAT value is between 0.45 and 0.55, most V m p values are on or below the trend line. When CAT values are greater than 0.55, most of the values are above the trend line. The above analysis indicates that there is an estimation bias in the current correlation estimation results between CAT and V m p . Therefore, it is necessary to divide road adhesion into different levels according to the CAT threshold. And further, build detailed prediction models of road adhesion performance using road texture under different CAT thresholds.

4. Discussion

4.1. Sample Subdivision

To accurately explore the relationship between road adhesion and road texture, this paper divides the CAT value into four levels according to the Italian Guide Line—CNR Bulletin N. 147/1992 [46]. Table 2 shows the details of the sample subdivision. The four levels are as follows: (1) When CAT < 0.35, the road surface is considered to have Mediocre adhesion, which means that the condition of the road surface needs to be checked very frequently to ensure driving safety. (2) When 0.35 < CAT < 0.45, the road surface is considered to have moderate adhesion properties, which means that the condition of the road surface needs to be checked frequently to ensure driving safety. (3) When 0.45 < CAT < 0.55, the road surface is considered to have satisfactory adhesion performance and only regular monitoring of the road surface is required. (4) When CAT > 0.55, the road surface is considered to have good adhesion, which means the maintenance office can reduce road surface monitoring and save costs. We divide the samples based on these CAT thresholds, and each sample consists of a pair of values: CAT and V m p . The number of samples in these four levels is 491, 386, 276, and 432.

4.2. Pavement Adhesion Assessment

To verify the impact of sample division based on the CAT threshold on the prediction of asphalt pavement adhesion performance based on pavement texture analysis, correlation analysis of CAT and V m p was performed on samples within each adhesion level. Figure 15 shows the results of the correlation analysis. The results show that when CAT < 0.35, the correlation coefficient R 2 is 0.6109, when 0.35 < CAT< 0.45, R 2 of which is 0.6006, and when 0.45 < CAT < 0.55, R 2 of which is 0.6126. That is, when CAT < 0.55, the corresponding correlation coefficients R 2 of the three adhesion levels under this CAT threshold are lower than that before dividing samples ( R 2 is 0.6585 and 0.6275), which indicates that the correlation between CAT and V m p was previously overestimated under this CAT threshold. When CAT > 0.55, the correlation coefficient R 2 of CAT and V m p is 0.7265, which is significantly higher than that of the previous estimate, which indicates that there was a significant underestimate of the correlation between CAT and V m p at this CAT threshold. All these results indicate that dividing samples according to the CAT threshold can more accurately measure the impact of pavement texture on asphalt pavement adhesion performance. In addition, from the above correlation analysis of the different adhesion ranges, it is highlighted that the measurement is more reliable when the CAT value is higher. That is, when the pavement has better performance, the distribution of road surface texture is more uniform, and pavement offers greater adhesion therefore the correlation between Vmp and CAT is higher.
In order to realize the asphalt pavement adhesion performance evaluation based on 3D laser detection technology, this paper further builds a asphalt pavement adhesion prediction model based on the samples classified by CAT threshold level and using the road texture index V m p . The prediction model and estimated parameters under each threshold level are listed in Table 3. Through these prediction models, the pavement adhesion coefficient CAT of the road surface can be predicted directly through the 3D texture surface of the road surface constructed by 3D laser detection technology, achieving efficient non-contact measurement of road pavement adhesion.

5. Conclusions

Pavement adhesion plays a crucial role in driving safety and is closely related to the condition of the pavement texture. To comprehensively consider the 3D characteristics of the road surface texture in the pavement adhesion assessment, and improve the accuracy and efficiency of the road asphalt adhesion assessment. We used the 3D laser technology to continuously collect the high-resolution 3D point cloud data of asphalt pavement surface. And then reconstruct the 3D topography of road surface texture using the collected point cloud. Then we propose a 3D volume parameter V m p based on the 3D topography to characterize the texture spatial characteristics. Primary analysis is conducted to validate the proposed experiment and volume parameters, and sample subdivision is carried out based on the CAT threshold. Finally, by analyzing the correlation between the proposed V m p and the road adhesion coefficient CAT, the refined sphalt pavement adhesion prediction models based on volume parameters of the road texture were established. Based on the analyses presented in the study, the following conclusions were reached:
  • The proposed volume parameter V m p can reliably characterize the asphalt pavement texture. The correlation analysis between the volumetric parameter V m p and the pavement adhesion coefficient CAT demonstrates a satisfactory degree of correlation, indicating the reliability of the proposed volumetric parameter in characterizing the 3D structure of texture;
  • By grading asphalt pavement surfaces through CAT thresholds, the accuracy of road surface texture characterization can be effectively improved, and the measurement is more reliable when the CAT value is higher. Within different adhesion thresholds, the correlation between pavement texture and pavement adhesion coefficient is different. Conventional analysis methods may overlook such differences, thus reducing the accuracy of pavement adhesion assessment. Utilizing CAT threshold-based segmentation can reduce this disparity, thereby enhancing accuracy;
  • Utilization of 3D laser detection technology enables rapid prediction of asphalt pavement adhesion coefficients and assessment of road skid resistance performance. Based on CAT threshold segmentation, this paper proposes a refined model utilizing road texture volume indicators to estimate asphalt pavement adhesion coefficients. This suggests that in the future, road skid resistance performance can be rapidly and non-invasively assessed through direct employment of road surface 3D laser detection technology.
Future developments: In this paper, when we calculate the 3D parameter V m p of the pavement texture, we only consider the top 10% of the material volume. The V m p value is closely related to this ratio, which will further affect the characterization of the pavement texture and the accuracy and reliability of the road adhesion prediction. It is unclear at which scale calculated V m p is most beneficial for characterizing the road surface and assessing road adhesion. In the future, we will further study the impact of different ratios on pavement texture characterization and adhesion assessment. Moreover, more volume parameters will be taken into account to fully characterize the relationship between pavement adhesion and pavement texture.

Author Contributions

Conceptualization, M.R.D.B. and S.O.; methodology, M.R.D.B. and H.L.; validation: M.R.D.B. and S.O.; formal analysis: H.L., M.R.D.B. and R.G.P.; investigation and data curation: R.G.P. and S.O.; writing—original draft preparation, H.L.; writing—review and editing, H.L., M.R.D.B. and L.C.; supervision, M.R.D.B. and L.C. All authors have read and agreed to the published version of the manuscript.

Funding

This research received no external funding.

Data Availability Statement

The data presented in this study are available upon appropriate request from the corresponding author.

Conflicts of Interest

The authors declare no conflicts of interest.

References

  1. Kogbara, R.B.; Masad, E.A.; Kassem, E.; Scarpas, A.T.; Anupam, K. A State-of-the-Art Review of Parameters Influencing Measurement and Modeling of Skid Resistance of Asphalt Pavements. Constr. Build. Mater. 2016, 114, 602–617. [Google Scholar] [CrossRef]
  2. Buddhavarapu, P.; Banerjee, A.; Prozzi, J.A. Influence of Pavement Condition on Horizontal Curve Safety. Accid. Anal. Prev. 2013, 52, 9–18. [Google Scholar] [CrossRef] [PubMed]
  3. Najafi, S.; Flintsch, G.W.; Medina, A. Linking Roadway Crashes and Tire–Pavement Friction: A Case Study. Int. J. Pavement Eng. 2017, 18, 119–127. [Google Scholar] [CrossRef]
  4. Alhasan, A.; Nlenanya, I.; Smadi, O.; MacKenzie, C.A. Impact of Pavement Surface Condition on Roadway Departure Crash Risk in Iowa. Infrastructures 2018, 3, 14. [Google Scholar] [CrossRef]
  5. Lyon, C.; Persaud, B.; Merritt, D. Quantifying the Safety Effects of Pavement Friction Improvements—Results from a Large-Scale Study. Int. J. Pavement Eng. 2018, 19, 145–152. [Google Scholar] [CrossRef]
  6. Abdi Kordani, A.; Rahmani, O.; Abdollahzadeh Nasiri, A.S.; Boroomandrad, S.M. Effect of Adverse Weather Conditions on Vehicle Braking Distance of Highways. Civ. Eng. J. 2018, 4, 46. [Google Scholar] [CrossRef]
  7. Shibata, K.; Takeuch, K.; Kawai, S.; Horita, Y. Detection of Road Surface Conditions in Winter Using Road Surveillance Cameras at Daytime, Night-Time and Twilight. Int. J. Comput. Sci. Netw. Secur. 2014, 14, 21. [Google Scholar]
  8. Alhasan, A.; Smadi, O.; Bou-Saab, G.; Hernandez, N.; Cochran, E. Pavement Friction Modeling Using Texture Measurements and Pendulum Skid Tester. Transp. Res. Rec. J. Transp. Res. Board 2018, 2672, 440–451. [Google Scholar] [CrossRef]
  9. Chu, L.; Cui, X.; Zhang, K.; Fwa, T.F.; Han, S. Directional Skid Resistance Characteristics of Road Pavement: Implications for Friction Measurements by British Pendulum Tester and Dynamic Friction Tester. Transp. Res. Rec. J. Transp. Res. Board 2019, 2673, 793–803. [Google Scholar] [CrossRef]
  10. Choubane, B.; Holzschuher, C.R.; Gokhale, S. Precision of Locked-Wheel Testers for Measurement of Roadway Surface Friction Characteristics. Transp. Res. Rec. J. Transp. Res. Board 2004, 1869, 145–151. [Google Scholar] [CrossRef]
  11. Zaid, N.B.M.; Hainin, M.R.; Idham, M.K.; Warid, M.N.M.; Naqibah, S.N. Evaluation of Skid Resistance Performance Using British Pendulum and Grip Tester. IOP Conf. Ser. Earth Environ. Sci. 2019, 220, 012016. [Google Scholar] [CrossRef]
  12. Nejad, F.M.; Karimi, N.; Zakeri, H. Automatic Image Acquisition with Knowledge-Based Approach for Multi-Directional Determination of Skid Resistance of Pavements. Autom. Constr. 2016, 71, 414–429. [Google Scholar] [CrossRef]
  13. Liang, J.; Gu, X.; Chen, Y.; Ni, F.; Zhang, T. A Novel Pavement Mean Texture Depth Evaluation Strategy Based on Three-Dimensional Pavement Data Filtered by a New Filtering Approach. Measurement 2020, 166, 108265. [Google Scholar] [CrossRef]
  14. Zuniga-Garcia, N.; Prozzi, J.A. High-Definition Field Texture Measurements for Predicting Pavement Friction. Transp. Res. Rec. 2019, 2673, 246–260. [Google Scholar] [CrossRef]
  15. Li, Q.J.; Yang, G.; Wang, K.C.P.; Zhan, Y.J.; Wang, C. Novel Macro- and Microtexture Indicators for Pavement Friction by Using High-Resolution Three-Dimensional Surface Data. Transp. Res. Rec. 2017, 2641, 164–176. [Google Scholar] [CrossRef]
  16. Flintsch, G.W.; McGhee, K.K.; Izeppi, E.d.L.; Najafi, S. The Little Book of Tire Pavement Friction. Pavement Surf. Prop. Consort. 2012, 1, 1–22. [Google Scholar]
  17. Uz, V.E.; Gökalp, İ. Comparative Laboratory Evaluation of Macro Texture Depth of Surface Coatings with Standard Volumetric Test Methods. Constr. Build. Mater. 2017, 139, 267–276. [Google Scholar] [CrossRef]
  18. Liu, Z.; Cui, B.; Yang, Q.; Gu, X. Sensor-Based Structural Health Monitoring of Asphalt Pavements with Semi-Rigid Bases Combining Accelerated Pavement Testing and a Falling Weight Deflectometer Test. Sensors 2024, 24, 994. [Google Scholar] [CrossRef] [PubMed]
  19. Liu, Z.; Yang, Q.; Gu, X. Assessment of Pavement Structural Conditions and Remaining Life Combining Accelerated Pavement Testing and Ground-Penetrating Radar. Remote Sens. 2023, 15, 4620. [Google Scholar] [CrossRef]
  20. Chen, D.; Ling, C.; Wang, T.; Su, Q.; Ye, A. Prediction of Tire-Pavement Noise of Porous Asphalt Mixture Based on Mixture Surface Texture Level and Distributions. Constr. Build. Mater. 2018, 173, 801–810. [Google Scholar] [CrossRef]
  21. Shi, J.; Gong, H.; Yang, F.; Liang, H.; Cong, L. Image Processing of Aggregate Skeleton Structure of Asphalt Mixture for Aggregate Uniformity Quantification. J. Mater. Civ. Eng. 2023, 35, 04022388. [Google Scholar] [CrossRef]
  22. Yang, G.; Li, Q.J.; Zhan, Y.J.; Wang, K.C.P.; Wang, C. Wavelet Based Macrotexture Analysis for Pavement Friction Prediction. KSCE J. Civ. Eng. 2018, 22, 117–124. [Google Scholar] [CrossRef]
  23. Nguyen, T.S.; Avila, M.; Begot, S. Automatic Detection and Classification of Defect on Road Pavement Using Anisotropy Measure. In Proceedings of the 2009 17th European Signal Processing Conference, Glasgow, UK, 24–28 August 2009. [Google Scholar]
  24. Liu, S.; Huang, J.H.; Sung, J.; Lee, C. Detection of Cracks Using Neural Networks and Computational Mechanics. Comput. Methods Appl. Mech. Eng. 2002, 191, 2831–2845. [Google Scholar] [CrossRef]
  25. Fujita, Y.; Shimada, K.; Ichihara, M.; Hamamoto, Y. A Method Based on Machine Learning Using Hand-Crafted Features for Crack Detection from Asphalt Pavement Surface Images. In Proceedings of the Thirteenth International Conference on Quality Control by Artificial Vision 2017, Tokyo, Japan, 14–16 May 2017; p. 103380I. [Google Scholar] [CrossRef]
  26. Tsai, Y.C.J.; Jiang, C.; Huang, Y. Multiscale Crack Fundamental Element Model for Real-World Pavement Crack Classification. J. Comput. Civ. Eng. 2014, 28, 04014012. [Google Scholar] [CrossRef]
  27. Du, Y.; Liu, C.; Song, Y.; Li, Y.; Shen, Y. Rapid Estimation of Road Friction for Anti-Skid Autonomous Driving. IEEE Trans. Intell. Transp. Syst. 2020, 21, 2461–2470. [Google Scholar] [CrossRef]
  28. Yang, G.; Zhang, A.A.; Wang, K.C.P.; Li, J.Q.; Liu, W.; Liu, Y. Deep-Learning Based Non-Contact Method for Assessing Pavement Skid Resistance Using 3D Laser Imaging Technology. Int. J. Pavement Eng. 2023, 24, 2147520. [Google Scholar] [CrossRef]
  29. Sun, X.; Huang, J.; Liu, W.; Xu, M. Pavement Crack Characteristic Detection Based on Sparse Representation. EURASIP J. Adv. Signal Process. 2012, 2012, 191. [Google Scholar] [CrossRef]
  30. Zhang, D.; Zou, Q.; Lin, H.; Xu, X.; He, L.; Gui, R.; Li, Q. Automatic Pavement Defect Detection Using 3D Laser Profiling Technology. Autom. Constr. 2018, 96, 350–365. [Google Scholar] [CrossRef]
  31. Li, F. A Methodology for Characterizing Pavement Rutting Condition Using Emerging 3D Line Laser Imaging Technology. Ph.D. Thesis, Georgia Institute of Technology, Atlanta, GA, USA, 2012. [Google Scholar]
  32. Tsai, Y.; Wu, Y.; Ai, C. Feasibility Study of Measuring Concrete Joint Faulting Using 3D Continuous Pavement Profile Data. In Proceedings of the Transportation Research Board 90th Annual Meeting, Washington, DC, USA, 23–27 January 2011. [Google Scholar]
  33. Tsai, Y.C.J.; Chatterjee, A. Pothole Detection and Classification Using 3D Technology and Watershed Method. J. Comput. Civ. Eng. 2018, 32, 04017078. [Google Scholar] [CrossRef]
  34. De Blasiis, M.R.; Di Benedetto, A.; Fiani, M. Mobile Laser Scanning Data for the Evaluation of Pavement Surface Distress. Remote Sens. 2020, 12, 942. [Google Scholar] [CrossRef]
  35. Chen, W.; Ni, Z.; Hu, X.; Lu, X. Research on Pavement Roughness Based on the Laser Triangulation. Photonic Sens. 2016, 6, 177–180. [Google Scholar] [CrossRef]
  36. Alamdarlo, M.N.; Hesami, S. Optimization of the Photometric Stereo Method for Measuring Pavement Texture Properties. Measurement 2018, 127, 406–413. [Google Scholar] [CrossRef]
  37. Chen, H.; Zhang, D.; Gui, R.; Pu, F.; Cao, M.; Xu, X. 3D Pavement Data Decomposition and Texture Level Evaluation Based on Step Extraction and Pavement-Transformer. Measurement 2022, 188, 110399. [Google Scholar] [CrossRef]
  38. Yang, G.; Li, Q.J.; Zhan, Y.; Yu, W.; Wang, K.C.; Peng, Y. Field Performance Evaluation of High Friction Surface Treatments (HFST) in Oklahoma. Can. J. Civ. Eng. 2019, 46, 1142–1150. [Google Scholar] [CrossRef]
  39. Torbruegge, S.; Wies, B. Characterization of Pavement Texture by Means of Height Difference Correlation and Relation to Wet Skid Resistance. J. Traffic Transp. Eng. 2015, 2, 59–67. [Google Scholar] [CrossRef]
  40. Yang, G.; Li, Q.J.; Zhan, Y.; Fei, Y.; Zhang, A. Convolutional Neural Network–Based Friction Model Using Pavement Texture Data. J. Comput. Civ. Eng. 2018, 32, 04018052. [Google Scholar] [CrossRef]
  41. Chen, D.; Han, S.; Ye, A.; Ren, X.; Wang, W.; Wang, T. Prediction of Tire–Pavement Friction Based on Asphalt Mixture Surface Texture Level and Its Distributions. Road Mater. Pavement Des. 2020, 21, 1545–1564. [Google Scholar] [CrossRef]
  42. Yang, G.; Wang, K.C.; Li, J.Q. Multiresolution Analysis of Three-Dimensional (3D) Surface Texture for Asphalt Pavement Friction Estimation. Int. J. Pavement Eng. 2021, 22, 1882–1891. [Google Scholar] [CrossRef]
  43. Yang, G.; Wang, K.C.P.; Li, J.Q.; Wang, G. A Novel 0.1 Mm 3D Laser Imaging Technology for Pavement Safety Measurement. Sensors 2022, 22, 8038. [Google Scholar] [CrossRef]
  44. Zou, Y.; Yang, G.; Huang, W.; Lu, Y.; Qiu, Y.; Wang, K.C.P. Study of Pavement Micro- and Macro-Texture Evolution Due to Traffic Polishing Using 3D Areal Parameters. Materials 2021, 14, 5769. [Google Scholar] [CrossRef]
  45. Il Centro Sperimentale Stradale. 2016. Available online: https://www.stradeanas.it/it/il-centro-sperimentale-stradale-di-cesano (accessed on 2 April 2024).
  46. Crisman, B.; Roberti, R. Tire Wet-Pavement Traction Management for Safer Roads. Procedia Soc. Behav. Sci. 2012, 53, 1054–1067. [Google Scholar] [CrossRef]
  47. Besl, P.J.; McKay, N.D. Method for Registration of 3-D Shapes. In Proceedings of the Sensor Fusion IV: Control Paradigms and Data Structures, Boston, MA, USA, 14–15 November 1992; SPIE: Washington, DC, USA, 1992; Volume 1611, pp. 586–606. [Google Scholar] [CrossRef]
  48. Almhdie, A.; Léger, C.; Deriche, M.; Lédée, R. 3D Registration Using a New Implementation of the ICP Algorithm Based on a Comprehensive Lookup Matrix: Application to Medical Imaging. Pattern Recognit. Lett. 2007, 28, 1523–1533. [Google Scholar] [CrossRef]
  49. Duffy, A.; Yates, B.; Takacs, P. Using MountainsMap (Digital Surf) Surface Analysis Software as an Analysis Tool for X-ray Mirror Optical Metrology Data. In SPIE Optical Engineering + Applications; Assoufid, L., Takacs, P.Z., Asundi, A.K., Eds.; SPIE: San Diego, CA, USA, 2012; p. 850106. [Google Scholar] [CrossRef]
  50. Leach, R. (Ed.) Characterisation of Areal Surface Texture; Springer: Berlin/Heidelberg, Germany, 2013. [Google Scholar] [CrossRef]
  51. International Organization for Standardization. EN ISO 25178-2:2022; Geometrical Product Specifications (GPS)—Surface Texture: Areal—Part 2: Terms, Definitions and Surface Texture Parameters. CEN-CENELEC Management Centre: Brussels, Belgium, January 2022.
  52. Papageorgiou, G.; Mouratidis, A. Defining Threshold Values for Pavement Surface Characteristics. Proc. Inst. Civ. Eng. Transp. 2015, 168, 223–230. [Google Scholar] [CrossRef]
  53. Yan, Y.; Ran, M.; Sandberg, U.; Zhou, X.; Xiao, S. Spectral Techniques Applied to Evaluate Pavement Friction and Surface Texture. Coatings 2020, 10, 424. [Google Scholar] [CrossRef]
Figure 1. Demonstration of data collection system: (a) shows the E.R.M.E.S. Instrument developed by Anas S.p.A., (b) is a schematic layout of the location of each type of data collection equipment within the E.R.M.E.S. system. With the E.R.M.E.S. instrument, the pavement adhesion index and pavement texture 3D point cloud at the same position can be collected simultaneously.
Remotesensing 16 01943 g001
Figure 2. S.C.R.I.M for pavement adhesion detection: (a) is the details of the S.C.R.I.M. system. on E.R.M.E.S. instrumentation (Road Experimental Center—Anas S.p.A.). (b) shows the collection of the resulting force of the S.C.R.I.M. tire that generates pavement adhesion index CAT.
Remotesensing 16 01943 g002
Figure 3. The principle of obtaining 3D point cloud of road surfaces. Through the laser triangulation principle, 3D point clouds of road surface profiles can be obtained, facilitating the construction of road surface profile diagrams, and thereby acquiring the 3D morphology of the road surface.
Remotesensing 16 01943 g003
Figure 4. Road scanning system. (a) is the appearance of Gocator 2342 in road scanner, (b) shows the definition of the detection parameters of the sensor.
Remotesensing 16 01943 g004
Figure 5. Sensors layout and data collection within the road scanner. (a) shows the inner sensor layout details of the road scanning system, and (b) is the profile capture within each pair of sensors.
Remotesensing 16 01943 g005
Figure 6. 3D data extraction and reconstruction of road pavement surface. (a) shows the extraction resolution details of 3D data, and (b) is the reconstructed 3D surface of pavement texture.
Remotesensing 16 01943 g006
Figure 7. The definition of material ratio. The deeper the cutting plane position, the larger the material ratio.
Remotesensing 16 01943 g007
Figure 8. The description of accumulative curve. This is a single curve that has information on both the areal material ratio curve and height density curve. It is appropriate to analyze the 3D functional characteristics of a surface.
Remotesensing 16 01943 g008
Figure 9. The sketch of volume parameters. The values of volume parameters vary with the positions of mr1 and mr2. In this study, the material ratios, 10%, and 80% are used to determine m r 1 and m r 2 to define surface peak and valley.
Remotesensing 16 01943 g009
Figure 10. The flow chart of data transmission and fusion of the E.R.M.E.S system. The data acquired by the lasers are recorded on a PC, and the GNSS coordinates the point cloud with the CAT measurements.
Remotesensing 16 01943 g010
Figure 11. The detection sketch map of field experiments. The 2 km test road is divided into lots of 20-m segments. One of the test road segments is taken as an investigation area. The C A T and V m p data are collected in the same area at the same time.
Remotesensing 16 01943 g011
Figure 12. The detection sketch map of field experiments. The 2 km test road is divided into lots of 20-m segments. One of the test road segments is taken as an investigation area. The C A T and V m p data are collected in the same area at the same time.
Remotesensing 16 01943 g012
Figure 13. Pavement adhesion varies with testing distance. (a) shows the trend of CAT in the right wheel track zone, (b) shows the trend of CAT in the left wheel track zone. The CAT value changes as the testing position changes.
Remotesensing 16 01943 g013
Figure 14. Correlation between CAT and V m p on the right and left wheel track zone, respectively. (a) shows the correlation between CAT and V m p on the right wheel track, (b) shows the correlation between CAT and V m p on the left wheel track.
Remotesensing 16 01943 g014
Figure 15. Results of the correlation analysis of CAT and V m p under different CAT thresholds. (a) CAT < 0.35, adhesion in Mediocre levels. (b) 0.35 < CAT< 0.45, adhesion in Moderate level. (c) 0.45 < CAT < 0.55, adhesion in Satisfactory level. (d) CAT > 0.55, adhesion in Good level.
Remotesensing 16 01943 g015aRemotesensing 16 01943 g015b
Table 1. Gocator 2342 sensor parameter specifications.
Sensor ParameterValues
Scan Rate15 ≤ 5000 Hz
Points per Profile1280
Transverse Resolution (X)0.095 mm–0.170 mm
Depth Resolution0.015 mm–0.040 mm
Field of View (FOV)64 mm–240 mm
Clearance Distance (CD)190 mm
Measurement Range (MR)210 mm
Table 2. Sample subdivision details by CAT threshold.
Adhesion LevelJudgmentOperationsNumber of Samples
CAT < 0.35MediocreVery frequent checks491
0.35 < CAT < 0.45ModerateFrequent checks386
0.45 < CAT < 0.55SatisfactoryPeriodic surveillance276
CAT > 0.55GoodReduce surveillance432
Table 3. Pavement adhesion prediction models of different adhesion levels.
Adhesion LevelPrediction Models R 2 Coeff. Person
CAT < 0.35y = 0.0002x + 0.00740.61090.7816
0.35 < CAT < 0.45y = 0.0007x − 0.00870.60060.7803
0.45 < CAT < 0.55y = 0.0003x + 0.00760.61260.7827
CAT > 0.55y = 0.0009x − 0.02680.72650.8523
Notes: x means CAT, y means V m p .
Disclaimer/Publisher’s Note: The statements, opinions and data contained in all publications are solely those of the individual author(s) and contributor(s) and not of MDPI and/or the editor(s). MDPI and/or the editor(s) disclaim responsibility for any injury to people or property resulting from any ideas, methods, instructions or products referred to in the content.

