Article

Combined Geophysical Methods in Extreme Environments—An Example from the Dead Sea

1
Dr. Mosses Strauss Department of Marine Geosciences, Leon H. Charney School of Marine Sciences, University of Haifa, Mount Carmel, Haifa 3103301, Israel
2
GeoSense Ltd., Even-Yehuda 40500, Israel
*
Author to whom correspondence should be addressed.
Remote Sens. 2024, 16(11), 1978; https://doi.org/10.3390/rs16111978
Submission received: 30 April 2024 / Revised: 23 May 2024 / Accepted: 27 May 2024 / Published: 30 May 2024
(This article belongs to the Special Issue Remote Sensing of the Dead Sea Region)

Abstract

:
The application of geophysical methods in saline environments is limited in their ability to discern shallow subsurface geology and tectonics due to the high subsurface conductivity, which can play havoc with the geophysical signal. Recent changes in the hypersaline Dead Sea provided the opportunity to demonstrate the effectiveness and adequacy of the terrestrial frequency domain electromagnetic (henceforth FDEM) method in such settings. Since the International Continental Drilling Program (ICDP) 5017-3-C borehole was cored in 2011 in a water depth of ~2.1 m, the lake level has dropped by almost 15 m, exposing some 320 m of a new, salt-encrusted shore. An FDEM survey was carried out on what is now land across the borehole. The results of the survey were compared to downhole gamma ray logging data. Three lithologies were found based on gamma-ray cutoff values, and they are in agreement with changes in apparent electric conductivity. The FDEM survey supplied additional spatial information on the subsurface geology, highlighting areas of fluid flow and fracturing, which were found to be aligned with the trend of small strike-slip faults and earthquake clusters from previous studies. The FDEM method is a reliable way of discerning shallow subsurface geology, even in harsh conditions where other geophysical methods are limited.

1. Introduction

Problems of obtaining meaningful high-resolution geophysical data in terrestrial saline environments are well known. Information is usually limited to mapping the saline/freshwater interface, groundwater salinity, or soil moisture with little or no geological or tectonic interpretation within the conductive zones ([1,2,3], to name but a few). Traditional methods, such as ground penetrating radar (GPR), normally do not work in such an environment since they can be greatly affected by both moisture and salinity [4,5,6]. Studies in terrestrial saline environments often combine some sort of electrical method with classical seismic ones (e.g., [3] and references therein).
The near-shore coastal areas along the Dead Sea are a particularly harsh environment to study due to extreme hypersaline conditions. In addition, a solid layer of salt can be found along the recently exposed shoreline (see below), making it even more difficult to obtain subsurface geological/tectonic information from these areas using classical geophysical methods.
Despite these difficulties, a wealth of high-resolution terrestrial geophysical methods have been applied in the Dead Sea area, overwhelmingly for the study of sinkhole formation and their development. These include ground penetrating radar (GPR), transient electromagnetics (TEM), magnetic resonance sounding (MRS), frequency domain electromagnetics (FDEM), electric resistivity tomography (ERT), microgravity, nanoseismicity, seismic refraction, and reflection. For a complete summary of the methods applied and their results, please see [7]. The results of these studies were used to examine the “salt edge” model, which proposed that sinkholes develop along the edge of a buried salt layer that represents an ancient shoreline. As the edge comes into contact with fresher groundwater as a result of lowering lake levels and an eastward shift in the saline-freshwater interface, it is dissolved, leading to the formation of subsurface cavities and eventual collapse along pre-defined lineaments that follow this edge (e.g., [8]). However, this model is contested [9].
Electrical and magnetic methods have been applied in more complex settings of the Dead Sea, where the high salinity of the groundwater can affect the geophysical signal [10]. The authors combined these methods to discern variations in groundwater salinity and in the lithology of water-saturated sediment, separating between areas of brine-saturated permeable rock (sand and probably karstic salt formation) and low permeable material (clay, silt, compact salt) in the subsurface. It is important to note that all studies along the shores of the Dead Sea using geophysical methods were conducted well away from the shoreline—i.e., in areas where the surface was covered by mud or gravel, not hard salt.
The current study utilizes the terrestrial FDEM method across an ICDP borehole cored in what was very shallow waters at the time (2011). Due to receding lake levels, at the time of the geophysical survey (2016), the borehole was located on the newly exposed Dead Sea shoreline. Results were used to obtain information on shallow subsurface geology, which was not recovered from the core. They were also correlated to geophysical logging data, specifically gamma ray (GR) logs, thus providing a lithological interpretation as well. The study demonstrates how the FDEM method can be a useful tool even in extreme hypersaline environments.

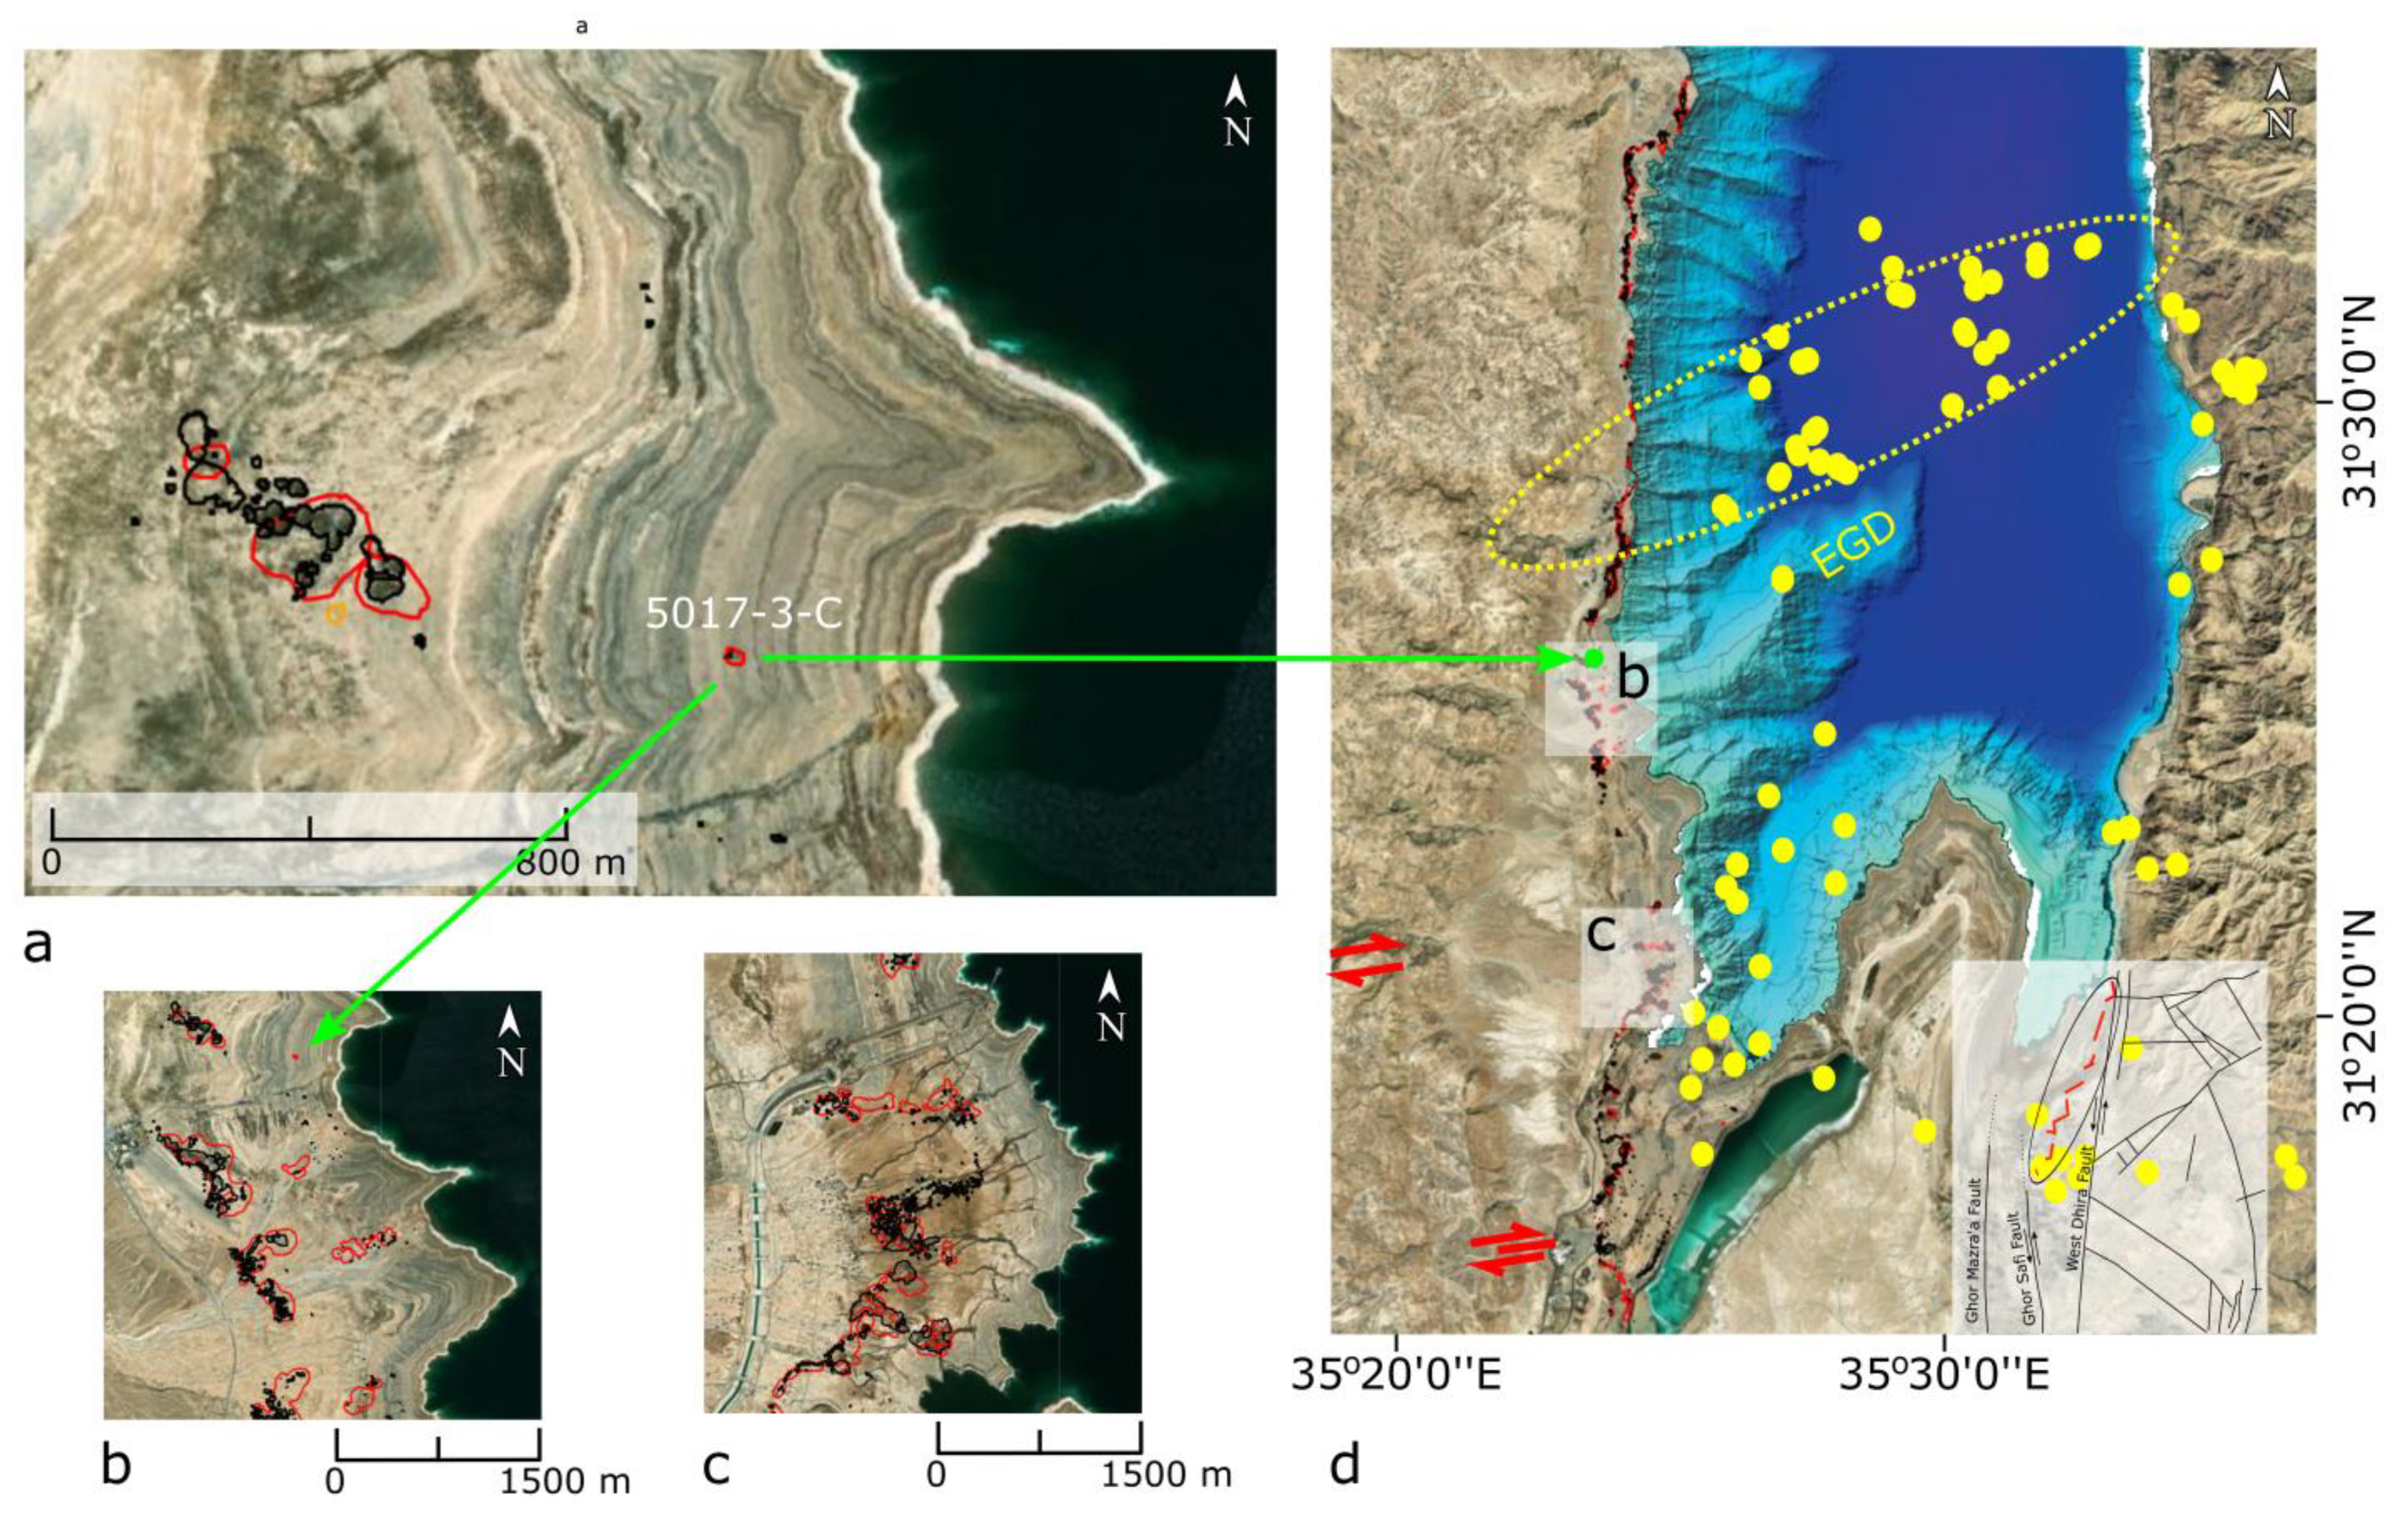
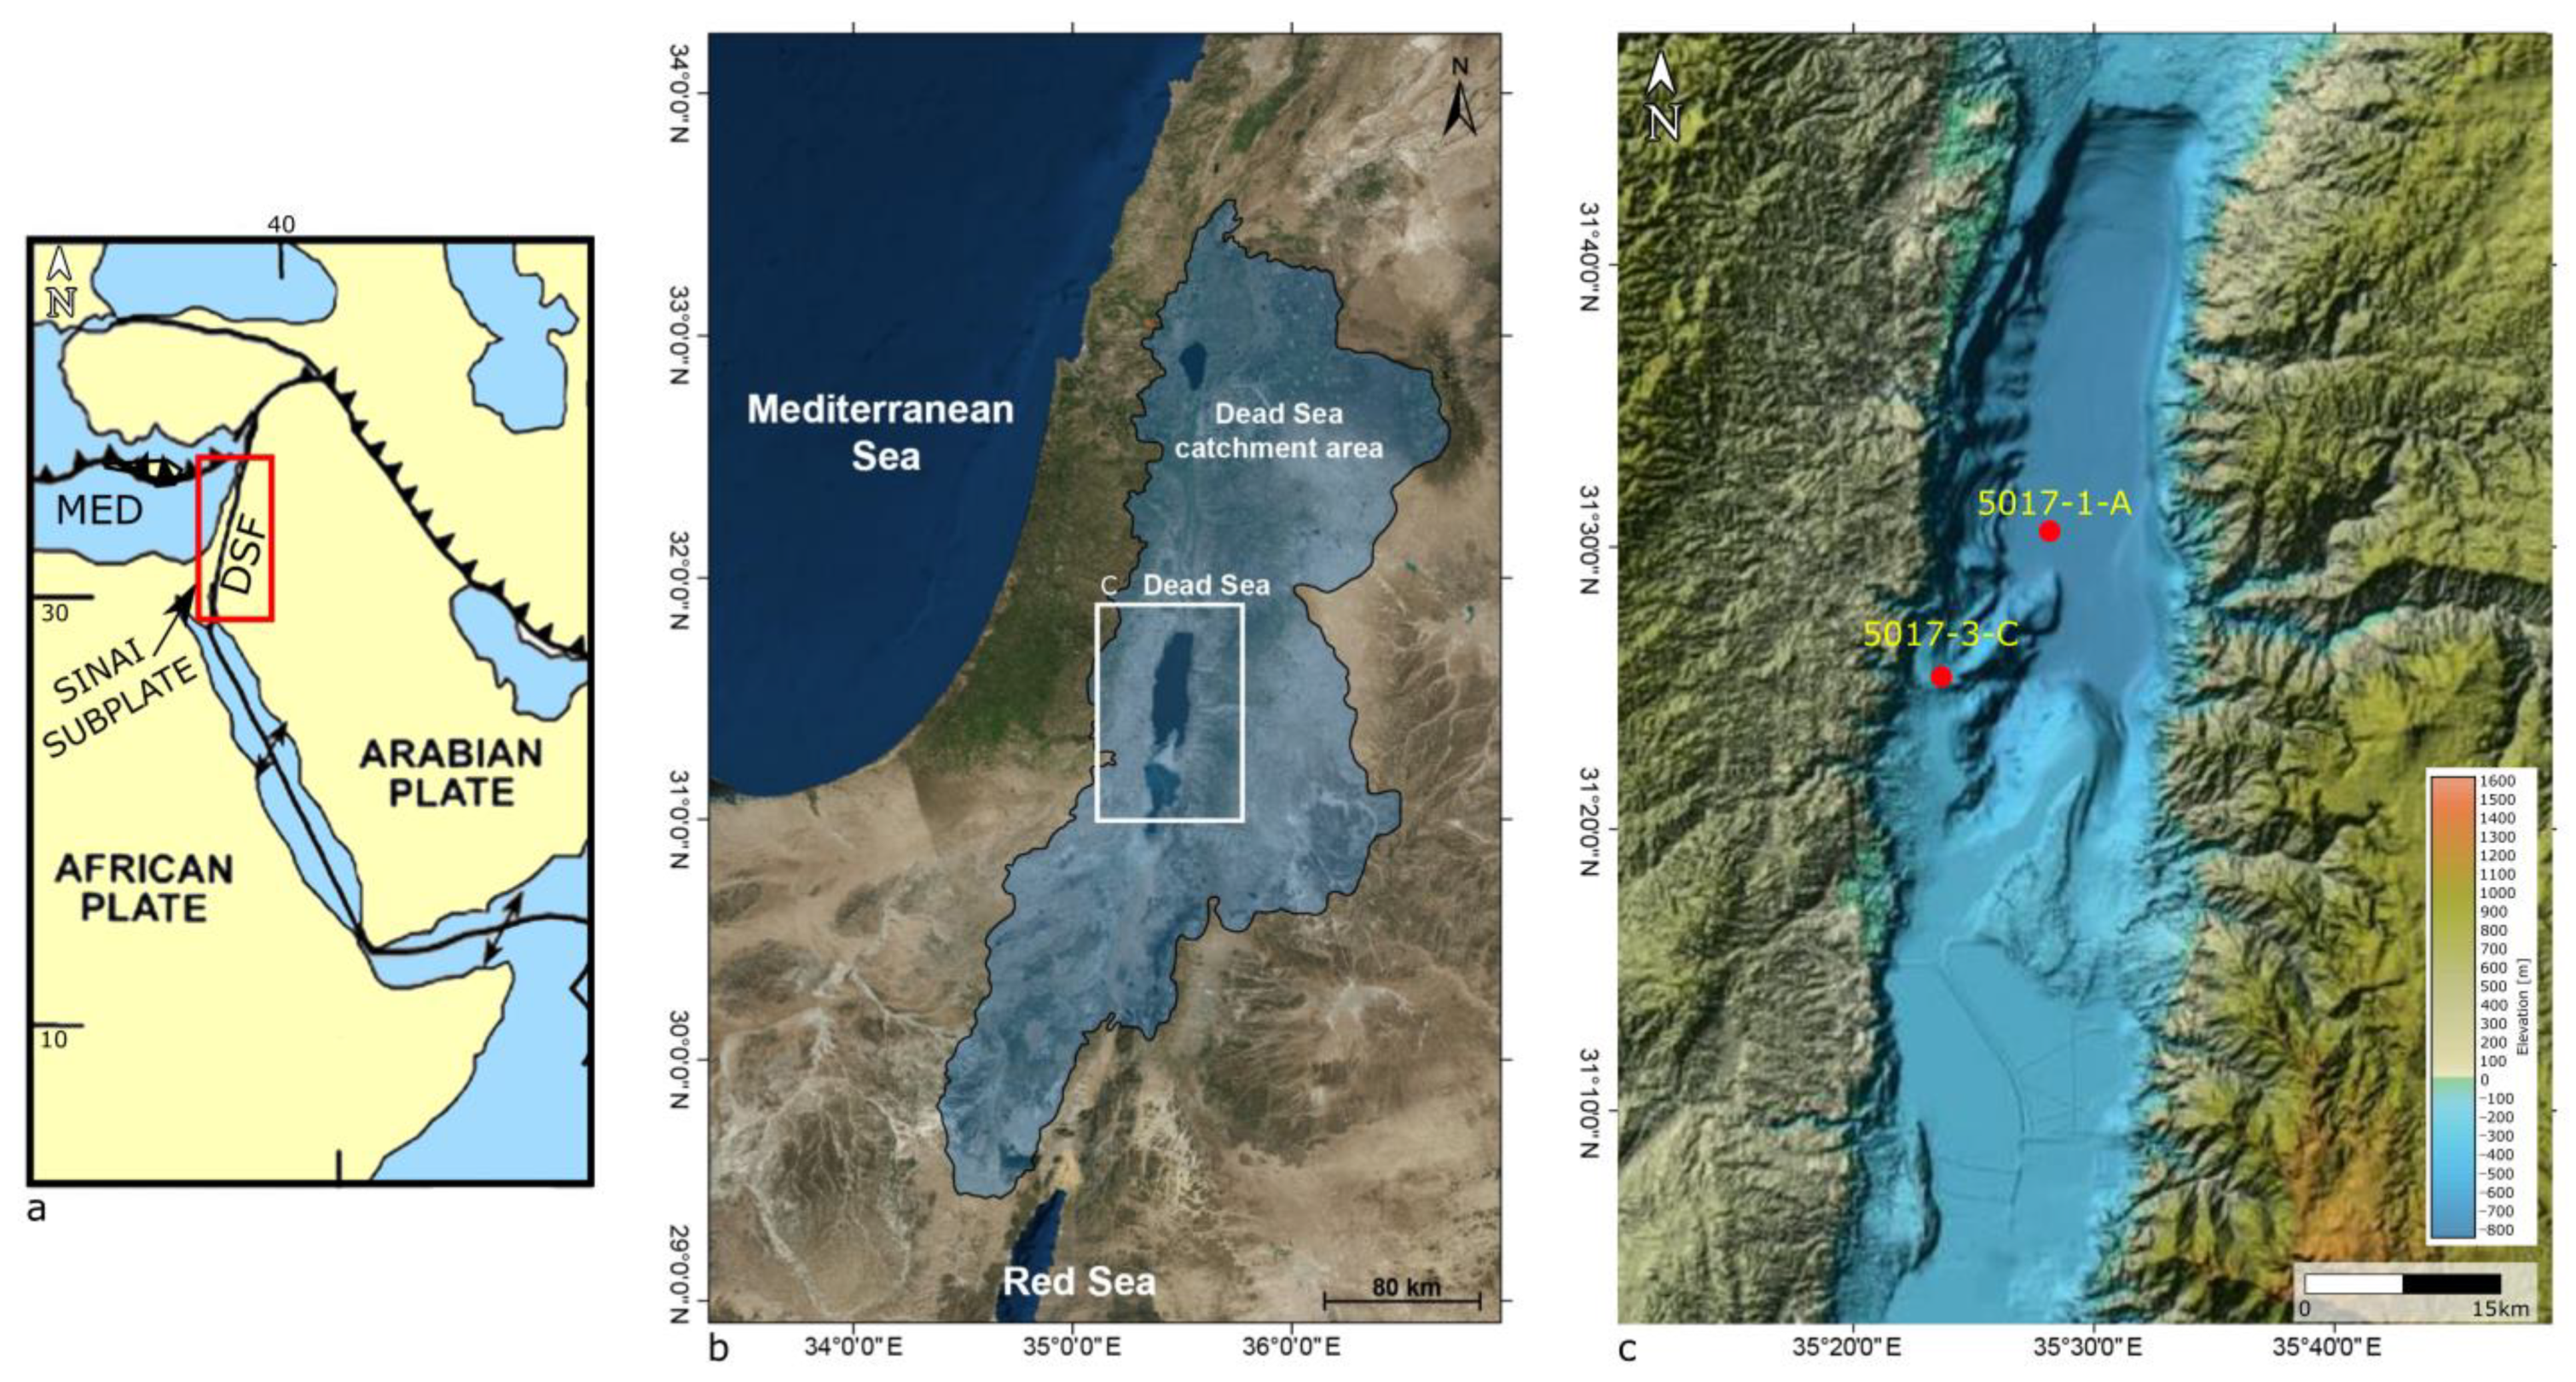
2. Geological Background

The Dead Sea is an active pull-apart basin influenced by subsidence [11,12] and localized salt tectonics [13,14,15]. It is 15–17 km wide with a total overall length of around 150 km and is divided into a northern sub-basin covered by a lake (known simply as the Dead Sea) and a southern one occupied by industrial evaporation ponds. Currently, its waters lie at around 438 m below mean sea level (bmsl). Since the lake is terminal, it acts as a trap for sediments from a large watershed extending from Mt. Hermon in the north to the Gulf of Eilat (Aqaba) in the south (Figure 1a). As such, its sediments have been used to reconstruct paleoclimatic conditions in the eastern Mediterranean region during the late Quaternary (e.g., [16,17,18,19] and references therein). Sedimentary depositional cycles have been correlated to glacial and interglacial cycles as well as centennial to millennial climatic oscillations (e.g., [20,21,22,23,24,25]. A complete reconstruction of the lithostratigraphic framework of the lake for the last ~250,000 years was carried out on sediments from a series of International Continental Drilling Program (ICDP) cores extracted from the deep northern sub-basin in 2010 and from the shallow lake shoulder in 2011 (Figure 1b; [26,27,28,29,30]).
The sedimentary record of the Dead Sea has also been used to reconstruct lake level curves going back at least 70,000 years in extremely high resolution (e.g., [31,32]. Over the last 10,000 years, lake levels have been extremely erratic, fluctuating between −370 mbsl and >−430 mbsl [21,32,33]. Sediments from this period are characterized by brown and white laminations, with the former indicating detrital material brought during wet periods of floods and the latter—summer evaporation. During particularly low lake stands (<400 mbsl), the northern basin becomes detached from the southern one due to a structural sill, and halite precipitates from the water column, forming layers of rock salt on the lake floor. These thick intervals of halite rocks and lacustrine to fluvial facies reflect a semi-arid environment ([24,34] and contain a fair amount of gypsum crystals [34]. Primary aragonite is also abundant during the last ~3000 ka [33,35].
Today, the Dead Sea is a hypersaline lake whose level is dropping at an alarming rate of over 1 m/yr. This is the result of both natural evaporation and anthropogenic interference (e.g., diversion of river input and pumping of water from the lake for industry). Since the water of the lake is oversaturated with respect to halite, this mineral is actively being precipitated out of the water column, leading to salt accumulation on the lake floor. As the lake retreats, it often leaves behind a crystalline salt crust that covers recently exposed areas (Figure 2). This crust is slowly dissolved and weathered away by dissolution (rain and runoff) and other erosive processes. This environment leads to an increased salinity of surficial and subsurface sediments. In addition, a large salt body (composed of sand gravel with intercalated salt and clay sediment) is also present in the shallow subsurface (e.g., [10]). Its dissolution by freshwater is thought to be one of the main causes of sinkhole formation along the western shore of the Dead Sea (e.g., [36]).
The present study uses the terrestrial frequency domain electromagnetic (FDEM) method to discern subsurface properties along the salt-encrusted shore of the Dead Sea. The study area is located just northeast of the Ein Gedi Spa, some 125 m west of the shoreline of the lake at the time of the survey in 2016. The site was the location of the shallow-water International Continental Drilling Program (ICDP) Dead Sea borehole 5017-3-C (Figure 1b and Figure 2; N31°25’22.74”, E35°23’39.58”), which was first described by [29]. A total depth of ~340 m was drilled, with 271 m recovered (~80%). The top 30 m, representing the Holocene Ze’elim formation, accounts for about half of the missing cored lithology. The water depth at the time of drilling in 2011 was 2.1 m. However, by the time of the FDEM survey in 2016, lake levels had receded by over 5 m, exposing the iron drill pipe, the top 21 m of which were left inside the hole. At the time of the survey, the area was covered by a thick layer of salt, which still had not dissolved due to weathering, rain, and runoff (Figure 2).

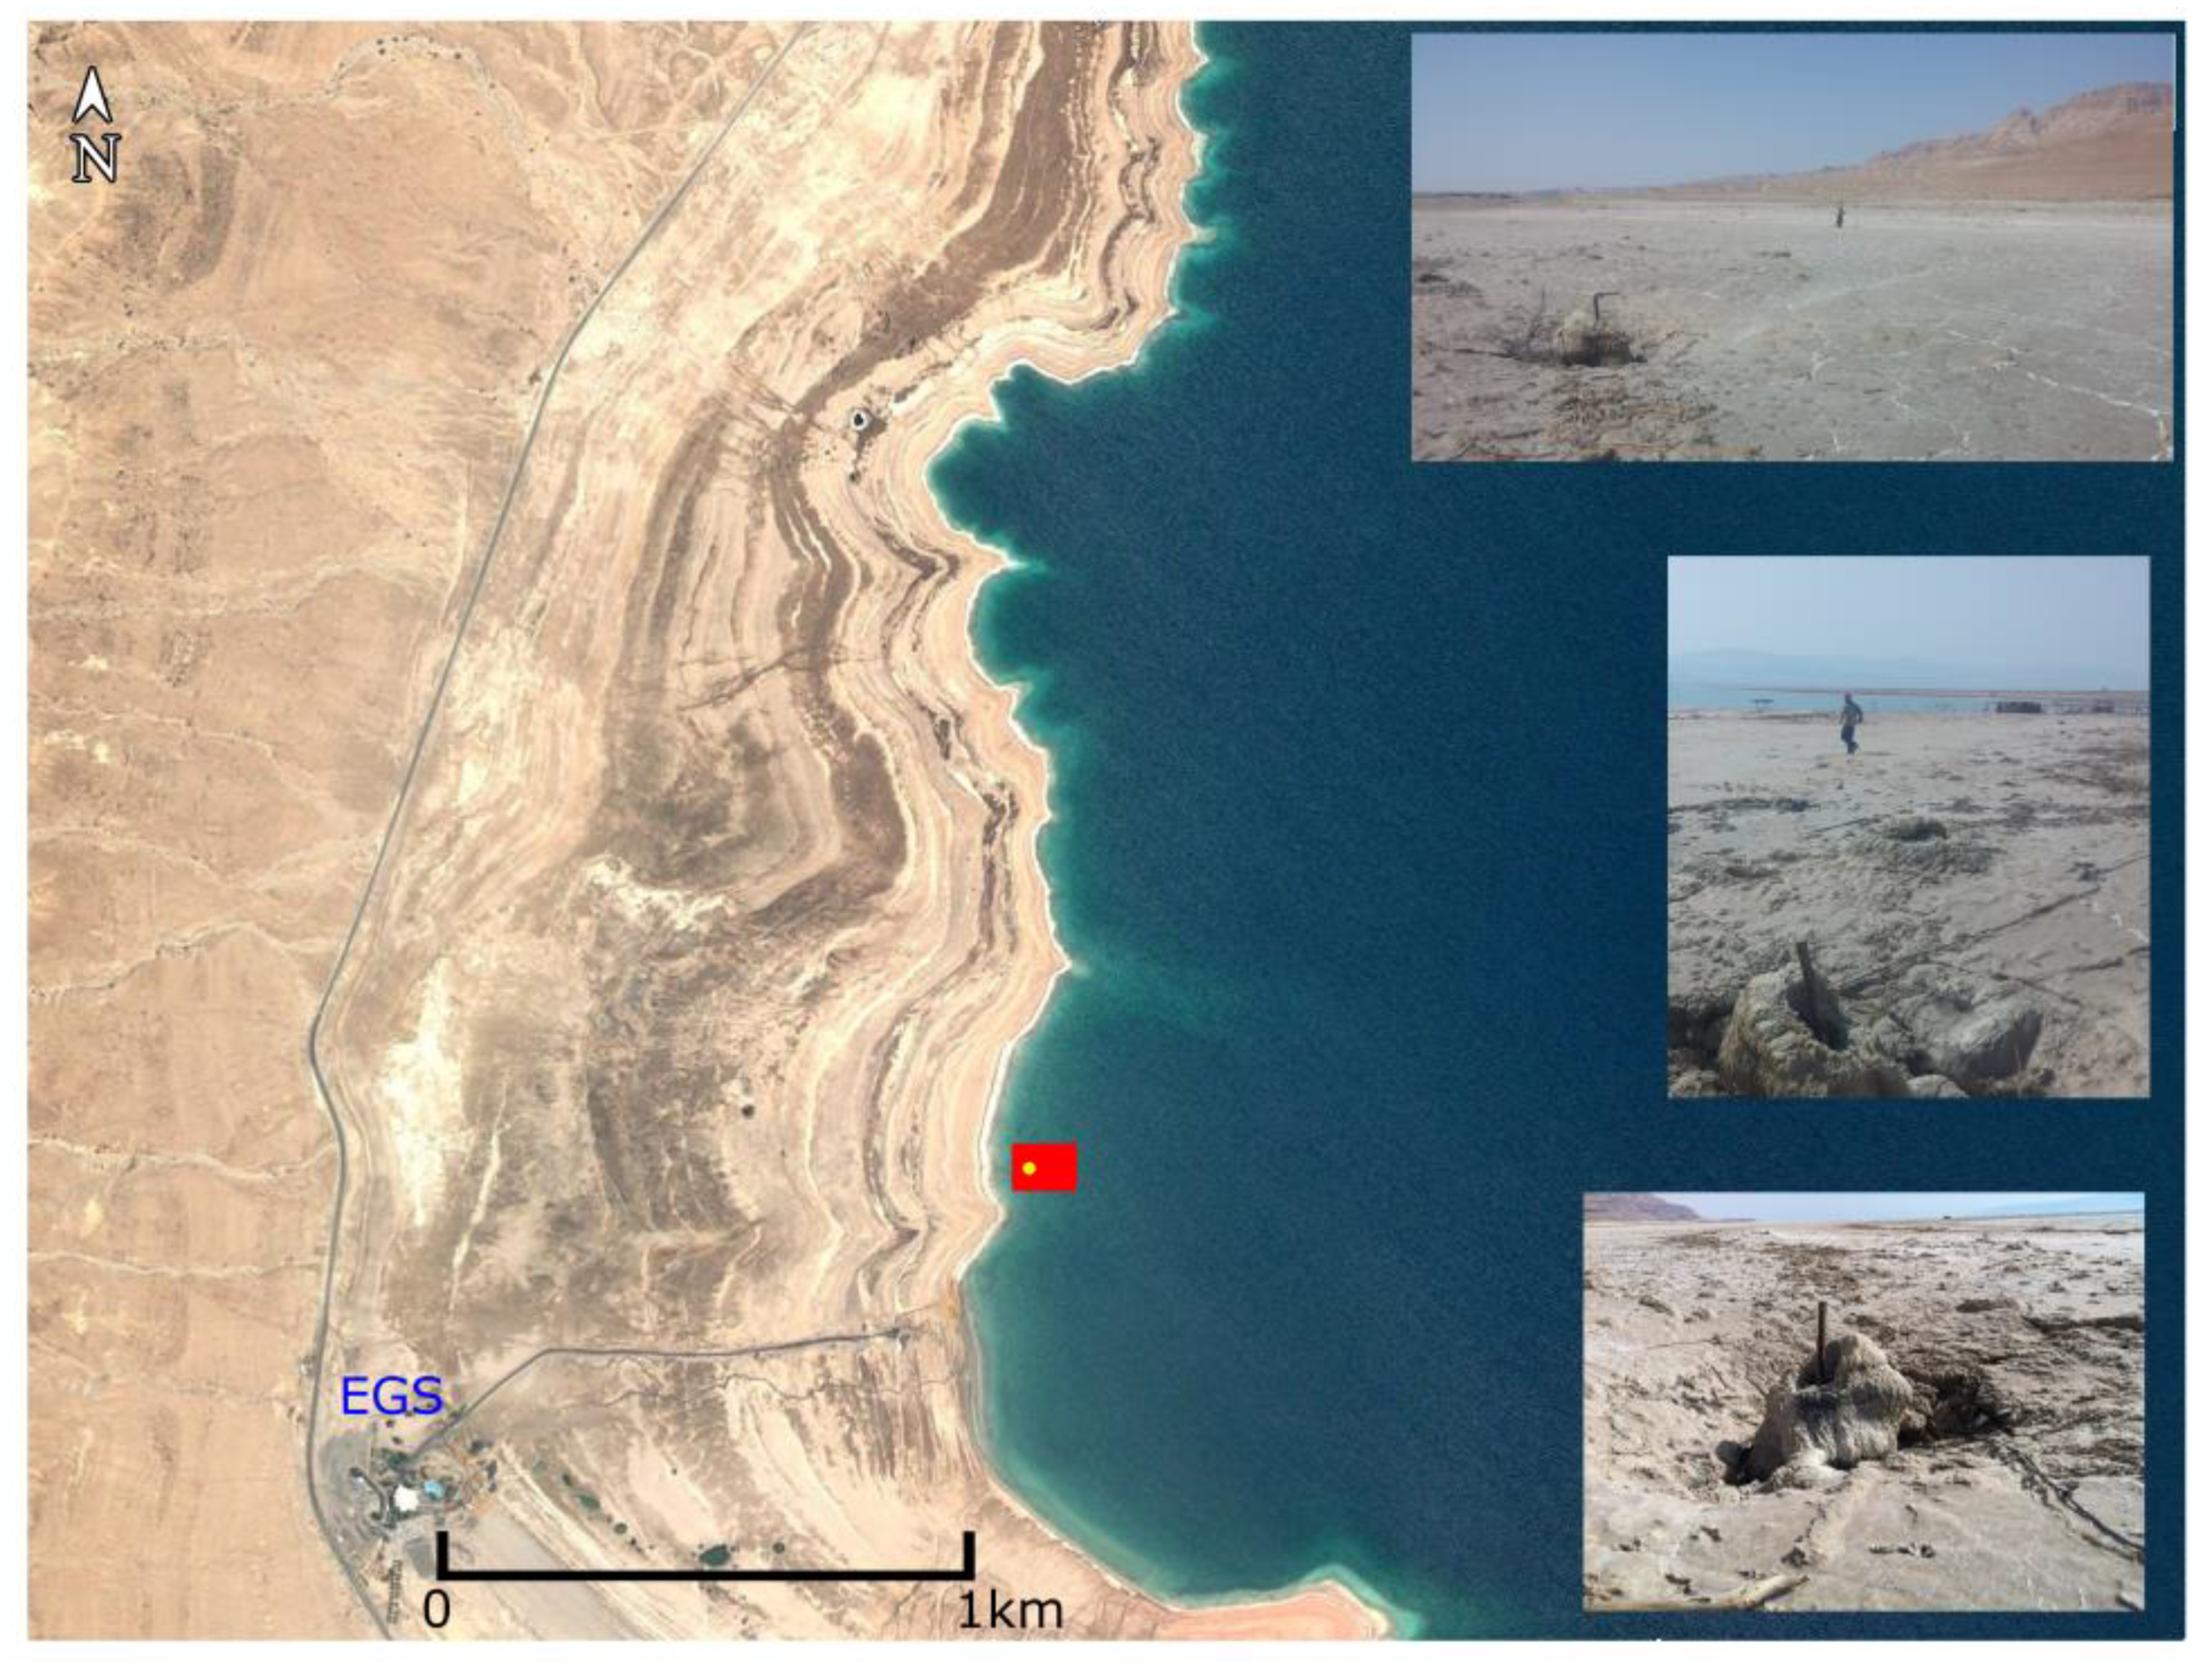
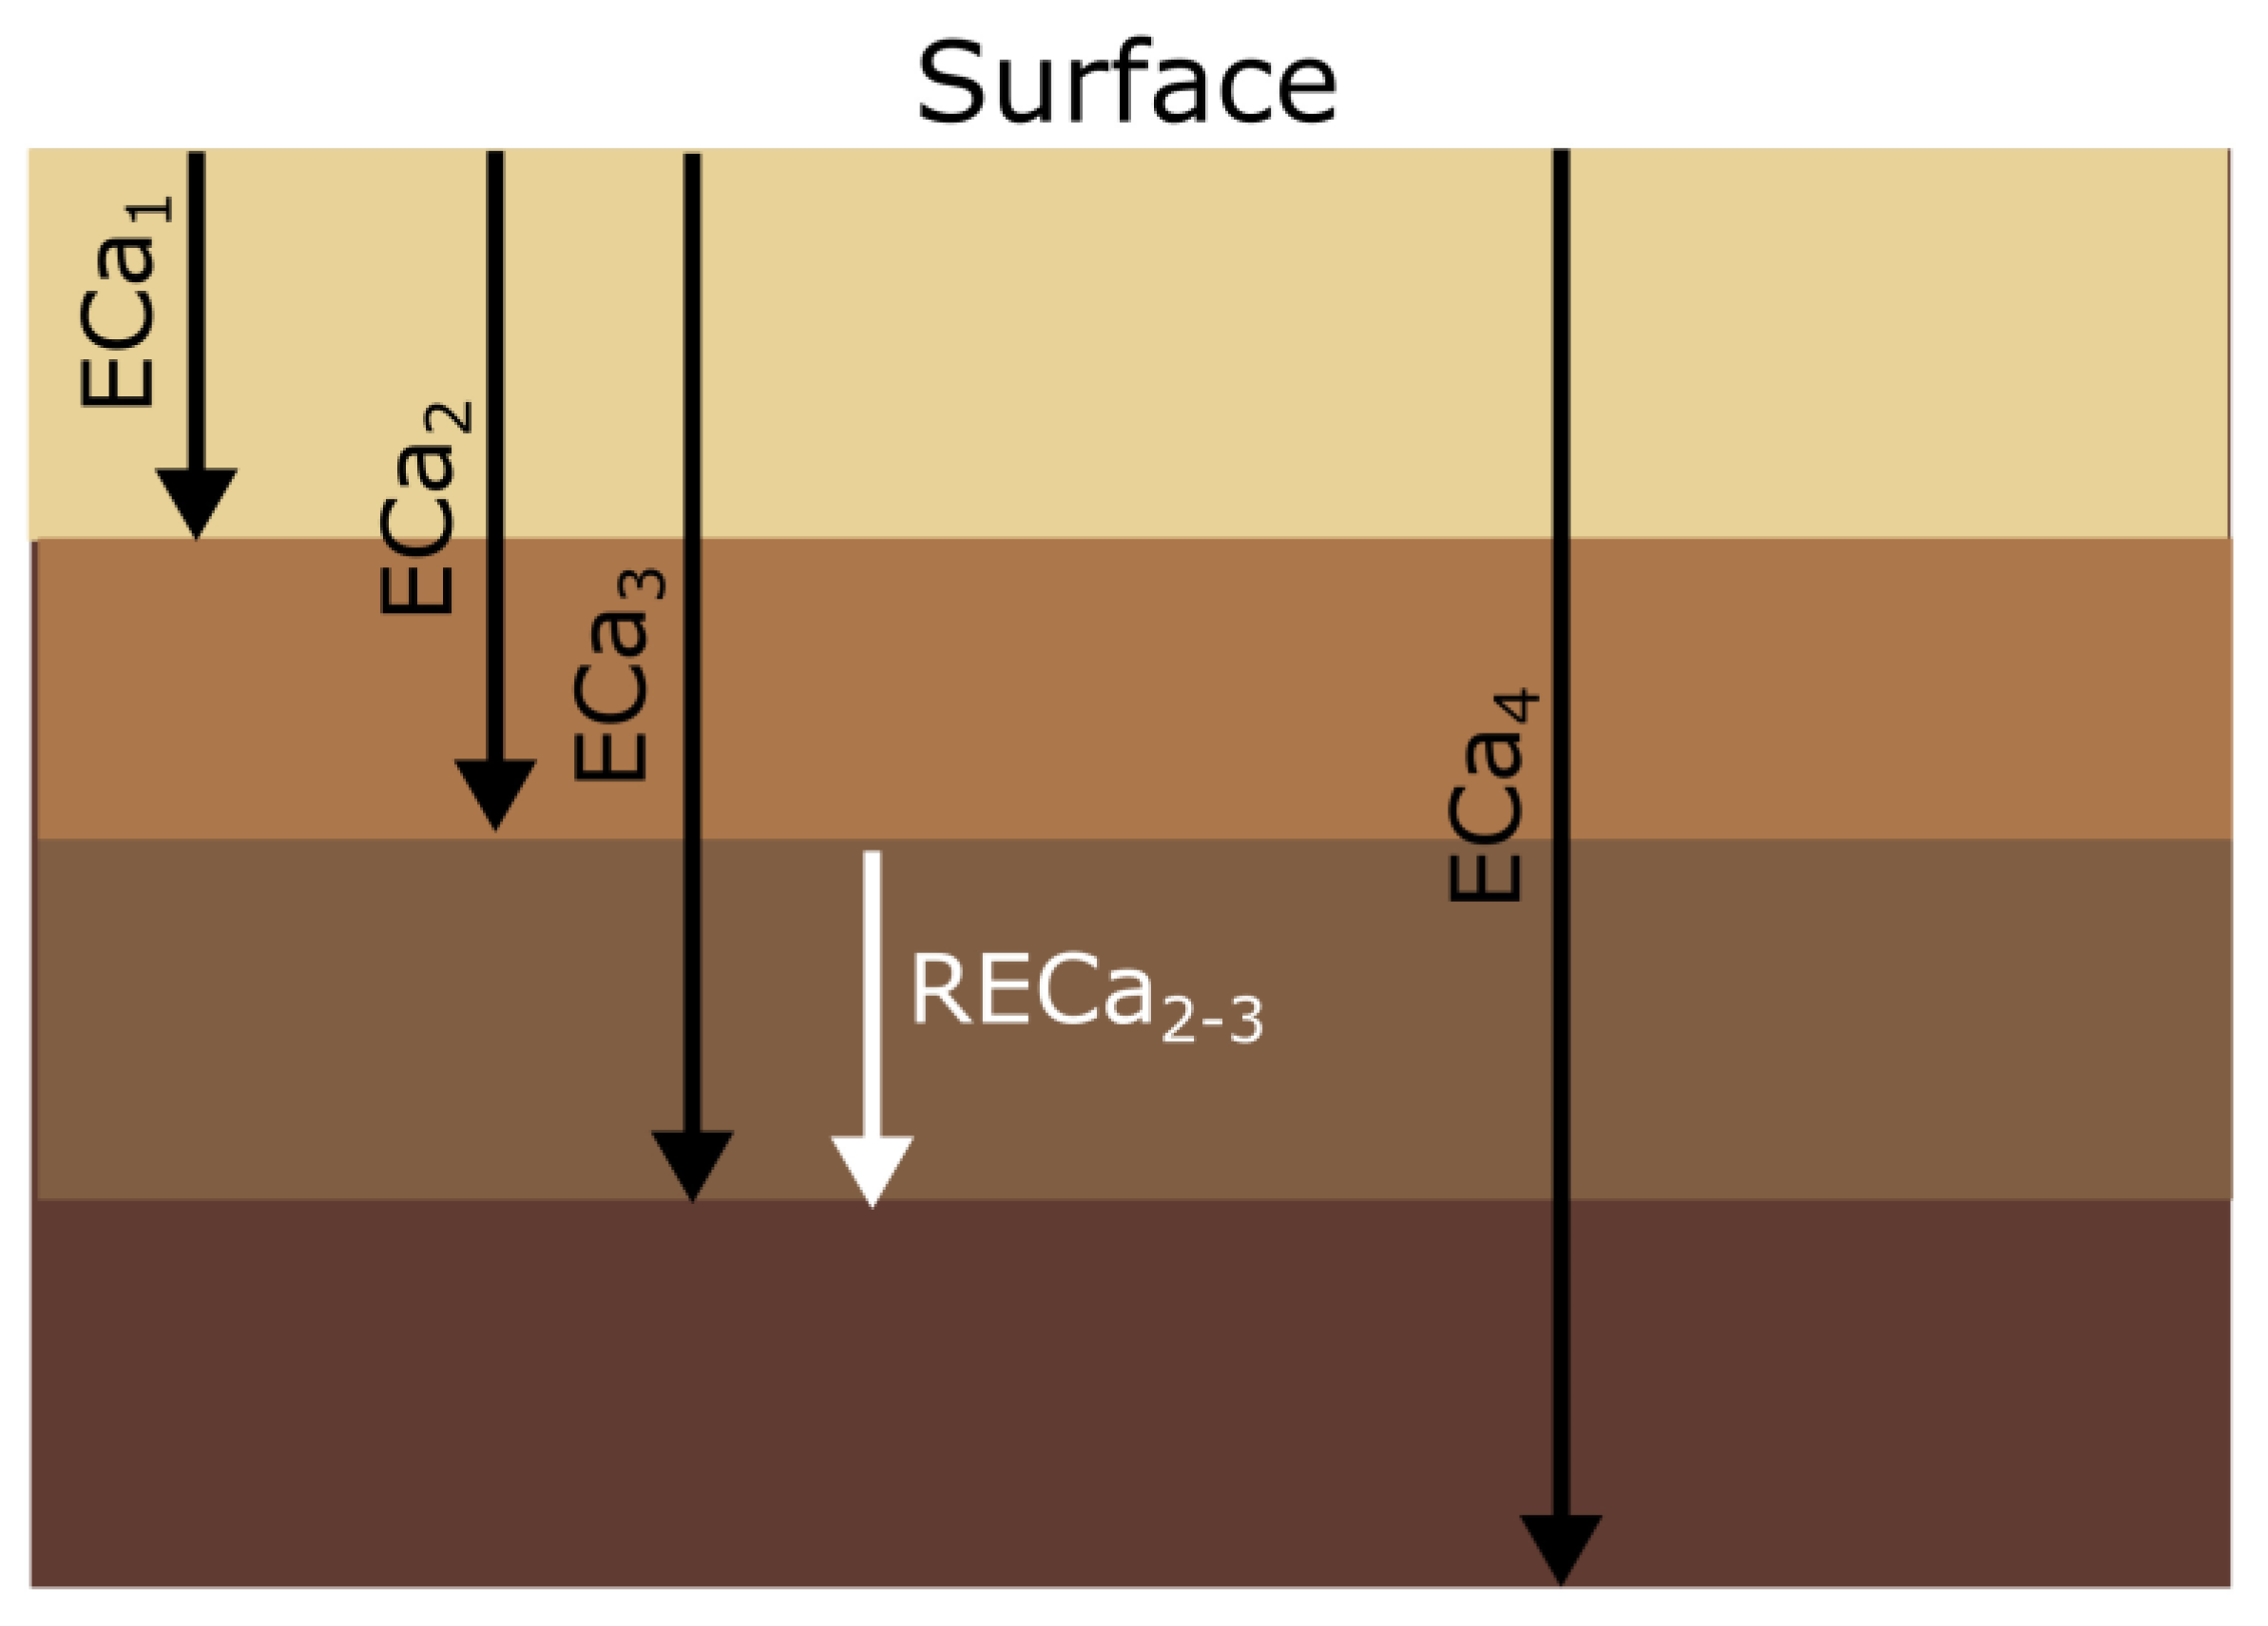
3. Materials and Methods
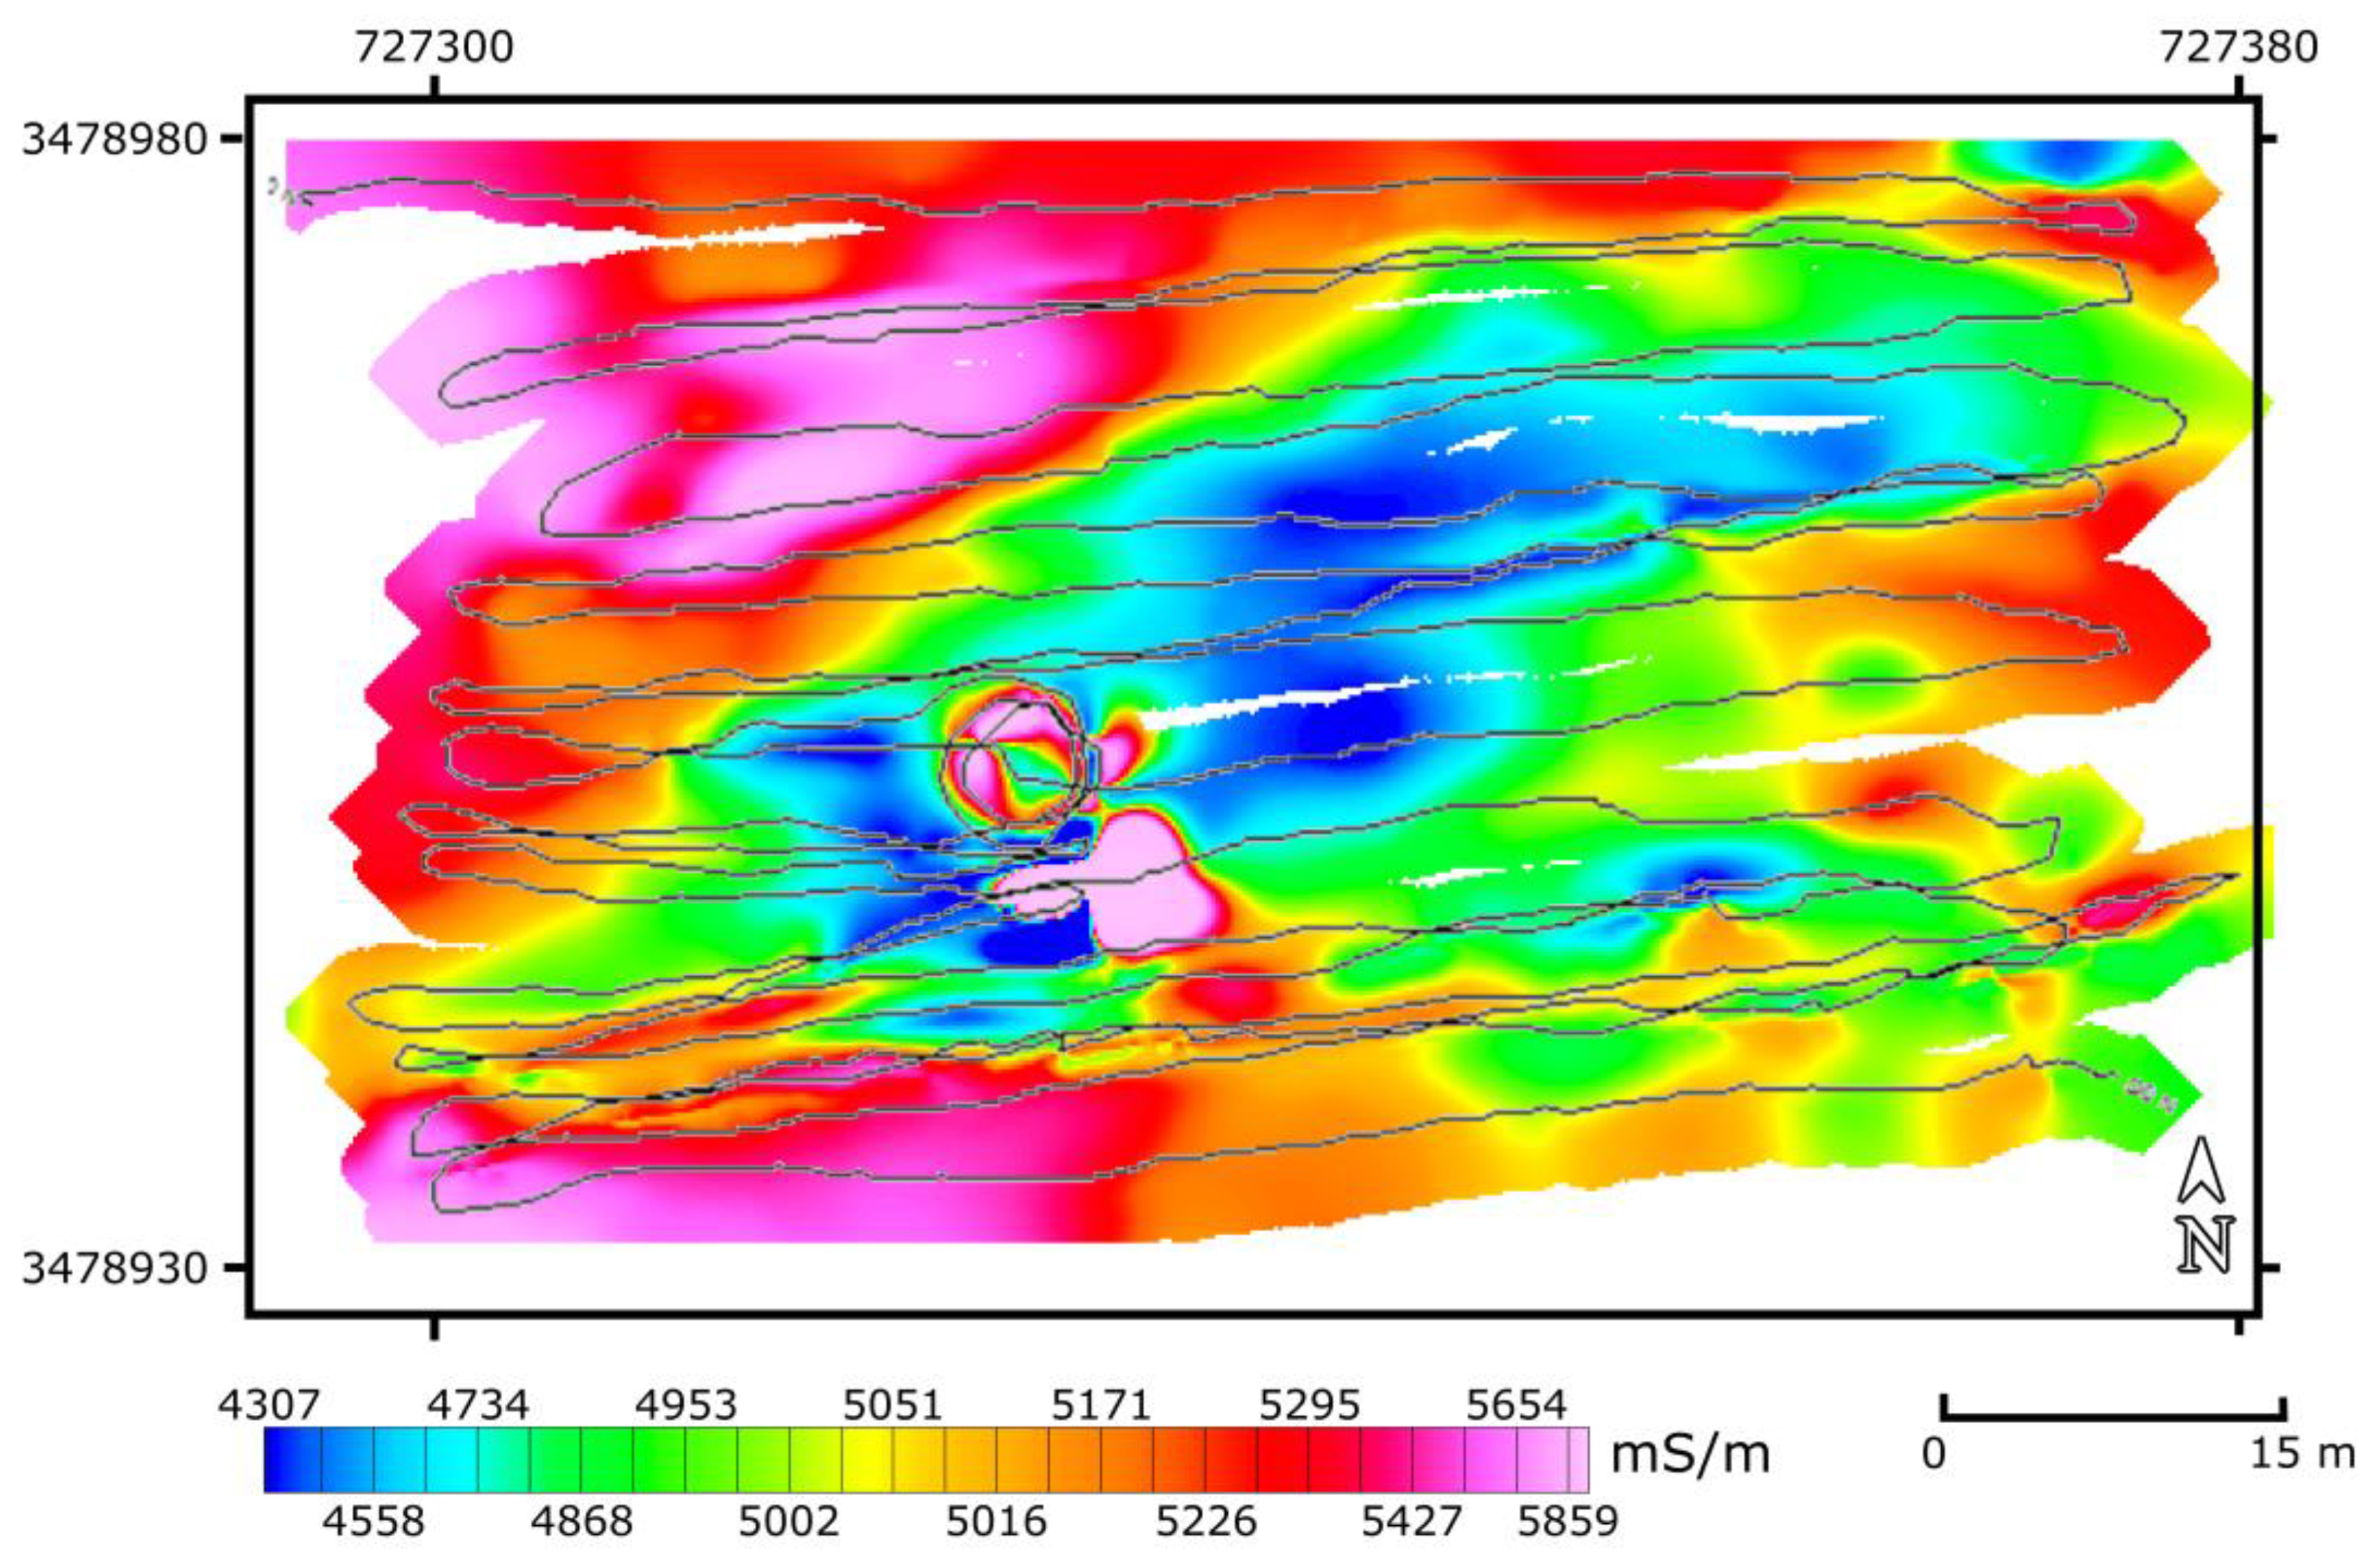
Due to the thick layer of rock salt mentioned above, more conventional high-resolution geophysical methods, such as GPR, were considered inappropriate. Any electrical method that would involve sticking electrodes into the ground would be nearly impossible due to the hardness of the salt-covered surface. Other methods, such as seismic reflection, suffer from poor vertical and spatial resolution. For these reasons and for its relative ease of use, FDEM was chosen. Moreover, the FDEM method has already been proven to work in environments with saline water on the surface and in the near-subsurface (e.g., [37,38]). However, this is still a complex setting for electromagnetic studies due to its proximity to the hypersaline waters of the Dead Sea coupled with a lithology that is highly affected by runoff, groundwater, and alluvial and tectonic processes.
An area of 50 × 75 m around the 2011 ICDP 5017-3-C borehole was chosen for the FDEM survey. A Geophex GEM-2 sensor with a scanning depth down to 6–10 m and the ability to record 10 frequencies between 25 Hz and 96 kHz (e.g., [39,40]) was used. Coil spacing is permanent and set at 1.66 m.
A total of 20 SW-NE trending lines were collected with an average spacing of 2 m between them. The sensor was held at a constant height of 1 m above the ground and used in horizontal mode. The FDEM method involves the formation of an oscillating magnetic field at the transmitter, which induces eddy currents within the Earth’s subsurface. These currents generate a secondary magnetic field, principally influenced by the target’s conductivity and the frequency of the alternating field. The sensor detects the quadrature (Q) and in-phase (I) components of this secondary field, representing the phase difference and alignment with the primary field, respectively. Utilizing multiple (n) frequencies simultaneously, the system enables measurement of Q1… Qn and I1… In. Through data transformation, apparent electrical conductivity (ECa) and apparent magnetic susceptibility (MSa) are derived, providing insights into subsurface properties [41]. ECa and MSa are instrument-specific (hence “apparent”) and influenced by coil spacing, which is constant. Contrasts in ECa signify variations in subsurface characteristics such as clay content, mineralogy, and moisture [42]. In general, an increase in salinity corresponds to higher conductivity and lower resistivity.
Simultaneously transmitting multiple frequencies allows for data collection from various depths, given that lower frequencies penetrate deeper into the subsurface compared to higher ones. Consequently, the outcome comprises a sequence of relative frequency interval slices, reflecting the integration of all subsurface data within a particular sampled volume (i.e., extending down to frequency-related depths).
The depth of investigation refers to the maximum depth at which the FDEM system can detect a half-space subsurface at a specific frequency. The frequency at which the electromagnetic response of a subsurface feature or irregularity can initially be observed is mainly influenced by its depth and the electromagnetic characteristics of the overlying strata. This determination is relatively unaffected by the source or receiver type or the distance between them. The depth of investigation relies on the physical properties of the subsurface and is primarily determined by the skin depth (δ; [41,43])—the distance within a half-space at which a plane wave’s amplitude is reduced to 1/e (37%) of its surface value [43]. This is a function of the angular frequency of the plane wave (ω), the electrical conductivity (σ), and the magnetic permeability (μ) of the medium. However, according to [43,44,45,46], the practical/effective depth of penetration, which is empirical, can be expressed as:
D ≈ 1.5 δ = 750 (1/(σf)),
where f represents the frequency of the wave transmitted by the FDEM system.
Since the shore of the Dead Sea is a hypersaline environment, the “low induction number” assumption is not valid. The induction number is the ratio of the separation between the instrument’s coils, in this case, 1.66 m, and the skin depth δ. For low induction numbers, the effective depth of penetration is independent of ECa. However, as true conductivity increases, as a function of salinity, for example, the skin depth decreases, causing the induction number to rise. According to theory, in conditions of high conductivity, the quadrature response is no longer linearly proportional to the true conductivity. The apparent electrical conductivity (ECa) becomes biased, underestimating the true conductivity for a given frequency and intercoil spacing [47]. This can lead to a potential risk of spatially distorted data in environments with high conductivity [48]. However, studies have suggested multifrequency electromagnetic sensors are useful for depth sounding in such environments (and, hence, in the Dead Sea) due to their ability to gather frequency-dependent electromagnetic data at relatively high induction numbers [49]. Collecting multifrequency data at high induction levels allows for the mapping of variations in conductivity with depth, as described by [50]. In such cases, inversion of the data is usually achieved through the solution of Maxwell’s equations (e.g., [51]). According to [52] the low induction number approximation may be used in highly conductive areas. However, the data needs to be corrected for comparison with true conductivity. In addition, various authors concluded that electromagnetic induction surveys are viable for subsurface examination under highly saline conditions [40,50] and deduced this for the small sensor configuration of the GEM-2 used in this study, which was verified and validated by [37,38].
For this study, six frequencies were selected, corresponding to the effective penetration depths listed in Table 1. These were chosen partially based on assumptions made about the subsurface geology from previous studies conducted nearby (e.g., [33]). However, since the study area is located at the edge of an alluvial fan, it is difficult to compare the shallow lithology with previous work. Therefore, a range is provided for the effective depth of penetration.
Processing was carried out using Version 9.8 of the Oasis Montaj (Seequent-Bentley) software package. Initially, raw data were examined manually (statistical mean and standard deviation for each frequency), and extreme outliers were deleted. A non-linear filter was applied to remove additional random/ambient noise and spikes. High salinity leads to greater attenuation of electromagnetic waves due to the fact that conductive materials dissipate more energy. This can cause a reduction in the amplitude of the received signal, making it harder to detect and accurately sample, thus increasing the risk of aliasing. Therefore, data were gridded using the Minimum Curvature method, which is good at reducing aliasing. However, due to the extremely high conductive nature of the area, some aliasing and oversaturation may still remain.
Relative frequency interval slice maps were created using a program written in-house (and after the application of the non-linear filter to remove spikes), using a normalized weighted algorithm of the frequency interval for every two consecutive frequencies. The result is a series of relative ECa maps (RECa) that contain the integration of all electrical conductivity between two different frequencies (i.e., depths) in the subsurface (Figure 3; Table 2), where negative values represent an increase in conductivity between the top and bottom volumes and a positive number—a decrease. The sign of the result is similar to what would be achieved by subtracting a layer with low ECa values from a layer with higher ones, although the process applied here is more complicated. The exact algorithm used is the proprietorship of GeoSense Ltd., Netanya, Israel but a more detailed description can be found in [38].

4. Results

Six apparent electrical conductivity maps were produced, each one representing the integration of all conductivity values down to the effective depth penetrated by each one of the six frequencies (see Supplementary Materials). In general, all six frequency maps portray the same image of a SW-NE trending “patch” of low ECa (from ~4350 mS/m in the example given in Figure 4) that is distinctly different from its surroundings. To the northwest and southeast of this patch, high values of ECa (5800 mS/m and above) are reached. In each map, the steel drilling pipe is evident by a circular anomaly of high ECa, although the regional influence of this feature on the data was removed during processing. The remaining effect of this pipe is so strong in the first frequency interval (57,225 Hz corresponding to the integration of all electrical conductivities from the surface down to a depth of 1.7–2.6 m) that it saturates its surroundings and appears as a large patch of high conductivity. A consistent, high conductivity anomaly lies to the north of the drill pipe. A number of prominent linear features are also visible in the data (Figure 4). For all frequencies, these linear features have relatively low ECa values compared to their surroundings.
Results of the relative frequency interval slice maps (RECa) portray a similar SW-NE trending path at all frequency (or depth) intervals (Figure 5a). However, the trend here is somewhat strange. The RECa map of the deepest layers (825–1925 Hz and 1925–4425 Hz) exhibits the opposite trend to that observed above—i.e., the SW-NE trending patch is of higher ECa than its surroundings. Excluding extreme values near the steel pipe, these range from −340 mS/m to 360 mS/m and −1360 mS/m to 450 mS/m, respectively. This changes in the section above (4425–10,425 Hz) with the patch becoming less conductive (minimum of −83 mS/m) than its surroundings (maximum 3500 mS/m). In the next section (10,425–24,425 Hz), the center of the patch has low conductivity, while the rest of it is high. Outside of the patch, conductivities decrease. However, excluding the borehole, the range of change is relatively narrow (1820–2520 mS/m). The second to shallowest layer (24,425–57,225 Hz) shows a low conductivity patch with high conductivities outside it. Again, the range of change is narrow (−630 to −70 mS/m). Finally, in the shallowest section (57,225 Hz—i.e., from the surface down to the equivalent depth of penetration for this frequency), the patch is diffuse and less focused. However, it is still characterized by low conductivities, which become higher around the borehole and directly outside of it. Excluding the borehole, conductivities are relatively uniform, changing from 2295 mS/m to 2410 mS/m. This is clearly visible on the RECa maps displayed with a normalized multi-channel distribution scale (Figure 5a). It should be noted that the shallowest section is not shown since, on a normalized scale, it is a solid block of meaningless color.

5. Discussion

Since actual sedimentary data is missing from the top 30 m of the ICDP borehole due to incomplete recovery during coring, additional proxies are needed in order to interpret the FDEM results in terms of geological meaning and to discern the shallow subsurface lithology. During March 2011, a set of wire-logging measurements were collected by the ICDP Operational Support Group (OSG) in the near-shore 5017-3-C borehole, which was, at the time, in shallow water. Available well logs for the top section, which still contained the drill pipe, consist of master gamma ray (GR) and spectral GR with potassium (K), uranium (U), and thorium (Th). Chart-based corrections for casing effects were performed for K, U, and Th. Logs were depth corrected, and data were processed at the GeoForschungsZentrum (GFZ) Potsdam, Germany, by the OSG team.
In general, the high potassium content of clays leads to high GR values. Wet clay is not very conductive. Low or zero GR values are associated with quartz-dominated rocks such as carbonates and sandstones. Conductivity (and resistivity) is a function of salinity (moist-wet) as well as the porosity of the surrounding rock. For all lithologies, it has been shown that resistivity decreases and conductivity increases with increasing salt content (e.g., [53]). In addition, rock salt is nonporous (non-moist) and, therefore, should exhibit both low GR and EC values.
A number of studies have shown a clear relationship between GR and conductivity/resistivity, at least in the overall trends of the measurements. Ref. [54] attributed the positive correlation between GR and ECa to changing clay content, although both fluctuate similarly in response to the presence of sand as well. Ref. [55] used GR combined with electrical resistivity (the reciprocal of electrical conductivity) to improve the resolution of the detection of thin coal seams. Ref. [56] used the same combination to infer missing lithology, in this case, basalt layers, from cores extracted from beneath the seafloor. While the correlation between the two parameters is not always straightforward, the above-mentioned studies show that it is applicable in many areas. In the present study, GR values are used to discern the subsurface lithology, while the ECa results provide more regional context.
In the Dead Sea, ref. [29] set specific criteria for lithological interpretation of GR data from the upper 56 m of the deep ICDP 5017-1-A borehole (see Figure 1c for location). These were applied here and defined as >20 gAPI mudstones interbedded siltstones/sandstones; 10–20 gAPI medium to thick-bedded mudstone to sandstones mixed with evaporites; <10 API evaporites. Analysis of the GR logging data based on the cutoff values mentioned above (Figure 5b) shows that the top 10 m of the borehole can be divided into three distinct layers: 0–2.5 m (GR < 10 gAPI), 2.6–7 m (GR = 10–20 gAPI) and 7.1–10 m (GR > 20 gAPI). Combining these results with the FDEM RECa Maps (Figure 5a), a clearer picture emerges.
From top to bottom, the low conductivities observed in the first two RECa maps (57,225 Hz and 24,425–57,225 Hz) combined with the low GR values of less than 10 gAPI are indicative of evaporites. This is consistent with the observation of a solid (but wet and thus slightly conductive) layer of salt on the surface of the study area (Figure 2). The next two RECa maps (10,425–24,425 Hz and 4424–10,425 Hz) both show a general trend of increased conductivity. According to GR values attributed to the effective depths of penetration for these frequencies, the lithology is composed of medium to thick-bedded mudstone to sandstone mixed with evaporites. The evaporitic content, suspected to be halite, would explain the increase in RECa values, especially if it was present in the form of brine. The final two RECa (1925–4425 Hz and 825–1925 Hz) show a return to lower conductivity as the GR rises above 20 gAPI, indicating sand/siltstone, i.e., smaller, clay-like grain sizes. The presence of a significant change at ~6.8 m is also evident on the Th/K ration plot (Figure 5c), which has been used in other studies as an indicator of sedimentary unconformities (e.g., [57]). This is due to the fact that sudden changes in the ratio represent a variation in radioactive mineral content and thus reflect abrupt changes in the depositional environment, such as unconformities [58].
The SW-NE trending patch consistently has a lower conductivity than its surroundings when viewed on a normalized distribution scale. Together with the linear features, the impression is that of a focused wet patch due to a fault. If connected to the deeper subsurface, it could act as a conduit for fresh(er) water intrusion from below, whose source would be the regional aquifer (e.g., [59] and references therein). The lower values of ECa are consistent with lower salinities of groundwater. Extraction of the ICDP core could have facilitated this process by helping to fracture an already unstable subsurface and by releasing pressure in the sediments, thus allowing the flow of pore water from nearby formations towards the borehole. Another indication of this is the collapse of the area immediately surrounding the borehole into a mini “sinkhole” once again demonstrating the instability of the subsurface due to the extraction of the core (Figure 2).
It is interesting to note that since the geophysical survey in 2016, a sinkhole area has opened up some 500 m to the northwest of the ICDP borehole. Sinkholes are thought to form as a result of the dissolution of a buried salt layer by freshwater as the fresh/saline water interface migrates lakewards due to dropping lake levels. Even more to the point is that according to the geological Survey of Israel’s online Sinkholes and Subsidence Monitoring of the Dead Sea (https://egozi.gsi.gov.il/WebApps/hazards/sinkholes_subsidence/ accessed on 24 April 2024), the “mini sinkhole” seen surrounding the borehole continued to develop into a small yet significant sinkhole with subsidence of the surrounding area (Figure 6a) sometime between January and February 2019. This further strengthens our findings, especially the ability of the FDEM to obtain meaningful results from high-inductive number areas such as hypersaline environments. In addition, while previous studies based on high-resolution geophysical surveying in the Dead Sea have proposed that sinkholes develop along the edge of the buried subsurface salt layer [8], this new sinkhole does not correspond to the proposed salt edge and is, in fact, located at some distance to the east of it. As can be seen in Figure 6a, it is isolated and located far from the main developing area. It would seem that drilling operations of the 5017-3-C borehole and the extraction of the ~270 m long sediment core destabilized the subsurface in an already unstable area susceptible to subsurface cavity formation, leading to the development of this sinkhole.
In the context of local geology and tectonics (Figure 6b), the study area seems to lie just to the north of an area with small right lateral strike-slip faults, with the same trend as the SW-NE aligned patch in the FDEM data [60]. It also seems to be aligned with the direction of the northern flank of the Ein Gedi diapir as it appears in the bathymetry and a cluster of micro-earthquakes mapped by [61]. The presence of natural springs in the area (the Ein Gedi oasis located some 3 km to the north and the Ein Gedi spa ~1.3 km to the west) strengthens the argument for fault-related groundwater flow in the area.
On a more regional scale, it should be noted that the trend of large-scale transverse faults in the lake is NW-SE. i.e., opposite to the direction of these features (e.g., [61,62]). One possibility is that these could represent localized faults that formed as a result of salt tectonics (i.e., uplift of the Ein Gedi diapir; [15]). Another option may be related to displacements along the major N-S trending branches of the Dead Sea fault in the area, which create a zigzag pattern of minor normal faults aligned also in ESE and WNW directions (e.g., [63]). Further to the south, [64] suggested that the displacement between two N-S trending stepped strike-slip faults is transferred by extension associated with E-W trending normal faults. This is similar to what was suggested by [65] for the formation of faults within the Ghor Al Haditha sinkhole area, southern Dead Sea, Jordan (Figure 6). It would seem that the development of sinkholes in the southern Dead Sea area, both on the west side and the east side of the basin, is related to minor E-W trending faults that form along tension cracks between two strike-slip faults.
Figure 6. (a) The study area shows the location of sinkholes (black) with surrounding subsidence (red) from the GSI database as of April 2024. The location of the 5017-3-C borehole is marked, and green arrows point to its location in other images. (b) The southward continuation of the study area shows the extent of nearby sinkholes and their NW-SE and ENE-WSW orientations. See (d) for the location. (c) A sinkhole area further to the south shows their extent and E-W orientations. See (d) for the location. (d) Combined digital terrain and multibeam bathymetry map showing the southern half of the northern Dead Sea basin. The study area is marked by a green circle. Yellow circles show the location of micro-earthquakes mapped by [61]. The red arrows are right-lateral strike-slip faults after [60]. Black and red polygons on the western shore mark sinkholes with subsidence. EGD—Ein Gedi diapir. A dashed yellow ellipse is a cluster of micro-earthquakes with a similar trend to other features mentioned in the text. The bottom inset shows tectonic faults (black lines) and proposed minor faults dictating sinkhole development (red lines) on the Jordanian side of the Dead Sea (after [65]) with similar orientations to those observed in this study.
Remotesensing 16 01978 g006
The current study shows that the use of logging data combined with geophysical methods (such as FDEM) is a convenient and pertinent tool for interpreting missing lithostratigraphic data from boreholes, especially in harsh environments. When combined with local/regional geology, it can also provide interesting information on the effect of drilling processes on the surrounding environment.

6. Conclusions

The integration of techniques used in this study provides a reliable way of discerning shallow subsurface geology, even in harsh conditions, in a non-intrusive way. It not only can be used to estimate the lithology by relating changes in apparent conductivity to additional information from the subsurface (such as logging data), but it can also provide insight into the actual geology and tectonics of a study area. In this way, not only the missing upper 10 m of the ICDP 5017-3-C borehole was reconstructed, and the effect of coring on the sedimentary structure below examined, but also a spatial picture of the local geologic and neotectonic setting around the borehole was obtained. While the high conductivity of the subsurface in terrestrial hypersaline environments may lead to oversaturation of the FDEM data in some places, the unique properties of this method allow it to function where other geophysical methods are limited, such as coastal areas and other (hyper)saline environments providing vital information on shallow subsurface geology and tectonics.

Supplementary Materials

The following supporting information can be downloaded at https://www.mdpi.com/article/10.3390/rs16111978/s1, which contains all the apparent electrical conductivity maps produced in this study.

Author Contributions

Conceptualization, M.L. and U.B.; methodology, M.L. and U.B.; software, U.B.; validation, M.L., U.B. and L.C.; formal analysis, M.L., U.B. and L.C.; investigation, L.C.; resources, M.L. and U.B.; writing—original draft preparation, M.L. and L.C.; writing—review and editing, M.L. and U.B.; visualization, M.L. and U.B.; supervision, M.L. and U.B.; funding acquisition, M.L. All authors have read and agreed to the published version of the manuscript.

Funding

This research was funded in part by Israel Science Foundation (ISF), grant number 1736/11 and 1436/14.

Data Availability Statement

The original contributions presented in the study are included in the article, further inquiries can be directed to the corresponding author.

Acknowledgments

This study uses results from the International Continental Scientific Drilling Program (ICDP) Dead Sea deep drilling project.

Conflicts of Interest

Author Uri Basson is CEO of the company GeoSense Ltd. The remaining authors declare that the research was conducted in the absence of any commercial or financial relationships that could be construed as a potential conflict of interest.

References

  1. Choudhury, K.; Saha, D.K. Integrated Geophysical and Chemical Study of Saline Water Intrusion. Groundwater 2004, 42, 671–677. [Google Scholar] [CrossRef] [PubMed]
  2. Obikoya, I.B.; Bennell, J.D. Geophysical Investigation of the Fresh-Saline Water Interface in the Coastal Area of Abergwyngregyn. J. Environ. Prot. 2012, 3, 1039–1046. [Google Scholar] [CrossRef]
  3. Costall, A.; Harris, B.; Pigois, J.P. Electrical Resistivity Imaging and the Saline Water Interface in High-Quality Coastal Aquifers. Surv. Geophys. 2018, 39, 753–816. [Google Scholar] [CrossRef]
  4. Bristow, C.S.; Jol, H.M. Ground Penetrating Radar in Sediments; Geological Society of London: London, UK, 2003; ISBN 978-1-86239-459-9. [Google Scholar]
  5. Conyers, L.B. Ground-Penetrating Radar for Archaeology; Geophysical Methods for Archaeology; AltaMira Press: Walnut Creek, CA, USA, 2004; ISBN 978-0-7591-0773-1. [Google Scholar]
  6. Rogers, M.; Leon, J.F.; Fisher, K.D.; Manning, S.W.; Sewell, D. Comparing Similar Ground-Penetrating Radar Surveys Under Different Moisture Conditions at Kalavasos-Ayios Dhimitrios, Cyprus. Archaeol. Prospect. 2012, 19, 297–305. [Google Scholar] [CrossRef]
  7. Ezersky, M.; Eppelbaum, L.V.; Legchenko, A. Geophysical Methods Applied to the Sinkhole Investigation at the Dead Sea Coasts. In Applied Geophysics for Karst and Sinkhole Investigation: The Dead Sea and Other Regions; IOP Publishing: Bristol, UK, 2023. [Google Scholar]
  8. Ezersky, M.G.; Eppelbaum, L.V.; Al-Zoubi, A.; Keydar, S.; Abueladas, A.; Akkawi, E.; Medvedev, B. Geophysical Prediction and Following Development Sinkholes in Two Dead Sea Areas, Israel and Jordan. Environ. Earth Sci. 2013, 70, 1463–1478. [Google Scholar] [CrossRef]
  9. Closson, D.; Abou Karaki, N. Sinkhole Hazards Prediction at Ghor Al Haditha, Dead Sea, Jordan: “Salt Edge” and “Tectonic” Models Contribution—A Rebuttal to “Geophysical Prediction and Following Development Sinkholes in Two Dead Sea Areas, Israel and Jordan, by: Ezersky, M.G., Eppelbaum, L.V., Al-Zoubi, A.3, Keydar, S., Abueladas, A.-R., Akkawi, E., and Medvedev, B.”. Environ. Earth Sci. 2013, 70, 2919–2922. [Google Scholar] [CrossRef]
  10. Legchenko, A.; Ezersky, M.; Camerlynck, C.; Al-Zoubi, A.; Chalikakis, K. Joint Use of TEM and MRS Methods in a Complex Geological Setting. Comptes Rendus Geosci. 2009, 341, 908–917. [Google Scholar] [CrossRef]
  11. Ten Brink, U.S.; Ben-Avraham, Z. The Anatomy of a Pull-Apart Basin: Seismic Reflection Observations of the Dead Sea Basin. Tectonics 1989, 8, 333–350. [Google Scholar] [CrossRef]
  12. Ten Brink, U.S.; Flores, C.H. Geometry and Subsidence History of the Dead Sea Basin: A Case for Fluid-Induced Mid-Crustal Shear Zone? J. Geophys. Res. Solid Earth 2012, 117, B01406. [Google Scholar] [CrossRef]
  13. Neev, D.; Hall, J.K. Geophysical Investigations in the Dead Sea. Sediment. Geol. 1979, 23, 209–238. [Google Scholar] [CrossRef]
  14. Pe’eri, S.; Zebker, H.A.; Ben-Avraham, Z.; Frumkin, A.; Hall, J.K. Spatially-Resolved Uplift Rate of the Mount Sedom (Dead Sea) Salt Diapir from InSAR Observations. Isr. J. Earth Sci. 2004, 53, 99–106. [Google Scholar] [CrossRef]
  15. Coianiz, L.; Schattner, U.; Lang, G.; Ben-Avraham, Z.; Lazar, M. Between Plate and Salt Tectonics—New Stratigraphic Constraints on the Architecture and Timing of the Dead Sea Basin during the Late Quaternary. Basin Res. 2020, 32, 636–651. [Google Scholar] [CrossRef]
  16. Neev, D.; Emery, K.O. The Dead Sea: Depositional Processes and Environments of Evaporites; Geological Survey: Jeruslaem, Israel, 1967. [Google Scholar]
  17. Begin, Z.B.; Begîn, Z.B.; Ehrlich, A.; Nathan, Y. Lake Lisan: The Pleistocene Precursor of the Dead Sea; Ministry of Commerce and Industry, Geological Survey: Jeruslaem, Israel, 1974.
  18. Stein, M.; Starinsky, A.; Katz, A.; Goldstein, S.L.; Machlus, M.; Schramm, A. Strontium Isotopic, Chemical, and Sedimentological Evidence for the Evolution of Lake Lisan and the Dead Sea. Geochim. Cosmochim. Acta 1997, 61, 3975–3992. [Google Scholar] [CrossRef]
  19. Stein, M. The Evolution of Neogene-Quaternary Water-Bodies in the Dead Sea Rift Valley. In Dead Sea Transform Fault System: Reviews; Garfunkel, Z., Ben-Avraham, Z., Kagan, E., Eds.; Springer: Dordrecht, The Netherlands, 2014; pp. 279–316. ISBN 978-94-017-8872-4. [Google Scholar]
  20. Bartov, Y.; Goldstein, S.L.; Stein, M.; Enzel, Y. Catastrophic Arid Episodes in the Eastern Mediterranean Linked with the North Atlantic Heinrich Events. Geology 2003, 31, 439–442. [Google Scholar] [CrossRef]
  21. Bookman, R.; Enzel, Y.; Agnon, A.; Stein, M. Late Holocene Lake Levels of the Dead Sea. GSA Bull. 2004, 116, 555–571. [Google Scholar] [CrossRef]
  22. Haase-Schramm, A.; Goldstein, S.L.; Stein, M. U-Th Dating of Lake Lisan (Late Pleistocene Dead Sea) Aragonite and Implications for Glacial East Mediterranean Climate Change. Geochim. Cosmochim. Acta 2004, 68, 985–1005. [Google Scholar] [CrossRef]
  23. Prasad, S.; Vos, H.; Negendank, J.F.W.; Waldmann, N.; Goldstein, S.L.; Stein, M. Evidence from Lake Lisan of Solar Influence on Decadal- to Centennial-Scale Climate Variability during Marine Oxygen Isotope Stage 2. Geology 2004, 32, 581–584. [Google Scholar] [CrossRef]
  24. Stein, M.; Torfstein, A.; Gavrieli, I.; Yechieli, Y. Abrupt Aridities and Salt Deposition in the Post-Glacial Dead Sea and Their North Atlantic Connection. Quat. Sci. Rev. 2010, 29, 567–575. [Google Scholar] [CrossRef]
  25. Torfstein, A.; Goldstein, S.L.; Stein, M.; Enzel, Y. Impacts of Abrupt Climate Changes in the Levant from Last Glacial Dead Sea Levels. Quat. Sci. Rev. 2013, 69, 1–7. [Google Scholar] [CrossRef]
  26. Neugebauer, I.; Brauer, A.; Schwab, M.J.; Waldmann, N.D.; Enzel, Y.; Kitagawa, H.; Torfstein, A.; Frank, U.; Dulski, P.; Agnon, A.; et al. Lithology of the Long Sediment Record Recovered by the ICDP Dead Sea Deep Drilling Project (DSDDP). Quat. Sci. Rev. 2014, 102, 149–165. [Google Scholar] [CrossRef]
  27. Kiro, Y.; Goldstein, S.L.; Garcia-Veigas, J.; Levy, E.; Kushnir, Y.; Stein, M.; Lazar, B. Relationships between Lake-Level Changes and Water and Salt Budgets in the Dead Sea during Extreme Aridities in the Eastern Mediterranean. Earth Planet. Sci. Lett. 2017, 464, 211–226. [Google Scholar] [CrossRef]
  28. Lu, Y.; Waldmann, N.; Nadel, D.; Marco, S. Increased Sedimentation Following the Neolithic Revolution in the Southern Levant. Glob. Planet. Chang. 2017, 152, 199–208. [Google Scholar] [CrossRef]
  29. Coianiz, L.; Ben-Avraham, Z.; Stein, M.; Lazar, M. Spatial and Temporal Reconstruction of the Late Quaternary Dead Sea Sedimentary Facies from Geophysical Properties. J. Appl. Geophys. 2019, 160, 15–27. [Google Scholar] [CrossRef]
  30. Coianiz, L.; Bialik, O.M.; Ben-Avraham, Z.; Lazar, M. Late Quaternary Lacustrine Deposits of the Dead Sea Basin: High Resolution Sequence Stratigraphy from Downhole Logging Data. Quat. Sci. Rev. 2019, 210, 175–189. [Google Scholar] [CrossRef]
  31. Torfstein, A.; Enzel, Y. Dead Sea Lake Level Changes and Levant Palaeoclimate. In Quaternary of the Levant; Enzel, Y., Bar-Yosef, O., Eds.; Cambridge University Press: Cambridge, UK, 2017; pp. 115–126. ISBN 978-1-316-10675-4. [Google Scholar]
  32. Bookman, R. The Dead Sea and Its Deviation from Natural Conditions. In Large Asian Lakes in a Changing World: Natural State and Human Impact; Mischke, S., Ed.; Springer International Publishing: Cham, Switzerland, 2020; pp. 1–33. ISBN 978-3-030-42254-7. [Google Scholar]
  33. Migowski, C.; Stein, M.; Prasad, S.; Negendank, J.F.W.; Agnon, A. Holocene Climate Variability and Cultural Evolution in the Near East from the Dead Sea Sedimentary Record. Quat. Res. 2006, 66, 421–431. [Google Scholar] [CrossRef]
  34. Yechieli, Y.; Magaritz, M.; Levy, Y.; Weber, U.; Kafri, U.; Woelfli, W.; Bonani, G. Late Quaternary Geological History of the Dead Sea Area, Israel. Quat. Res. 1993, 39, 59–67. [Google Scholar] [CrossRef]
  35. Haliva-Cohen, A.; Stein, M.; Goldstein, S.L.; Sandler, A.; Starinsky, A. Sources and Transport Routes of Fine Detritus Material to the Late Quaternary Dead Sea Basin. Quat. Sci. Rev. 2012, 50, 55–70. [Google Scholar] [CrossRef]
  36. Abelson, M.; Baer, G.; Shtivelman, V.; Wachs, D.; Raz, E.; Crouvi, O.; Kurzon, I.; Yechieli, Y. Collapse-sinkholes and Radar Interferometry Reveal Neotectonics Concealed within the Dead Sea Basin. Geophys. Res. Lett. 2003, 30, 2003GL017103. [Google Scholar] [CrossRef]
  37. Lazar, M.; Engoltz, K.; Basson, U.; Yasur-Landau, A. Water Saturated Sand and a Shallow Bay: Combining Coastal Geophysics and Underwater Archaeology in the South Bay of Tel Dor. Quat. Int. 2018, 473, 112–119. [Google Scholar] [CrossRef]
  38. Lazar, M.; Basson, U.; Himmelstein, A.G.; Levy, T.E.; Arkin Shalev, E.; Yasur-Landau, A. The Door to Dor: Tracing Unseen Anthropogenic Impact in an Ancient Port. Geoarchaeology 2021, 36, 203–212. [Google Scholar] [CrossRef]
  39. Won, I.J.; Keiswetter, D.A.; Fields, G.R.A.; Sutton, L.C. GEM-2: A New Multifrequency Electromagnetic Sensor. J. Environ. Eng. Geophys. 1996, 1, 129–137. [Google Scholar] [CrossRef]
  40. Huang, H.; Won, I.J. Real-time Resistivity Sounding Using a Hand-held Broadband Electromagnetic Sensor. Geophysics 2003, 68, 1224–1231. [Google Scholar] [CrossRef]
  41. Huang, H. Depth of Investigation for Small Broadband Electromagnetic Sensors. Geophysics 2005, 70, G135–G142. [Google Scholar] [CrossRef]
  42. Sudduth, K.A.; Kitchen, N.R.; Wiebold, W.J.; Batchelor, W.D.; Bollero, G.A.; Bullock, D.G.; Clay, D.E.; Palm, H.L.; Pierce, F.J.; Schuler, R.T.; et al. Relating Apparent Electrical Conductivity to Soil Properties across the North-Central USA. Comput. Electron. Agric. 2005, 46, 263–283. [Google Scholar] [CrossRef]
  43. Spies, B.R. Depth of Investigation in Electromagnetic Sounding Methods. Geophysics 1989, 54, 872–888. [Google Scholar] [CrossRef]
  44. Goldshleger, N.; Basson, U.; Azaria, I.; Fastig, S. Using Combined Close-Range Active and Passive- Remote Sensing Methods to Detect Sinkholes. J. Remote Sens. GIS 2018, 7, 222. [Google Scholar] [CrossRef]
  45. Goldshleger, N.; Basson, U. Utilization of Ground-Penetrating Radar and Frequency Domain Electromagnetic for Investigation of Sewage Leaks. In Environmental Applications of Remote Sensing; Marghany, M., Ed.; InTech: London, UK, 2016; ISBN 978-953-51-2443-6. [Google Scholar]
  46. Goldshleger, N.; Shamir, O.; Basson, U.; Zaady, E. Frequency Domain Electromagnetic Method (FDEM) as a Tool to Study Contamination at the Sub-Soil Layer. Geosciences 2019, 9, 382. [Google Scholar] [CrossRef]
  47. McNeill, J.D. Electrical Conductivity of Soils and Rocks; Technical Note 5; Geonics LTD: Mississauga, ON, Canada, 1980. [Google Scholar]
  48. Beamish, D. Low Induction Number, Ground Conductivity Meters: A Correction Procedure in the Absence of Magnetic Effects. J. Appl. Geophys. 2011, 75, 244–253. [Google Scholar] [CrossRef]
  49. Weymer, B.A.; Everett, M.E.; Houser, C.; Wernette, P.; Barrineau, P. Differentiating Tidal and Groundwater Dynamics from Barrier Island Framework Geology: Testing the Utility of Portable Multifrequency Electromagnetic Induction Profilers. Geophysics 2016, 81, E347–E361. [Google Scholar] [CrossRef]
  50. Huang, H.; Deszcz-Pan, M.; Smith, B. Limitations of Small EM Sensors in Resistive Terrain. In Symposium on the Application of Geophysics to Engineering and Environmental Problems Proceedings; The Environmental and Engineering Geophysical Society: Denver, CO, USA, 2008; pp. 163–180. [Google Scholar]
  51. Jadoon, K.Z.; Altaf, M.U.; McCabe, M.F.; Hoteit, I.; Muhammad, N.; Moghadas, D.; Weihermüller, L. Inferring Soil Salinity in a Drip Irrigation System from Multi-Configuration EMI Measurements Using Adaptive Markov Chain Monte Carlo. Hydrol. Earth Syst. Sci. 2017, 21, 5375–5383. [Google Scholar] [CrossRef]
  52. Delefortrie, S.; Saey, T.; Van De Vijver, E.; De Smedt, P.; Missiaen, T.; Demerre, I.; Van Meirvenne, M. Frequency Domain Electromagnetic Induction Survey in the Intertidal Zone: Limitations of Low-Induction-Number and Depth of Exploration. J. Appl. Geophys. 2014, 100, 14–22. [Google Scholar] [CrossRef]
  53. Shevnin, V.; Mousatov, A.; Ryjov, A.; Delgado-Rodriquez, O. Estimation of Clay Content in Soil Based on Resistivity Modelling and Laboratory Measurements. Geophys. Prospect. 2007, 55, 265–275. [Google Scholar] [CrossRef]
  54. Crow, H.L.; Hunter, J.A.; Olson, L.C.; Pugin, A.J.-M.; Russell, H.A.J. Borehole Geophysical Log Signatures and Stratigraphic Assessment in a Glacial Basin, Southern Ontario. Can. J. Earth Sci. 2018, 55, 829–845. [Google Scholar] [CrossRef]
  55. Kayal, J.R. Electrical and Gamma-Ray Logging in Gondwana and Tertiary Coal Fields of India. Geoexploration 1979, 17, 243–258. [Google Scholar] [CrossRef]
  56. Goldberg, D. The Role of Downhole Measurements in Marine Geology and Geophysics. Rev. Geophys. 1997, 35, 315–342. [Google Scholar] [CrossRef]
  57. Soua, M. Paleozoic Oil/Gas Shale Reservoirs in Southern Tunisia: An Overview. J. Afr. Earth Sci. 2014, 100, 450–492. [Google Scholar] [CrossRef]
  58. Shaaban, F.F.; Al-Rashed, A.R. Recognition of Lithostratigraphic Breaks in Undifferentiated Rock Units Using Well Logs: A Flow Chart. J. Geol. Geophys. 2015, 4, 225. [Google Scholar] [CrossRef]
  59. Lazar, M.; Siebert, C. Out of Sight, out of Mind. Submarine Springs in the Dead Sea—An Underappreciated Phenomenon. Geomorphology 2023, 436, 108777. [Google Scholar] [CrossRef]
  60. Shamir, G. The Active Structure of the Dead Sea Depression. In New Frontiers in Dead Sea Paleoenvironmental Research; Enzel, Y., Agnon, A., Stein, M., Eds.; Geological Society of America: Boulder, CO, USA, 2006; Volume 401, ISBN 978-0-8137-2401-0. [Google Scholar]
  61. Wetzler, N.; Sagy, A.; Marco, S. The Association of Micro-Earthquake Clusters with Mapped Faults in the Dead Sea Basin. J. Geophys. Res. Solid Earth 2014, 119, 8312–8330. [Google Scholar] [CrossRef]
  62. Lazar, M.; Ben-Avraham, Z.; Schattner, U. Formation of Sequential Basins along a Strike–Slip Fault–Geophysical Observations from the Dead Sea Basin. Tectonophysics 2006, 421, 53–69. [Google Scholar] [CrossRef]
  63. Sagy, A.; Reches, Z.; Agnon, A. Hierarchic Three-Dimensional Structure and Slip Partitioning in the Western Dead Sea Pull-Apart. Tectonics 2003, 22, 1004. [Google Scholar] [CrossRef]
  64. Bartov, Y.; Sagy, A. Late Pleistocene Extension and Strike-Slip in the Dead Sea Basin. Geol. Mag. 2004, 141, 565–572. [Google Scholar] [CrossRef]
  65. Closson, D.; Karaki, N.A. Salt Karst and Tectonics: Sinkholes Development along Tension Cracks between Parallel Strike-Slip Faults, Dead Sea, Jordan. Earth Surf. Process. Landf. 2009, 34, 1408–1421. [Google Scholar] [CrossRef]
Figure 1. Location map showing (a) the general tectonic map of the region. DSF—Dead Sea Fault. MED—Mediterranean Sea. The red rectangle marks the area shown in (b), which is the location of the Dead Sea and its drainage basin. White rectangle—area shown in (c) topography and bathymetry of the northern Dead Sea basin showing the location of the two ICDP boreholes mentioned in the text (red circles). The study area is located on borehole 5017-3-C.
Remotesensing 16 01978 g001
Figure 2. Google Earth image of the study area (red box) showing the location of the ICDP 5017-3-C borehole (yellow dot) at the time of coring in 2011, which is now exposed due to dropping lake levels. EGS—Ein Gedi Spa. Insets—the actual study area at the time of the survey conducted for this study showing the salt-covered surface and the ICDP drill pipe sticking out of a small sunken depression.
Remotesensing 16 01978 g002
Figure 3. Conceptual model showing the principle of the FDEM method and the meaning of electrical conductivity (ECa) and relative electrical conductivity (RECa). Although extraction of RECa is more complicated, it can be viewed in a simplistic way as subtraction between two volumes. The exact method is the proprietorship of GeoSense Ltd.
Remotesensing 16 01978 g003
Figure 4. ECa map of frequency 825 kHz corresponding to the integration of all electrical conductivities from the surface down to a depth range of 5.1–9.1 m. Grey lines show the actual path used for data collection (survey lines). The color scale is in mS/m. Values do not represent absolute conductivity but are relative to the sensor used in the study. The red-pink circle represents the surface location of the ICDP 5017-3-C drill pipe, while the adjacent pink patch (just to the south) is the effect of the subsurface extent of the pipe on the apparent electrical conductivity.
Remotesensing 16 01978 g004
Figure 5. Comparison between (a) FDEM RECa maps. From top to bottom and left to right: 24,425–57,225 kHz; 10,425–24,425 kHz; 4425–10,425 kHz; 1925–4425 kHz; 825–1925 kHz. Negative values represent an increase in ECa values between the first and second volumes, similar to the result of simple subtraction (Figure 4). (b) Gamma Ray is logging data from the ICDP 5017-3-C borehole. Colors divide the graph into cutoff values suggested by [29]. White 0–5 gAPI; Pink 5–10 gAPI; Yellow 10–20 gAPI.; Green 20-25 gAPI (c) Th/K ratio. The text to the right indicates the predicted lithology. E—evaporates. MSE—medium to thick-bedded mudstone to sandstone with evaporates. MSS—mudstones interbedded siltstones/sandstones. Horizontal and black lines mark the depths of the maximum cutoff values, while angled black lines divide the FDEM inversion maps accordingly.
Remotesensing 16 01978 g005
Table 1. Frequencies used in the FDEM survey and depth range of effective penetration for each one.
Frequency (Hz)Range of Effective Penetration (m)
8255.1–9.1
19254.6–7.7
44254.0–6.3
10,4253.1–4.7
24,4252.1–3.6
57,2251.7–2.6
Table 2. Frequencies used to produce RECa maps, as well as the range of apparent electrical conductivity for each map. Negative values represent an increase in conductivity between the first and last frequency and a positive number—a decrease.
Frequency (Hz)Range of ECa (mS/m)
825–1925−340–360
1925–4425−1360–450
4425–10,425−83–3500
10,425–24,4251820–2520
24,425–57,225−630–−70
57,2252295–2410
Disclaimer/Publisher’s Note: The statements, opinions and data contained in all publications are solely those of the individual author(s) and contributor(s) and not of MDPI and/or the editor(s). MDPI and/or the editor(s) disclaim responsibility for any injury to people or property resulting from any ideas, methods, instructions or products referred to in the content.

