Abstract
Human activities and climate change have profound impacts on the ecological environment of oases in Xinjiang, and it is of great significance to explore the spatial and temporal evolution patterns of ecological environment quality in this region for the sustainable development of Xinjiang. The remote sensing ecological index (RSEI) was extracted from the Google Earth Engine (GEE) platform from 2000 to 2020, and the coefficient of variation and Hurst index were used to reveal the spatial and temporal characteristics and stability of the ecological environment quality of the artificial oasis and natural oasis in Xinjiang. The key factors affecting the ecological environment quality are explored through correlation analysis and geoprobes. The results show that the distribution of the ecological environment in Xinjiang oases is high in the north and low in the south, and the overall quality shows a fluctuating downward trend from 0.210 to 0.189. Artificial oases have higher RSEI values, stability, and sustainability than natural oases. The RSEI in the study area was mainly influenced by humidity, followed by greenness and heat, and dryness had the least influence on the RSEI model. Based on the geodetector, the top three highest contributors were found to be precipitation (PRE) (0.83) > relative humidity (RHU) (0.82) > evapotranspiration (ET) (0.57). Climate is the main factor affecting the ecological quality of oases, and the RSEI can be improved by increasing the proportion of artificial oases. The study aims to provide a scientific basis for the sustainable development of oases in arid zones.
1. Introduction
An oasis is a unique geographic landscape in an arid zone due to the uneven distribution of natural resources, especially water resources. Oases arid zones are important places for human survival and development [1]. In the context of global and regional ecosystems under the influence of climate change and human activities, scientific assessment of dry zone ecosystems plays an important role in environmental governance and sustainable development [2]. With rapid economic development, conflicts and problems between human beings and ecosystems are becoming more and more prominent [3]. This conflict has led to multiple ecological problems such as ecological degradation, land desertification, and extreme weather [4]. At the same time, the expansion of artificial oases and the shrinkage of natural oases have made the ecosystem more fragile [5,6]. Harmonious development of oasis expansion and the ecological environment has become the most basic requirement and trend of ecological civilization construction and sustainable development goals [7]. Therefore, long-term monitoring of the changing law of oasis ecological environment quality and exploring the potential factors affecting its change has become a hot research topic in the field of ecological environment change in arid zones [8,9].
In long time-series analyses, traditional ecological quality assessment faces the challenges of huge data volume and complex data processing. The Google Earth Engine (GEE) remote sensing big data platform overcomes the difficulties and limitations in data acquisition, and its powerful computing functions can process image datasets quickly and efficiently. The remote sensing ecological index (RSEI) [10] processed through the GEE platform has the advantages of a wide range, short cycle, and large amount of information, which can effectively respond to the changes in the quality of the oasis ecological environment. The index comprehensively considers the greenness, humidity, heat, and dryness indicators that are closely related to human beings, which makes up for the singularity of the evaluation of ecological environment quality [11]. And it has been well applied in large-scale environmental monitoring. Scholars found that there is spatial variability in the distribution of ecological quality in China through the GEE platform in the long series monitoring of China’s RSEI from 2000 to 2019, and the RESI can better respond to the trend of ecological spatial quality in China since 2000 [12]. In the assessment of the ecological health of Tibetan alpine grasslands in Gannan using remote sensed ecological indicators and urban agglomerations [13] and other regional long series RSEI monitoring found that the RESI can well respond to the long series changes in regional ecological environment quality. Based on the RSEI time series data, some scholars found that the changes in the RSEI are closely related to climate elements and human activities by using trend analysis and correlation analysis. Through the sensitivity analysis of different driving factors in different stages of the RSEI in Yan’an City, China, from 1990 to 2020, scholars found that temperature and land use changes have a higher degree of influence on the RSEI [14]. This view has also been confirmed by scholars using the Hurst index and geoprobes in RSEI long series monitoring in Chongqing, China [15].
Later, the RSEI was proposed based on the broadness and comprehensiveness of remote sensing technology [16]. The index comprehensively considers the greenness, humidity, heat, and dryness indicators that are closely related to human beings, which makes up for the singularity of ecological environment quality evaluation. These studies have been applied to the impact of urbanization [17] and urban agglomerations [18,19] on the quality of the ecological environment and found that the RSEI values are better at higher levels of greenness and humidity, and better at lower levels of dryness or heat. Meanwhile, in a study of the arid zone of Africa, it was found that the RSEI responds better to the quality of ecosystems and precipitation is the main factor affecting the RSEI [20]. While in the study of islands in the subtropical region, the RSEI showed a small decrease, due to the impact of reclamation projects, large areas of bare soil will increase which can lead to regional ecological decline [21]. However, these studies are usually limited to specific cities or regions [22], and mostly focus on the ecological changes in the process of urbanization [23,24], while there is still a research gap in the assessment of the quality of the integrated ecological environment for special geographical units such as oases in arid zones, especially in the face of the dual impacts of climate change and human activities.
Located in the arid zone of north-west China, the Xinjiang oasis is a typical climate-responsive sensitive and ecologically fragile area. Under the dual impacts of climate change and human activities, the regional ecological environment quality has undergone significant changes. In this context, it is urgent to study the changing characteristics of the ecological environment in the Xinjiang oasis and the extremely influencing factors. Land use [25], climate change [26], and the impact of human activities [27] in arid zone oases have been extensively explored. It was found that the expansion of arable land and construction land is a key factor leading to the ecological decline of the Shule River [28], and this relevant point of view was also confirmed in the Manas River basin [27]. For this reason, artificial oases have been proposed as a key factor leading to the decline in ecological environment quality [2]. In order to prevent ecological degradation, natural oases need to be protected and the continued expansion of artificial oases must be curbed. This point of view has also been proposed in the study of Lake Edin [29]. Restricting the development of artificial oases (AOs) undoubtedly brings great problems to social and economic development [30], and the coordination of ecological environment and oasis development has become a trend [31]. An artificial oasis has the same ecological function as a natural oasis (NO) [32]. However, the existing research lacks the positive effect of artificial oases on the ecological environment, as well as the stability analysis of different types of oases.
To solve the above problems, the experiment is based on the GEE platform. Based on the GEE platform, the experiment was carried out to reveal the spatial and temporal changes of the RSEI in the Xinjiang oasis by using the coefficient of variation and trend analysis method and the Hurst index. Correlation analyses and geographic probes were used to investigate the main factors affecting the change in the RSEI in the oasis. It is expected to provide a scientific basis for the ecological conservation and sustainable development of oases in north-west China and similar arid zones around the world. The study will also explore the interactions between human activities and changes in the natural environment, providing new perspectives for understanding and responding to the impacts of fragile ecosystems under global environmental change.
2. Materials and Methods
2.1. Study Area
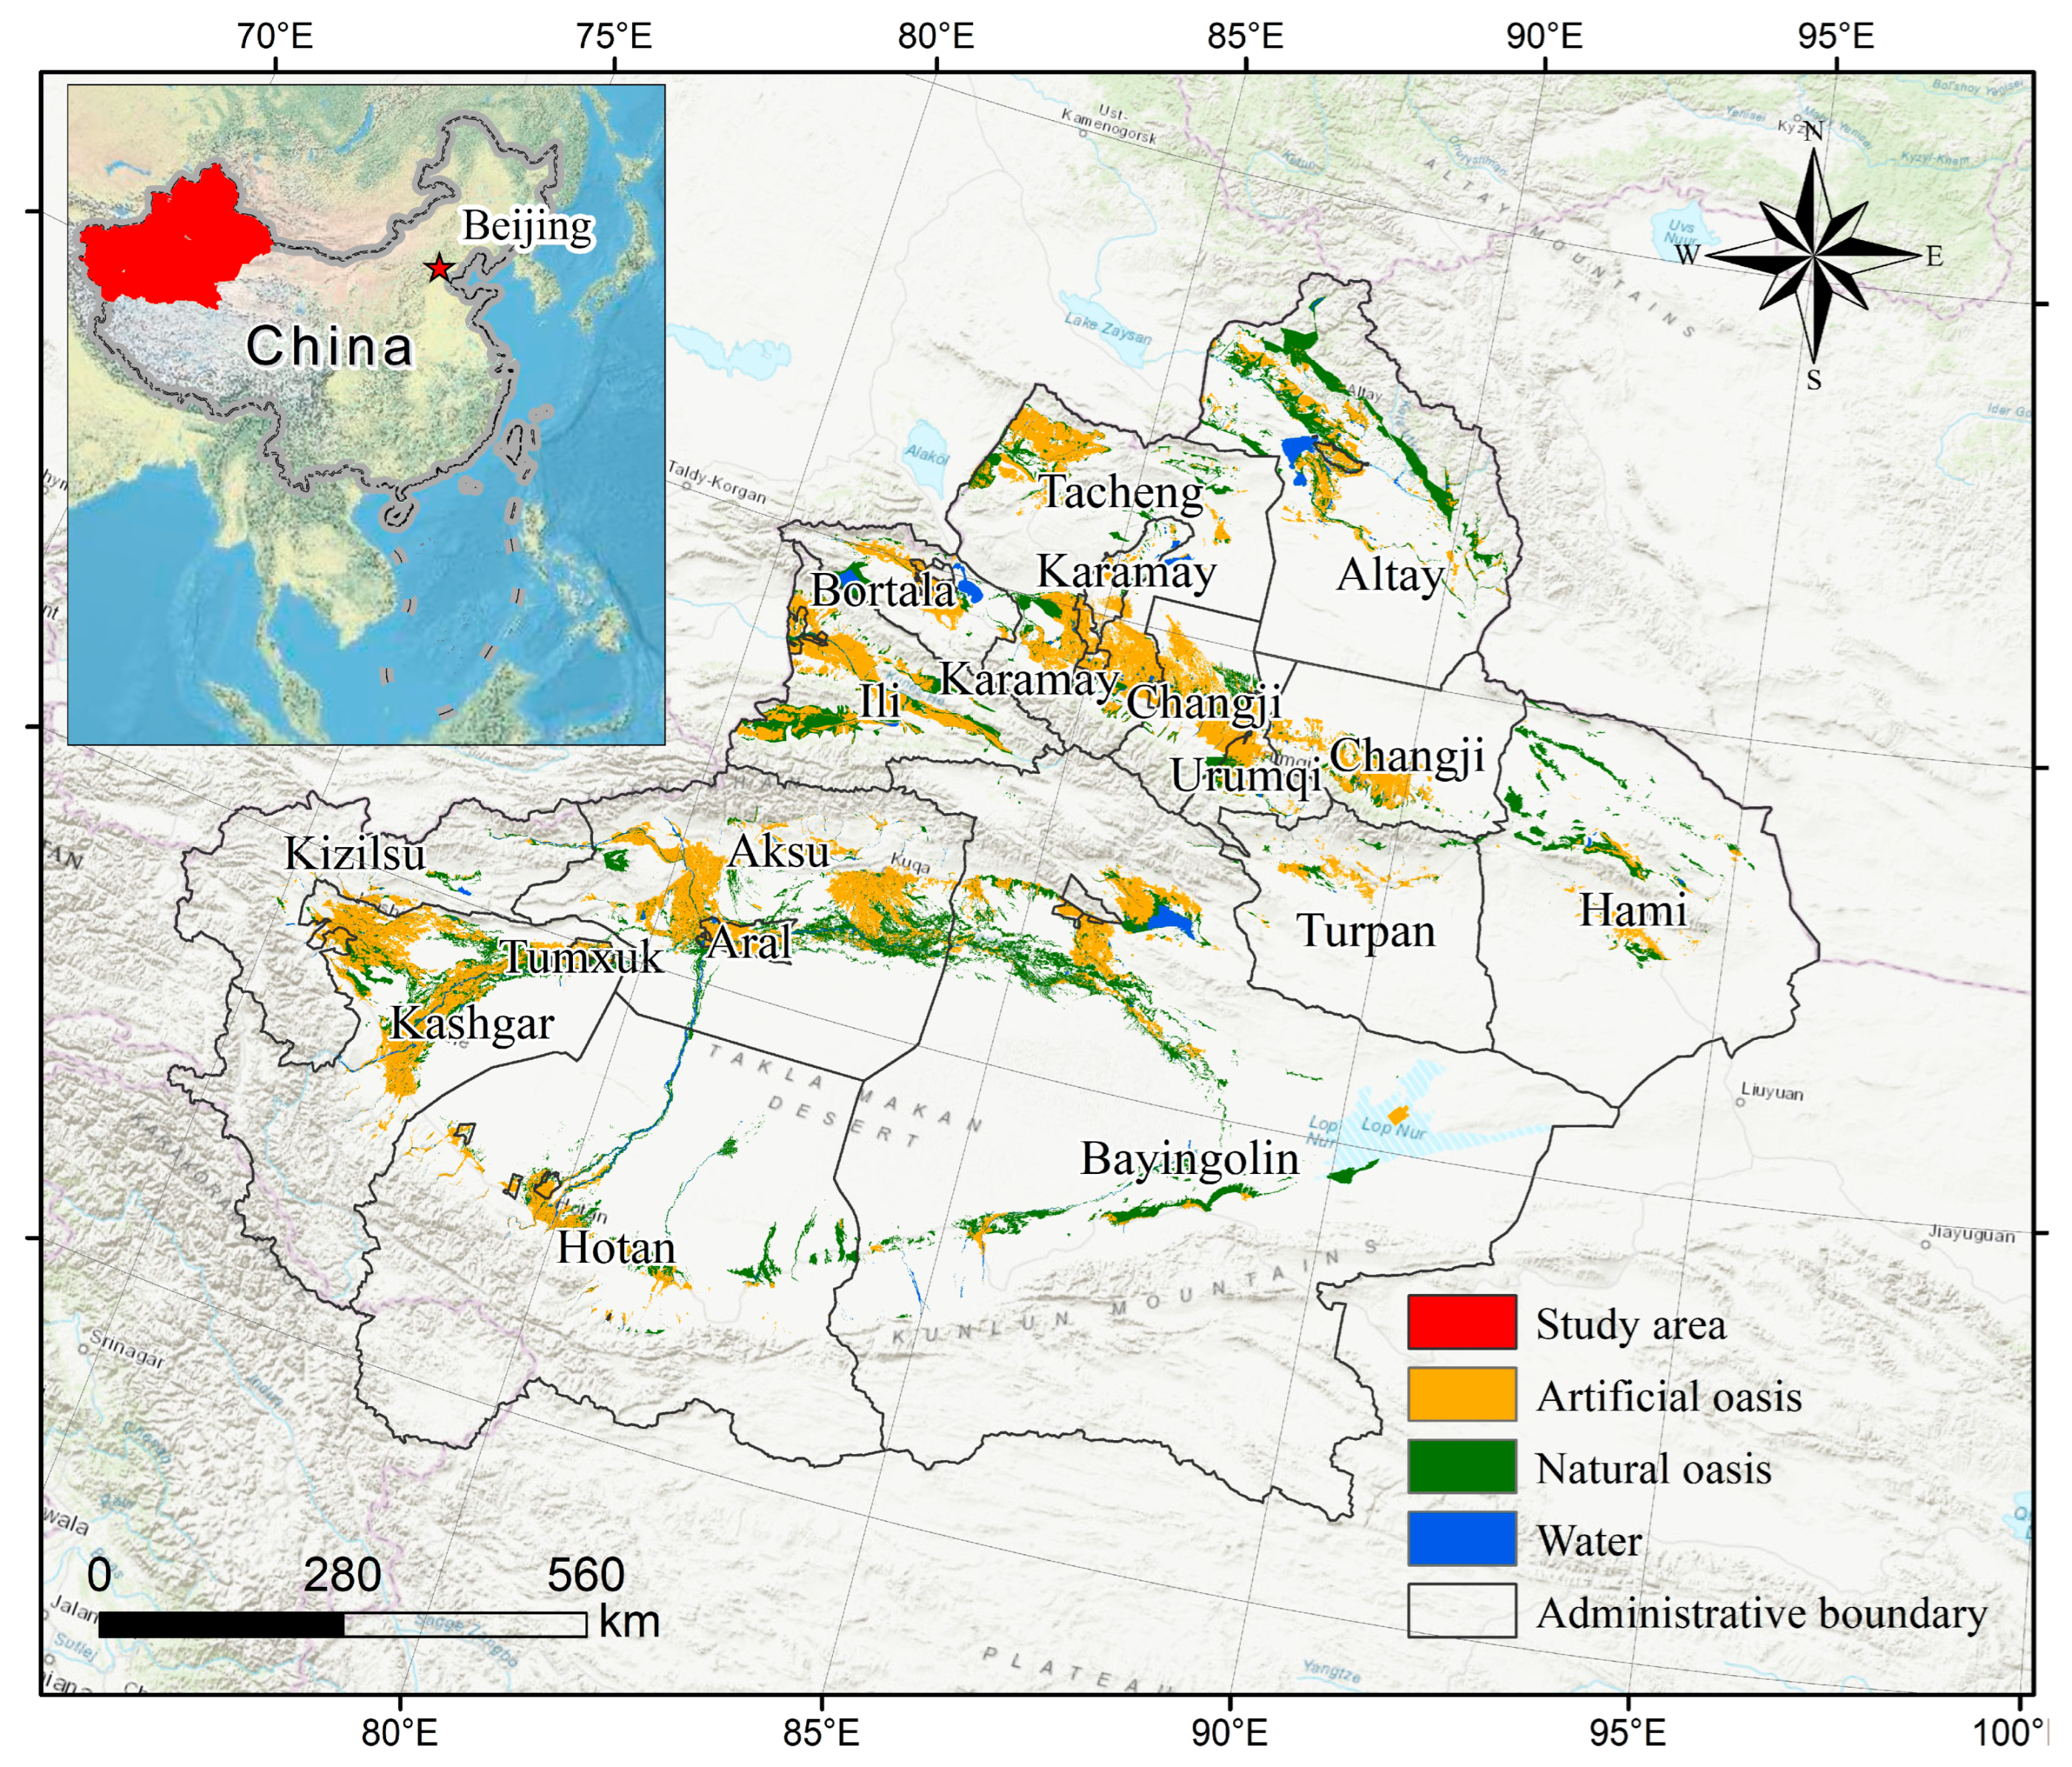
The study area is Xinjiang (Figure 1), with a total area of 1.66 million km2, located in the hinterland of the Eurasian continent, with a geographic location of 34°25′N−48°10′N, 73°40′E−96°18′E, and bordered by eight countries including Russia, Kazakhstan, Tajikistan, Kyrgyzstan, Afghanistan, Mongolia, Pakistan, and India, and Tajikistan, Kyrgyzstan, Afghanistan, Mongolia, Pakistan, India, and eight other countries border; in the history of the ancient Silk Road it is an important corridor, and is now the second “Asia−Europe Continental Bridge” to pass through the place. Because Xinjiang is far from the ocean, it has a typical temperate continental arid climate [33]. The large temperature difference, sufficient sunshine time, average annual precipitation of around 150 mm, low precipitation and high evaporation, and dry climate, coupled with the unique topographic pattern of “three mountains and two basins”, have an important impact on the climate and vegetation in the region. Extraction of land use data for Xinjiang in 2020 shows the Xinjiang oasis area is 173,100 km2, of which the artificial oasis area is 100,300 km2, and the natural oasis area is 72,800 km2.

Figure 1.
Xinjiang location map, China.
2.2. Data Sources
The MODIS product data used to construct the four component indicators involved in the RSEI are primarily derived from the United States Geological Survey (USGS), and these data are integrated into the GEE Cloud Computing Platform for the time period 1 January 2001−31 December 2020. The 2000 data were supplemented by Landsat 5TM data due to the MODIS data condition. Meteorological data are yearly average temperature, precipitation, relative humidity, and evapotranspiration (ET) datasets at 1-km resolution for China from 2000 to 2020, which were obtained from the National Earth System Science Data Center (http://www.geodata.cn accessed on 15 January 2024). Agricultural water consumption data were obtained from the Xinjiang Water Resources Department (http://slt.xinjiang.gov.cn accessed on 28 November 2023). Land use data were adopted from the 2000−2020 China Multi-Period Land Use Remote Sensing Monitoring dataset (https://www.resdc.cn accessed on 11 October 2023), which classifies the land use/cover type of oasis according to the formation mechanism of the oasis. Among them, natural oasis includes naturally growing forest and grassland and natural waters; artificial oasis includes cultivated land, artificial forest land, construction land, and reservoirs. Detailed data are shown in Table 1.

Table 1.
Description of the data set.
2.3. Methodology
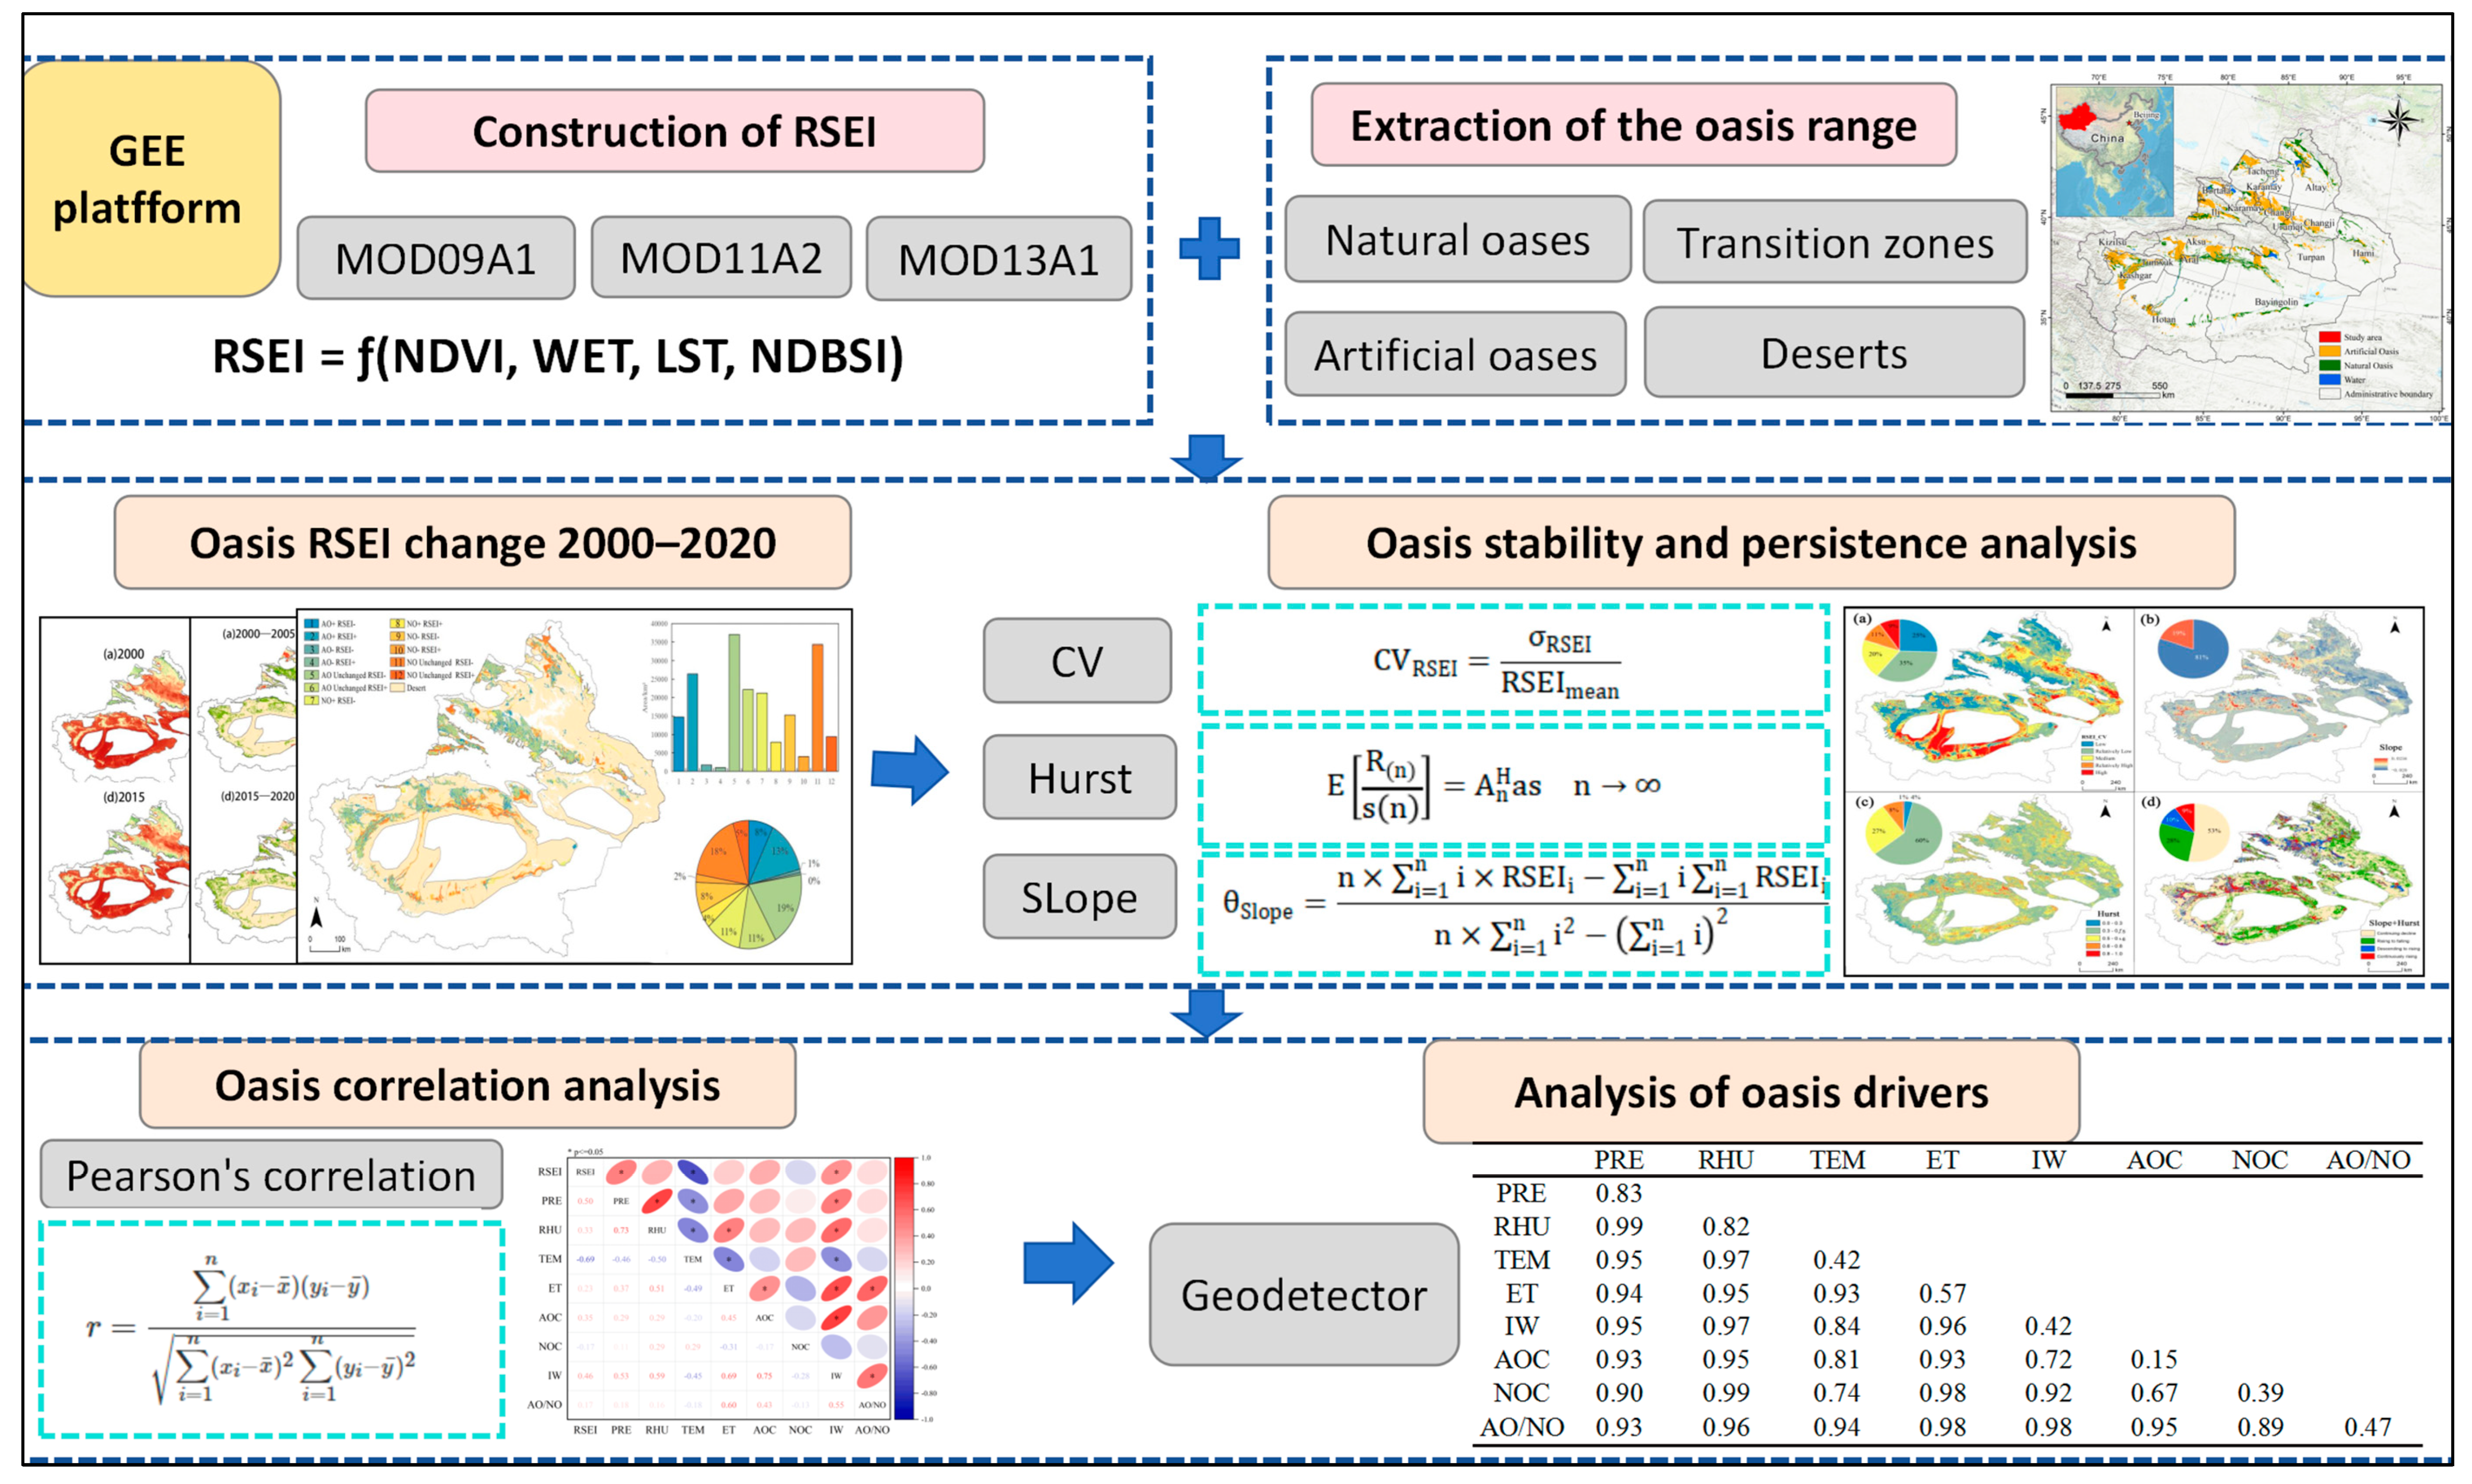
In this study, we analyzed the spatial and temporal distribution and trends of the RSEI in the AOs, NOs, transition zone, and desert in Xinjiang. The ecological environment quality of the Xinjiang oasis was evaluated from 2000 to 2020 with a spatial resolution of 250 m. Meanwhile, the stability and continuity evaluation system of ecological environment quality was established, and the trend of ecological environment quality was systematically analyzed. Finally, the ecological environment quality and climate factors and human activity impacts were processed by correlation analysis and geoprobes (Figure 2).
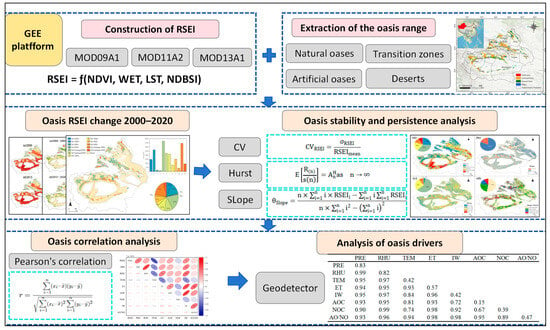
Figure 2.
The general framework of this study.
2.3.1. RSEI Model Construction
The RSEI model contains four natural indicators of greenness, humidity, heat, and dryness [10], and the RSEI model equation is.
where NDVI represents the greenness index of the study area. The NDVI index in MOD13A1 was used in the study. WET represents the humidity index of the study area, which mirrors the humidity of the water body and the soil and vegetation, and the calculation method is shown in Equation (2) [34]. LST surface temperature represents the heat index of the study area, and the LST index in MOD11A2 was used in the study. NDBSI represents the dryness index of the study area, and it consists of the bare soil index (soilindex, SI) and building index (index−basedbuilt−upindex, IBI) combination. It can reflect the degree of dryness of the ground surface in an area, and the calculation method is shown in Equations (3)–(5) [35]. ƒ is Principal Component Analysis (PCA) [27], which is a multivariate statistical method. It automatically and objectively determines the weights of each indicator based on the nature of the data used itself, and the contribution of the above four indicators to each principal component. Thus, it avoids the result bias of human subjective factors in the weight setting process.
where − are bands 1 to 7 in the MOD09A1 image dataset, corresponding to red band, near-infrared 1 band, blue band, green band, near-infrared 2 band, short-wave infrared 1 band, and short-wave infrared 2 band.
RSEI = ƒ(NDVI, WET, LST, NDBSI)
Finally, the above four natural indicators are removed from the scale and their values are mapped to the [0, 1] interval using Equation (6). The 1st principal component PC1 can be obtained by using the principal component analysis module, and the initial ecological index is obtained, and then the RSEI of the image element is obtained by using Equation (7). The quality of the ecological environment is classified into five levels, and the corresponding values are as follows: poor (0−0.2), poor (0.2−0.4), moderate (0.4−0.6), good (0.6−0.8), and excellent (0.8−1). The above RSEI calculations were performed on the GEE platform [36].
2.3.2. Coefficient of Variation
The Coefficient of Variation (CV) analysis method can effectively reveal the data fluctuation; this paper uses the 2000~2020 Xinjiang oasis for fluctuation analysis, and the formula is as follows.
where σRSEI is the standard deviation of the RSEI data, RSEImean is the mean value of the RSEI, and CV can be used to measure the changes in the ecological environment. The higher the CV value indicates that the volatility of the RSEI time series is greater, and vice versa, the more stable it is. In order to reflect the changes more intuitively, the CV value was subdivided into five levels: low volatility (CV ≤ 0.1), relatively low volatility (0.1 < CV≤ 0.2), medium volatility (0.2 < CV ≤ 0.3), relatively high volatility (0.3 < CV ≤ 0.4), and high volatility (CV > 0.4) [37].
2.3.3. Trend Analysis Method
In order to analyze the spatial and temporal characteristics of the RSEI in Xinjiang from 2000 to 2020, the inter-annual trend was analyzed by using the one-dimensional linear regression method on a pixel-by-pixel basis, and the formula was calculated as follows.
where: is the slope of the univariate linear regression equation, i is the year, RSEIi is the RSEI in year i, and n is the total number of years [37].
2.3.4. Hurst Index
In analyzing the trend of the RSEI, the Hurst index is utilized to detect how the range of fluctuations in a time series changes over the time span [38].
where: n is the number of time series observation points, representing the size of the time span; R(n) is the range of variation of these n observation points; and S(n) is the standard deviation of these points. To see if the trend is consistent with the past trend, the closer to 1, the stronger its continuity; if H = 0.5, it indicates that the RSEI time series is a random sequence, and the future trend is unknown; if 0 < H < 0.5, it indicates that the RSEI time series has an anti-continuity, and the closer the value of H is to 0, the stronger its anti-continuity.
2.3.5. Pearson’s Correlation Coefficient Method
The Pearson correlation coefficient method was used to correlate the annual scale RSEI with temperature, precipitation, relative humidity, and ET factors for each image element [39].
The value of r is between −1 and +1. If > 0, it indicates that the two variables are positively correlated; if < 0, it indicates that the two variables are negatively correlated, and the larger the absolute value of r, the stronger the correlation; if = 0, it indicates that the two are not linearly correlated.
2.3.6. Geodetector
Geodetector is a statistical method based on spatial statistics and spatial autocorrelation theory. It can be used to study spatial anisotropy, reveal the degree of influence and importance of each driver, detect the strength of interactions between factors, and perform risk detection. In this study, we used the interaction detection tool to analyze the drivers of ecological change in the region [40].
Interaction detection: This identifies the interaction between different independent variables X, reflecting whether the influence of two factors on Y when acting together is correlated or independent, and derived by q-value [q(X1∩X2)], as shown in Table 2.
Table 2.
Driving force magnitude criterion interval and interaction type.
3. Results
3.1. Characteristics of Spatial and Temporal Changes in Ecological Quality in Oases
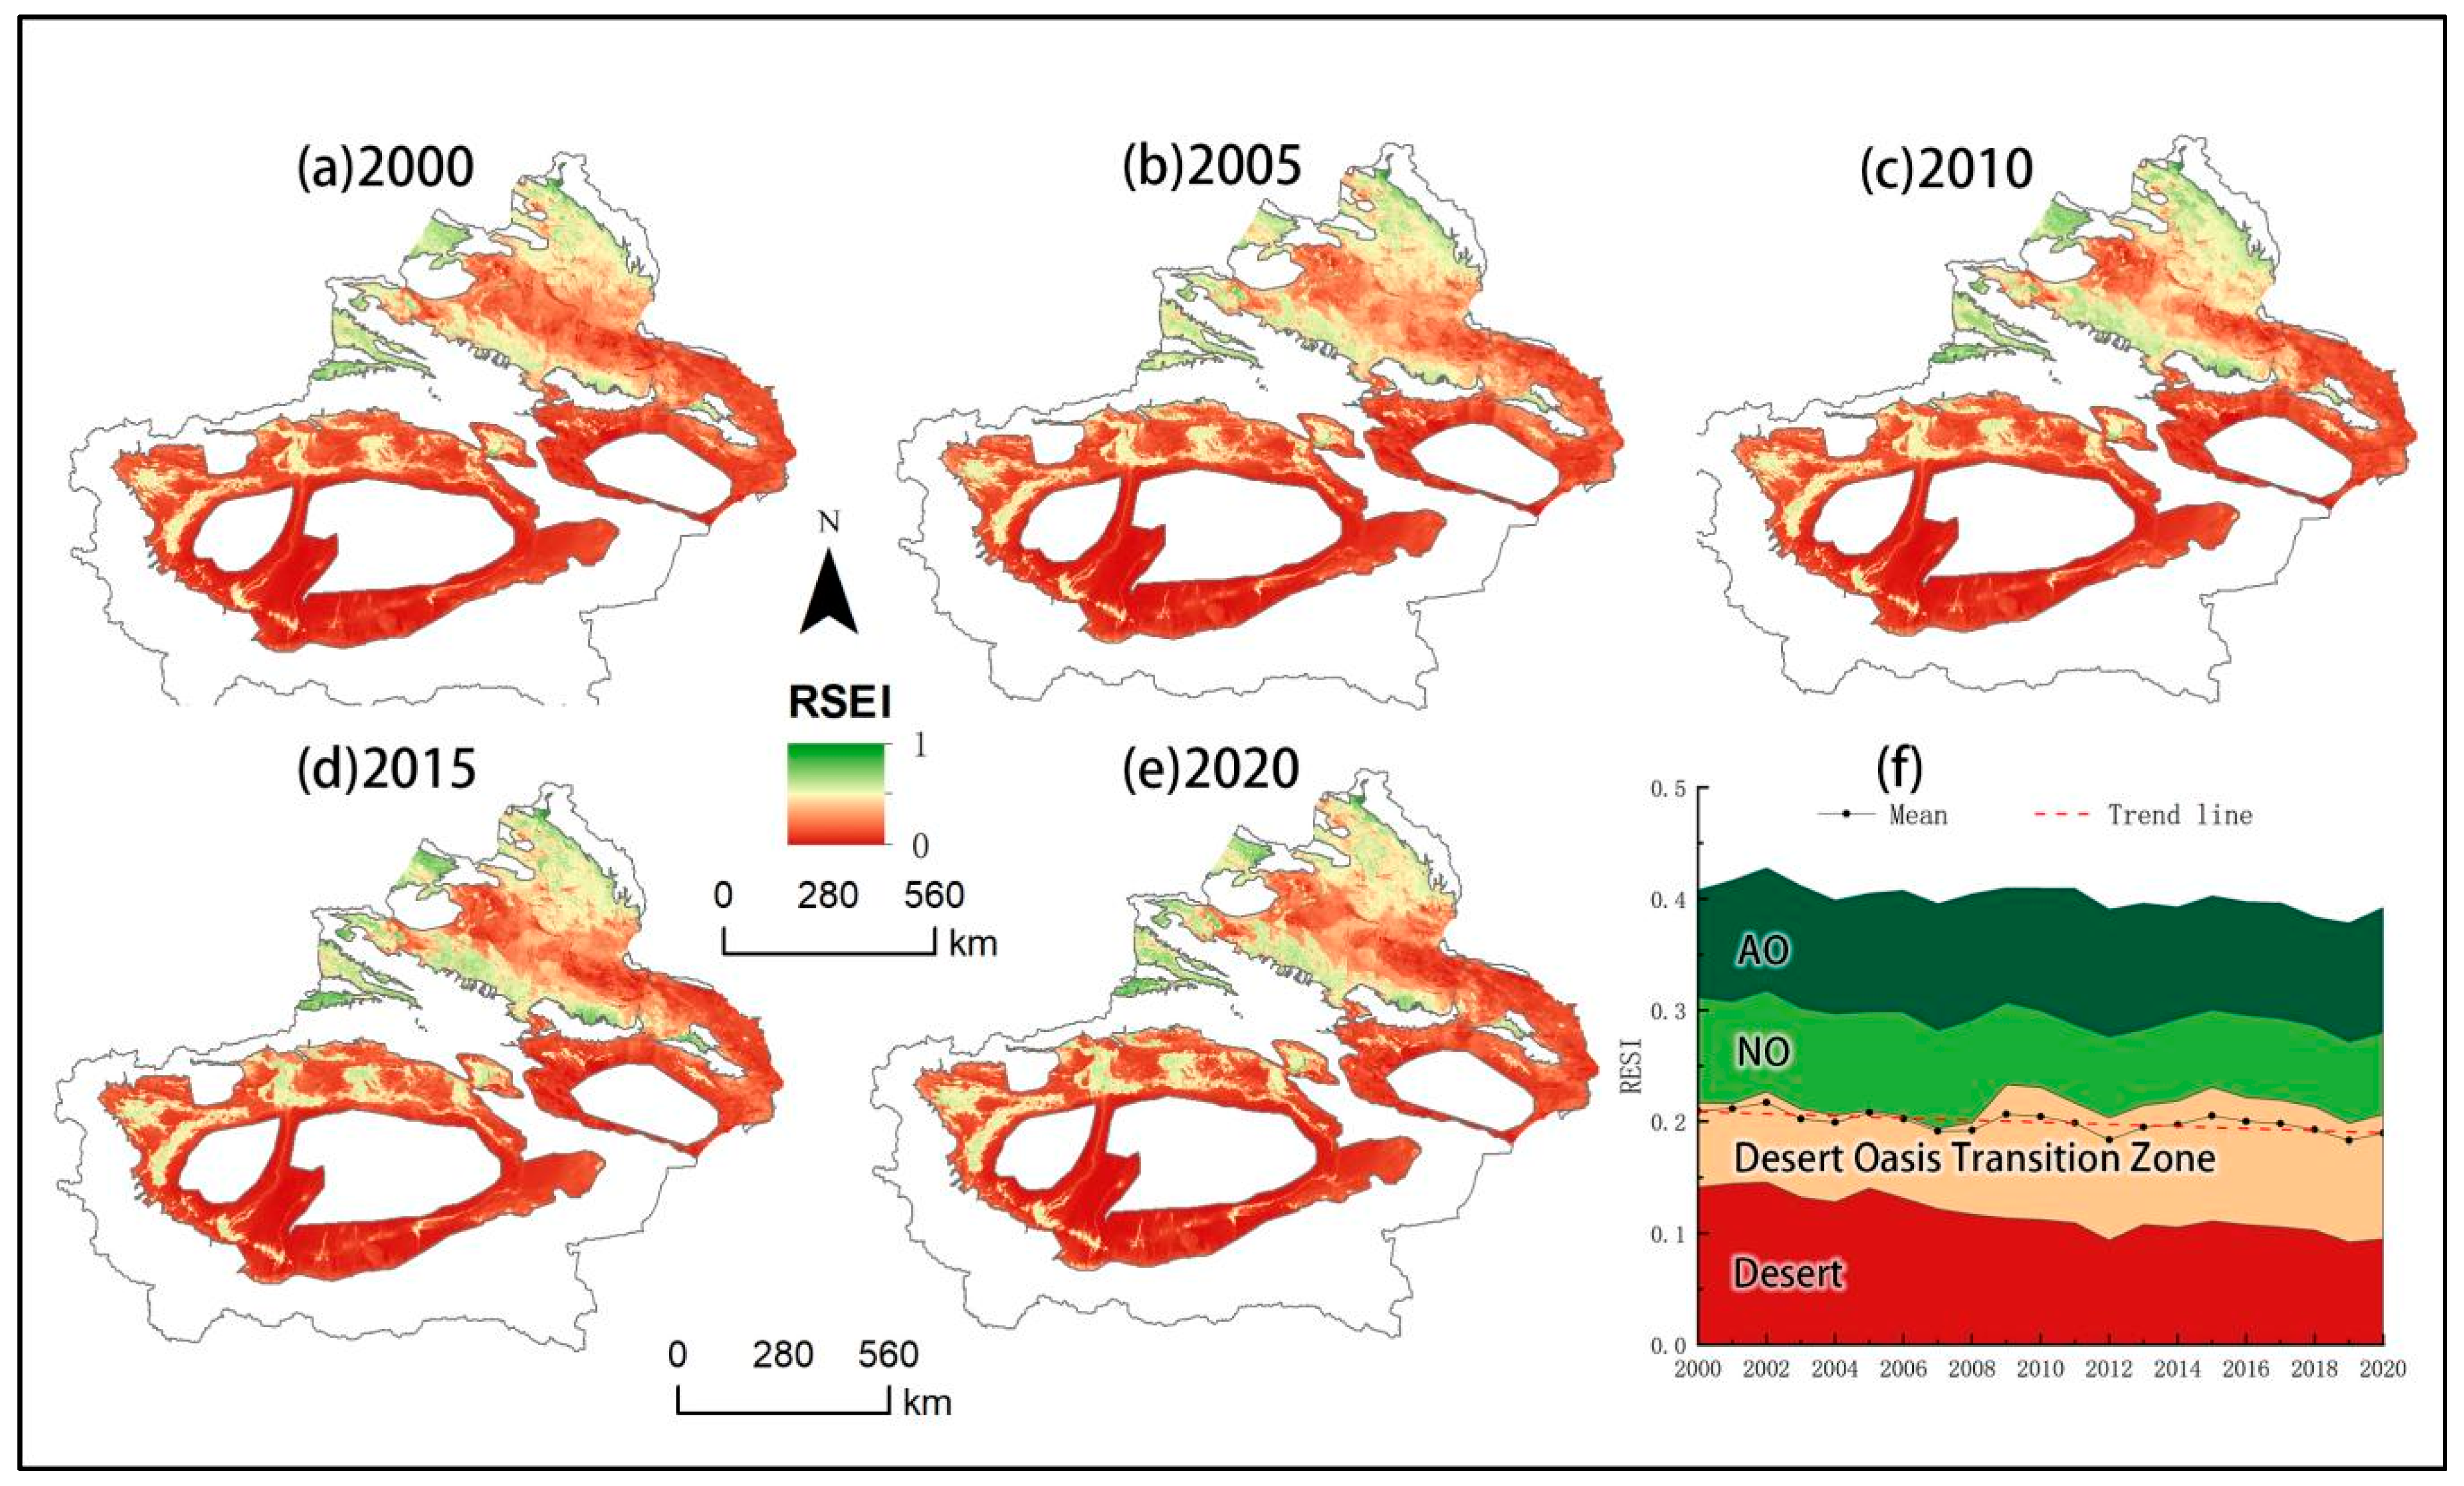
The inter-annual variation in the RSEI (Figure 3) shows that the spatial distribution of ecological environmental quality shows obvious heterogeneity and aggregation (Figure 3a). The distribution of the RSEI is high in the north and low in the south, and the high values are concentrated in the north-western part of the country, mainly in the Yili Prefecture, part of the Tacheng area and the Altay region, and a small portion of them are distributed in the central part of the country such as part of the Changji area and the Hami area. The low values are concentrated in the southern part and the northern desert area (Figure 3f). According to the classification, the average RSEI of the unit area AO is 0.112 higher than that of NO, and 0.212 and 0.301 higher than that of transition zone and desert area, respectively. The mean value of the RSEI for different land classes showed a fluctuating downward trend, with the desert zone showing the largest decline from 0.141 in 2000 to 0.095 in 2020, with a decline of 0.046. The NO RSEI declined from 0.311 in 2000 to 0.280 in 2020, with a decline of 0.041, and the RSEI values of AO and transition zone were more stable in the last 20 years, with a decrease of 0.016 and 0.011, respectively.

Figure 3.
Spatial distribution of annual average RSEI in Xinjiang, 2000−2020 (a–e). Overall oasis and different types of land use RSEI annual mean change statistics (f).
By grading the ecological environment quality and analyzing its inter-annual changes, it can be seen that the proportion of poor RSEI (0−0.2), poor RSEI (0.2−0.4), medium RSEI (0.4−0.6), better RSEI (0.6−0.8), and good RSEI (0.8−1.0) are in the following order: 59.97%, 27.22%, and 12.63%, 0.17%, and 0.01%, and the total percentage of the above areas in the RSEI is 12.81%; the overall ecological quality is poor. The results by time period show (Figure 4a−e), during 2000−2005, the RSEI increased in the north and south of the desert around the concentration of the degraded area, and there was a significant decrease in the distribution of the improved area in the Ili state and Tacheng part of the region; in the 2005−2010 time period, the RSEI overall increase in the northern part of the area is obvious, and in the southern part there is more enhancement of the area of degradation in this period of time compared to the decrease in the previous time period. During 2010−2015, the area of ecological enhancement decreased, and the area of obvious degradation in the north increased, and this phenomenon continued until 2015−2020, when more obvious degradation appeared in the east; overall, large areas of ecological degradation appeared in the northern region of Xinjiang during the period of 2000−2020, and the degradation occurred in the areas of higher ecological quality background value, such as Yili Prefecture, part of Tacheng, most of Altay, and the eastern part of the Hami region. In contrast to the north, the south shows a clear improvement in ecological quality, and only a small part of the south-east shows degradation.
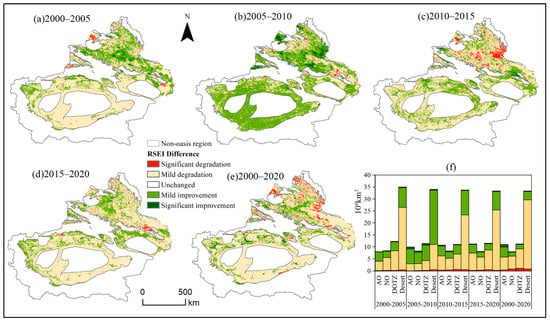
Figure 4.
Spatial distribution of oasis-graded RSEI in Xinjiang, 2000−2020 (a–e). Statistics on trends in oasis area over time (f).
Changes in the ecological quality of different categories showed (Figure 4f) that the overall ecological quality of the oasis was dominated by slight degradation (74.42%), with the percentage of the obviously degraded area being 5.26%, and the ecological enhancement area of 129,100 km2 accounting for 20.32%, of which the ecological quality of AO was enhanced in an area of 52,600 km2 and that of NO was enhanced in an area of 18,400 km2. The degradation of the quality of the ecological environment slowed down from 2005 to 2010, with the degraded area in the four periods being 55,900 km2, 30,600 km2, 52,200 km2, and 57,100 km2. The area of improvement in the quality of the ecological environment being 26,700 km2, 52,200 km2, 28,700 km2, and 22,500 km2.
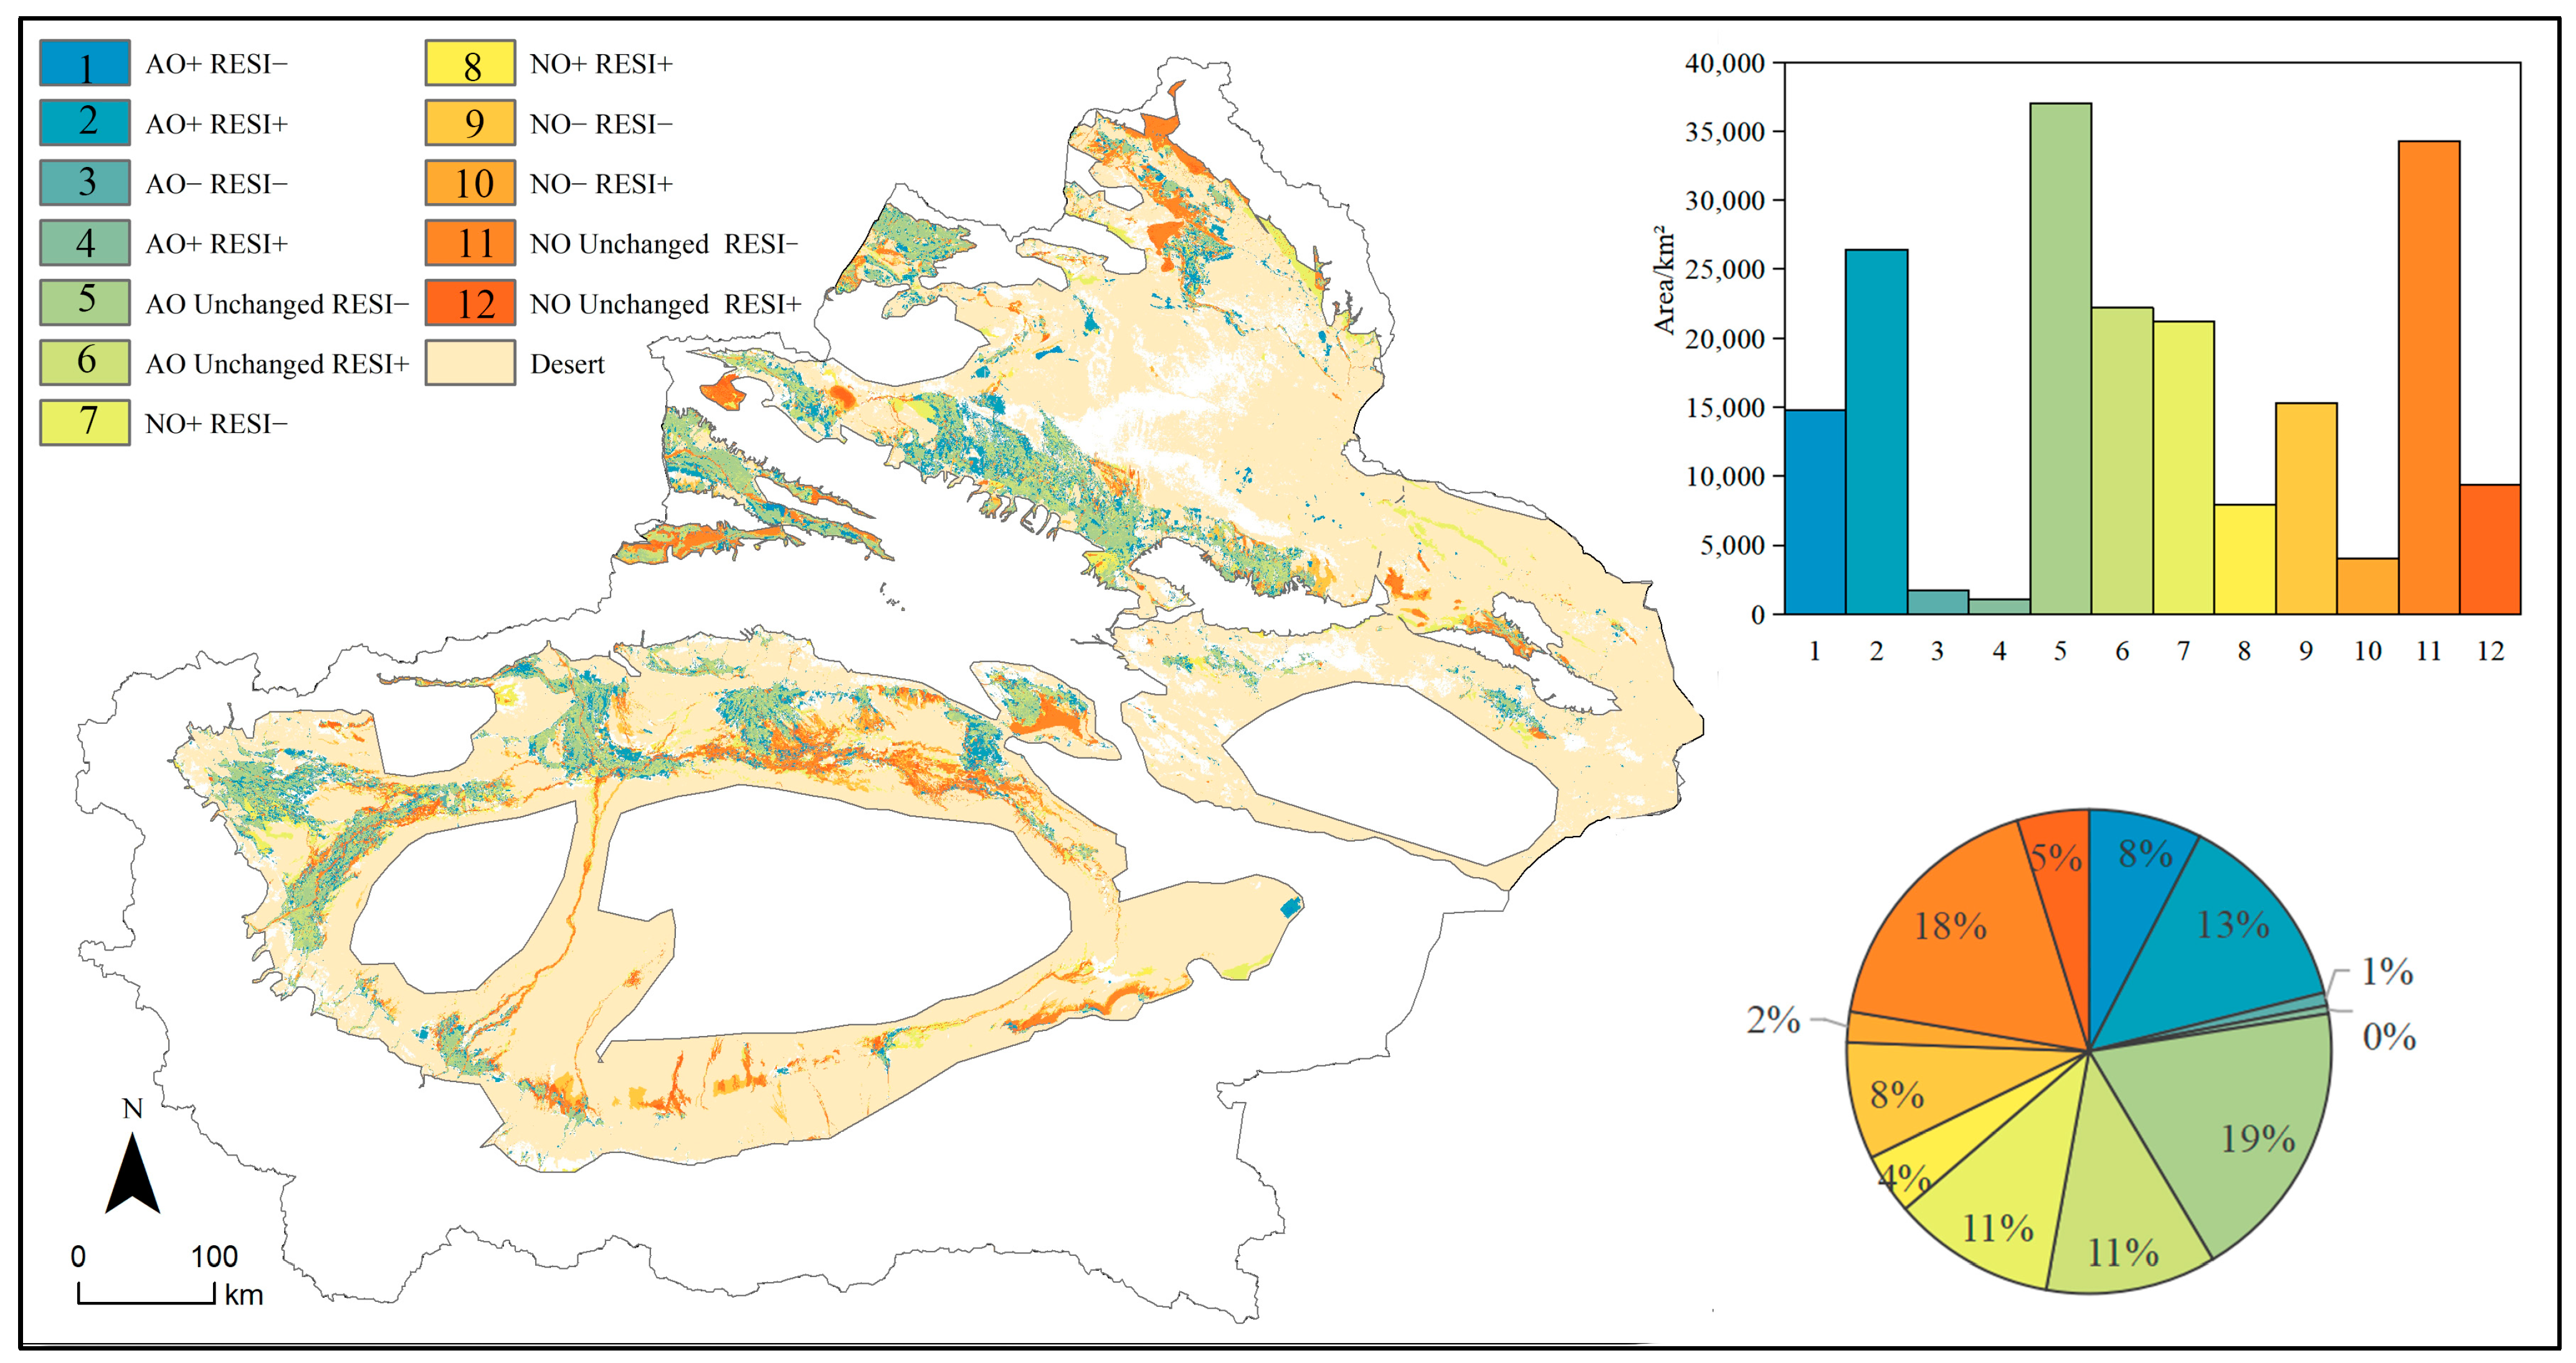
In order to further analyze the relationship between oasis change and RSEI increase or decrease, three cases of oasis increase, oasis decrease, and oasis unchanged area and two cases of RSEI increase or decrease were selected, and the areas of AO and NO change were superimposed on the areas of RSEI change to be analyzed, which were divided into a total of 12 types of change (Figure 5). The results showed that under the condition of unchanged oasis, the RSEI decreased by 36.53% of the total oasis area, which was the main type of change, of which the area of AO was 37,000 km2 and the area of NO was 34,300 km2, indicating that the ecological quality of the original oasis area declined, and this type of change was centrally distributed in the middle and downstream areas of the various oases. In the unchanged oasis condition, the area of RSEI increase is only 31.5 thousand, accounting for 16.15% of the total area of the oasis, mostly distributed in the upper and middle reaches of the oasis with better water conditions, which is dominated by the increase in ecological quality of AO, with an area of 22.2 thousand km2, and the area of NO is only 0.930 thousand km2; the expansion of the oasis brings about the enhancement of the RSEI, which accounts for 34.3 thousand km2, accounting for 0.930 thousand km2 of the total oasis km2, accounting for 17.58% of the total oasis area, with an area of 26,400 km2 for AO and 0.79 million km2 for NO. On the contrary, the oasis expansion caused a decrease in the RSEI value of the area of 18.43%, with an area of 14,700 km2 for AO and 21,200 km2 for NO, which was mainly distributed in the periphery of the existing oasis, and subject to the resource and environmental constraints. This type of change is mainly distributed in the periphery of the existing oasis, and due to the limitation of resources and environment, the transformation between AO and NO is more frequent, and the ecological quality of the oasis is lower.

Figure 5.
Overlay analysis of oasis change and RSEI change, 2000−2020.
3.2. Analysis of Ecological Stability and Future Sustainability of Oases
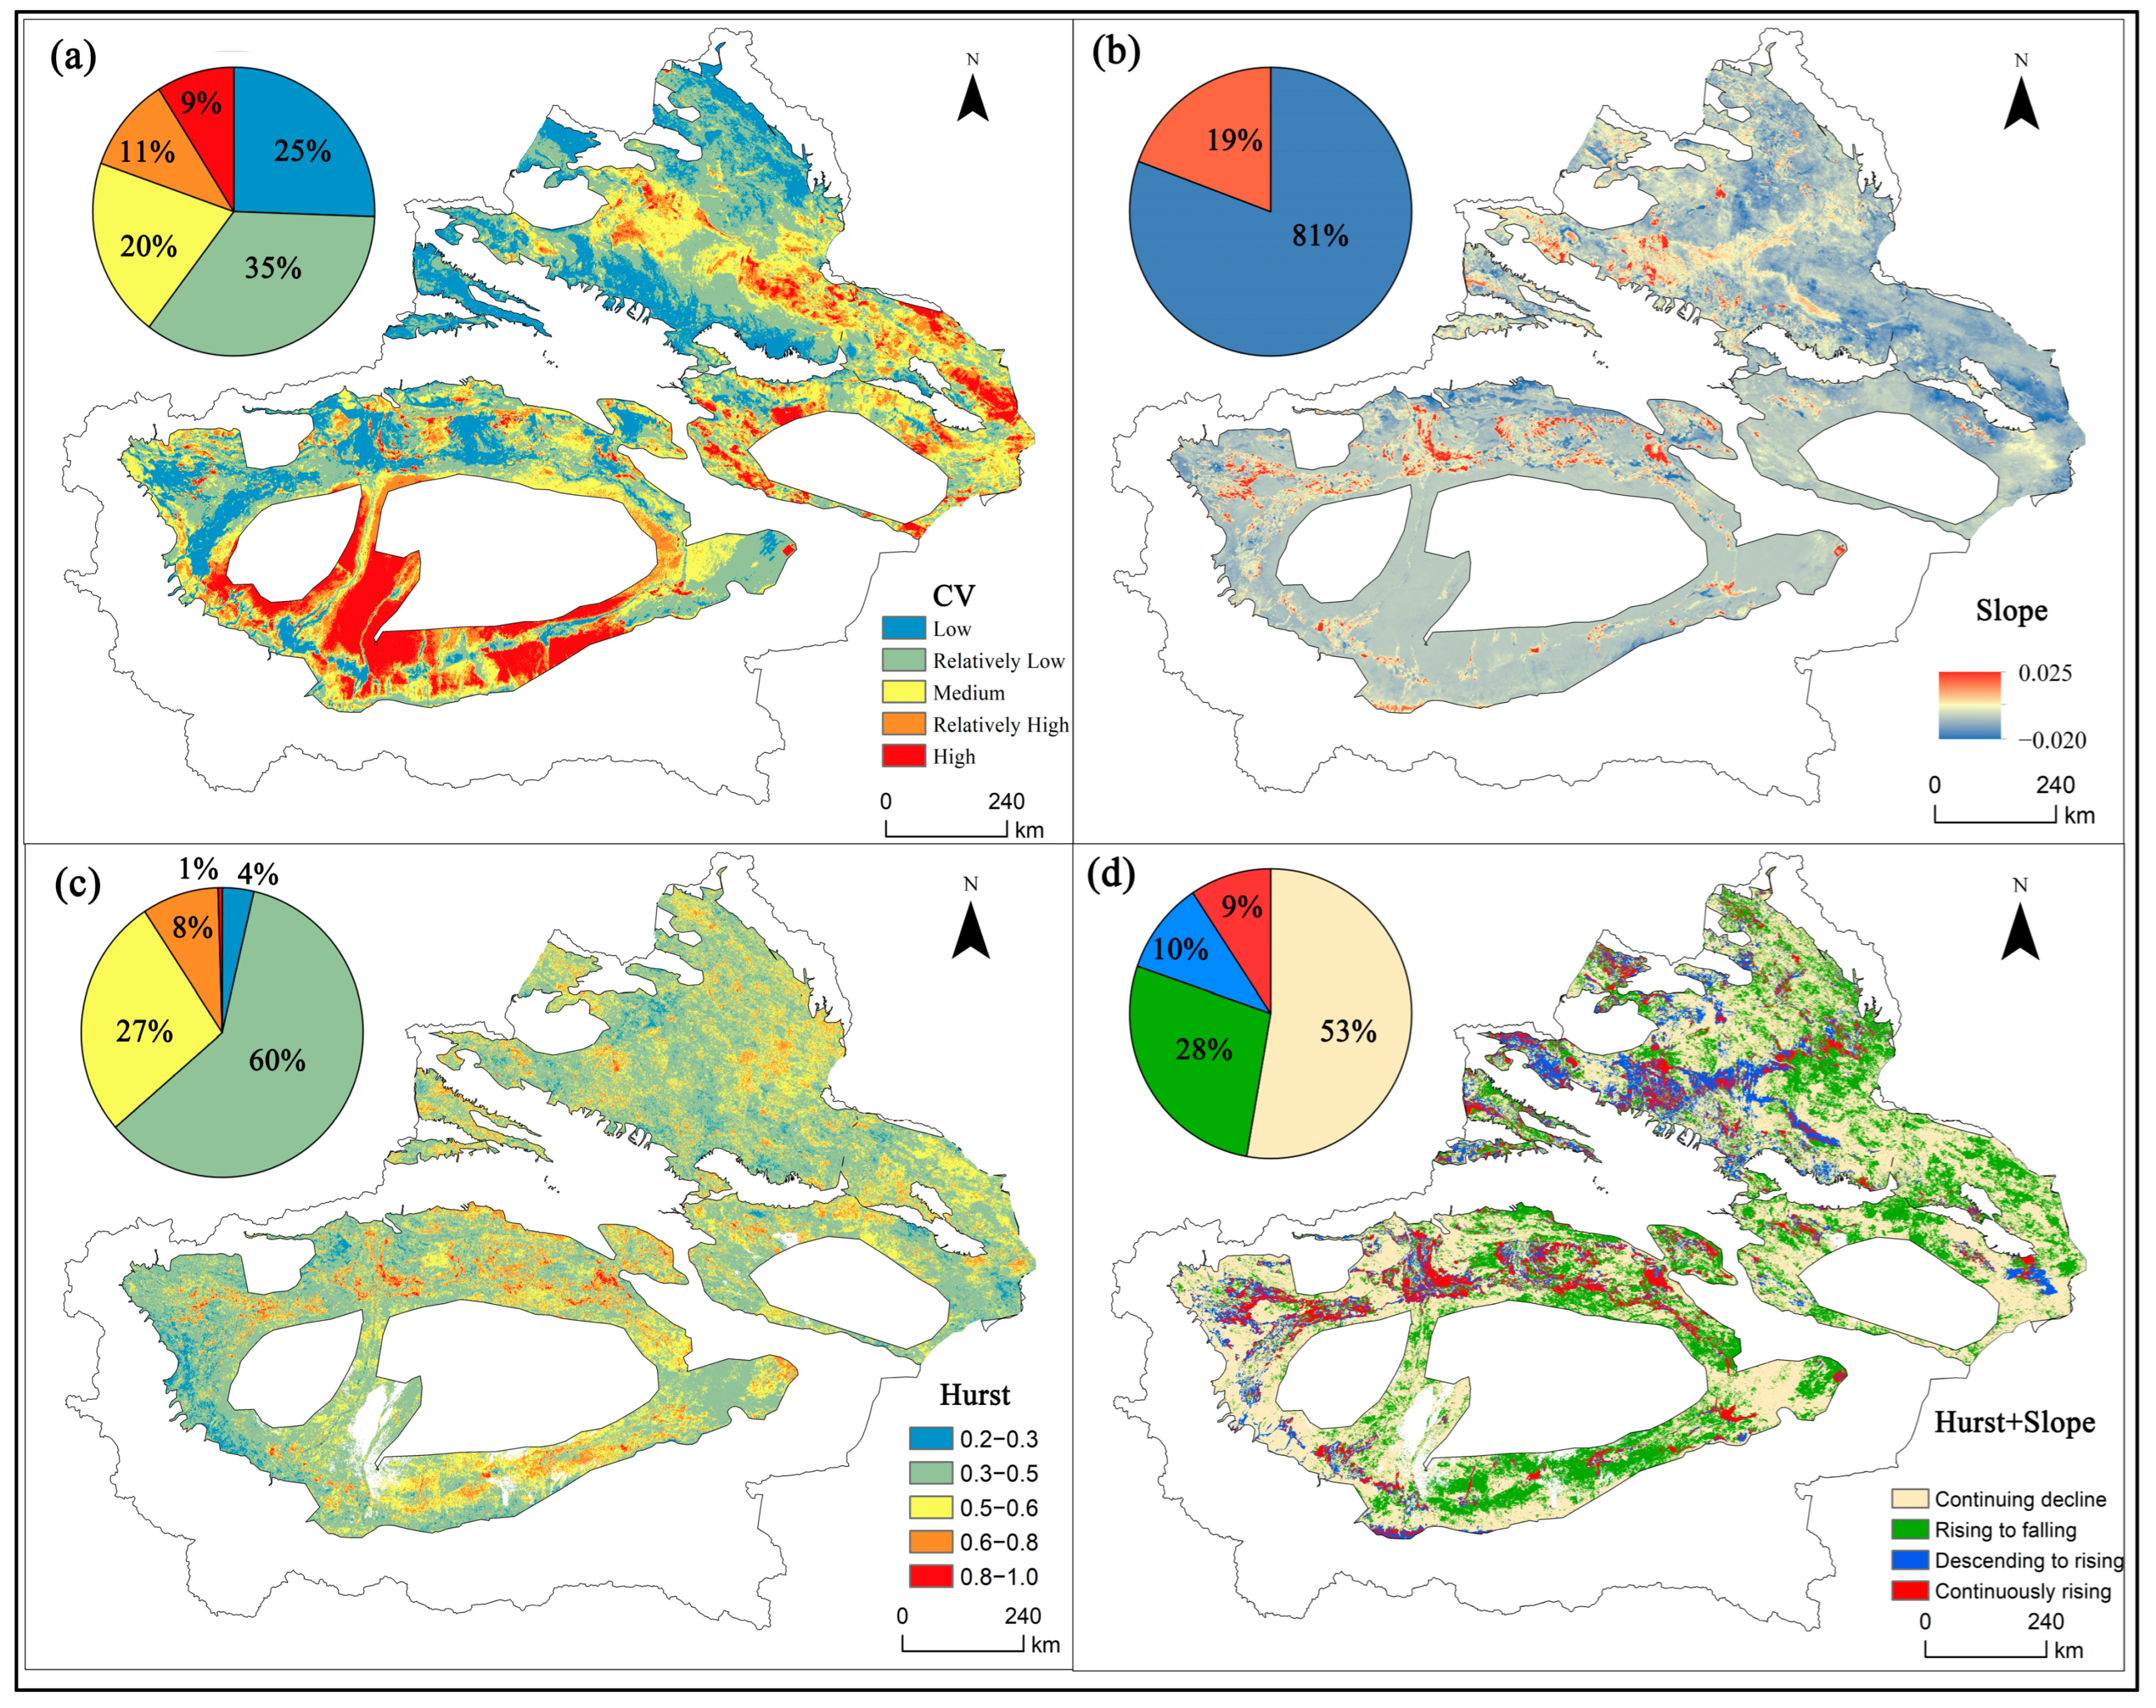
The ecological quality of oases in Xinjiang from 2000 to 2020 is highly stable (Figure 6a), with the area of less than medium fluctuation accounting for 80% of the total area, of which the areas of low fluctuation and lower fluctuation accounted for 25% and 35% of the total area, and were mainly distributed in the range of the existing AOs and NOs. The areas with high and relatively high fluctuations accounted for only 9% and 11% of the total oasis area, and were relatively concentrated in the junction between oasis and desert. The future ecosystem change trend in most regions has a strong continuity, and the trend of ecosystem development is generally favorable. In the last 20 years, the RSEI has been decreasing (slope < 0) in 81% of the total oasis area (Figure 6b), and only 19% of the oases have sustained ecological growth, which are mainly located in the middle and upper reaches of the region with better resource conditions. In order to indicate the future sustainability of the RSEI, it was found by calculating the Hurst index for analysis (Figure 6c) that the areas with a Hurst index less than 0.5 accounted for 60% of the total oasis area, and these areas had inverse sustainability, which indicated that the trend of increasing in the past would be decreasing in the future, and vice versa; the proportion of the areas with a Hurst index greater than 0.5 was 40%, which indicated that the positive direction of the RSEI of the oasis area in Xinjiang would have a stronger persistence. By superimposing the RSEI trends of the oases in the past 20 years with the Hurst index values, the future RSEI trends were categorized into four types: continuously increasing, continuously decreasing, increasing to decreasing, and decreasing to increasing (Figure 6d). The area shares of these four types were 9%, 53%, 28%, and 10%, respectively. Continuous decline of the ecosystem is the main type, mostly distributed in the periphery of oases; the continuous increase in the area of the ecosystem is mostly concentrated in the distribution range of AO, and the area of increase later turned to decline is mainly distributed in the downstream area of natural oasis.

Figure 6.
Stability and future trends of Xinjiang oasis. RSEI coefficient of variation (a), RSEI trend (b), RSEI Hurst index (c), and Hurst index coupled to trend (d).
The statistical results of different land types (Table 3) show that through the statistics of CV value and slope value, the four types of land are ranked in the following order: AO > NO > transitional zone > desert, and oasis area has a higher stability and sustainability compared to the transition zone and desert ecological environment, but the Hurst index shows that this ecological environment will decrease in the trend of sustained growth, in which the ecological environment quality of the AO ecological environment is better compared to the NO in terms of stability and sustainability.
Table 3.
Statistical data on the persistence and stability of different types of oases.
3.3. Evaluation of Oasis Ecosystem Quality Models and Analysis of Driving Factors
3.3.1. Evaluation and Prediction of Oasis Ecosystem Quality Models
In the last 20 years of the research period, due to the large amount of data, this paper selects the results of principal component analysis in 2000, 2005, 2010, 2015, and 2020. From Table 4, it can be seen that the contribution rate of the first principal component is above 70%, indicating that the contribution of the first principal component is dominant, and the data that cannot be expressed account for a relatively small proportion. It can be seen that it is feasible to analyze the ecological quality of the Xinjiang oasis using principal component analysis.
Table 4.
Regression coefficients and principal component contributions of indicators, 2000−2020.
In order to further quantitatively portray the ecological conditions of the oasis in Xinjiang, an ecological model of the oasis in Xinjiang was established for simulating and predicting the trend of ecological changes in the oasis. Firstly, the NDVI, WET, LST, NDBSI, and RSEI thematic images of each year were sampled, and the sampling method of a 1 × 1 km2 grid across the whole image was adopted, with 580,000 sample points taken from each image. A sufficiently large number of sample points and applying the sampling method across the whole image can avoid the uncertainty of the results caused by a small number of sample points and localized sampling.
A stepwise regression analysis was carried out with the ecological index RSEI as the dependent variable, and NDVI, WET, LST, and NDBSI as the independent variables to establish their relationship models (Table 4). From the obtained model, it can be seen that the four indicators are retained in the stepwise regression of five years, which indicates that the four selected indicators are key indicators of urban ecology, and all of them have passed the 1% significance test. In terms of the mean values of the indicators, the humidity and greenness indices are positive, and the dryness and heat indices are negative. This indicates that humidity and greenness are positively correlated with the remote RSEI, and dryness and heat are negatively correlated. In terms of the magnitude of the values, humidity (0.515) > greenness (0.387) > heat (−0.309) > dryness (−0.146), which indicates that among the indices affecting the ecological environment of the oasis in Xinjiang, the humidity and greenness indices have a greater influence on the remote RSEI for every unit length of each index that rises.
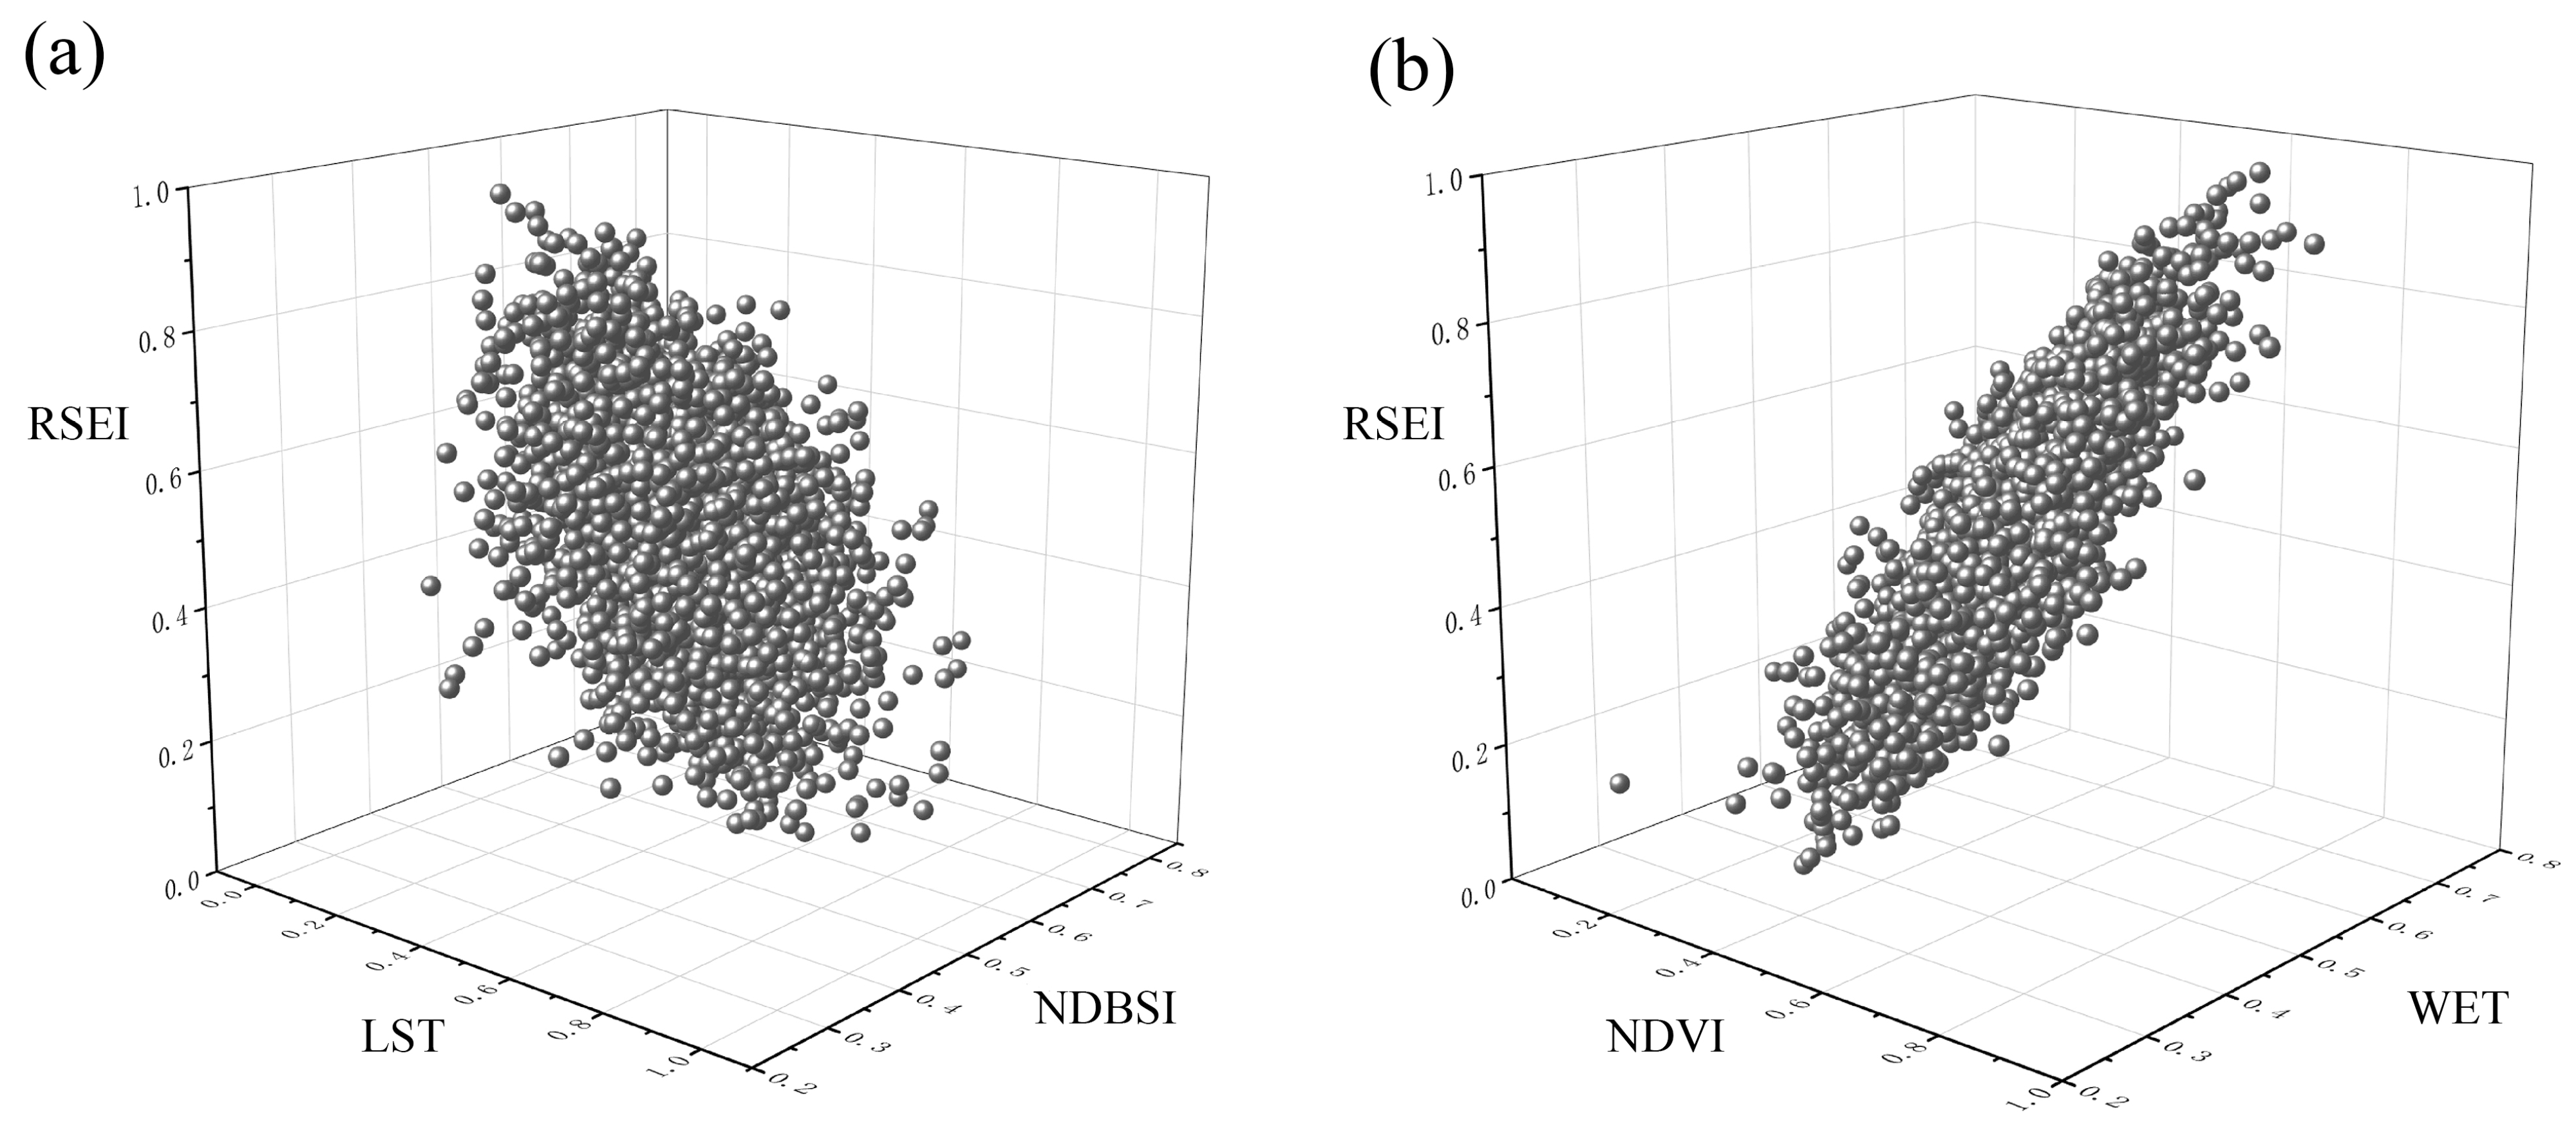
A three-dimensional plot of positive and negative factors versus the RSEI was constructed (Figure 7) in order to further analyze the correlation between the factors and the RSEI. From the three-dimensional relationship diagram, the high values of the RSEI were mainly distributed in the high value areas of NDVI and WET, which play a positive role in the RSEI (Figure 7b). The better the development of vegetation in the area with good moisture conditions, the better the ecological environment quality. NDBSI and LST have a negative effect on the RSEI. An increase in temperature and drought decreases the quality of the ecosystem (Figure 7a).

Figure 7.
Three-dimensional projections of negatively correlated NDBSI, LST, and RSEI (a). Three-dimensional projections of positively correlated NDVI, WET, and RSEI (b).
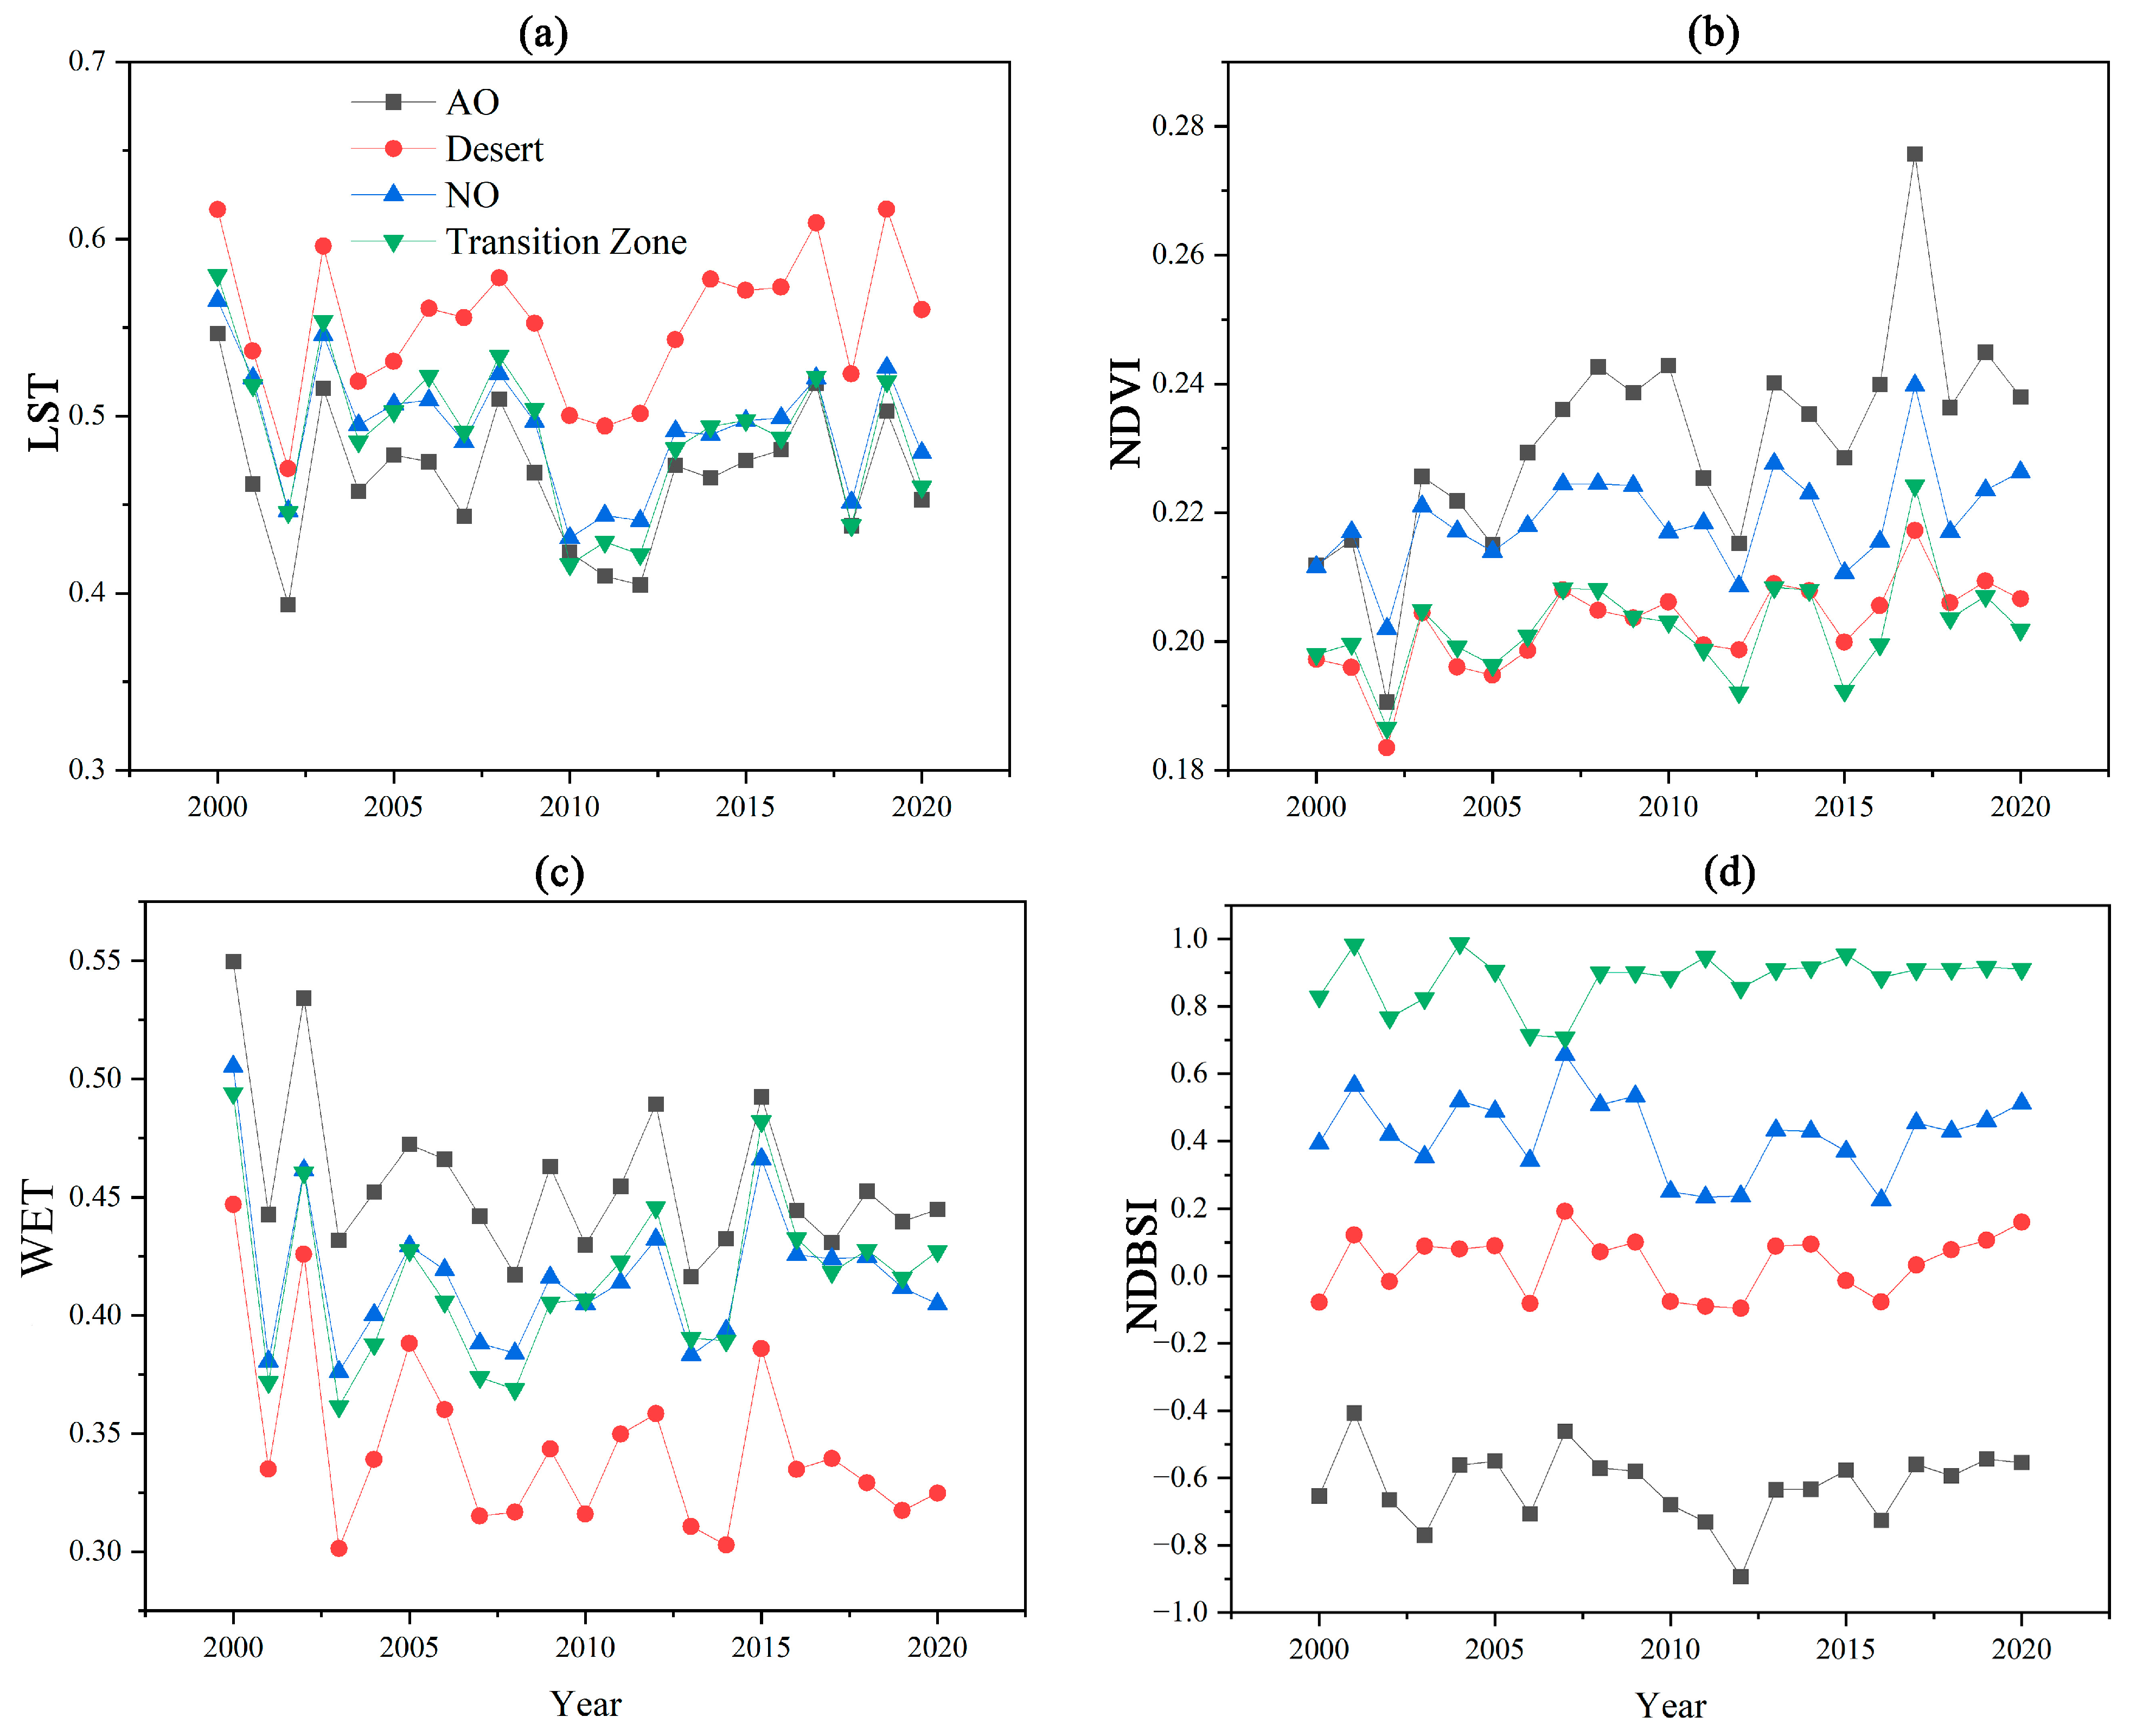
In order to further analyze the variability of ecological quality changes in different types of oases, the mean values of the four indicators from 2000 to 2020 were extracted by land category to create Figure 8. It can be seen from the figure that the NDVI, which is a positive feedback on ecological quality, shows a fluctuating and increasing trend, while the WET shows a fluctuating and decreasing trend. The negative feedback LST has a larger change, but shows a fluctuating decreasing trend. NDBSI, although more stable in value, still exhibits an increasing trend. Under the effect of the four values, although the NDVI greenness index is enhanced and the LST heat degree is decreasing, it cannot offset the negative effect caused by the decrease in the humidity WET and the increase in the dryness NDBSI. Therefore, the ecological quality of the oasis in Xinjiang has shown a continuous downward trend in the past 20 years. Compared with NO, AO has a higher NDVI and WET, while dryness LST and heat NDBSI are the lowest.
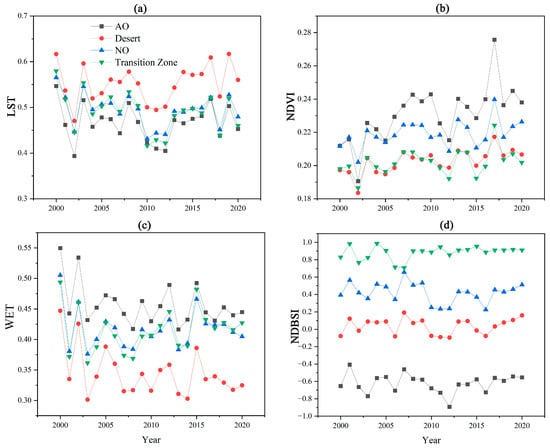
Figure 8.
Chart of changes in indicators over time. LST (a), NDVI (b), WET (c), and NDBSI (d).
Overall, WET and NDVI have the greatest influence on oasis ecology, and WET is greater than NDVI. With the latest 2020 modeling projections, in the future, just about every 0.203 unit increase in WET or 0.212 unit increase in NDVI will result in a 0.1−unit enhancement of the RSEI in the study area. The effect of oasis expansion along with the enhancement of NDVI is significant and it can be seen that the impact of NDVI has continued to grow since 2000, but the negative impact of LST, which represents the heat, has continued and has an increasing trend. From the coefficients of the regression model, it can be seen that the influence of LST has been increasing since 2000 and has exceeded that of NDBSI, which is the reason for the decrease in WET and the increase in NDBSI.
3.3.2. Oasis Ecosystem Quality Drivers
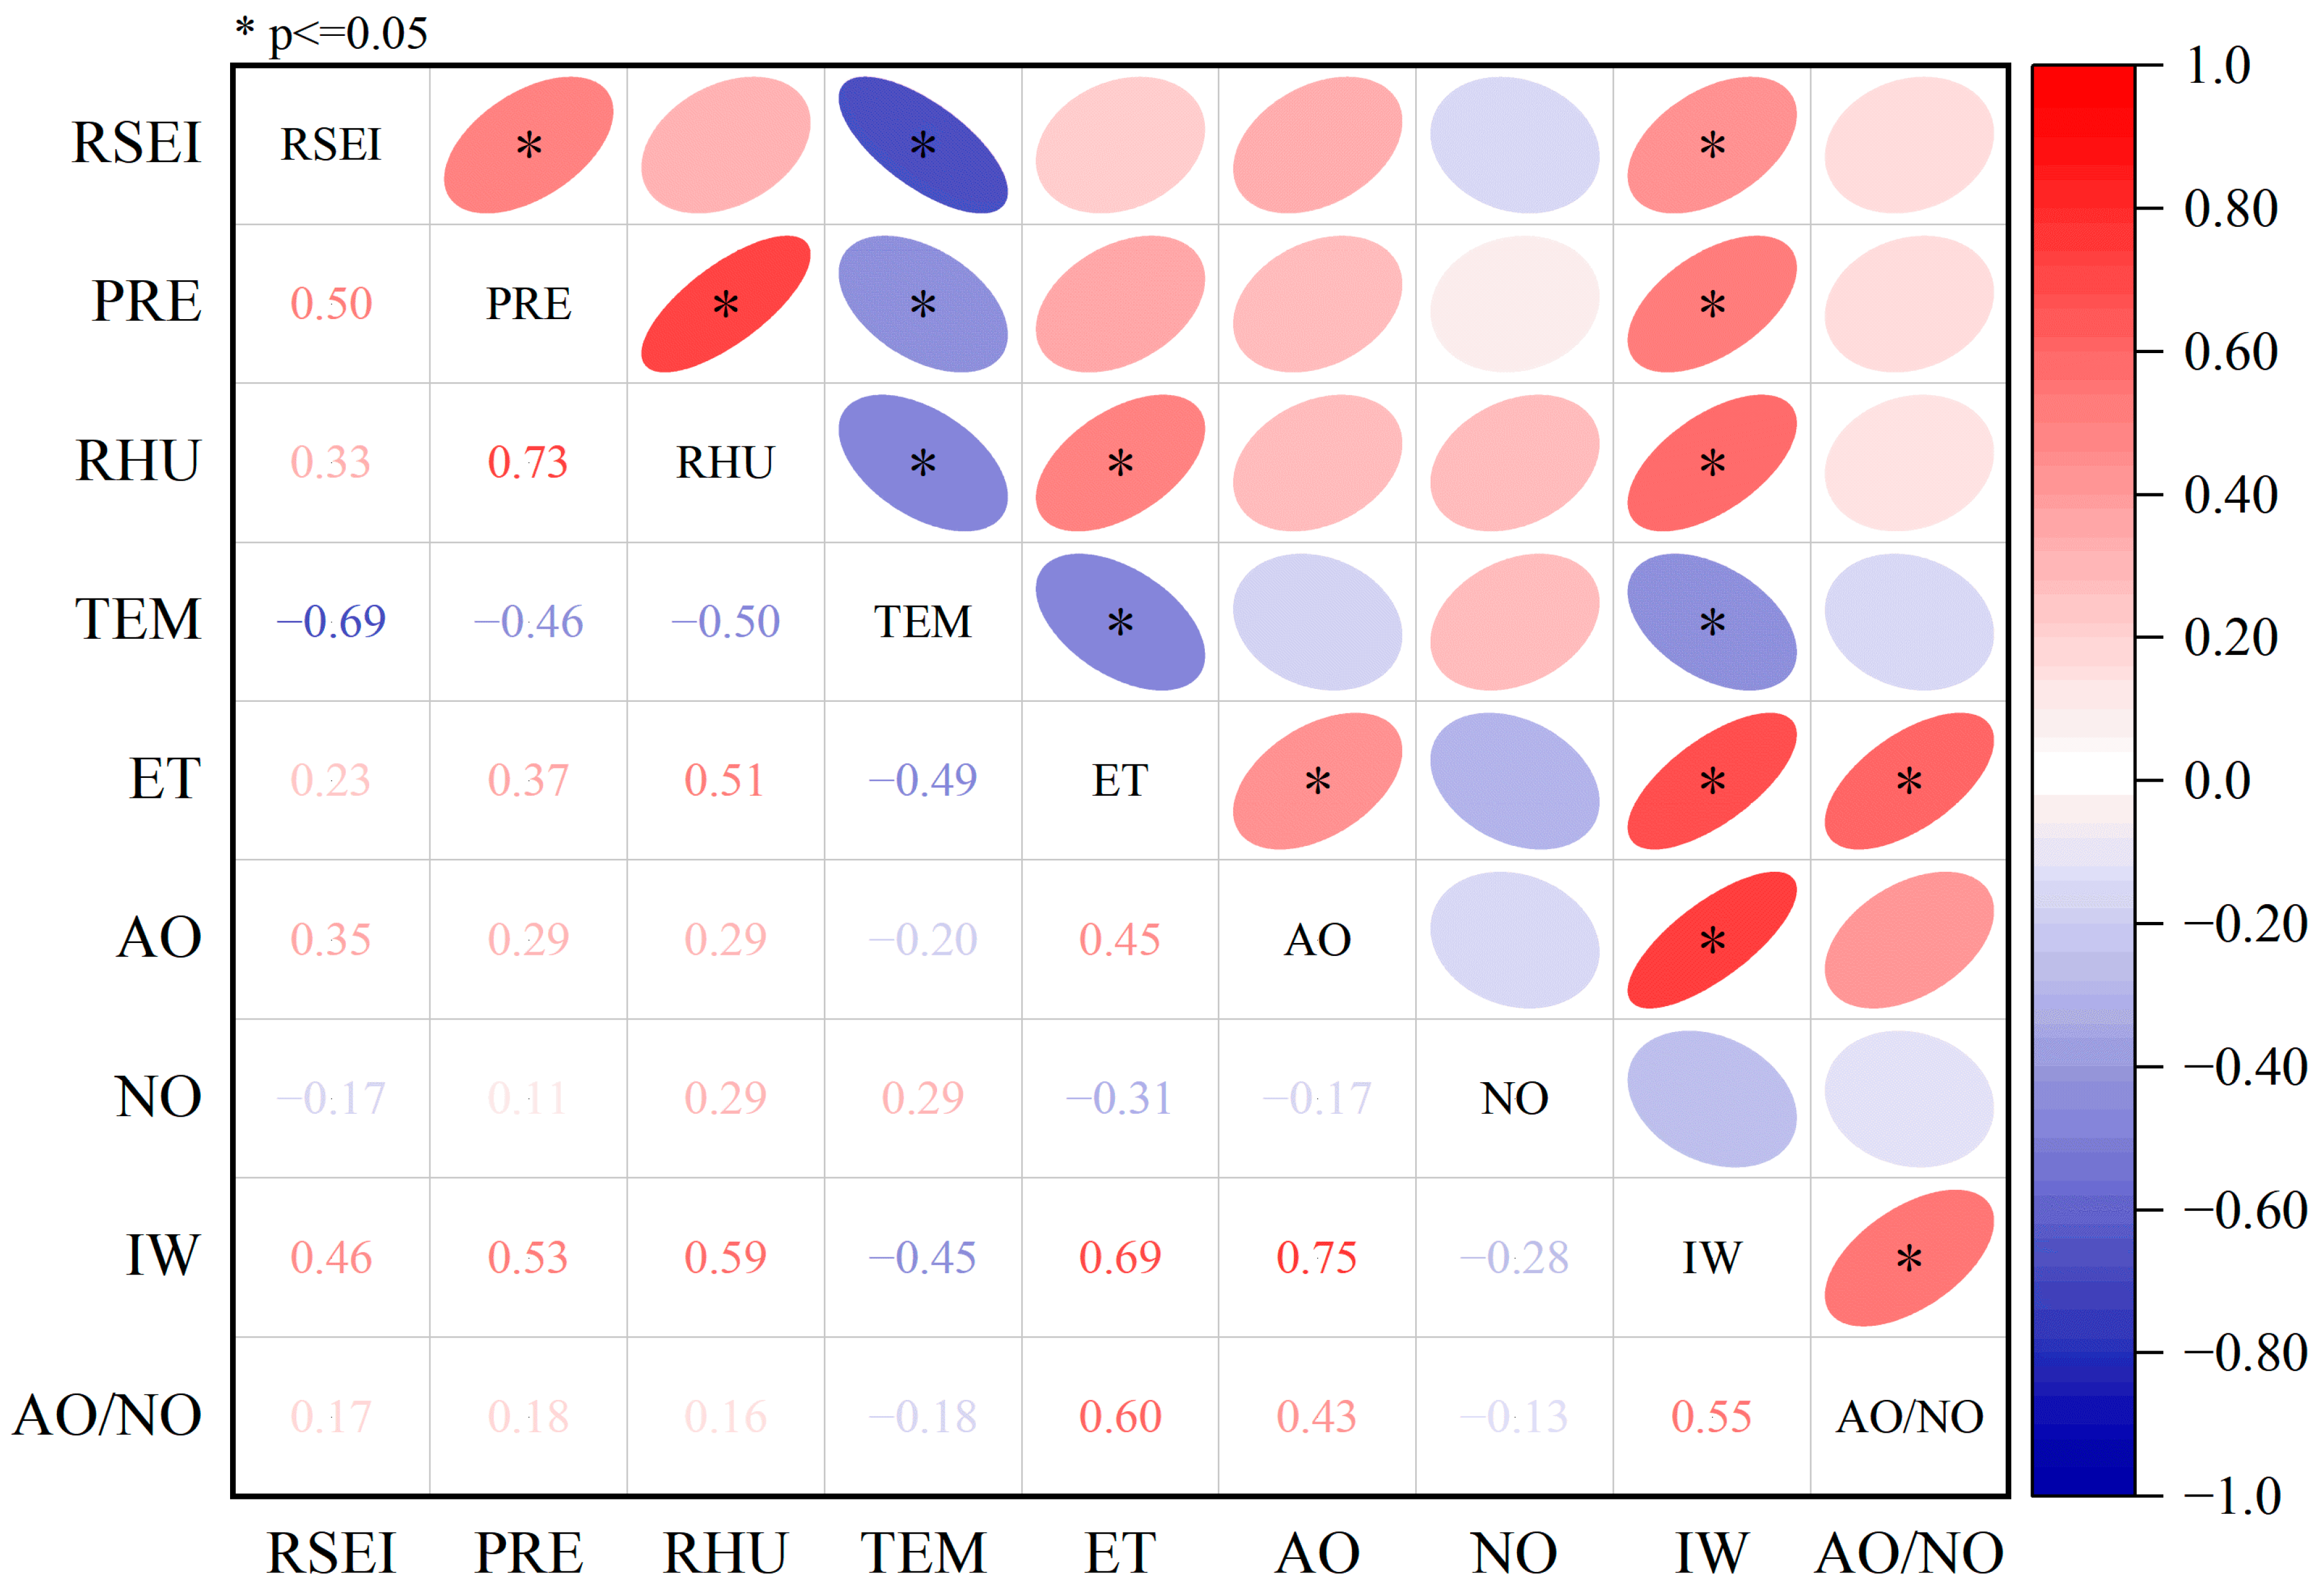
Climate change and human activities are the main factors causing changes in oases, and the changes in oases will directly or indirectly affect the ecological quality of oases [5]. In order to reflect the degree of correlation among the indicators, precipitation (PRE), relative humidity (RHU), air temperature (TEM), evapotranspiration (ET), area change of AO (AOC), area change of NO (NOC), agricultural irrigation water (IW), and percentage of artificial oases (AO/NO) were selected. Figure 8 presents the correlation matrix between changes in the RSEI and selected climatic and agricultural variables.
A significant negative correlation (= −0.69) between TEM and RSEI suggests that increased temperature may adversely affect the ecological health of the study area (Figure 9). Meanwhile, the positive correlation between RHU and RSEI (= 0.33) implies that an increase in humidity may be favorable to the ecosystem, and these results reveal the potential impact of climatic variables on regional ecosystem health. As for other variables, although their correlations with the RSEI were not as significant as those of temperature and humidity, they still provided valuable information. For example, PRE and IW were positively correlated with the RSEI (= 0.50 and = 0.46, respectively), suggesting that humidity conditions along with water use for agricultural irrigation have a significant impact on the ecological index. It is worth noting that the increase in ecological quality was not significantly related to the increase in artificial or natural oases.
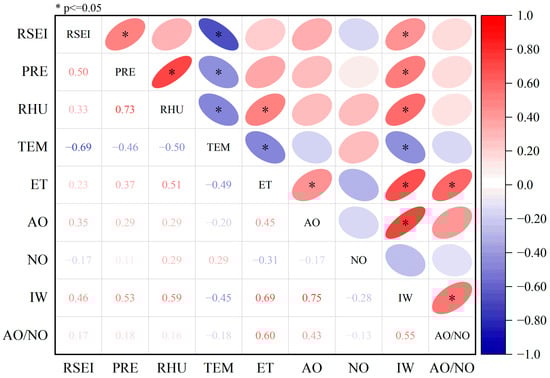
Figure 9.
RSEI correlation coefficient matrix. The shade of the color varies with the strength of the correlation: red indicates a positive correlation and blue indicates a negative correlation. Correlation strength varies from −1 (perfect negative correlation) to +1 (perfect positive correlation), where 0 represents no correlation. Significant correlations in the table are marked by an asterisk (*).
3.3.3. Analysis of Drivers of Ecological Environment Quality Change
In order to assess the degree of influence of various drivers on the change in ecological environment quality, the q-value of the degree of influence of the interaction of each driver on habitat quality was calculated based on geodetector, and the results are shown in Table 5. The effects of each factor on habitat quality were as follows: PRE (0.83) > RHU (0.82) > ET (0.57) > AO/NO (0.47) > IW (0.42) > TEM (0.42) > NOC (0.39) > AOC (0.15). From the results of the detection of the driving factors, PRE among the natural factors had the greatest explanatory power for the habitat quality, and PRE, RHU, and ET were able to influence the changes in ecological environment quality to some extent, with strong factor interactions. The growth of AO was the main human factor influencing the changes in habitat quality, and the interaction between the natural factors and the growth of AO had significantly increased explanatory power for the changes in the habitat quality in the study area. In summary, the results of interaction detection between the driving factors all showed two-factor enhancement and non-linear enhancement; there are interactions between different factors, and the combined effect of natural and human factors will enhance the impact on the ecological environment. Therefore, while developing the regional economy and implementing engineering activities, it is of great significance to reasonably control the development of the oasis to protect the ecological environment and resources.
Table 5.
Interaction detection results of ecosystem quality drivers.
3.3.4. Seasonal Correlation between Changes in Ecosystem Quality and Indicators
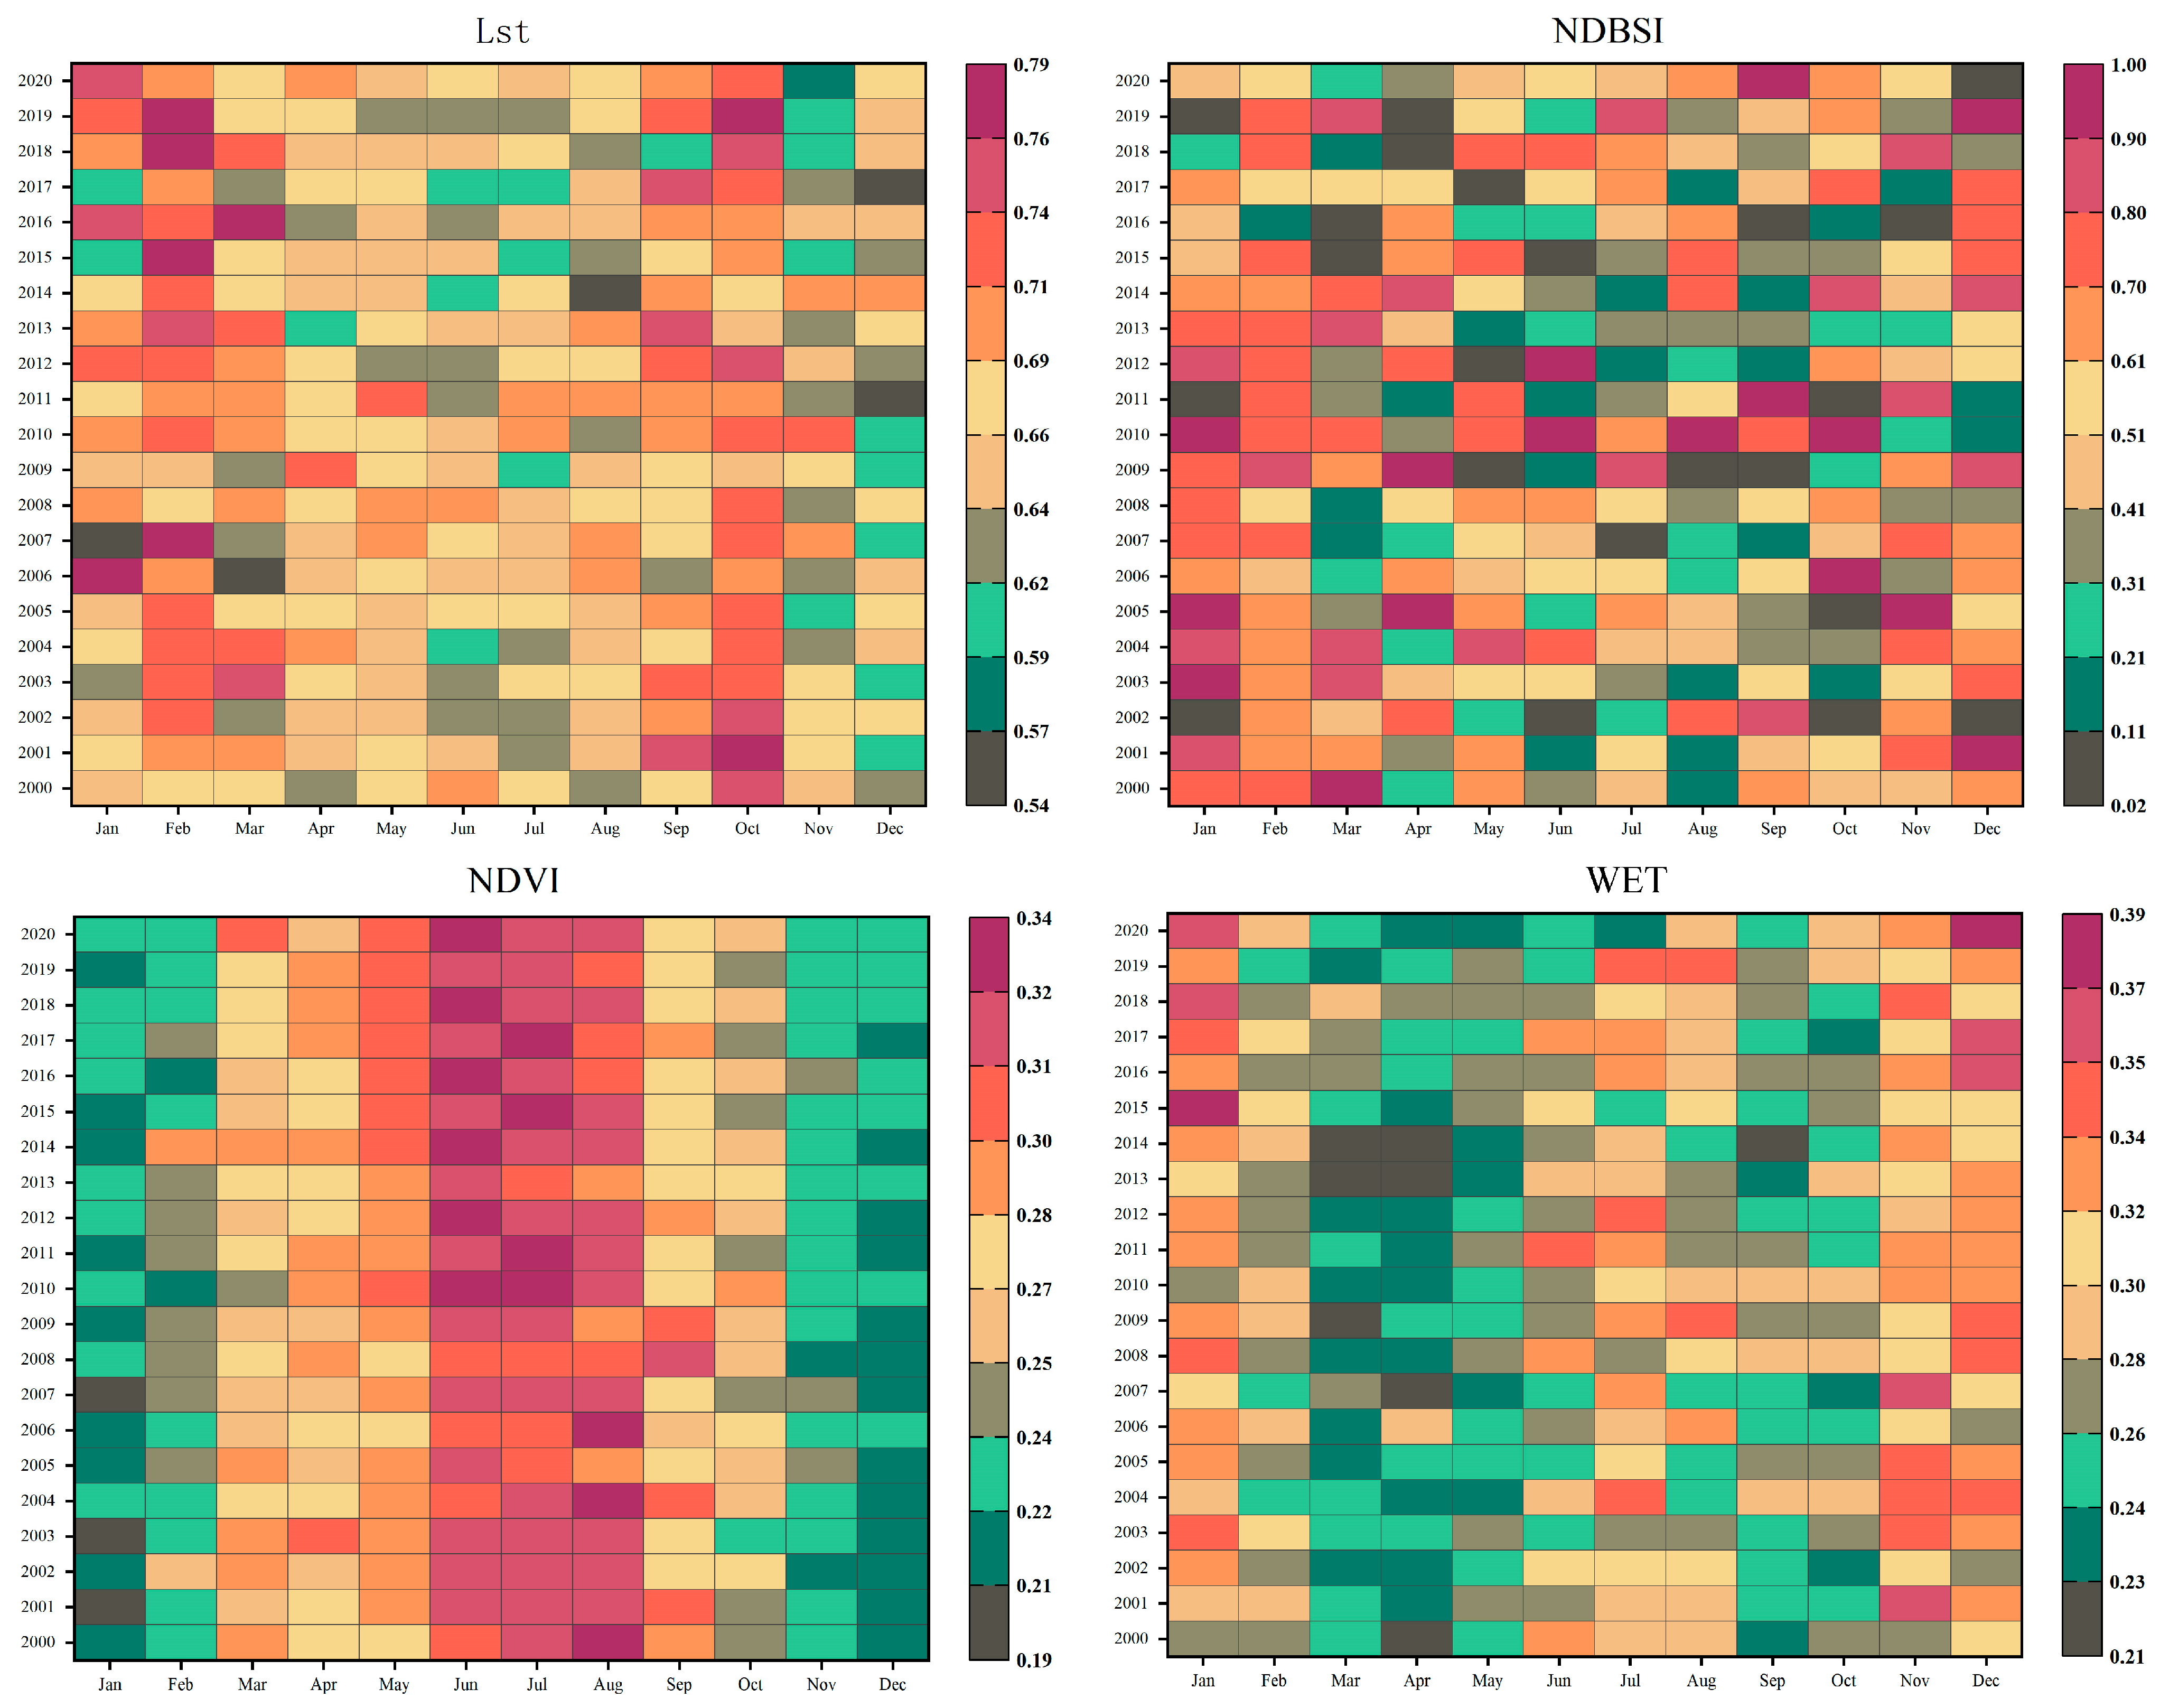
In impact studies of ecological change, monthly scale data can capture rapid changes driven by seasonal climate patterns and biogeographic processes, and to avoid the possibility that these changes may be smoothed or missed at annual scales, key environmental indicators such as LST, NDBSI, NDVI, and WET were analyzed through the monthly changes in environmental indicators to assess the association between these indicators and the RSEI (Figure 10).
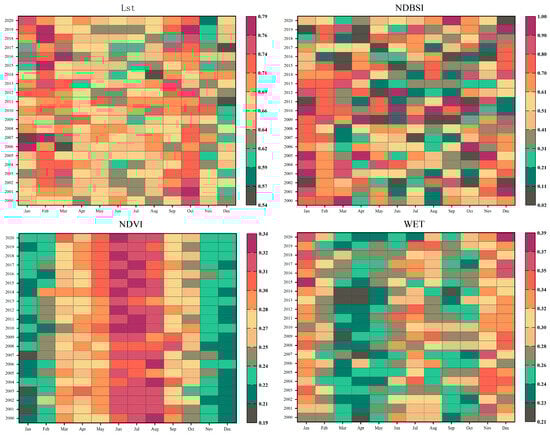
Figure 10.
Statistical chart of monthly scale indicators.
The LST subplot shows a clear seasonal variation, with the summer months showing higher temperature values. The NDBSI subplot reveals monthly changes in bare ground cover across years, corresponding to possible land degradation or other environmental change processes. The NDVI heatmap shows how the intensity of vegetation activity varies seasonally, with spring and summer months typically showing higher vegetation densities. WET reflects seasonal and interannual variability in precipitation patterns and/or surface moisture conditions.
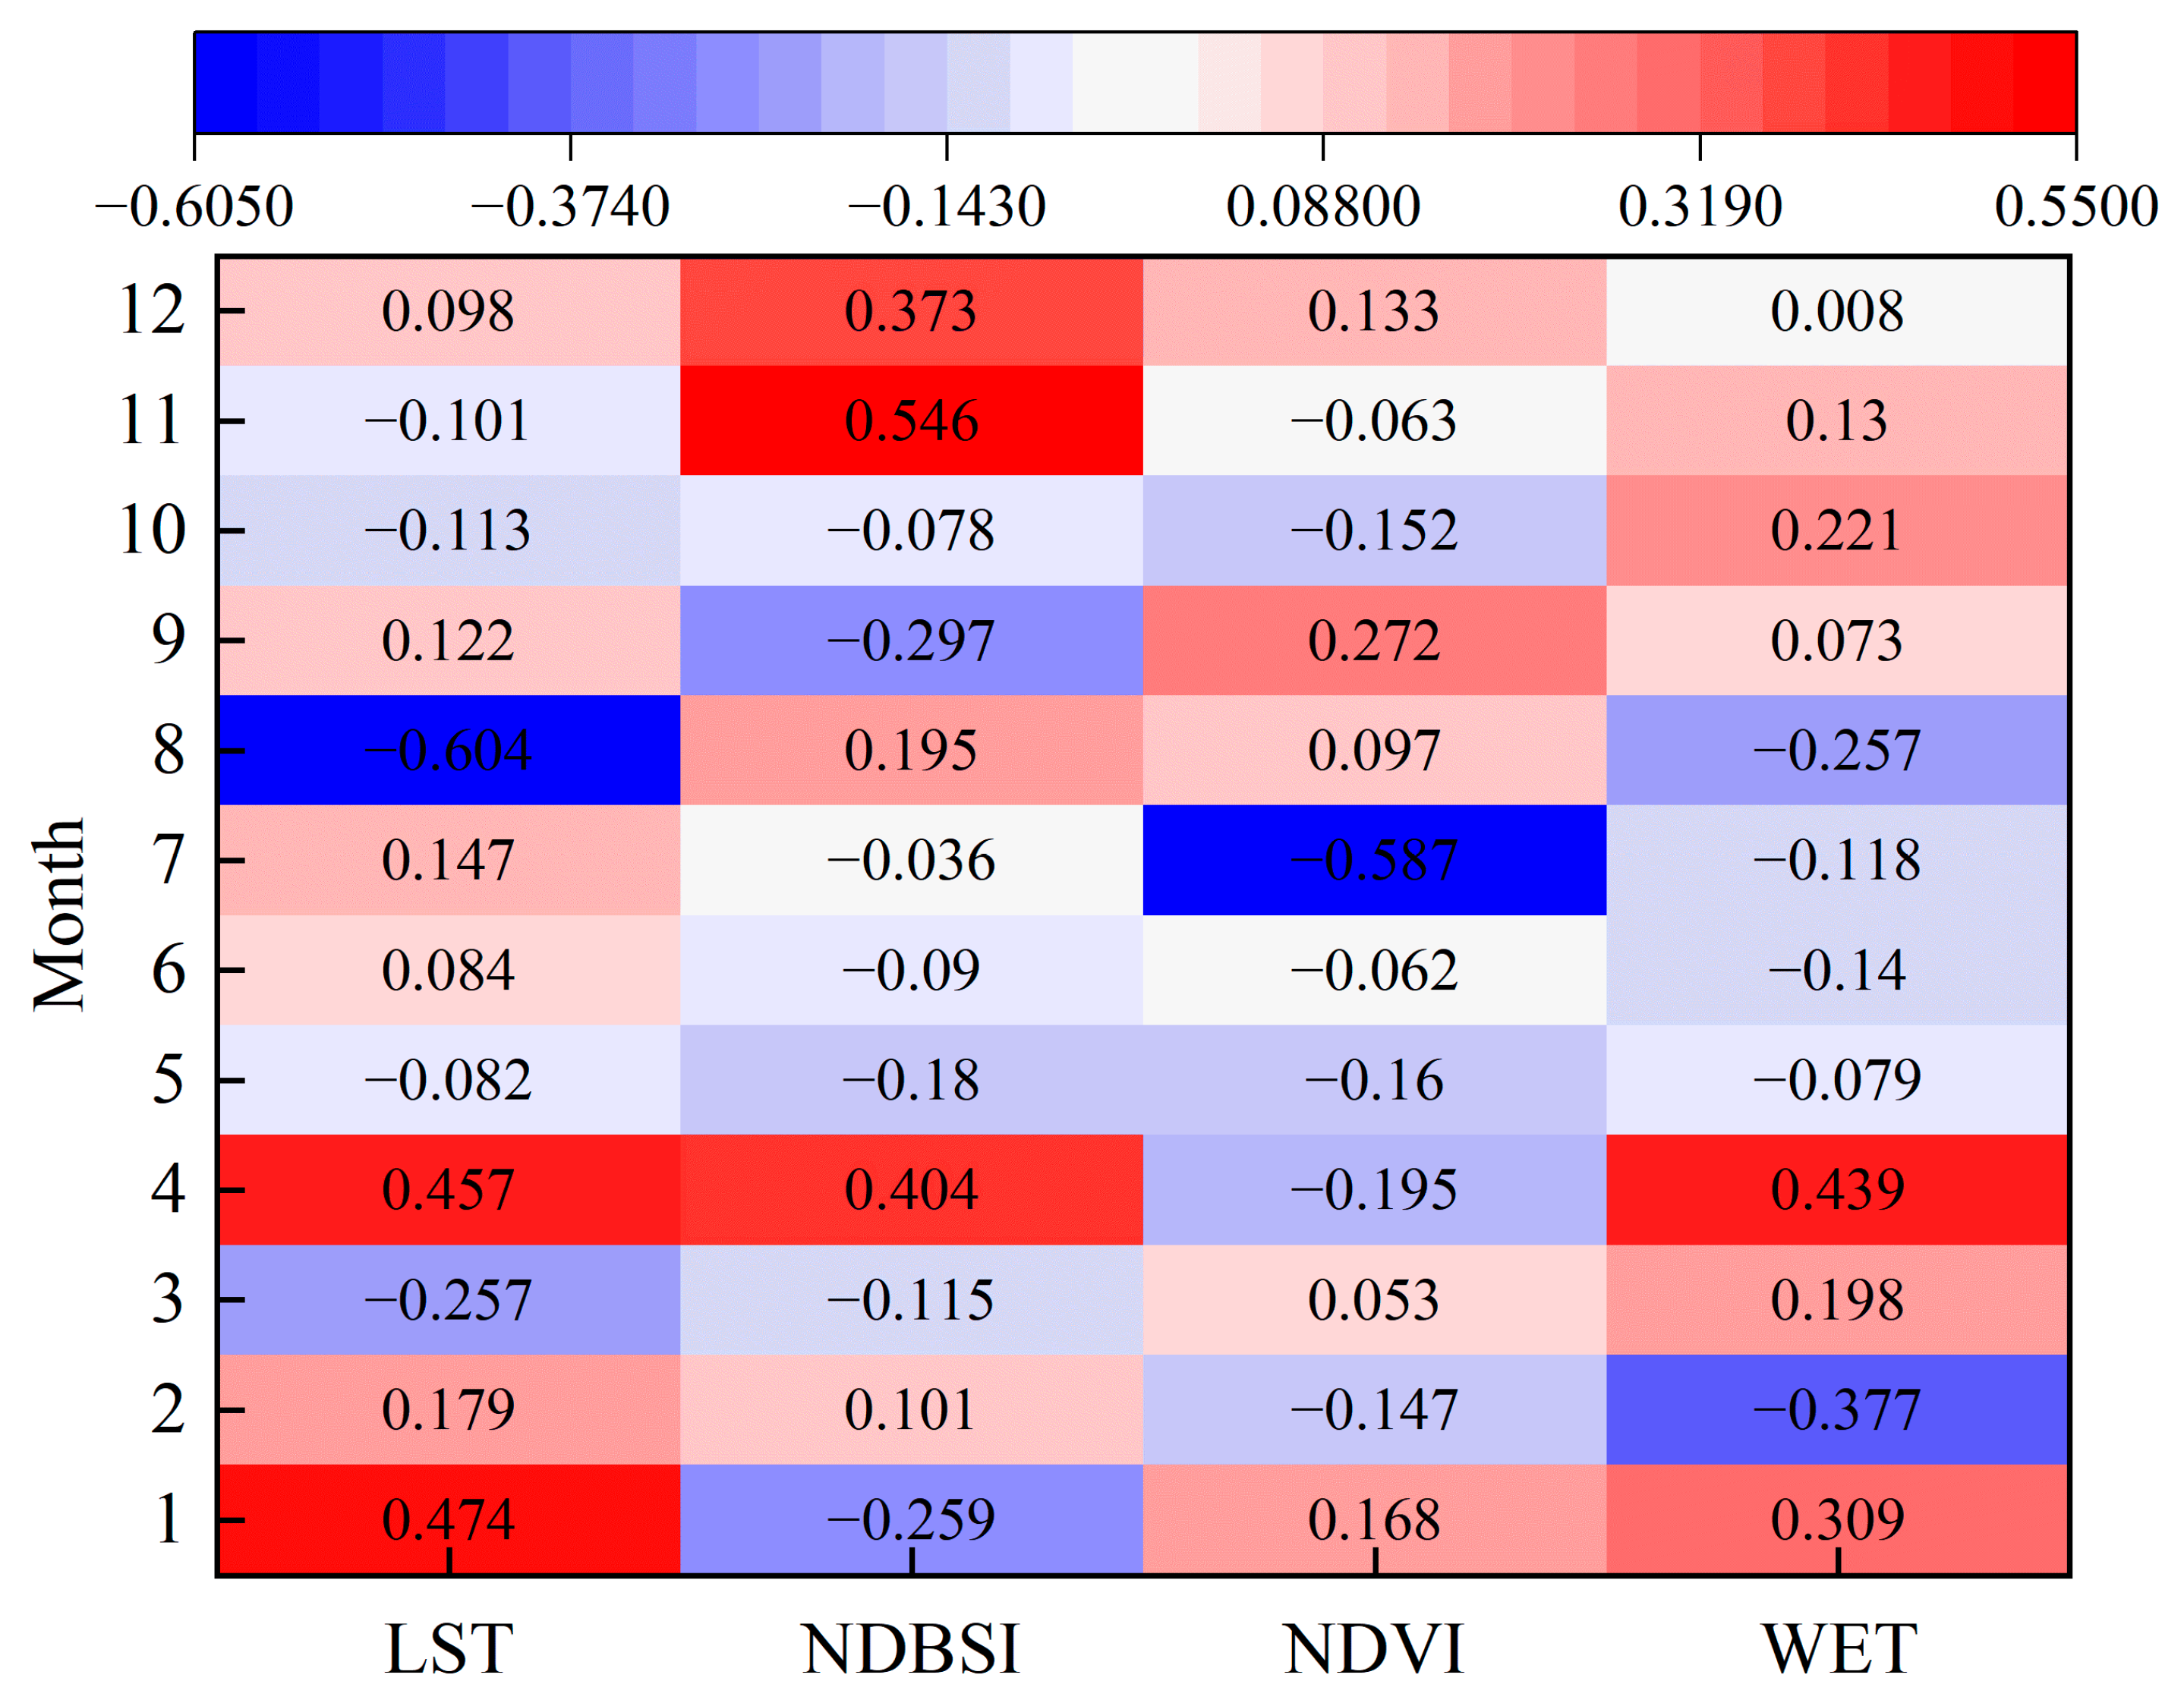
To quantify the interrelationships between these indicators and the RSEI, the correlations between the RSEI and key environmental indicators for each month between 2000 and 2020 are presented in the form of heatmap through further statistical analysis to reveal the dominant factors determining the health of the ecosystem (Figure 11). The analysis shows that the correlations between the RSEI and the indicators exhibit significant seasonal variations across months. In winter months (especially January and February), the correlation between LST and the RSEI was more significant, with correlation coefficients of 0.474 and 0.179. This may reflect the important impact of low winter temperatures on ecosystem health. In contrast, WET was more strongly correlated with the RSEI in the spring (March and April) and fall (October), suggesting that moisture conditions are particularly critical to ecosystem quality during these seasons.
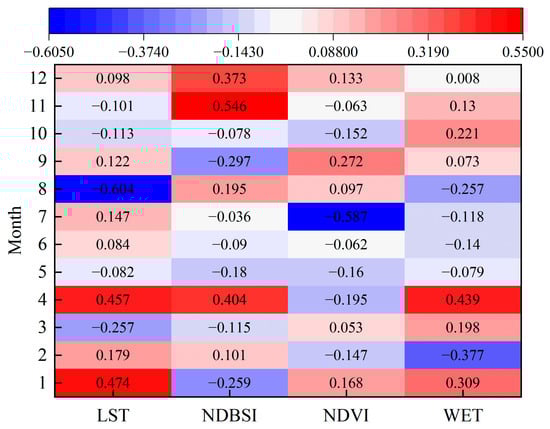
Figure 11.
Matrix of correlation coefficients between the 4 indicators and RSEI.
Notably, the positive correlation between NDVI and the RSEI was most significant in September at the end of the growing season, with a correlation coefficient of 0.272, emphasizing the critical role of vegetation density in maintaining ecosystem health. In addition, the correlation between NDBSI and the RSEI was significantly higher in the late months of the year (August, November, and December), with the highest correlation coefficient of 0.546 in November, reflecting the association between the increase in bare land and ecosystem degradation. These findings reveal the complexity of the seasonal variation in the effects of different environmental factors on ecosystem health. By analyzing monthly data, we were able to identify more accurately the critical periods and environmental factors affecting ecosystem health than by analyzing annual-scale data, which is crucial for developing effective ecological management and conservation strategies.
4. Discussion
4.1. Patial and Temporal Variations in the Ecological Quality of Oases
In this paper, the RSEI index was constructed by the GEE station to analyze the ecological environment quality of the Xinjiang oasis in long series. The results showed that the spatial distribution of the RSEI within the oasis of Xinjiang showed obvious differentiation and aggregation. The annual mean value of the RSEI showed a fluctuating downward trend. The ecological quality of the RSEI increased in some regions. This result is consistent with existing studies [41,42], but differs from Wang’s study of the overall ecological quality improvement in Xinjiang in the past 20 years [43]. It may be that the scope of consideration is different. Based on the analyses, it was found that the ecological improvement areas were mostly concentrated in mountainous areas and areas with better vegetation cover. In contrast, this study only considered the plains and the following areas, which are more sensitive to climate. Degraded areas are also concentrated in the plains, so there is a trend of oases declining as a whole [44].
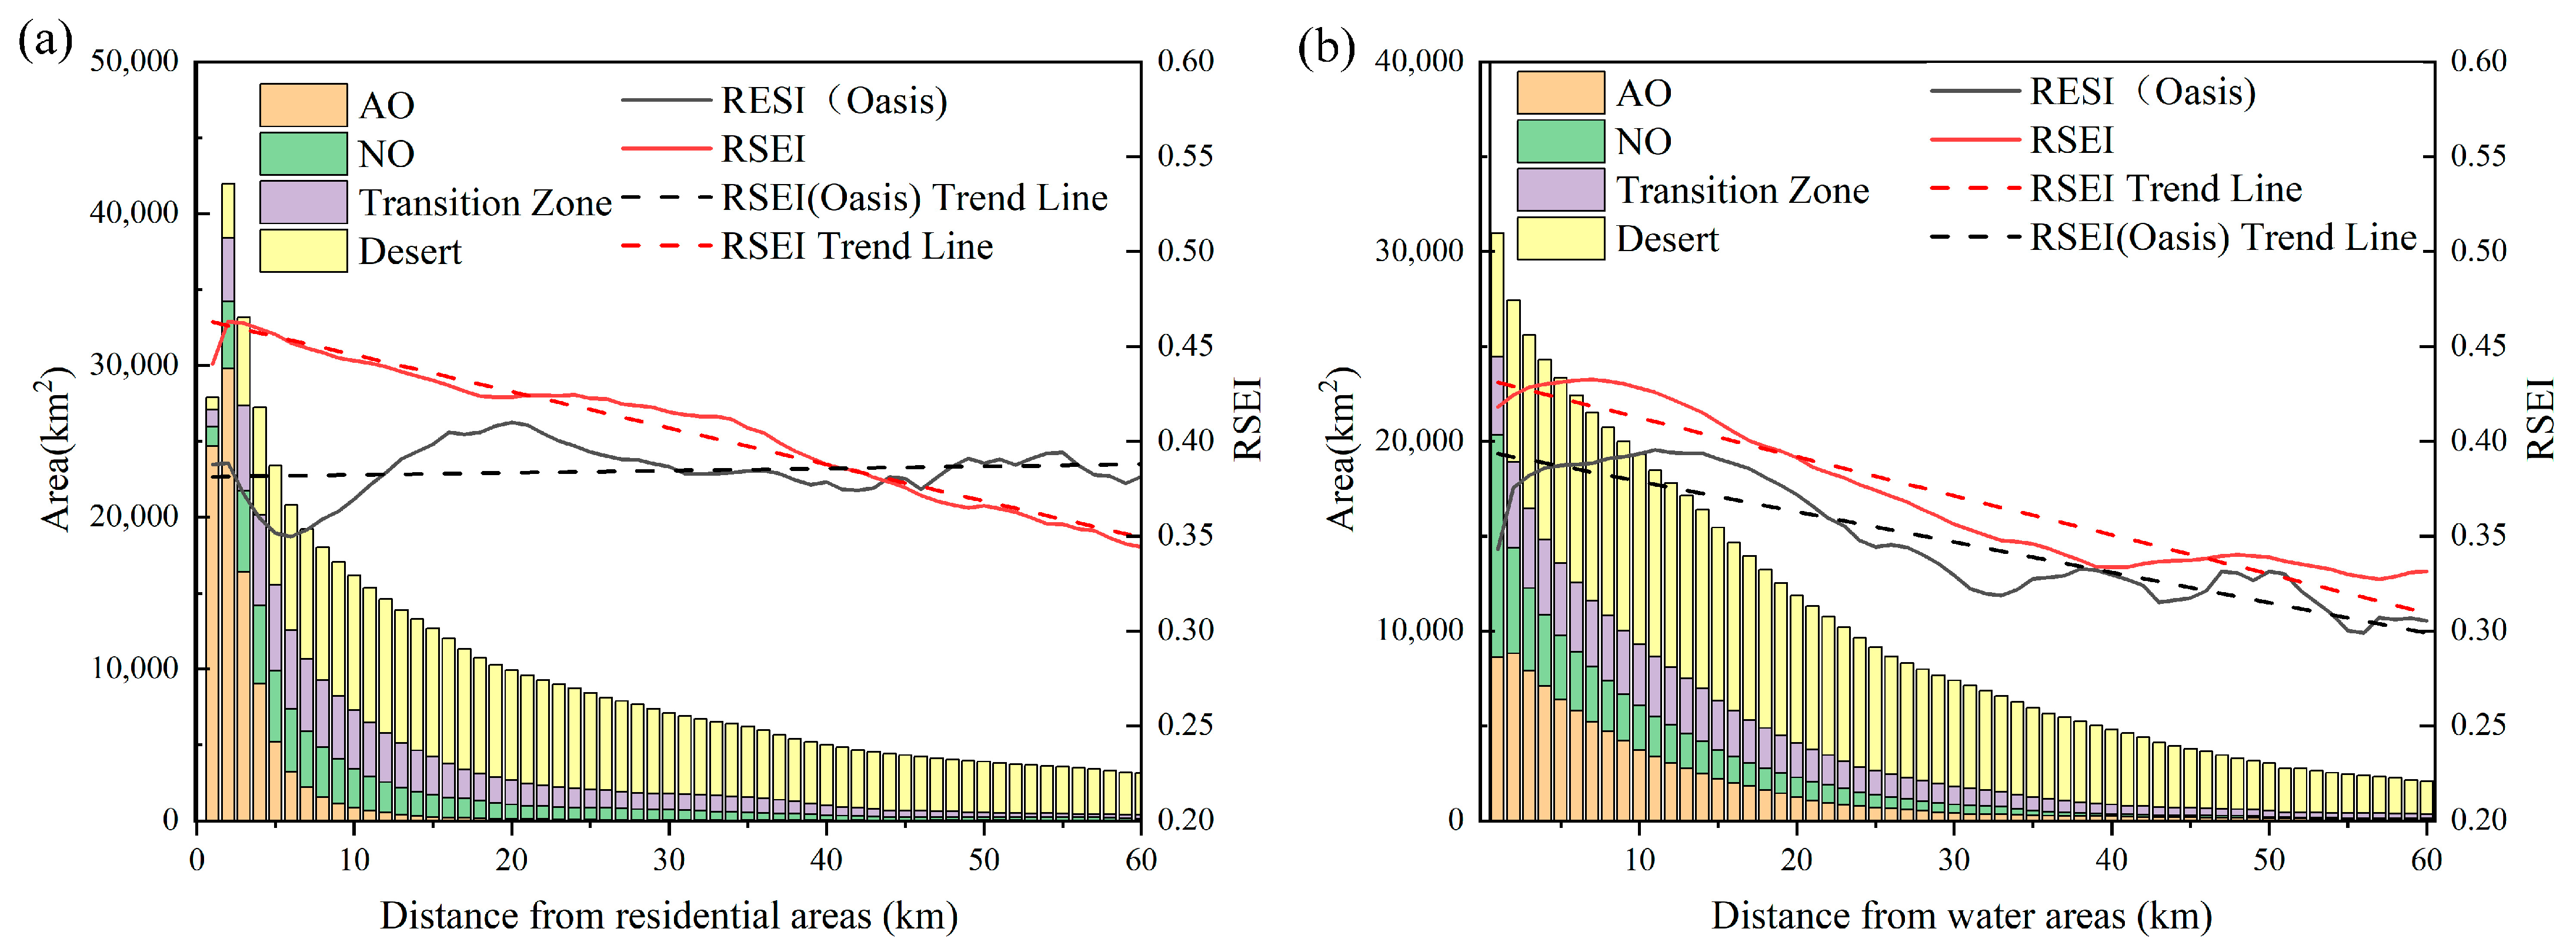
The results of the study show that the RSEI values of different land types, in descending order, are: AO > NO > transition zone > desert; AO has higher greenness, stability, and sustainability than NO. From the distribution, the ecological environment improvement characteristic of ‘human-centered’ is gradually formed. By analyzing the changes in ecological quality around the water system and settlements (Figure 12a), we found that the ecological quality did not decrease with the increase in the distance, but showed a stable trend with the increase in the distance, which means that the ecological quality of the oases distributed within 10 km was the same as that of the oases in the range of 50−60 km. And the relationship with the water system showed a decreasing trend of the RSEI with increasing distance (Figure 12b). Therefore, compared with rain-fed areas, anthropogenic ecological management in the Xinjiang region is the main means to improve the environment. Cultivation of arable land will not only enhance the regional vegetation cover level. It will also indirectly concentrate water resources, promote the improvement of the ecological environment driven by economic development with agriculture as the leading industry, and achieve the purpose of improving the quality of the ecological environment while developing the economy.
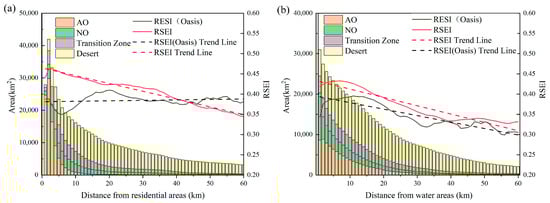
Figure 12.
Relationship between oasis area and RSEI spatialarea distribution distance (a), relationship between oasis area and water system distance (b).
However, the expansion of artificial oases is not unlimited, and the increase in agricultural cultivation will also lead to the increase in water consumption, and the process of urbanization will also reduce the quality of the ecological environment [45]. Cultivated land has a weaker impact on the quality of the ecosystem than forested land and water bodies. The blind and uncontrolled conversion of forest land and water bodies into arable land will lead to the deterioration of ecological environment quality. Priority should be given to reclaiming unused land and grassland, and improving the ecological environment through agricultural cultivation while maintaining a balance between water and land resources.
4.2. Oasis Ecosystem Quality Drivers
From the mid-to-late 1980s to the end of the century, Xinjiang was characterized by ‘warming and humidification’. However, after 1997, the temperature jumped, potential evaporation increased, and precipitation decreased slightly, resulting in more than 70 percent of the region becoming dry. The trend of drought change in Xinjiang has increased significantly. The climate of Xinjiang has changed from ‘warm−humid’ to ‘warm−dry’ [46]. Through the superposition analysis with the change in oasis area, it was found that 63.66% of the oases showed different degrees of reduction in the RSEI, among which 36.52% still showed a reduction in the RSEI when the oasis area did not change. As a result of climate impacts, vegetation growth in Xinjiang was stagnant after 1997, soil moisture decreased significantly, and the ecological effect was reversed. Against the background of frequent and repeated extreme weather events, the ‘wet−dry transition’ and the intensification of extreme weather events have led to the negative ecological effects in Xinjiang. This is one of the main reasons for the overall degradation of oases in Xinjiang [47].
Changes in the ecological quality of oases in Xinjiang caused by human activities have two sides [48]. On the one hand, the quality of oasis ecosystems has been enhanced through the construction of new channels for irrigation and the reclamation of arable land, which accounts for 11.33% of the total oasis area. On the other hand, urbanization has accelerated the degradation of ecological quality. The expanding urban area in Xinjiang has increased from 4400 km2 in 2000 to 9600 km2 in 2020, shifting a large number of forest and grassland use types to arable land and construction land, resulting in ecological degradation [49].
It was found that the NDVI greenness indicator was elevated and the heat LST was decreasing, but it could not offset the negative effect of the decrease in the humidity WET and the increase in the dryness NDBSI. Therefore, the ecological quality of the oasis in Xinjiang has shown a continuous downward trend in the past 20 years. This conclusion is consistent with Li’s study [50]. In contrast to NO, AO has a higher NDVI and WET, while dryness LST and heat NDBSI are the lowest. Based on the geodetector findings, the top three influences on ecological quality are PRE, RHU, and ET, which shows that climatic factors are the main factors affecting the oasis in Xinjiang. This is because the basin is located in the northwestern arid climate zone, subject to the limitation of water resources, and the water required for the growth of natural oasis vegetation is mainly dependent on precipitation. Precipitation among the climatic elements is an important factor in ensuring the growth of vegetation. Therefore, the influence of climate change on the growth of natural vegetation such as woodland and grassland is stronger than that of arable land and bare land. In artificial oases, the water needed for vegetation growth is replenished by artificial irrigation in addition to natural precipitation. In bare land, vegetation is sparse and precipitation is low, and most of the precipitation is consumed in the form of evapotranspiration, so the vegetation can absorb and use less water [51]. The ecological quality of the oasis changed significantly during the year. Winter in Xinjiang lasts from November to the end of April. In this case, large areas of snow have a significant effect on the RSEI results, especially more pronounced in northern Xinjiang [12], so the ecological environment is more sensitive to LST and NDBSI during this time period. Between March and May, with the change inf temperature, snow and ice begin to melt, humidity in the air begins to increase, and the increase in WET becomes the dominant factor affecting the RSEI. By summer, vegetation grows and vegetation cover increases. The oasis heat island effect makes the ground temperature lower relative to bare ground, and the correlation coefficient between NDVI and the RSEI is highest in this period [13].
4.3. Research Limitations and Outlook
The RSEI can provide an objective picture of changes in ecological quality, but it is not only these four indicators that affect ecological quality. It also includes the results of multiple factors such as climate and human activities. Therefore, more factors need to be added to make a comprehensive judgement when considering the ecological environment. In this study, with the help of the time series extraction of the RSEI of oases in Xinjiang, we found that artificial oases are better than natural oases in terms of stability, greenness, and future sustainability through Hurst index and trend analysis. However, this does not mean that we can expand the scope of artificial oases arbitrarily. A reasonable scale can ensure the sustainable development of the oasis. In the future, we can analyze the relationship and difference between artificial oases and natural oases from the perspectives of the ecological contribution and ecological resilience of the oases, and search for the appropriate proportion and sustainable development path of the two, so as to provide new ideas for arid zone oases.
5. Conclusions
The aim of this study is to reveal the changes and differences between the ecological quality of AO and NO with the help of long-series ecological evaluation tools. The differences and stability between AO and NO were studied through coefficient of variation, trend analysis, and the Hurst index. The relationship between factors affecting the difference between AO and NO was explored through correlation analysis and geoprobes. This led to the following conclusions:
- The spatial distribution of ecological environmental quality in the oasis region of Xinjiang shows obvious differentiation and aggregation, and the overall distribution of the RSEI is high in the north and low in the south. The ecological environmental quality shows a fluctuating downward trend from 2000 to 2020, decreasing from 0.210 to 0.189. The ecological environmental quality of AO is greater than the mean value of 0.112 for NO.
- Based on the coefficient of variation, the Hurst index, and trend analyses, the stability of ecological environment quality in the Xinjiang oasis from 2001 to 2020 is high. The continuous decline of the ecological environment is the main type, mostly distributed in the periphery of the oasis. AO is better than NO in terms of greenness, stability, and sustainability, and the continuous increase in the ecological environment area is mostly concentrated in the distribution range of AO.
- Correlation analyses showed that NDVI and WET were positive indicators, while NDBSI and LST were negative indicators, and the positive feedback provided by the continuous decrease in WET and the increase in NDVI could not offset the negative feedback brought by the increase in LST and NDBSI, which was an important reason for the decline in the ecological quality of the oasis in Xinjiang.
- The top three highest contributors based on geodetectors were found to be PRE (0.83) > RHU (0.82) > ET (0.57), with climate being the main factor influencing the ecological quality of oases, and the overall ecological quality of oases can be appropriately improved by increasing the proportion of artificial oases.
Author Contributions
Conceptualization, J.Z. and A.L.; methodology, J.Z.; software, C.R.; validation, J.Z. and P.Z.; formal analysis, A.L.; investigation, C.R.; resources, S.W.; data curation, P.Z.; writing—original draft preparation, J.Z.; writing—review and editing, P.Z.; visualization, X.D.; supervision, M.D.; project administration, A.L.; funding acquisition, X.L. All authors have read and agreed to the published version of the manuscript.
Funding
This research was supported by the National Natural Science Foundation of China (Grant NOs. 52379020, 52309041) from X.L. and P.Z. It was also supported by the Third Xinjiang Scientific Expedition Program (Grant No. 2022xjkk0103; Grant No. 2021xjkk0406).
Data Availability Statement
Data will be made available on request.
Acknowledgments
The work was supported by the “Ten Thousand People Plan” of China for Science and Technology Innovation Leaders.
Conflicts of Interest
Author Shuhong Wang was employed by the company Xinjiang Corps Survey and Design Institute (Group) Co., Ltd. The remaining authors declare that the research was conducted in the absence of any commercial or financial relationships that could be construed as a potential conflict of interest.
References
- Zhang, H.; Wu, H.W.; Zheng, Q.H.; Yu, Y.H. A preliminary study of oasis evolution in the Tarim Basin, Xinjiang, China. J. Arid. Environ. 2003, 55, 545–553. [Google Scholar] [CrossRef]
- Fang, Y.; Wang, X.; Cheng, Y.; Wang, Z. Oasis Change Characteristics and Influencing Factors in the Shiyang River Basin, China. Sustainability 2022, 14, 14354. [Google Scholar] [CrossRef]
- Liu, X.R.; Shen, Y.J. Quantification of the impacts of climate change and human agricultural activities on oasis water requirements in an arid region: A case study of the Heihe River basin, China. Earth Syst. Dyn. 2018, 9, 211–225. [Google Scholar] [CrossRef]
- Song, W.; Zhang, Y. Expansion of agricultural oasis in the Heihe River Basin of China: Patterns, reasons and policy implications. Phys. Chem. Earth 2015, 89–90, 46–55. [Google Scholar] [CrossRef]
- Zhang, J.; Zhang, P.; Gu, X.; Deng, M.; Lai, X.; Long, A.; Deng, X. Analysis of Spatio-Temporal Pattern Changes and Driving Forces of Xinjiang Plain Oases Based on Geodetector. Land 2023, 12, 1508. [Google Scholar] [CrossRef]
- Xie, Y.C.; Gong, J.; Sun, P.; Gou, X.H. Oasis dynamics change and its influence on landscape pattern on Jinta oasis in arid China from 1963a to 2010a: Integration of multi-source satellite images. Int. J. Appl. Earth Obs. Geoinf. 2014, 33, 181–191. [Google Scholar] [CrossRef]
- Liu, L.; Xue, J.; Mao, D.L.; Chang, J.J.; Wang, S.K.; Li, X.X. An integrative socio-hydrological resilience assessment and management implications for oasis sustainability in arid regions, Northwest China. J. Hydrol. Reg. Stud. 2023, 47, 101389. [Google Scholar] [CrossRef]
- Li, X.Y.; Xiao, D.N.; He, X.Y.; Chen, W.; Song, D.M. Factors associated with farmland area changes in arid regions: A case study of the Shiyang River basin, northwestern China. Front. Ecol. Environ. 2007, 5, 139–144. [Google Scholar] [CrossRef]
- Yang, Q.; Lei, J.Q.; Wei, W.S.; Zhao, J.F.; Gao, W. Study on the effects of artificial oases to the climate change trend. In Proceedings of the Conference on Remote Sensing and Modeling of Ecosystems for Sustainability, Denver, CO, USA, 2–4 August 2004; pp. 455–465. [Google Scholar]
- Xu, H. A remote sensing urban ecological index and its application. Acta Ecol. Sin. 2013, 33, 7853–7862. [Google Scholar]
- Zheng, Z.H.; Wu, Z.F.; Chen, Y.B.; Guo, C.; Marinello, F. Instability of remote sensing based ecological index (RSEI) and its improvement for time series analysis. Sci. Total Environ. 2022, 814, 152595. [Google Scholar] [CrossRef]
- Liu, X.; Guo, P.; Qi, J.; Du, W.; Zhang, R.; Zhang, K. Spatio-temporal changes and driving forces in the ecological environment of Altay City determined using an MRSEI model. Arid Zone Res. 2023, 40, 1014–1026. [Google Scholar]
- Huang, S.; Li, Y.; Hu, H.; Xue, P.; Wang, J. Assessment of optimal seasonal selection for RSEI construction: A case study of ecological environment quality assessment in the Beijing-Tianjin-Hebei region from 2001 to 2020. Geocarto Int. 2024, 39, 2311224. [Google Scholar] [CrossRef]
- Xue, H.; Liu, P. Spatiotemporal Variation of Ecological Environmental Quality and Its Response to Different Driving Factors in the Section of Yellow River Basin in Recent 31 YearsTaking Yan′an City as an Example. Res. Soil Water Conserv. 2024, 31, 373–384. [Google Scholar]
- Wang, Y.; Xu, Y.; Yang, J.; Chen, Y.; Wei, J.; Zhou, J.; Zhang, W.; Cheng, W. Dynamic monitoring and spatio-temporal pattern evolution analysis of ecoenvironmental quality in Chongqing based on remote sensing. Acta Ecol. Sin. 2023, 43, 6278–6292. [Google Scholar]
- Ariken, M.; Zhang, F.; Liu, K.; Fang, C.L.; Kung, H.T. Coupling coordination analysis of urbanization and eco-environment in Yanqi Basin based on multi-source remote sensing data. Ecol. Indic. 2020, 114, 106331. [Google Scholar] [CrossRef]
- Aizizi, Y.; Kasimu, A.; Liang, H.W.; Zhang, X.L.; Zhao, Y.Y.; Wei, B.H. Evaluation of ecological space and ecological quality changes in urban agglomeration on the northern slope of the Tianshan Mountains. Ecol. Indic. 2023, 146, 109896. [Google Scholar] [CrossRef]
- Lv, Y.; Xiu, L.A.; Yao, X.J.; Yu, Z.P.; Huang, X.Y. Spatiotemporal evolution and driving factors analysis of the eco-quality in the Lanxi urban agglomeration. Ecol. Indic. 2023, 156, 111114. [Google Scholar] [CrossRef]
- Wu, S.P.; Gao, X.; Lei, J.Q.; Zhou, N.; Guo, Z.K.; Shang, B.J. Ecological environment quality evaluation of the Sahel region in Africa based on remote sensing ecological index. J. Arid Land 2022, 14, 14–33. [Google Scholar] [CrossRef]
- Wen, X.L.; Ming, Y.L.; Gao, Y.G.; Hu, X.Y. Dynamic Monitoring and Analysis of Ecological Quality of Pingtan Comprehensive Experimental Zone, a New Type of Sea Island City, Based on RSEI. Sustainability 2020, 12, 21. [Google Scholar] [CrossRef]
- Xiong, Y.; Xu, W.H.; Lu, N.; Huang, S.D.; Wu, C.; Wang, L.G.; Dai, F.; Kou, W.L. Assessment of spatial–temporal changes of ecological environment quality based on RSEI and GEE: A case study in Erhai Lake Basin, Yunnan province, China. Ecol. Indic. 2021, 125, 107518. [Google Scholar] [CrossRef]
- Jiang, F.; Zhang, Y.Q.; Li, J.Y.; Sun, Z.Y. Research on remote sensing ecological environmental assessment method optimized by regional scale. Environ. Sci. Pollut. Res. 2021, 28, 68174–68187. [Google Scholar] [CrossRef] [PubMed]
- Geng, J.W.; Yu, K.Y.; Xie, Z.; Zhao, G.J.; Ai, J.W.; Yang, L.Q.; Yang, H.H.; Liu, J. Analysis of Spatiotemporal Variation and Drivers of Ecological Quality in Fuzhou Based on RSEI. Remote Sens. 2022, 14, 4900. [Google Scholar] [CrossRef]
- Huang, H.; Xue, J.; Feng, X.; Zhao, J.; Sun, H.; Hu, Y.; Ma, Y. Thriving arid oasis urban agglomerations: Optimizing ecosystem services pattern under future climate change scenarios using dynamic Bayesian network. J. Environ. Manag. 2024, 350, 119612. [Google Scholar] [CrossRef] [PubMed]
- Huang, R.; Chen, X.; Hu, Q.; Jiang, S.; Dong, J. Impacts of altitudinal ecohydrological dynamic changes on water balance under warming climate in a watershed of the Qilian Mountains, China. Sci. Total Environ. 2024, 908, 168070. [Google Scholar] [CrossRef]
- Zhang, J.; Qin, Y.; Zhang, Y.; Lu, X.; Cao, J. Comparative Assessment of the Spatiotemporal Dynamics and Driving Forces of Natural and Constructed Wetlands in Arid and Semiarid Areas of Northern China. Land 2023, 12, 1980. [Google Scholar] [CrossRef]
- Wang, L.; Jiao, L.; Lai, F.; Zhang, N. Evaluation of ecological changes based on a remote sensing ecological index in a Manas Lake wetland, Xinjiang. Acta Ecol. Sin. 2019, 39, 2963–2972. [Google Scholar]
- Chen, L.; Liu, P.; Hua, Y. Comprehensive Evaluation of Ecological Quality and its Factors Analysis in the Shule River Basin Based on RSEI. Chin. J. Soil Sci. 2021, 52, 25–33. [Google Scholar]
- Zhang, G.; Nie, Z.; Cui, H.; Wang, Q.; Yan, M.; Tian, Y.; Wang, J. Main causes and mechanism for the natural oasis degeneration in the lower reaches of northwest inland basins. Hydrogeol. Eng. Geol. 2022, 49, 1–11. [Google Scholar]
- Yang, Y.; Liu, Y.; Dong, W.; Li, L. Spatio-temporal variation analysis of urbanization and land use benefit of oasis urban areas in Xinjiang. Acta Ecol. Sin. 2011, 31, 6568–6578. [Google Scholar]
- Pan, G.; Shen, T.; Ma, X.; Qiao, X. Effects of human activities and natural factors on ecological environment of the Hailiutu river basin. J. Arid Land Resour. Environ. 2017, 31, 67–72. [Google Scholar]
- Chen, C.; Wu, Y.; Wang, J.; Zhao, X.; Zhao, L. Artificial and natural oasis mutual converting process and the proper ration in the middle reaches of Tarim River basin. J. Water Resour. Water Eng. 2017, 28, 42–47. [Google Scholar]
- Zheng, Z.; Ma, Z.; Li, M.; Xia, J. Regional water budgets and hydroclimatic trend variations in Xinjiang from 1951 to 2000. Clim. Chang. 2017, 144, 447–460. [Google Scholar] [CrossRef]
- Lobser, S.E.; Cohen, W.B. MODIS tasselled cap: Land cover characteristics expressed through transformed MODIS data. Int. J. Remote Sens. 2007, 28, 5079–5101. [Google Scholar] [CrossRef]
- Hu, X.; Xu, H. A new remote sensing index for assessing the spatial heterogeneity in urban ecological quality: A case from Fuzhou City, China. Ecol. Indic. 2018, 89, 11–21. [Google Scholar] [CrossRef]
- Liao, Y.; Wu, G.; Zhang, Z. Multi-Scale Remote Sensing Assessment of Ecological Environment Quality and Its Driving Factors in Watersheds: A Case Study of Huashan Creek Watershed in China. Remote Sens. 2023, 15, 5633. [Google Scholar] [CrossRef]
- Liu, C.; Zhang, X.; Wang, T.; Chen, G.; Zhu, K.; Wang, Q.; Wang, J. Detection of vegetation coverage changes in the Yellow River Basin from 2003 to 2020. Ecol. Indic. 2022, 138, 108818. [Google Scholar] [CrossRef]
- Li, Y.; Pan, X.; Wang, C.; Liu, Y.; Zhao, Q. Changes of vegetation net primary productivity and its driving factors from 2000 to 2011 in Guangxi, China. Acta Ecol. Sin. 2014, 34, 5220–5228. [Google Scholar]
- Lei, X.; Xie, P.; Wu, Z.Y.; Sang, Y.F.; Zhao, J.Y.; Li, B.B. Hydrologic variability and sensitivity based on Hurst coefficient and Bartels statistic. Ying Yong Sheng Tai Xue Bao J. Appl. Ecol. 2018, 29, 1051–1060. [Google Scholar] [CrossRef]
- Deng, X.; Liu, Y.; Gao, F.; Liao, S.; Zhou, F.; Cai, G. Spatial Distribution and Mechanism of Urban Occupation Mixture in Guangzhou: An Optimized GeoDetector-Based Index to Compare Individual and Interactive Effects. ISPRS Int. J. Geo-Inf. 2021, 10, 659. [Google Scholar] [CrossRef]
- Sawut, R.; Abliz, A.; Li, H.; Kasim, N.; Li, X. Dynamic Monitoring and Analysis of Ecological Environment in Fukang City Based on RSEI Model. Res. Soil Water Conserv. 2020, 27, 283–289, 297. [Google Scholar]
- Chen, M.; Feng, D.; Zhang, S.; Jiang, Y.; Zhang, X. Dynamic monitoring and prediction of eco-environmental quality in Yining City based on RSEI and ANN-CA-Markov model. Arid Land Geogr. 2023, 46, 911–921. [Google Scholar]
- Wang, J.; Ding, J.; Ge, X.; Qin, S.; Zhang, Z. Assessment of ecological quality in Northwest China (2000–2020) using the Google Earth Engine platform: Climate factors and land use/land cover contribute to ecological quality. J. Arid Land 2022, 14, 1196–1211. [Google Scholar] [CrossRef]
- Luo, W.; Wang, F.; Rong, M. Dynamic evolution of ecological-economic-social system coupling coordination in national key ecological function areas: Take the Altay region of Xinjiang as an example. Acta Ecol. Sin. 2022, 42, 4729–4741. [Google Scholar]
- Xia, N.; Hai, W.; Tang, M.; Song, J.; Quan, W.; Zhang, B.; Ma, Y. Spatiotemporal evolution law and driving mechanism of production-living-ecological space from 2000 to 2020 in Xinjiang, China. Ecol. Indic. 2023, 154, 110807. [Google Scholar] [CrossRef]
- Yao, J.; Mao, W.; Chen, J.; Dilinuer, T. Signal and impact of wet-to-dry shift over Xinjiang, China. Acta Geogr. Sin. 2021, 76, 57–72. [Google Scholar]
- Aizizi, Y.; Kasimu, A.; Liang, H.; Zhang, X.; Wei, B.; Zhao, Y.; Ainiwaer, M. Evaluation of Ecological Quality Status and Changing Trend in Arid Land Based on the Remote Sensing Ecological Index: A Case Study in Xinjiang, China. Forests 2023, 14, 1830. [Google Scholar] [CrossRef]
- Cui, R.; Han, J.; Hu, Z. Assessment of Spatial Temporal Changes of Ecological Environment Quality: A Case Study in Huaibei City, China. Land 2022, 11, 944. [Google Scholar] [CrossRef]
- Cheng, Y.; Song, W.; Yu, H.; Wei, X.; Sheng, S.; Liu, B.; Gao, H.; Li, J.; Cao, C.; Yang, D. Assessment and Prediction of Landscape Ecological Risk from Land Use Change in Xinjiang, China. Land 2023, 12, 895. [Google Scholar] [CrossRef]
- Li, T.-T.; Ma, C.; Guo, Z.-C. Ecological quality evaluation and influencing factors analysis of Helan Mountain based on RSEI. Shengtaixue Zazhi 2021, 40, 1154–1165. [Google Scholar]
- Fang, C.; Zhu, R.; Lu, R.; Chen, Z.; Wang, L.; Shan, J.A.; Yin, Z. Analysis of Vegetation Cover Change Characteristics and Influencing Factors in the Shiyang River basin based on GEE. Remote Sens. Technol. Appl. 2023, 38, 1167–1179. [Google Scholar]

Disclaimer/Publisher’s Note: The statements, opinions and data contained in all publications are solely those of the individual author(s) and contributor(s) and not of MDPI and/or the editor(s). MDPI and/or the editor(s) disclaim responsibility for any injury to people or property resulting from any ideas, methods, instructions or products referred to in the content. |
© 2024 by the authors. Licensee MDPI, Basel, Switzerland. This article is an open access article distributed under the terms and conditions of the Creative Commons Attribution (CC BY) license (https://creativecommons.org/licenses/by/4.0/).