Article

Development of a Proof-of-Concept A-DInSAR-Based Monitoring Service for Land Subsidence

Department of Science, Technology and Society (STS), University School for Advanced Studies (IUSS), 27100 Pavia, Italy
*
Author to whom correspondence should be addressed.
Remote Sens. 2024, 16(11), 1981; https://doi.org/10.3390/rs16111981
Submission received: 5 April 2024 / Revised: 22 May 2024 / Accepted: 28 May 2024 / Published: 31 May 2024
(This article belongs to the Special Issue New Perspective of InSAR Data Time Series Analysis)

Abstract

:
The increasing availability of SAR images and processing results over wide areas determines the need for systematic procedures to extract the information from this dataset and exploit the enhanced quality of the displacement time series. The aim of the study is to propose a new pre-operational workflow of an A-DInSAR-based land subsidence monitoring and interpretation service. The workflow is tested in Turano Lodigiano (Lombardy region, Italy) using COSMO-SkyMed data, processed using the SqueeSAR™ algorithm, and covering the time span from 2016 to 2019. The test site is a representative peri-urban area of the Po plain susceptible to land subsidence. The results give insight about new value-added products and enable non-expert users to exploit the potential of the interferometric results.

1. Introduction

Advanced Differential Synthetic Aperture Radar (SAR) Interferometry (A-DInSAR) is an established technique to obtain ground deformation measurements with millimetric accuracy over wide areas. An increasing number of studies have proven the advances in the use of A-DInSAR data for land subsidence monitoring [1,2,3]. Interferometry operates on the principle that the phase of SAR (Synthetic Aperture Radar) images is an ambiguous (modulo2π) measure of the sensor–target distance. By comparing the phase difference of corresponding pixels in two SAR images, variations in distance can be obtained. A-DInSAR is based on the processing of multiple SAR images over the same area to obtain ground deformation measurements [4].
Therefore, several countries have started to develop services to monitor their territory with nation- or region-wide A-DInSAR-based data [5,6].
The first national-scale A-DInSAR-based service was developed in 2007 in Italy [7]. This service was financed and managed by the Italian Ministry of the Environment (MoE) in the framework of the Italian Not-ordinary Plan of Remote Sensing of the Environment. C-band data such as the ERS 1/2 (spanning the period 1992–2001) and the Envisat (spanning the period 2002–2010) images were collected and processed by means of different A-DInSAR approaches. In particular, the SAR images were processed using the PSP [8], the PSInSAR [9] and the SqueeSAR [10] algorithms. Successively, MoE financed the processing of X-band data acquired by the COSMO-SkyMed (CSK) sensors in three test sites: Bologna, Palermo, and Venezia. The relevant results led to the extension of the processing, including 100 CKS SAR acquired from ASI (Italian Space Agency) in the framework of the MapItaly Project. MapItaly represents a systematic acquisition program of the Italian territory based on interferometric data and designed in 2009 by ASI and the Italian Department of Civil Protection, with the purpose of monitoring Italy for civil protection purposes by means of the CSK mission [11]. The data can be accessed through the website of the National Geoportal [12] and can be downloaded upon request.
In 2018, Norway developed the first national public ground deformation monitoring service using Sentinel-1 (hereafter, S1) images. This initiative is managed by the Geological Survey of Norway, the Norwegian Water Resources and Energy Directorate, and the Norwegian Space Centre. This service allows users to obtain regularly updated ground deformation time series (TS) for the entire territory of Norway, freely accessible and downloadable through a web interface [13]. Furthermore, Radarsat-2 data are also available for some selected test sites and for regional-scale analysis. It is worth noting that Norway is characterized by snowy regions; therefore, SAR data acquired from months with little snow cover (i.e., from June to October) are used for the nationwide datasets. Meanwhile, SAR images from the whole year are processed to obtain ground deformation data in the urban areas. The data are processed on a high-performance computing cluster and using software developed by the KSATGMS partnership [14].
In 2019, Ground Motion Service Germany (BodenBewegungsdienst Deutschland—BBD) was launched by the Federal Institute for Geosciences and Natural Resources (BGR) by using S1 data processed through the Persistent Scatterer Interferometry (PSI) technique by the Remote Sensing Technology Institute of the German Aerospace Center (DLR). In this case, the distributed data are GNSS-calibrated deformation measurements available through a WebGIS [15]. This initiative delivers not only line of sight (LOS) displacement TS but also vertical and east–west deformation data over the entire territory of Germany. The service was implemented taking into account different end-user requirements from German governmental agencies (e.g., state geological surveys, mining authorities, and ordnance surveying) and remote sensing experts [16].
Another ground deformation service was developed to monitor the Netherlands. In particular, the Dutch Ground Motion Service is an initiative developed by the Netherlands Centre for Geodesy and Geo-Informatics in collaboration with universities (TU Delft, UTwente, HU), knowledge centres (KNMI), and geodetic companies (SkyGeo, 06-GPS). The SAR data used are S1 data that were processed by SkyGeo. The results have been validated with the GNSS time series [17]. This service delivers two different types of products, such as the Surface motion map 1.0 and surface and object motion (SOM) map 2.0, and the data are accessible via a website [18] and can be freely downloaded upon request.
Even the Agency for Data Supply and Efficiency, part of the Danish Ministry of Climate, Energy and Utilities, is developing a nationwide ground deformation monitoring service for Denmark [19].
Starting from 2022, a European initiative named European Ground Motion Service (EGMS), which is part of the Copernicus Land Monitoring Service, makes available ground deformation measurements over the whole territory of Europe using the S1 SAR images [20]. The available data are basic, calibrated, and ortho products freely accessible and downloadable via a webGIS [21].
Recently, other examples of nationwide A-DInSAR data have been processed to monitor the ground deformations in Greece [22] and Japan [23]. Nationwide and country scale A-DInSAR data are used for several purposes such as strategic water facilities monitoring in Hungary [24], landslide mapping and risk management in Italy [25], railway monitoring in the Netherlands [26], and assessment of areas, population, and households exposed to land subsidence in Mexico [27].
The availability of SAR archives and processing results with a free and open access policy over wide areas determines the need for post-processing systematic procedures to develop new value-added products and enable non-expert users to exploit the potential of the interferometric results. Nowadays, the scientific community is defining new systematic procedures to extract relevant information from A-DInSAR-based ground deformation data to be used by authorities responsible for risk management, urban planning, and environmental management [28,29].
In the Lombardy region, there is ongoing development of MapLombardy, a service inspired by MapItaly, being downscaled at a regional scale. Specifically, MapLombardy aims to offer comparable services to the Lombardy region through the launch of a 2024 pilot test for the commercial NOCTUA satellite, which utilizes SAR technology in X-band [30]. This satellite is a part of the IRIDE Constellation financed in the framework of the Italian National Recovery and Resilience Plan (PNRR). This initiative will be completed by 2026 under the management of the European Space Agency (ESA). IRIDE represents a constellation of constellations [31], with sixty-nine satellites and eight macro-services. The development took into account a deep analysis of user requirements [32,33] by the National User Forum. Pre-operational services are currently undergoing testing such as for agricultural monitoring [34] and detecting flood impacts [35].
In this paper, for the first time, a proof of concept (PoC) on land subsidence monitoring service is developed. The PoC on land subsidence monitoring service makes use of the systematic acquisition in the Lombardy region (Italy), for which updated information will be generated for each new SAR acquisition using CSK (X-band) data. The workflow of the pre-operational service has been tested in Turano Lodigiano, a peri-urban area located in the Lombardy region (Italy), which is a land subsidence-prone area representative of the Po Plain, characterized by large agricultural areas in close proximity to urban centers. Peri-urban areas are characterized by complex land use dynamics that increase environmental pressure. Lombardy has a particular urban structure that revolves around the metropolitan area of Milan, and significant land consumption rates increase faster than population growth [36]. However, there are few studies analyzing the application of A-DInSAR data for land subsidence studies in peri-urban areas, as the landscape presents challenges in identifying deformation mechanisms with lower measurement point density and heterogeneous trends compared to larger cities. For example, Abdikan et al. (2014) [37] used ALOS-PALSAR data (L-band) to monitor coal mining subsidence in the peri-urban area of Zonguldak city, Turkey. They found that L-band data were useful for overcoming the problems of signal decorrelation identified by previous authors who used C-band data, allowing for a more accurate estimation of surface deformation in vegetated study areas.
In particular, the article addresses the following research question:
-
Considering that the future of the A-DInSAR service is to provide continuously updated data, how can the TS datasets be used to detect subsidence hotspots and capture their dynamic behavior in time and space?
-
X-band A-DInSAR data are well-established for monitoring urbanized areas. These data will be produced in the forthcoming year as part of the IRIDE program. However, what is their suitability in the peri-urban areas that have a relevant diffusion in the Lombardy region and are poorly studied in the literature?
Our work provides insights into the potential and limitations of X-band data in peri-urban areas where land subsidence mechanisms have not been studied before. The proposed service aims to support the exploitation of MapLombardy services and future Earth Observation (EO) products, such as those offered by the IRIDE program, which will include two SAR constellations in Band-X. The service is designed to provide regularly updated ground deformation hotspot mapping and data to support civil protection activities and land use management.

2. Test Site

The test site is located in Turano Lodigiano municipality (~1515 inhabitants [38]), which is in the Lodi Plain, Lombardy region (Italy) (Figure 1). From the geomorphological point of view, Turano Lodigiano is located in a relatively flat topography, with an altitude ranging from 52 to 69 m a.s.l. (Figure 1a). The area experiences the influence of the nearby Adda River, which has shaped the landforms through erosion and deposition processes. The area extends for about 95 km2, and it is mainly characterized by cultivated lands. The study area is primarily composed of alluvial deposits belonging to the Plio-Pleistocenic continental depositional system of the Po Plain [39]. These deposits overlie the underlying bedrock, consisting of a marine basement composed of clayey–silty marls and silty clays. The thickness of the alluvial sediments reaches approximately a hundred meters, permitting the presence of a multilayer aquifer system. In the shallow ten meters, the deposits are mainly constituted by sandy layers constituting the phreatic aquifer, whereas locally low permeability layers are found and determine unconfined and semi-confined conditions of the aquifer. At a depth of about 70–80 m, a continuous clayey layer is found, and so, at higher depths, the aquifer is confined (Figure 1b). The area is characterized by paleo-riverbed deposits where the textural and granulometric variability (ranging from fine sediments characteristic of low energy depositional environments to granular ones) is responsible for a corresponding variability in permeability indices (from very low to good, Figure 1b). In the northern portion of the study area, there are clayey–silty soils that are 2–3 m thick, followed by mostly sandy deposits (from moderate to good permeability, Figure 1b). In the southern part, there are sandy and gravelly deposits with some clayey–silty coverings (from low to moderate permeability, Figure 1b).
The test site is characterized by a temperate climate, with January being the coldest month and July and August being the warmest. During the considered period (2016–2019), the temperature trend has been increasing, showing a constant positive anomaly compared with the reference period. The area lies in the Po plain, the largest irrigation basin in the region. Thirty-five percent of the national agricultural production occurs here in the Po river valley, which generates 40% of the country’s gross domestic product. The site is mainly covered by cultivated land (82% of the total area), followed by urban areas (9%). The main crop is grain maize, covering 70% of the total cultivated area (Figure 1b).

3. Materials and Methods

The proposed service delivers tools and products to quickly detect hotspots of ground deformation and understand their triggering factors. These have a great potential to be exploited by local authorities and for civil protection activities to identify areas that need intervention, such as the installation of in situ monitoring systems [42]. The hotspot ground deformation (HGD) mapping is produced using regularly acquired CSK SAR images approximately every 16 days.

3.1. Methodology

The workflow of the pre-operational service is divided into three phases: A-DInSAR data processing, TS analysis and post-processing, and reporting (Figure 2). In the first phase, the CSK SAR images are processed using the SqueeSAR algorithm [10] to obtain a map of the measuring point (MP) distribution. Each MP includes information about the average yearly velocity (mm/yr) and displacement TS (mm) along the LOS.
To simulate a continuously updated service, the processing results available for the monitored period (2016–2019) were sub-sampled to obtain two datasets. Specifically, the historical and updated displacement products were obtained by processing all available 72 scenes of SAR images using the conventional A-DInSAR method. The updated dataset was then created by using the TS obtained from the last ten SAR images. Moving forward, the PoC service will be tested to analyze new A-DInSAR products, including those obtained using dynamic processing of new SAR acquisitions.
In the second phase, the statistical analysis of the displacement TS is performed to identify MPs characterized by a similar trend.
Then, these MPs are clustered to produce a database of the hotspots of ground deformation (HGD). The same procedure is applied to the updated data. The two databases are compared to identify changes in the space (e.g., increase or decrease in the HGD extent) and in time (e.g., acceleration, deceleration in the average velocity). This phase allows the mapping of persistent HGD that are combined with different ancillary datasets such as geological, hydrogeological, and land use data to find correlations and generate hypotheses about the triggering factors [43,44].
Finally, in the third phase, a report is generated to describe the entire analysis process, including the findings and the suggested actions for local authorities in charge of land use management and civil risk protection activities. The report aims to provide easy-to read information for non-experts in order to take into account the stakeholder needs [45]. A confidence degree assessment of the achieved results is also presented by taking into account the MP density.

3.1.1. A-DInSAR Data Processing

In this work, CSK SAR images in Stripmap Himage mode were analyzed. In particular, a total of 72 CSK acquisitions were processed using the SqueeSAR® techniques [10] by TRE Altamira, Milan, Italy. The SqueeSAR® is a proprietary multi-interferogram technique [10] that combines the algorithm for identifying persistent scatterers (PS) with the capability to extract information from areas (e.g., debris areas, non-cultivated land) exhibiting similar reflectivity values, referred to as Distributed Scatterers (DS). Therefore, the combined PS and DS allow an increase in the density of measurement points (MPs). The selected CSK data are acquired in descending mode during the period from January 2016 until December 2019 (Figure 3). Additional details of the SAR images and processing are provided in Table 1. The processing results show that 90% of the MP are PS, whereas 10% are DS. The test site is characterized by sparse cultivated land, and in these areas, the MP are missing (Figure 3), because of the use of X-band data that easily decorrelate over vegetation due to the short wavelength.

3.1.2. TS Analysis and Post-Processing

LOS displacement TS and the LOS velocity maps are products that require an expert interpretation before being provided to final users (e.g., local authorities). Indeed, the representation of the average LOS velocity using a scale bar color for different ranges of velocity is not sufficient to distinguish moving areas. The moving areas can be characterized by nonlinear and seasonal trends that are not captured using the LOS velocity map and LOS velocity threshold [46]. For this reason, in this work, we propose to apply the principal component analysis (PCA) to identify the different components of the ground deformation [44]. The statistical analysis is performed using the two LOS displacement TS datasets (i.e., historical and updated archives). PCA is a multivariate analysis that converts a collection of intercorrelated variables to generate a new set of variables (components) that are uncorrelated and are ordered in their capability to explain variability in the original set [47]. Previous authors used PCA to identify ground deformation patterns in A-DInSAR TS [48,49,50,51]. Chaussard et al. (2014) [48] and Wang et al. (2022) [50] employed Principal Component Analysis (PCA) to distinguish longer-term from seasonal deformation. However, neither study conducted clustering to isolate ground deformation hotspots. Festa et al. (2023) [29] incorporated both PCA and K-Means clustering, while Rigamonti et al. utilized PCA, Independent Component Analysis (ICA), and Hierarchical clustering. In these studies, ground deformation inventories were compiled considering TS. Our approach diverges from previous work in two key aspects: (1) we utilize Optimized Hot Spot Analysis (OHSA) to identify clusters of MP exhibiting similar trends derived from PCA, and (2) our method is designed to capture the dynamic evolution of land subsidence hotspots. This approach offers the advantage of detecting accelerations and decelerations in areas characterized by similar trends.
Specifically, we use PCA to find HGD with similar TS trends. The outputs of the PCA are the scores, eigenvectors (or loadings), and variances. To determine how many principal components (PCs) should be interpreted, a scree plot is generated to visualize the percent of explained variance by the principal component, and PCs that explain the total variance between 70% to 80% are selected [47].
The PC eigenvectors describe how each variable contributes to each PC, and PC scores are the values of each original variable to each PC. The last product is used to create MP clusters. In particular, optimized hot spot analysis (OHSA) is performed to find clusters of MPs with similar trends. This spatial statistic tool allows us to detect high and low values of PC scores based on the Getis-Ord Gi* statistic [52]. The significant hotspots are identified using a 90% confidence level, and successively, preliminary HGD are filtered by considering clusters with at least five MPs and an extension higher than 5000 m2. The same approach is applied to the historical and updated archives, and the results are overlapped to define the persistent HGD and verify any spatial changes in the moving areas. From the temporal point of view, accelerations and decelerations are investigated by extracting the average TS for each HGD both using the historical and the updated archives. Consecutively, the acceleration (a) is computed using the following Equation (1):
a = Δ v Δ t = v u v h t u t h   ,
where Δ v and Δ t stand for the change in the velocity and in the time, respectively. v u and v h are the average velocities calculated using the updated and historical archives, respectively. Whereas, t u and t h are the ending time and starting times.
Finally, to understand the geological meaning of the HGD, the database is cross-compared with different ancillary data such as geological and hydrogeological data, new buildings database, wells location, etc.

3.1.3. Reporting

For each new acquisition, the service can be updated to include the new parameters for the latest acquisition date. In this sense, a report can be generated and refreshed with each new acquisition.
The service will enable local authorities to identify deforming areas that need further detailed investigations. The accuracy of the results will be assessed by taking into account the MP distribution. Therefore, a kernel density (KD) map is created to calculate the density of the MP. The kernel function is based on the quartic kernel function explained in Silverman (1986) [53]. This product enables the final user to understand the areas where the data are missing and no information about the ground deformation is available. Specifically, a confidence degree map is produced by classifying the kernel density results in five confidence intervals (i.e., very low, low, moderate, high, very high) using the Jenks natural breaks algorithm [54]. Then, the average kernel density values are extracted for the various topographic attributes (e.g., buildings, roads, railways, bridges, viaducts, etc.) by using the Regional Topographic Geodatabase (DBTR) of the Lombardy region [38].
The report consists of a summary table about the main parameters (e.g., number of MP, number of HGD, etc.), the hypothesis about the HGD drivers and the suggested actions (see the Supplementary Material Figure S1). The report also includes the LOS velocity map, the Confidence degree (C.d.) map, the HGD maps, and the average TS of representative HGD (see the Supplementary Material Figure S2).

4. Results

This section describes the results of the pre-operative service obtained in the Turano Lodigiano area.

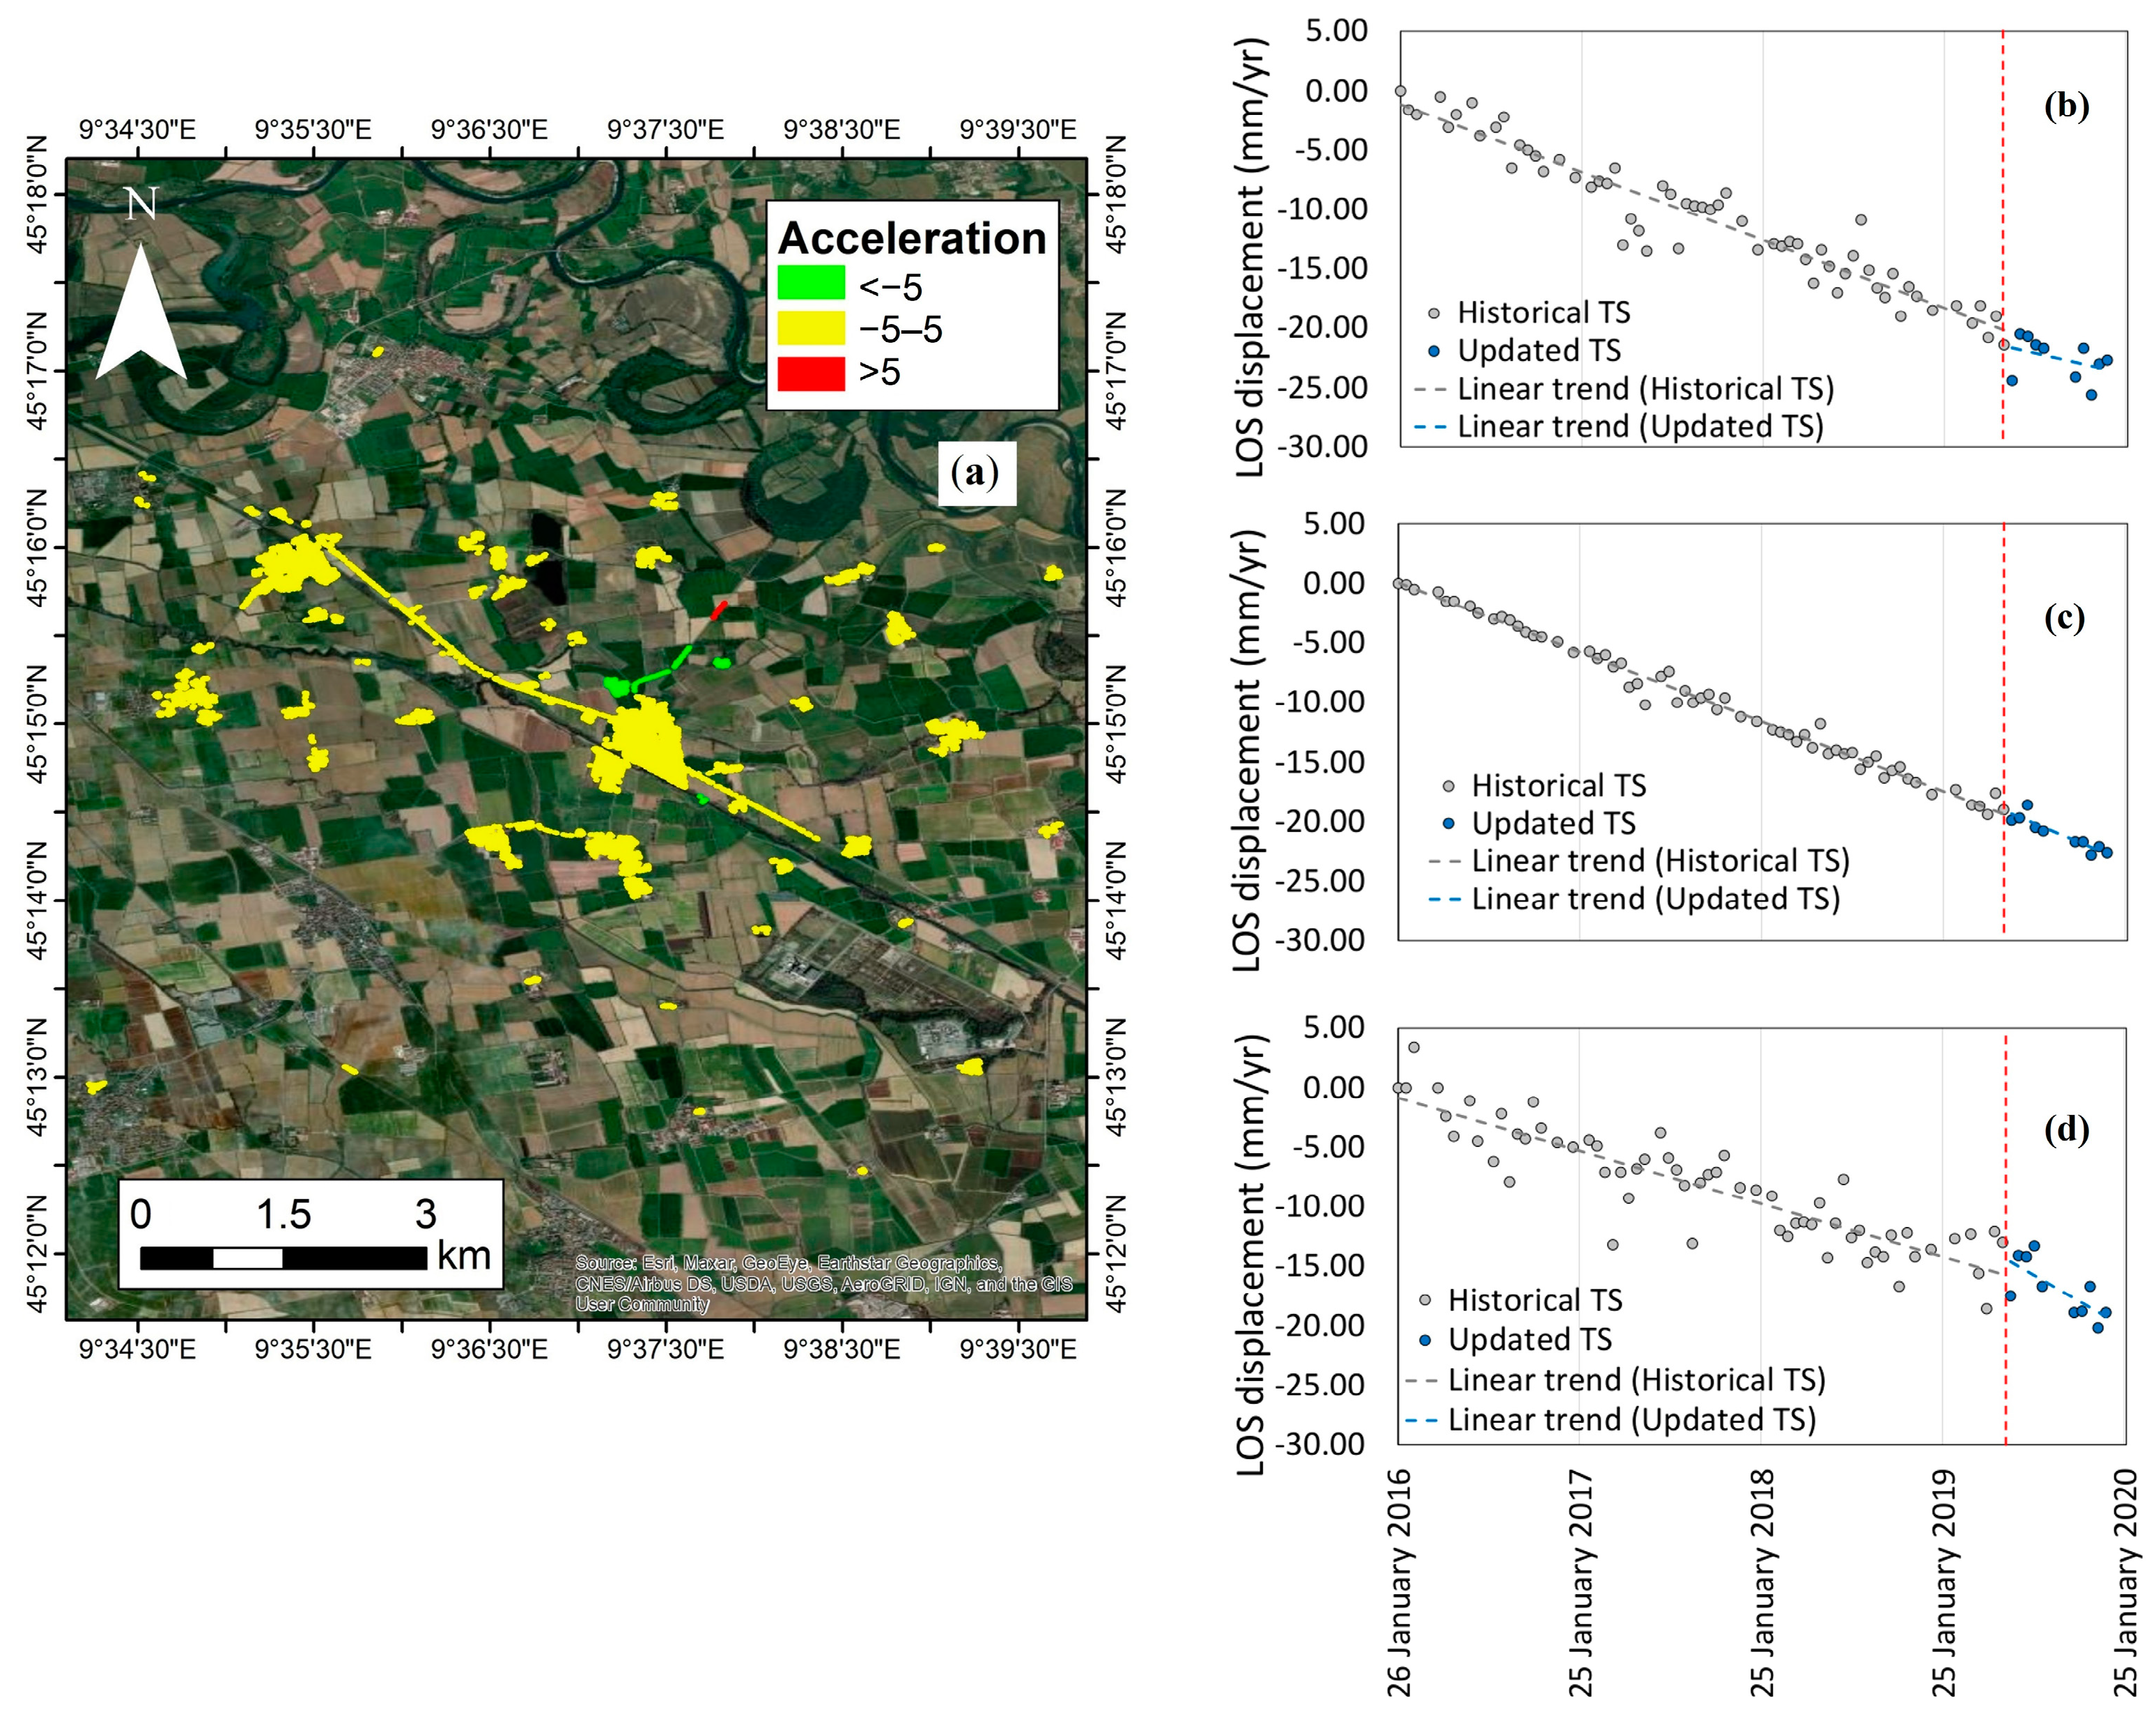
4.1. Hotspot of Land Subsidence in Turano Lodigiano

In Turano Lodigiano, 123 preliminary HGD have been detected using CSK (Figure 4a). By applying the filter about the extension and a minimum number of five MP, the final HGD reach the value of 65, and cover a total moving area of 2.41 km2. The maximum LOS velocity rate reaches −12 mm/yr. The results of the PCA show that the historical dataset is characterized by one PC that explains about 80% of the variance (Figure 4b), and the PC1 shows a linear lowering trend (Figure 4c). The hotspots of the PC scores are mainly localized in the center of the municipality.
No relevant spatial differences about the HGD were detected using the historical and updated archive. The detected moving areas are persistent within Turano Lodigiano.
According to the proposed workflow, the acceleration has been computed for each HGD. It is worth noting that negative values represent deceleration.
The results show that the majority of the HGDs are characterized by linear trends (acceleration between −5 and 5 mm/yr2). One in five HGDs display an acceleration (values higher than 5 mm/yr2) and deceleration trend (values lower than −5 mm/yr2), respectively (Figure 5).

4.2. Driver of the Land Subsidence

4.2.1. Geological and Hydrogeological Control on the Land Subsidence

Land subsidence may be related to natural and anthropogenic processes [55,56]. One of the most diffused causes of the land subsidence is the groundwater exploitation that triggers the compaction of susceptible aquifer systems (e.g., unconsolidated alluvial or basin-fill aquifer systems) [57,58]. The test site is mainly covered by agricultural landscapes and is therefore subject to intensive groundwater extraction for irrigation. Unfortunately, lithological information is not available to estimate the thickness of the compressible soils in the study area. The relationship between the ground deformation and the permeability classes (Figure 1) has been assessed by extracting different statistical parameters such as the maximum, minimum, mean, and standard deviation (SD) and the total extent of the moving area (HGD) for each class. The results show that the higher negative LOS velocity rate is observed in the low to discreet class. The mean values detected in the lower to discreet and the very low to good classes are similar reaching values of −4.30 and −6.24 mm/yr, respectively (Figure 6).
The total moving areas extracted from the HGD are 1.05, 0.17, and 0.06 km2 for the permeability classes low to discreet, moderate to good, and very low to good, respectively. Therefore, local semi-confined and confined conditions of the aquifer due to clayey–silty coverage on sandy and gravelly deposits could have a relevant role for the movements detected in the southern part of the study area.
Considering that the groundwater abstraction is unknown and piezometric measurements are not available to verify the groundwater level changes in the monitored period, an analysis of water crop demand in the period 2016–2019 was performed to understand the potential amount of groundwater extracted for agricultural purposes. This is not the main focus of this study, so a simple methodology was chosen for this analysis. In particular, the methodology was selected from the FAO Training manual n°3 on Irrigation Water Management [59]. Crop water requirements, expressed as Crop Evapotranspiration (ETc—mm/month), have been estimated using the following Formula (2):
ETc = Kc × ET 0 ,
where Kc is a crop coefficient related to crop type and vegetative stage, and ET0 is the reference evapotranspiration. ET0 was obtained from the MODIS Evapotranspiration/Latent Heat Flux (ET/LE) product (MOD16A2GF—Version 6.1) with a spatial resolution of 500 m [60]. From this dataset, monthly ET0 values were extrapolated for each agricultural field, for the entire time period. The location of the agricultural parcels, with information on the crop cultivated in each parcel, was obtained from the Regional Agricultural Information System (SIARL) database.
From this dataset, the Kc for each crop class was obtained from the literature [61,62,63]. This coefficient was adjusted to take into account monthly relative humidity and wind speed. These meteorological data were collected by the Lombardy Regional Agency for Environmental Protection (ARPA Lombardy) portal [64] and then elaborated to obtain monthly average values. Finally, the Kc for each month was multiplied by ET0. The amount of precipitation was also considered as a contribution to irrigation, following the methodology indicated in the Chapter 4 of Training manual n°3 on Irrigation Water Management [50], analyzing the measurements collected by the Lombardy Regional Agency for Environmental Protection (ARPA Lombardy). In order to assess the adequacy of these estimates, the results have been compared with literature values [61,65].
Most water demanding crops in the study area are alfalfa and pasture, which represent the permanent forage, with mean values in the four years of ~9030 and 9622 m3/ha, respectively. The most irrigated areas are distributed throughout the area, concentrated especially around the Turano Lodigiano municipality (Figure 7a). The irrigated areas increased from 2016 to 2018, with a reduction in 2019, while the irrigation needs increased from 2016 to 2017 (from 44,982 to 65,886 m3/ha) and decreased in subsequent years (Figure 7b). The increase in 2017 can be explained by the increase in the pasture class, which then decreases in 2018 and 2019. At the same time, in 2018, the precipitation reached the maximum value (5197 mm), decreasing irrigation needs (Figure 7c).
The increase in the irrigated land and irrigation needs could be a cause of the land subsidence observed in the study area.

4.2.2. Impact of Urban Expansion on Land Subsidence

Urbanization is a triggering and/or accelerating factor for the land subsidence [66]. Several authors have detected consolidation processes induced by an external load (e.g., new buildings) using A-DInSAR data [66,67,68]. The complexity of the interpretation of the TS in urban areas is due to the fact that the movements are due to a combination of different factors, such as the geological and geotechnical properties of the subsoil, the pore pressure changes, the external load features, the types of foundations, and the building’s age [66,69,70]. Unfortunately, detailed information about the geotechnical properties of the soils and about the building characteristics is not available. It is worth noting that the buildings of Turano Lodigiano have the most extended HGDs (Figure 5a). Therefore, we focus the analysis on the comparison between the LOS velocity and the building’s age. In particular, the building’s age has been inferred by a manual change detection of the new buildings using the Regional Technical Chart (CTR) 1:10.000 [40] and the very high-resolution imagery from the ESRI World Map service [71]. The DBTR has been exploited as a database of the building [40]. Most of the constructions in the urban area of Turano Lodigiano are dated, on average, from 1940 till 2000 [72]. From a total quantity of 1062 buildings, 69% (734) were built until the year 1998, 29.9% (318) were constructed between 1998 and 2010 and only 1% (10) from 2010 till 2021 (Figure 8a). This includes also small structures that were incorporated and assembled into the original buildings. Despite this, the city’s expansion has been very slow in the last two decades and the population has slightly decreased in the last 50 years [38] with a negative growth rate of −17.6%.
The results show that the buildings built before 1998 have higher negative LOS velocity with respect to the most recent buildings. Overall, despite the different building ages, the average LOS velocity are high reaching values higher than −2 mm/yr. Therefore, a significant correlation between the building’s age and the moving area is not found.

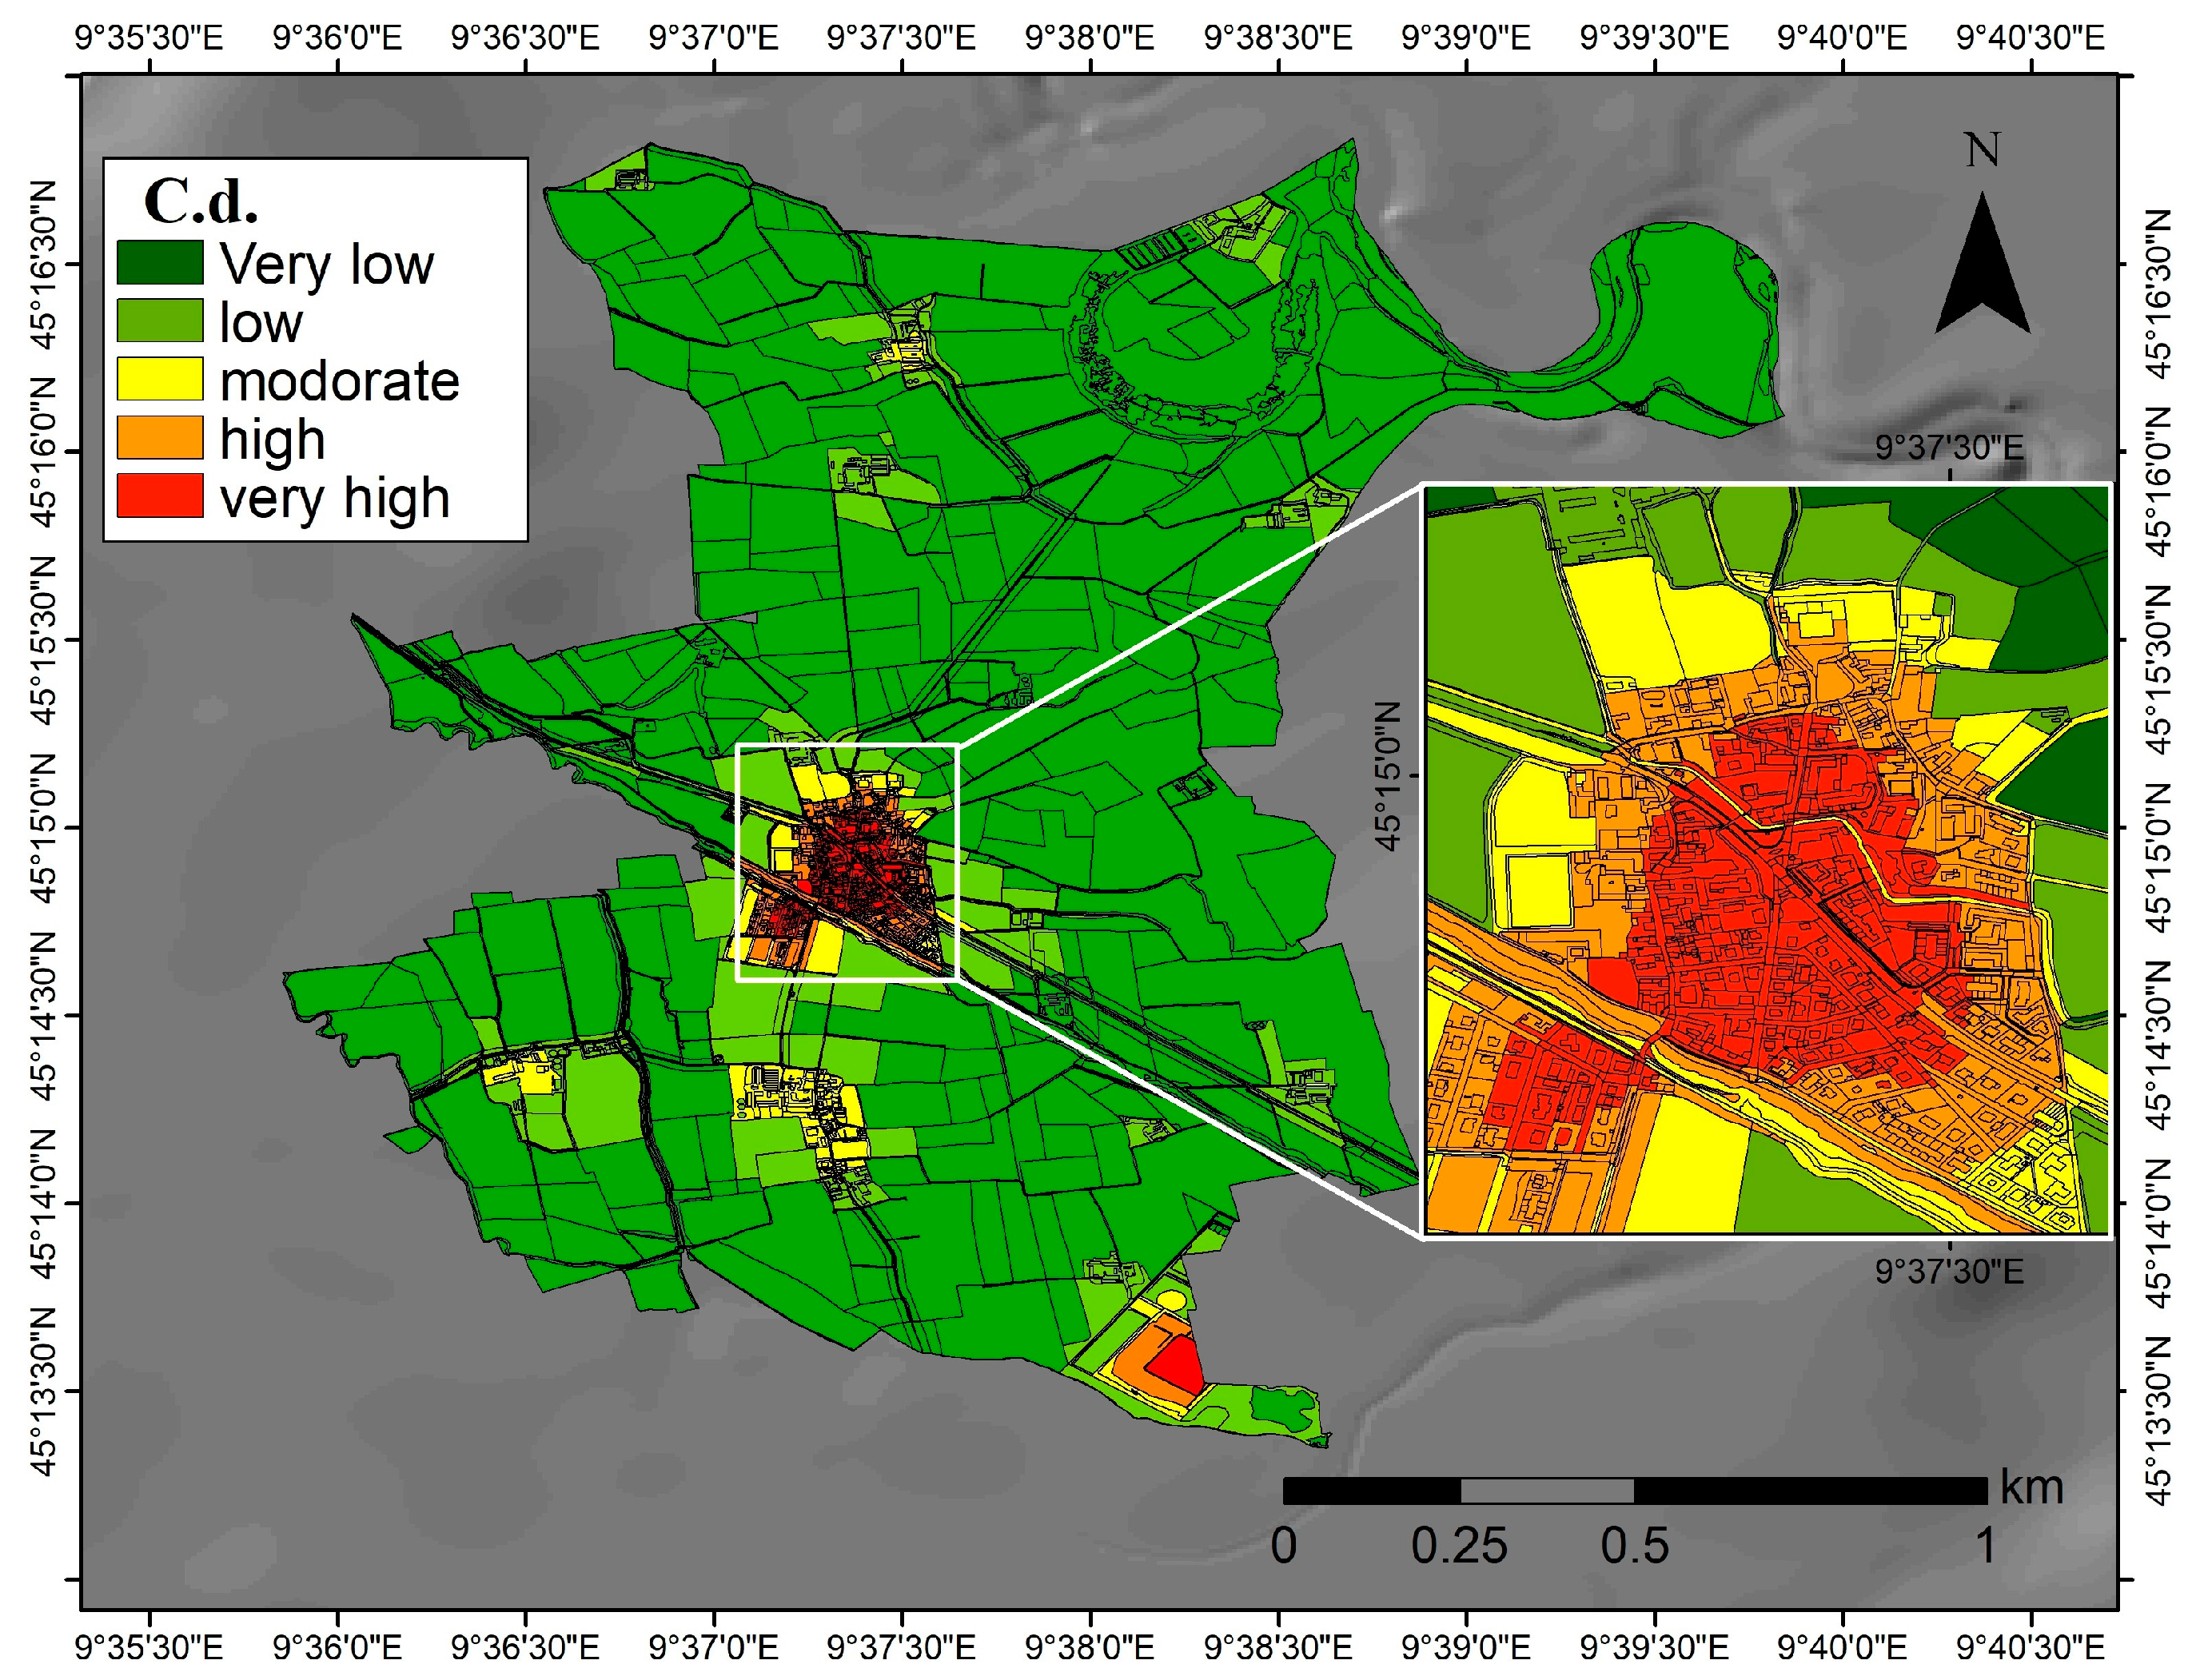
4.3. Confidence Degree of the Results and Suggested Actions

Confidence degree (C.d.) assessment of the A-DInSAR data for land subsidence detection and interpretation has been performed by taking into account the CSK MP distribution. The results are shown in Figure 9. The higher values are observed in the centre of Turano Lodigiano, whereas low and very low values are obtained in the agricultural lands.
Therefore, the results suggest that the interpretation of the ground movements is limited in the agricultural areas. Additional in situ land and groundwater monitoring systems should be implemented in the area, especially in the agricultural lands where the MP are missing. Piezometers should be installed to monitor the piezometric level variation in order to support the sustainable groundwater management. Additional geological/hydrogeological investigations are needed to understand the aquifer geometry and conditions (i.e., confined, semi-confined and unconfined) and the thickness of the compressible soils.

5. Discussions

5.1. Comparison of CSK with EGMS S1 Data

The quality of A-DInSAR results depends on several factors, such as the processing characteristics, the atmospheric correction, and phase unwrapping improving, and the validation may be performed by comparing A-DInSAR with ground truth data [73]. Furthermore, in some cases, the reliability of the processing results can be assessed by testing different algorithms [74] or different sensors over the same area [75]. As was mentioned before, EGMS provides a measure of the ground movements across Europe using S1 data.
Therefore, in this study a consistency analysis has been performed to compare the CSK results (X-band) with the available EGMS S1 (C-band) data.
EGMS delivers three levels of products updated annually and with a temporal resolution of 6 days: basic, calibrated, and orthorectified. The basic product provides LOS velocity maps in ascending and descending orbits referenced to a local reference point. The calibrated product provides LOS maps in the same orbits as the basic product but referenced to a model derived from global navigation satellite systems time-series data, making them absolute. The orthorectified product provides data on the horizontal and vertical components of motion, referencing the geodetic reference model and resampled at 100 m [21]. In this study, we used EGMS basic data from the period 2015–2021.
To make the two datasets spatially comparable, the CSK data has been interpolated using the Inverse Distance Weighted (IDW) method [76] with a maximum distance of 10 m. The resulting map was then sampled at the EGMS MP. A sensitivity analysis was conducted to determine the optimal threshold for the maximum distance of interpolation. Specifically, interpolation was performed using maximum distances of 10 and 30 m. The results indicate that a distance of 10 m enables the capture of differences between the two datasets. Despite the spatial interpolation and the sampling, the datasets refer to two different periods, and the CSK LOS velocity was derived using X-band data with a nominal revisit time of 16 days, while the EGMS LOS velocity was calculated using Sentinel-1 C-band data with a revisit time of 6 days. The spatial resolution of both sensors is different, while CSK produces a pixel size of 3 m, S1 pixel is 5× 20 m.
Also, the CSK wavelength, shorter than S1 sensor’s one, is more sensitive to small-scale ground deformation while less able to penetrate vegetation, resulting in lower coverage over the open fields.
However, the spatial distribution of the CSK LOS velocity (Figure 3) appears to be consistent with the same information derived from the EGMS S1 data (Figure 10a), and the two datasets of LOS velocity show a strong correlation (correlation index = 0.907).
The linear regression model built between EGMS and CSK data estimated an R-squared value of 0.82 (p-value < 2.2 × 10⁻¹⁶). The results show that there are less than ten points with differences between EGMS-CSK LOS velocity higher than 5 mm/year (Figure 10b). In some cases, the retrieved difference between the two datasets is due to very local outliers characterized by phase unwrapping errors detected in the EGMS data. However, no relevant errors have been retrieved by comparing the two datasets (Figure 10b).

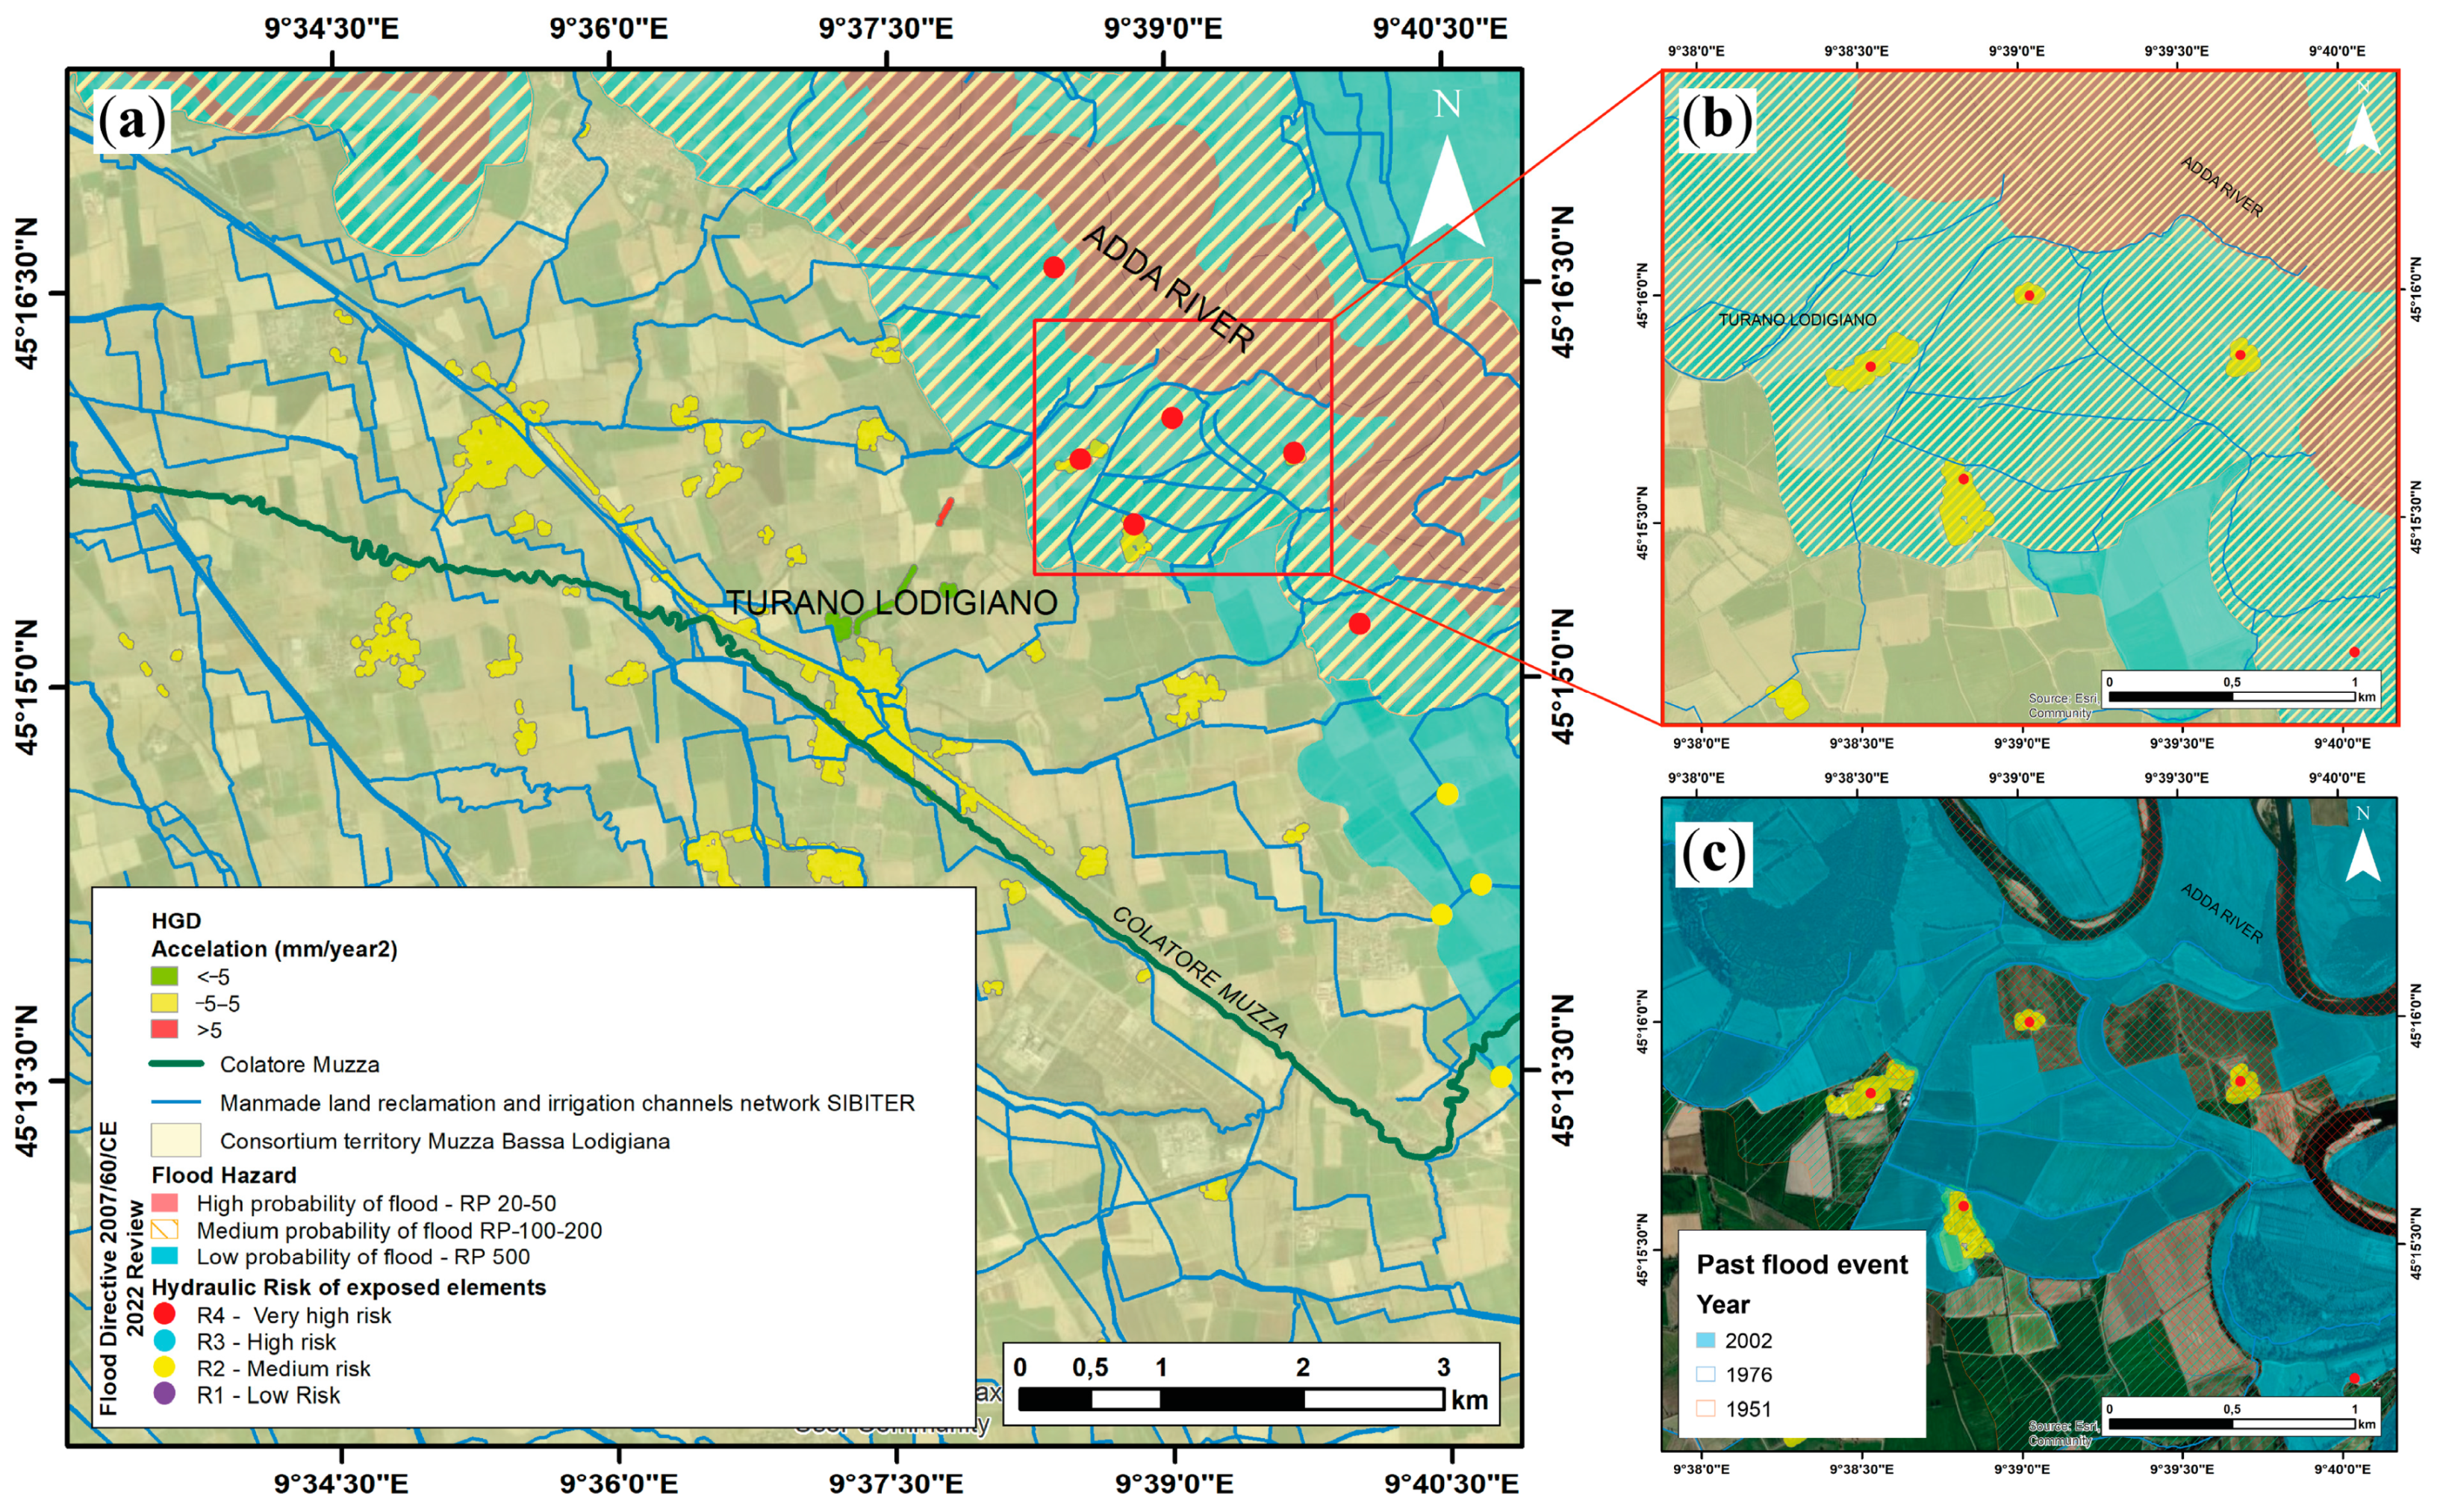
5.2. Land Subsidence and Hydraulic Risk

In the view of an operational monitoring service for land subsidence especially in flood prone areas considering concomitant phenomena could be crucial for multi-hazard risk assessment to provide valuable insight for emergency management, civil protection activities, and land use management. Additionally, in the literature, it seems that hydraulic risk can be altered or even intensified by the land subsidence [77] changing the spatial patterns of the hydraulic risk by modifying the inundation intensity (i.e., extent and spatial distribution of flooded areas) and consequently the spatial distribution of hydrodynamic variables (i.e., water depth and velocity) [78], and the correlation between the two phenomena is strictly associated with the study area setting [79]. A qualitative analysis related to the obtained results has been performed to evaluate the role of land subsidence in altering directly (i.e., changing the current topography) the hydraulic risk. Therefore, the persistent HGDs have been overlapped with the flood hazard maps delineated under the Floods Directive (Flood Directive 2007/60/CE—2022 Review [40]) (i.e., areas potentially affected by flooding) for three flood scenarios: low probability of floods or extreme event scenarios (up to 500-year return period), medium probability of floods (100–200-year return period) or high probability of floods (20–50-year return period) (Figure 11a). The test site is outside the areas of potential significant flood risk (APSFR). Thus, the potential negative consequences resulting from concomitant phenomena could slightly directly affect the exposed elements potentially hit by the flood considering the risk map under the Flood Directive that provides four risk classes expressed in terms of the number of inhabitants potentially affected, infrastructure and strategic facilities, environmental, historical and cultural heritage, distribution and type of economic activities, and the past flood events that occurred in the area (historical floods between Ticino and Adda river). Four buildings recognized as significant environmental and cultural heritage assets and classified as a very high hydraulic risk class fall within HGDs characterized by an acceleration between −5 and 5 mm/yr2 (Figure 11b). Differential land subsidence could weaken the structure causing distortion to already highly exposed elements, also affected by the historic floods of 1951 and 1976 (Figure 11c), increasing their physical vulnerability. Furthermore, land subsidence could have a possible negative impact on the hydraulic network. The main structures and infrastructures distributed in the test site feature a dense manmade land reclamation and irrigation channels network, comprising 98 channels with a total length of approximately 293 km (Figure 11a) (information system for the reclamation and irrigation of rural territory—SIBITER [40]). Thus, in high critical-conditions differential land subsidence can alter the channel flow directions and discharge reversing channel slopes, making water flow less efficiently and causing damage to infrastructure waterways and agriculture production [80]. Changes in ground elevations might also alter the starting/stopping level of the pumping system with a consequent increase in the energy and costs required for water disposal. In the perspective of an operational monitoring service, the land subsidence collateral effects should be taken into account even considering the maximum admissible differential displacements for structure and infrastructure. In the test site, land subsidence should be considered as a potential driver of a riverine flood hazard, as a slow and gradual process that develops on larger time scales than flooding [77].

5.3. MapLombardy and IRIDE Future Services

With a budget of EUR 1.06 billon, IRIDE represents one of the most ambitious space constellations in Europe with direct benefits to MapItaly in general and MapLombardy in particular. IRIDE next generation of satellites include two SAR constellations in Band-X, in Spotlight, Stripmap, and ScanSAR modes. IRIDE produces higher temporal and spatial resolution to overcome many limitations of current constellations. For instance, while the CSK revisiting time remains at 16 days, S1 is down to 6 days (12 days when exploiting one satellite only). The pixel size of the new IRIDE constellations is planned to be reduced up to 0.5 m. Therefore, smaller changes should be able to be observed [29] that will achieve a more robust MP map and HGD products.
Freely accessible A-DInSAR from EGMS will be complemented in 2026 by the slow land movement service from IRIDE, which will support Civil Protection and other Administrations as well as the private sector. This service is one of the eight thematic reference services that have been identified based on large Italian institutional user needs to facilitate the match between buyer groups’ demand and the industry offer. The land movement service has been created by considering two aspects: information needs and technical requirements. Some of the aspects that have been considered are spatial resolution, revisit time, and range, among others.
The potential of this PoC of the A-DInSAR service will be further utilized for various application domains, such as preventive monitoring for infrastructures and geohazards, and to address the lack of data for cultural and natural heritage located in areas affected by land subsidence [80].
The proposed approach has been applied in a complex peri-urban landscape with urban and rural characteristics. The main technological improvement compared to previous studies is a new data processing chain that captures the dynamic changes over time and space in the hotspot of ground deformation by utilizing the A-DInSAR time series. Specifically, the service includes TS post-processing tools that can also be utilized for exploiting EGMS data and future EO products such as those offered by the IRIDE program.

6. Conclusions and Perspectives

We present a PoC of an A-DInSAR-based service for land subsidence monitoring and interpretation. The pre-operational service MapLombardy is aimed at producing easy-to-read products to be exploited by local authorities and for civil protection activities. The service allows us to produce three main products that are (1) an MP map, (2) the HGD database, and (3) the report that includes the results of the operational workflow, the suggested actions, and a confidence degree map of the results.
Overall, the procedure allows us to exploit the A-DInSAR time series to identify moving areas that need intervention. The ground deformation data are converted into systematic information useful for non-expert users.
The methodology has been tested in Turano Lodigiano, a peri-urban area of the Lombardy region using CSK data acquired from 2016 to 2019. PCA and optimized hotspot analysis of the TS have allowed us to detect a total moving area of 2.41 km2 with a maximum LOS velocity rate of −12 mm/yr. Furthermore, to test a continuous updating of the A-DInSAR data, the original dataset has been subdivided into two archives (i.e., the historical and the updated data). This analysis has allowed us to identify acceleration, deceleration, and constant ground deformation trends. Turano Lodigiano is characterized by alluvial deposits susceptible to subsidence, and the detected land subsidence may be due to the groundwater extraction due to the increase in the irrigated land and irrigation needs and the highest subsidence rates observed in correspondence of the low to discreet permeability soils. Additional groundwater monitoring systems should be implemented to verify this hypothesis. No significant correlation is evident between the ground movements and urban expansion. The detected movements agree with the EGMS data with an R-squared value of 0.82. Some HGD has been detected in correspondence of four buildings recognized as significant environmental and cultural heritage assets and classified as a very high hydraulic risk class that needs additional in situ surveys. MapLombardy pre-operational services within IRIDE can be applied in other sites susceptible to land subsidence and using other sensors such as C-band (e.g., EGMS S1 data).
Overall, the workflow permits the detection and analysis of ground deformation over time, allowing a better understanding of the causes and potential risks associated with land subsidence. Information on where to install instruments in situ or complement missing information with other data. This knowledge is particularly crucial for land use planning and development purposes, as it enables authorities to prevent or mitigate potential damage to infrastructure, buildings, and the environment. By continuously monitoring the ground deformations, local authorities can anticipate and take preventive measures to ensure public safety and minimize potential damage. The developed products facilitate the identification of instability zones, aiding local authorities in implementing appropriate land-use policies and regulations. Therefore, this service provides valuable insights and data necessary for informed decision-making and effective management of infrastructure and natural resources in a complex landscape such as a peri-urban area.

Supplementary Materials

The following supporting information can be downloaded at: https://www.mdpi.com/article/10.3390/rs16111981/s1, Figure S1: Structure of the summary table of the report; Figure S2. (a) LOS velocity maps, (b) C.d. map, (c) HGD map and (d) displacement time series included in the report.

Author Contributions

Conceptualization, M.R., R.B. and A.T.; methodology, M.R. and R.B.; validation, S.S., I.G. and M.S.; formal analysis, M.R., R.B., S.S., I.G. and M.S.; investigation, S.S., I.G. and M.S.; writing—original draft preparation, R.B.; writing—review and editing, M.R., R.B., S.S., I.G., M.S. and A.T.; supervision, M.R., R.B. and A.T.; funding acquisition, A.T. All authors have read and agreed to the published version of the manuscript.

Funding

This study has been partially funded by the project NOCTUA “Landscape Monitoring. For Everyone. From Space” funded under the Regional Operative Program (POR) of Lombardy Region 2014–2020, call hub innovation and research (Project ID: 1179775), and by the Italian National Resilience and Recovery Plan (PNRR) M1C2-25—Investment 4.1.2: Satellite Technology and Spatial Economy, Financed by the European Union—NextGenerationEU, Purchase Order N. 5001035211 (Call for Views on the EO PNRR System And/Or Element Architecture).

Data Availability Statement

Sentinel-1 A-DInSAR data are freely available from the Copernicus EGMS service https://land.copernicus.eu/en/products/european-ground-motion-service (accessed on 26 February 2024). The meteorological data were obtained by the Lombardy Regional Agency for Environmental Protection (ARPA Lombardy) portal https://www.arpalombardia.it/dati-e-indicatori/meteo-e-clima/ (accessed on 5 March 2024). The digital elevation model, the Regional Technical Chart, the DBTR database, the flood hazard maps delineated under the Floods Directive (Flood Directive 2007/60/CE—2022 Review), and the rivel channel network data were freely downloaded from the Regione Lombardia—Open Data Geoportal https://www.geoportale.regione.lombardia.it/home (accessed on 26 February 2024). The geological and hydrogeological data were obtained from the “Comune Di Turano Lodigiano” portal https://www.comune.turanolodigiano.lo.it/piano-gestione-territoriale.php (accessed on 26 February 2024).

Acknowledgments

The authors would like to thank the technical team of TRE Altamira for their support in processing CSK InSAR datasets in the framework of the NOCTUA project.

Conflicts of Interest

The authors declare no conflicts of interest.

References

  1. Tomás, R.; Romero, R.; Mulas, J.; Marturià, J.J.; Mallorquí, J.J.; Lopez-Sanchez, J.M.; Herrera, G.; Gutiérrez, F.; González, P.J.; Fernández, J.; et al. Radar Interferometry Techniques for the Study of Ground Subsidence Phenomena: A Review of Practical Issues through Cases in Spain. Environ. Earth Sci. 2014, 71, 163–181. [Google Scholar] [CrossRef]
  2. Raspini, F.; Caleca, F.; Del Soldato, M.; Festa, D.; Confuorto, P.; Bianchini, S. Review of Satellite Radar Interferometry for Subsidence Analysis. Earth-Sci. Rev. 2022, 235, 104239. [Google Scholar] [CrossRef]
  3. Bischoff, C.A.; Ferretti, A.; Novali, F.; Uttini, A.; Giannico, C.; Meloni, F. Nationwide Deformation Monitoring with SqueeSAR® Using Sentinel-1 Data. Proc. Int. Assoc. Hydrol. Sci. 2020, 382, 31–37. [Google Scholar] [CrossRef]
  4. Crosetto, M.; Monserrat, O.; Cuevas-González, M.; Devanthéry, N.; Crippa, B. Persistent Scatterer Interferometry: A Review. ISPRS J. Photogramm. Remote Sens. 2016, 115, 78–89. [Google Scholar] [CrossRef]
  5. Crosetto, M.; Solari, L.; Mróz, M.; Balasis-Levinsen, J.; Casagli, N.; Frei, M.; Oyen, A.; Moldestad, D.A.; Bateson, L.; Guerrieri, L.; et al. The Evolution of Wide-Area DInSAR: From Regional and National Services to the European Ground Motion Service. Remote Sens. 2020, 12, 2043. [Google Scholar] [CrossRef]
  6. Ferretti, A.; Colombo, D.; Fumagalli, A.; Novali, F.; Rucci, A. InSAR Data for Monitoring Land Subsidence: Time to Think Big. Proc. Int. Assoc. Hydrol. Sci. 2015, 372, 331–334. [Google Scholar] [CrossRef]
  7. Costantini, M.; Ferretti, A.; Minati, F.; Falco, S.; Trillo, F.; Colombo, D.; Novali, F.; Malvarosa, F.; Mammone, C.; Vecchioli, F.; et al. Analysis of Surface Deformations over the Whole Italian Territory by Interferometric Processing of ERS, Envisat and COSMO-SkyMed Radar Data. Remote Sens. Environ. 2017, 202, 250–275. [Google Scholar] [CrossRef]
  8. Costantini, M.; Falco, S.; Malvarosa, F.; Minati, F. A New Method for Identification and Analysis of Persistent Scatterers in Series of SAR Images. In Proceedings of the IGARSS 2008-2008 IEEE International Geoscience and Remote Sensing Symposium, Boston, MA, USA, 7–11 July 2008; Volume 2, pp. II-449–II-452. [Google Scholar]
  9. Ferretti, A.; Prati, C.; Rocca, F. Permanent Scatterers in SAR Interferometry. IEEE Trans. Geosci. Remote Sens. 2001, 39, 8–20. [Google Scholar] [CrossRef]
  10. Ferretti, A.; Fumagalli, A.; Novali, F.; Prati, C.; Rocca, F.; Rucci, A. A New Algorithm for Processing Interferometric Data-Stacks: SqueeSAR. IEEE Trans. Geosci. Remote Sens. 2011, 49, 3460–3470. [Google Scholar] [CrossRef]
  11. Milillo, P.; Shanker, A.P.; Pascale, S.; Serio, C.; Sdao, F. Persistent Scatterer Interferometry Based on COSMO-SkyMed Imagery. In Proceedings of the 33rd EARSeL Symposium Towards Horizon 2020, Matera, Italy, 3–6 June 2013. [Google Scholar]
  12. Home-Geoportale MASE-Geoportale. Available online: https://gn.mase.gov.it/portale (accessed on 26 February 2024).
  13. What Is InSAR?|NGU. Available online: https://www.ngu.no/en/geologisk-kartlegging/what-insar (accessed on 26 February 2024).
  14. Dehls, J.F.; Larsen, Y.; Marinkovic, P.; Lauknes, T.R.; Stødle, D.; Moldestad, D.A. INSAR.No: A National Insar Deformation Mapping/Monitoring Service in Norway—From Concept to Operations. In Proceedings of the IGARSS 2019-2019 IEEE International Geoscience and Remote Sensing Symposium, Yokohama, Japan, 28 July–2 August 2019; pp. 5461–5464. [Google Scholar]
  15. Bodenbewegungsdienst Deutschland. Available online: https://bodenbewegungsdienst.bgr.de/mapapps/resources/apps/bbd/index.html?lang=en (accessed on 26 February 2024).
  16. Kalia, A.C.; Frei, M.; Lege, T. A Copernicus Downstream-Service for the Nationwide Monitoring of Surface Displacements in Germany. Remote Sens. Environ. 2017, 202, 234–249. [Google Scholar] [CrossRef]
  17. Mahapatra, P.; van der Marel, H.; van Leijen, F.; Samiei-Esfahany, S.; Klees, R.; Hanssen, R. InSAR Datum Connection Using GNSS-Augmented Radar Transponders. J. Geod. 2018, 92, 21–32. [Google Scholar] [CrossRef]
  18. Bodemdalingskaart 2.0. Available online: https://bodemdalingskaart.portal.skygeo.com/portal/bodemdalingskaart/u2/viewers/basic/ (accessed on 26 February 2024).
  19. Levinsen, J.F. Approaching Target: A Service for Nationwide Deformation Monitoring in Denmark Using Sentinel-1; DTU: Delhi, India, 2017. [Google Scholar]
  20. Crosetto, M.; Solari, L. Satellite Interferometry Data Interpretation and Exploitation; Elsevier: Amsterdam, The Netherlands, 2023. [Google Scholar]
  21. European Ground Motion Service—Copernicus Land Monitoring Service. Available online: https://land.copernicus.eu/en/products/european-ground-motion-service (accessed on 26 February 2024).
  22. Papoutsis, I.; Kontoes, C.; Alatza, S.; Apostolakis, A.; Loupasakis, C. InSAR Greece with Parallelized Persistent Scatterer Interferometry: A National Ground Motion Service for Big Copernicus Sentinel-1 Data. Remote Sens. 2020, 12, 3207. [Google Scholar] [CrossRef]
  23. Morishita, Y. Nationwide Urban Ground Deformation Monitoring in Japan Using Sentinel-1 LiCSAR Products and LiCSBAS. Prog. Earth Planet. Sci. 2021, 8, 6. [Google Scholar] [CrossRef]
  24. Ronczyk, L.; Zelenka-Hegyi, A.; Török, G.; Orbán, Z.; Defilippi, M.; Kovács, I.P.; Kovács, D.M.; Burai, P.; Pasquali, P. Nationwide, Operational Sentinel-1 Based InSAR Monitoring System in the Cloud for Strategic Water Facilities in Hungary. Remote Sens. 2022, 14, 3251. [Google Scholar] [CrossRef]
  25. Di Martire, D.; Paci, M.; Confuorto, P.; Costabile, S.; Guastaferro, F.; Verta, A.; Calcaterra, D. A Nation-Wide System for Landslide Mapping and Risk Management in Italy: The Second Not-Ordinary Plan of Environmental Remote Sensing. Int. J. Appl. Earth Obs. Geoinf. 2017, 63, 143–157. [Google Scholar] [CrossRef]
  26. Chang, L.; Dollevoet, R.P.B.J.; Hanssen, R.F. Nationwide Railway Monitoring Using Satellite SAR Interferometry. IEEE J. Sel. Top. Appl. Earth Obs. Remote Sens. 2017, 10, 596–604. [Google Scholar] [CrossRef]
  27. Fernández-Torres, E.A.; Cabral-Cano, E.; Solano-Rojas, D.; Salazar-Tlaczani, L.; Gárcia-Venegas, J.; Marquez-Azúa, B.; Graham, S.; Villarnobo-Gonzalez, K.M. Country-Scale Assessment of Urban Areas, Population, and Households Exposed to Land Subsidence Using Sentinel-1 InSAR, and GPS Time Series. Nat. Hazards 2024, 120, 1577–1601. [Google Scholar] [CrossRef] [PubMed]
  28. Tomás, R.; Pagán, J.I.; Navarro, J.A.; Cano, M.; Pastor, J.L.; Riquelme, A.; Cuevas-González, M.; Crosetto, M.; Barra, A.; Monserrat, O.; et al. Semi-Automatic Identification and Pre-Screening of Geological–Geotechnical Deformational Processes Using Persistent Scatterer Interferometry Datasets. Remote Sens. 2019, 11, 1675. [Google Scholar] [CrossRef]
  29. Festa, D.; Bonano, M.; Casagli, N.; Confuorto, P.; De Luca, C.; Del Soldato, M.; Lanari, R.; Lu, P.; Manunta, M.; Manzo, M.; et al. Nation-Wide Mapping and Classification of Ground Deformation Phenomena through the Spatial Clustering of P-SBAS InSAR Measurements: Italy Case Study. ISPRS J. Photogramm. Remote Sens. 2022, 189, 1–22. [Google Scholar] [CrossRef]
  30. Giglio, E.; Dejana, M.; Bevilacqua, M. NOCTUA: Potenzialità Innovative per l’Osservazione Della Terra. Available online: https://www.semanticscholar.org/paper/NOCTUA%3A-potenzialit%C3%A0-innovative-per-l%27Osservazione-Giglio-Dejana/6ee3ededee4cfc4b3f5df8e52d2a996f8c5026e9 (accessed on 29 February 2024).
  31. Fissore, V.; Bovio, L.; Perotti, L.; Boccardo, P.; Borgogno-Mondino, E. Towards a Digital Twin Prototype of Alpine Glaciers: Proposal for a Possible Theoretical Framework. Remote Sens. 2023, 15, 2844. [Google Scholar] [CrossRef]
  32. Conti, F.; Eugeni, M.; Marzioli, P.; Pasquali, M.; Schiavon, E.; Nguyen Xuan, A.; Antonella, T.; Geraldini, S.; Piergentili, F.; Taramelli, A.; et al. A Model-Based Approach for the Preliminary Design of the SAR Upstream Element for the Italian IRIDE EO Constellation Based on Users’ Demand. CEAS Space J. 2024. Under review. [Google Scholar] [CrossRef]
  33. Schiavon, E.; Taramelli, A.; Tornato, A.; Lee, C.M.; Luvall, J.C.; Schollaert Uz, S.; Townsend, P.A.; Cima, V.; Geraldini, S.; Nguyen Xuan, A.; et al. Maximizing Societal Benefit across Multiple Hyperspectral Earth Observation Missions: A User Needs Approach. J. Geophys. Res. Biogeosciences 2023, 128, e2023JG007569. [Google Scholar] [CrossRef]
  34. Valentini, E.; Sapio, S.; Schiavon, E.; Righini, M.; Monteleone, B.; Taramelli, A. Development of a Pre-Automatized Processing Chain for Agricultural Monitoring Using a Multi-Sensor and Multi-Temporal Approach. Land 2024, 13, 91. [Google Scholar] [CrossRef]
  35. Righini, M.; Gatti, I.; Taramelli, A.; Arosio, M.; Valentini, E.; Sapio, S.; Schiavon, E. Integrated Flood Impact and Vulnerability Assessment Using a Multi-Sensor Earth Observation Mission with the Perspective of an Operational Service in Lombardy, Italy. Land 2024, 13, 140. [Google Scholar] [CrossRef]
  36. Cattivelli, V. The Governance of Peri-Urban Areas in Lombardy (IT): The Strengths and Weaknesses of the Regional Territorial Governance System: La Governance Delle Aree Periurbane in Lombardia (IT): I Punti Di Forza e Di Debolezza Del Sistema Di Governance Territoriale Regionale. Valori Valutazioni 2023, 33, 133–148. [Google Scholar] [CrossRef]
  37. Abdikan, S.; Arıkan, M.; Sanli, F.B.; Cakir, Z. Monitoring of Coal Mining Subsidence in Peri-Urban Area of Zonguldak City (NW Turkey) with Persistent Scatterer Interferometry Using ALOS-PALSAR. Environ. Earth Sci. 2014, 71, 4081–4089. [Google Scholar] [CrossRef]
  38. Statistiche Istat. Available online: http://dati.istat.it/Index.aspx (accessed on 6 March 2024).
  39. Carcano, C.; Piccin, A.; Lombardia, R. (Eds.) Geologia degli acquiferi padani della Regione Lombardia: Relazione tecnica; S.EL.CA.: Firenze, Italy, 2002. [Google Scholar]
  40. Home. Available online: https://www.geoportale.regione.lombardia.it/ (accessed on 26 February 2024).
  41. Comune Di Turano Lodigiano. Available online: https://www.comune.turanolodigiano.lo.it/piano-gestione-territoriale.php (accessed on 26 February 2024).
  42. Pagliara, P.; Basile, G.; Cara, P.; Corazza, A.; Duro, A.; Manfrè, B.; Onori, R.; Proietti, C.; Sansone, V. Integration of Earth Observation and Ground-Based HR Data in the Civil Protection Emergency Cycle: The Case of the DORIS Project. In Mathematics of Planet Earth; Pardo-Igúzquiza, E., Guardiola-Albert, C., Heredia, J., Moreno-Merino, L., Durán, J.J., Vargas-Guzmán, J.A., Eds.; Springer: Berlin/Heidelberg, Germany, 2014; pp. 263–266. [Google Scholar]
  43. Taramelli, A.; Di Matteo, L.; Ciavola, P.; Guadagnano, F.; Tolomei, C. Temporal Evolution of Patterns and Processes Related to Subsidence of the Coastal Area Surrounding the Bevano River Mouth (Northern Adriatic)—Italy. Ocean. Coast. Manag. 2015, 108, 74–88. [Google Scholar] [CrossRef]
  44. Bonì, R.; Pilla, G.; Meisina, C. Methodology for Detection and Interpretation of Ground Motion Areas with the A-DInSAR Time Series Analysis. Remote Sens. 2016, 8, 686. [Google Scholar] [CrossRef]
  45. Geraldini, S.; Bruschi, A.; Bellotti, G.; Taramelli, A. User Needs Analysis for the Definition of Operational Coastal Services. Water 2021, 13, 92. [Google Scholar] [CrossRef]
  46. Cigna, F.; Tapete, D.; Casagli, N. Semi-Automated Extraction of Deviation Indexes (DI) from Satellite Persistent Scatterers Time Series: Tests on Sedimentary Volcanism and Tectonically-Induced Motions. Nonlinear Process. Geophys. 2012, 19, 643–655. [Google Scholar] [CrossRef]
  47. Jolliffe, I.T.; Cadima, J. Principal Component Analysis: A Review and Recent Developments. Phil. Trans. R. Soc. A 2016, 374, 20150202. [Google Scholar] [CrossRef]
  48. Chaussard, E.; Bürgmann, R.; Shirzaei, M.; Fielding, E.J.; Baker, B. Predictability of Hydraulic Head Changes and Characterization of Aquifer-System and Fault Properties from InSAR-Derived Ground Deformation. J. Geophys. Res. Solid Earth 2014, 119, 6572–6590. [Google Scholar] [CrossRef]
  49. Festa, D.; Novellino, A.; Hussain, E.; Bateson, L.; Casagli, N.; Confuorto, P.; Del Soldato, M.; Raspini, F. Unsupervised Detection of InSAR Time Series Patterns Based on PCA and K-Means Clustering. Int. J. Appl. Earth Obs. Geoinf. 2023, 118, 103276. [Google Scholar] [CrossRef]
  50. Wang, G.; Li, P.; Li, Z.; Liang, C.; Wang, H. Coastal Subsidence Detection and Characterization Caused by Brine Mining over the Yellow River Delta Using Time Series InSAR and PCA. Int. J. Appl. Earth Obs. Geoinf. 2022, 114, 103077. [Google Scholar] [CrossRef]
  51. Rigamonti, S.; Dattola, G.; Frattini, P.; Crosta, G.B. A Multivariate Time Series Analysis of Ground Deformation Using Persistent Scatterer Interferometry. Remote Sens. 2023, 15, 3082. [Google Scholar] [CrossRef]
  52. Ord, J.K.; Getis, A. Local Spatial Autocorrelation Statistics: Distributional Issues and an Application. Geogr. Anal. 1995, 27, 286–306. [Google Scholar] [CrossRef]
  53. Silverman, B.W. Density Estimation for Statistics and Data Analysis; Routledge: New York, NY, USA, 2017; ISBN 978-1-315-14091-9. [Google Scholar]
  54. Tosi, L.; Teatini, P.; Strozzi, T. Natural versus Anthropogenic Subsidence of Venice. Sci. Rep. 2013, 3, 2710. [Google Scholar] [CrossRef]
  55. Taramelli, A.; Manzo, C.; Valentini, E.; Cornacchia, L. Coastal Subsidence: Causes, Mapping and Monitoring. In Natural Hazards; CRC Press: Boca Raton, FL, USA, 2018; pp. 253–289. ISBN 978-1-138-05443-1. [Google Scholar]
  56. Galloway, D.L.; Burbey, T.J. Review: Regional Land Subsidence Accompanying Groundwater Extraction. Hydrogeol. J. 2011, 19, 1459–1486. [Google Scholar] [CrossRef]
  57. Herrera-García, G.; Ezquerro, P.; Tomás, R.; Béjar-Pizarro, M.; López-Vinielles, J.; Rossi, M.; Mateos, R.M.; Carreón-Freyre, D.; Lambert, J.; Teatini, P.; et al. Mapping the Global Threat of Land Subsidence. Science 2021, 371, 34–36. [Google Scholar] [CrossRef]
  58. Home|Food and Agriculture Organization of the United Nations. Available online: http://www.fao.org/home/en (accessed on 28 February 2024).
  59. Running, S.; Mu, Q.; Zhao, M.; Moreno, A. MODIS/Terra Net Evapotranspiration Gap-Filled 8-Day L4 Global 500m SIN Grid V061; LP DAAC: Sioux Falls, SD, USA, 2021. [Google Scholar]
  60. Casa, R.; Rossi, M.; Sappa, G.; Trotta, A. Assessing Crop Water Demand by Remote Sensing and GIS for the Pontina Plain, Central Italy. Water Resour. Manag. 2009, 23, 1685–1712. [Google Scholar] [CrossRef]
  61. Payero, J.O.; Irmak, S. Daily Energy Fluxes, Evapotranspiration and Crop Coefficient of Soybean. Agric. Water Manag. 2013, 129, 31–43. [Google Scholar] [CrossRef]
  62. FAO. Climate Info Tool. Available online: https://aquastat.fao.org/climate-information-tool/ (accessed on 5 March 2024).
  63. Meteo e Clima—ARPA Lombardia. Available online: https://www.arpalombardia.it/dati-e-indicatori/meteo-e-clima/ (accessed on 5 March 2024).
  64. Istat.it—6° Censimento Agricoltura 2010. Available online: https://www.istat.it/it/censimenti-permanenti/censimenti-precedenti/agricoltura/agricoltura-2010 (accessed on 5 March 2024).
  65. Bozzano, F.; Esposito, C.; Mazzanti, P.; Patti, M.; Scancella, S. Imaging Multi-Age Construction Settlement Behaviour by Advanced SAR Interferometry. Remote Sens. 2018, 10, 1137. [Google Scholar] [CrossRef]
  66. Stramondo, S.; Bozzano, F.; Marra, F.; Wegmuller, U.; Cinti, F.R.; Moro, M.; Saroli, M. Subsidence Induced by Urbanisation in the City of Rome Detected by Advanced InSAR Technique and Geotechnical Investigations. Remote Sens. Environ. 2008, 112, 3160–3172. [Google Scholar] [CrossRef]
  67. Chen, G.; Zhang, Y.; Zeng, R.; Yang, Z.; Chen, X.; Zhao, F.; Meng, X. Detection of Land Subsidence Associated with Land Creation and Rapid Urbanization in the Chinese Loess Plateau Using Time Series InSAR: A Case Study of Lanzhou New District. Remote Sens. 2018, 10, 270. [Google Scholar] [CrossRef]
  68. Bonì, R.; Bosino, A.; Meisina, C.; Novellino, A.; Bateson, L.; McCormack, H. A Methodology to Detect and Characterize Uplift Phenomena in Urban Areas Using Sentinel-1 Data. Remote Sens. 2018, 10, 607. [Google Scholar] [CrossRef]
  69. Floris, M.; Fontana, A.; Tessari, G.; Mulè, M. Subsidence Zonation Through Satellite Interferometry in Coastal Plain Environments of NE Italy: A Possible Tool for Geological and Geomorphological Mapping in Urban Areas. Remote Sens. 2019, 11, 165. [Google Scholar] [CrossRef]
  70. World Imagery—Overview. Available online: https://www.arcgis.com/home/item.html?id=10df2279f9684e4a9f6a7f08febac2a9#! (accessed on 27 February 2024).
  71. Available online: https://italia.indettaglio.it/ita/lombardia/turanolodigiano.html (accessed on 27 February 2024).
  72. Navarro-Hernández, M.I.; Valdes-Abellan, J.; Tomás, R.; Lopez-Sanchez, J.M.; Ezquerro, P.; Bru, G.; Bonì, R.; Meisina, C.; Herrera, G. ValInSAR: A Systematic Approach for the Validation of Differential SAR Interferometry in Land Subsidence Areas. IEEE J. Sel. Top. Appl. Earth Obs. Remote Sens. 2022, 15, 3650–3671. [Google Scholar] [CrossRef]
  73. Osmanoğlu, B.; Sunar, F.; Wdowinski, S.; Cabral-Cano, E. Time Series Analysis of InSAR Data: Methods and Trends. ISPRS J. Photogramm. Remote Sens. 2016, 115, 90–102. [Google Scholar] [CrossRef]
  74. Yang, M.; Yang, T.; Zhang, L.; Lin, J.; Qin, X.; Liao, M. Spatio-Temporal Characterization of a Reclamation Settlement in the Shanghai Coastal Area with Time Series Analyses of X-, C-, and L-Band SAR Datasets. Remote Sens. 2018, 10, 329. [Google Scholar] [CrossRef]
  75. Watson, D. A Refinement of Inverse Distance Weighted Interpolation. Geo-Processing 1985, 2, 315–327. [Google Scholar]
  76. Navarro-Hernández, M.I.; Valdes-Abellan, J.; Tomás, R.; Tessitore, S.; Ezquerro, P.; Herrera, G. Analysing the Impact of Land Subsidence on the Flooding Risk: Evaluation Through InSAR and Modelling. Water Resour. Manag. 2023, 37, 4363–4383. [Google Scholar] [CrossRef]
  77. Ortega-Becerril, J.A.; Garzón, G.; Béjar-Pizarro, M.; Martínez-Díaz, J.J. Towards an Increase of Flash Flood Geomorphic Effects Due to Gravel Mining and Ground Subsidence in Nogalte Stream (Murcia, SE Spain). Nat. Hazards Earth Syst. Sci. 2016, 16, 2273–2286. [Google Scholar] [CrossRef]
  78. Carisi, F.; Domeneghetti, A.; Gaeta, M.G.; Castellarin, A. Is Anthropogenic Land Subsidence a Possible Driver of Riverine Flood-Hazard Dynamics? A Case Study in Ravenna, Italy. Hydrol. Sci. J. 2017, 62, 2440–2455. [Google Scholar] [CrossRef]
  79. Simeoni, U.; Tessari, U.; Corbau, C.; Tosatto, O.; Polo, P.; Teatini, P. Impact of Land Subsidence due to Residual Gas Production on Surficial Infrastructures: The Dosso Degli Angeli Field Study (Ravenna, Northern Italy). Eng. Geol. 2017, 229, 1–12. [Google Scholar] [CrossRef]
  80. Chen, F.; Guo, H.; Ma, P.; Tang, Y.; Wu, F.; Zhu, M.; Zhou, W.; Gao, S.; Lin, H. Sustainable Development of World Cultural Heritage Sites in China Estimated from Optical and SAR Remotely Sensed Data. Remote Sens. Environ. 2023, 298, 113838. [Google Scholar] [CrossRef]
Figure 1. (a) Location and digital terrain model of the test site (modified from [40]). (b) Permeability map and wells location (red points). A representative borehole (black point in the map) and the stratigraphic log 96 m deep is also reported (modified from documents of the Land Government Plan of Turano Lodigiano municipality [41]). The location of the zoomed (b) is represented as an inset in (a) and is expanded in (b) to show the permeability map.
Remotesensing 16 01981 g001aRemotesensing 16 01981 g001b
Figure 2. Flowchart of the methodology.
Remotesensing 16 01981 g002
Figure 3. LOS velocity (mm/year) measured using the COSMO-SkyMed SAR images in the period 2016–2019 over the study area.
Remotesensing 16 01981 g003
Figure 4. (a) Preliminary HGD and OHSA results. (b) Percentage of explained variance of the historical archive and (c) eigenvector value of the first principal component of the dataset.
Remotesensing 16 01981 g004
Figure 5. (a) Acceleration (mm/yr2) map and average TS showing (b) deceleration, (c) constant, and (d) acceleration between the historical and updated dataset.
Remotesensing 16 01981 g005
Figure 6. Box-plot of the statistical parameters for each permeability classes. See Figure 1 for the permeability classes map.
Remotesensing 16 01981 g006
Figure 7. (a) Extent of the irrigated land from 2016 to 2019. (b) Annual irrigation needs versus extent of the crop classes in the period from 2016 to 2019. (c) Irrigation needs versus precipitation data provided by ARPA Lombardy. Basemap source: Esri, Maxar, GeoEye, Earthstar Geographics, CNES/Airbus DS, USDA, USGS, AeroGRID, IGN, and the GIS User Community.
Remotesensing 16 01981 g007
Figure 8. (a) Building’s age and (b) box-plot of the statistical parameters of the LOS velocity for the different building’s age.
Remotesensing 16 01981 g008
Figure 9. Confidence degree map of the CSK MP distribution in Turano Lodigiano.
Remotesensing 16 01981 g009
Figure 10. (a) EGMS S1 LOS velocity map (2015-2021) in Turano Lodigiano. (b) Comparison between the EGMS LOS velocity and the CSK LOS velocity. The regression line (red line) is also reported.
Remotesensing 16 01981 g010aRemotesensing 16 01981 g010b
Figure 11. (a) Flood hazard and hydraulic risk of exposed elements maps (R4—very high-risk class; loss of life; R3—high-risk class, possible harm to humans; R2—medium risk class, no direct threat for people; and R1—low risk class, no threat for people) and manmade land reclamation and irrigation channels network overlayed with HGD, (b) zoom-in of areas of possible concomitant phenomena, (c) significant past floods inundation map.
Remotesensing 16 01981 g011
Table 1. SAR data and processing details.
Satellite CSK
Wavelength 3.12 cm
Acquisition geometry Descending
Satellite track 39
Monitored period 26 January 2016–20 December 2019
Number of SAR images 72
Number of measurement points (MP) 191,275
Area 229.2 sq km
MP density 834.5 MP/sq km
Disclaimer/Publisher’s Note: The statements, opinions and data contained in all publications are solely those of the individual author(s) and contributor(s) and not of MDPI and/or the editor(s). MDPI and/or the editor(s) disclaim responsibility for any injury to people or property resulting from any ideas, methods, instructions or products referred to in the content.

