
Using Ground-Penetrating Radar (GPR) to Investigate the Exceptionally Thick Deposits from the Storegga Tsunami in Northeastern Scotland


Abstract

1. Introduction
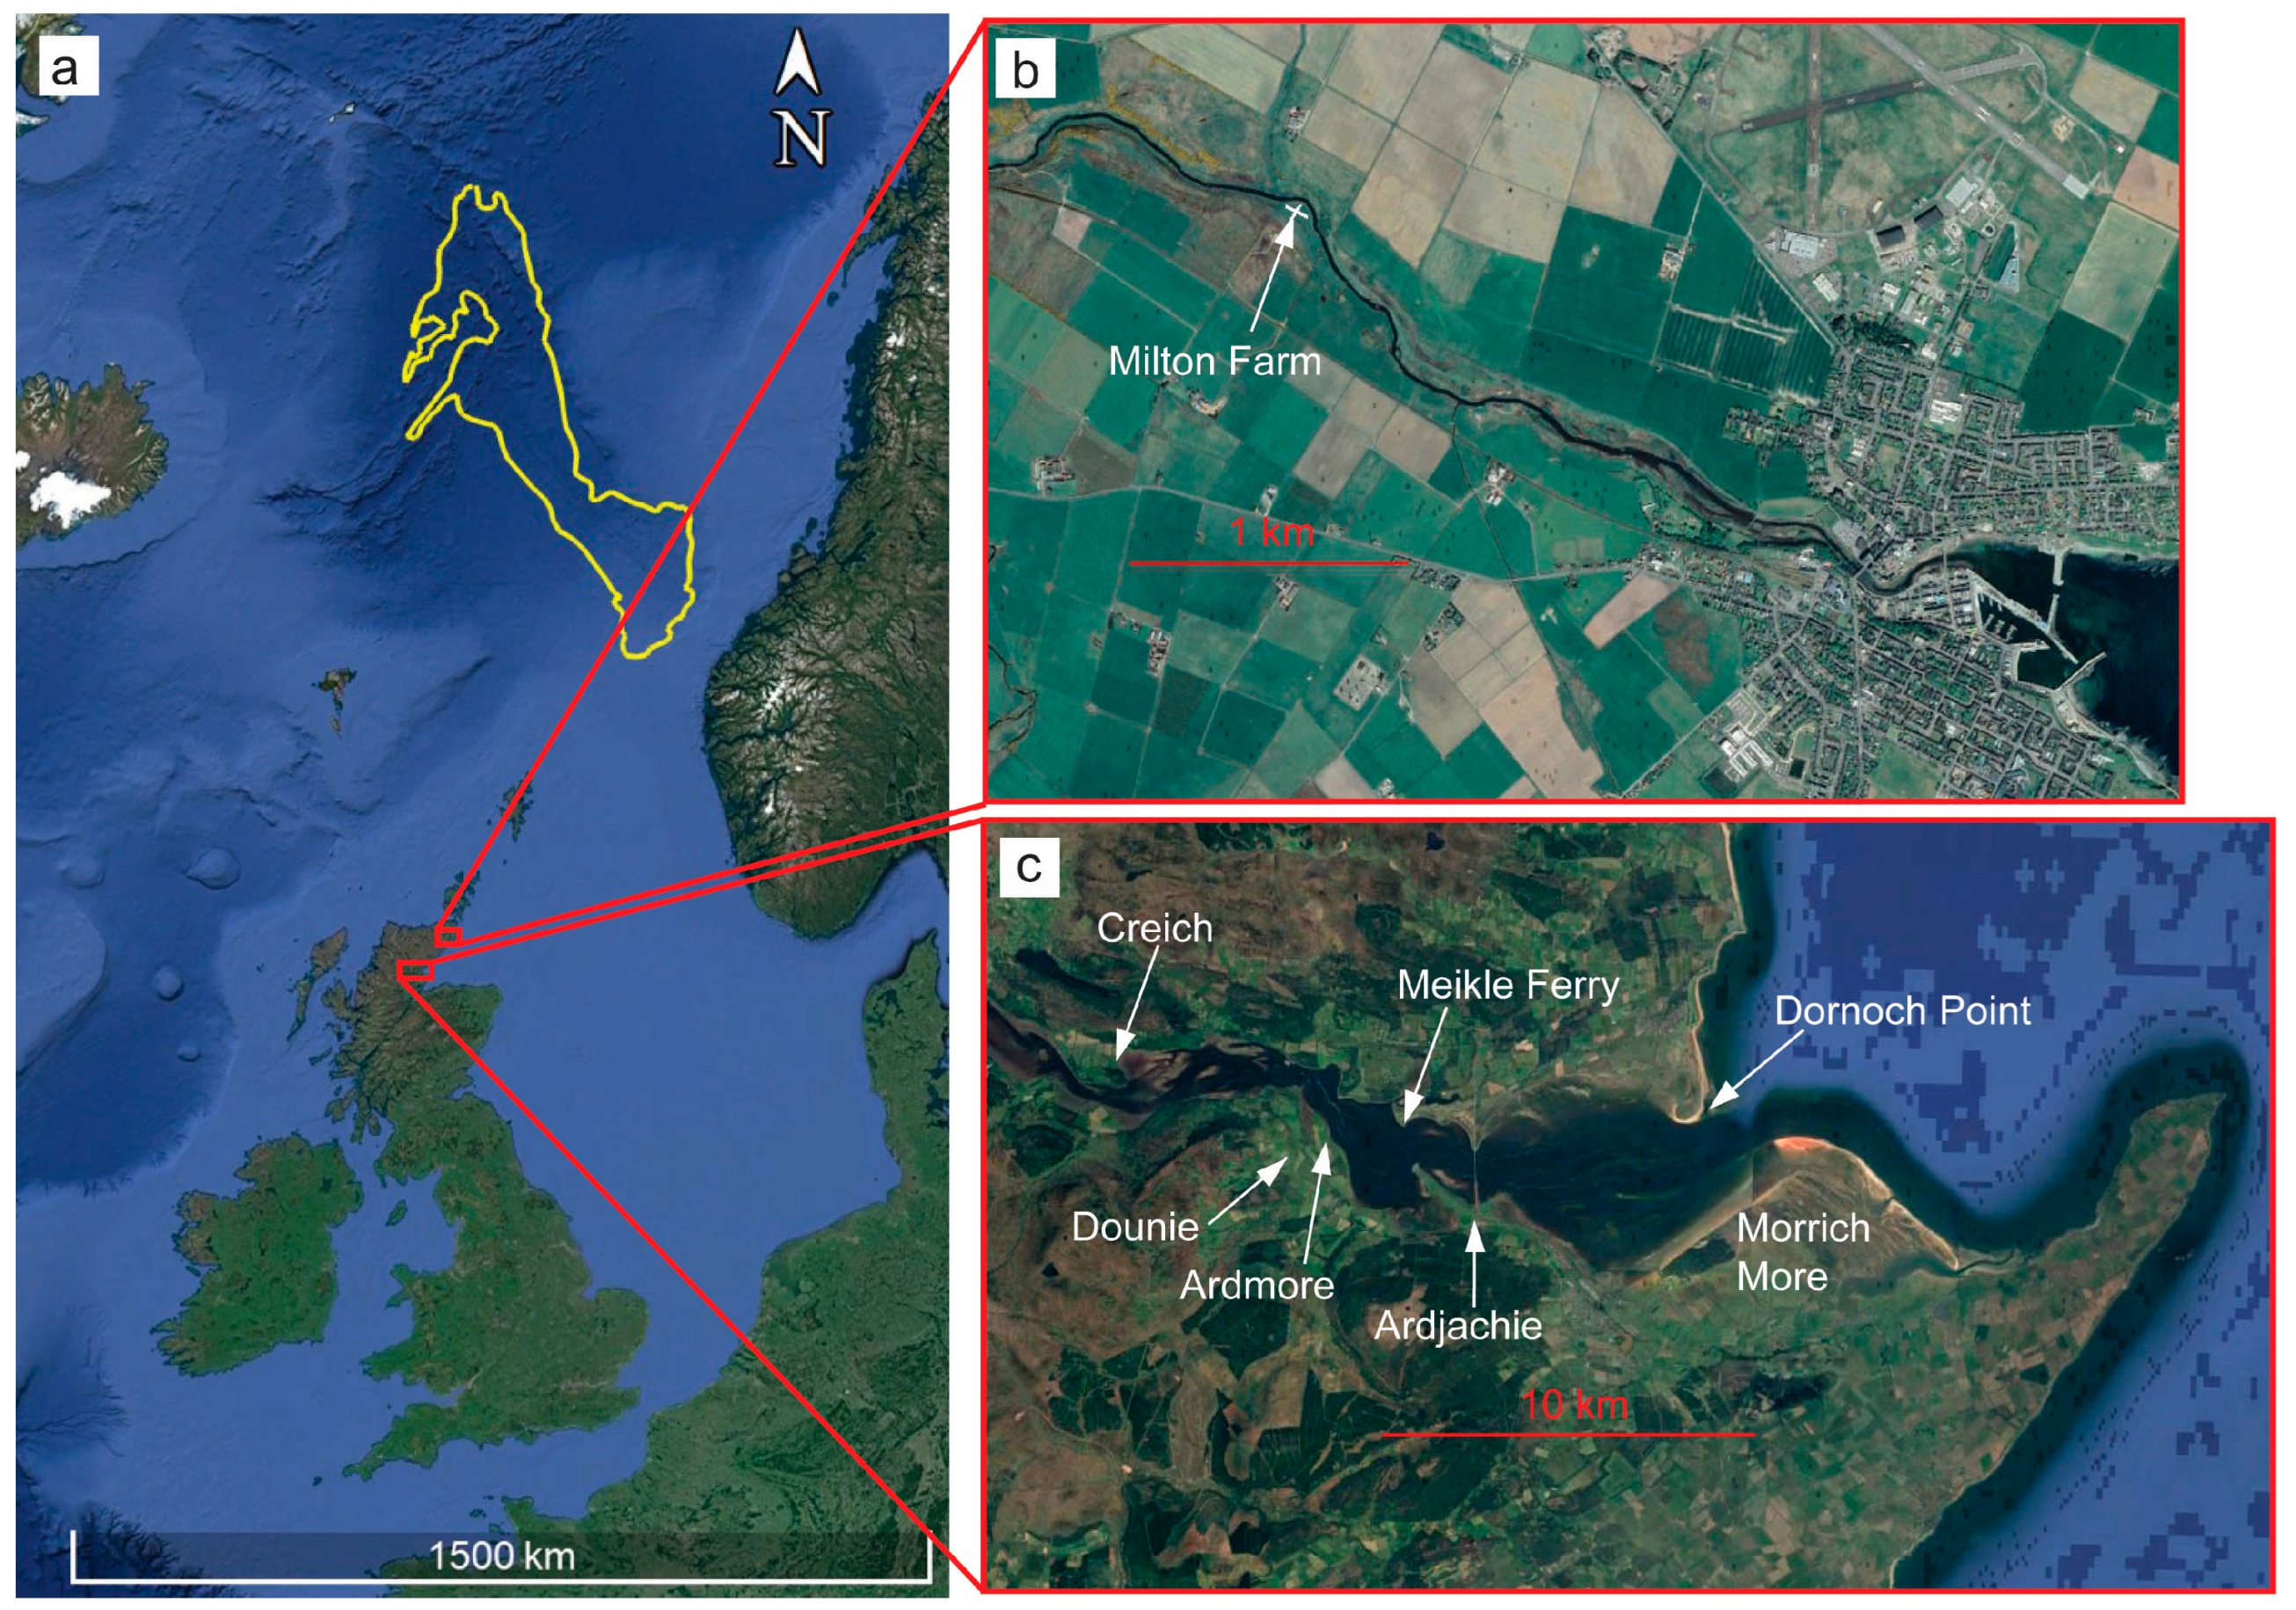
2. Study Areas
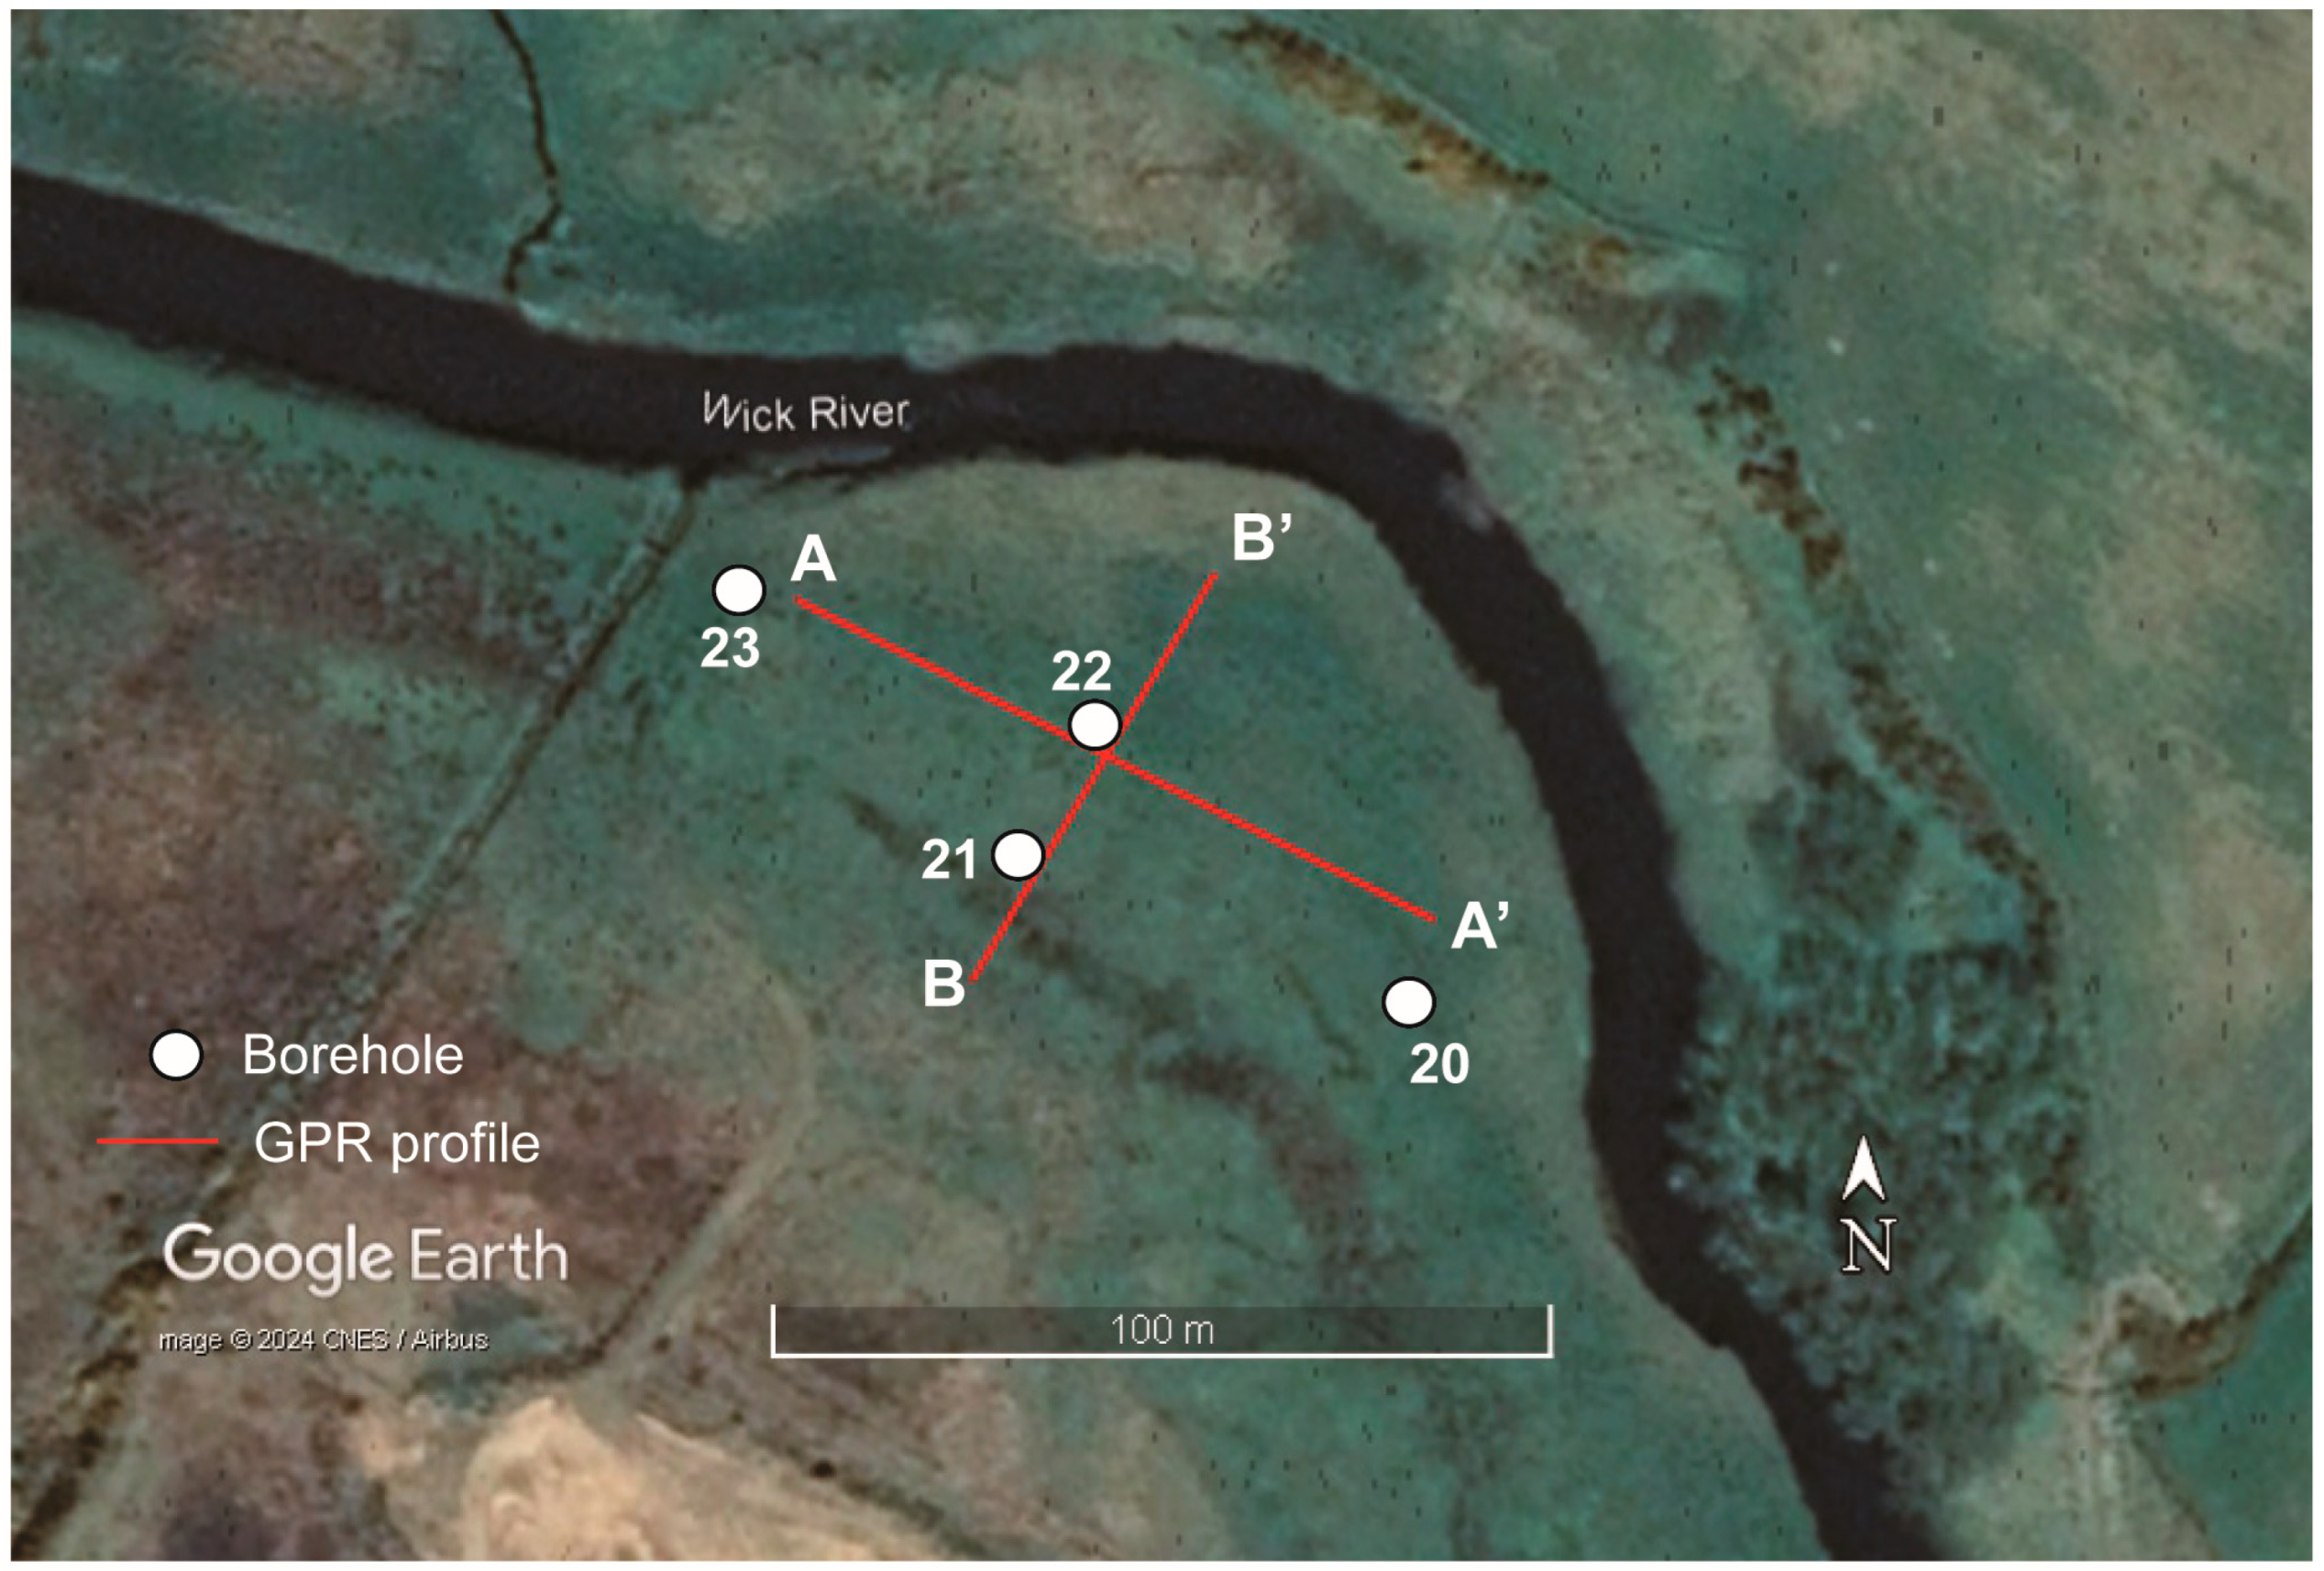
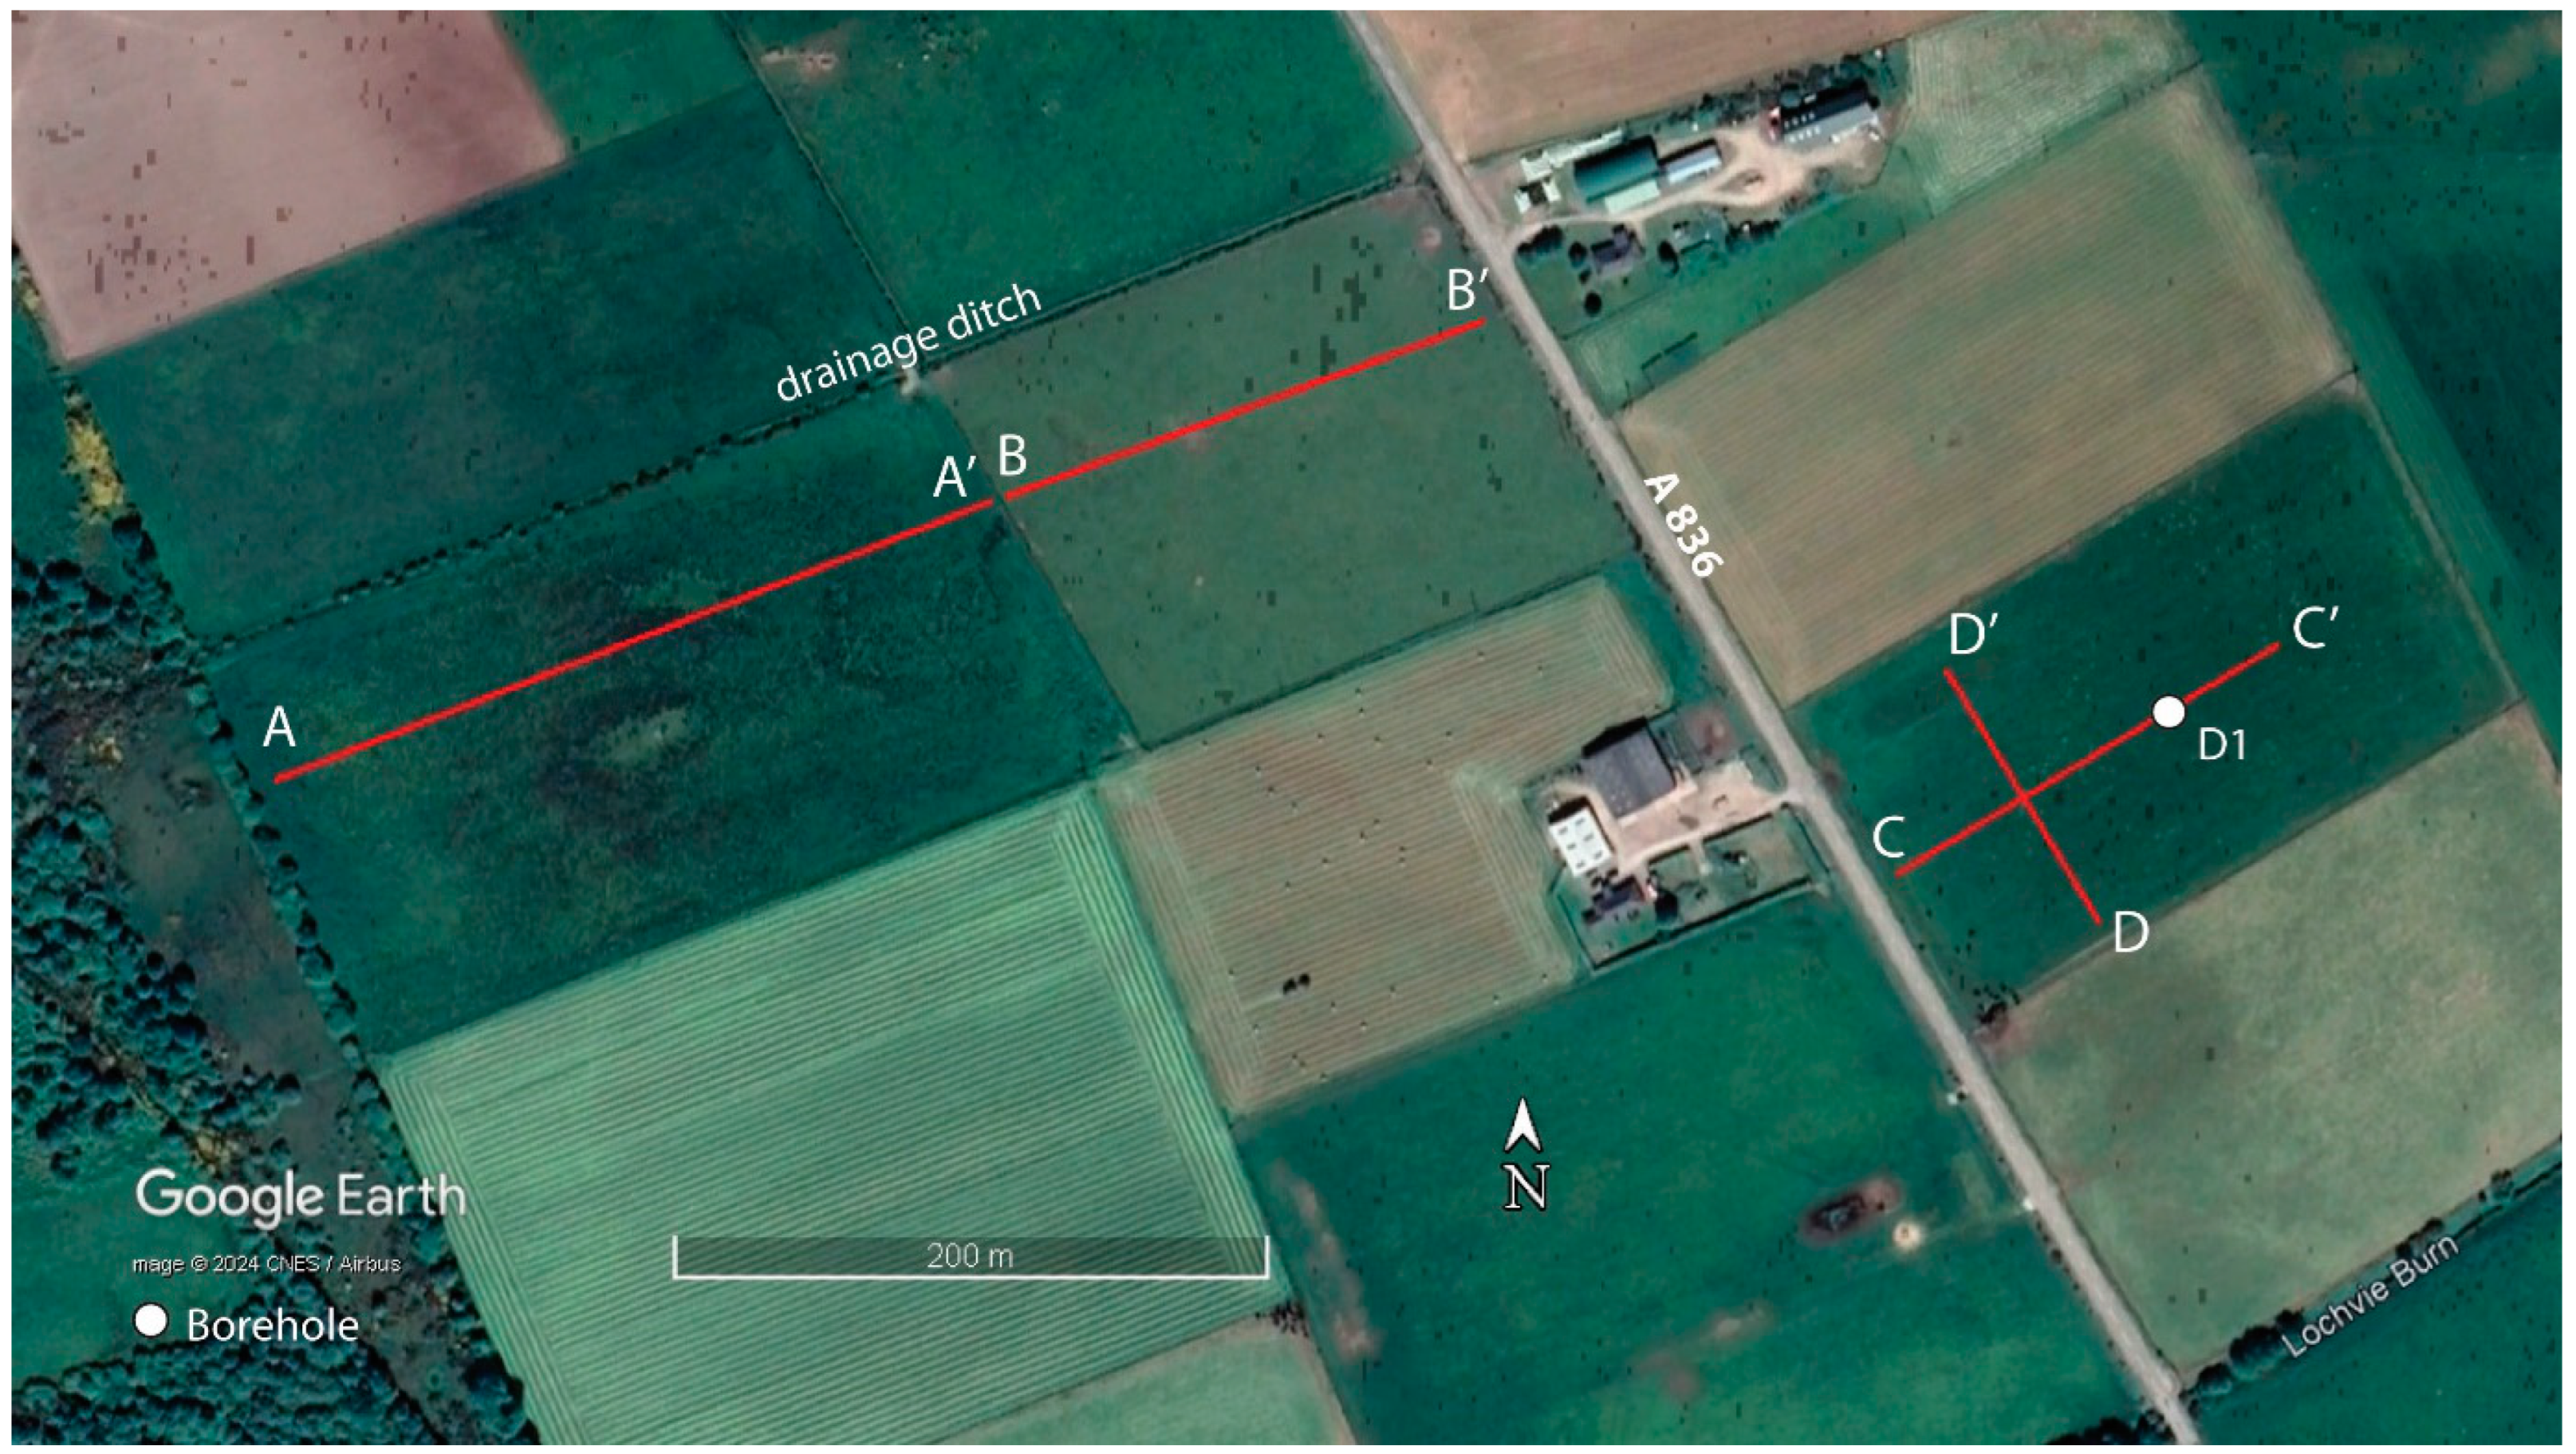
2.1. Milton Farm near Wick
2.2. Creich
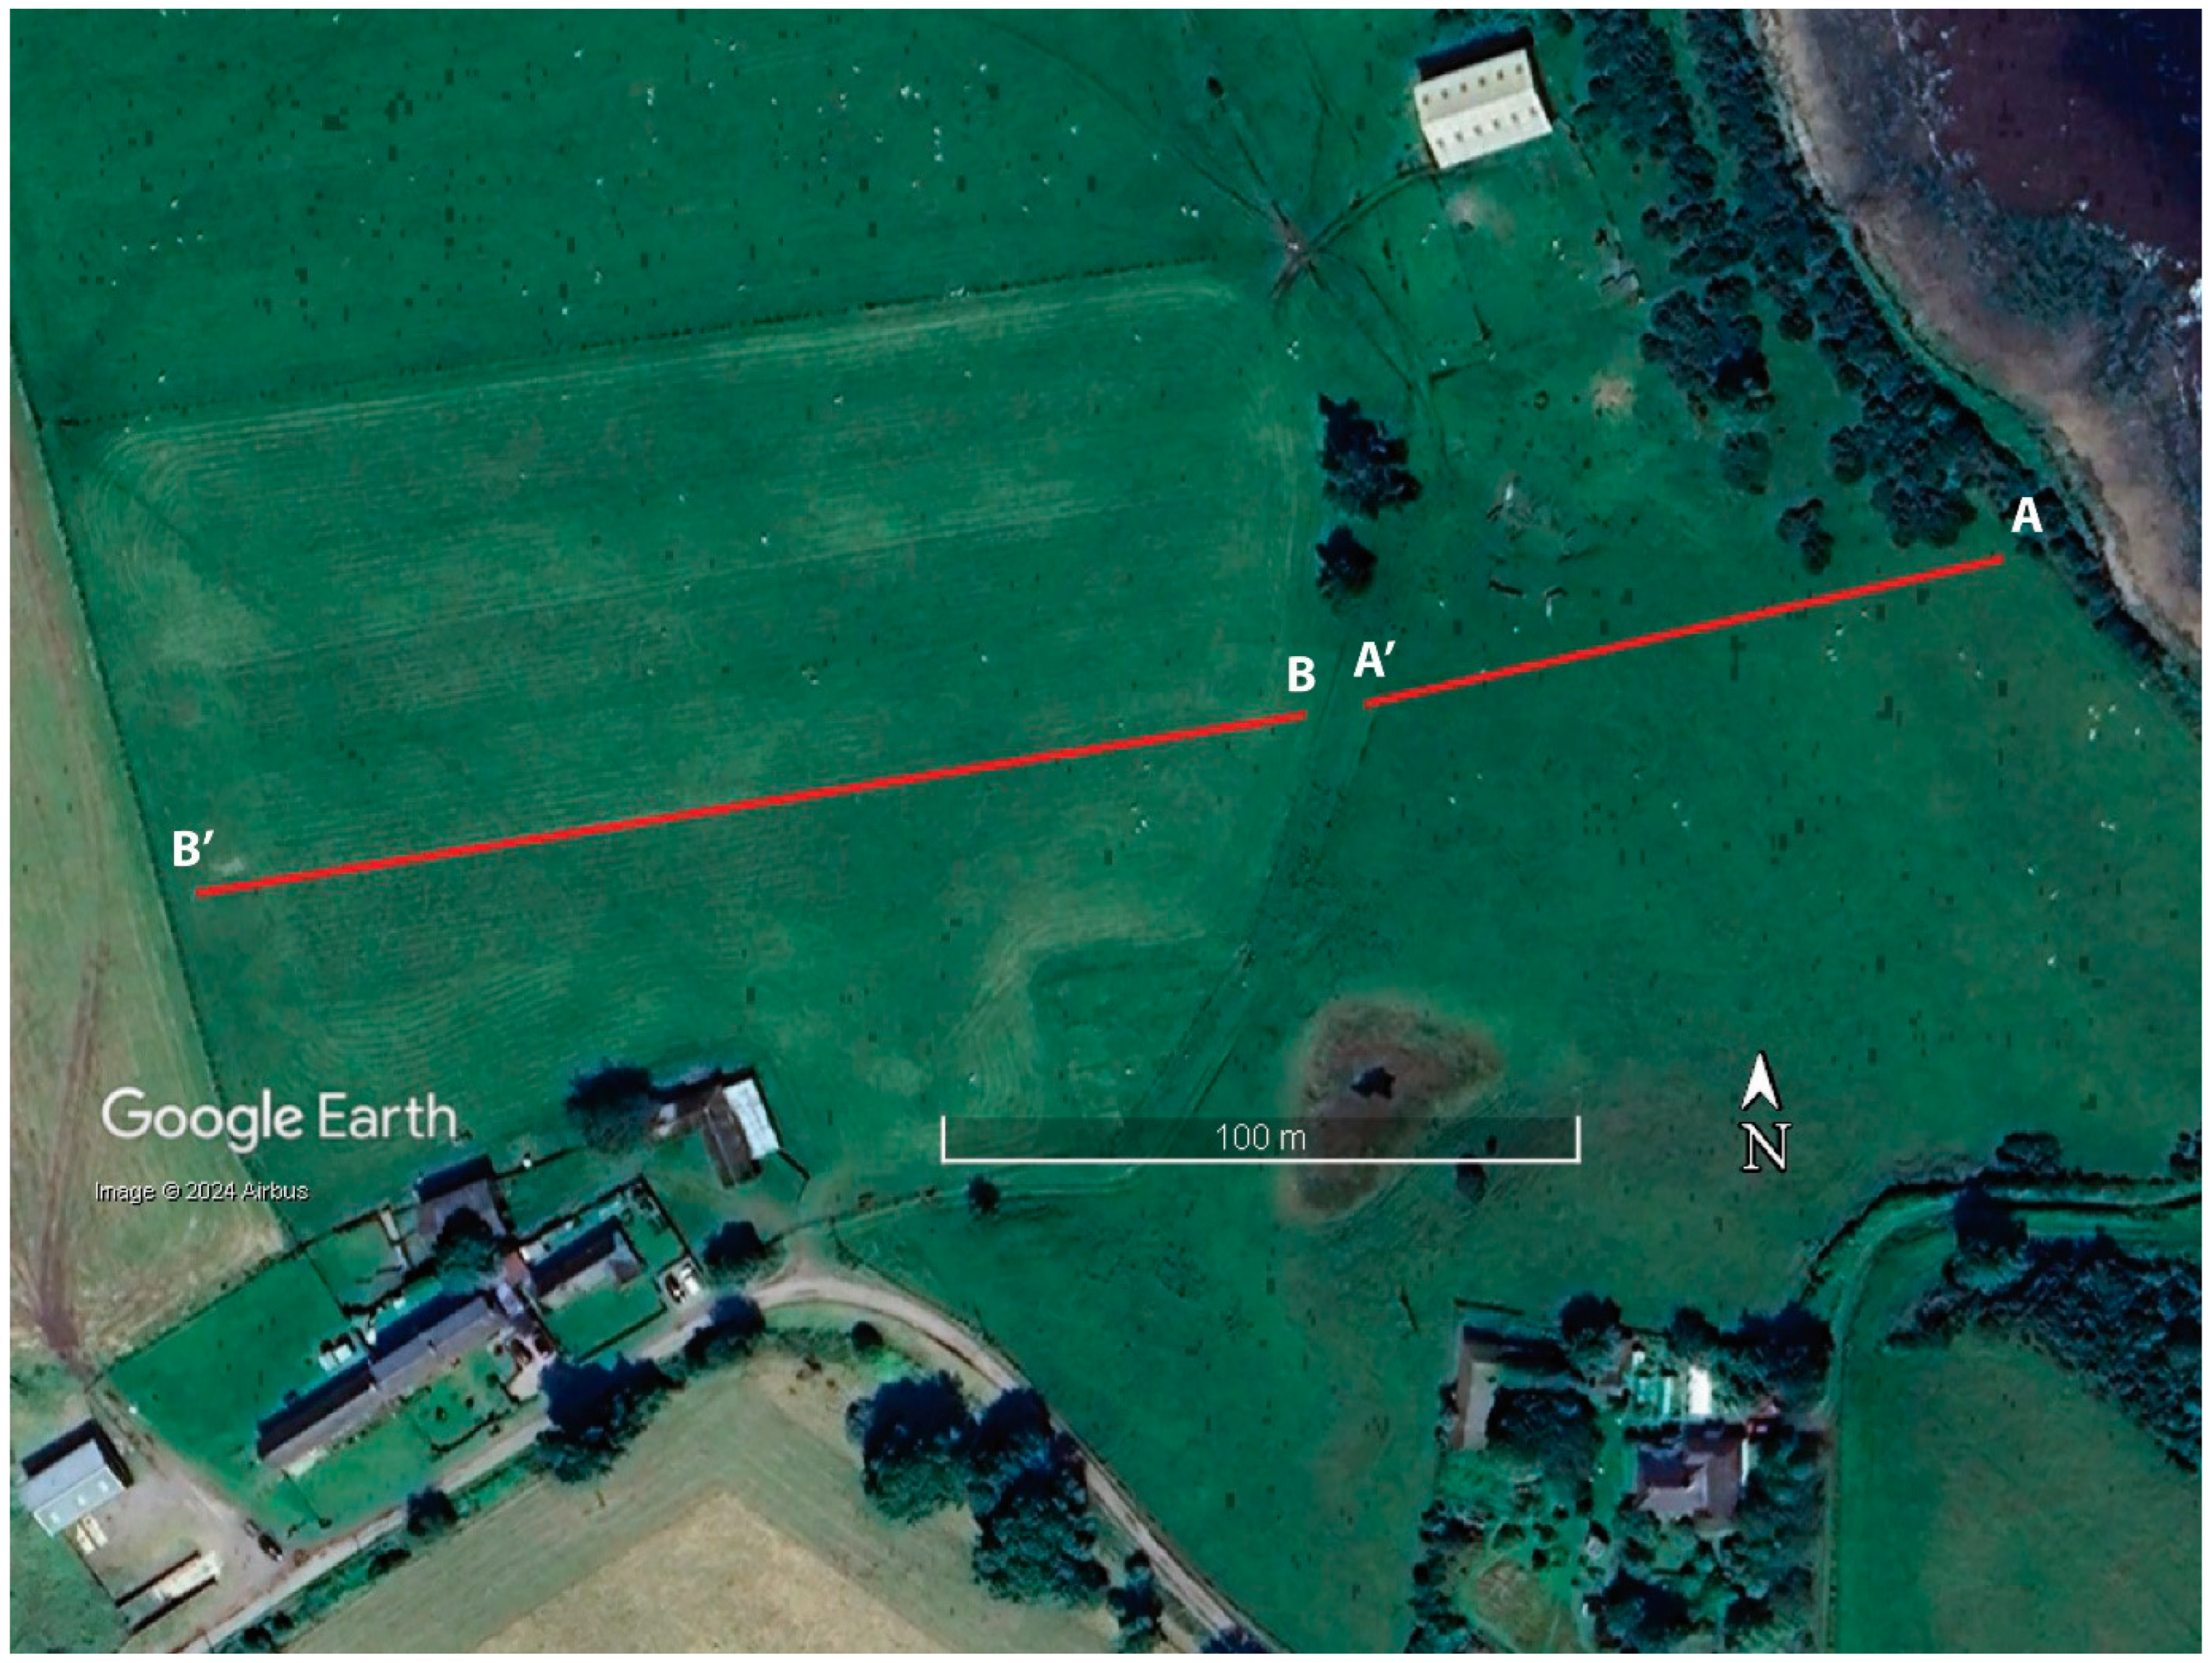
2.3. Ardmore
2.4. Dounie
2.5. Methods
3. Results
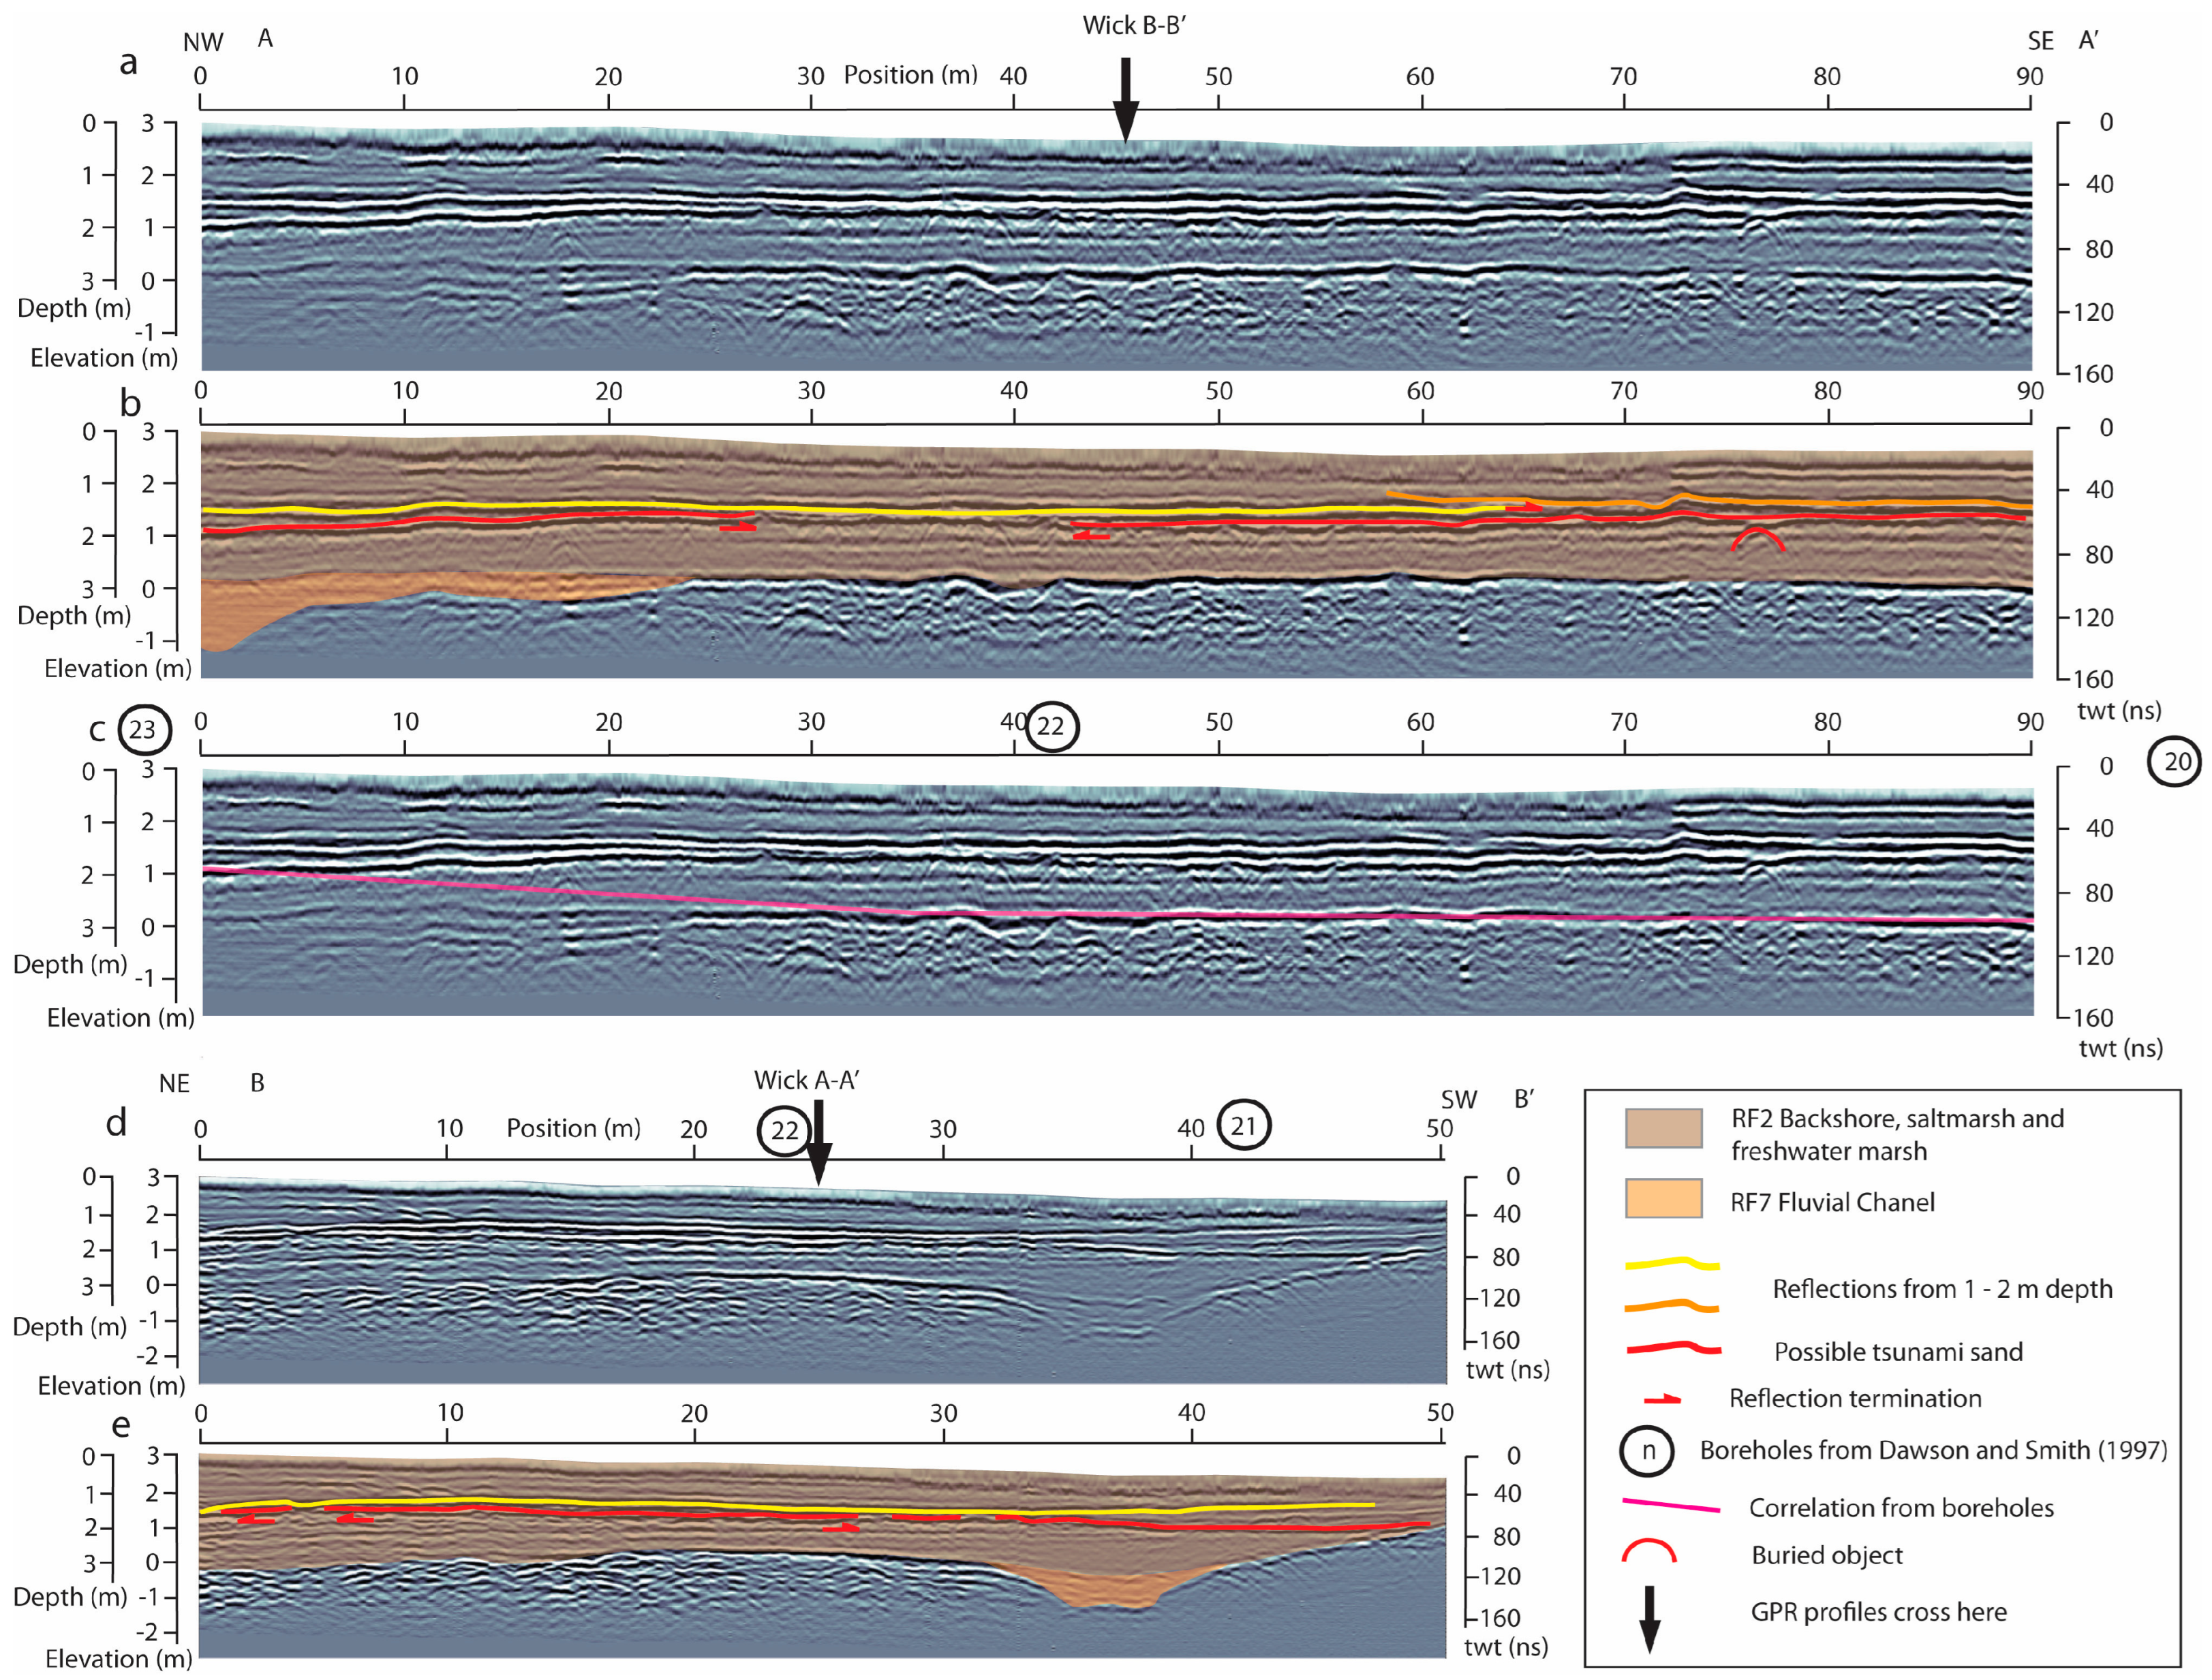
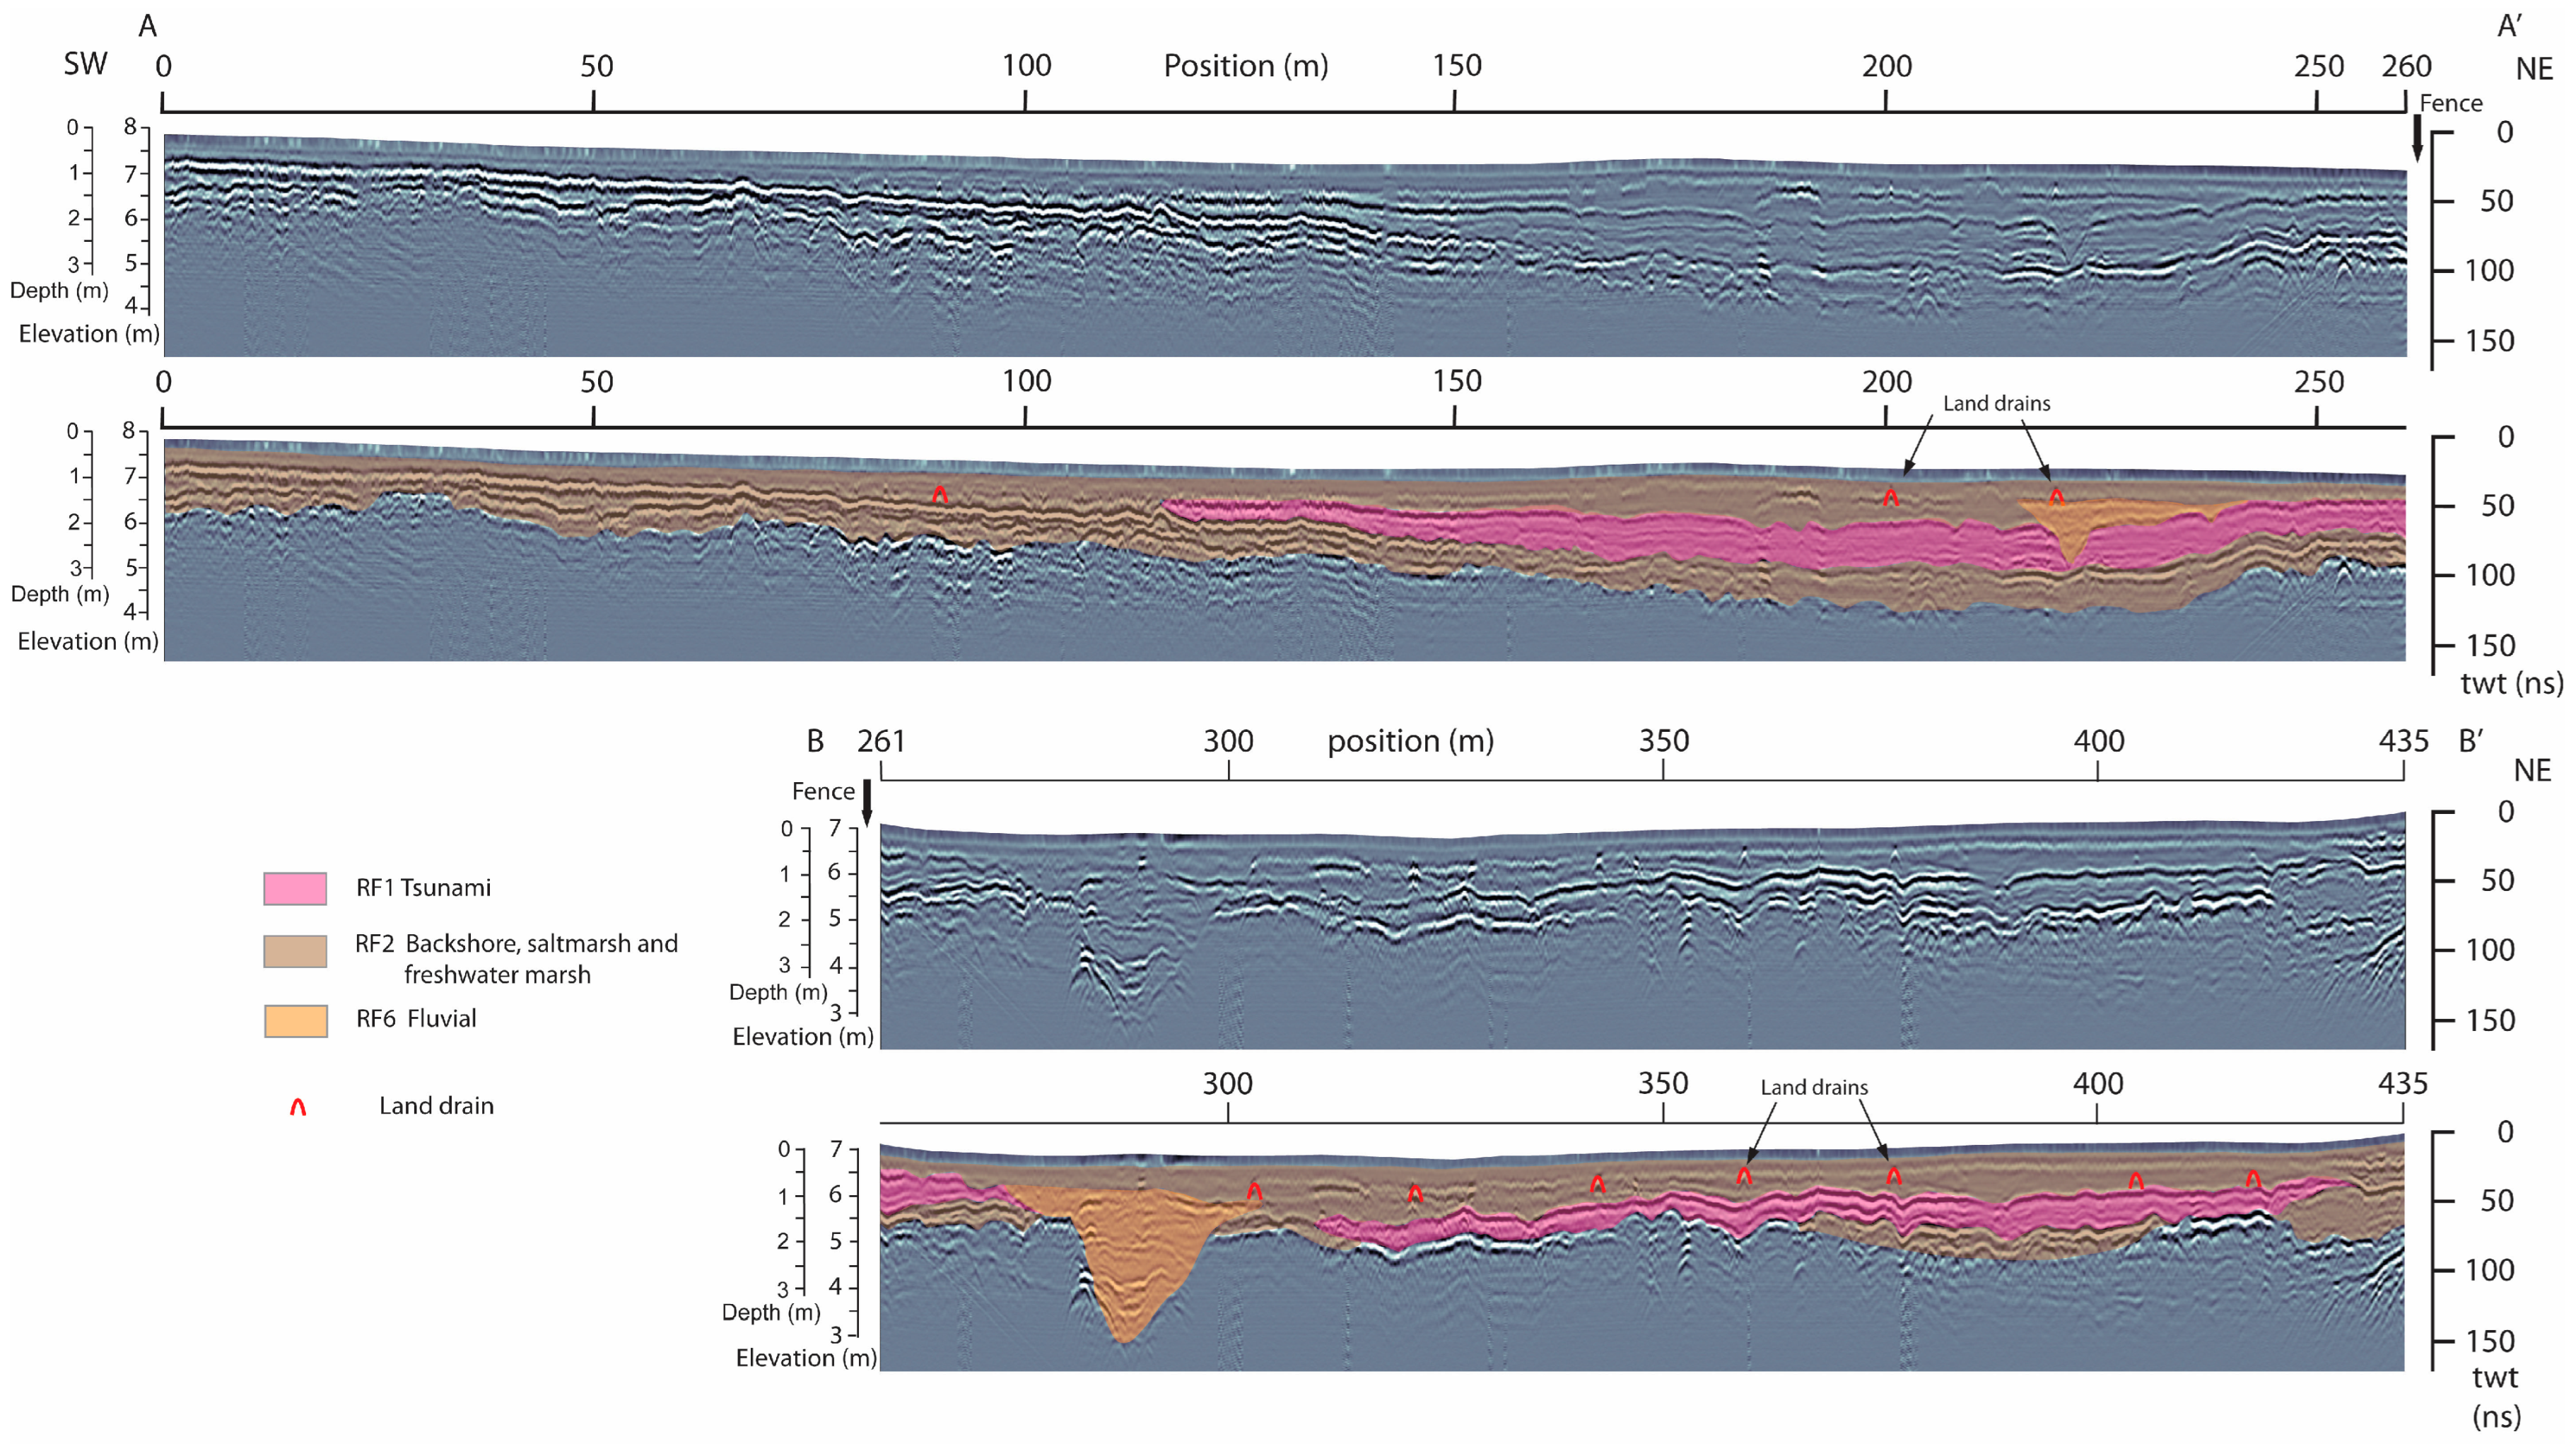
3.1. Milton Farm
3.1.1. Description
3.1.2. Interpretation
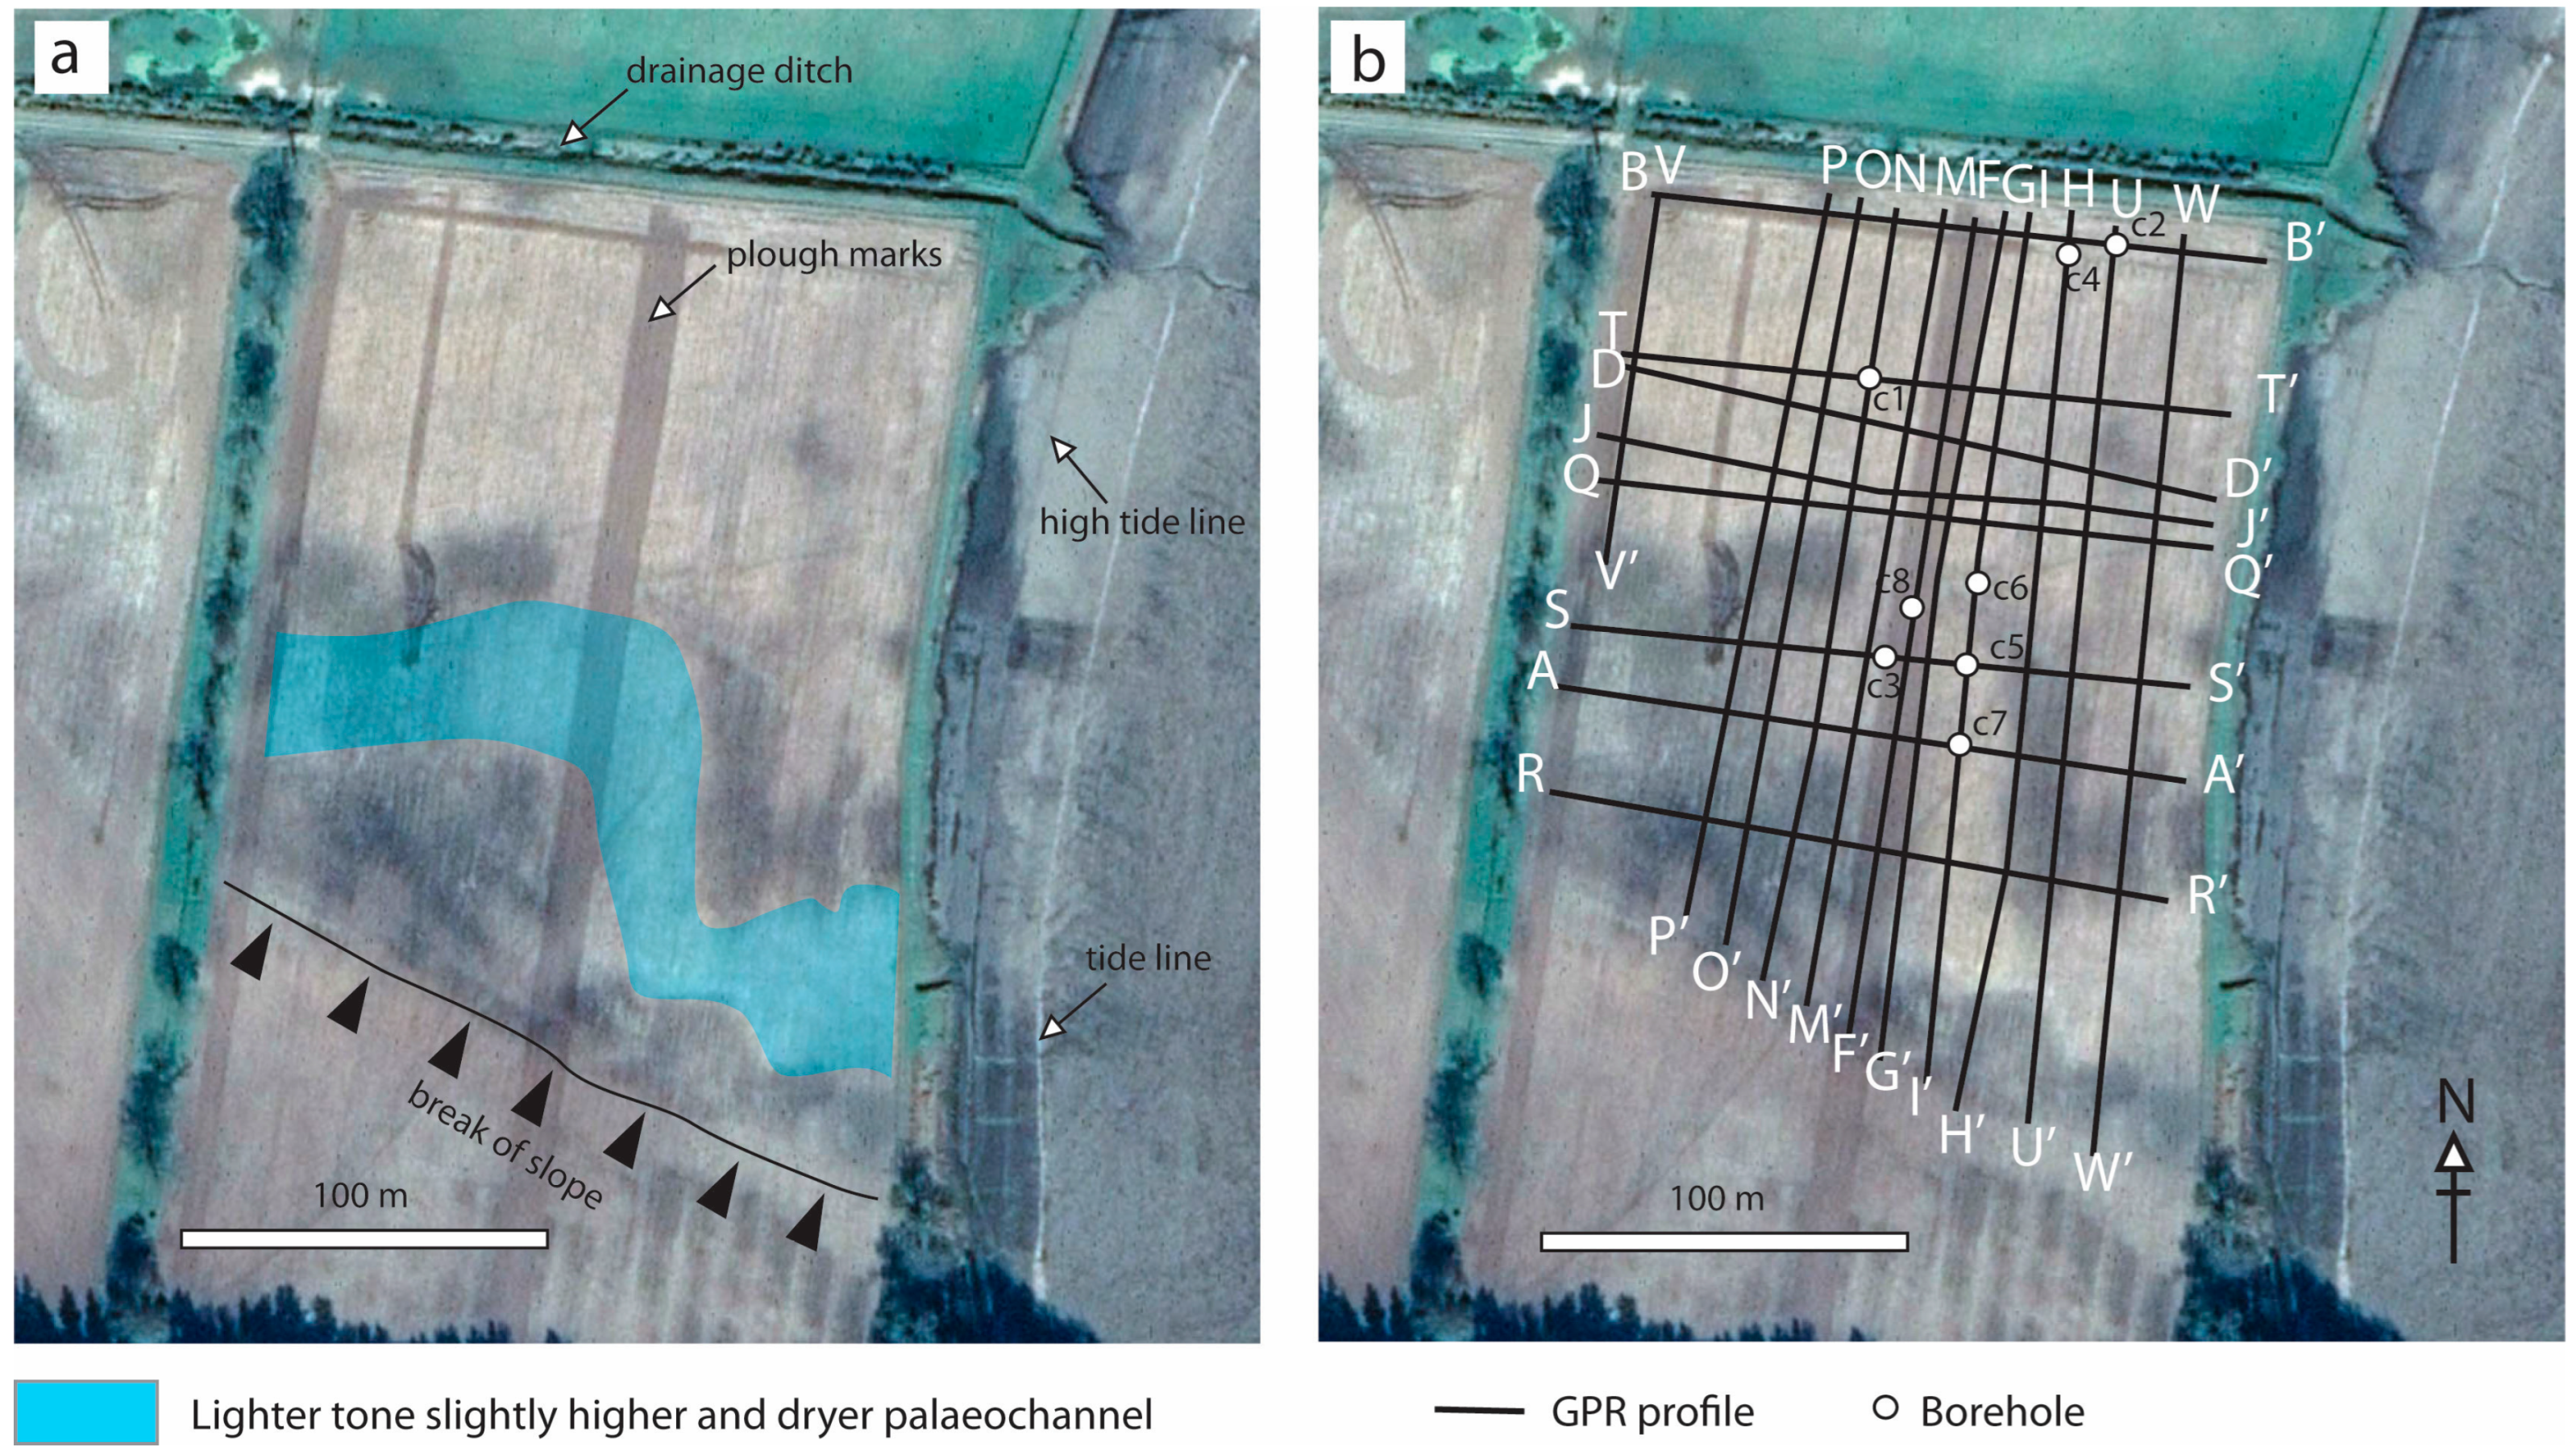
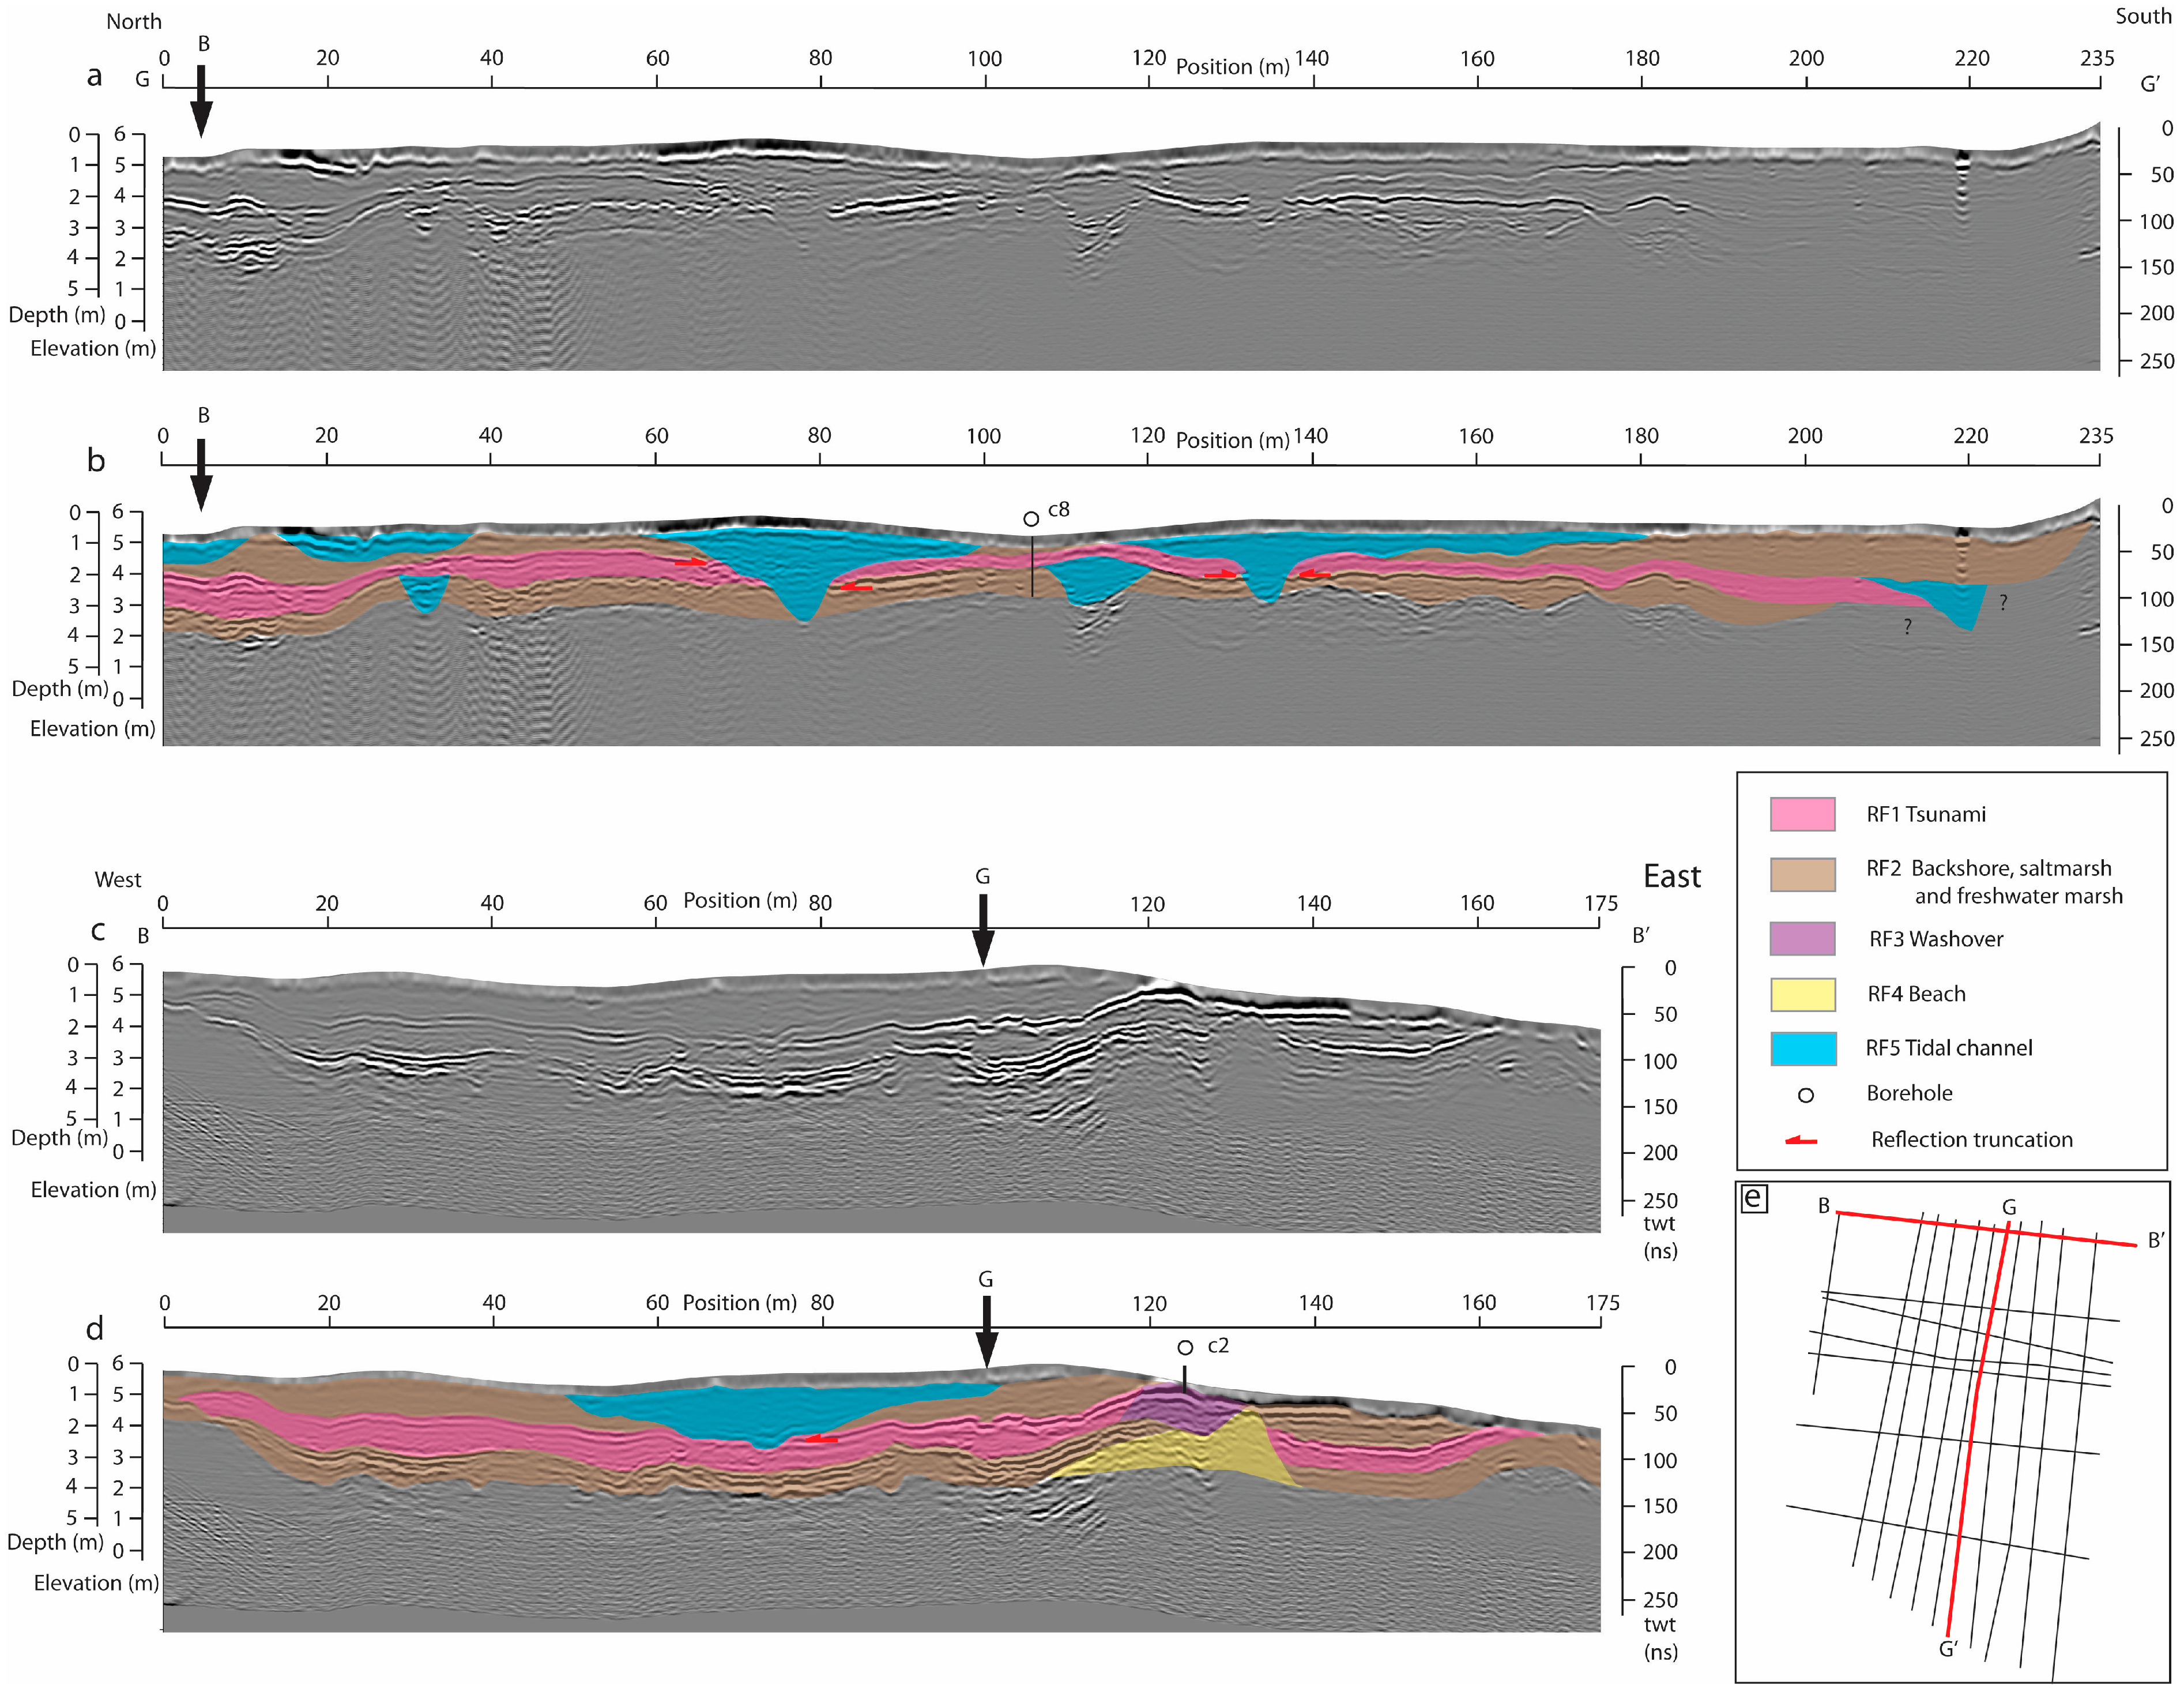
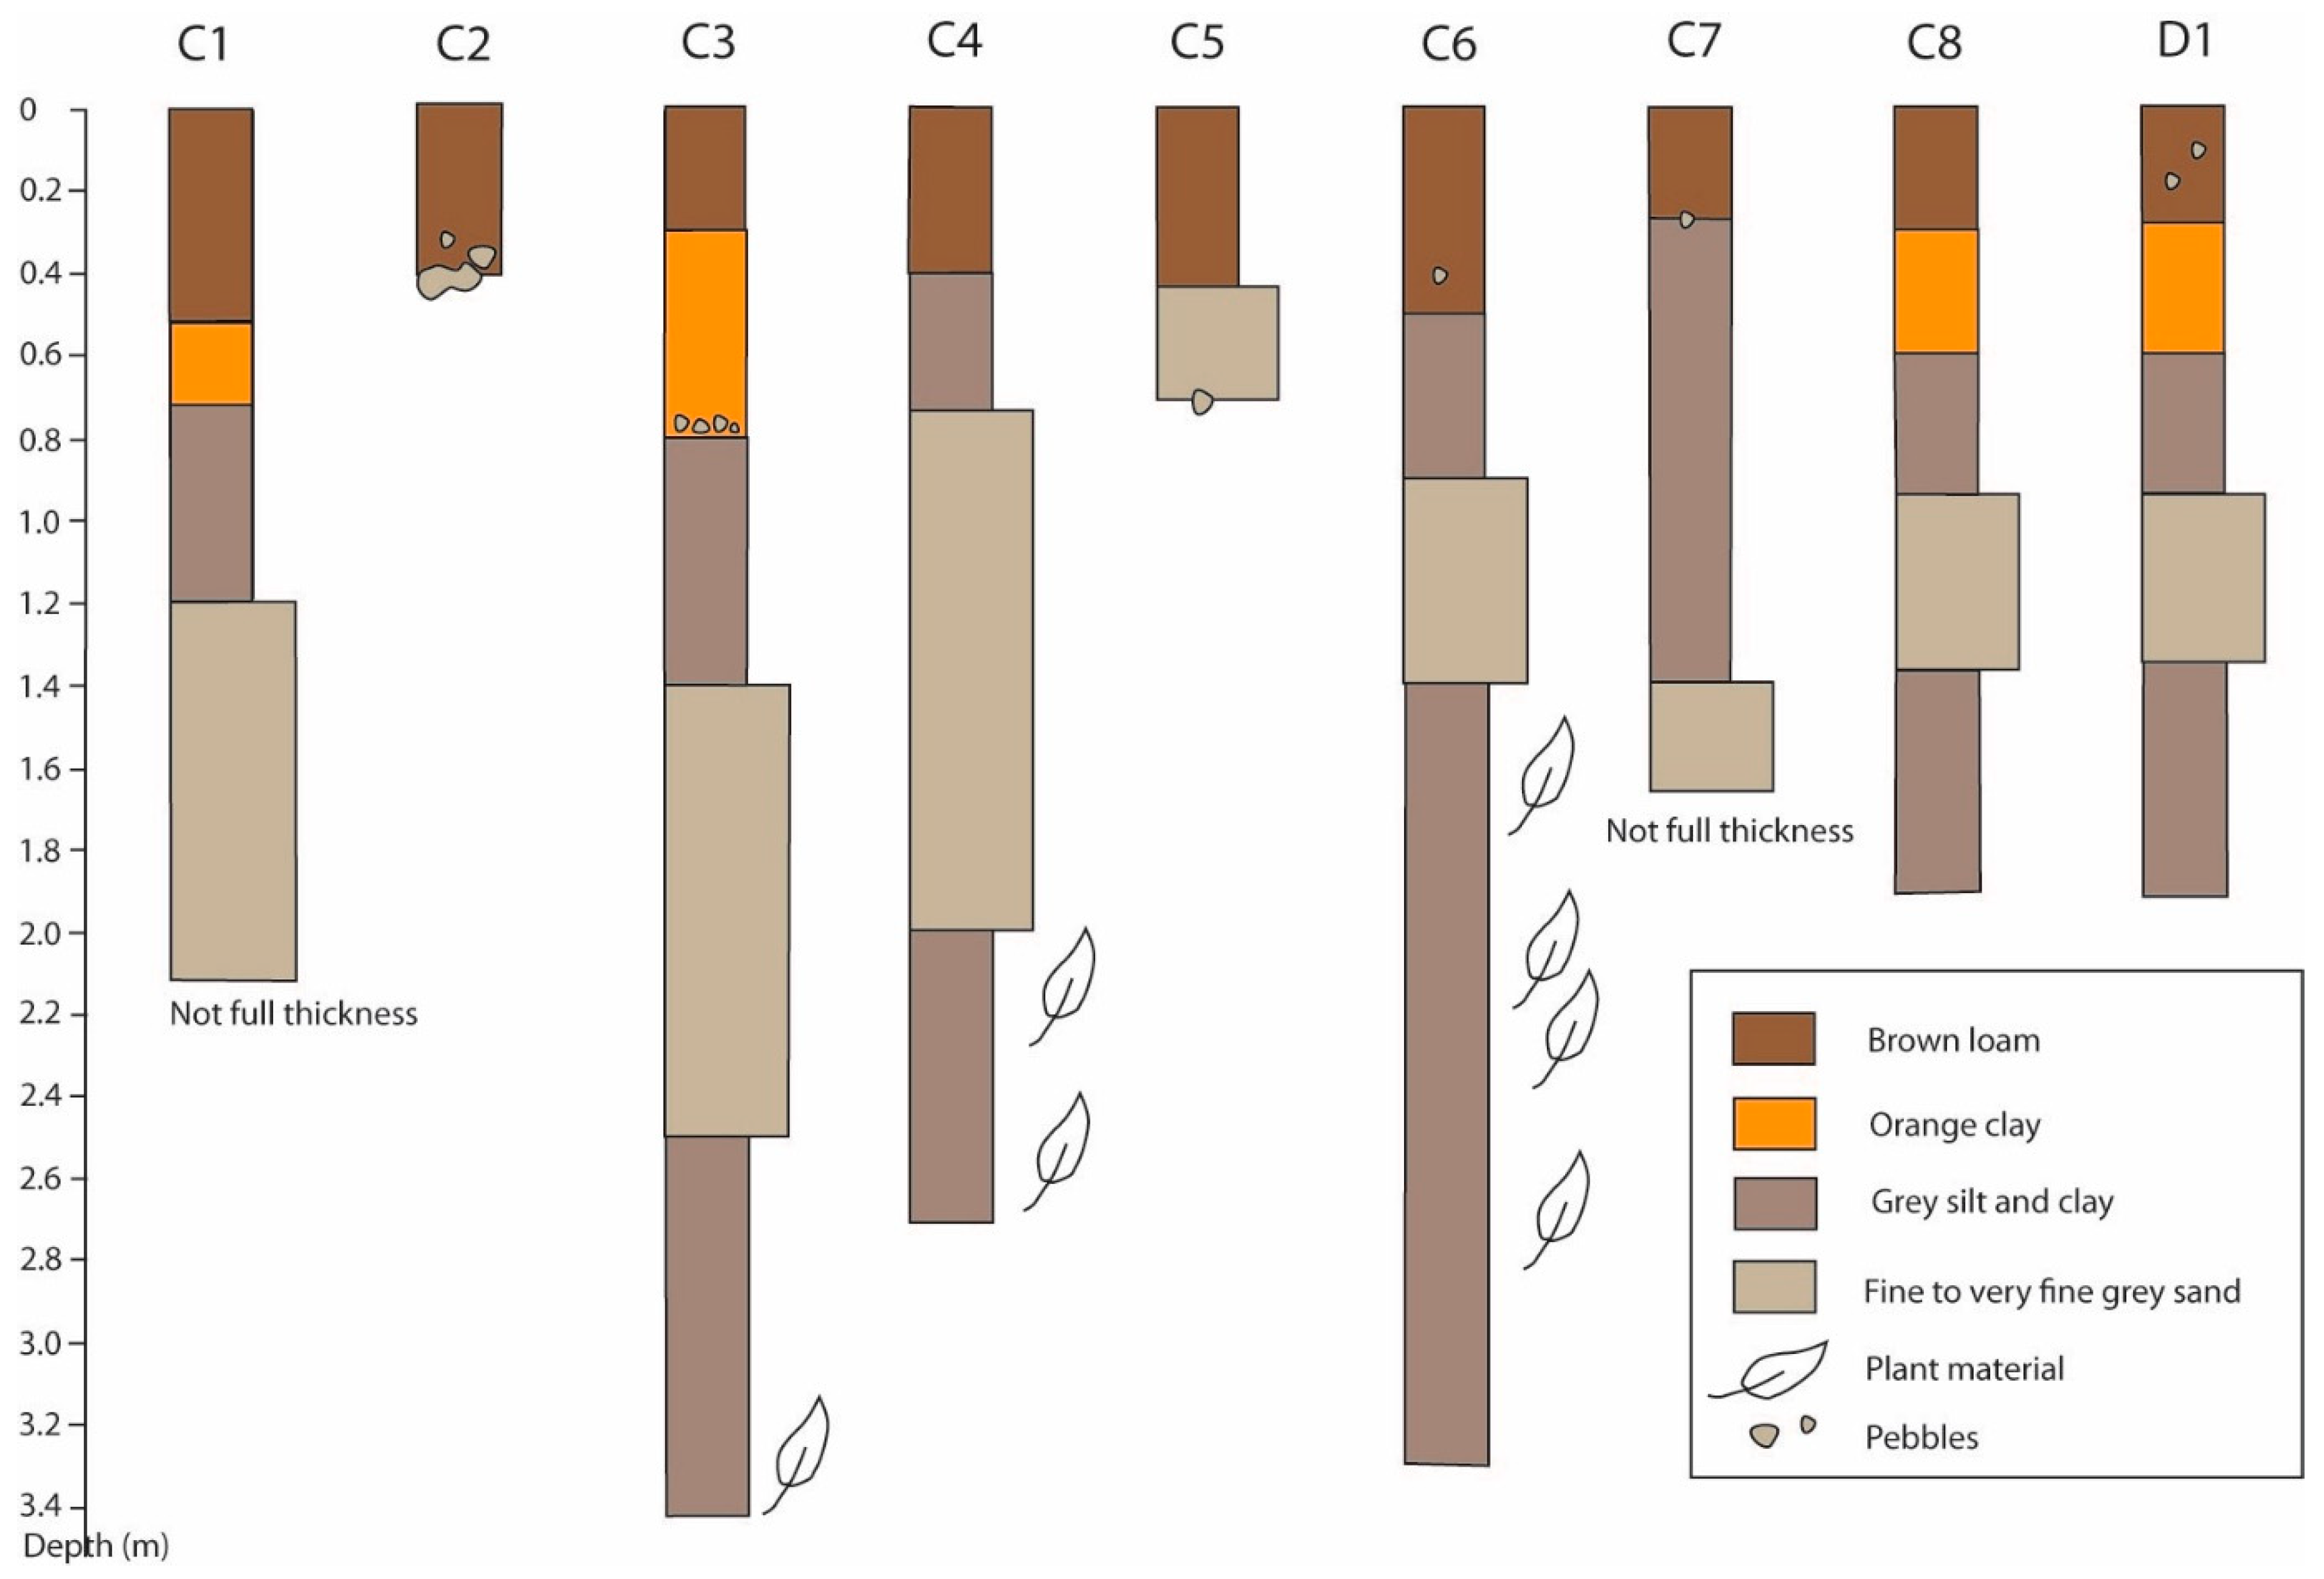
3.2. Creich
3.2.1. Description
3.2.2. Interpretation
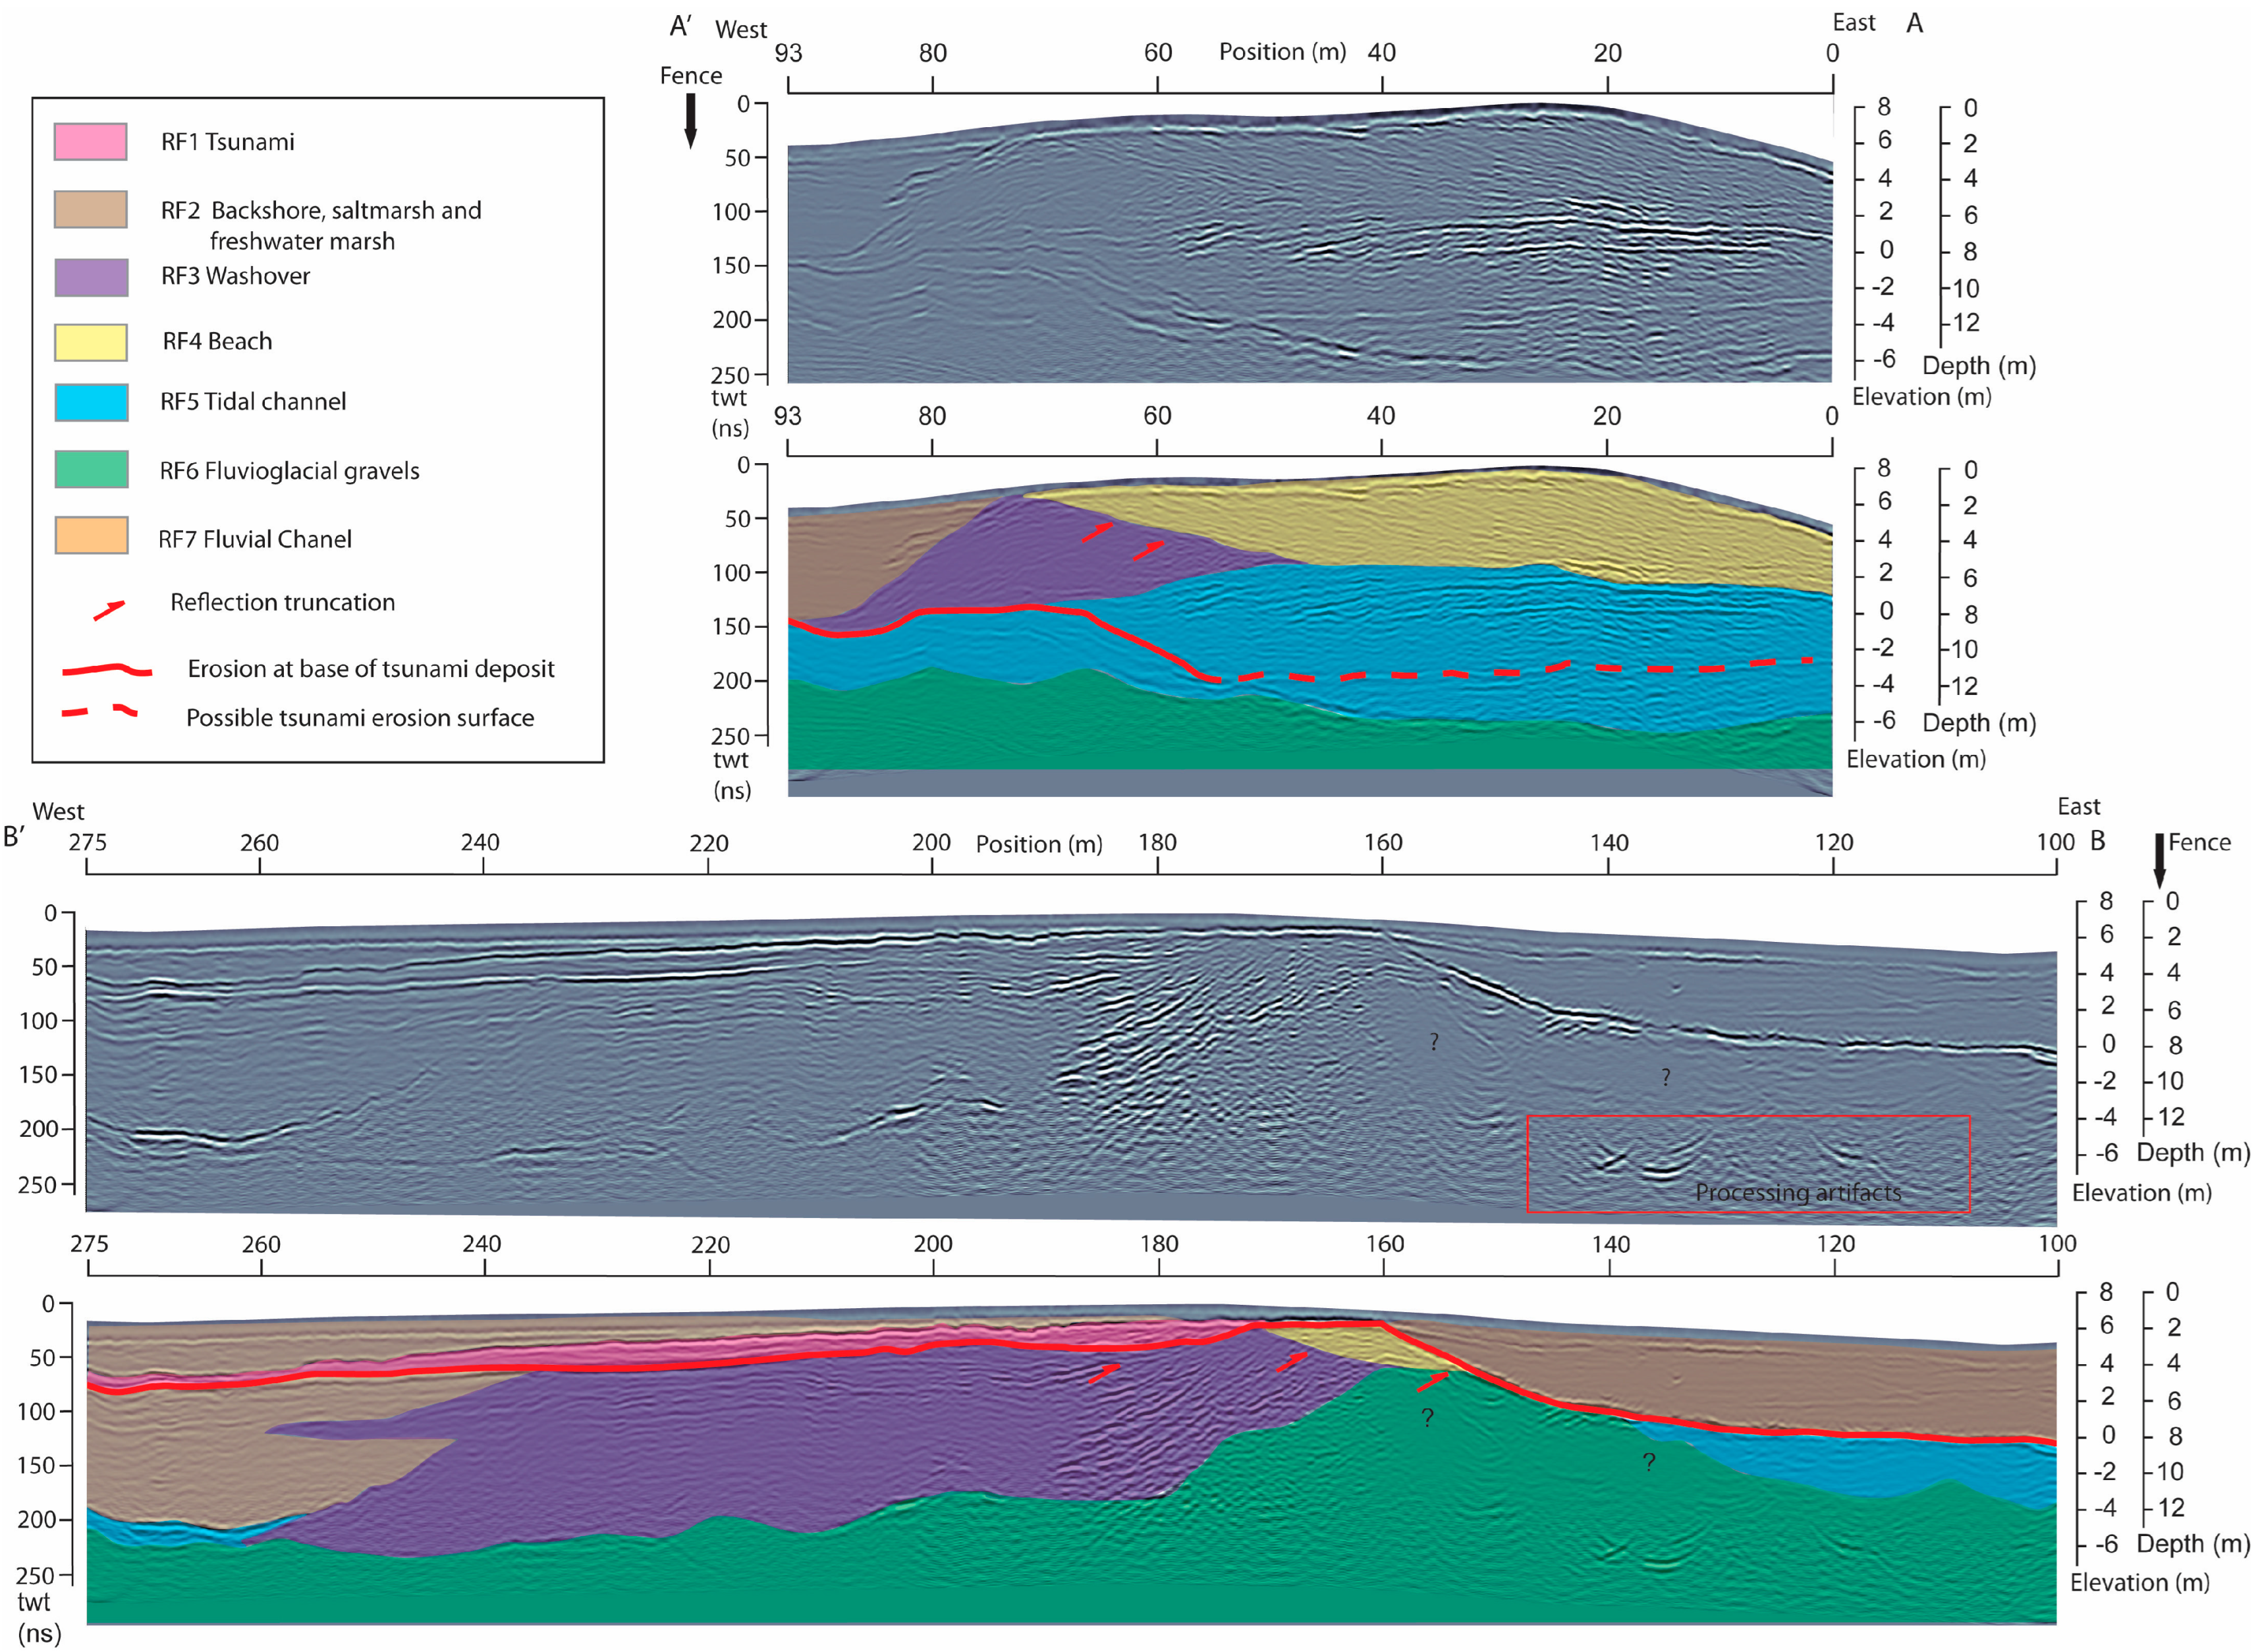
3.3. Ardmore
3.3.1. Description
3.3.2. Interpretation
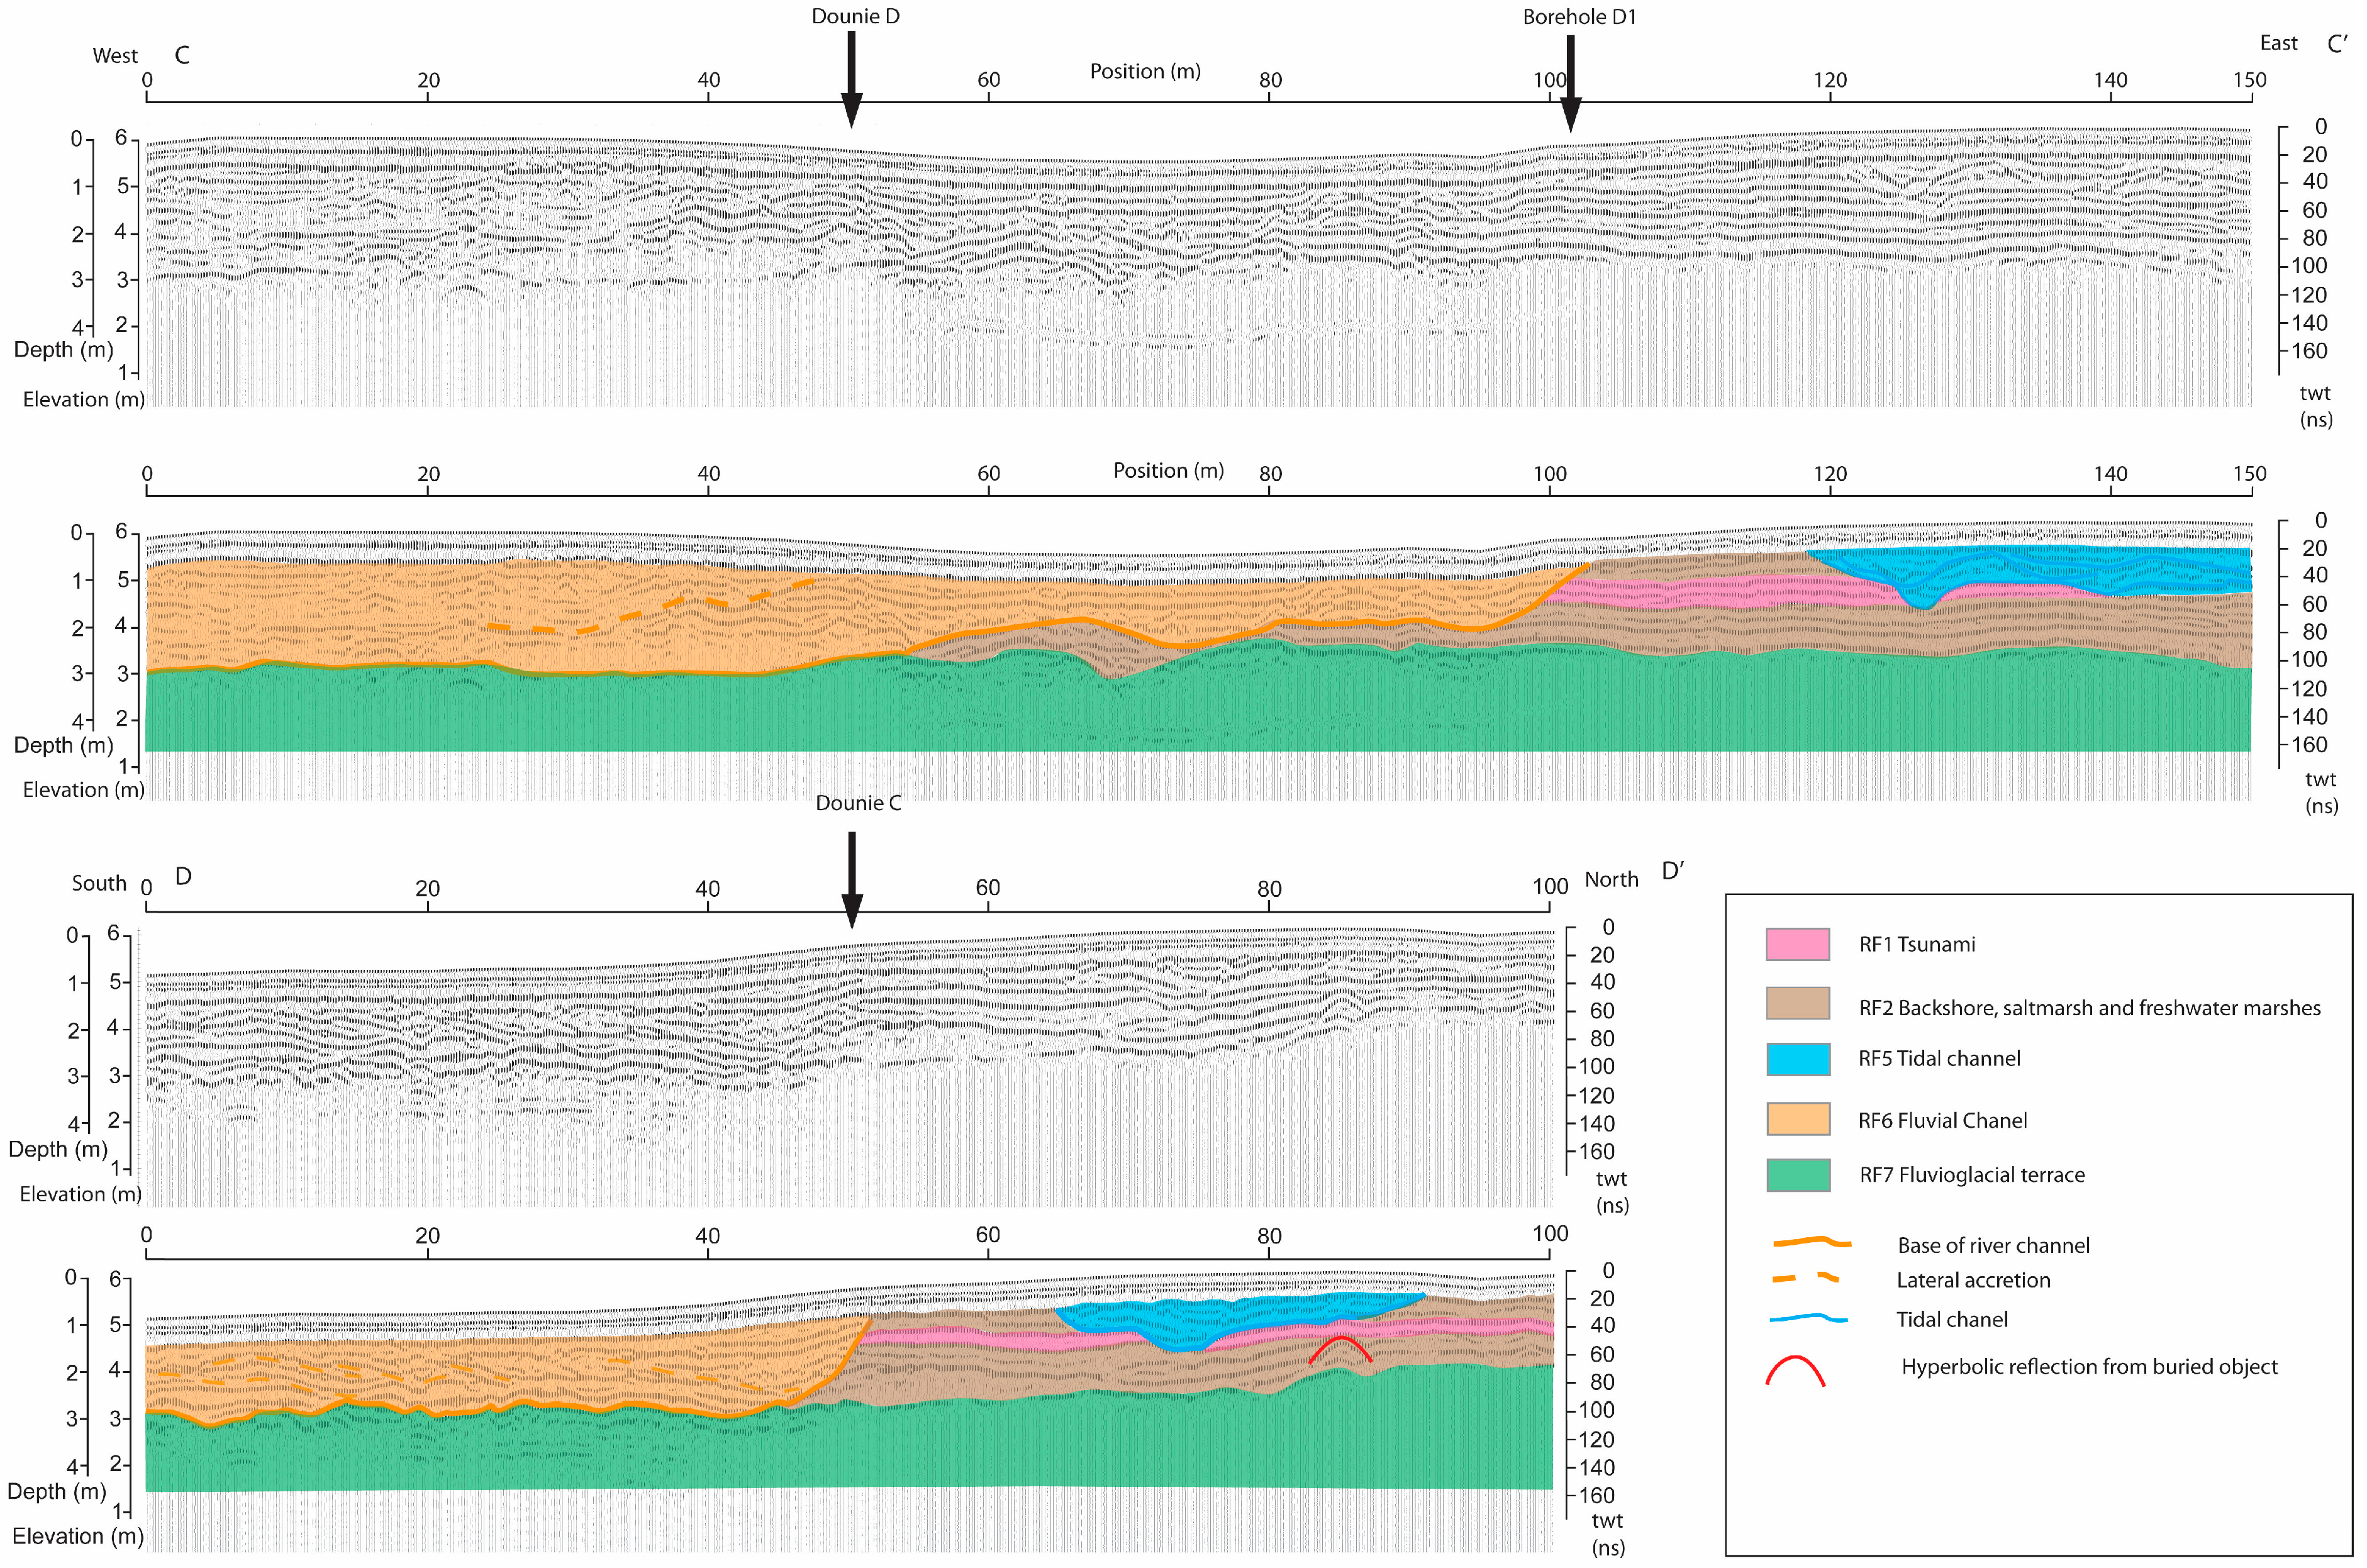
3.4. Dounie
3.4.1. Description
3.4.2. Interpretation
4. Discussion
4.1. Sediment Supply
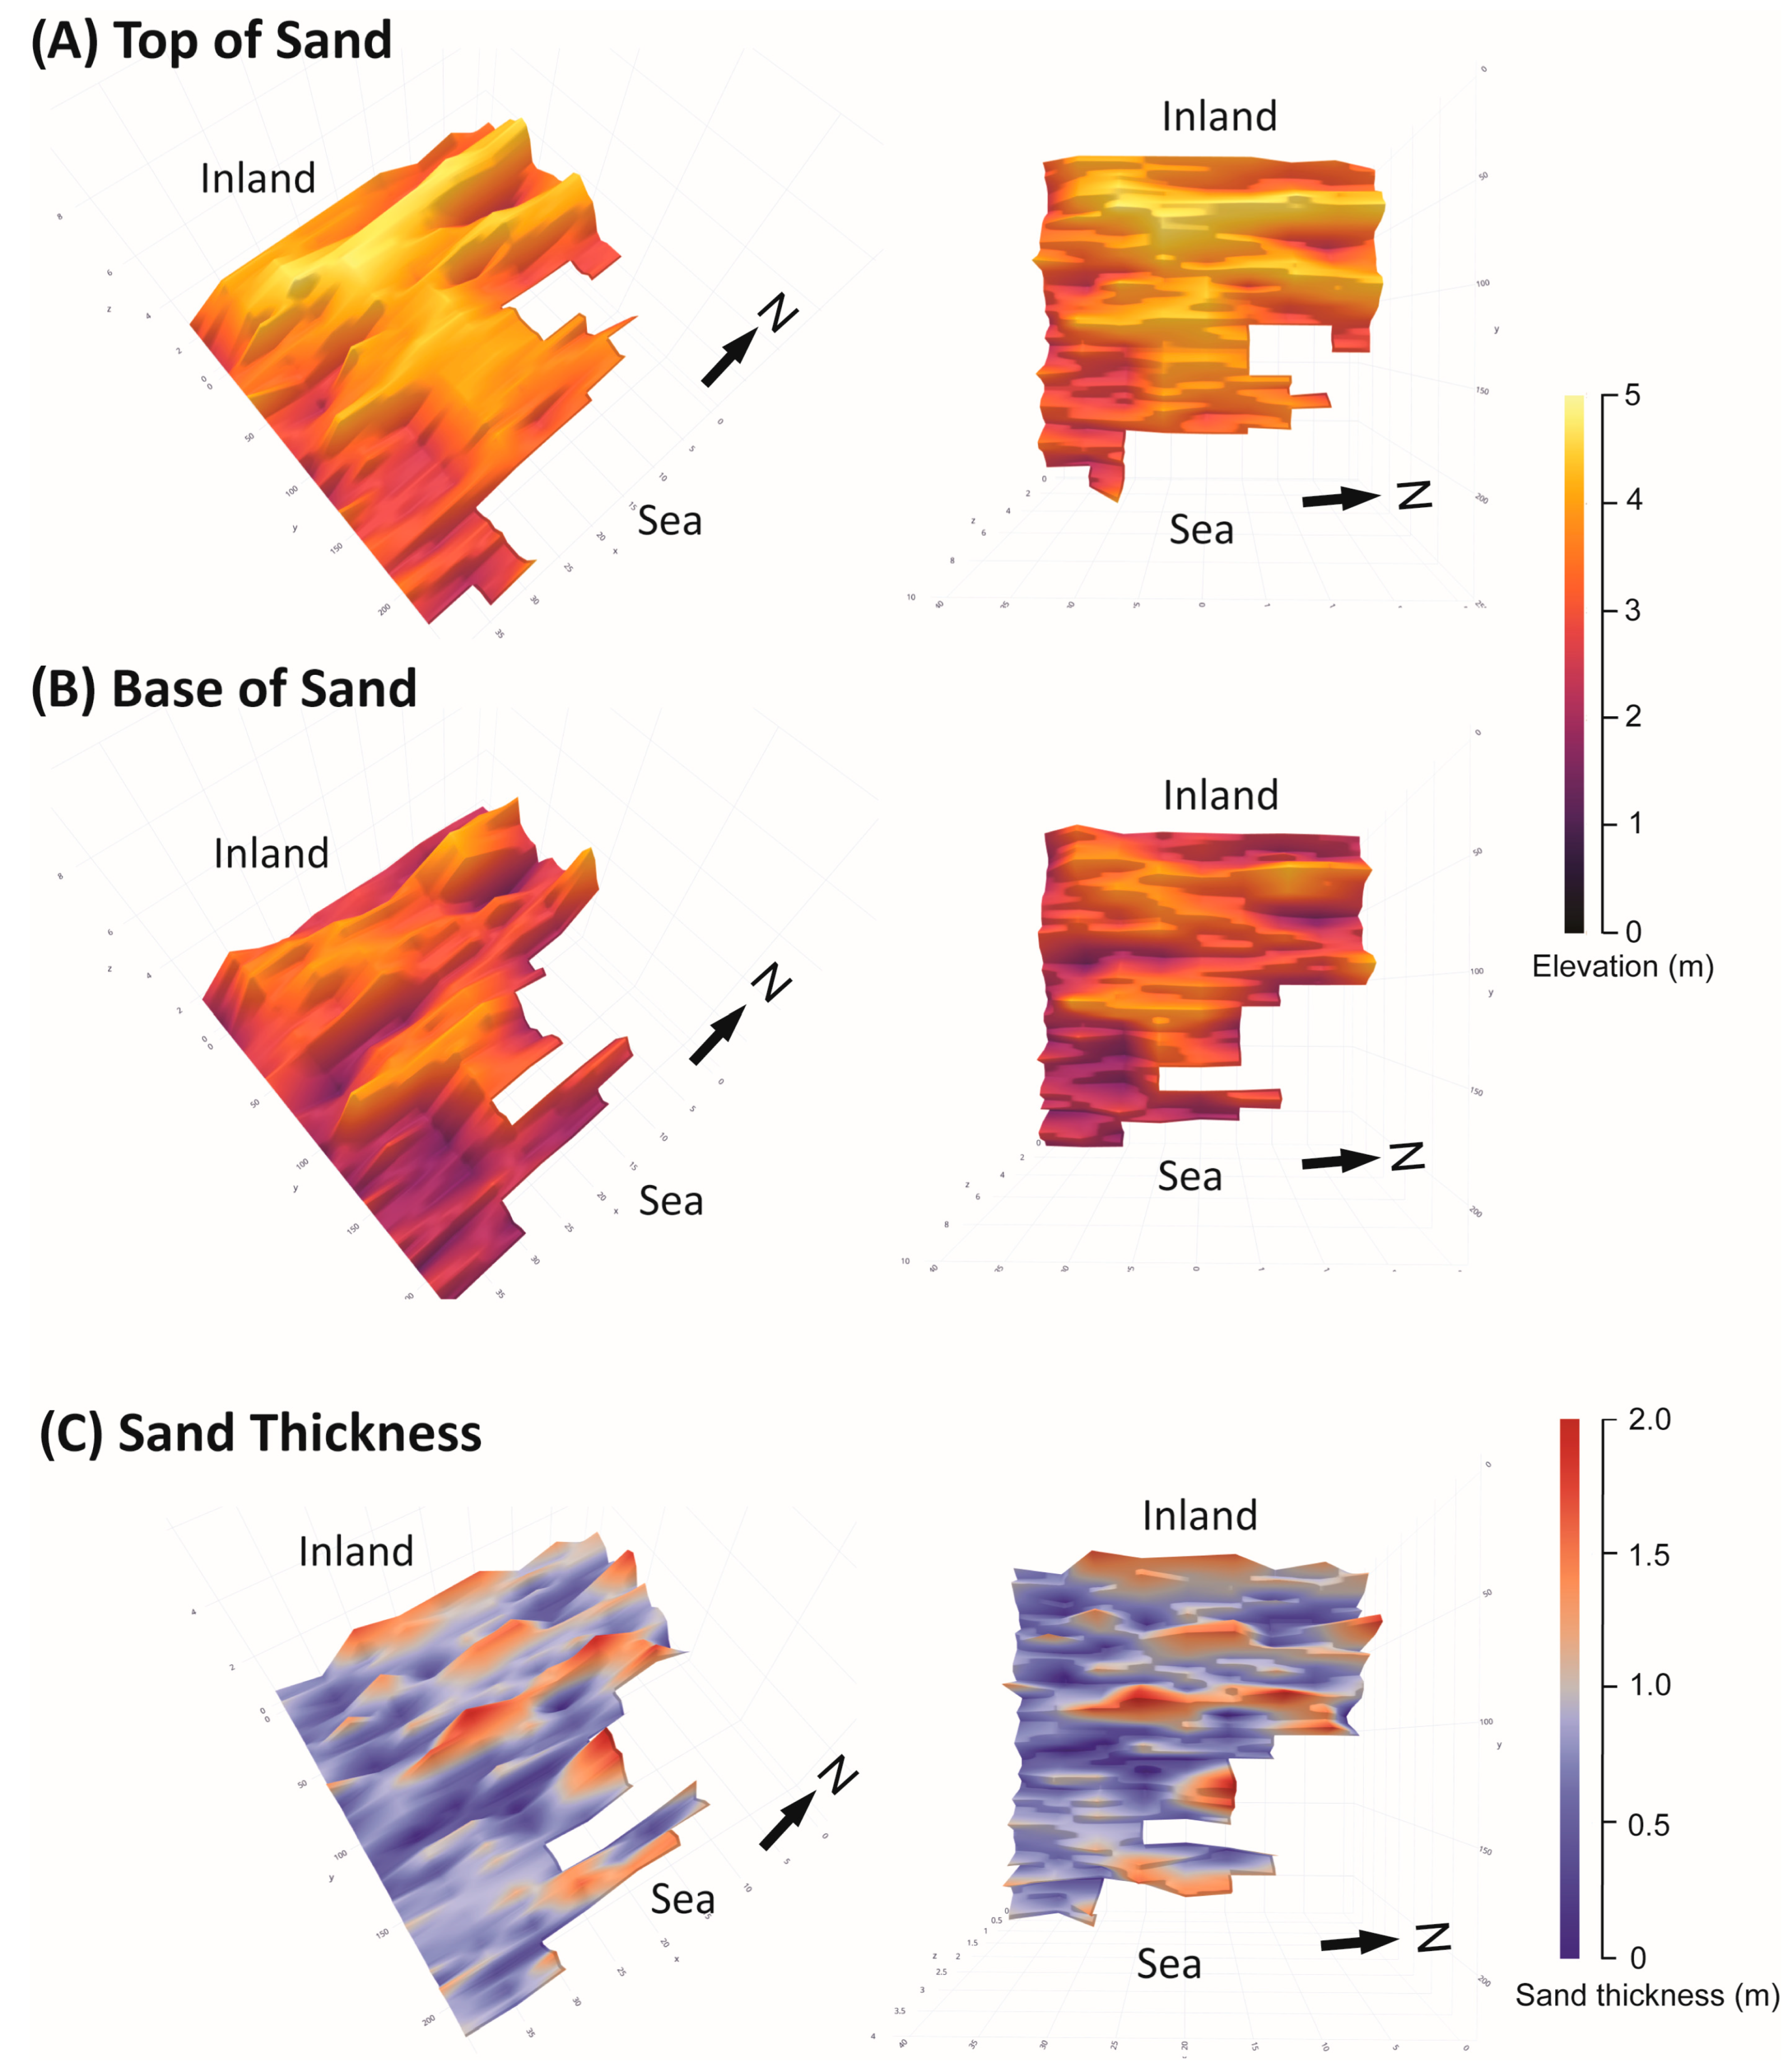
4.2. Thickness Changes at Creich
4.3. Sea-Level and Geomorphological Changes
5. Conclusions
Author Contributions
Funding
Data Availability Statement
Acknowledgments
Conflicts of Interest
References
- ten Brink, U.S.; Chaytor, J.D.; Geist, E.L.; Brothers, D.S.; Andrews, B.D. Assessment of tsunami hazard to the U.S. Atlantic Margin. Mar. Geol. 2014, 353, 31–54. [Google Scholar] [CrossRef]
- Smith, D.E.; Shi, S.; Cullingford, R.A.; Dawson, A.G.; Dawson, S.; Firth, C.R.; Foster, I.D.L.; Fretwell, P.T.; Haggart, B.A.; Holloway, L.K.; et al. The Holocene Storegga Slide tsunami in the United Kingdom. Quat. Sci. Rev. 2004, 23, 2291–2321. [Google Scholar] [CrossRef]
- Karstens, J.; Haflidason, H.; Berndt, C.; Crutchley, G.J. Revised Storegga Slide reconstruction reveals two major submarine landslides 12,000 years apart. Commun. Earth Environ. 2023, 4, 55. [Google Scholar] [CrossRef]
- Bondevik, S.; Stormo, S.K.; Skjerdal, G. Green mosses date the Storegga tsunami to the chilliest decades of the 8.2 ka cold event. Quat. Sci. Rev. 2012, 45, 1–6. [Google Scholar] [CrossRef]
- Haflidason, H.; lien, R.; Sejrup, H.P.; Forsberg, C.F.; Bryn, P. The dating and morphometry of the Storegga slide. Mar. Pet. Geol. 2005, 22, 123–136. [Google Scholar] [CrossRef]
- Bondevik, S.; Mangerud, J.; Dawson, S.; Dawson, A.; Lohne, O. Evidence for three North Sea tsunamis at the Shetland Islands between 8000 and 1500 years ago. Quat. Sci. Rev. 2005, 24, 1757–1775. [Google Scholar] [CrossRef]
- Bateman, M.D.; Kinnaird, T.C.; Hill, J.; Ashurst, R.A.; Mohan, J.; Bateman, R.B.I.; Robinson, R. Detailing the impact of the Storegga tsunami at Montrose, Scotland. Boreas 2023, 50, 1059–1078. [Google Scholar] [CrossRef]
- Bondevik, S.; Svendsen, J.I.; Mangerund, J. Tsunami sedimentary facies deposited by the Storegga tsunami in shallow marine basins and coastal lakes, western Norway. Sedimentology 1997, 44, 1115–1131. [Google Scholar] [CrossRef]
- Bondevik, S.; Svendsen, J.I.; Johnson, G.; Mangerund, J.; Kaland, P.E. The Storegga tsunami along the Norwegian coast, its age and runup. Boreas 1997, 26, 29–53. [Google Scholar] [CrossRef]
- Bondevik, S.; Svendsen, J.I. Distinction between the Storegga tsunami and the Holocene marine transgression in coastal basin deposits of western Norway. J. Quat. Sci. 1998, 13, 529–537. [Google Scholar] [CrossRef]
- Dawson, S.; Smith, D.E. Holocene relative sea-level changes on the margin of a glacio-isostatically uplifted area: An example from northern Caithness, Scotland. Holocene 1997, 7, 59–77. [Google Scholar] [CrossRef]
- Dawson, S.; Smith, D.E. Sedimentology of Middle Holocene tsunami facies in northern Sutherland, Scotland, UK. Mar. Geol. 2000, 170, 69–79. [Google Scholar] [CrossRef]
- Long, D.; Barlow, N.L.M.; Dawson, S.; Hill, J.; Innes, J.B.; Kelham, C.; Milne, F.D.; Dawson, A. Lateglacial and Holocene relative sea-level changes and first evidence for the Storegga tsunami in Sutherland, Scotland. J. Quat. Sci. 2016, 31, 239–255. [Google Scholar] [CrossRef]
- Grauert, M.; Bjorck, S.; Bondevik, S. Storegga tsunami deposits in a coastal lake on Suduroy, the Faroe Islands. Boreas 2001, 30, 300–9483. [Google Scholar] [CrossRef]
- Wagner, B.; Bennike, O.; Klug, M.; Cremer, H. First indication of Storegga tsunami deposits from East Greenland. J. Quat. Sci. 2007, 22, 321–325. [Google Scholar] [CrossRef]
- Jaffe, B.E.; Gelfenbaum, G. Using tsunami deposits to improve assessment of tsunami risk. In Solutions to Coastal Disasters’02. Conference Proceedings; ASCE: New York, NY, USA, 2002; pp. 836–847. [Google Scholar]
- Dominey-Howes, D.T.M. Documentary and geological records of tsunamis in the Aegean Sea region of Greece and their potential value to risk assessment and disaster management. Nat. Hazards 2002, 25, 195–224. [Google Scholar] [CrossRef]
- Dominey-Howes, D.T.M.; Humphreys, G.S.; Hesse, P.P. Tsunami and palaeotsunami depositional signatures and their potential value in understanding the late-Holocene tsunami record. Holocene 2006, 16, 1095–1107. [Google Scholar] [CrossRef]
- Satake, K.; Atwater, B.F. Long-Term Perspectives on Giant Earthquakes and Tsunamis at Subduction Zones. Annu. Rev. Earth Planet. Sci. 2007, 35, 349–374. [Google Scholar] [CrossRef]
- Gonzalez, F.I.; Geist, E.L.; Jaffe, B.; Kânoğlu, U.; Mofjeld, H.; Synolakis, C.E.; Titov, V.V.; Arcas, D.; Bellomo, D.; Carlton, D.; et al. Probabilistic tsunami hazard assessment at Seaside, Oregon, for near- and far-field seismic sources. J. Geophys. Res. 2009, 114, C11023. [Google Scholar] [CrossRef]
- Goto, K.; Chague-Goff, C.; Fujino, S.; Goff, J.; Jaffe, B.; Nishimura, Y.; Richmond, B.; Sugawara, D.; Szczucinski, W.; Tappin, D.R.; et al. New insights of tsunami hazard from the 2011 Tohoku-oki event. Mar. Geol. 2011, 290, 46–50. [Google Scholar] [CrossRef]
- Dawson, A.G.; Dawson, S.; Bondevik, S.; Costa, P.J.M.; Hill, J.; Stewart, I. Reconciling Storegga tsunami sedimentation patterns with modelled wave heights: A discussion from the Shetland Isles field laboratory. Sedimentology 2020, 67, 1344–1353. [Google Scholar] [CrossRef]
- Takeda, H.; Goto, K.; Goff, J.; Matsumoto, H.; Sugawara, D. Could tsunami risk be underestimated using core-based reconstructions? Lessons from ground penetrating radar. Earth Surf. Process. Landf. 2018, 43, 808–816. [Google Scholar] [CrossRef]
- Shinozaki, T.; Goto, K.; Fujino, S.; Sugawara, D.; Chiba, T. Erosion of a palaeo-tsunami record by the 2011 Tohoku-oki tsunami along the southern Sendai Plain. Mar. Geol. 2015, 369, 127–136. [Google Scholar] [CrossRef]
- Szczuciński, W. Post-depositional changes to tsunami deposits and their preservation potential. In Geological Records of Tsunamis and Other Extreme Waves; Engel, M., Pilarczyk, J., May, S.M., Brill, D., Garrett, E., Eds.; Elsevier: Amsterdam, The Netherlands, 2020; pp. 443–469. [Google Scholar] [CrossRef]
- Szczucinski, W.; Rachlewicz, G.; Chaimanee, N.; Saisuttichai, D.; Tepsuwan, T.; Lorenc, S. 26 December 2004 tsunami deposits left in areas of various tsunami runup in coastal zone of Thailand. Earth Planets Space 2012, 64, 843–858. [Google Scholar] [CrossRef]
- Bondevik, S.; Lovholt, F.; Harbitz, C.; Mangerud, J.; Dawson, A.; Svendson, J.I. The Storegga Slide tsunami—Comparing field observations with numerical simulations. Mar. Pet. Geol. 2005, 22, 195–208. [Google Scholar] [CrossRef]
- Hill, J.; Collins, G.S.; Avdis, A.; Kramer, S.C.; Piggott, M.D. How does multiscale modelling and inclusion of realistic palaeobathymetry affect numerical simulation of the Storegga Slide tsunami? Ocean Model. 2014, 83, 11–25. [Google Scholar] [CrossRef]
- Switzer, A.D.; Bristow, C.S.; Jones, B.G. Investigation of large-scale washover of a small barrier system on the southeast Australian coast using ground penetrating radar. Sediment. Geol. 2006, 183, 145–156. [Google Scholar] [CrossRef]
- Jol, H.M.; Peterson, C.D. Imaging Earthquake Scarps and Tsunami Deposits in the Pacific Northwest, USA. Symposium on the Application of Geophysics to Engineering and Environmental Problems. Environ. Eng. Geophys. Soc. 2006, 217–229. [Google Scholar] [CrossRef]
- Koster, B.; Hadler, H.; Vott, A.; Reicherter, K. Application of GPR for visualising spatial distribution and internal structures of tsunami deposits? Case studies from Spain and Greece. Z. Geomorphol. Suppl. Issue 2013, 57, 29–45. [Google Scholar] [CrossRef]
- Koster, B.; Reicherter, K. Sedimentological and geophysical properties of a ca. 4000 year old tsunami deposit in southern Spain. Sediment. Geol. 2014, 314, 1–16. [Google Scholar] [CrossRef]
- Koster, B.; Hoffmann, G.; Grutzner, C.; Reicherter, K. Ground penetrating radar facies of inferred tsunami deposits on the shores of the Arabian Sea (Northern Indian Ocean). Mar. Geol. 2014, 351, 13–24. [Google Scholar] [CrossRef]
- Gouramanis, C.; Switzer, A.; Polivka, P.M.; Bristow, C.S.; Jankaew, K.; Dat, P.T.; Pile, J.; Rubin, C.M.; Yingsin, L.; Ildetonso, S.R.; et al. Ground penetrating radar examination of thin tsunami beds—A case study from Phra Thong Island, Thailand. Sediment. Geol. 2015, 329, 149–165. [Google Scholar] [CrossRef]
- Premasiri, R.; Styles, P.; Shirira, V.; Cassidy, N.; Schwenninger, J.-L. OSL Dating and GPR Mapping of Palaeotsunami Inundation: A 4000-Year History of Indian Ocean Tsunamis as recorded in Sri Lanka. Pure Appl. Geophys. 2015, 172, 3357–3384. [Google Scholar] [CrossRef]
- Takamura, M.; Udo, K.; Sato, M.; Takahashi, K. Analysis of Coastal Erosion due to the 2011 Great East Japan Tsunami and its Recovery Using Ground Penetrating Radar Data. J. Coast. Res. 2016, 75, 477–481. [Google Scholar] [CrossRef]
- Sawai, Y.; Tamura, T.; Shimada, Y.; Tanigawa, K. Scour ponds from unusually large tsunamis on a beach-ridge plain in eastern Hokkaido, Japan. Sci. Rep. 2023, 13, 3064. [Google Scholar] [CrossRef]
- Bristow, C.; Buck, L. GPR survey of Storegga Tsunami deposits, Shetland Islands, UK and geohazard discussion. Eng. Min. Geophys. 2021, 2021, 1–8. [Google Scholar] [CrossRef]
- Buck, L.; Bristow, C.S. Using ground-penetrating radar to investigate deposits from the Storegga slide tsunami and other sand sheets in the Shetland Islands, UK. J. Geol. Soc. 2024, 181, 1–14. [Google Scholar] [CrossRef]
- Smith, D.E.; Firth, C.R.; Turbayne, S.C.; Brooks, C.L. Holocene relative sea-level changes and shoreline displacement in the Dornoch Firth area, Scotland. Proc. Geol. Assoc. 1992, 103, 237–257. [Google Scholar] [CrossRef]
- Long, D.; Dawson, A.G.; Smith, D.E. A Holocene tsunami deposit in eastern Scotland. J. Quat. Sci. 1989, 4, 61–66. [Google Scholar] [CrossRef]
- Firth, C.; Smith, D.E.; Hansom, J.D.; Pearson, S.G. Holocene spit development on a regressive shoreline, Dornoch Firth, Scotland. Mar. Geol. 1995, 124, 203–214. [Google Scholar] [CrossRef]
- Shi, S. Observational and theoretical aspects of tsunami sedimentation. Ph.D. Thesis, Coventry University, Coventry, UK, 1995; 360p. Unpublished. [Google Scholar]
- Jol, H.M.; Bristow, C.S. GPR in Sediments: Advice on data collection, basic processing and interpretation, a good practice guide. In Ground Penetrating Radar in Sediments; Bristow, C.S., Jol, H.M., Eds.; Geological Society Special Publication 211; The Geological Society: London, UK, 2003; pp. 9–27. [Google Scholar]
- Neal, A. Ground-penetrating radar and its use in Sedimentology: Principles, problems and progress. Earth Sci. Rev. 2004, 66, 261–330. [Google Scholar] [CrossRef]
- Beres, M., Jr.; Haeni, F.P. Application of Ground-Penetrating-Radar methods in hydrogeology. Groundwater 1991, 29, 375–386. [Google Scholar] [CrossRef]
- Shragge, J.; Irving, J.; Artman, B. Shot profile migration of GPR data. In Proceedings of the Tenth International Conference on Grounds Penetrating Radar, 2004. GPR 2004, Delft, The Netherlands, 21–24 June 2004; pp. 337–340. Available online: https://ieeexplore.ieee.org/abstract/document/1343441 (accessed on 4 November 2023).
- Sena, A.R.; Stoffa, P.L.; Sen, M.K. Split-step Fourier migration of GPR data in lossy media. Geophysics 2006, 71, k77–k91. [Google Scholar] [CrossRef]
- Dawson, A.G.; Foster, I.D.L.; Shi, S.; Smith, D.E.; Long, D. The identification of tsunami deposits in coastal sediment sequences. Sci. Tsunami Hazards 1991, 9, 73–82. [Google Scholar]
- Abe, T.; Goto, K.; Sugawara, D. Relationship between the maximum extent of tsunami sand and the inundation limit of the 2011 Tohoku-oki tsunami on the Sendai Plain, Japan. Sediment. Geol. 2012, 282, 142–150. [Google Scholar] [CrossRef]
- Goto, K.; Hashimoto, K.; Sugawara, D.; Yanagisawa, H.; Abe, T. Spatial thickness variability of the 2011 Tohoku-oki tsunami deposits along the coastline of Sendai Bay. Mar. Geol. 2014, 358, 38–48. [Google Scholar] [CrossRef]
- Richmond, B.; Szczucinski, W.; Chague-Goff, C.; Goto, K.; Sugawara, D.; Witter, R.; Tappin, D.R.; Jaffe, B.; Fujino, S.; Nishimura, Y.; et al. Erosion, deposition and landscape change on the Sendai coastal plain, Japan, resulting from the March 11, 2011 Tohou-oki tsunami. Sediment. Geol. 2012, 282, 27–39. [Google Scholar] [CrossRef]
- Goto, K.; Sugawara, D.; Ikema, S.; Miyagai, T. Sedimentary processes associated with sand and boulder deposits formed by the 2011 Tohoku-oki tsunami at Sabusawa Island Japan. Sediment. Geol. 2012, 282, 188–198. [Google Scholar] [CrossRef]
- Razjigaeva, N.G.; Ganzey, L.A.; Grebennikova, T.A.; Ivanova, E.D.; Kharlamov, A.A.; Kaistrenko, V.M.; Arslanov, K.A.; Chernov, S.B. The Tohoku Tsunami of 11 March 2011: The Key Event to Understanding Tsunami Sedimentation on the Coasts of Closed Bays of the Lesser Kuril Islands. Pure Appl. Geophys. 2014, 171, 3307–3328. [Google Scholar] [CrossRef]
- Choowong, M.; Murakoshi, N.; Hisada, K.-i.; Charoentitirat, T.; Charusiri, P.; Phantuwongraj, S.; Wongkok, P.; Choowong, A.; Subsayjun, R.; Chutakositkanon, V.; et al. Flow conditions of the 2004 Indian Ocean tsunami in Thailand, inferred from capping bedforms and sedimentary structures. Terra Nova 2008, 20, 141–149. [Google Scholar] [CrossRef]
- Hawkes, A.D.; Bird, M.; Cowie, S.; Grundy-Warr, C.; |Horton, B.P.; Hwai, A.T.S.; Law, L.; Macgregor, C.; Nott, J.; Ong, J.E.; et al. Sediments deposited by the 2004 Indian Ocean Tsunami along the Malaysia-Thailand Peninsula. Mar. Geol. 2007, 242, 169–190. [Google Scholar] [CrossRef]
- Matsumoto, D.; Shimamoto, T.; Hirose, T.; Gunatilake, J.; Wickramasooriya, A.; DeLile, J.; Young, S.; Rathnayake, C.; Ranasooriya, J.; Murayama, M. Thickness and grain-size distribution of the 2004 Indian Ocean tsunami deposits in Periya Kalapuwa Lagoon, eastern Sri Lanka. Sediment. Geol. 2010, 230, 95–104. [Google Scholar] [CrossRef]
- Srinivvasalu, S.; Thangaduria, N.; Switzer, A.D.; Ram Mohan, V.; Ayyamperumal, T. Erosion and sedimentation in Kalpakkam (N Tamil Nadu, India) from the 26 December 2004 tsunami. Mar. Geol. 2007, 240, 65–75. [Google Scholar] [CrossRef]
- Paris, R.; Lavigne, F.; Wassmer, P.; Sartohadi, J. Coastal sedimentation associated with the December 26, 2004 tsunami in Lhok Nga, west Banda Ache (Sumatra, Indonesia). Mar. Geol. 2007, 238, 93–106. [Google Scholar] [CrossRef]
- Monecke, K.; Finger, W.; Klarer, D.; Kongko, W.; McAdoo, B.J.; Moore, A.L.; Sudrajat, S.U. A 1,000-year sediment record of tsunami recurrence in northern Sumatra. Nature 2008, 455, 1232–1234. [Google Scholar] [CrossRef]
- Chanson, H.; Lubin, P. Mixing and Sediment Processes induced by Tsunamis propagating Upriver in Tsunamis. In Economic Impact, Disaster Management and Future Challenges; Cai, T., Ed.; Nova Science Publishers: Hauppauge, NY, USA, 2013; Chapter 3; pp. 65–102. ISBN 978-1-62808-682-9/978-1-62808-686-7. [Google Scholar]
- Tolkova, E.; Tanaka, H. Tsunami Bores in Kitakami River. In Global Tsunami Science: Past and Future, Volume I; Geist, E.L., Fritz, H.M., Rabinovich, A.B., Tanioka, Y., Eds.; Pageoph Topical Volumes; Birkhäuser: Cham, Switzerland, 2016. [Google Scholar] [CrossRef]
- Hansom, J.D. Coastal sensitivity to environmental change: A view from the beach. Catena 2001, 42, 291–305. [Google Scholar] [CrossRef]
- Hansom, J.D. Morrich More, Ross and Cromarty (NH 803 835-NH 892 830). In Coastal Geomorphology of Great Britain; May, V.J., Hansom, J.D., Eds.; Geological Conservation Review Series No. 28. Peterborough; Joint Nature Conservation Committee: Peterborough, UK, 2003; pp. 576–583. [Google Scholar]
- Dheeradilok, P. Quaternary coastal morphology and deposition in Thailand. Quat. Int. 1995, 26, 49–54. [Google Scholar] [CrossRef]
- Matsumoto, H. Beach ridge ranges and the Holocene sea-level fluctuations on alluvial coastal plains, northeast Japan. Sci. Rep. Tohoku Univ. 1985, 35, 15–46. [Google Scholar]
- Yoshida, J.; Udo, K.; Takeda, Y.; Mano, A. Potential impact of climate change at five Japanese beaches. J. Coast. Res. 2013, 65, 2185–2190. [Google Scholar] [CrossRef]
- Lambeck, K. Glacial rebound and sea-level changes in the British Isles. Terra Nova 1991, 3, 379–389. [Google Scholar] [CrossRef]
- Lambeck, K. Glacial rebound of the British Isles—II. A high-resolution, high-precision model. Geophys. J. Int. 1993, 115, 960–990. [Google Scholar] [CrossRef]
- Bondevik, S. Tsunami from the Storegga landslide. In Encyclopaedia of Complexity and Systems Science; Meyers, R., Ed.; Springer: Berlin/Heidelberg, Germany, 2022; pp. 153–185. [Google Scholar] [CrossRef]
- Switzer, A.D.; Gouramanis, C.; Bristow, C.S.; Simms, A.R. Ground-penetrating radar (GPR) in coastal hazard studies. In Geological Records of Tsunamis and Other Extreme Waves; Engel, M., Pilarczyk, J., May, S.M., Brill, D., Garrett, E., Eds.; Elsevier: Amsterdam, The Netherlands, 2020; pp. 143–168. [Google Scholar] [CrossRef]

| Radar Facies | Description of Reflection Characteristics | Colour | Interpretation of Depositional Environment |
|---|---|---|---|
| RF1 | Continuous, sub-horizontal, high-amplitude reflections, thickens and thins laterally. | Pink | Tsunami sand layer |
| RF2 | Continuous, sub-horizontal, low-amplitude reflections, with broad concave reflections. | Brown | Back-barrier/estuarine intertidal sediments and freshwater marsh |
| RF3 | Inclined tangential reflections that dip towards the sea. | Yellow | Beach deposits |
| RF4 | Inclined tangential reflections that dip towards the land. | Purple | Washover deposits |
| RF5 | Packages of short, inclined reflections bounded by low-angle convex and low-amplitude concave reflections that truncate other low-angle reflections. | Blue | Tidal channel deposits |
| RF6 | Packages of inclined, planar, and sigmoid reflections with concave or irregular erosional surfaces at base. | Orange | Lateral accretion in fluvial channel |
| RF7 | Discontinuous hyperbolic reflections, high-attenuation, locally reflection-free. Migration produces artifacts with short concave reflections. | Green | Fluvioglacial terrace deposits |
Disclaimer/Publisher’s Note: The statements, opinions and data contained in all publications are solely those of the individual author(s) and contributor(s) and not of MDPI and/or the editor(s). MDPI and/or the editor(s) disclaim responsibility for any injury to people or property resulting from any ideas, methods, instructions or products referred to in the content. |
© 2024 by the authors. Licensee MDPI, Basel, Switzerland. This article is an open access article distributed under the terms and conditions of the Creative Commons Attribution (CC BY) license (https://creativecommons.org/licenses/by/4.0/).
Share and Cite
Bristow, C.S.; Buck, L.K.; Shah, R. Using Ground-Penetrating Radar (GPR) to Investigate the Exceptionally Thick Deposits from the Storegga Tsunami in Northeastern Scotland. Remote Sens. 2024, 16, 2042. https://doi.org/10.3390/rs16112042
Bristow CS, Buck LK, Shah R. Using Ground-Penetrating Radar (GPR) to Investigate the Exceptionally Thick Deposits from the Storegga Tsunami in Northeastern Scotland. Remote Sensing. 2024; 16(11):2042. https://doi.org/10.3390/rs16112042
Chicago/Turabian StyleBristow, Charlie S., Lucy K. Buck, and Rishi Shah. 2024. "Using Ground-Penetrating Radar (GPR) to Investigate the Exceptionally Thick Deposits from the Storegga Tsunami in Northeastern Scotland" Remote Sensing 16, no. 11: 2042. https://doi.org/10.3390/rs16112042
APA StyleBristow, C. S., Buck, L. K., & Shah, R. (2024). Using Ground-Penetrating Radar (GPR) to Investigate the Exceptionally Thick Deposits from the Storegga Tsunami in Northeastern Scotland. Remote Sensing, 16(11), 2042. https://doi.org/10.3390/rs16112042