
Evaluating Tropical Cyclone-Induced Flood and Surge Risks for Vanuatu by Assessing Location Hazard Susceptibility

Abstract
:
1. Introduction
2. Data and Methods
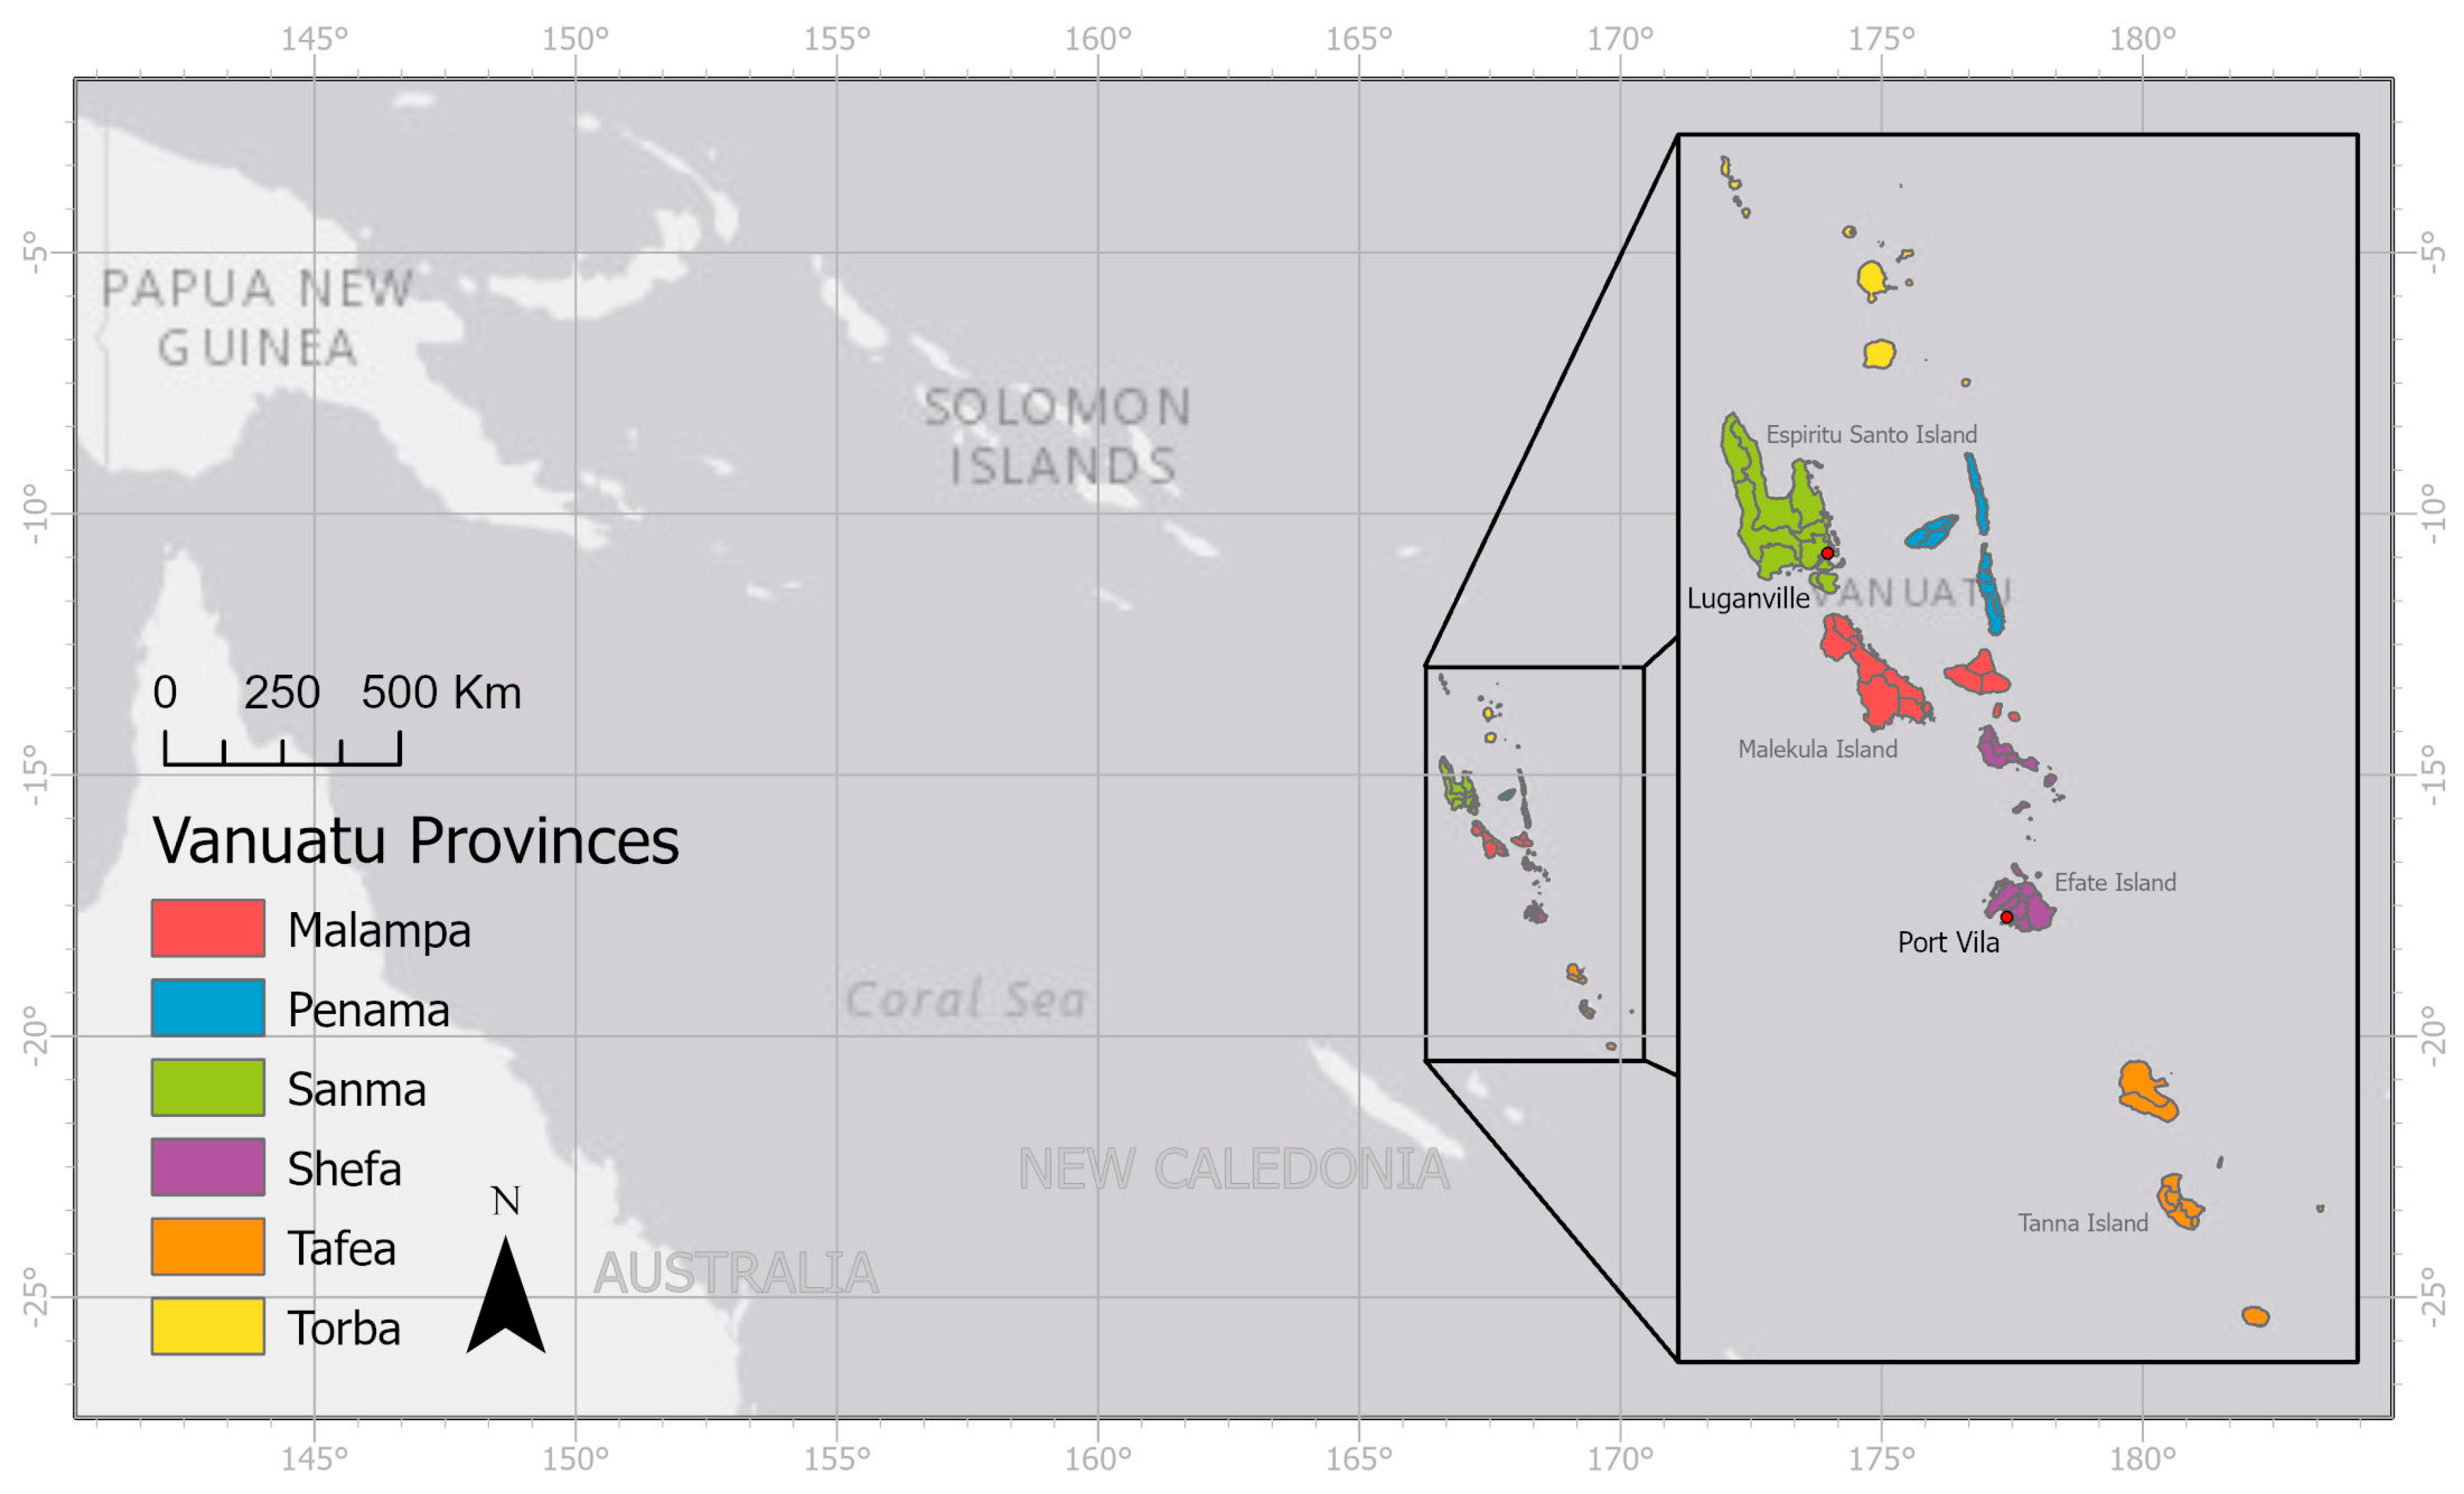
2.1. Study Area
2.2. Selection and Description of Indicators
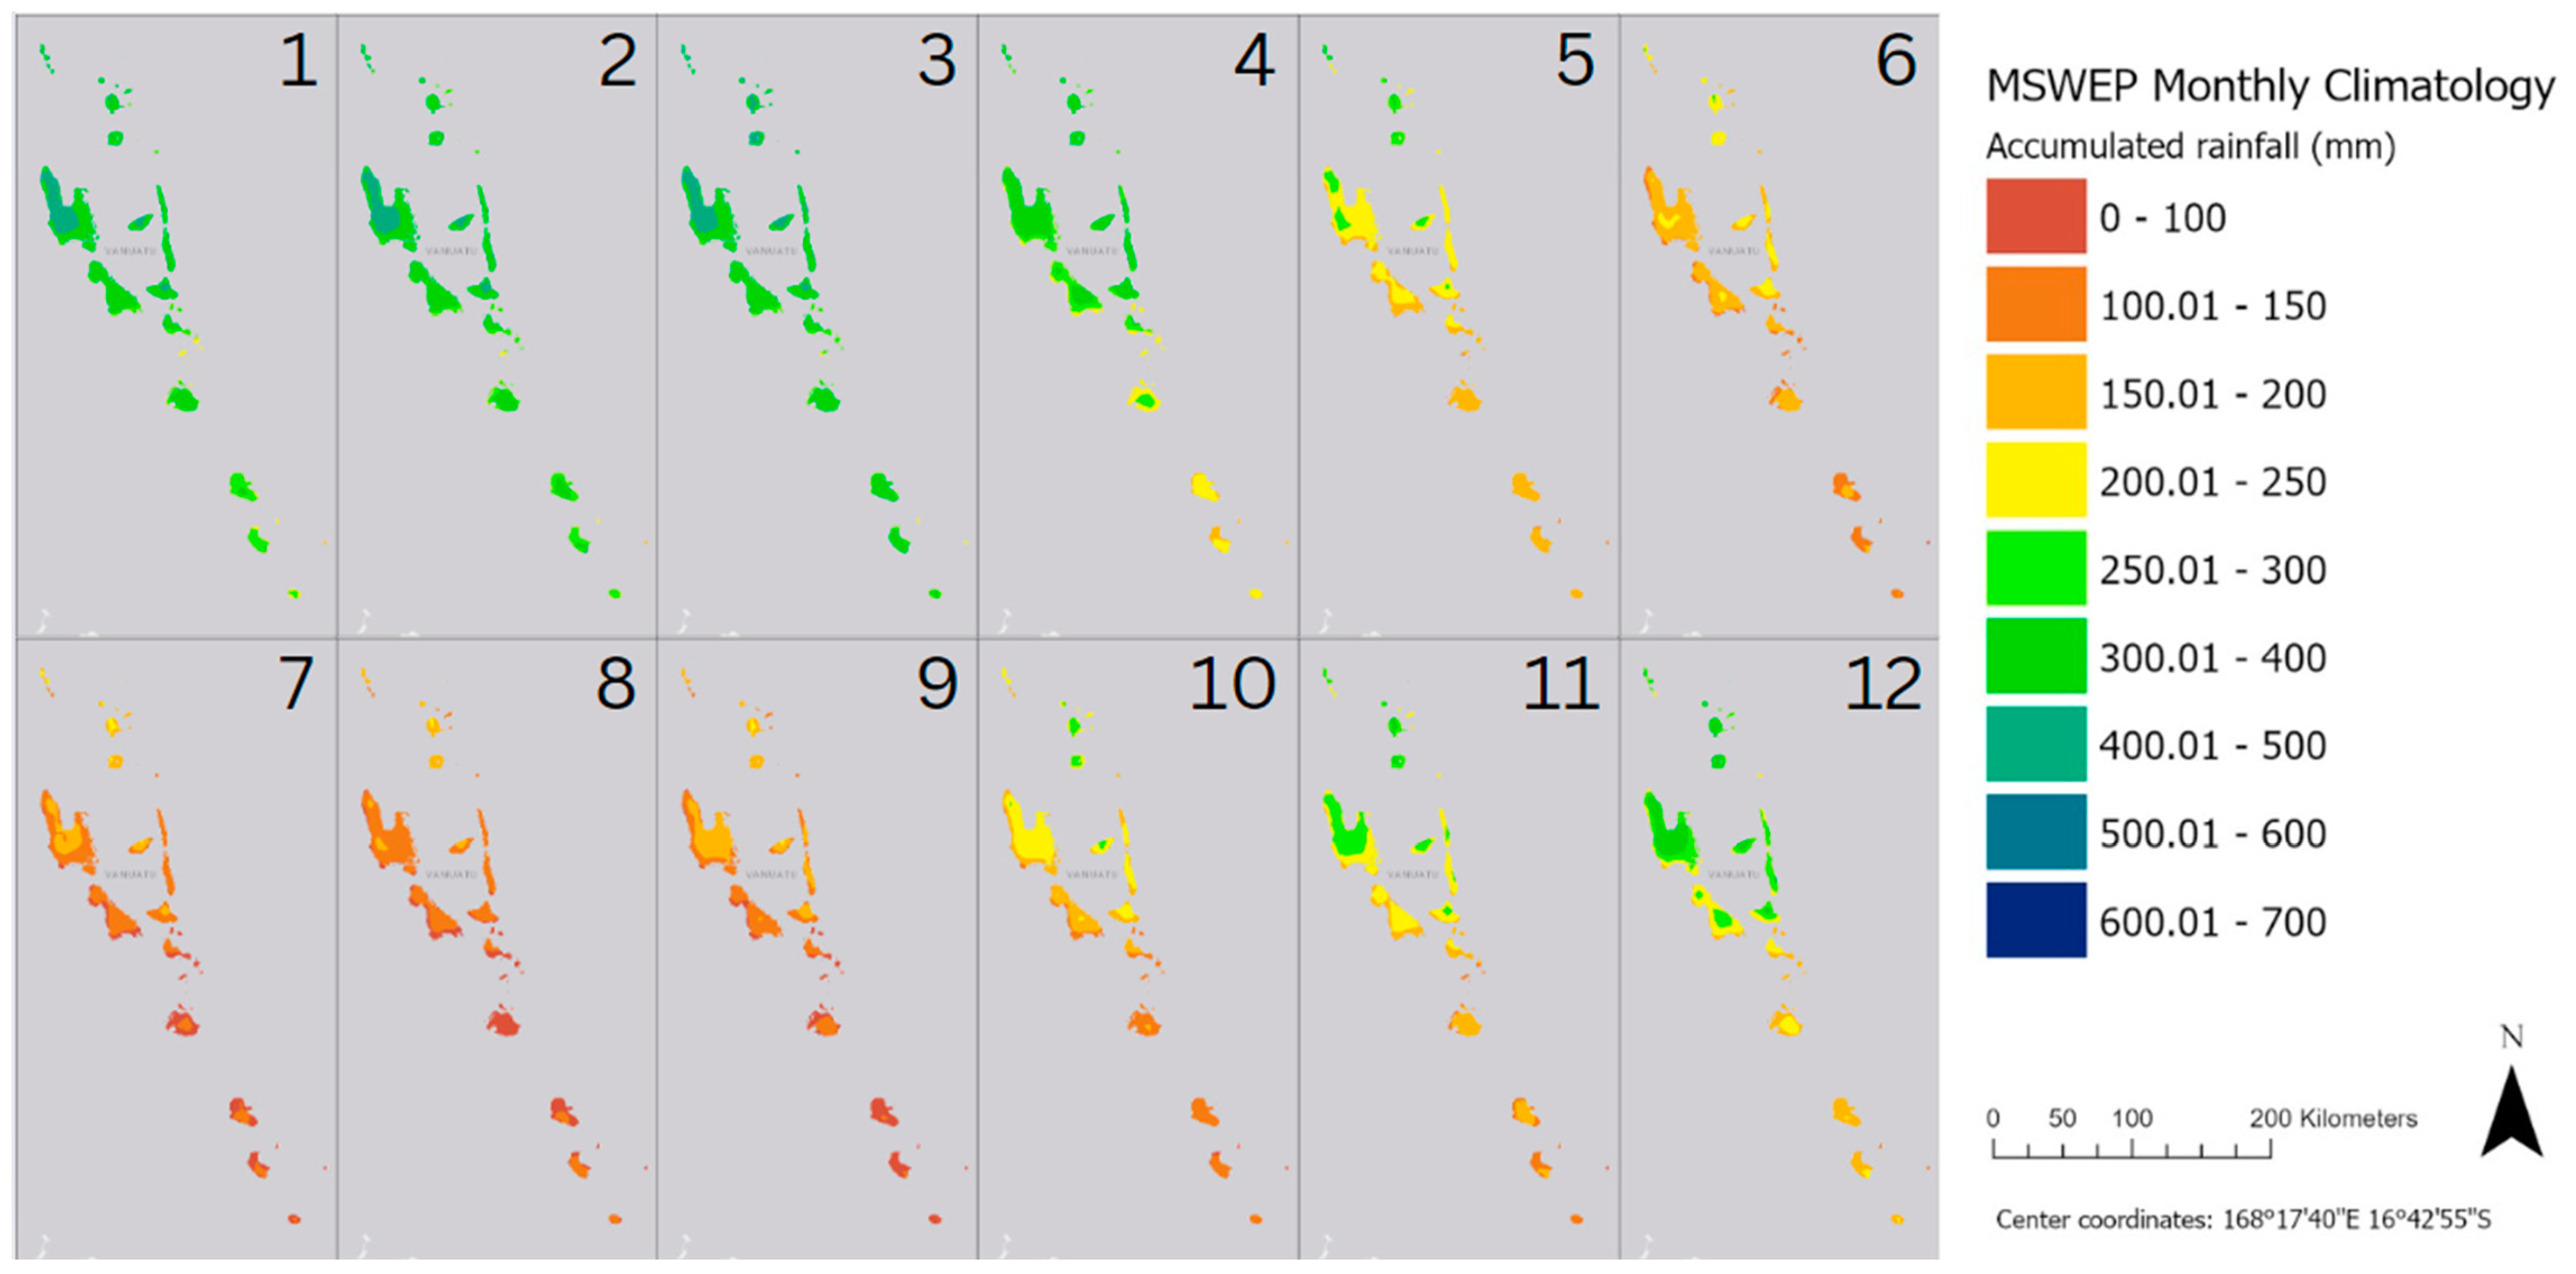
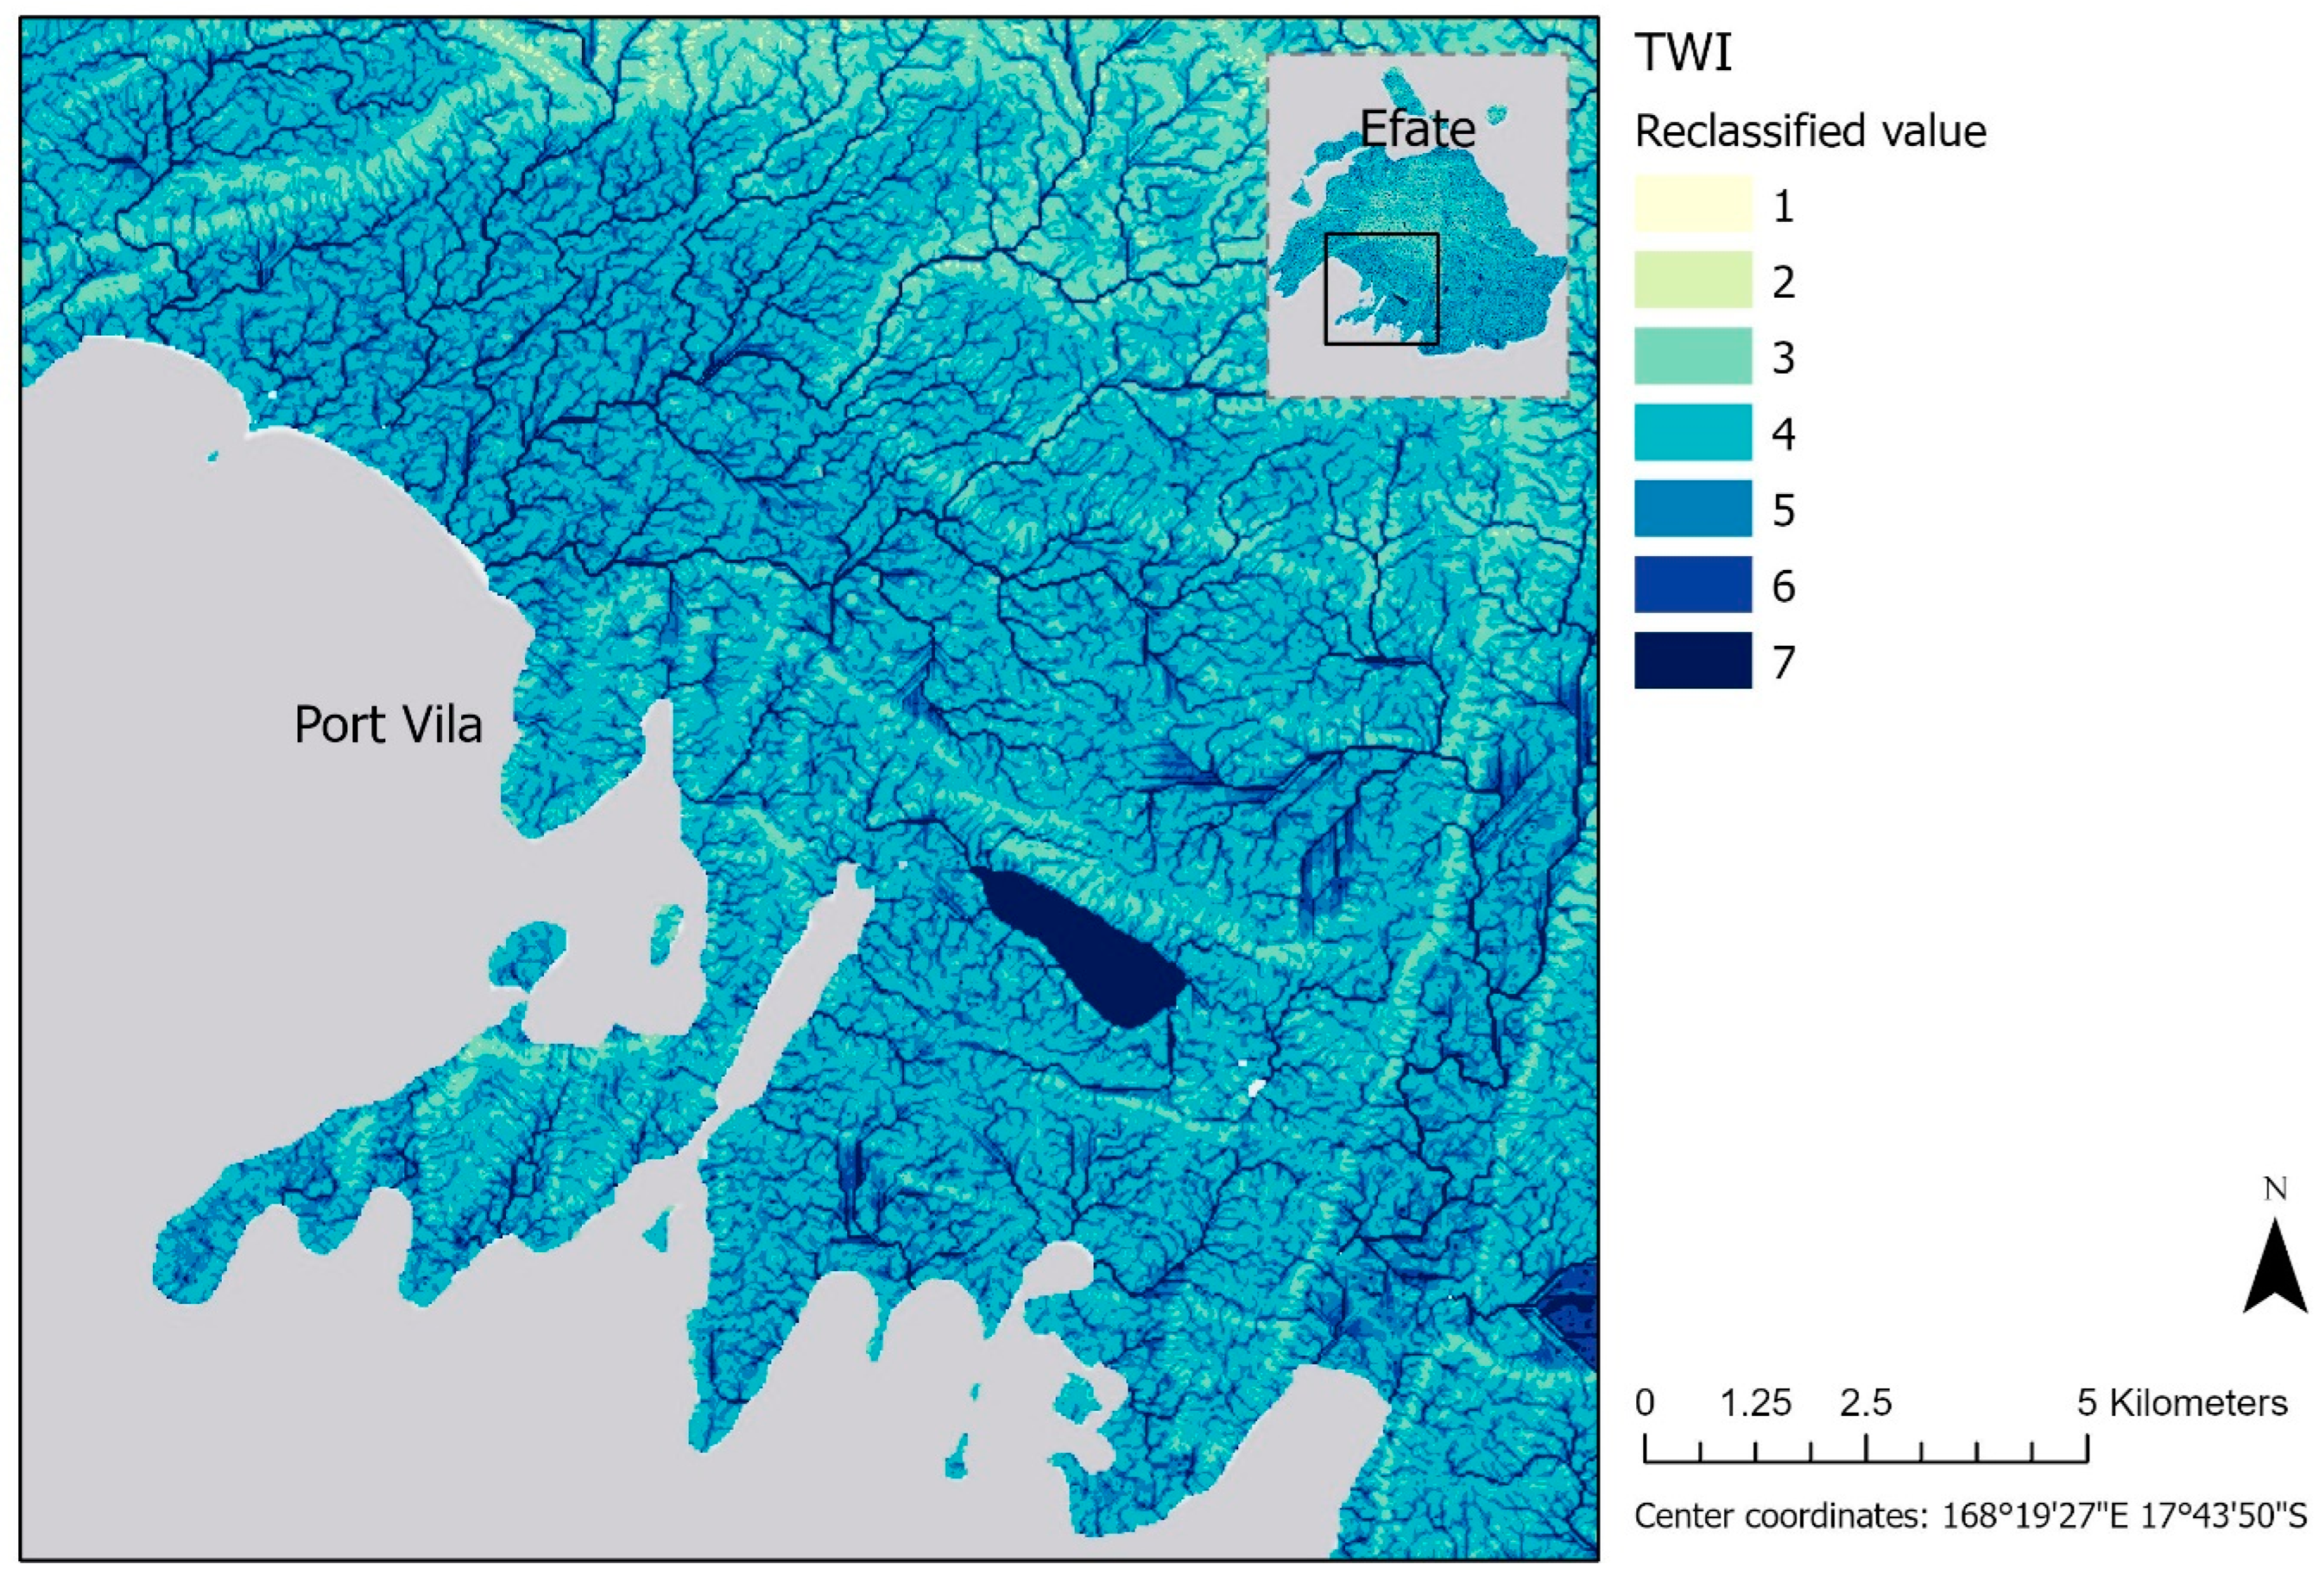
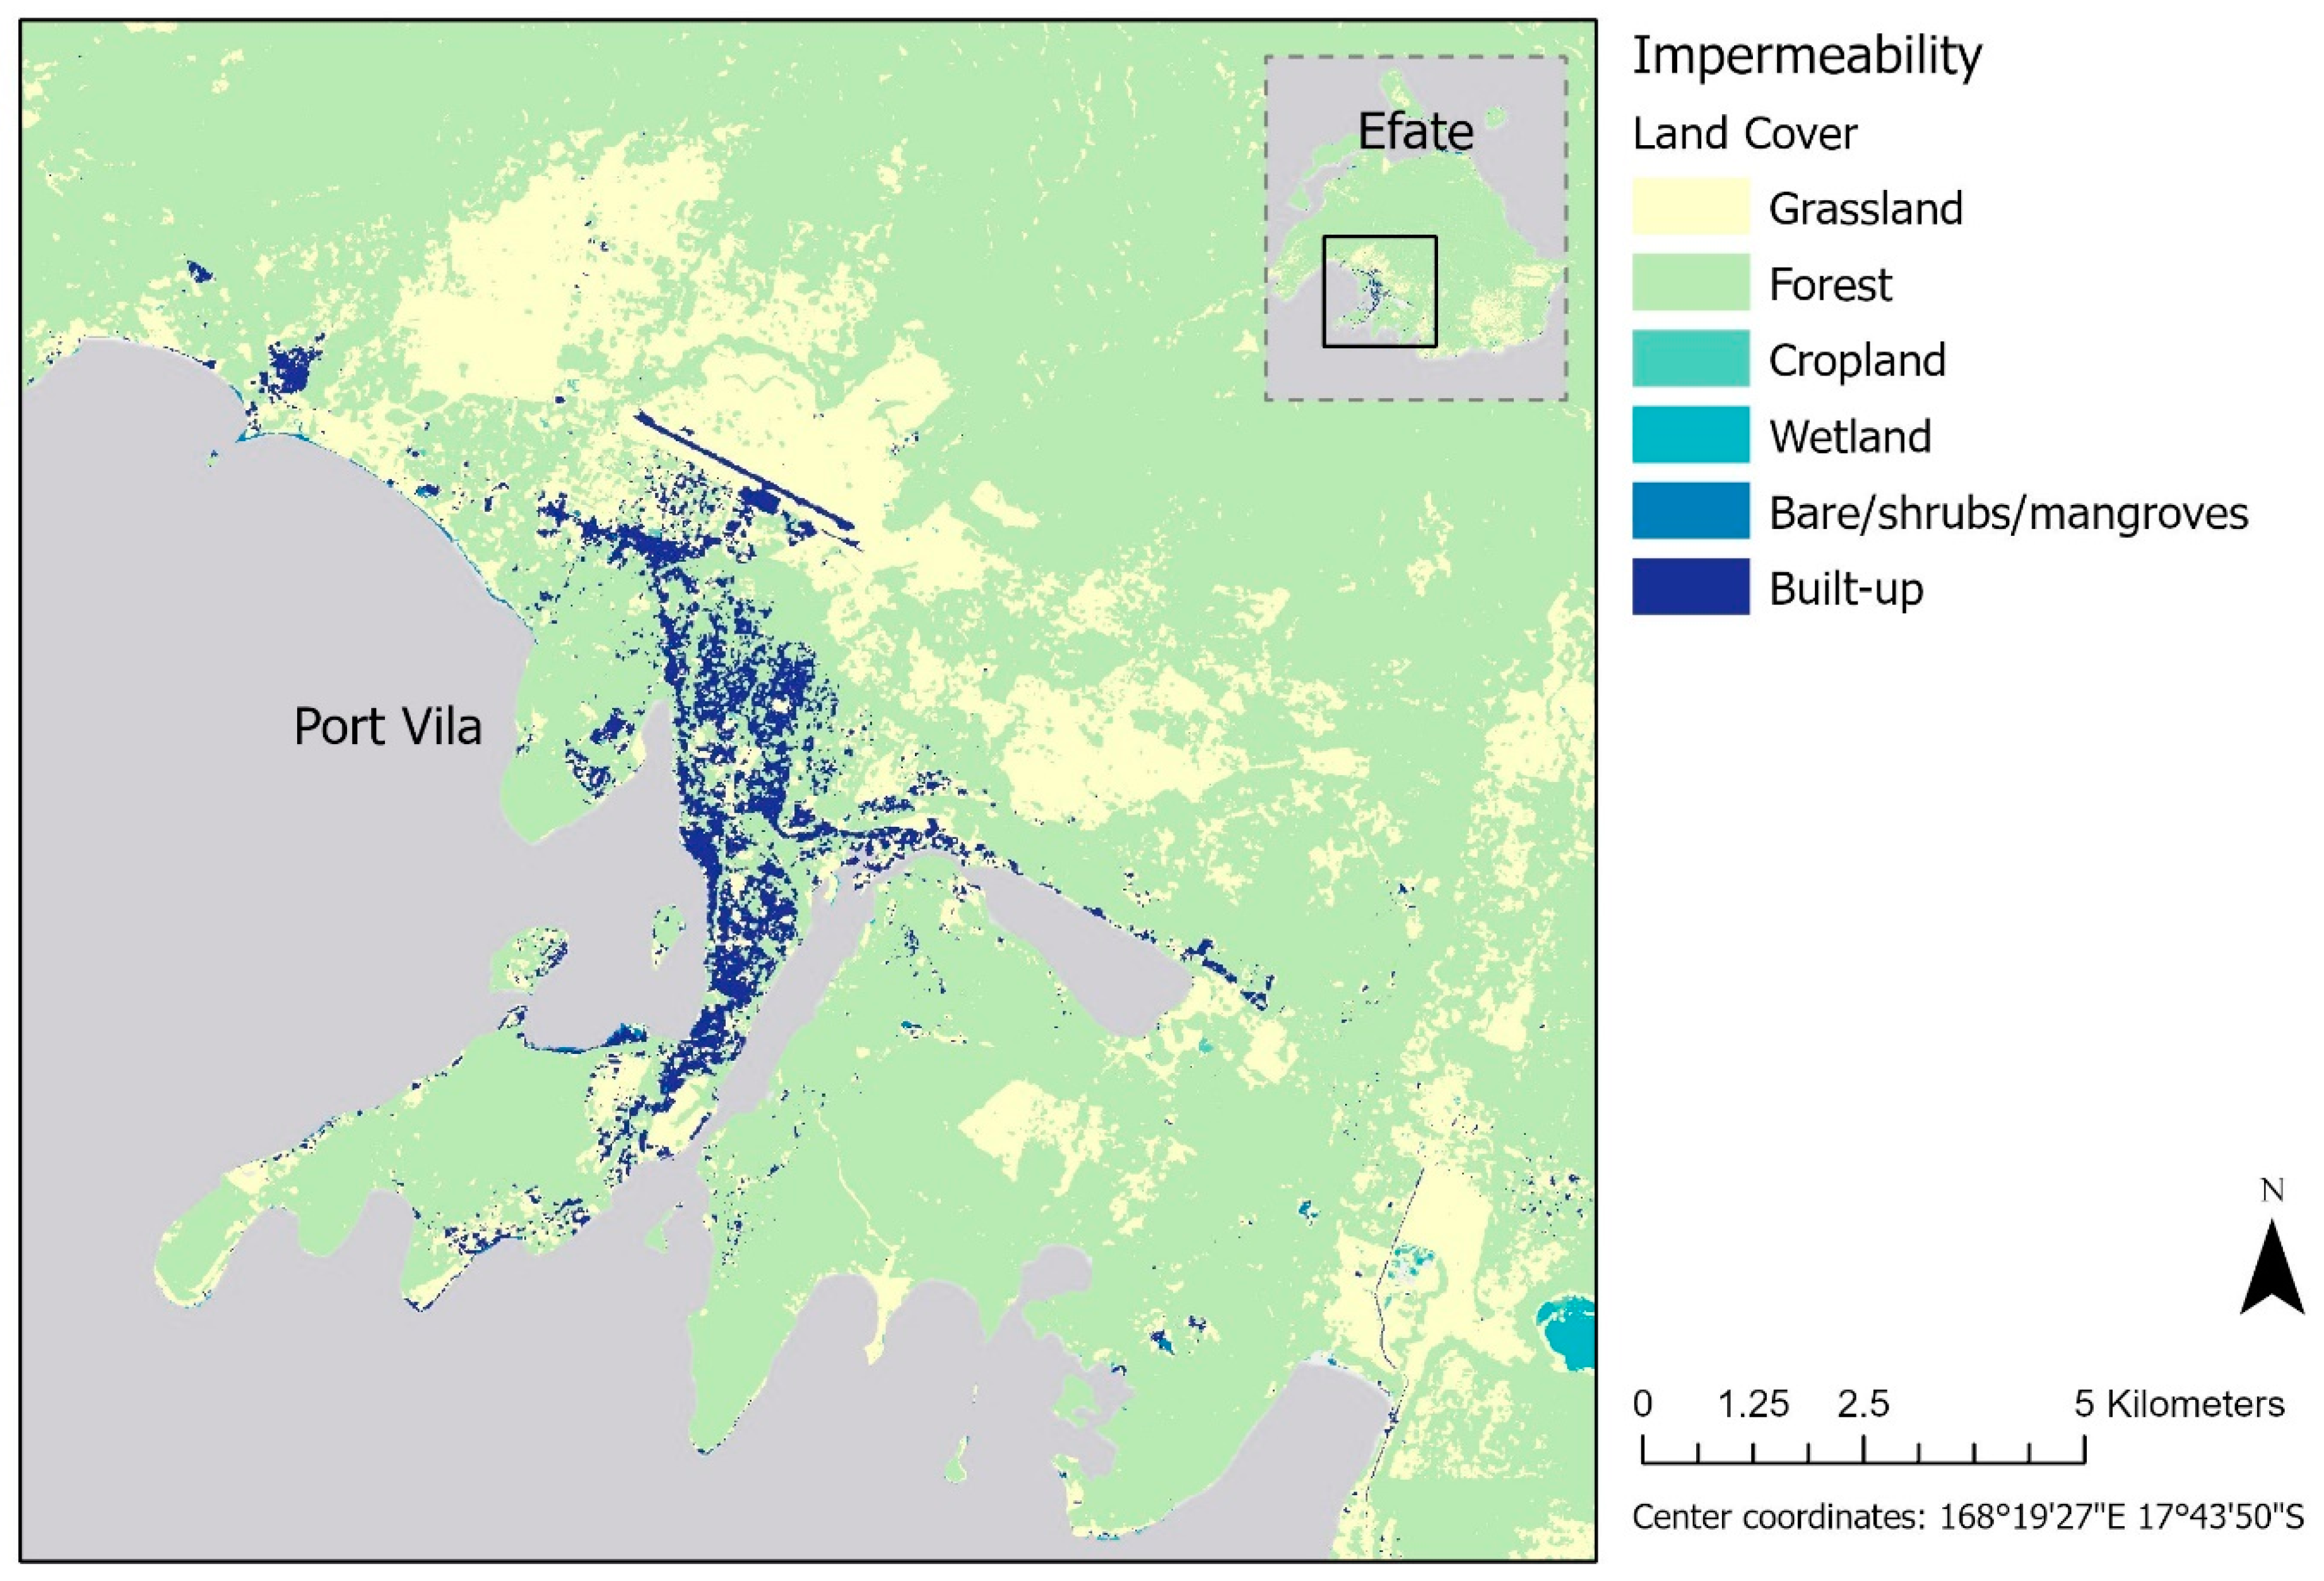
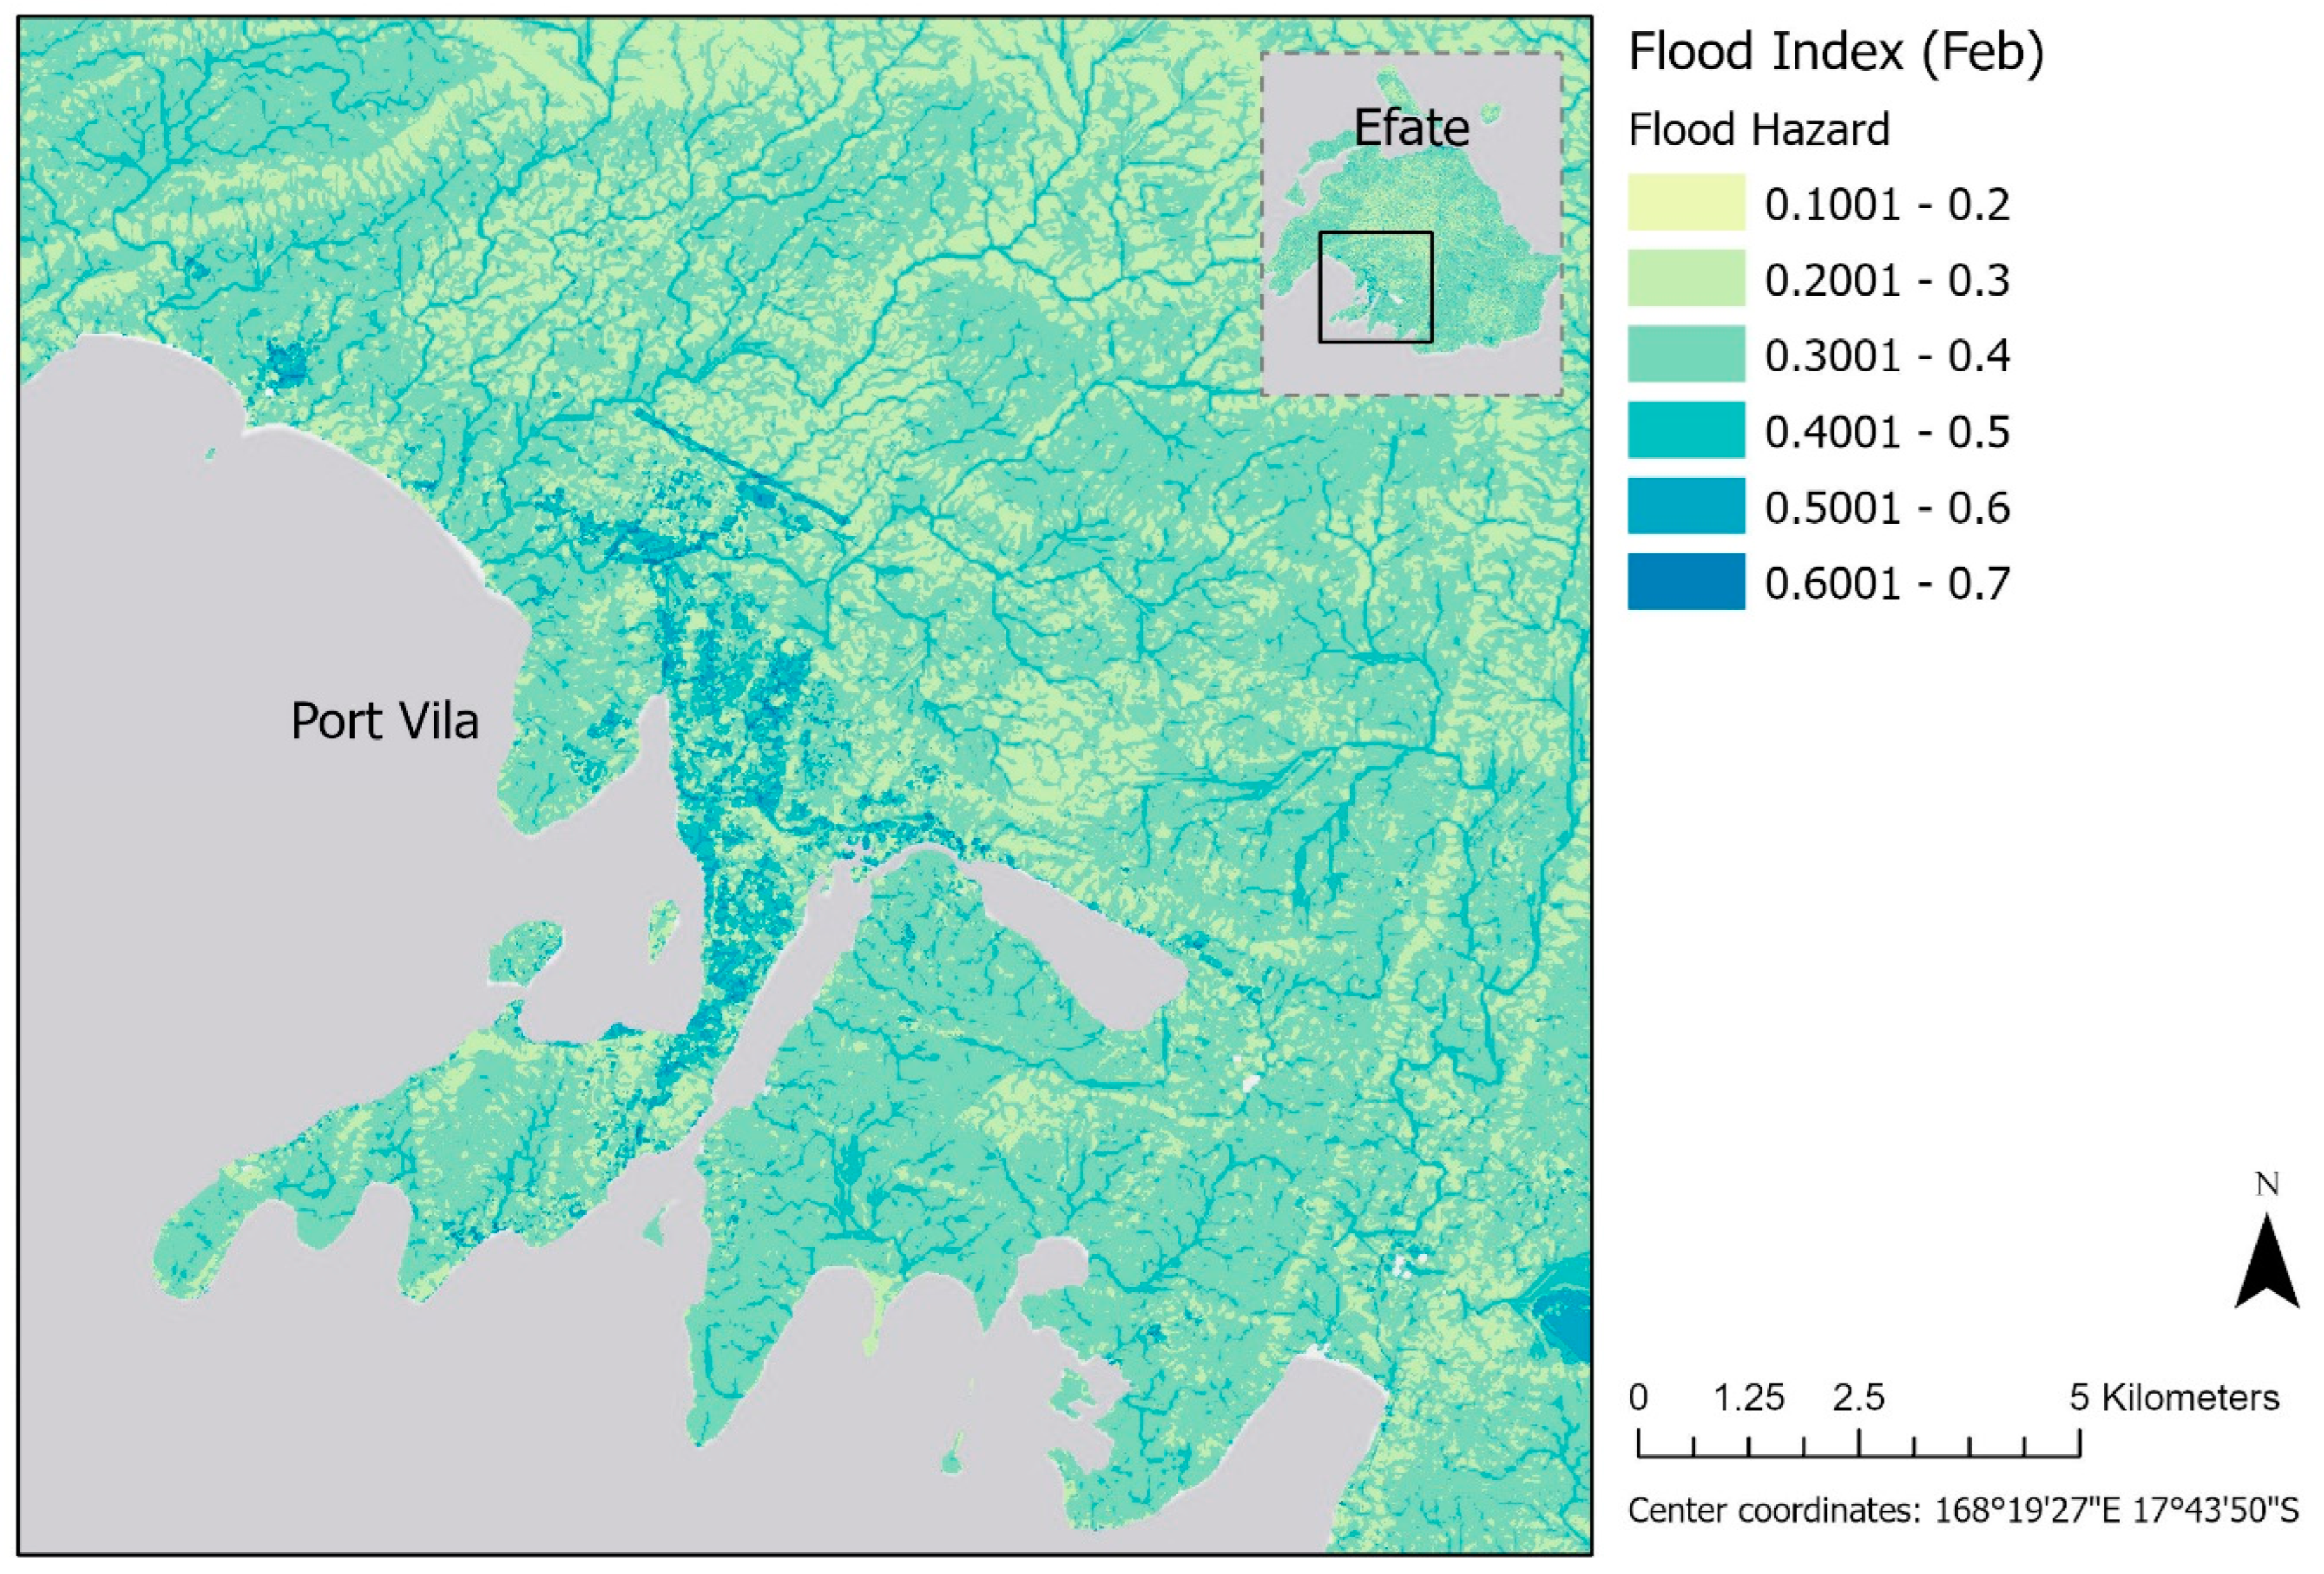
2.2.1. Flood Hazard Indicators
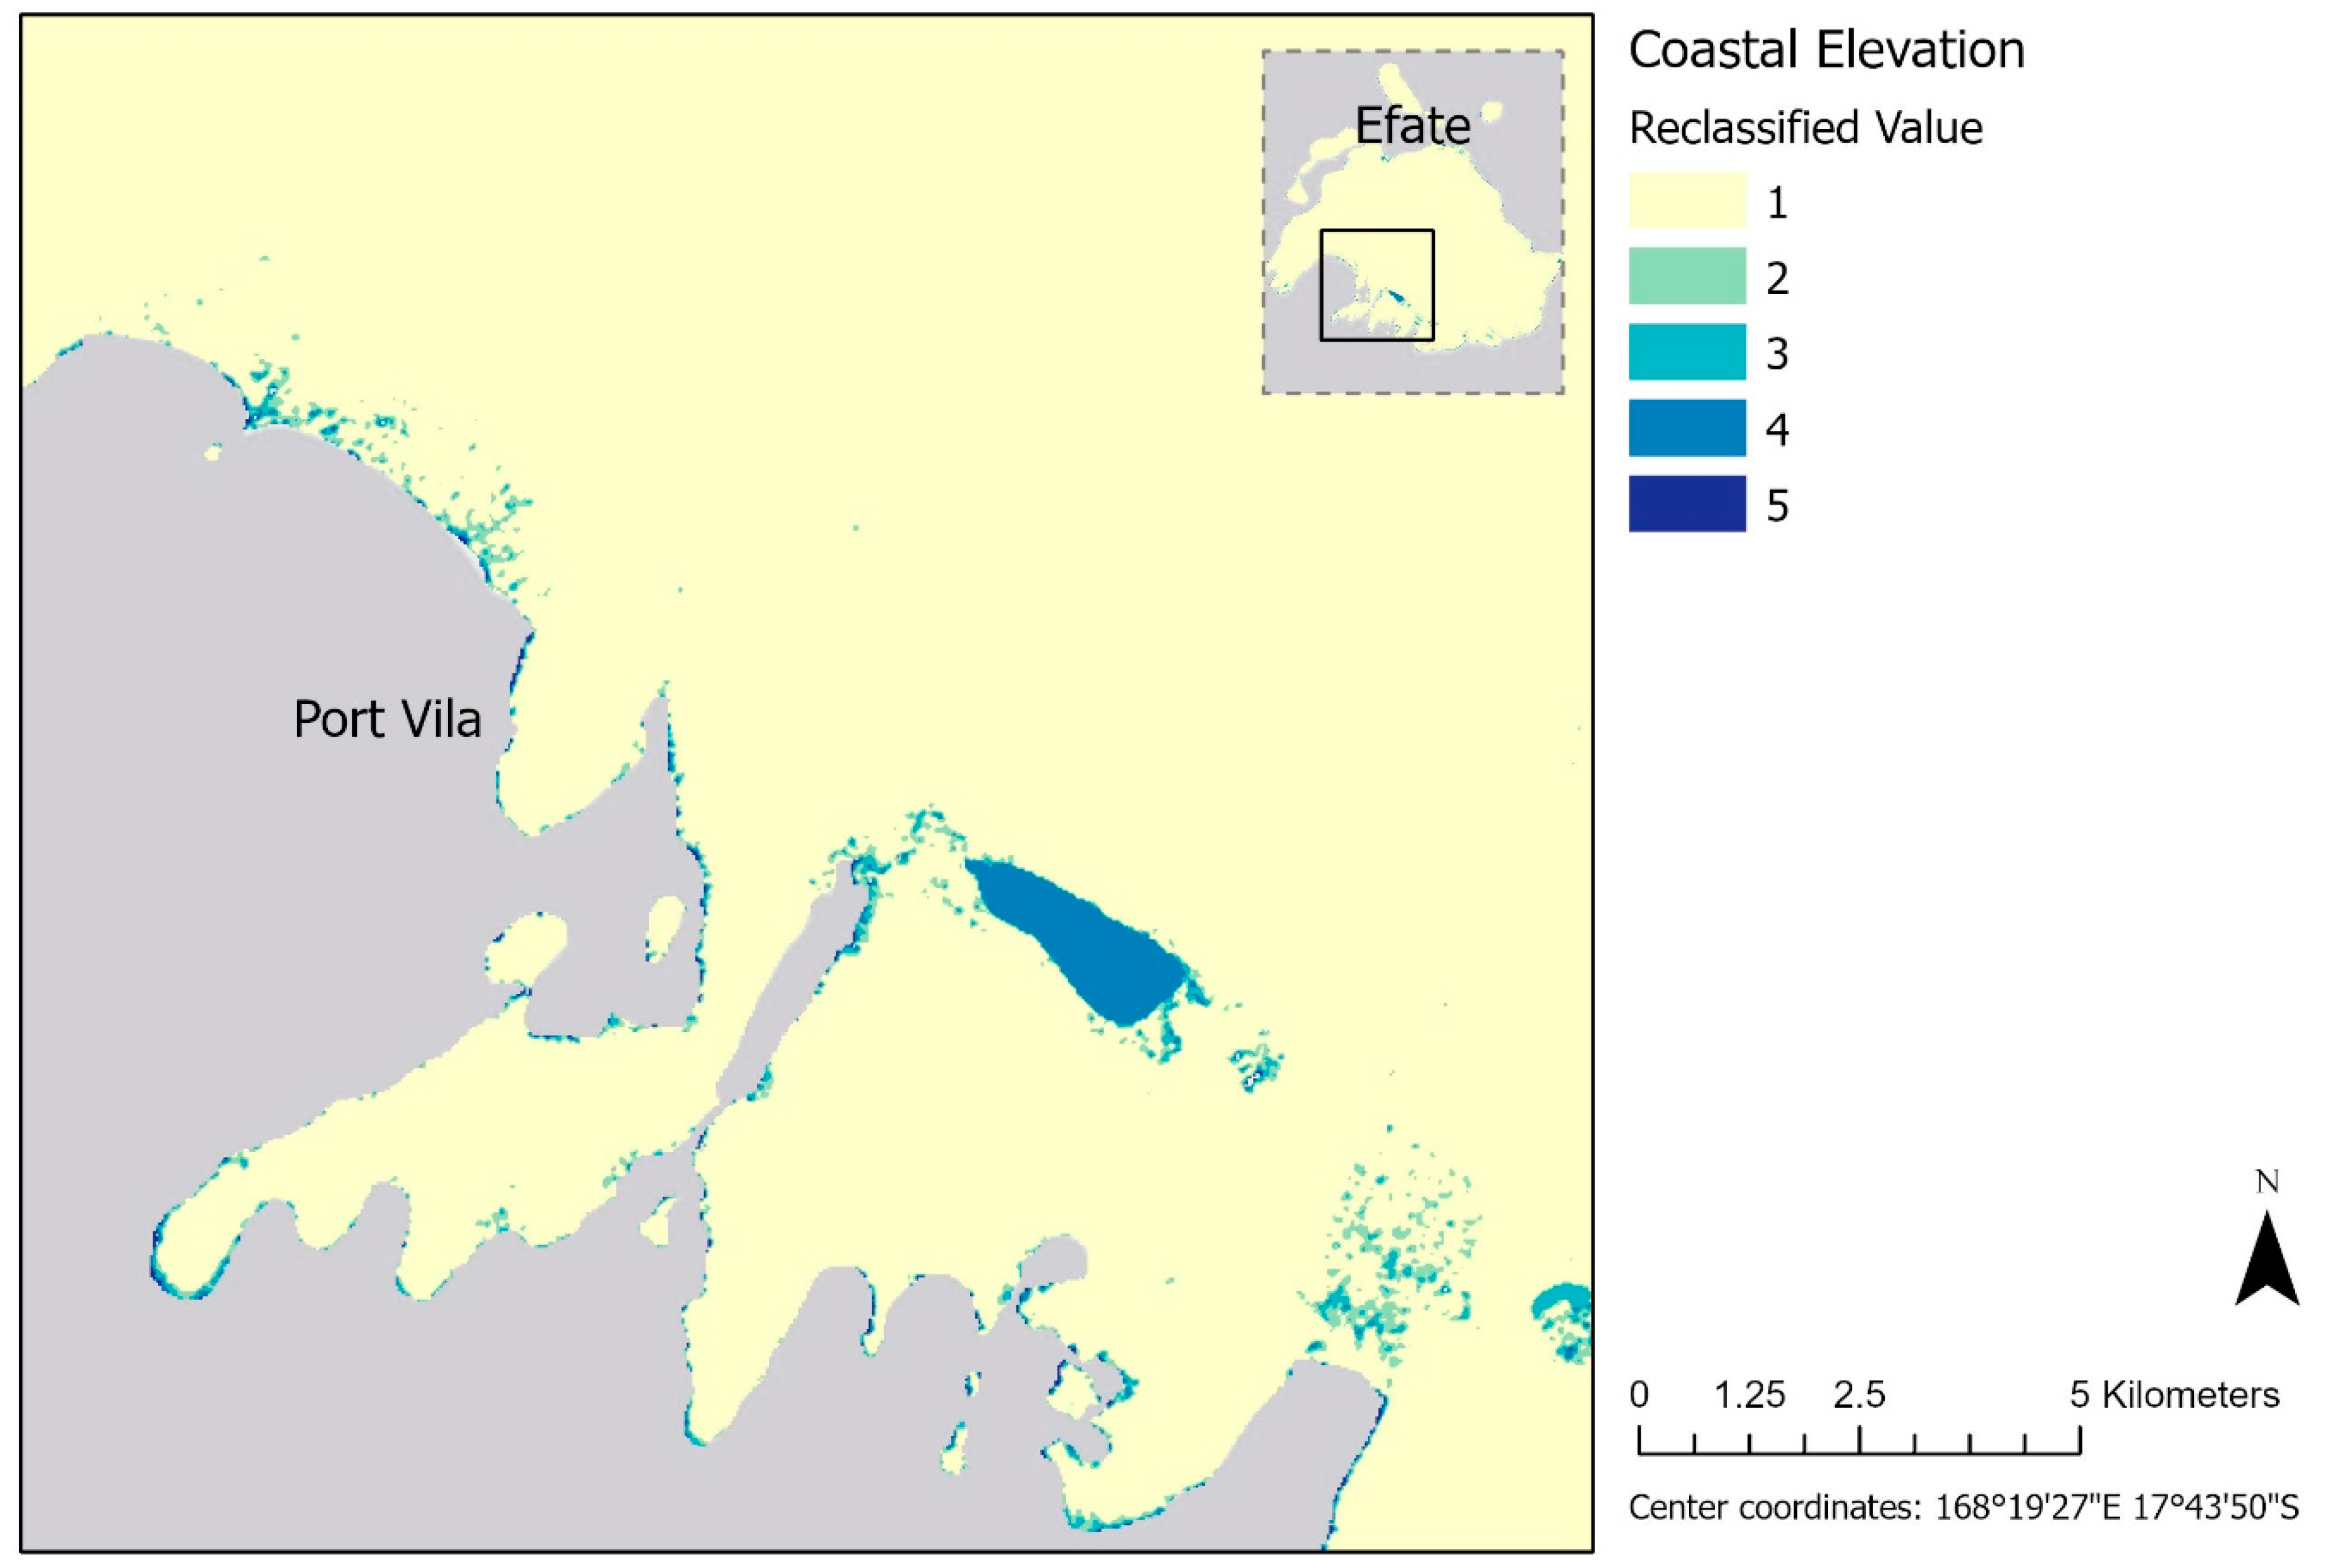
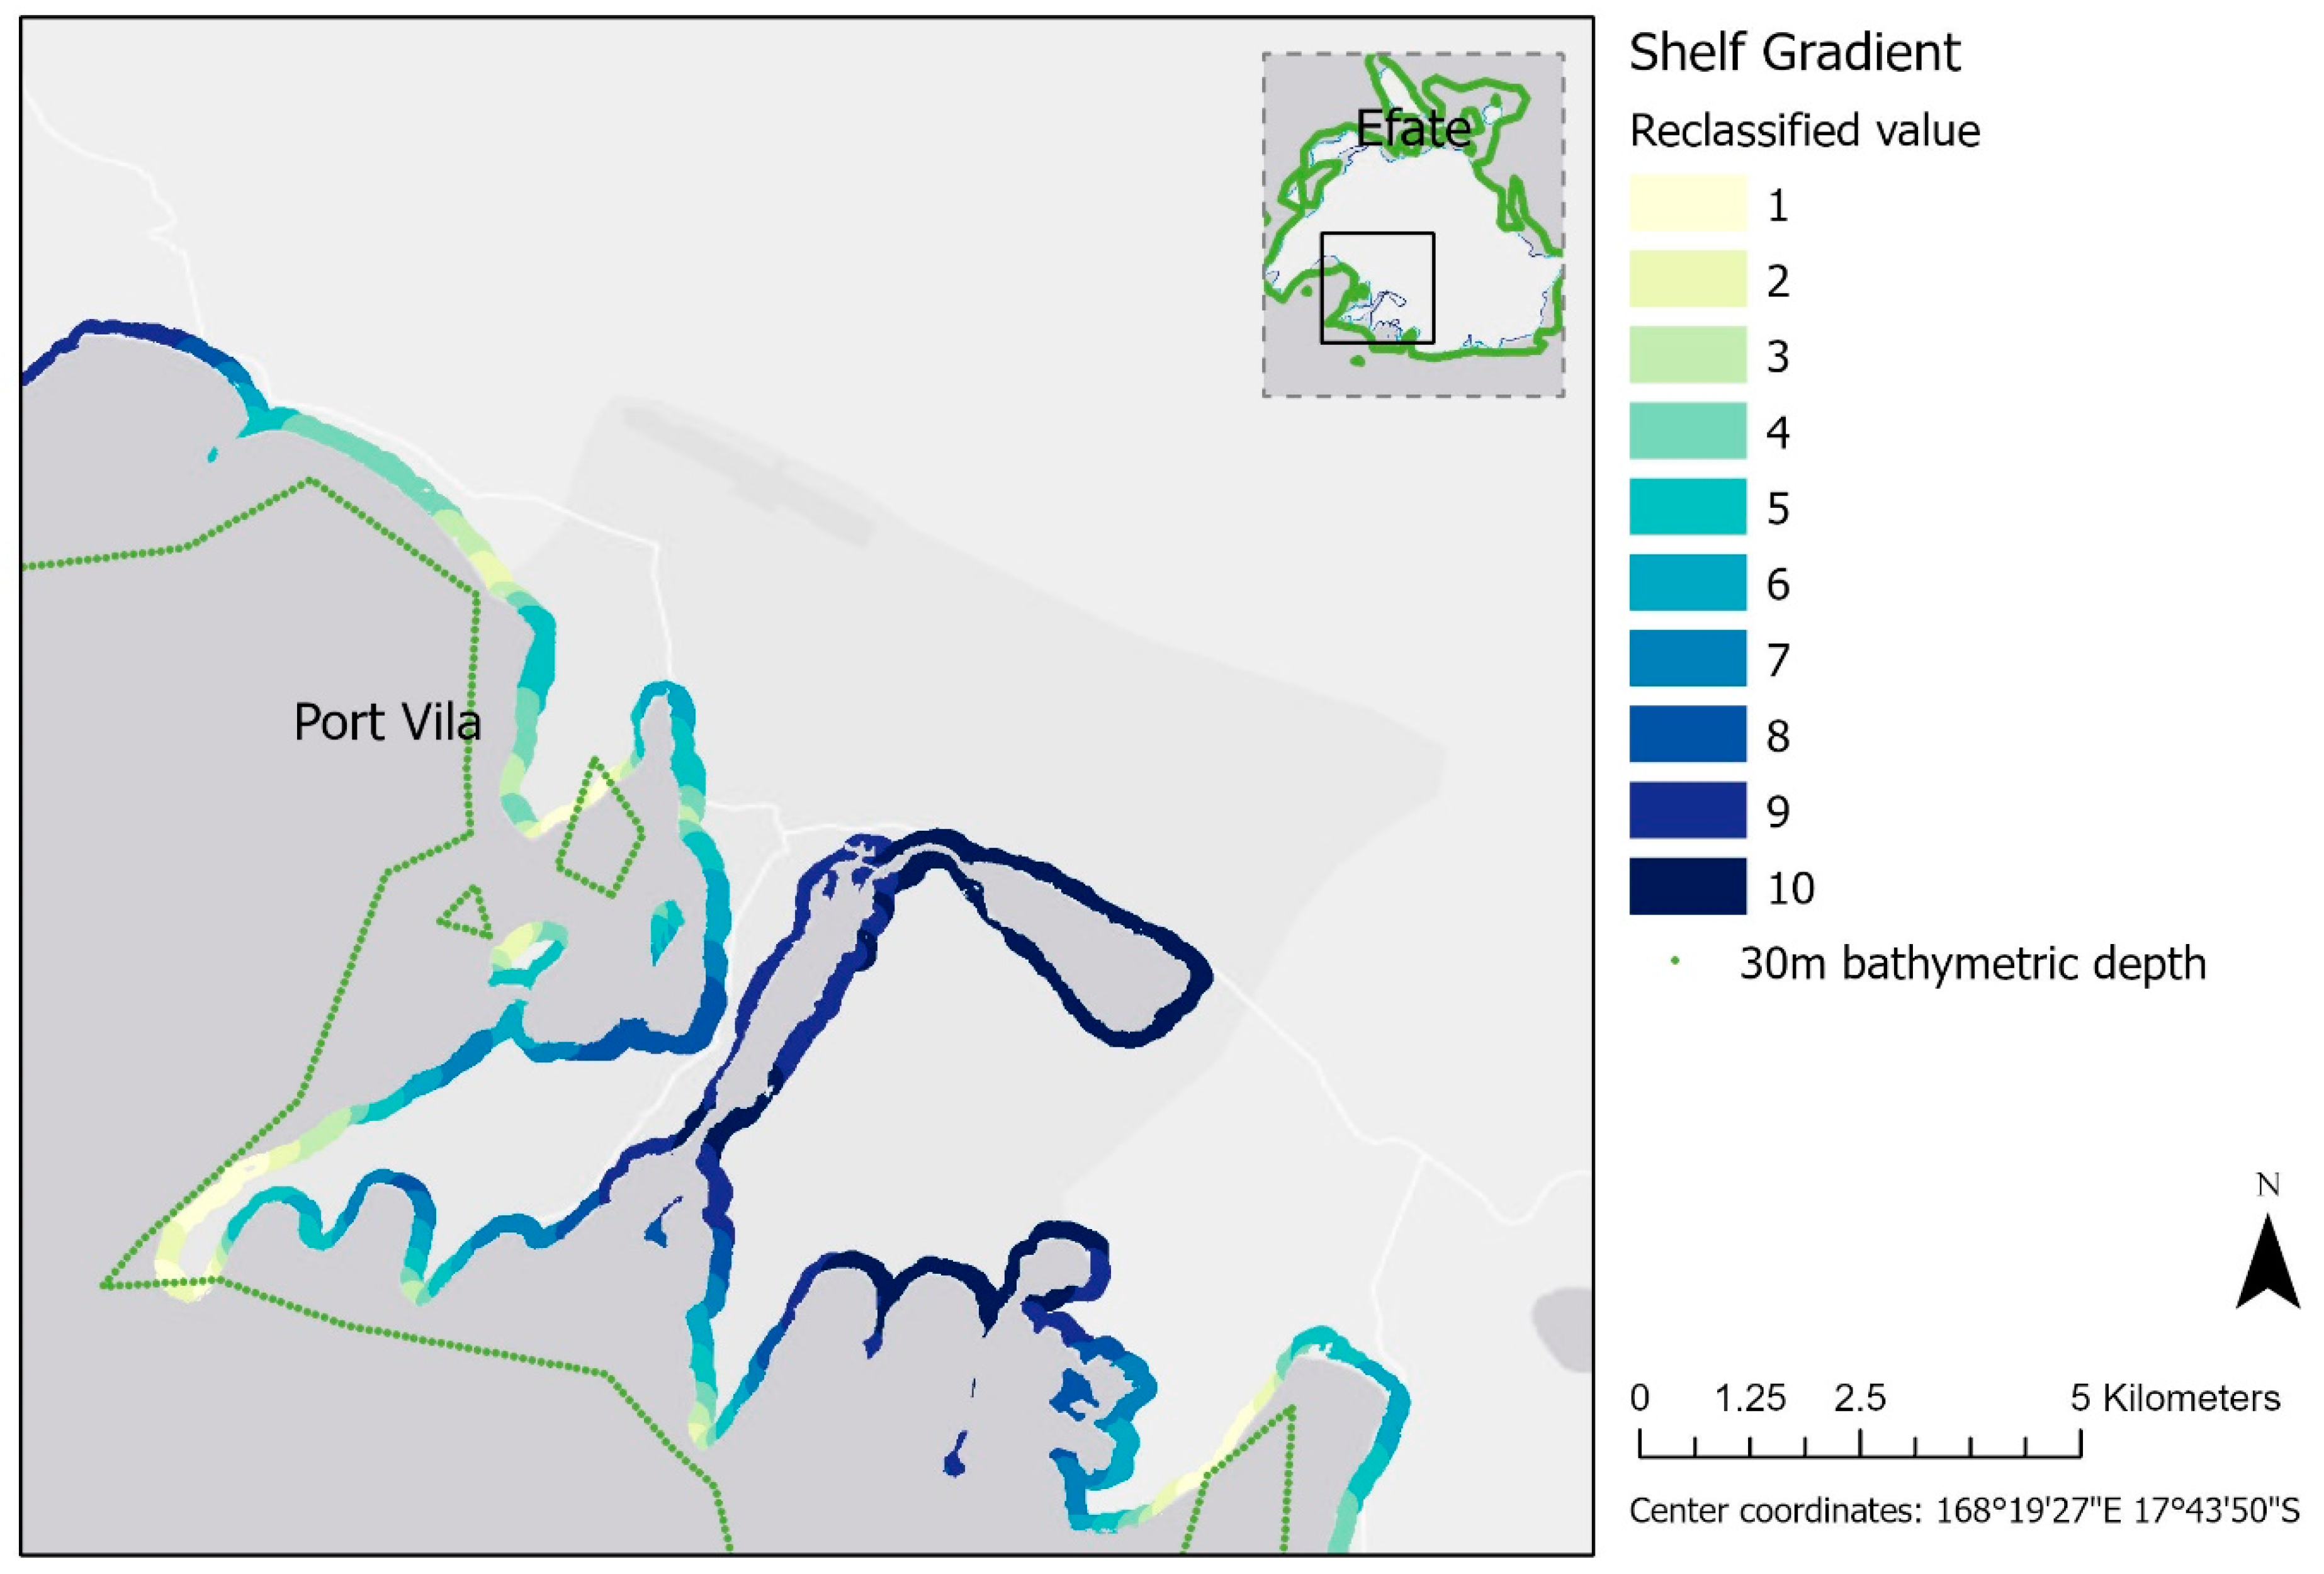
2.2.2. Storm Surge Hazard Indicators
2.2.3. Exposure and Vulnerability Indicators
2.3. Outline of Method
3. Results and Discussion
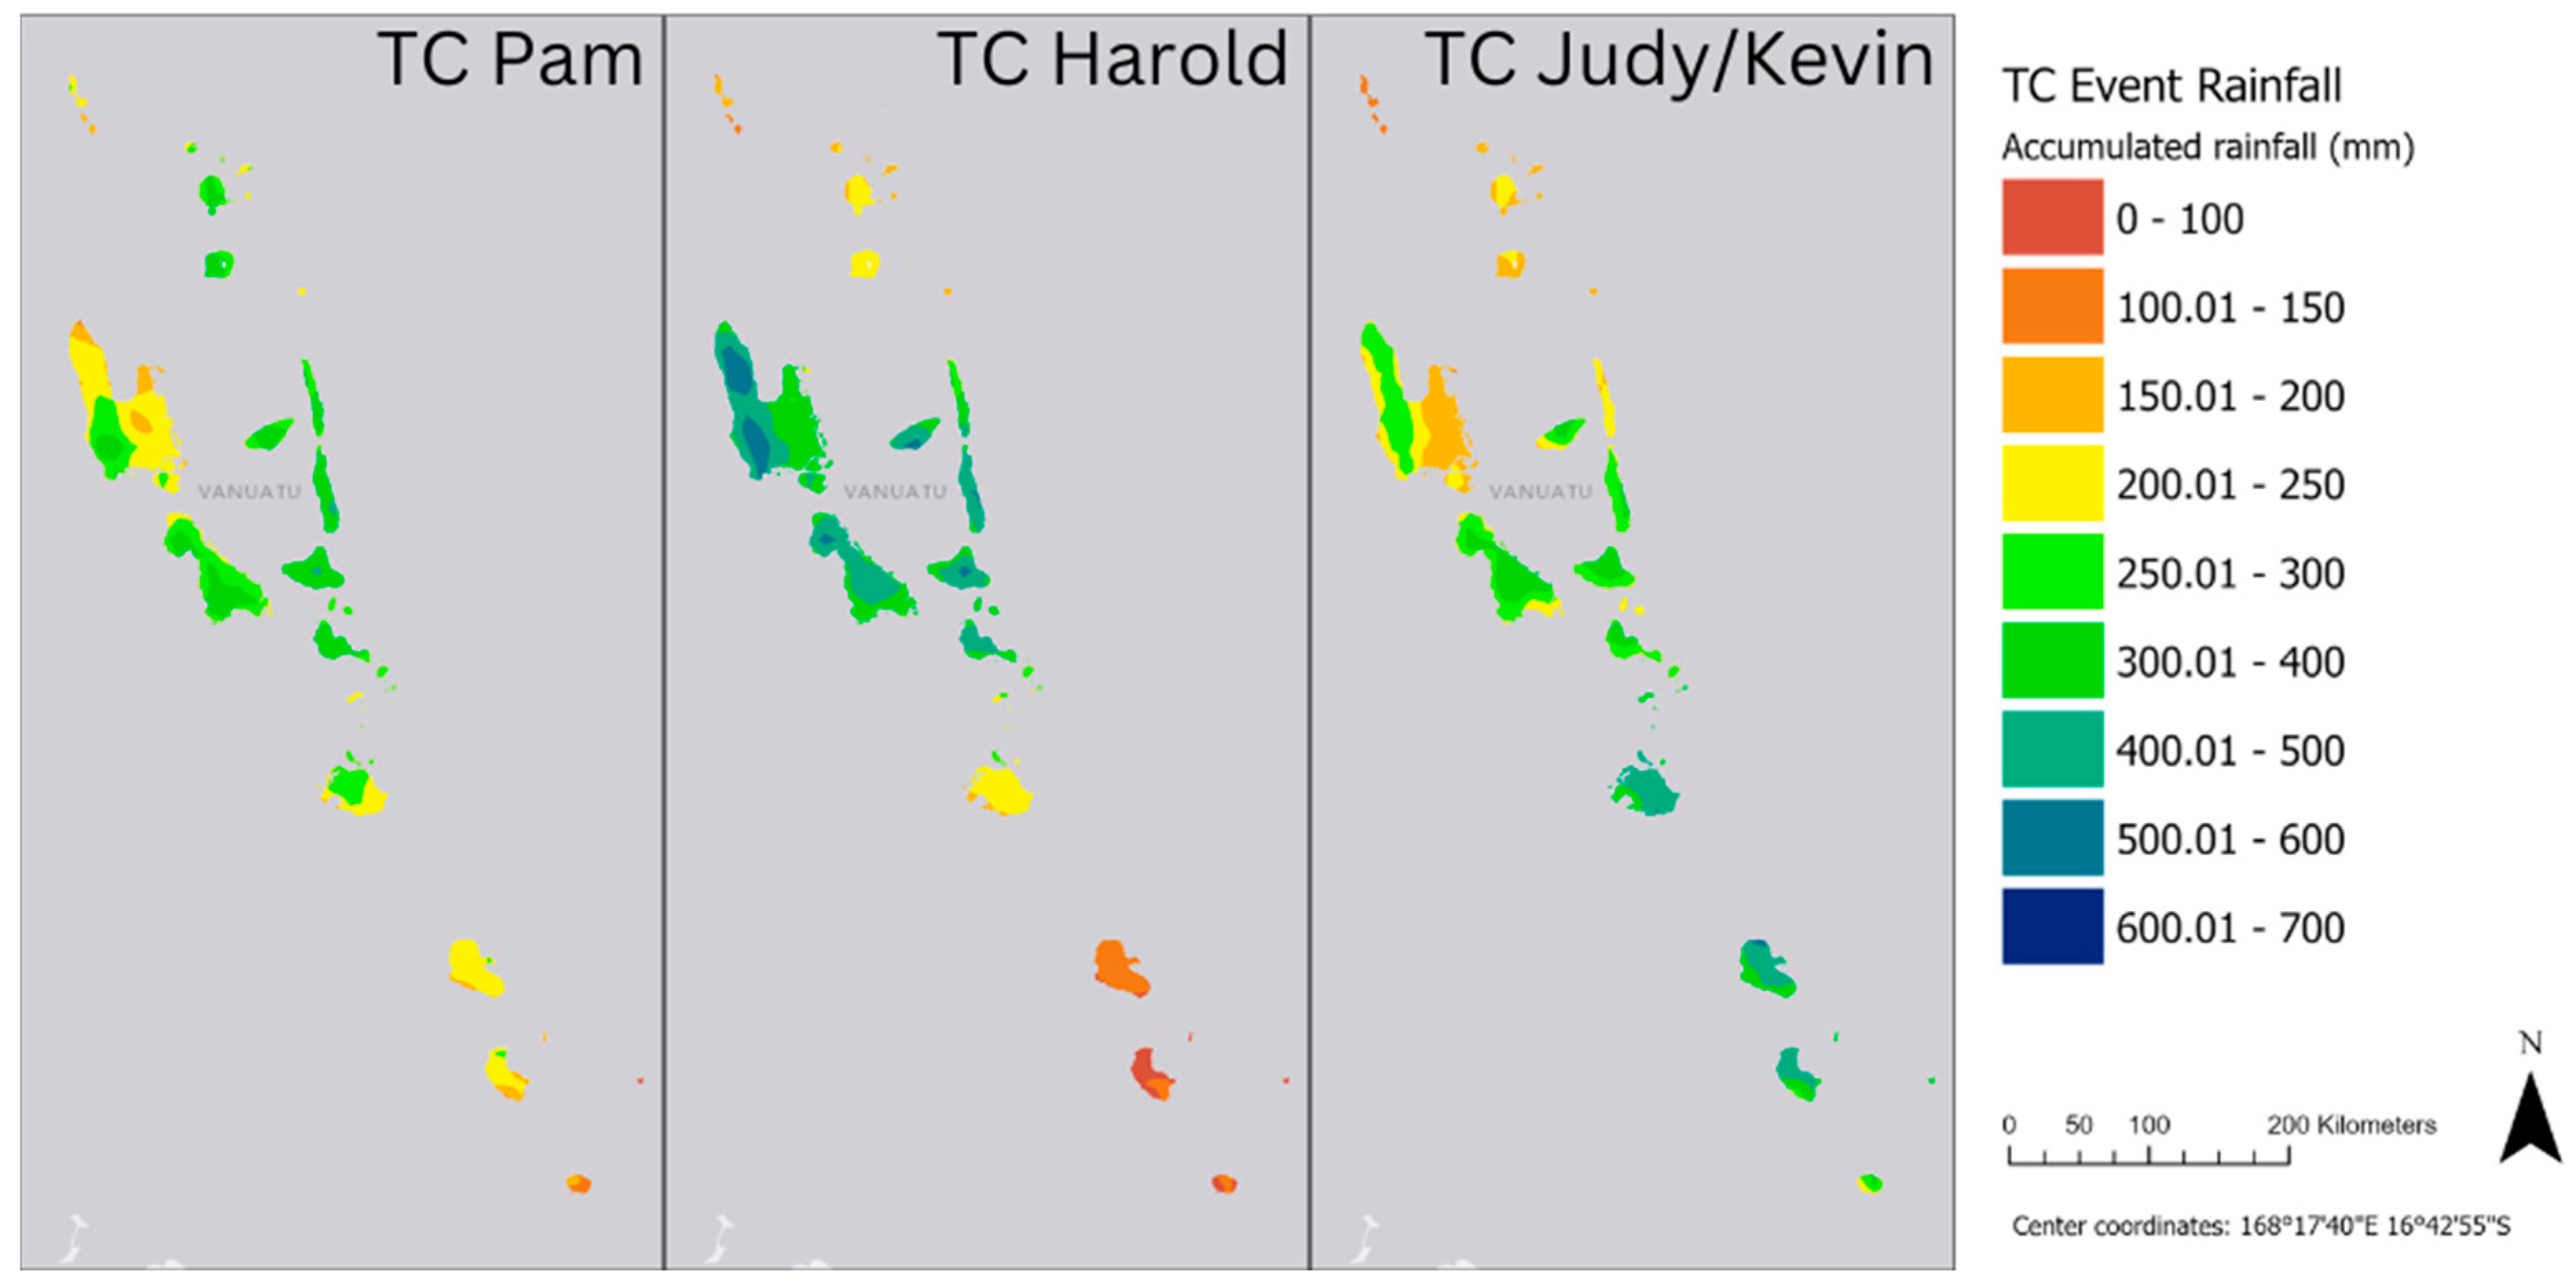
3.1. Flood Hazard
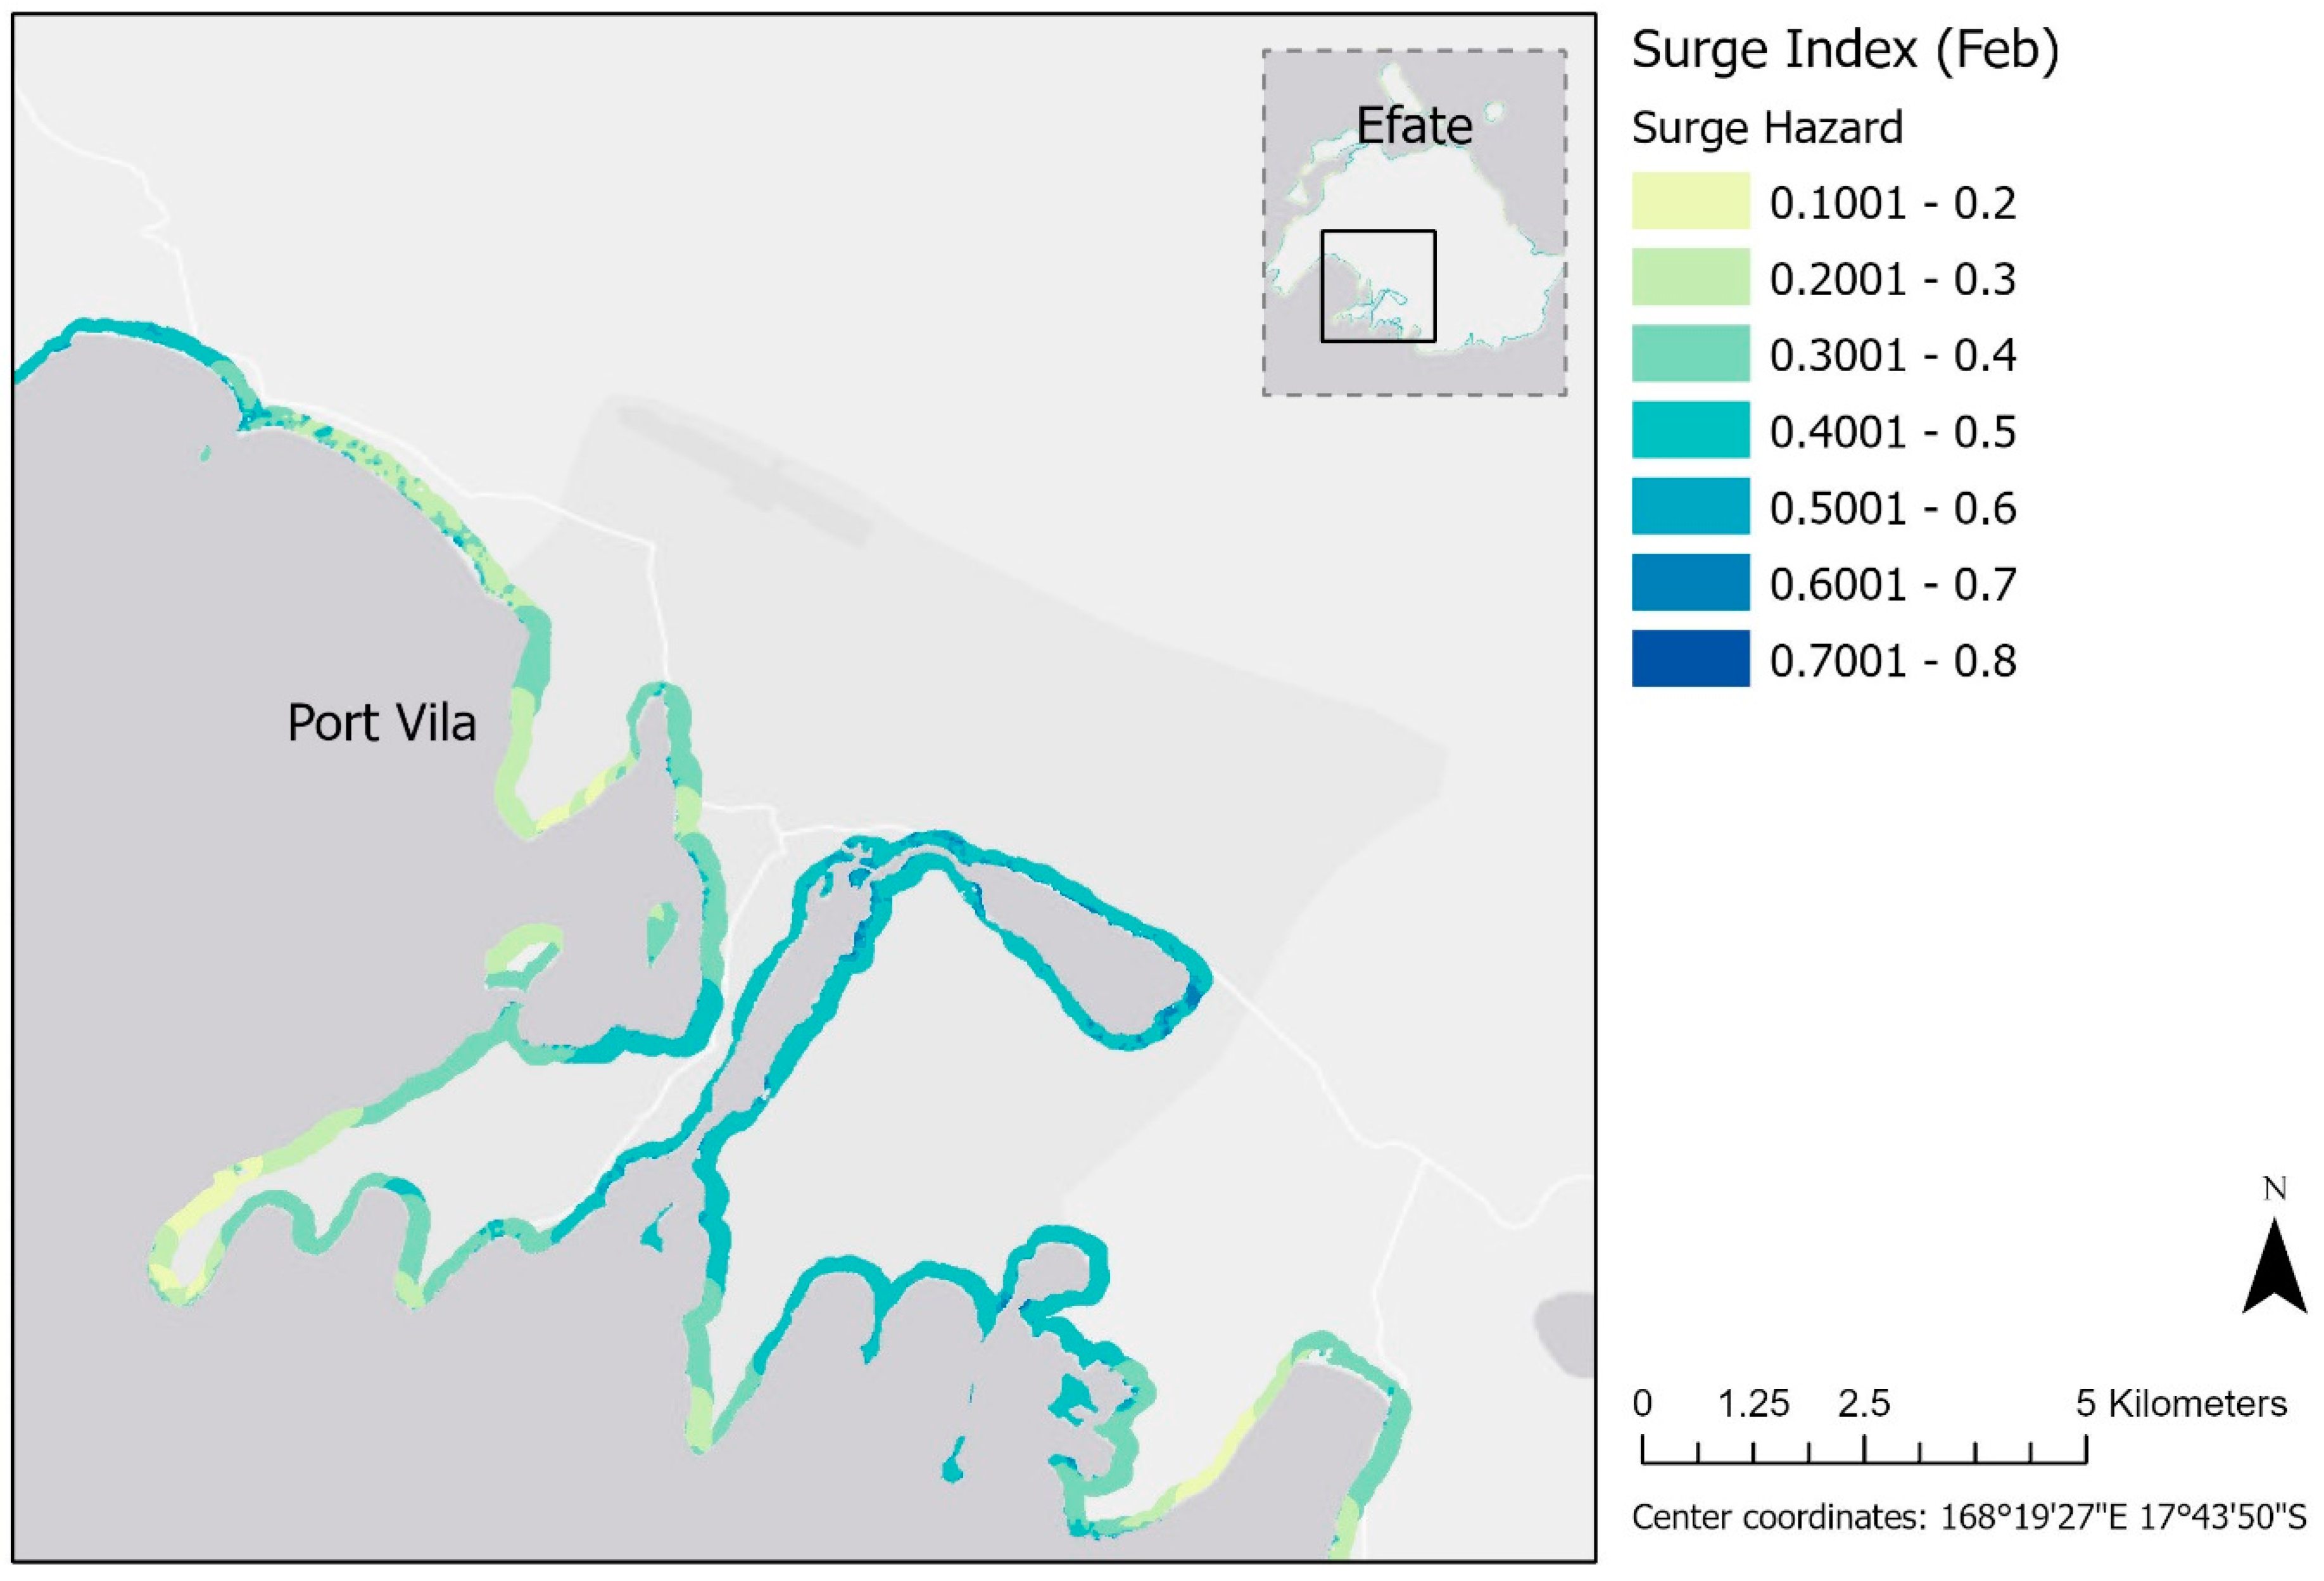
3.2. Surge Hazard
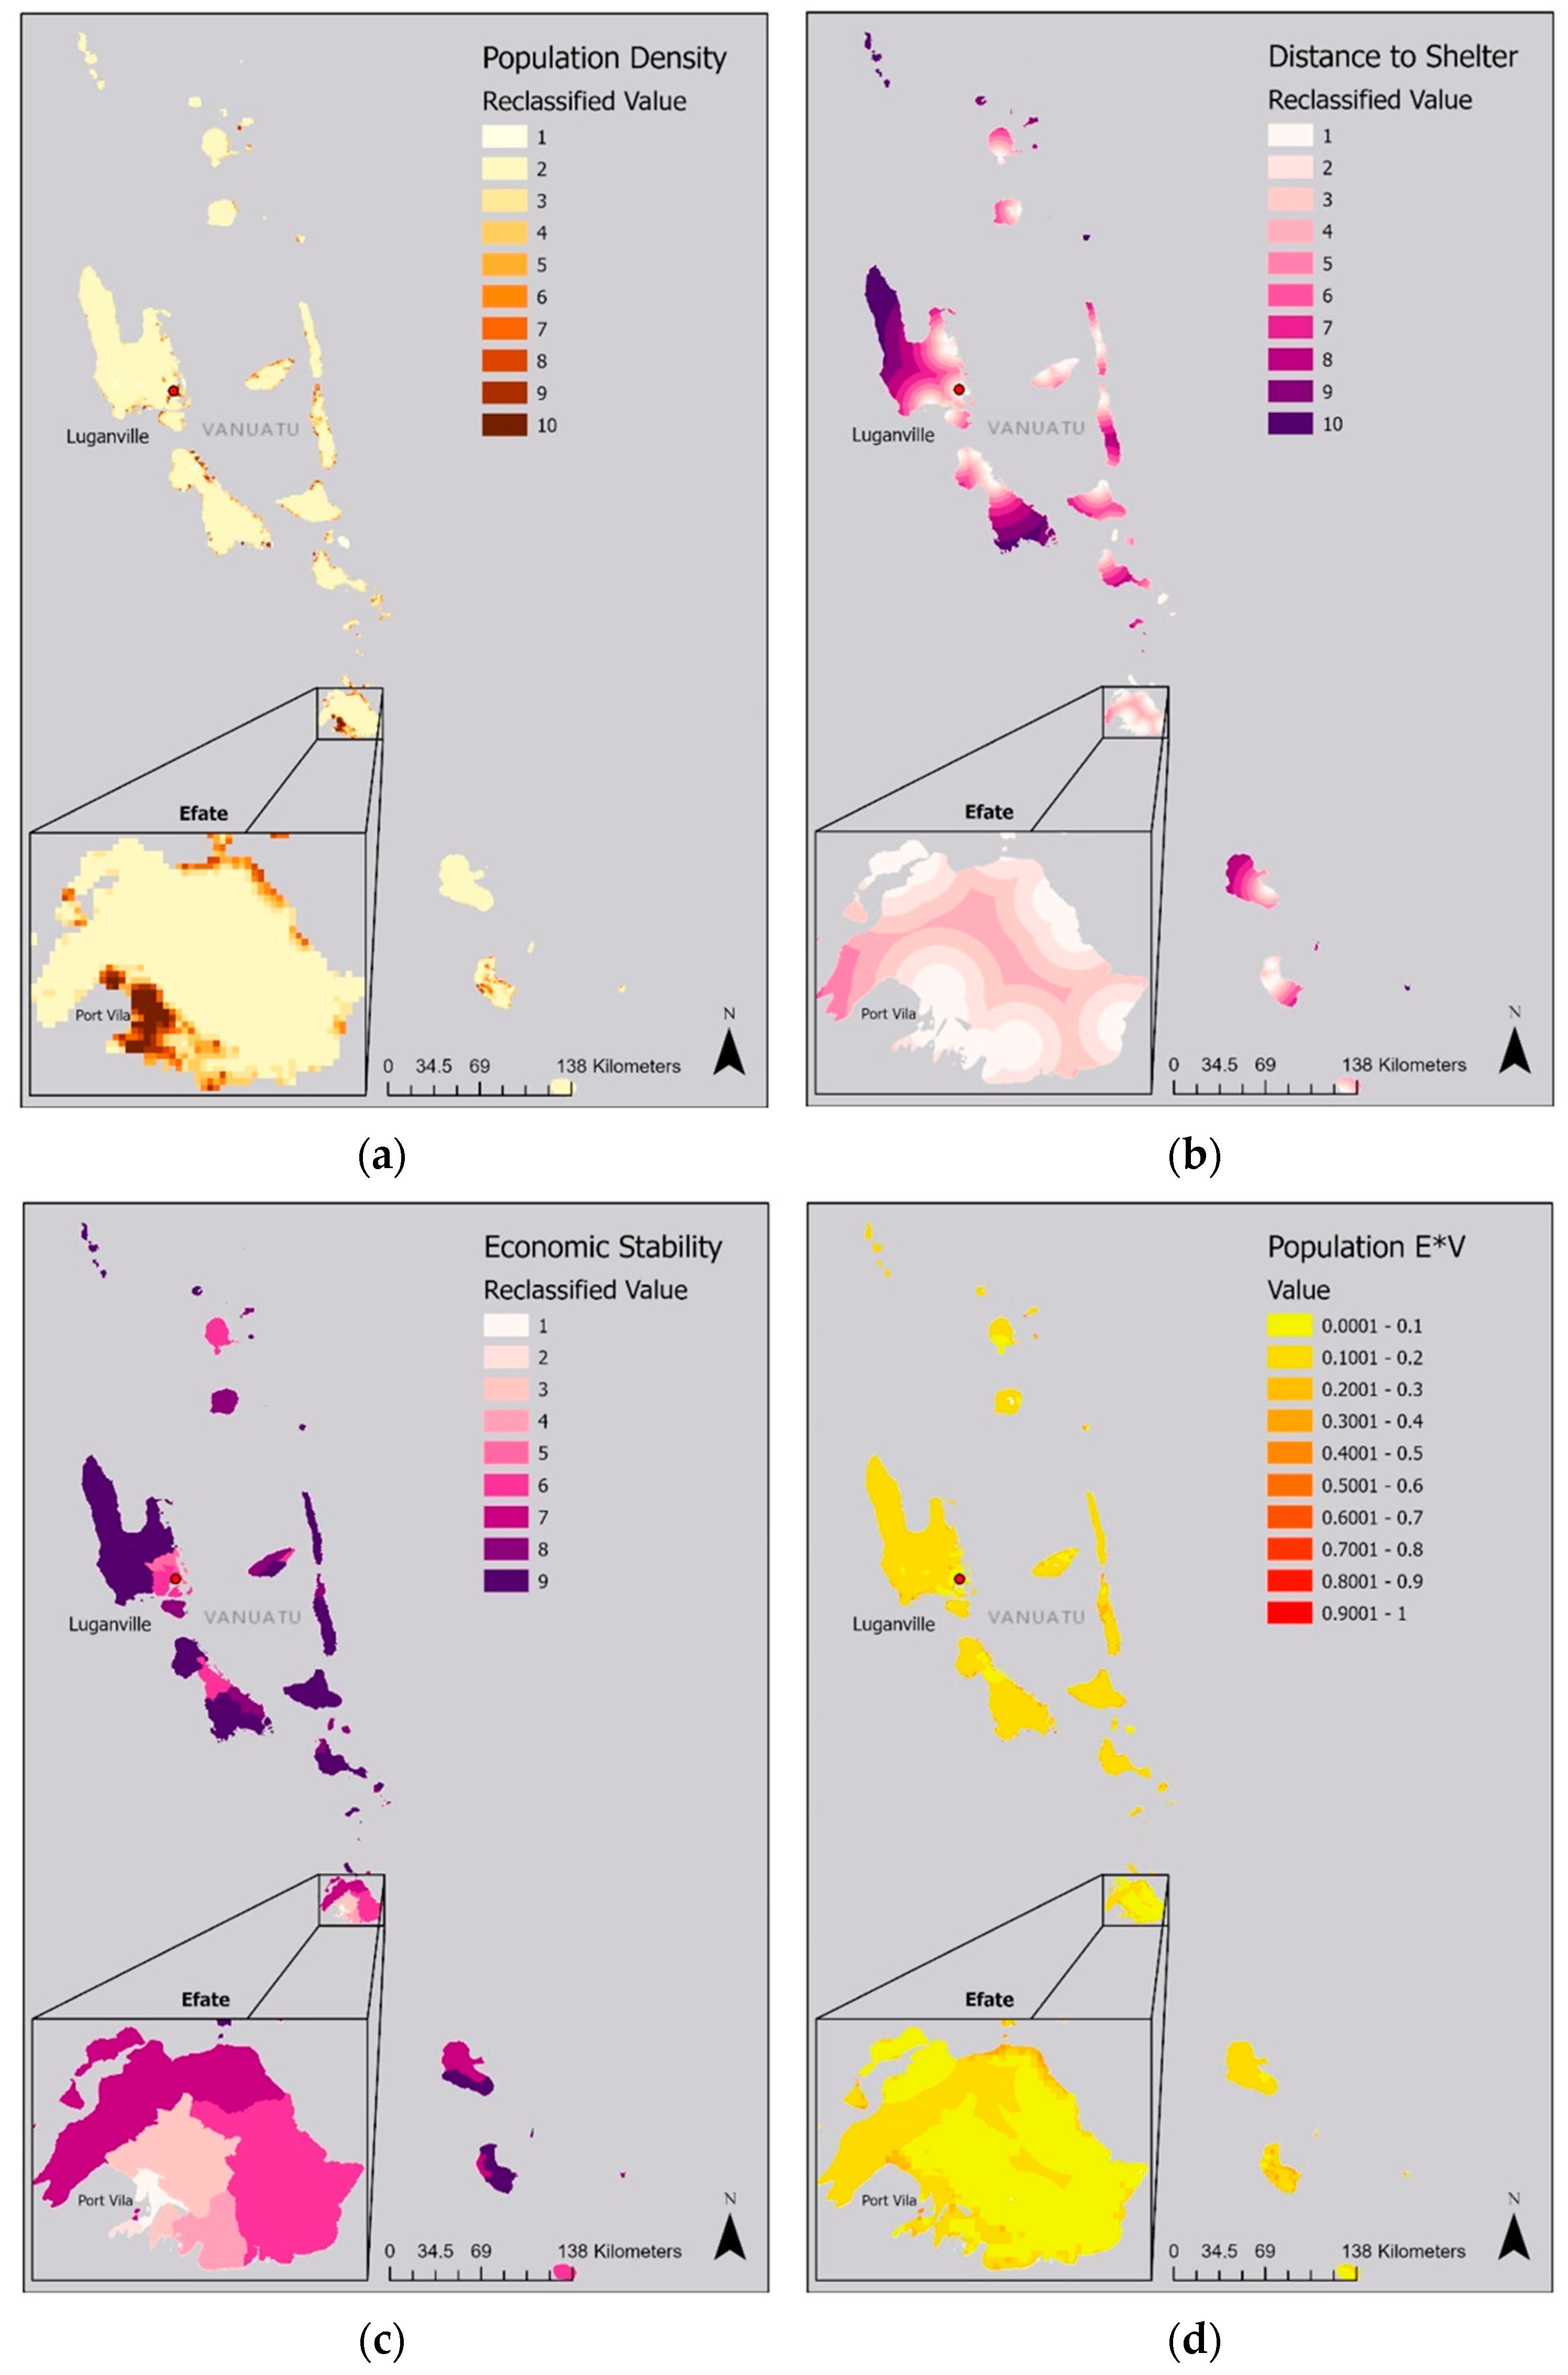
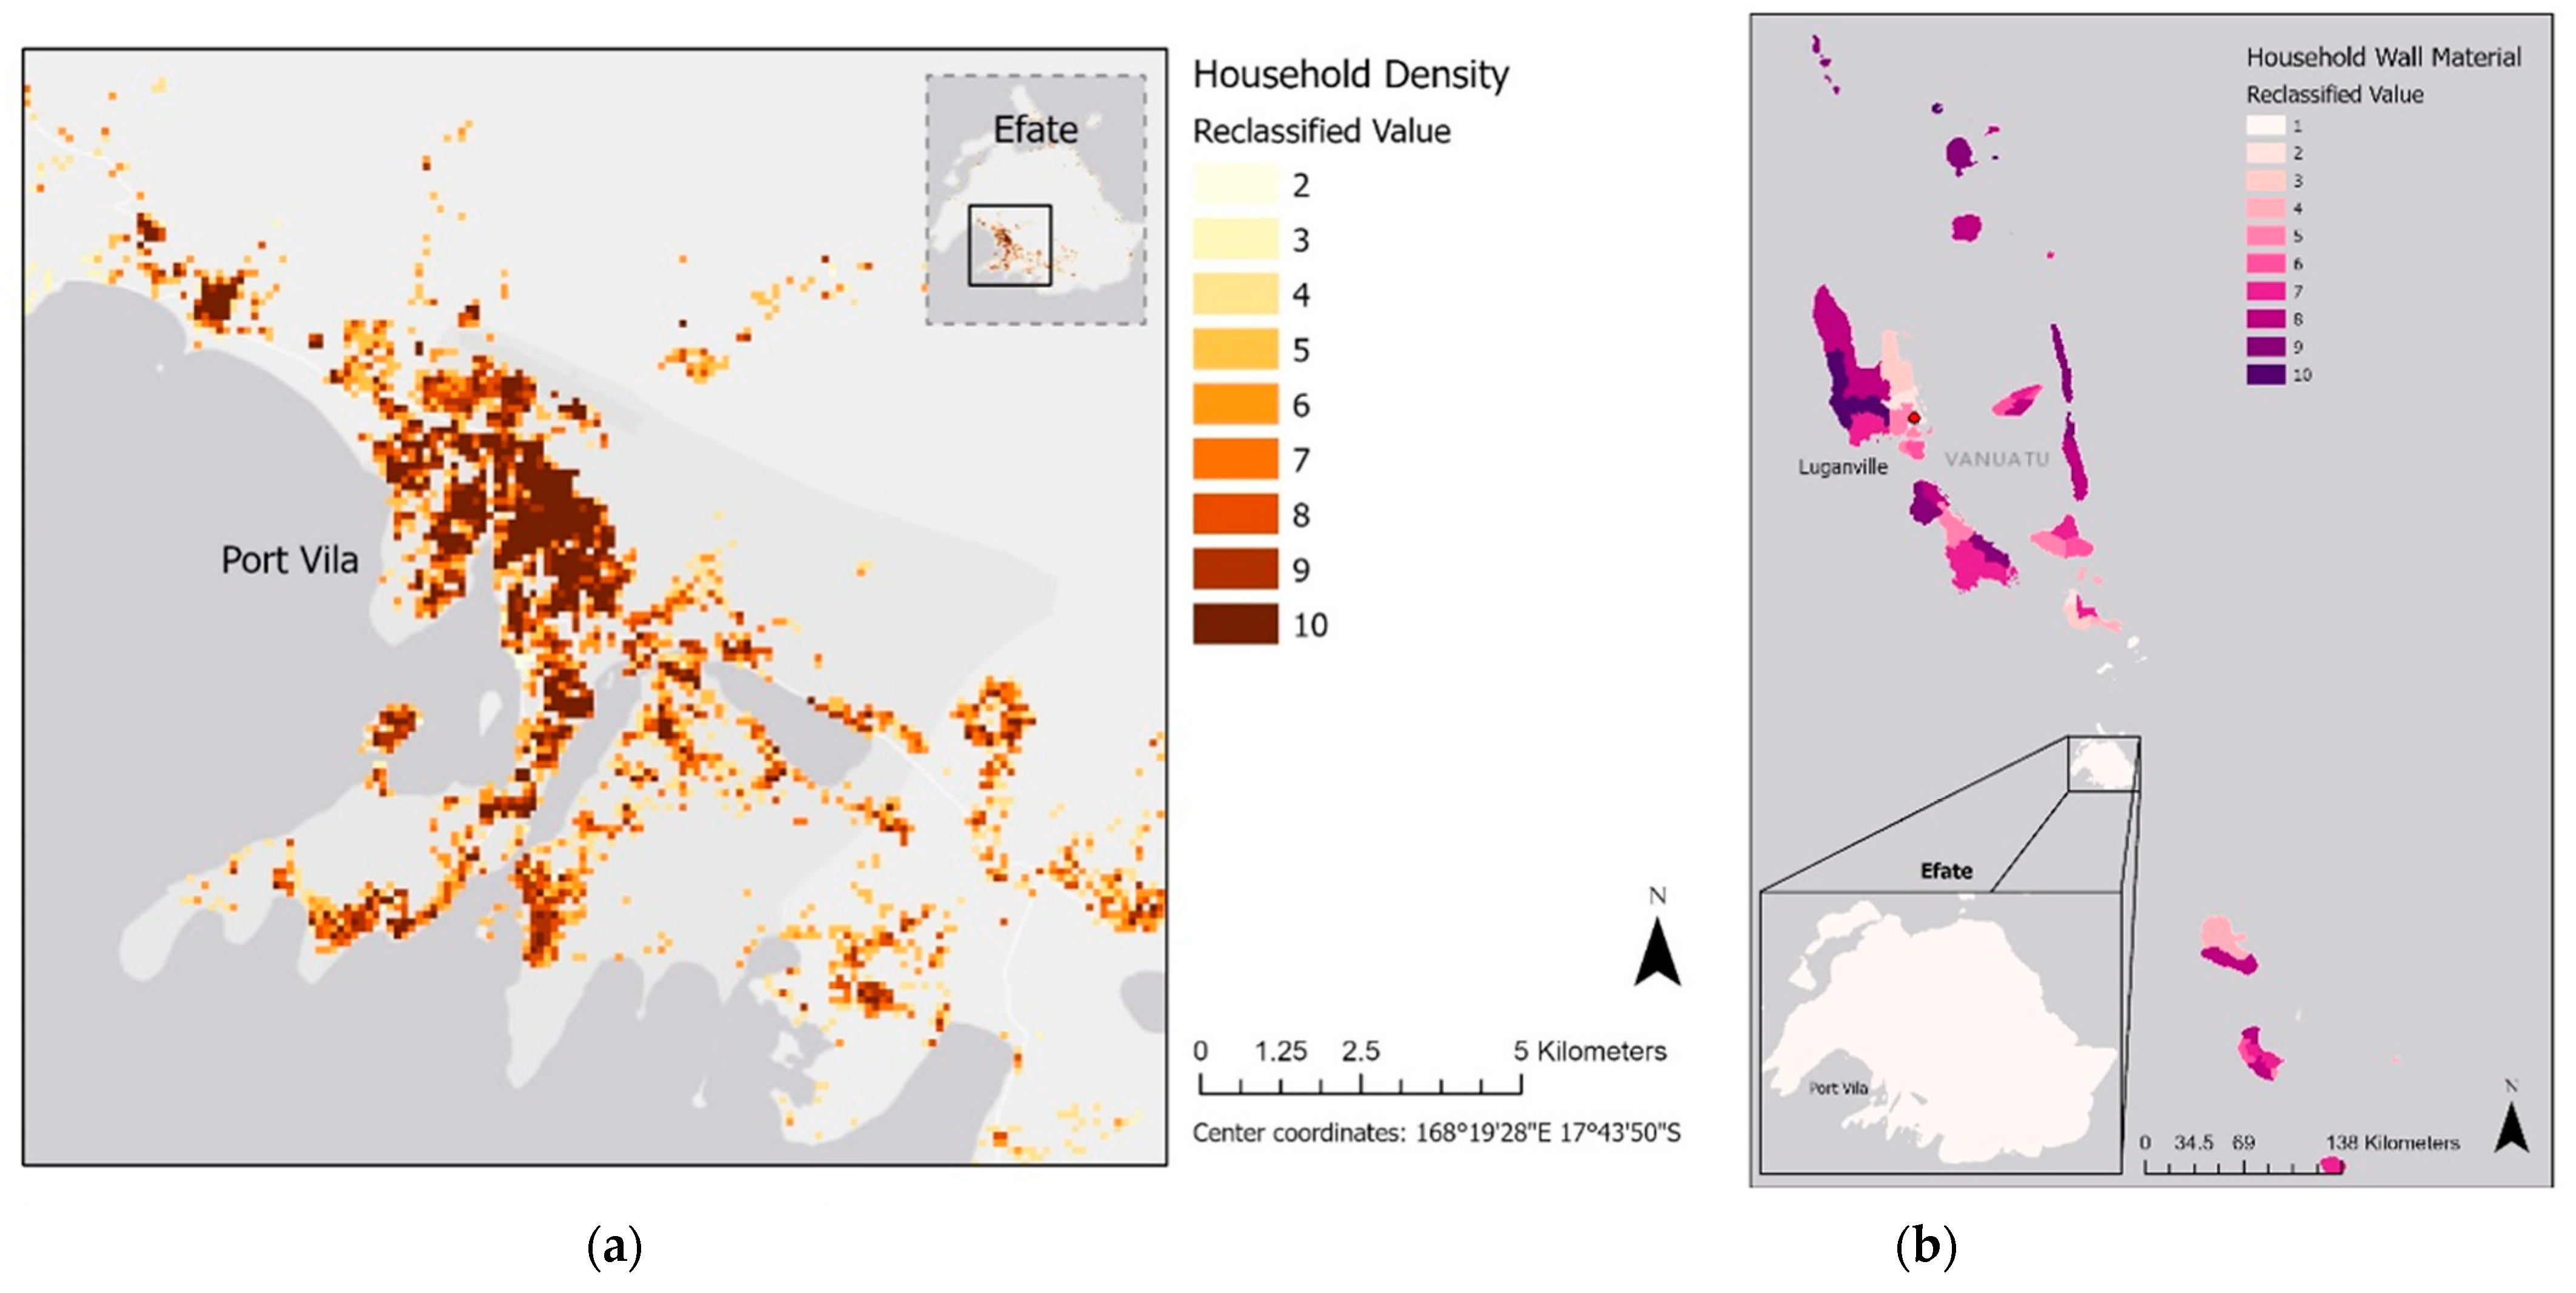
3.3. Exposure and Vulnerability
3.3.1. Population Domain
3.3.2. Population Domain
3.3.3. Road Domain
3.4. Risk Assessment
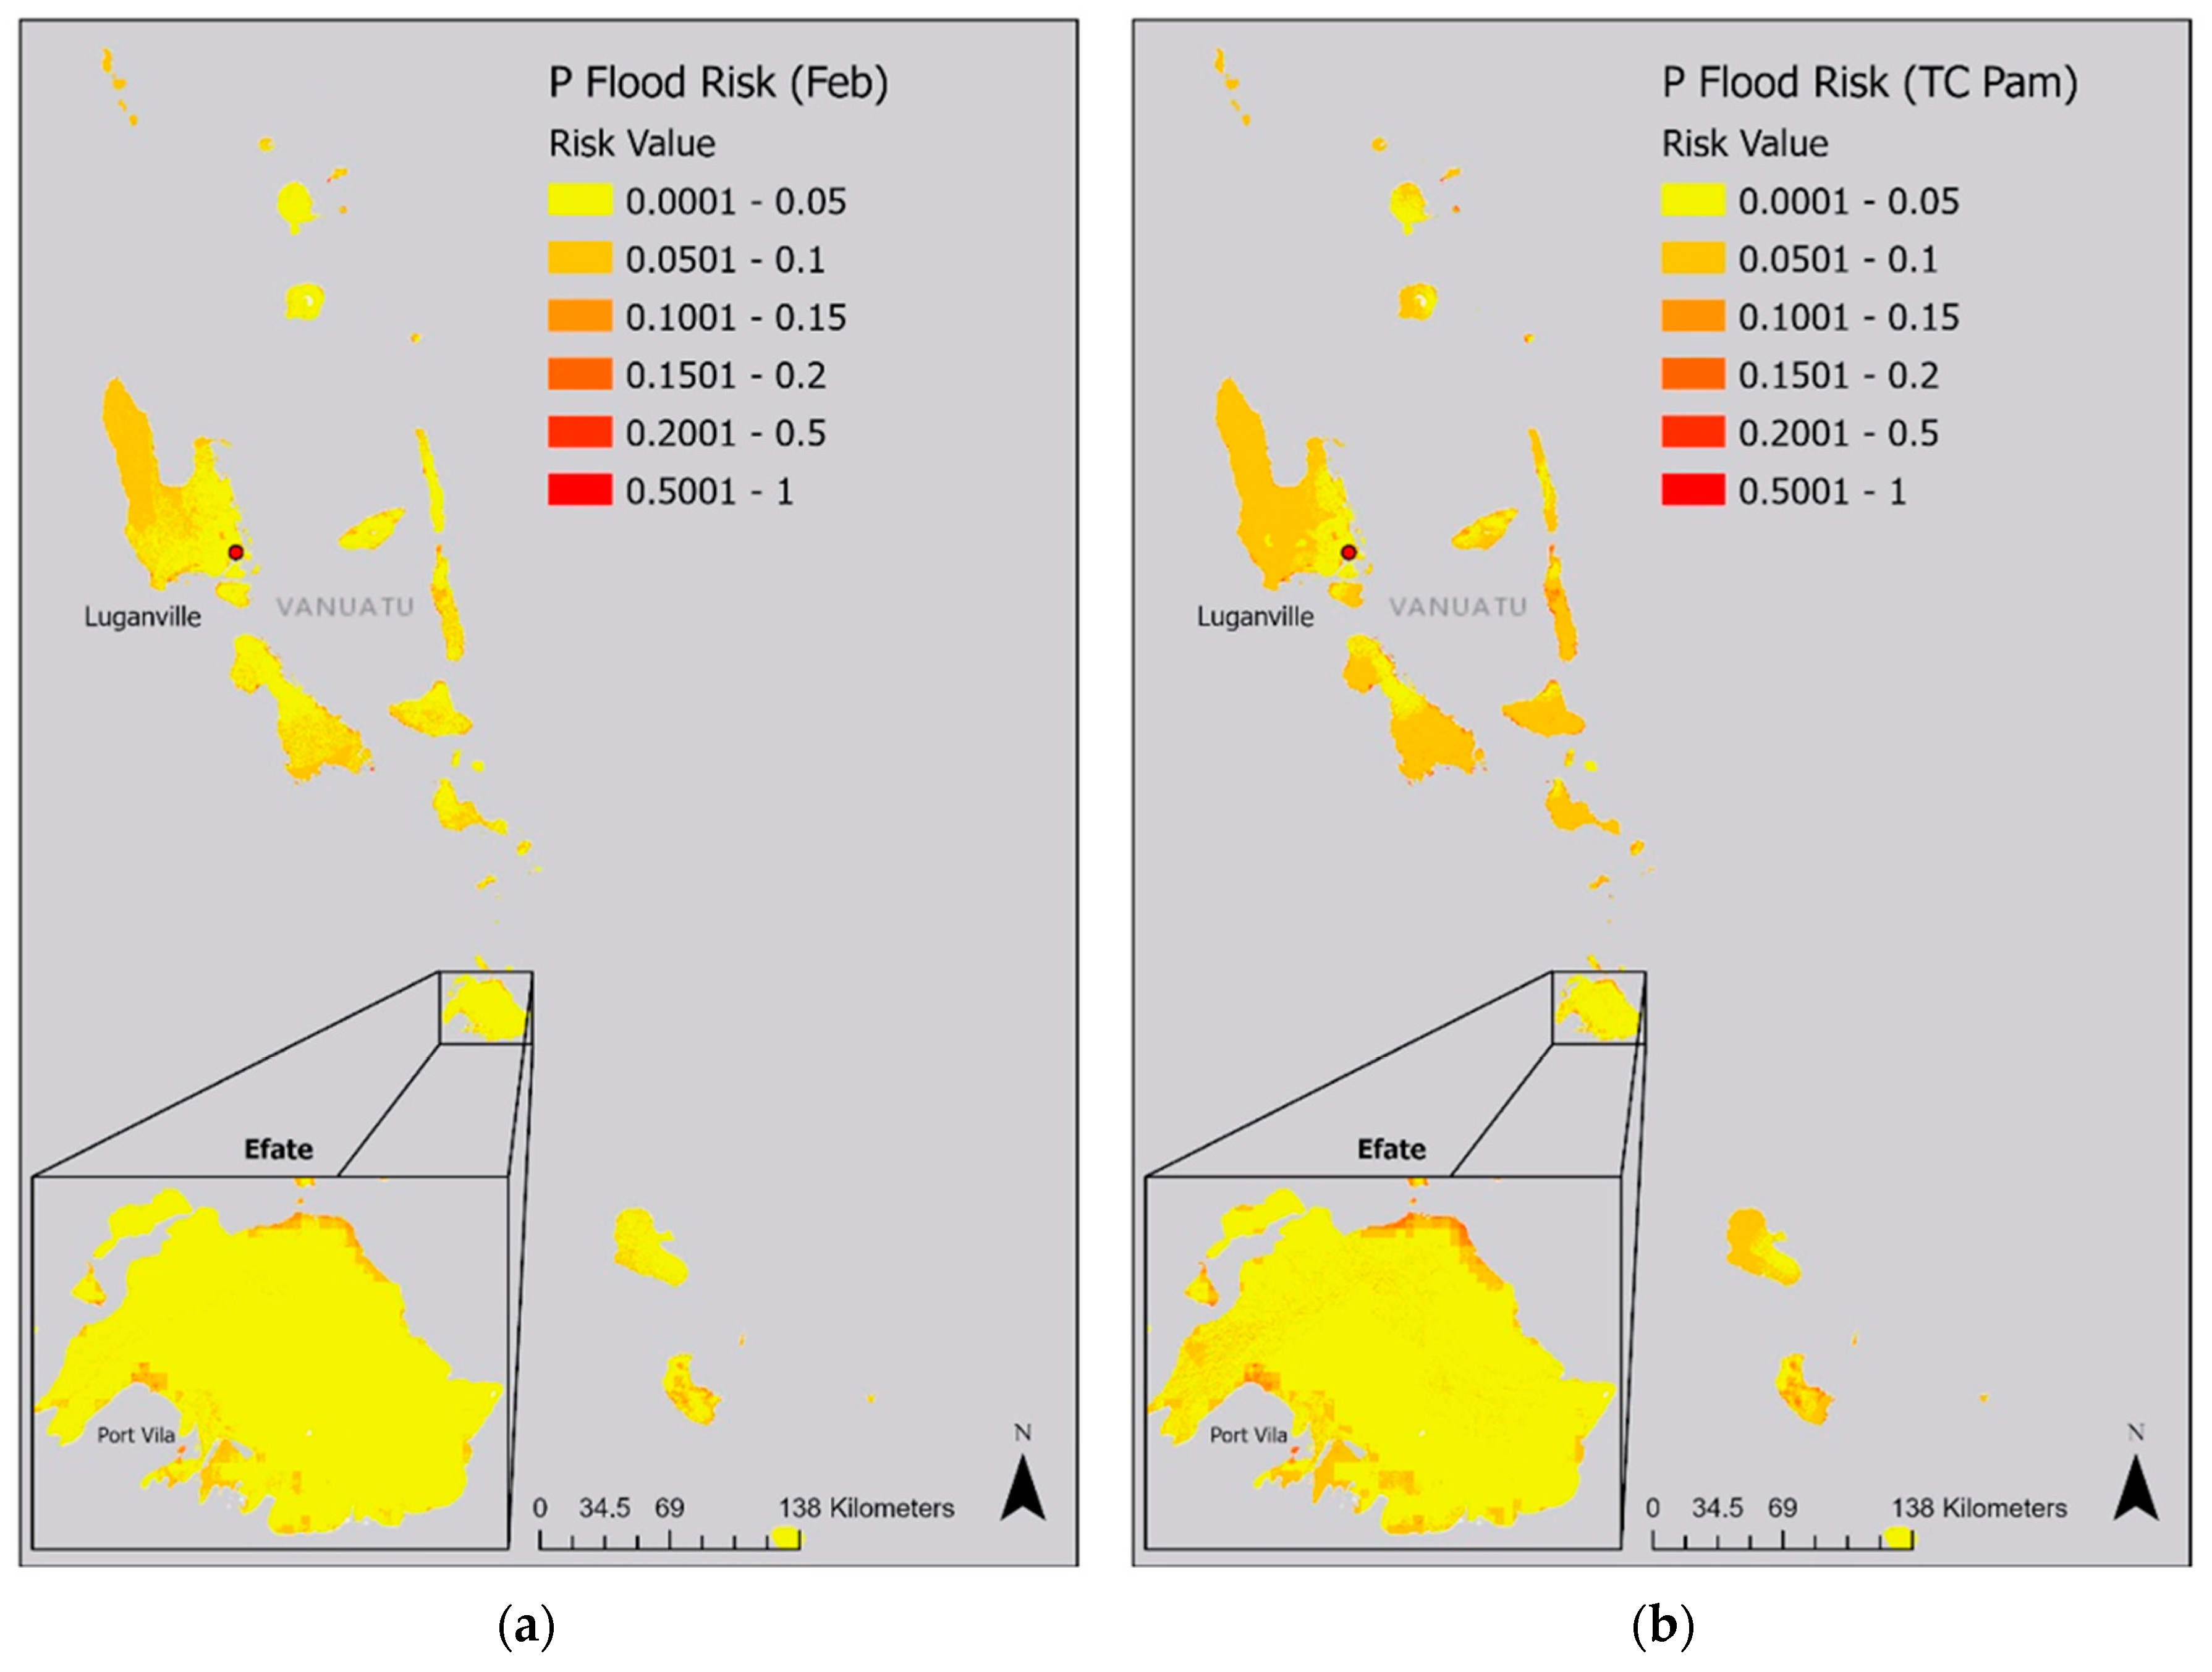
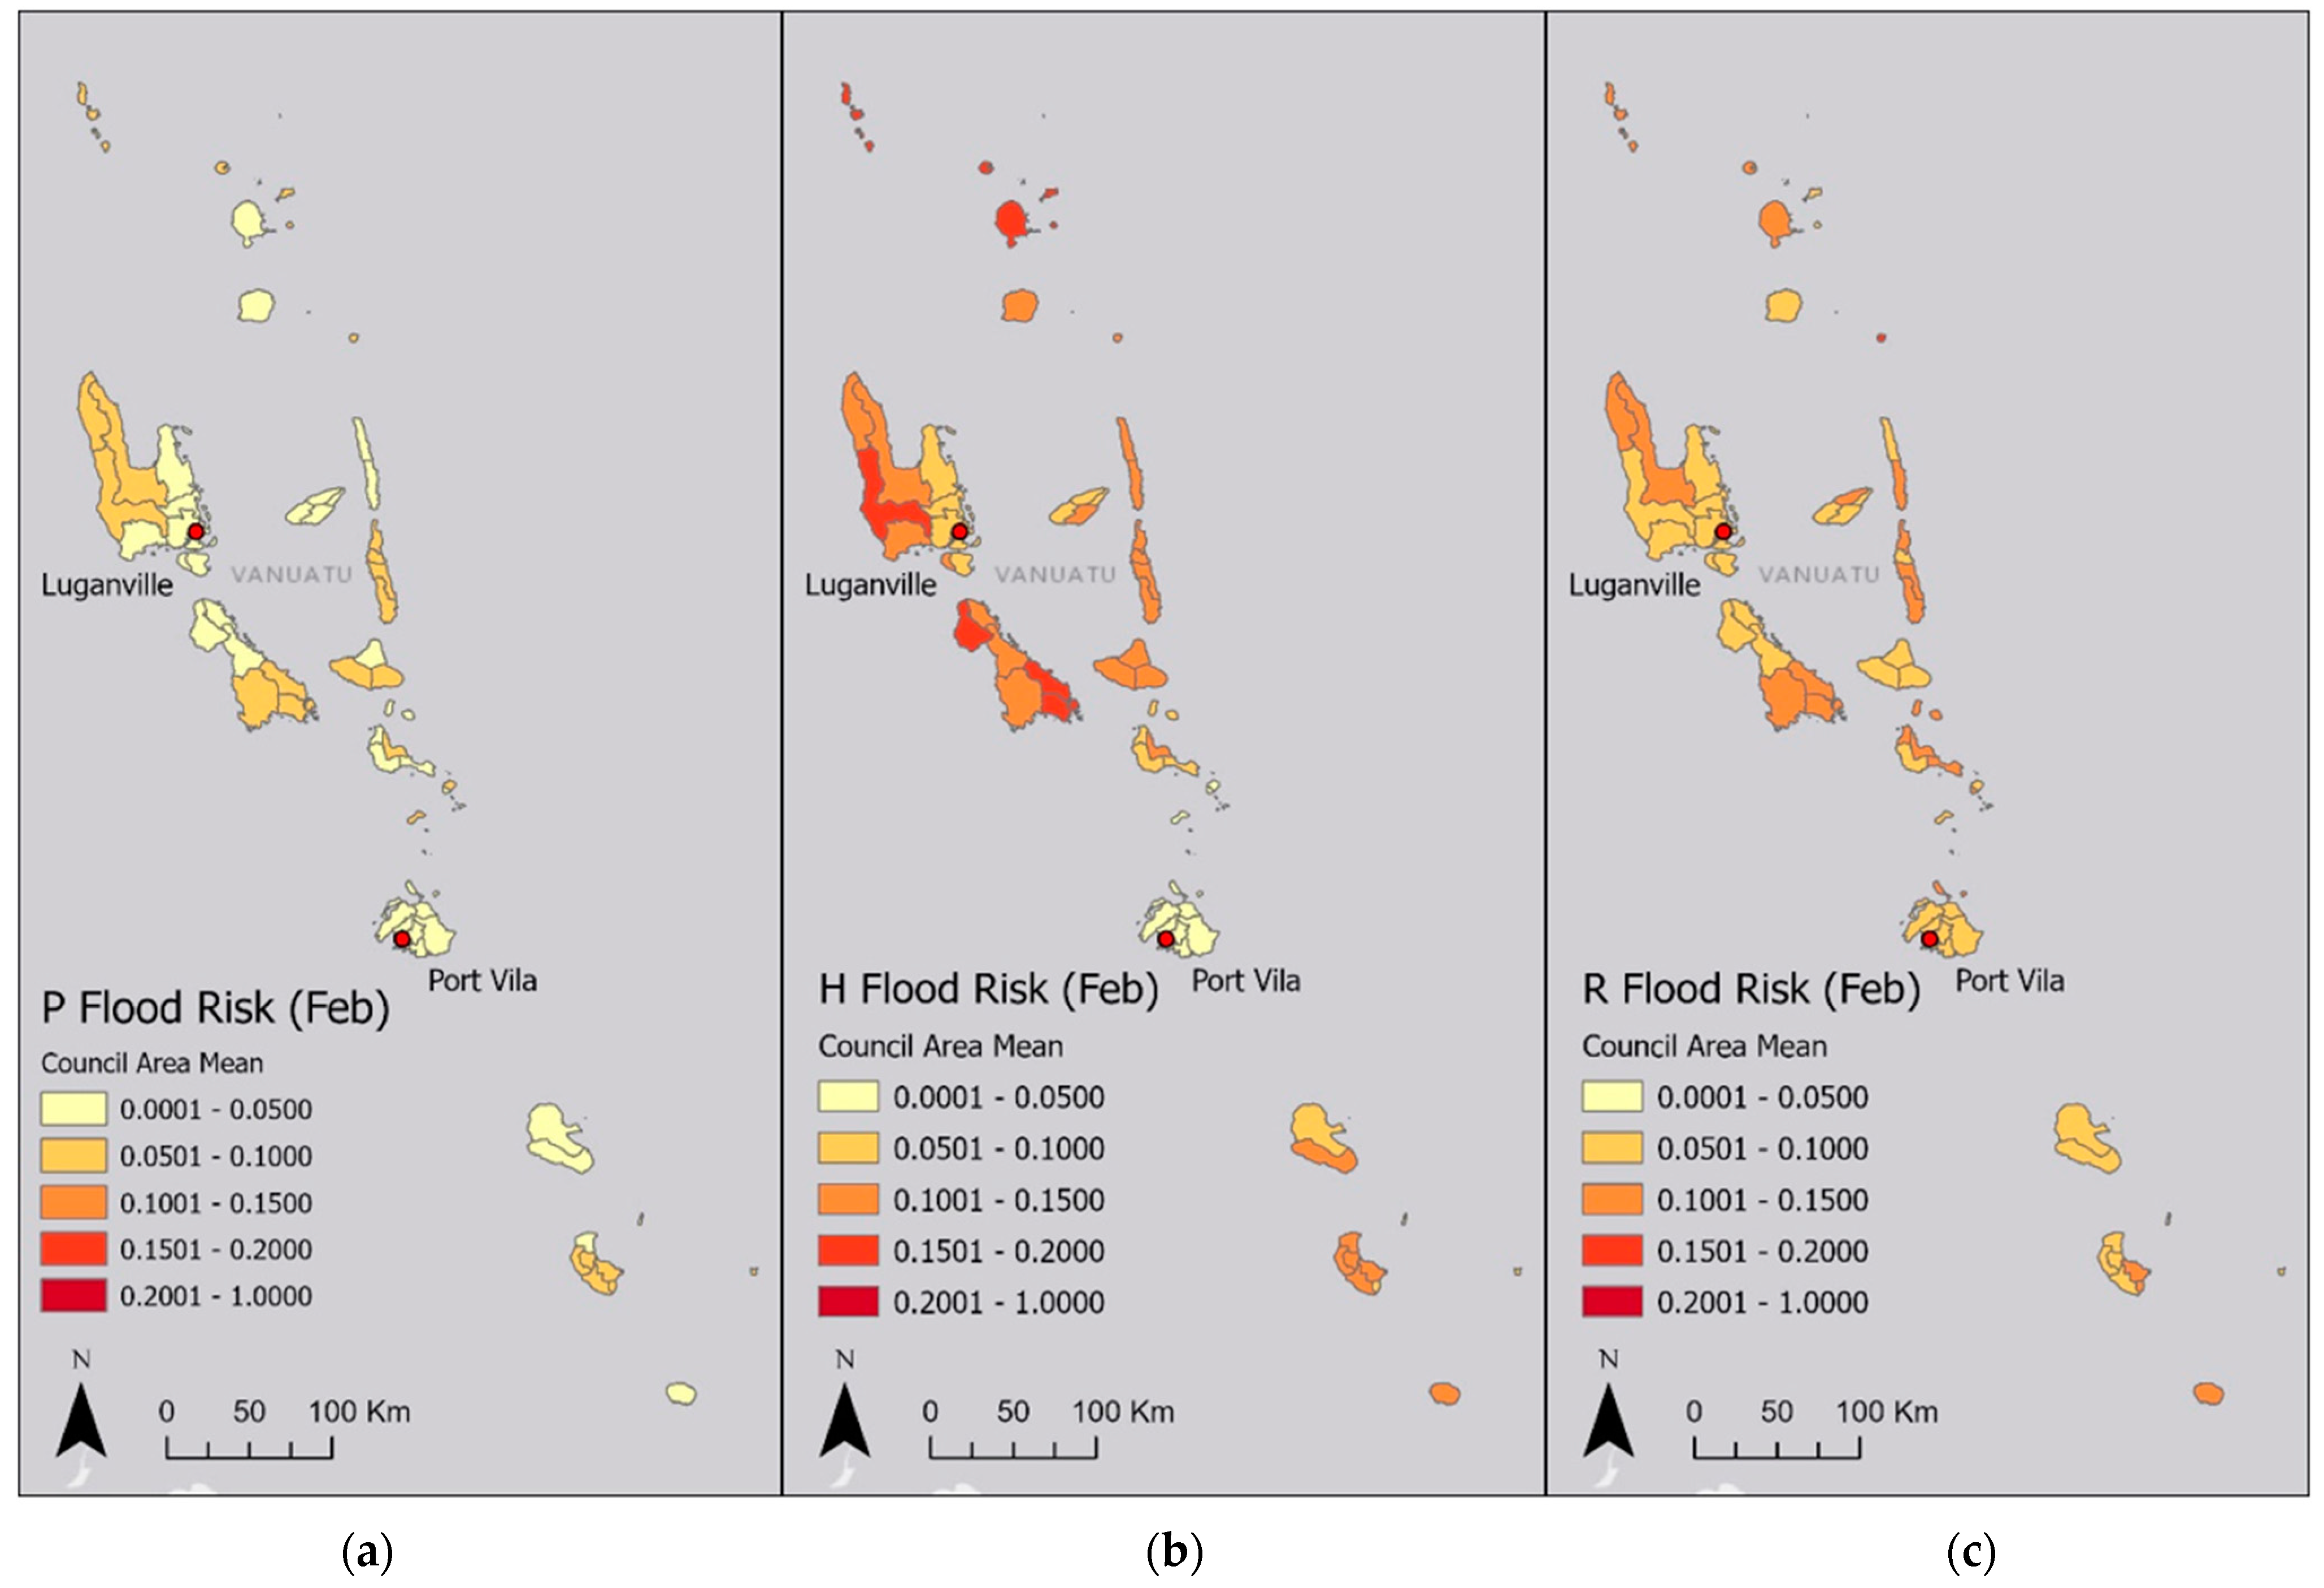
3.4.1. Flood Risk
3.4.2. Surge Risk
3.5. Further Discussion
4. Conclusions
Author Contributions
Funding
Data Availability Statement
Acknowledgments
Conflicts of Interest
References
- World Meteorological Organisation. Tropical Cyclones. Available online: https://wmo.int/topics/tropical-cyclone (accessed on 12 April 2024).
- Mendelsohn, R.; Emanuel, K.; Chonabayashi, S.; Bakkensen, L. The impact of climate change on global tropical cyclone damage. Nat. Clim. Chang. 2012, 2, 205–209. [Google Scholar] [CrossRef]
- Knutson, T.; Camargo, S.J.; Chan, J.C.L.; Emanuel, K.; Ho, C.-H.; Kossin, J.; Mohapatra, M.; Satoh, M.; Sugi, M.; Walsh, K.; et al. Tropical Cyclones and Climate Change Assessment: Part II: Projected Response to Anthropogenic Warming. Bull. Am. Meteorol. Soc. 2020, 101, E303–E322. [Google Scholar] [CrossRef]
- Deng, Z.; Wang, Z.; Wu, X.; Lai, C.; Zeng, Z. Strengthened tropical cyclones and higher flood risk under compound effect of climate change and urbanization across China’s Greater Bay Area. Urban Clim. 2022, 44, 101224. [Google Scholar] [CrossRef]
- Scawthorn, C.; Schneider, P.J.; Schauer, B.A. Natural hazards—The multihazard approach. Nat. Hazards Rev. 2006, 7, 39. [Google Scholar] [CrossRef]
- Burston, J.M.; Taylor, D.; Dent, J.; Churchill, J. Australia-wide tropical cyclone multi-hazard risk assessment. In Proceedings of the Coasts and Ports 2017, Cairns, Australia, 21–23 June 2017; pp. 185–191. [Google Scholar]
- Sahoo, B.; Bhaskaran, P.K. Multi-hazard risk assessment of coastal vulnerability from tropical cyclones—A GIS based approach for the Odisha coast. J. Environ. Manag. 2018, 206, 1166–1178. [Google Scholar] [CrossRef]
- Eberenz, S.; Lüthi, S.; Bresch, D.N. Regional tropical cyclone impact functions for globally consistent risk assessments. Nat. Hazards Earth Syst. Sci. 2021, 21, 393–415. [Google Scholar] [CrossRef]
- National Research Council. Hazard and Risk Assessment. In A Safer Future: Reducing Impacts Natural Disasters; National Research Council: Washington, DC, USA, 1991; Volume 2, pp. 13–16. [Google Scholar]
- Wang, C.; Zhang, H.; Ellingwood, B.R.; Guo, Y.; Mahmoud, H.; Li, Q. Assessing post-hazard damage costs to a community’s residential buildings exposed to tropical cyclones. Struct. Infrastruct. Eng. 2020, 17, 443–453. [Google Scholar] [CrossRef]
- Pant, R.; Thacker, S.; Hall, J.W.; Alderson, D.; Barr, S. Critical infrastructure impact assessment due to flood exposure. J. Flood Risk Manag. 2018, 11, 22–33. [Google Scholar] [CrossRef]
- Do, C.; Saunders, G.E.; Kuleshov, Y. Assessment of tropical cyclone risk to coral reefs: Case study for Australia. Remote Sens. 2022, 14, 6150. [Google Scholar] [CrossRef]
- Ivčević, A.; Mazurek, H.; Siame, L.; Moussa, A.B.; Bellier, O. Indicators in risk management: Are they a user-friendly interface between natural hazards and societal responses? Challenges and opportunities after UN Sendai conference in 2015. Int. J. Disaster Risk Reduct. 2019, 41, 101301. [Google Scholar] [CrossRef]
- Rumpf, J.; Weindl, H.; Höppe, P.; Rauch, E.; Schmidt, V. Tropical cyclone hazard assessment using model-based track simulation. Nat. Hazards 2009, 48, 383–398. [Google Scholar] [CrossRef]
- Cardona, O.-D.; Ordaz, M.G.; Mora, M.G.; Salgado-Gálvez, M.A.; Bernal, G.A.; Zuloaga-Romero, D.; Marulanda Fraume, M.C.; Yamín, L.; González, D. Global risk assessment: A fully probabilistic seismic and tropical cyclone wind risk assessment. Int. J. Disaster Risk Reduct. 2014, 10, 461–476. [Google Scholar] [CrossRef]
- Peduzzi, P.; Dao, H.; Herold, C.; Mouton, F. Assessing global exposure and vulnerability towards natural hazards: The Disaster Risk Index. Nat. Hazards Earth Syst. Sci. 2009, 9, 1149–1159. [Google Scholar] [CrossRef]
- Ward, P.J.; Blauhut, V.; Bloemendaal, N.; Daniell, J.E.; de Ruiter, M.C.; Duncan, M.J.; Emberson, R.; Jenkins, S.F.; Kirschbaum, D.; Kunz, M. Natural hazard risk assessments at the global scale. Nat. Hazards Earth Syst. Sci. 2020, 20, 1069–1096. [Google Scholar] [CrossRef]
- Doocy, S.; Dick, A.; Daniels, A.; Kirsch, T.D. The human impact of tropical cyclones: A historical review of events 1980–2009 and systematic literature review. PLoS Curr. 2013, 5. [Google Scholar] [CrossRef] [PubMed]
- Deo, A.; Chand, S.S.; McIntosh, R.D.; Prakash, B.; Holbrook, N.J.; Magee, A.; Haruhiru, A.; Malsale, P. Severe tropical cyclones over southwest Pacific Islands: Economic impacts and implications for disaster risk management. Clim. Chang. 2022, 172, 38. [Google Scholar] [CrossRef]
- Ahmed, I. An Assessment-Based Toolkit for Management of Urban Disasters. In An Interdisciplinary Approach for Disaster Resilience and Sustainability; Springer: Singapore, 2020; pp. 497–519. [Google Scholar] [CrossRef]
- Heintze, H.-J.; Kirch, L.; Küppers, B.; Mann, H.; Mischo, F.; Mucke, P.; Pazdzierny, T.; Prütz, R.; Radtke, K.; Strube, F. World Risk Report 2018; Bündnis Entwicklung Hilft: Berlin, Germany, 2018. [Google Scholar]
- Rey, T.; Le De, L.; Leone, F.; Gilbert, D. An integrative approach to understand vulnerability and resilience post-disaster: The 2015 cyclone Pam in urban Vanuatu as case study. Disaster Prev. Manag. Int. J. 2017, 26, 259–275. [Google Scholar] [CrossRef]
- Nalau, J.; Handmer, J.; Dalesa, M. The role and capacity of government in a climate crisis: Cyclone Pam in Vanuatu. In Climate Change Adaptation in Pacific Countries; Springer: Cham, Switzerland, 2017; pp. 151–161. [Google Scholar]
- Mohanty, S.K.; Chatterjee, R.; Shaw, R. Building resilience of critical infrastructure: A case of impacts of cyclones on the power sector in Odisha. Climate 2020, 8, 73. [Google Scholar] [CrossRef]
- Kaspi, M.; Kuleshov, Y. Flood Hazard Assessment in Australian Tropical Cyclone-Prone Regions. Climate 2023, 11, 229. [Google Scholar] [CrossRef]
- Chipatiso, E. Flood Risk Mapping: Quantifying Topographic Wetness Index to determine Flood Risk Zones for Mutoko District in Zimbabwe. J. Sens. Netw. Data Commun. 2023, 3, 215–222. [Google Scholar]
- Irish, J.L.; Resio, D.T. A hydrodynamics-based surge scale for hurricanes. Ocean Eng. 2010, 37, 69–81. [Google Scholar] [CrossRef]
- Islam, M.R.; Lee, C.-Y.; Mandli, K.T.; Takagi, H. A new tropical cyclone surge index incorporating the effects of coastal geometry, bathymetry and storm information. Sci. Rep. 2021, 11, 16747. [Google Scholar] [CrossRef] [PubMed]
- Gori, A.; Lin, N.; Xi, D. Tropical Cyclone Compound Flood Hazard Assessment: From Investigating Drivers to Quantifying Extreme Water Levels. Earth’s Future 2020, 8. [Google Scholar] [CrossRef]
- Hague, B.S.; Murphy, B.F.; Jones, D.A.; Taylor, A.J. Developing impact-based thresholds for coastal inundation from tide gauge observations. J. South. Hemisph. Earth Syst. Sci. 2020, 69, 252–272. [Google Scholar] [CrossRef]
- Do, C.; Kuleshov, Y. Multi-hazard Tropical Cyclone Risk Assessment for Australia. Remote Sens. 2023, 15, 795. [Google Scholar] [CrossRef]
- PACCSAP; SMEC; Government of Vanuatu. The Vanuatu Climate Resilient Road Standards Project. 2014. Available online: https://www.pacificclimatechange.net/sites/default/files/Vanuatu-Climate-Resilient-Road-Standards-brochure.pdf (accessed on 2 November 2023).
- Crichton, D. UK and global insurance responses to flood hazard. Water Int. 2002, 27, 119–131. [Google Scholar] [CrossRef]
- Schneiderbauer, S.; Ehrlich, D. Risk, hazard and people’s vulnerability to natural hazards. In A Review of Definitions, Concepts and Data; European Commission Joint Research Centre: Brussels, Belgium, 2004; Volume 21410, p. 40. [Google Scholar]
- Rabine, C. Timing of Tectonic Uplift Rate Change at Araki, Vanuatu, Derived from 230-Th Dating of Fossil Corals; University of Minnesota: Minneapolis, MN, USA, 2018. [Google Scholar]
- Takaya, Y.; Caron, L.-P.; Blake, E.; Bonnardot, F.; Bruneau, N.; Camp, J.; Chan, J.; Gregory, P.; Jones, J.J.; Kang, N. Recent advances in seasonal and multi-annual tropical cyclone forecasting. Trop. Cyclone Res. Rev. 2023, 12, 182–199. [Google Scholar] [CrossRef]
- Schreck, C.J., III; Vitart, F.; Camargo, S.J.; Camp, J.; Darlow, J.; Elsberry, R.; Gottschalck, J.; Gregory, P.; Hansen, K.; Jackson, J. Advances in tropical cyclone prediction on subseasonal time scales during 2019–2022. Trop. Cyclone Res. Rev. 2023, 12, 136–150. [Google Scholar] [CrossRef]


| Month | Avg. Daily TAT (Hours) |
|---|---|
| January | 10.9800 |
| February | 10.7849 |
| March | 9.95161 |
| April | 8.91071 |
| May | 8.28111 |
| June | 8.30000 |
| July | 8.80184 |
| August | 9.59447 |
| September | 9.94643 |
| October | 10.3894 |
| November | 10.5262 |
| December | 10.7454 |
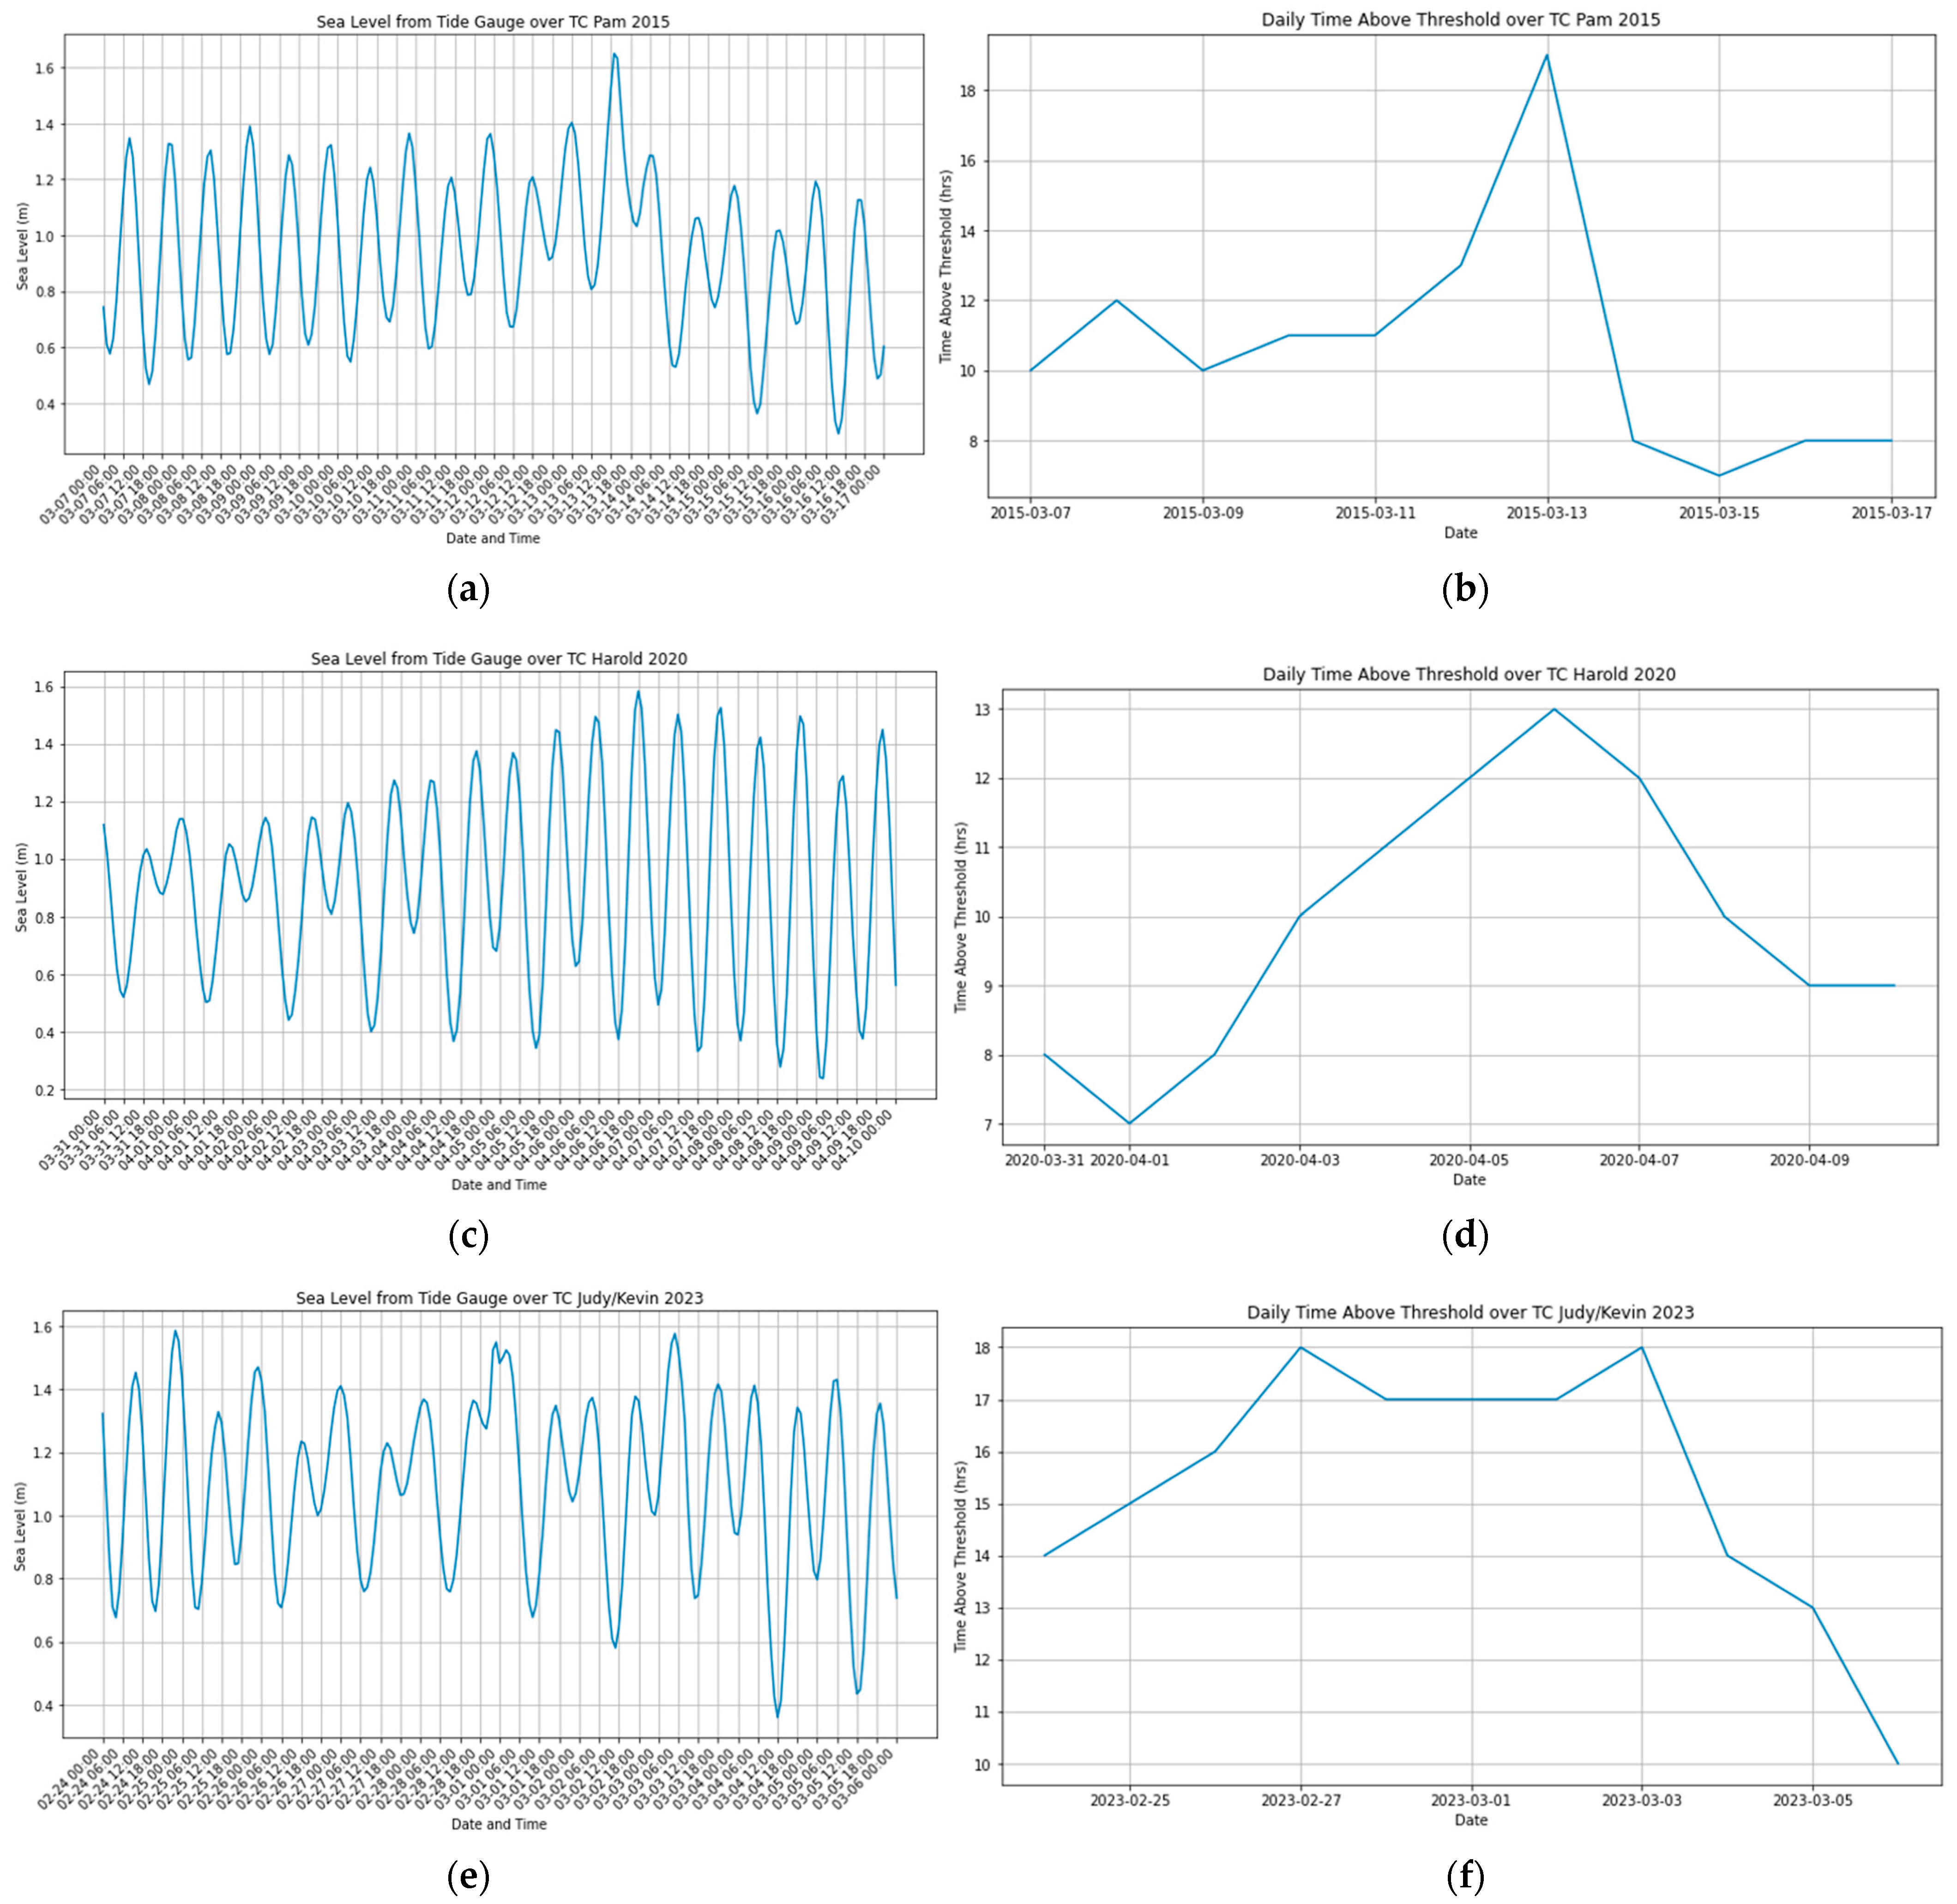
| TC Event | Avg. Daily TAT (Hours) |
|---|---|
| TC Pam | 12.4 |
| TC Harold | 11.6 |
| TC Judy/Kevin | 17.4 |
| Indicator | Data Source | Resolution | Methods |
|---|---|---|---|
| TWI (Flood Hazard) | NASADEM-HGT elevation data | ~30 m (1 arc second) | St Dev (1–7) |
| Impermeability (Flood Hazard) | Land Cover data from ESA | 10 m | Unique (1–100) |
| Accumulated Rainfall (Flood Hazard) | Daily accumulated rainfall from MSWEP from 1980 to 2023 | ~11.1 km (0.1 degrees) | Min-max (0–1) |
| Coastal Elevation (Surge Hazard) | NASADEM-HGT elevation data | ~30 m (1 arc second) | Unique (0–4) |
| Shelf Gradient (Surge Hazard) | GEBCO gridded bathymetry | ~450 m (15 arc seconds) | Quantile (1–10) |
| TAT (Surge Hazard) | Hourly Sea Level and Meteorological Data from the Australia Bureau of Meteorology from 1995 to 2023 | N/A | Min-max (0–1) |
| Population Density (Population Exposure) | Vanuatu Population Density 2020 (WorldPop) | 1 km | Quantile (1–10) |
| Distance to Shelter (Population Vulnerability) | Vanuatu Buildings polygons (OpenStreetMap) | 30 m | Quantile (1–10) |
| Economic Stability (Population Vulnerability) | Proportion of households with salary as main income (Vanuatu 2016 mini-census) | Council Area level | Equal (1–9) |
| Household Density (Housing Exposure) | Household locations grid (2016 Population and Housing census) | 100 m | Quantile (1–10) |
| Household Wall Material (Housing Vulnerability) | Proportion of houses built with traditional materials for walls (Vanuatu 2016 mini-census) | Council Area level | Equal (1–10) |
| Household Roof Material (Housing Vulnerability) | Proportion of houses built with palm/straw materials for roofs (Vanuatu 2016 mini-census) | Council Area level | Equal (1–10) |
| Road presence (Road Exposure) | Vanuatu Road polylines (OpenStreetMap) | 30 m | Unique (1) |
| Road Vulnerability Index (Road Vulnerability) | NASADEM-HGT elevation data | ~30 m (1 arc-second) | Unique (0–4) |
Disclaimer/Publisher’s Note: The statements, opinions and data contained in all publications are solely those of the individual author(s) and contributor(s) and not of MDPI and/or the editor(s). MDPI and/or the editor(s) disclaim responsibility for any injury to people or property resulting from any ideas, methods, instructions or products referred to in the content. |
© 2024 by the authors. Licensee MDPI, Basel, Switzerland. This article is an open access article distributed under the terms and conditions of the Creative Commons Attribution (CC BY) license (https://creativecommons.org/licenses/by/4.0/).
Share and Cite
Do, C.; Kuleshov, Y.; Choy, S.; Sun, C. Evaluating Tropical Cyclone-Induced Flood and Surge Risks for Vanuatu by Assessing Location Hazard Susceptibility. Remote Sens. 2024, 16, 1890. https://doi.org/10.3390/rs16111890
Do C, Kuleshov Y, Choy S, Sun C. Evaluating Tropical Cyclone-Induced Flood and Surge Risks for Vanuatu by Assessing Location Hazard Susceptibility. Remote Sensing. 2024; 16(11):1890. https://doi.org/10.3390/rs16111890
Chicago/Turabian StyleDo, Cameron, Yuriy Kuleshov, Suelynn Choy, and Chayn Sun. 2024. "Evaluating Tropical Cyclone-Induced Flood and Surge Risks for Vanuatu by Assessing Location Hazard Susceptibility" Remote Sensing 16, no. 11: 1890. https://doi.org/10.3390/rs16111890