Article

Estimation of Soil Organic Matter Based on Spectral Indices Combined with Water Removal Algorithm

1
Changchun Institute of Optics, Fine Mechanics and Physics, Chinese Academy of Sciences, Changchun 130033, China
2
University of Chinese Academy of Sciences, Beijing 100049, China
3
Center of Materials Science and Optoelectrics Engineering, University of Chinese Academy of Sciences, Beijing 100049, China
*
Author to whom correspondence should be addressed.
Remote Sens. 2024, 16(12), 2065; https://doi.org/10.3390/rs16122065
Submission received: 15 March 2024 / Revised: 28 May 2024 / Accepted: 2 June 2024 / Published: 7 June 2024

Abstract

:
Soil moisture strongly interferes with the spectra of soil organic matter (SOM) in the near-infrared region, which reduces the correlation between organic matter and spectra and decreases accuracy in the prediction of SOM. In this study, we explored the feasibility of two types of spectral indices, two- and three-band mixed (SI) and three-band spectral indices (SI3), and two water removal algorithms, direct standardization (DS) and external parameter orthogonalization (EPO), to estimate SOM in wet soils using a total of 192 soil samples at six water content gradients. The estimation accuracies of spectral indices combined with water removal algorithms were better than those of full spectral data combined with water removal algorithms: the prediction accuracies of SI-EPO (R2 = 0.735, RMSEp = 3.4102 g/kg) were higher than those of EPO (R2 = 0.63, RMSEp = 4.1021 g/kg), and those of SI-DS (R2 = 0.70, RMSEp = 3.7085 g/kg) were higher than those of DS (R2 = 0.61, RMSEp = 4.2806 g/kg); SI3-EPO (R2 = 0.752, RMSEp = 3.1344 g/kg) was better than SI-EPO; both EPO and DS effectively mitigated the influence of soil moisture, with EPO demonstrating superior performance in small-sample prediction scenarios. This study introduces a novel approach to counteract the impact of soil moisture on SOM estimation.

Graphical Abstract

1. Introduction

Black soil, abundant in organic matter, serves as a vital substrate for cultivating staple food crops, alongside other crops and livestock. However, this soil type is highly susceptible to degradation through overuse, erosion, and contamination. Consequently, safeguarding black soil is imperative, not only for future agricultural productivity and food security but also for preserving soil health and promoting sustainable soil management practices. Organic matter, a key component of soil fertility, serves as a significant reservoir of nutrients, including nitrogen, phosphorus, and potassium, which are essential for plant growth. Its decomposition enriches agricultural soils, thereby enhancing crop yields and contributing significantly to soil ecosystem functioning, agricultural productivity, and environmental conservation [1]. Hyperspectral technology plays an important role in air quality detection, ultra-short laser pulse characterization, spectral imaging, the detection of soil properties, and other fields [2]. Field visible near-infrared (vis-NIR) soil spectroscopy represents a promising alternative to traditional soil organic matter assessment methods. By leveraging remote sensing satellites or ground sensors, vis-NIR spectroscopy streamlines data collection, offering advantages such as efficiency, broad coverage, environmental friendliness, and cost-effectiveness. In contrast to conventional field data collection methods, which demand significant human, material, and financial resources and entail long processing times and limited coverage, vis-NIR spectroscopy presents a convenient, rapid, and affordable solution for obtaining soil property data, including organic matter content [3,4].
Various studies by domestic and international scholars have explored modeling and predicting soil properties using visible near-infrared (VNIR) reflectance hyperspectral techniques (350–2500 nm) [5]. Machine learning algorithms, known for their nonlinear capabilities and robust data mining prowess, have been instrumental in constructing regression models for estimating soil organic matter (SOM) content based on hyperspectral remote sensing data [6,7,8]. For instance, Yu et al. determined that a partial least squares regression (PLSR) model, combined with continuous uniform removal transformation, yielded the optimal prediction model for SOM content in the Jianghan Plain [9]. Additionally, Chang introduced a dynamic adaptive inertia-weighted particle swarm optimization (DPSO) algorithm to fine-tune the parameters of an artificial neural network (ANN), resulting in enhanced SOM prediction accuracy [10]. Ou addressed overfitting issues by employing a semi-supervised deep neural network regression (Semi-DNNR) model, which incorporated various parametric inversion features [11]. Zhang utilized a genetic algorithm (GA) for band selection, leading to improved predictive model calibration with partial least squares regression (PLSR) [12]. However, it is important to note that these methods typically utilized dried soil samples for modeling and prediction purposes [13,14,15].
Minor fluctuations in soil moisture content can significantly impact the way microwaves are reflected and scattered at the soil surface [16]. Soil moisture serves as a significant factor in spectral analysis and the determination of soil organic matter (SOM) content in the near-infrared (NIR) region, disrupting the correlation between SOM and spectral data. Among soil components, soil moisture content (SMC) exerts the most substantial influence on the range of soil reflectance in the visible near-infrared (VNIR) region [17,18,19]. Previous research has delved into the effects of SMC on reflectance by rehydrating soil samples, demonstrating that SMC can impact the accuracy of SOM estimation [20,21]. SMC can interfere with SOM prediction by obscuring key soil spectral absorption features and distorting the overall spectral profile [22].
To remove the water effect from the wet spectrum, researchers have used various methods. Yang et al. used an external parameter orthogonalization (EPO) algorithm to remove the effect of soil water content and improved the accuracy of SOM content estimation [23]. Direct standardization (DS) and piecewise direct standardization (PDS) have also been used to remove the effect of water [24]. EPO can eliminate external influences orthogonal to the target characteristics, thus allowing for the removal of known external factors from spectral features. EPO requires a dataset consisting of the same samples from two different measurement conditions. Similarly, DS requires the transmission of sample spectra to the desired reference space through a transfer set [25]. Hong used the Normalized Soil Moisture Index (NSMI) to group soil water content and estimated SOM content and concluded that NSMI can be used as a measure of soil water content [26]. Chen et al. used Singular Value Decomposition (SVD) combined with correlation analysis to screen soil moisture characteristic spectra, constructed correction coefficients for removing moisture factors to form correction spectra for wet soil spectra, and found that the estimation accuracy was improved after modeling analysis [27].
Most of the above studies used spectral data in full spectral bands for the predictive modeling of soil properties. Soil hyperspectral curves contain many bands, and there are different degrees of correlation between bands. There is a certain amount of information redundancy. Extracting the soil spectral feature index can reduce the input variables for the spectral modeling of soil properties and improve the modeling efficiency.
The aims of this study were as follows:
(1)
To analyze the effect of moisture content on soil spectral reflectance and compare the ability of external parameter orthogonalization (EPO) and direct standardization (DS) to eliminate the effect of moisture in VNIR spectra.
(2)
To create a two-band spectral index and a three-band spectral index, investigate their correlation with soil organic matter content, and identify the most sensitive bands.
(3)
To construct an improved algorithm for combining SOM spectral indices with EPO and DS to overcome and eliminate the effect of soil moisture on the accuracy of SOM spectral monitoring in order to improve the accuracy of SOM detection.

2. Materials and Methods

2.1. Experimental Materials

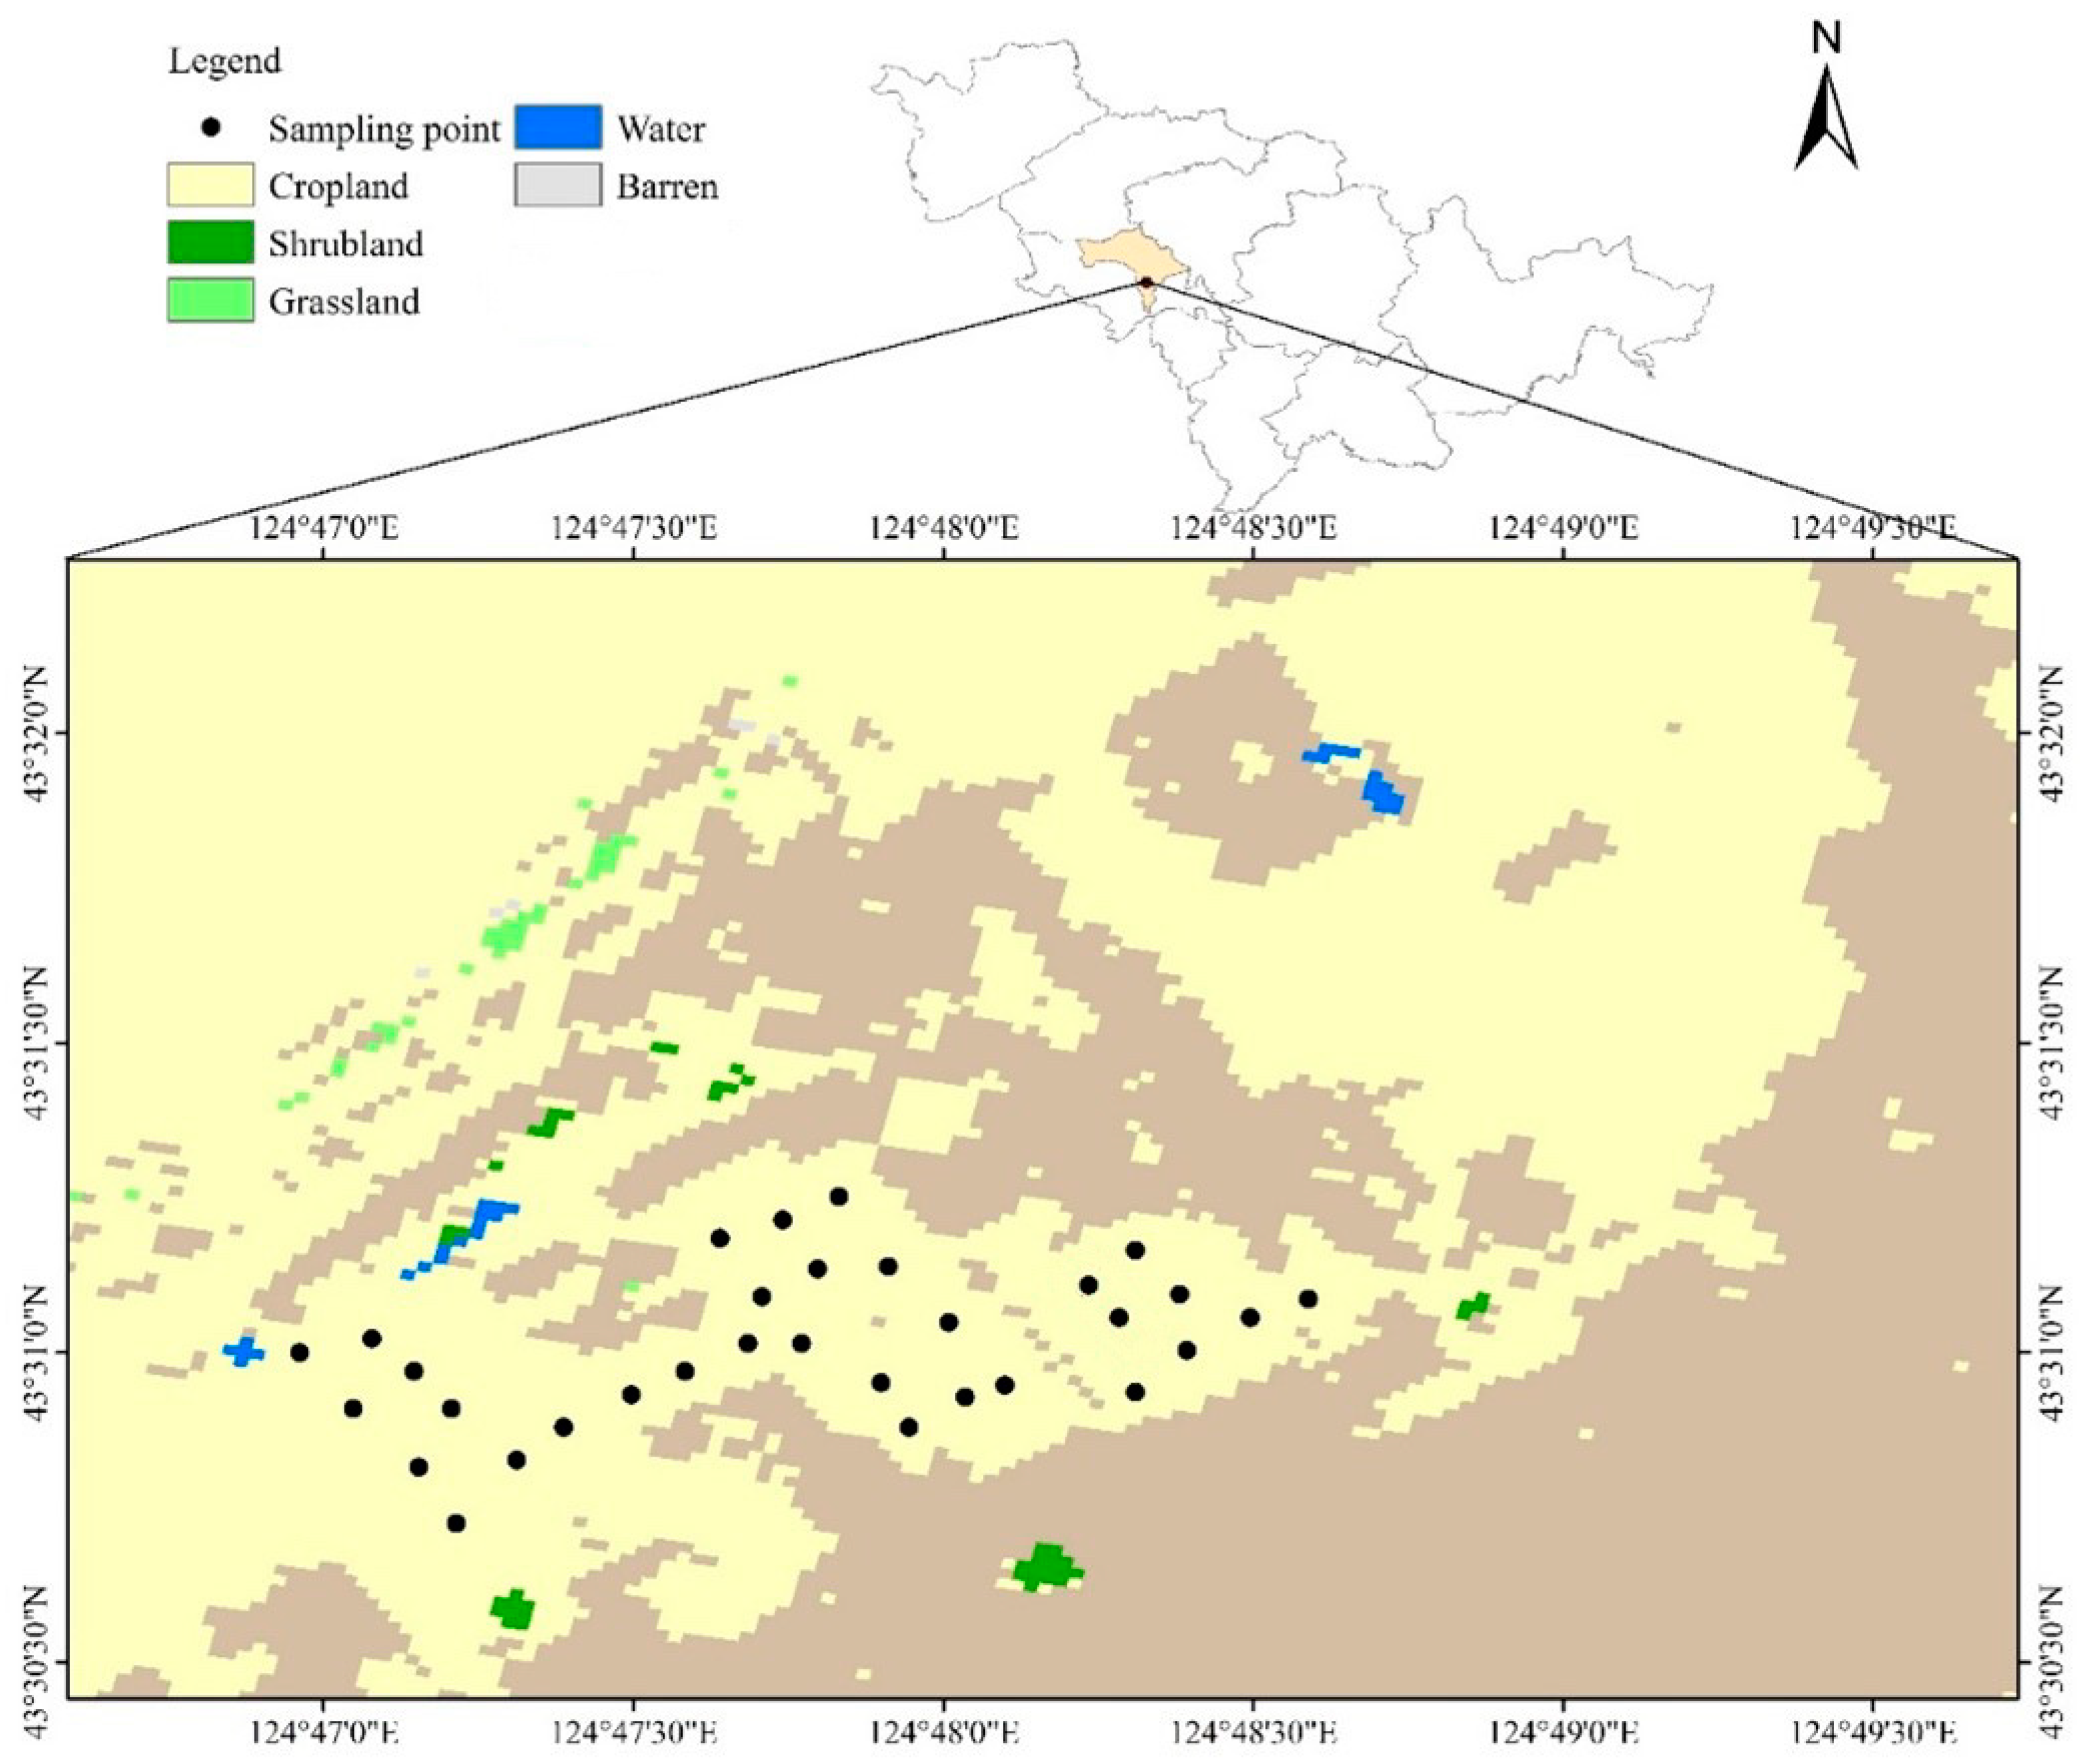
2.1.1. Study Area and Soil Data Collection

Soil samples were collected from Gongzhuling City, Jilin Province, China. Gongzhuling City is located in the central and western part of Jilin Province, on the right bank of the middle course of the Dongliao River, in the middle of the Songliao Plain, between 124°02′ to 125°18′E and 43°11′ to 44°09′N (Figure 1). The geological structure is covered by alluvial layers throughout the season, most of which are composed of black clay. A few areas contain sandy clay, which is a good research object for black soil.
The experimental field was divided into 32 experimental plots based on organic matter concentration. Within each plot, we employed a five-point sampling technique. Soil samples were divided into two portions: one for measuring soil organic matter content, and the other for collecting spectral data. The soil samples were air-dried, ground, and sieved through a 2 mm mesh. Organic matter content was determined using the Agricultural Soil Inventory (ASI) method. The soil samples exhibited a range of organic matter contents, with a maximum of 38.60 g/kg, a minimum of 17.98 g/kg, and an average of 27.75 g/kg.

2.1.2. Soil Moisture Content Setting

Six gradients were set for soil moisture content, namely 12%, 14%, 16%, 18%, 20%, and 22%. In Formula (1), W2 is the weight of wet soil, W1 is the weight of dry soil, and W3 is the weight of the plastic box containing the soil. We added a certain amount of water according to the formula, sealed the container, and let it sit for one night to achieve the corresponding moisture content gradient. In this way, 192 soil samples with different organic matter contents and moisture contents were obtained, which were used to establish a soil organic matter hyperspectral prediction model.
θ m = W 2 W 1 W 1 W 3 100 %

2.1.3. Spectral Measurement

Hyperspectral measurements were conducted in the laboratory using the Field-Spec 3 Hi-Res spectrometer from the American ASD Company (Alpharetta, GA, USA) on 192 wet soil samples and 32 dry soil samples. The spectrometer’s range spans from 350 to 2500 nm, employing a 50 W halogen lamp as its light source, set at a 45° incident angle, positioned 20 cm away from the soil sample. A lens added to the probe narrowed the field of view angle to 1°, with the probe placed 10 cm from the soil sample. Each measurement automatically collected 10 spectral curves, with the arithmetic average utilized as the spectral curve for each soil sample. Standard white plate calibration was performed prior to each measurement.

2.1.4. Data Preprocessing

Since 350–500 nm and 2400–2500 nm are affected by the low light sensitivity of the ASD and low soil reflectivity [28], the signal-to-noise ratio was low, so this part of the band was eliminated during the study, and only the soil reflection in the 500–2400 nm band was analyzed. The Savitzky–Golay smoothing method was used to smooth the spectral data after correcting the breakpoints. The Savitzky–Golay smoothing method was proposed by Savitzky and Golay in 1964 [29]. It is a digital signal processing filter based on polynomial fitting. It performs polynomial fitting within a local area of the signal and uses the points on the fitting curve as the filtered output value. This filtering method has a certain smoothing effect while retaining the overall trend of the signal.

2.2. Experimental Methods

2.2.1. Spectral Index

Spectral indices play a crucial role in various fields, such as remote sensing, environmental science, and agriculture, offering insights into vegetation condition, soil texture, water quality, and more. They are calculated from spectral bands and come in one-, two-, and three-band types. While the first-band spectral index is straightforward but limited in data, second- and third-band indices provide more comprehensive information.
This study employed three common spectral index calculation methods, the difference spectral index (DSI), ratio spectral index (RSI), and normalized difference spectral index (NDSI), as outlined in Table 1.

2.2.2. External Parameter Orthogonalization (EPO)

External parameter orthogonalization (EPO) was first proposed by Roger et al. [30]. The proposed EPO-PLS method corrects the influence of temperature variables on the spectral prediction of sugar content in fruits. Minasny et al. applied EPO to soil organic carbon measurements [31]. The use of EPO can eliminate the influence of soil moisture from the spectrum, thereby improving the calibration and prediction of soil organic carbon content.
The influence of SMC on wet soil spectra can be represented by a matrix as follows:
X = X P + X Q
In the formula, X represents the matrix of wet soil spectra. P is the projection matrix that contains useful information about SOM in X. Q is the projection matrix that represents the useless information generated due to the influence of SMC.
The core idea of the EPO is to extract the projection matrix P that covers useful spectral information from X. The specific algorithm process is as follows:
(1)
Dry soil samples can be represented as (n × m), and the average spectrum of dry soil samples can be calculated as (1 × m).
(2)
Wet soil samples can be represented as (N × m), and the average spectrum of samples with different SMCs can be calculated as (h × m).
(3)
Calculate the difference between dry and wet soil samples as D (h × m).
(4)
Perform Principal Component Analysis on DTD to obtain the matrix V (m × m).
(5)
Define the dimension of EPO as g and calculate a subset Vs (m × g) of the V matrix.
(6)
Calculate Q = VsVs T.
(7)
Finally, calculate the projection matrix P using the formula P = IQ, where I is an identity matrix.

2.2.3. Direct Standardization (DS)

Direct standardization (DS) [32] is a commonly used spectral data preprocessing method that normalizes the spectral differences between different samples, making the spectral data easier to compare and analyze. DS was initially used for transfer calibration between vis-NIR spectrometers. Ji et al. [33] proposed the use of DS to remove the influence of SMC in soil spectra.
The dry soil spectrum X can be represented as follows:
X = X w B + λ d S T
where B is the transfer matrix, and λ d S T is the residual term.
The specific steps of the DS are as follows: Collect a set of soil samples, including samples with different SMCs. Perform spectral measurements on each soil sample to obtain spectral data. Select a specific wavelength range where the spectral signal is primarily influenced by moisture. For the spectral data within this wavelength range, for each soil sample, calculate the average. For each soil sample, subtract the corresponding average value from the spectral data within this wavelength range.

2.2.4. Model Construction Methods and Accuracy Evaluation Indicators

The SOM prediction model adopts the partial least squares (PLS) method. PLS is a statistical method used to build linear regression models and perform data dimensionality reduction. It is mainly used for handling multivariate data and finds widespread applications in tasks such as regression analysis and data prediction.
The 192 samples from the experiment were split into a training set comprising 160 samples and a validation set with 32 samples. The training set samples were used to analyze the correlation between spectral indices and SOM content, build SOM prediction models based on EPO and DS, and improve the SOM prediction model based on the spectral indices. The validation set was solely employed to assess the model’s accuracy.
The accuracy of the PLS model was evaluated using the coefficient of determination (R2), bias, and the root mean squared error (RMSE) [12] between the predicted and measured SOM content. A higher R2 and lower RMSE indicate that the model has greater prediction accuracy. The closer the bias is to 0, the higher the accuracy of the model.
RMSE = i = 1 N y i y ^ i 2 N
R 2 = 1 i = 1 N y i y ^ i 2 i = 1 N y i y - 2
where y i and y ^ i are the observed values and the predicted values, y - is the mean of the observed values, and N is the number of samples with i equal to 1, 2, N.

3. Results

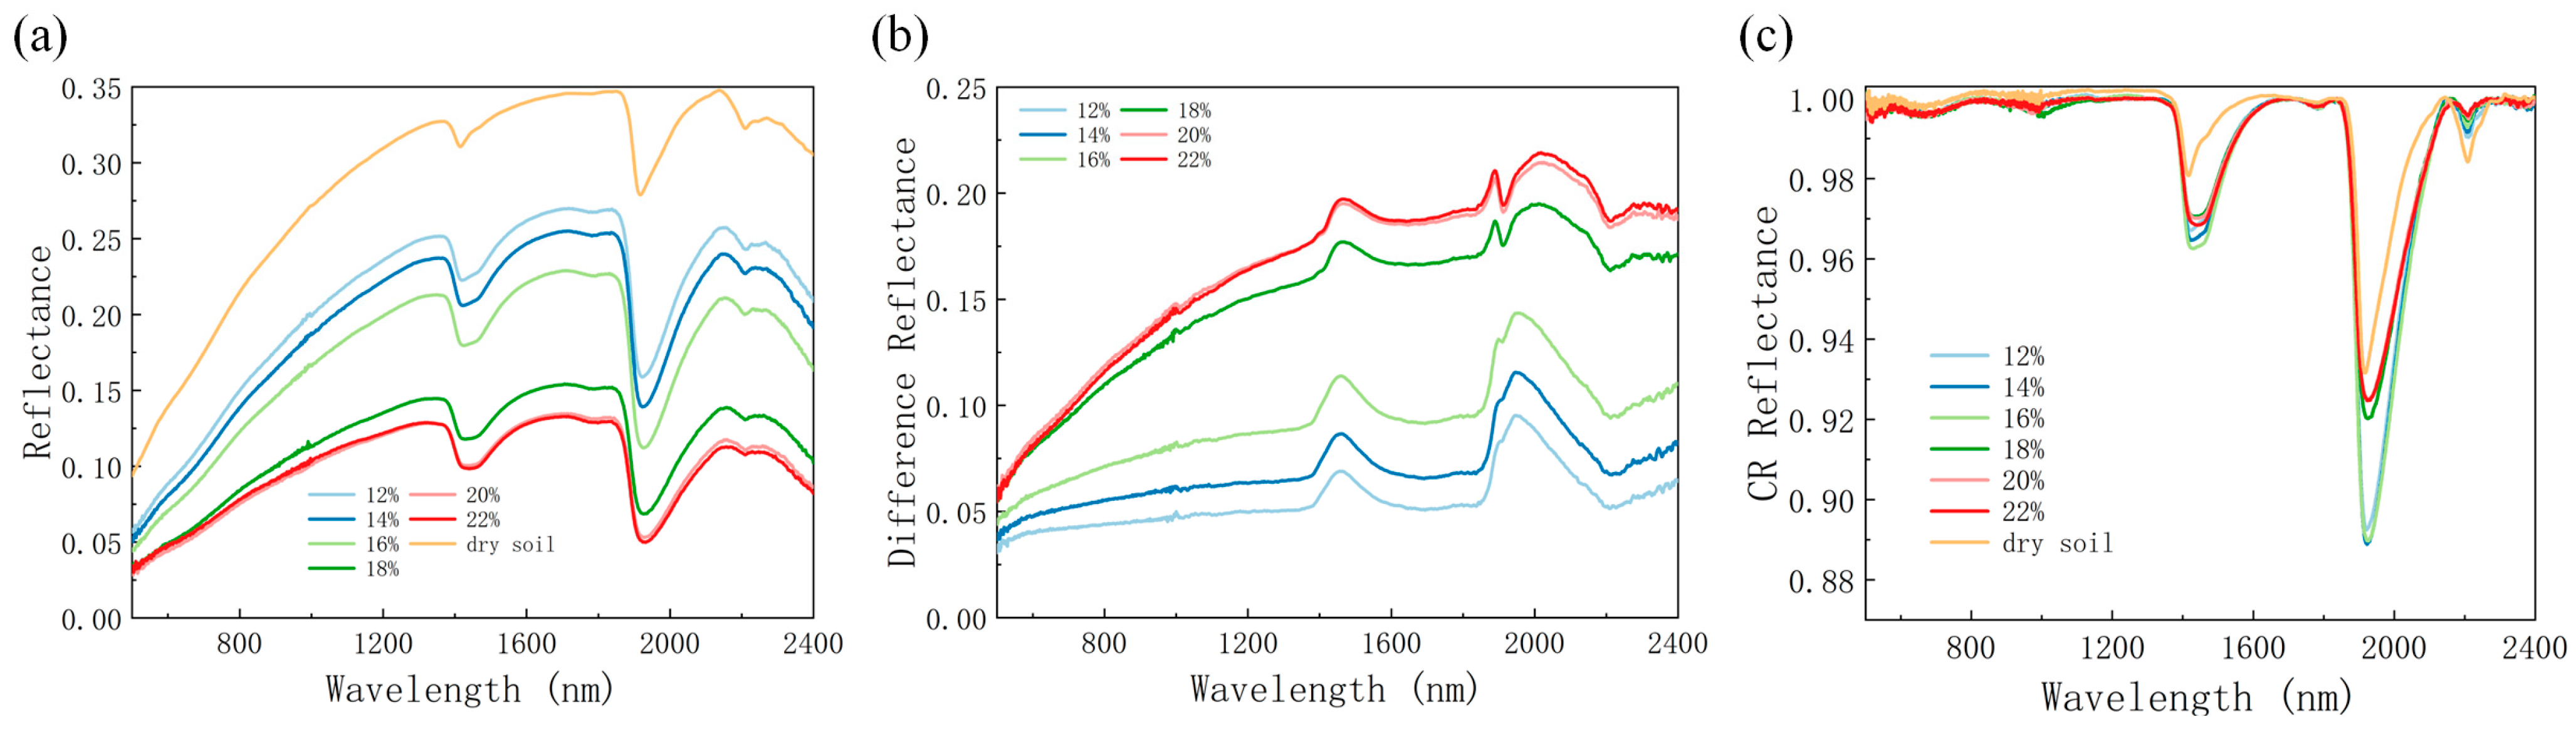
3.1. Effect of Soil Moisture Content on Soil Spectral Reflectance

Figure 2a illustrates the average spectral reflectance of soil across seven different soil moisture content (SMC) gradients. Throughout the entire spectral range from 500 to 2400 nm, there is a noticeable decrease in spectral reflectance as the moisture content increases. This decrease is primarily due to the increased refraction of light between soil particles with a higher SMC, which leads to reduced spectral reflectance. Significant variations in soil spectral reflectance are observed when the SMC is 16% or less. However, once the SMC exceeds 16%, the influence of moisture content on soil spectral reflectance diminishes, and the rate at which spectral reflectance decreases slows down. At SMCs of 20% and 22%, the corresponding curves are almost indistinguishable.
Principal Component Analysis (PCA) was conducted on the original spectra. The cumulative variance of dry soil and low SMC surpasses that of high SMC. Soil with a high water content exhibited a notable decrease in PC1 and an increase in PC2, as indicated in Table 2.
The diagram below clearly depicts differences in the spectra of dry soil, low SMC, and high SMC. The dry soil samples exhibit clear distinctions, whereas the scores for PC1 and PC2 of the other moist samples are mixed, making it challenging to discern clear clusters (Figure 3). Nonetheless, distinct clusters are still identifiable between low-moisture-content (12%, 14%, 16%) and high-moisture-content (18%, 20%, 22%) samples.
According to the calculation of the difference in average reflectance between the wet and dry soil samples (Figure 2b), the spectral absorption near 1950 nm is the highest among the full wavelength range and greater than other wavelengths. It can be observed from the graph that the influence of SMC on the spectral reflectance in the visible light range is significantly weaker compared to the near-infrared range. Figure 2c represents the continuum removal (CR) plot of the average spectral reflectance of dry soil samples and wet soil samples for seven different SMCs. The soil spectrum exhibits significant absorption around 1455 nm, 1945 nm, and 2200 nm.
Based on the analysis provided, there are notable differences in soil spectral reflectance across various soil moisture levels. Specifically, a pronounced water absorption valley near 1945 nm partially obscures the absorption valley near 2200 nm. This could potentially impact the prediction of soil organic, atter (SOM) content. Hence, employing efficient SMC correction algorithms to calibrate spectra is necessary to mitigate moisture’s influence on SOM content prediction.

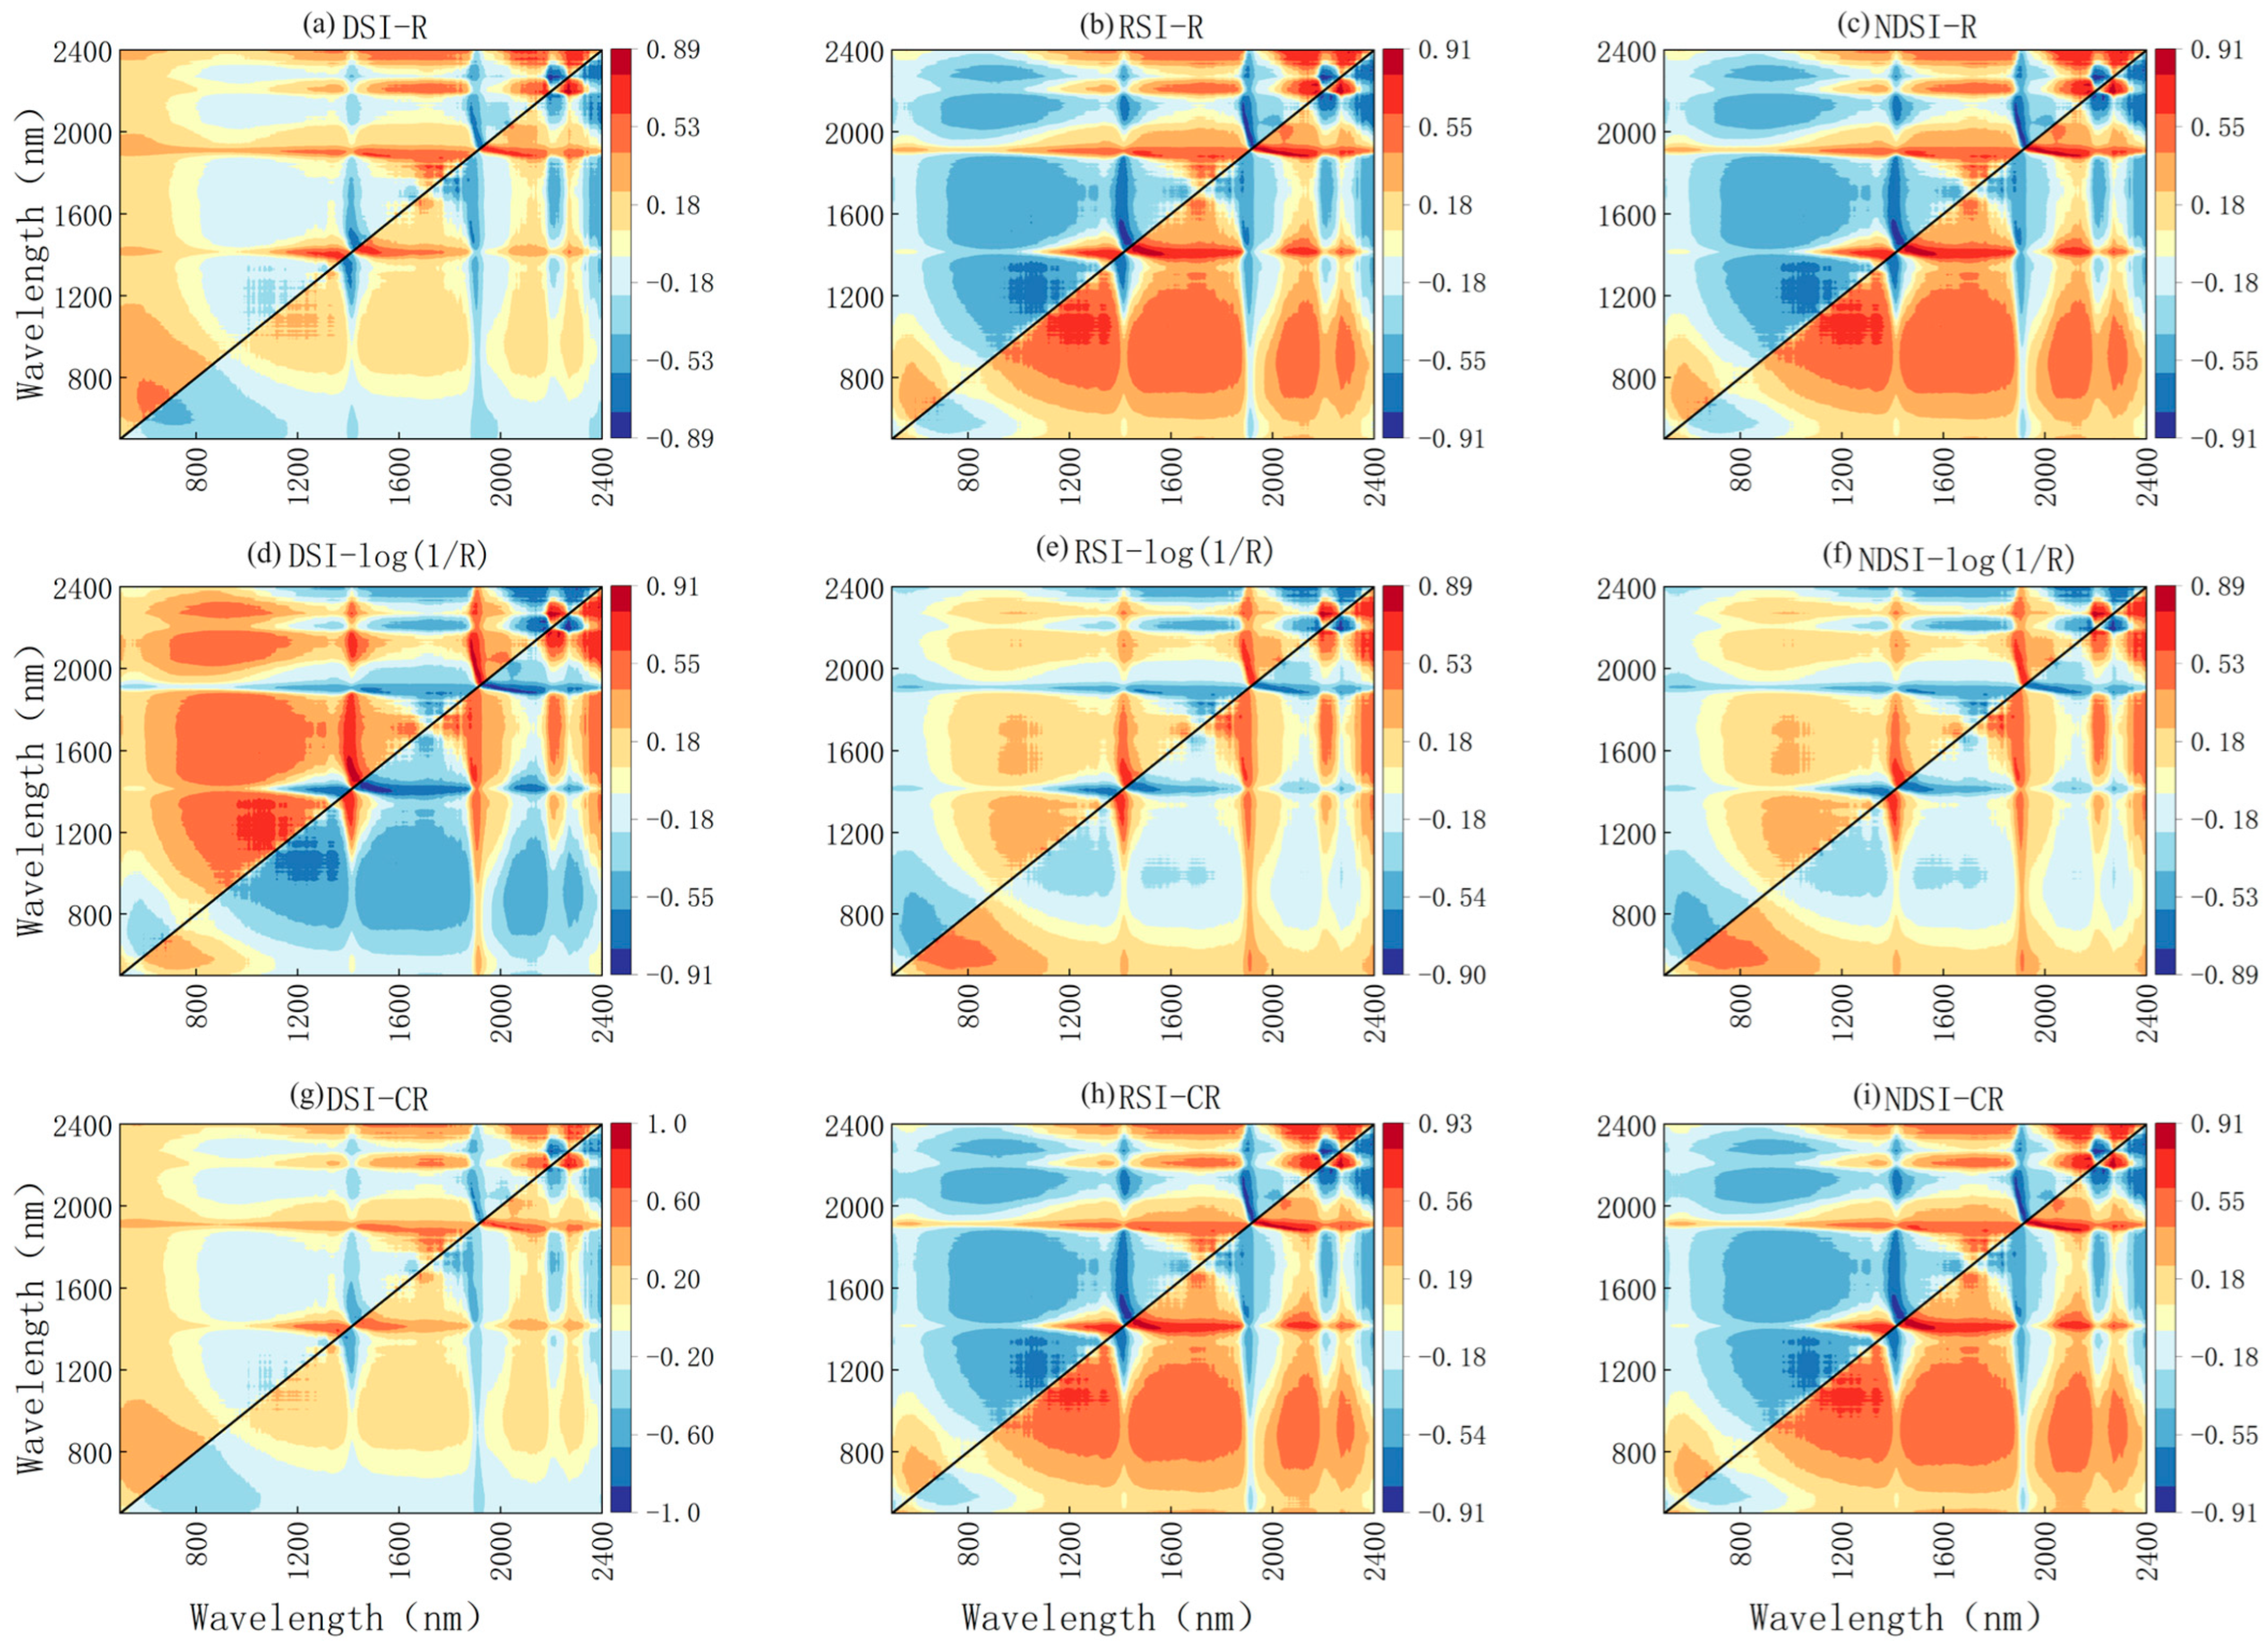
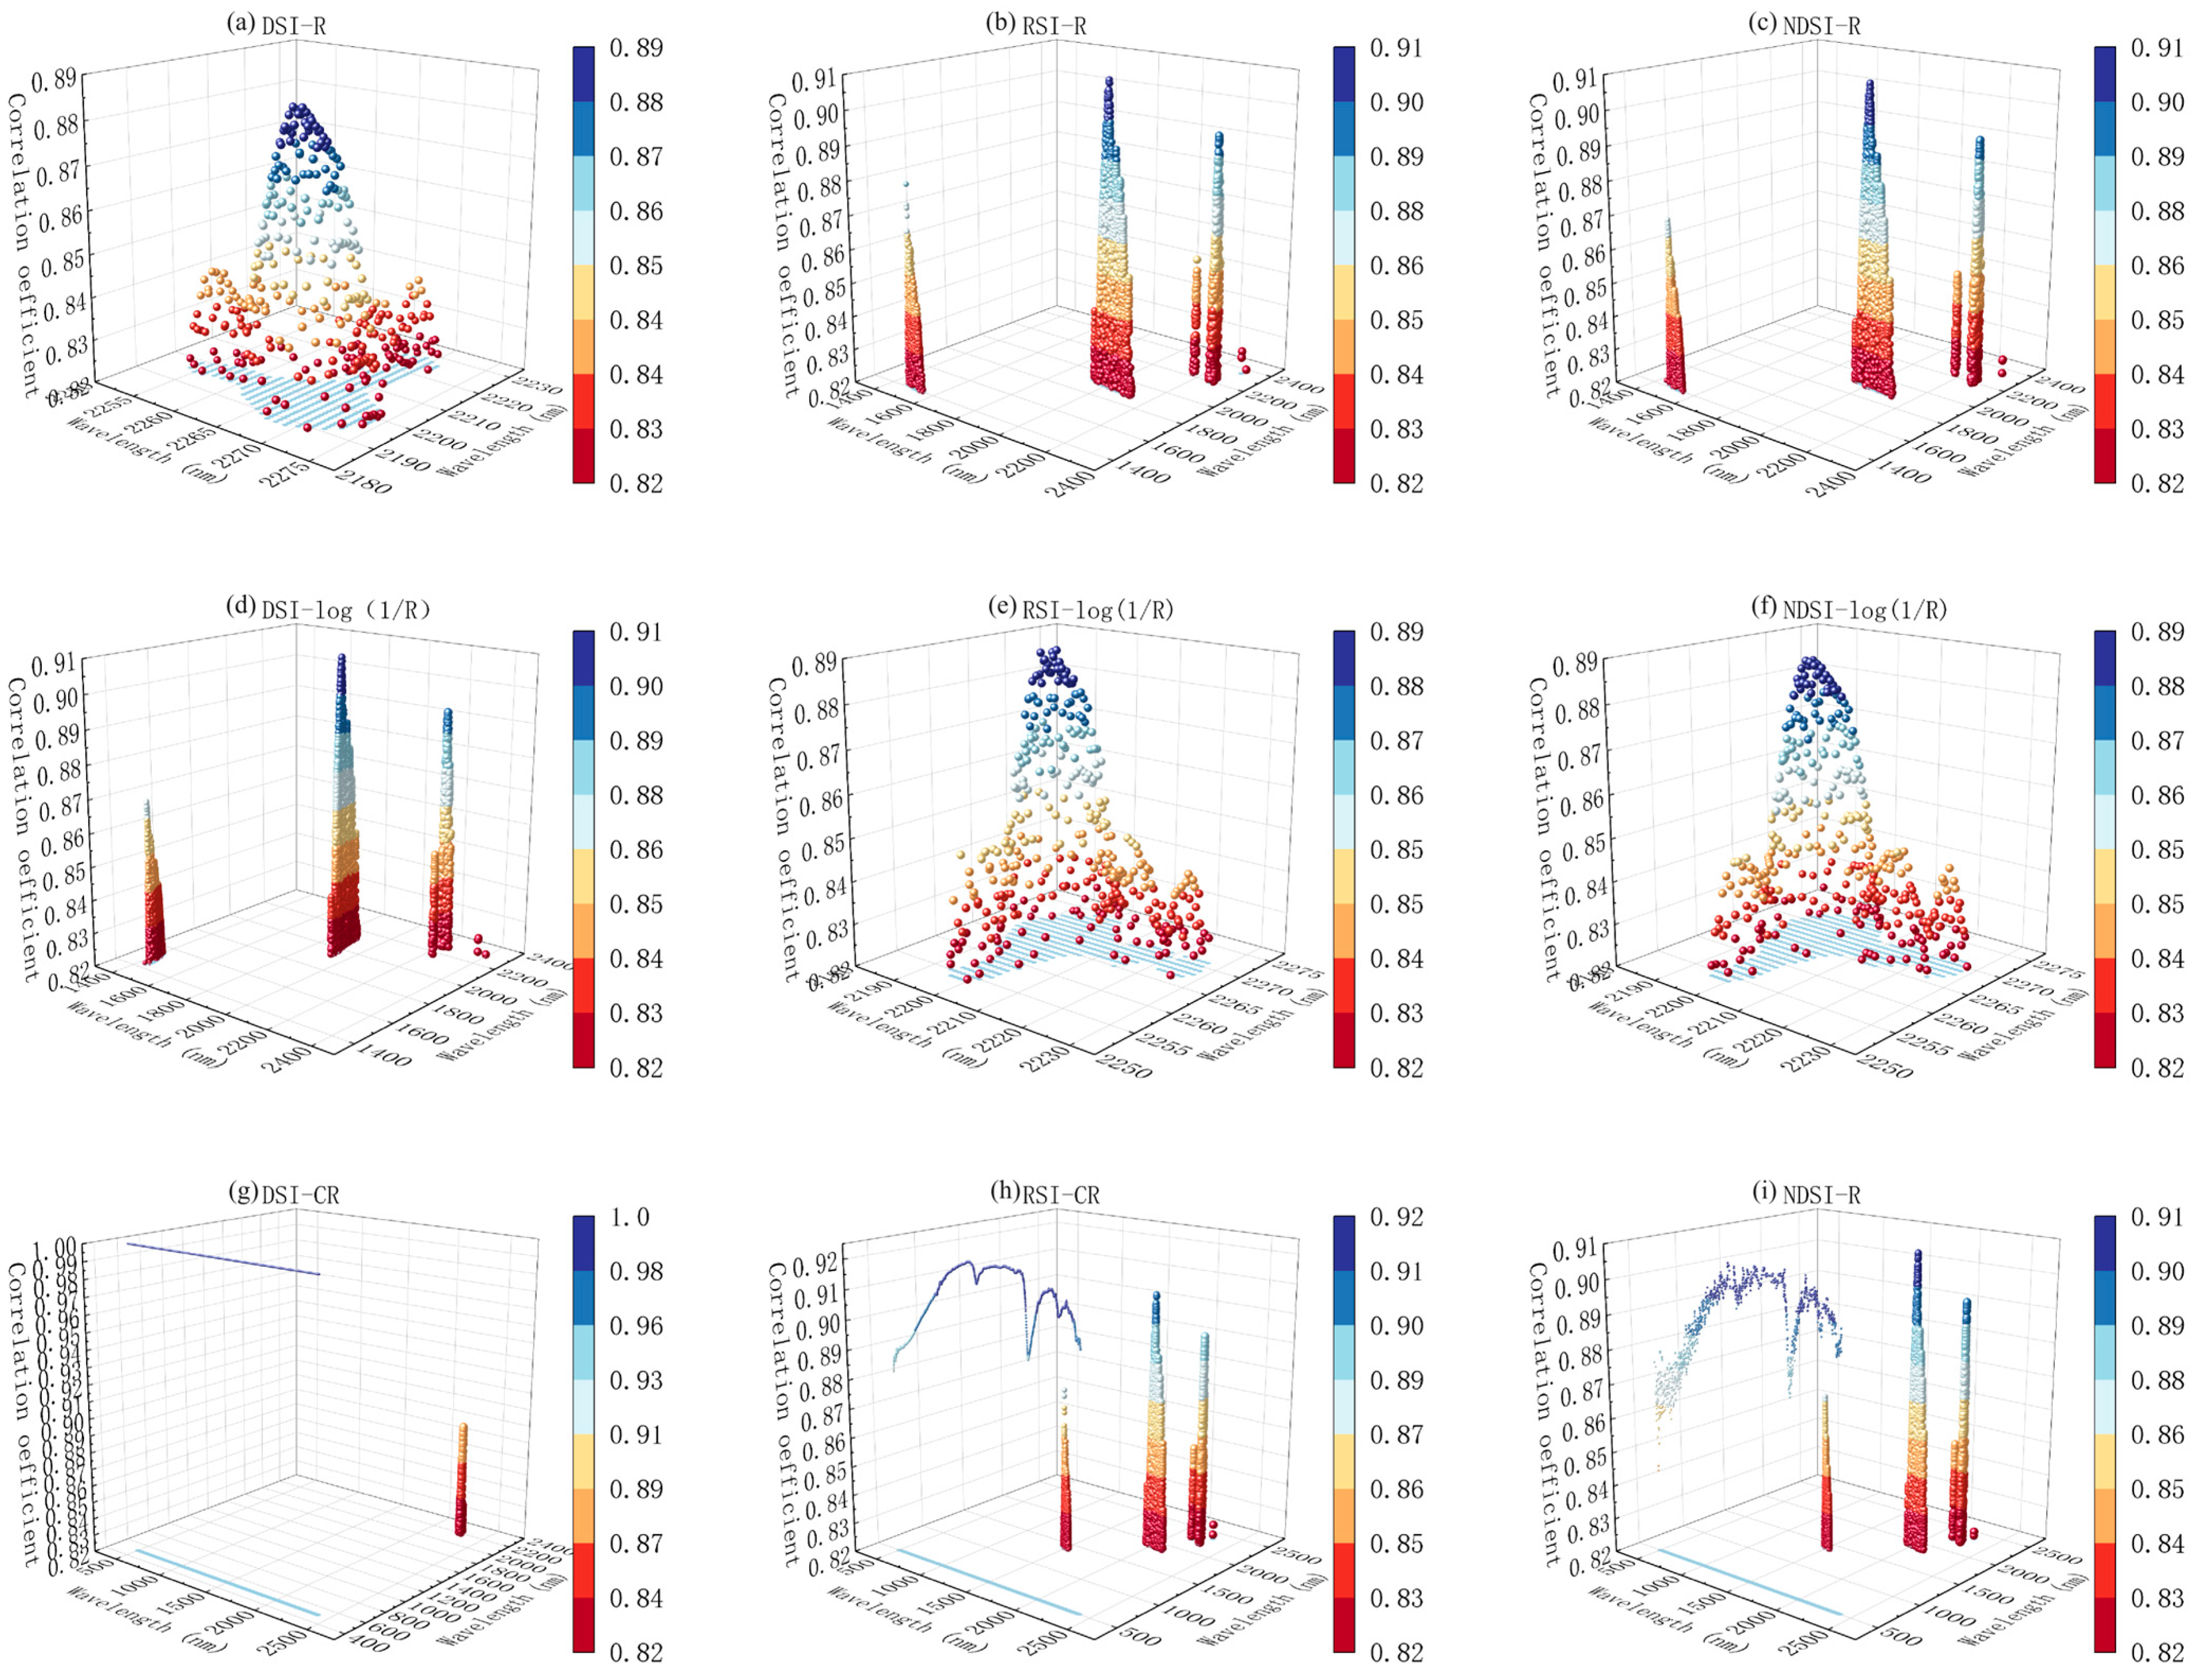
3.2. Construction of Spectral Index

Figure 4 illustrates the correlation coefficient curves between soil organic matter (SOM) content and different spectral transformations. SOM content demonstrates a significant negative correlation (p < 0.01) with the original spectrum in the 500–2400 nm wavelength range (Figure 4a). Conversely, it exhibits a significant positive correlation (p < 0.01) with the Log(1/R) spectrum, with correlation coefficients exceeding 0.3 in absolute value. Notably, the correlation in the 500–900 nm wavelength range surpasses that in other ranges, with correlation coefficients exceeding 0.55 in absolute value. Furthermore, the correlation coefficient of the Log(1/R) spectrum is even higher (Figure 4b). SOM content shows varying degrees of positive or negative correlations with the CR spectrum. When employing the original and Log(1/R) spectra to infer SOM content in the study area, the sensitive bands primarily reside in the visible and near-infrared bands. Conversely, if CR spectral data are utilized, the sensitive band range widens to cover visible light, near-infrared, and short-wave infrared band ranges (Figure 4c).
Within the full wavelength range, the sensitive bands for SOM content inversion are mainly located at 500–900 nm, 1450–1700 nm, and 2200–2400 nm. Based on our analysis of Figure 4, when studying the inversion of SOM content using the original spectrum and Log(1/R) spectrum, the sensitive bands are mainly in the visible light and near-infrared ranges. When using the CR spectrum for the inversion of SOM content in the study area, there are sensitive bands in the visible light, near-infrared, and short-wave infrared ranges, with a wider range of selection.
Figure 5 shows the contour maps of three types of correlation coefficients between SOM content and spectral indices in the study area, where different values represent the absolute correlation coefficients between DSI, RSI, NDSI, and SOM. The contour maps of the correlation coefficients clearly demonstrate the distribution range of the characteristic indices that have a relatively high correlation coefficient.
In the original spectral data, the band combinations exhibiting a high correlation between SOM content and DSI are primarily situated in the range of 2160 to 2300 nm (Figure 5a). The range of band combinations showing a high correlation between SOM content and RSI or NDSI remains consistent and broader, spanning from 1400 to 2200 nm. Notably, NDSI achieves the highest correlation coefficient of 0.9094, with a band combination of 2004 nm and 1900 nm (Figure 5b,c).
In the Log(1/R) spectra (Figure 5d–f), the band combinations displaying a high correlation between SOM content and DSI are predominantly spread across ranges of 1400 to 1600 nm and 1900 to 2200 nm. The contour maps of correlation coefficients for RSI and NDSI exhibit similar distributions, with a narrower range of band combinations showing a high correlation primarily in the range of 2180 to 2280 nm. Notably, DSI achieves the highest correlation coefficient of 0.9081, with a band combination of 1900 nm and 2004 nm.
In the CR spectra (Figure 5g–i), the band combinations exhibiting a high correlation between SOM content and DSI are primarily concentrated in the narrow range of 2100 to 2300 nm. The contour maps of correlation coefficients for RSI and NDSI demonstrate similar distributions, with both being within the range of 2000 to 2280 nm. Notably, NDSI achieves the highest correlation coefficient of 0.9069, with a band combination of 2004 nm and 2180 nm.
Figure 4 shows that the correlation coefficients between reflectance at 2197 nm and 2266 nm and SOM range from −0.44 to −0.43 for the original spectra but significantly improve after calculating DI, RI, and NDI, with correlation coefficients exceeding 0.82 in absolute value. The Log(1/R) spectra exhibit a significantly improved correlation with SOM after calculating DI, RI, and NDI at 1900 nm, 2003 nm, and 2005 nm. Similarly, the CR spectra show a significantly improved correlation with SOM for spectral indices calculated at 2267 nm, 2202 nm, and 2200 nm. This indicates that after appropriate spectral index calculations, the spectral reflectance in different bands enhances the correlation with SOM, thereby improving the accuracy of modeling and prediction to a certain extent.
The sensitive bands of different spectral transformations and spectral indices and their correlations are summarized in Table 3.
The normalized difference spectral index based on reflectance R (NDSI-R) has a simple form and good performance, so a three-band normalized spectral index was constructed by adding a third band λk to the existing two-band spectral index, NDSI (λi, λj).
Ten two-band spectral indices with correlation coefficients above 0.7 with SOM were selected. A total of 10 sets of three-band spectral indices were constructed by iterating through the bands from 500 to 2400 nm and using Equation (6) to calculate every possible combination (10 × 1901). The three-band spectral index with the strongest correlation in each set was selected. As shown in Table 4, compared with the two-band spectral index, the vast majority of the three-band spectral indices exhibited an improved correlation with SOM.
N D S I ( λ i , λ j , λ k ) = R ( λ i ) R ( λ j ) R ( λ k ) R ( λ i ) + R ( λ j ) + R ( λ k )
When selecting spectral indices, it is crucial to ensure that the input matrix for EPO is not too small. Hence, from the nine different spectral transformations and operations with a correlation with SOM above 0.82 (Figure 6), collinearity was evaluated using the Variance Inflation Factor (VIF). Subsequently, a total of 190 spectral indices, comprising 180 two-band and 10 three-band indices, were selected to replace the wet soil reflectance matrix as the input matrix for both the EPO and DS methods.

3.3. EPO-PLS and DS-PLS Prediction Results after Using Spectral Index

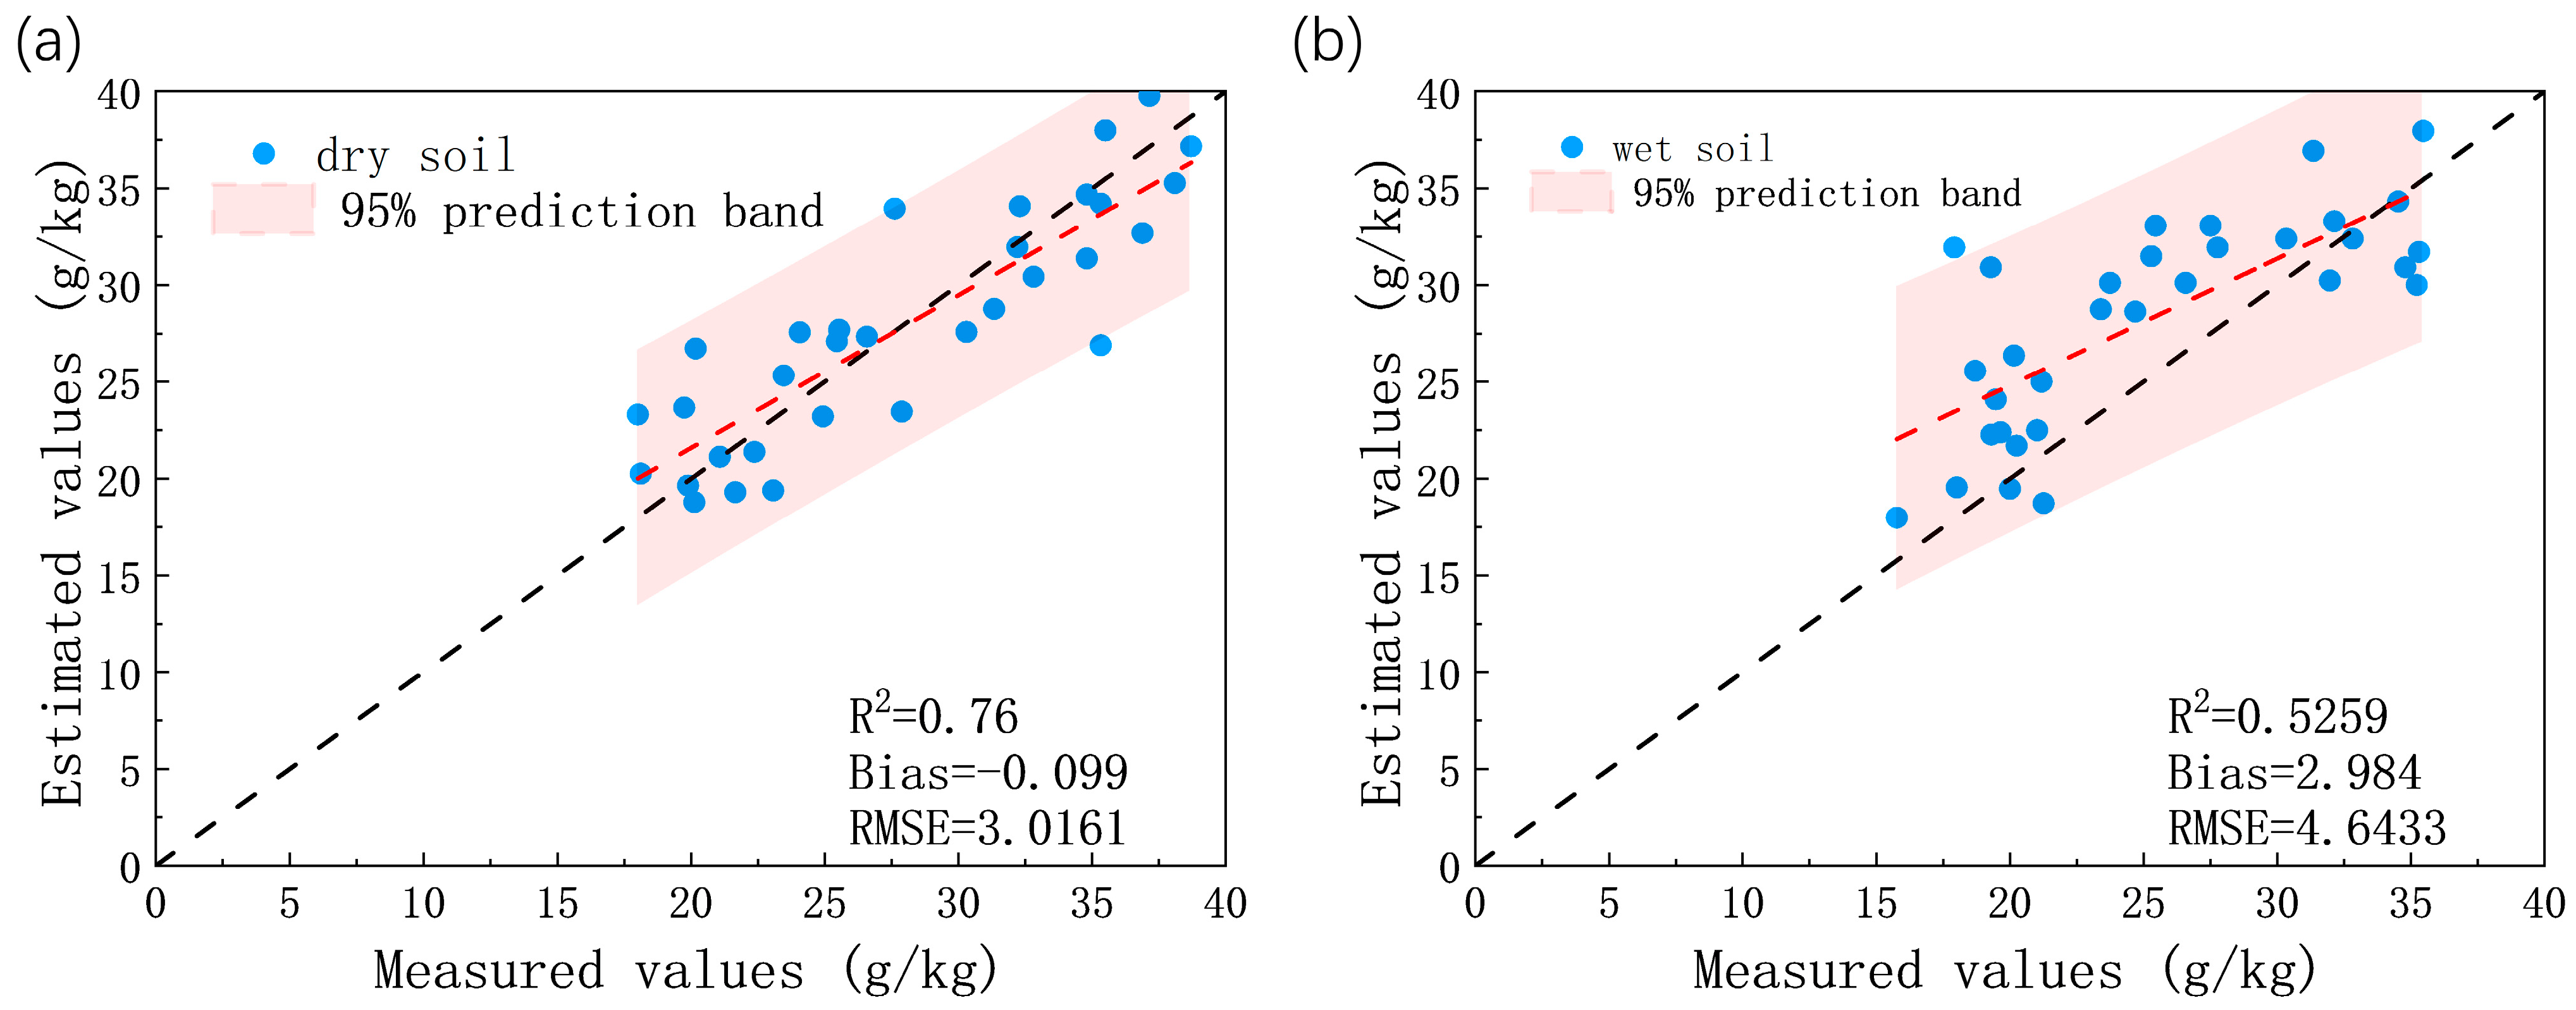
3.3.1. PLS Prediction of Wet Soil and Dry Soil

When no soil moisture correction was applied, the R2 for wet soil was 0.5259, much lower than the R2 for dry soil (0.76), and RMSEp was 4.6433 (Figure 7a,b). The high prediction error for wet soil using PLS prediction indicates that the prediction accuracy is significantly reduced when soil samples contain a certain amount of water, and the model cannot accurately estimate SOM under varying soil moisture conditions. This indicates that the model is unable to accurately estimate SOM under varying soil moisture conditions, underscoring the necessity to develop an effective soil moisture correction algorithm.

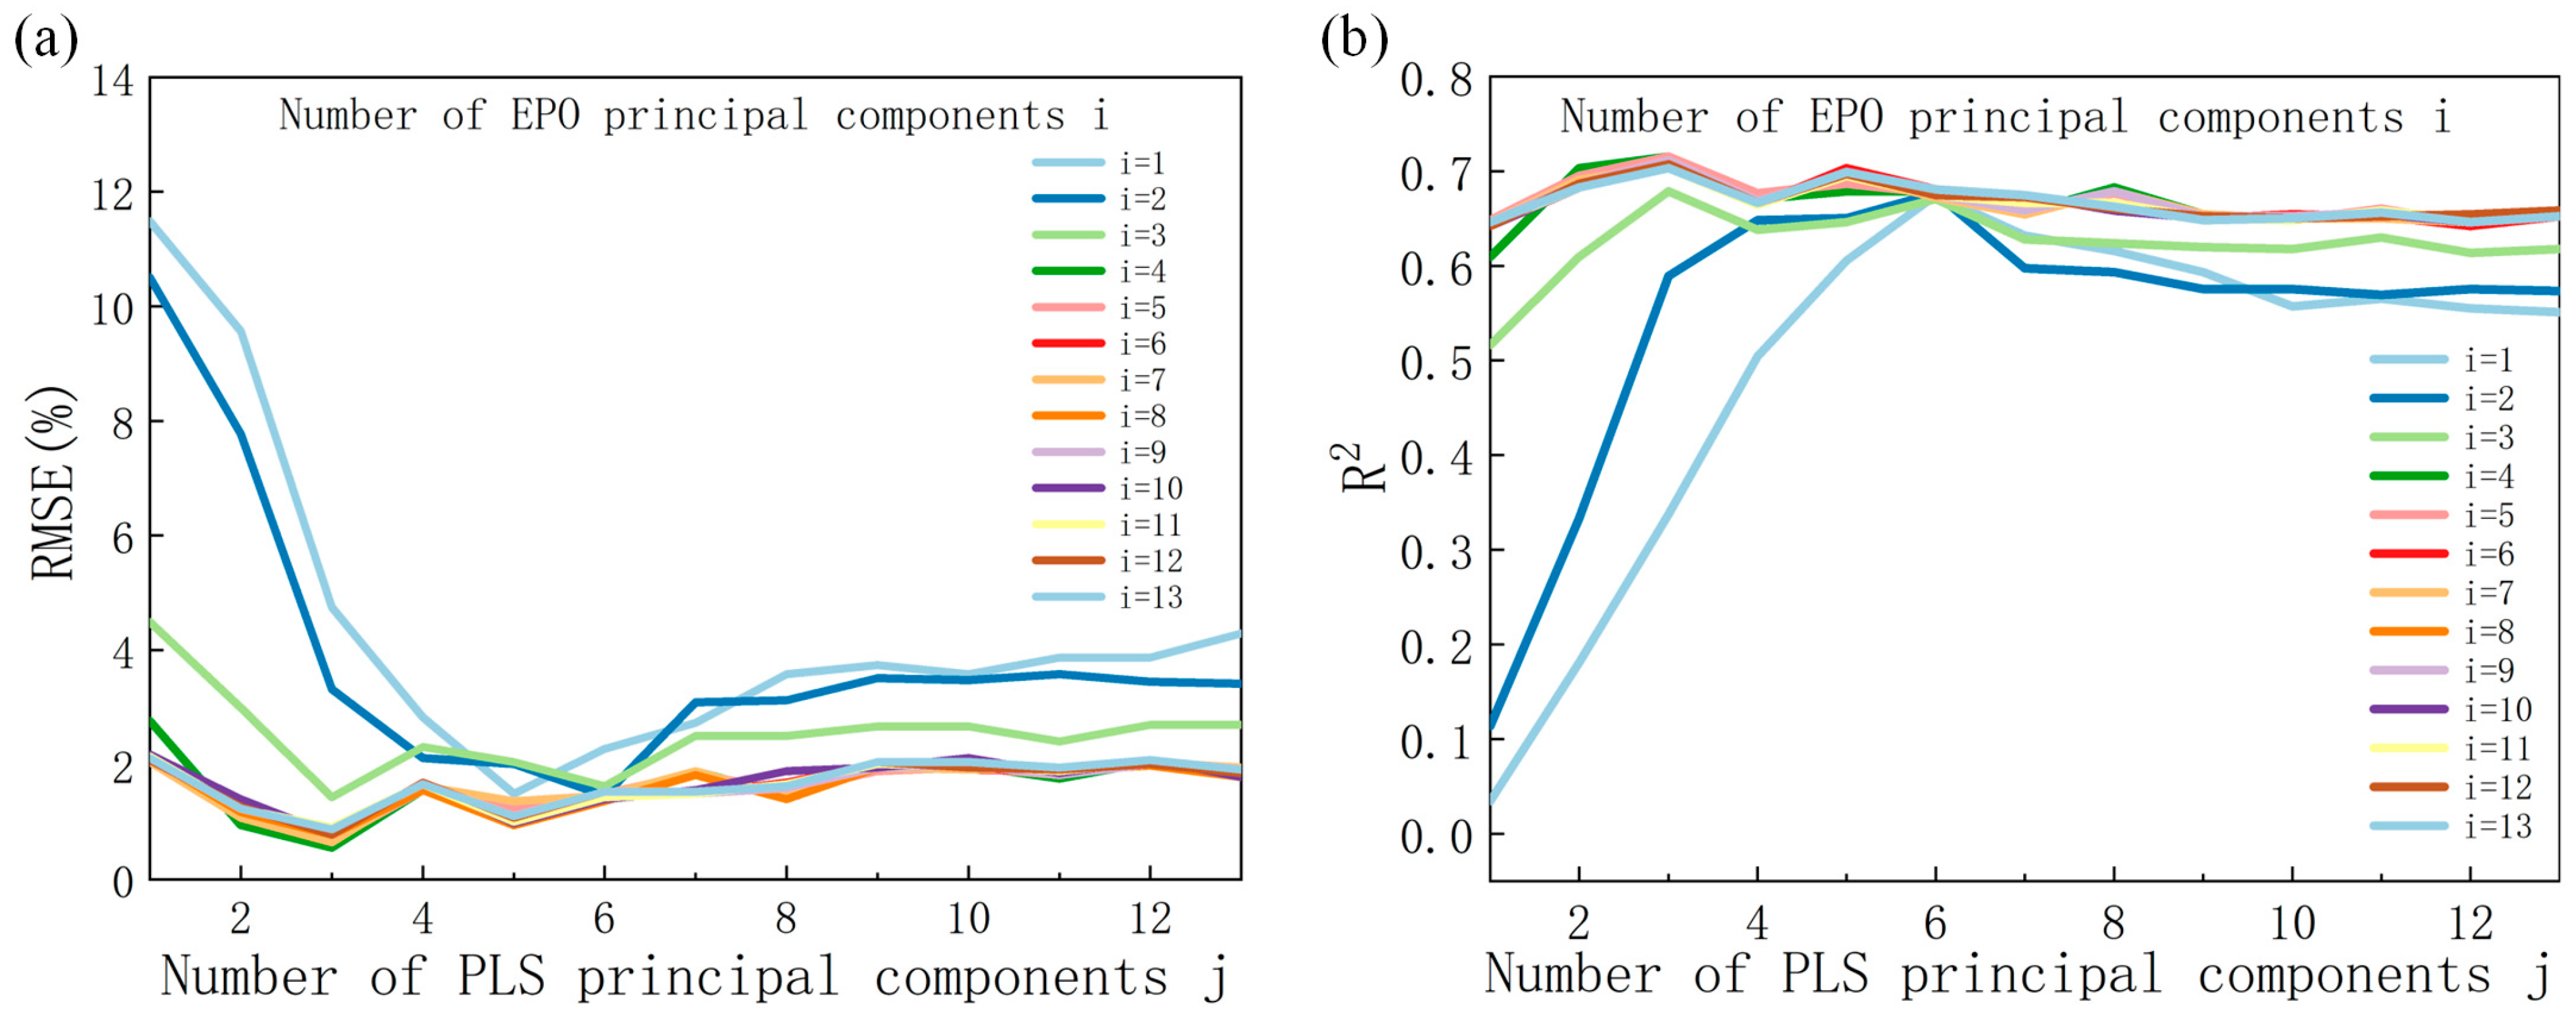
3.3.2. Model of Spectral Index Combined with EPO

In this model, the dimensions (i) of EPO and the optimal number of factors (j) in PLS need to be further optimized to improve the prediction accuracy of the EPO-PLS model. The RMSE value and R2 in the model are used as criteria to determine the best parameter combination. The cross-validation RMSE curves generated by different combinations of i and j in the EPO-PLS model are shown in Figure 8a. The optimization range for dimension i in the EPO-PLS model is 1 to 13, and the optimal range for the number of factors j is 1 to 13. The results show that there is no significant decrease in RMSE value after four PLS factors, and the lowest RMSE value is achieved when the EPO dimension is 4. The correlation coefficient error (R2) curve is shown in Figure 8b, and the model’s R2 value reaches the maximum when i = 4 and j = 4. Therefore, i = 4 and j = 4 is the best parameter combination for subsequent modeling analysis.
After SMC correction by EPO, the R2 of the EPO-PLS model is 0.63, and the RMSEp is 4.1021, indicating a moderate accuracy for the model. This model can be used to roughly estimate SOM under different moisture gradients (Figure 9a). Compared with Figure 7b, the prediction accuracy has been improved after correction, with an increase in the R2 of 0.1041, indicating the feasibility of using EPO to remove the influence of SMC and improve the accuracy of SOM estimation. The R2 of the SI EPO-PLS model, which combines spectral indices and EPO for modeling analysis, is 0.735, and the RMSEp is 3.4102. This model demonstrates the capability to accurately estimate SOM under varying moisture gradients, showcasing good model accuracy, low bias, and strong explanatory power (Figure 9b).

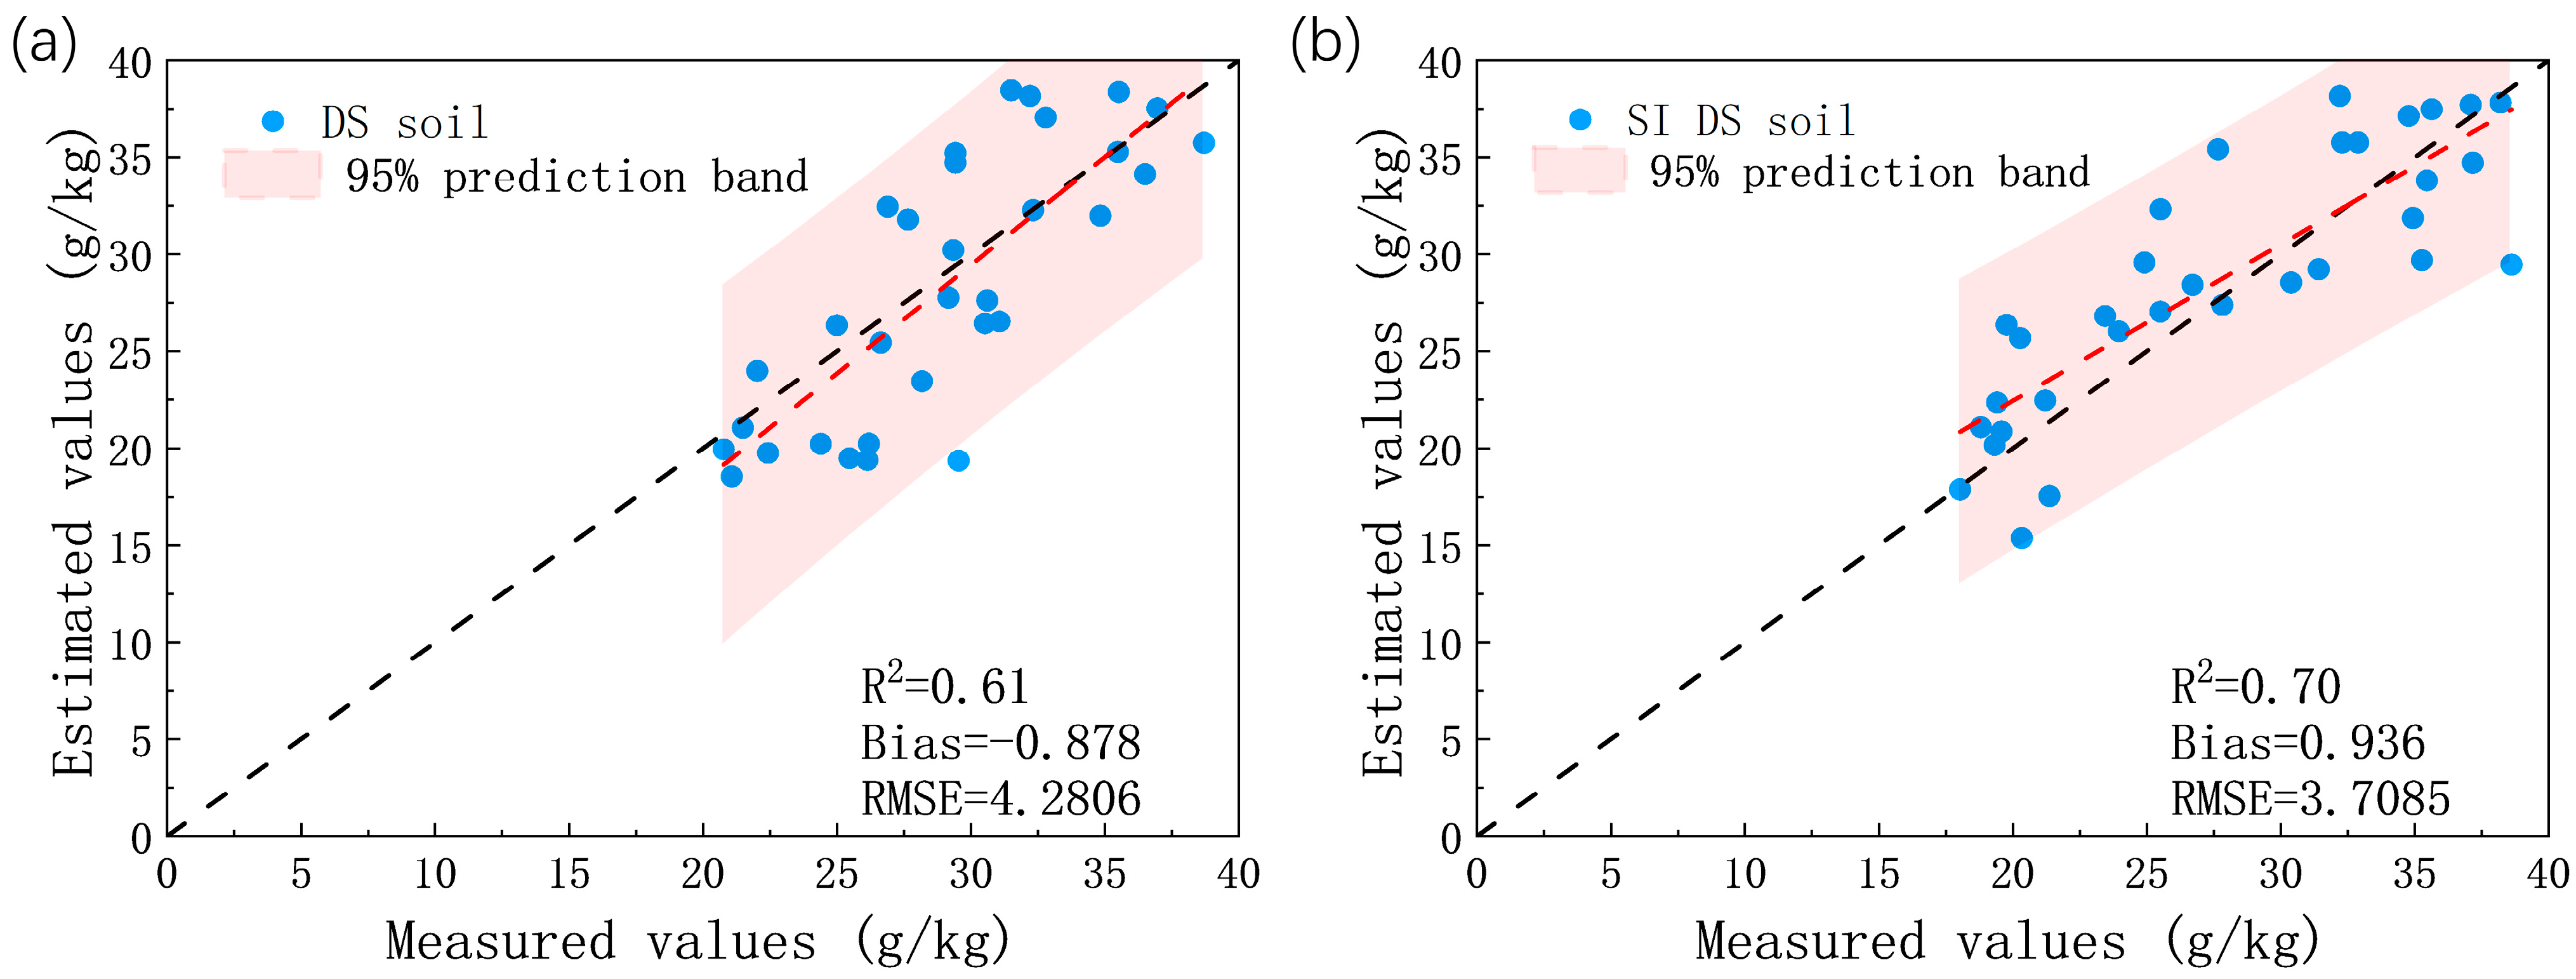
3.3.3. Model of Spectral Index Combined with DS

To further verify the superiority of spectral index processing, an analysis was conducted on the combination modeling of spectral indices with the DS, as shown in Figure 10. Compared to the DS-PLS model, the SI DS-PLS model, which incorporates spectral indices, showed an R2 improvement of 0.09 and a decrease in RMSEp of 0.5721, indicating an enhancement in prediction accuracy. However, there is still a gap compared to the prediction results for dry soil (R2 = 0.76, RMSEp = 3.0161). When comparing the prediction accuracy of EPO-PLS (Figure 9a) and DS-PLS (Figure 10a), it can be inferred that the effectiveness of EPO in water removal surpasses DS in small-sample prediction.

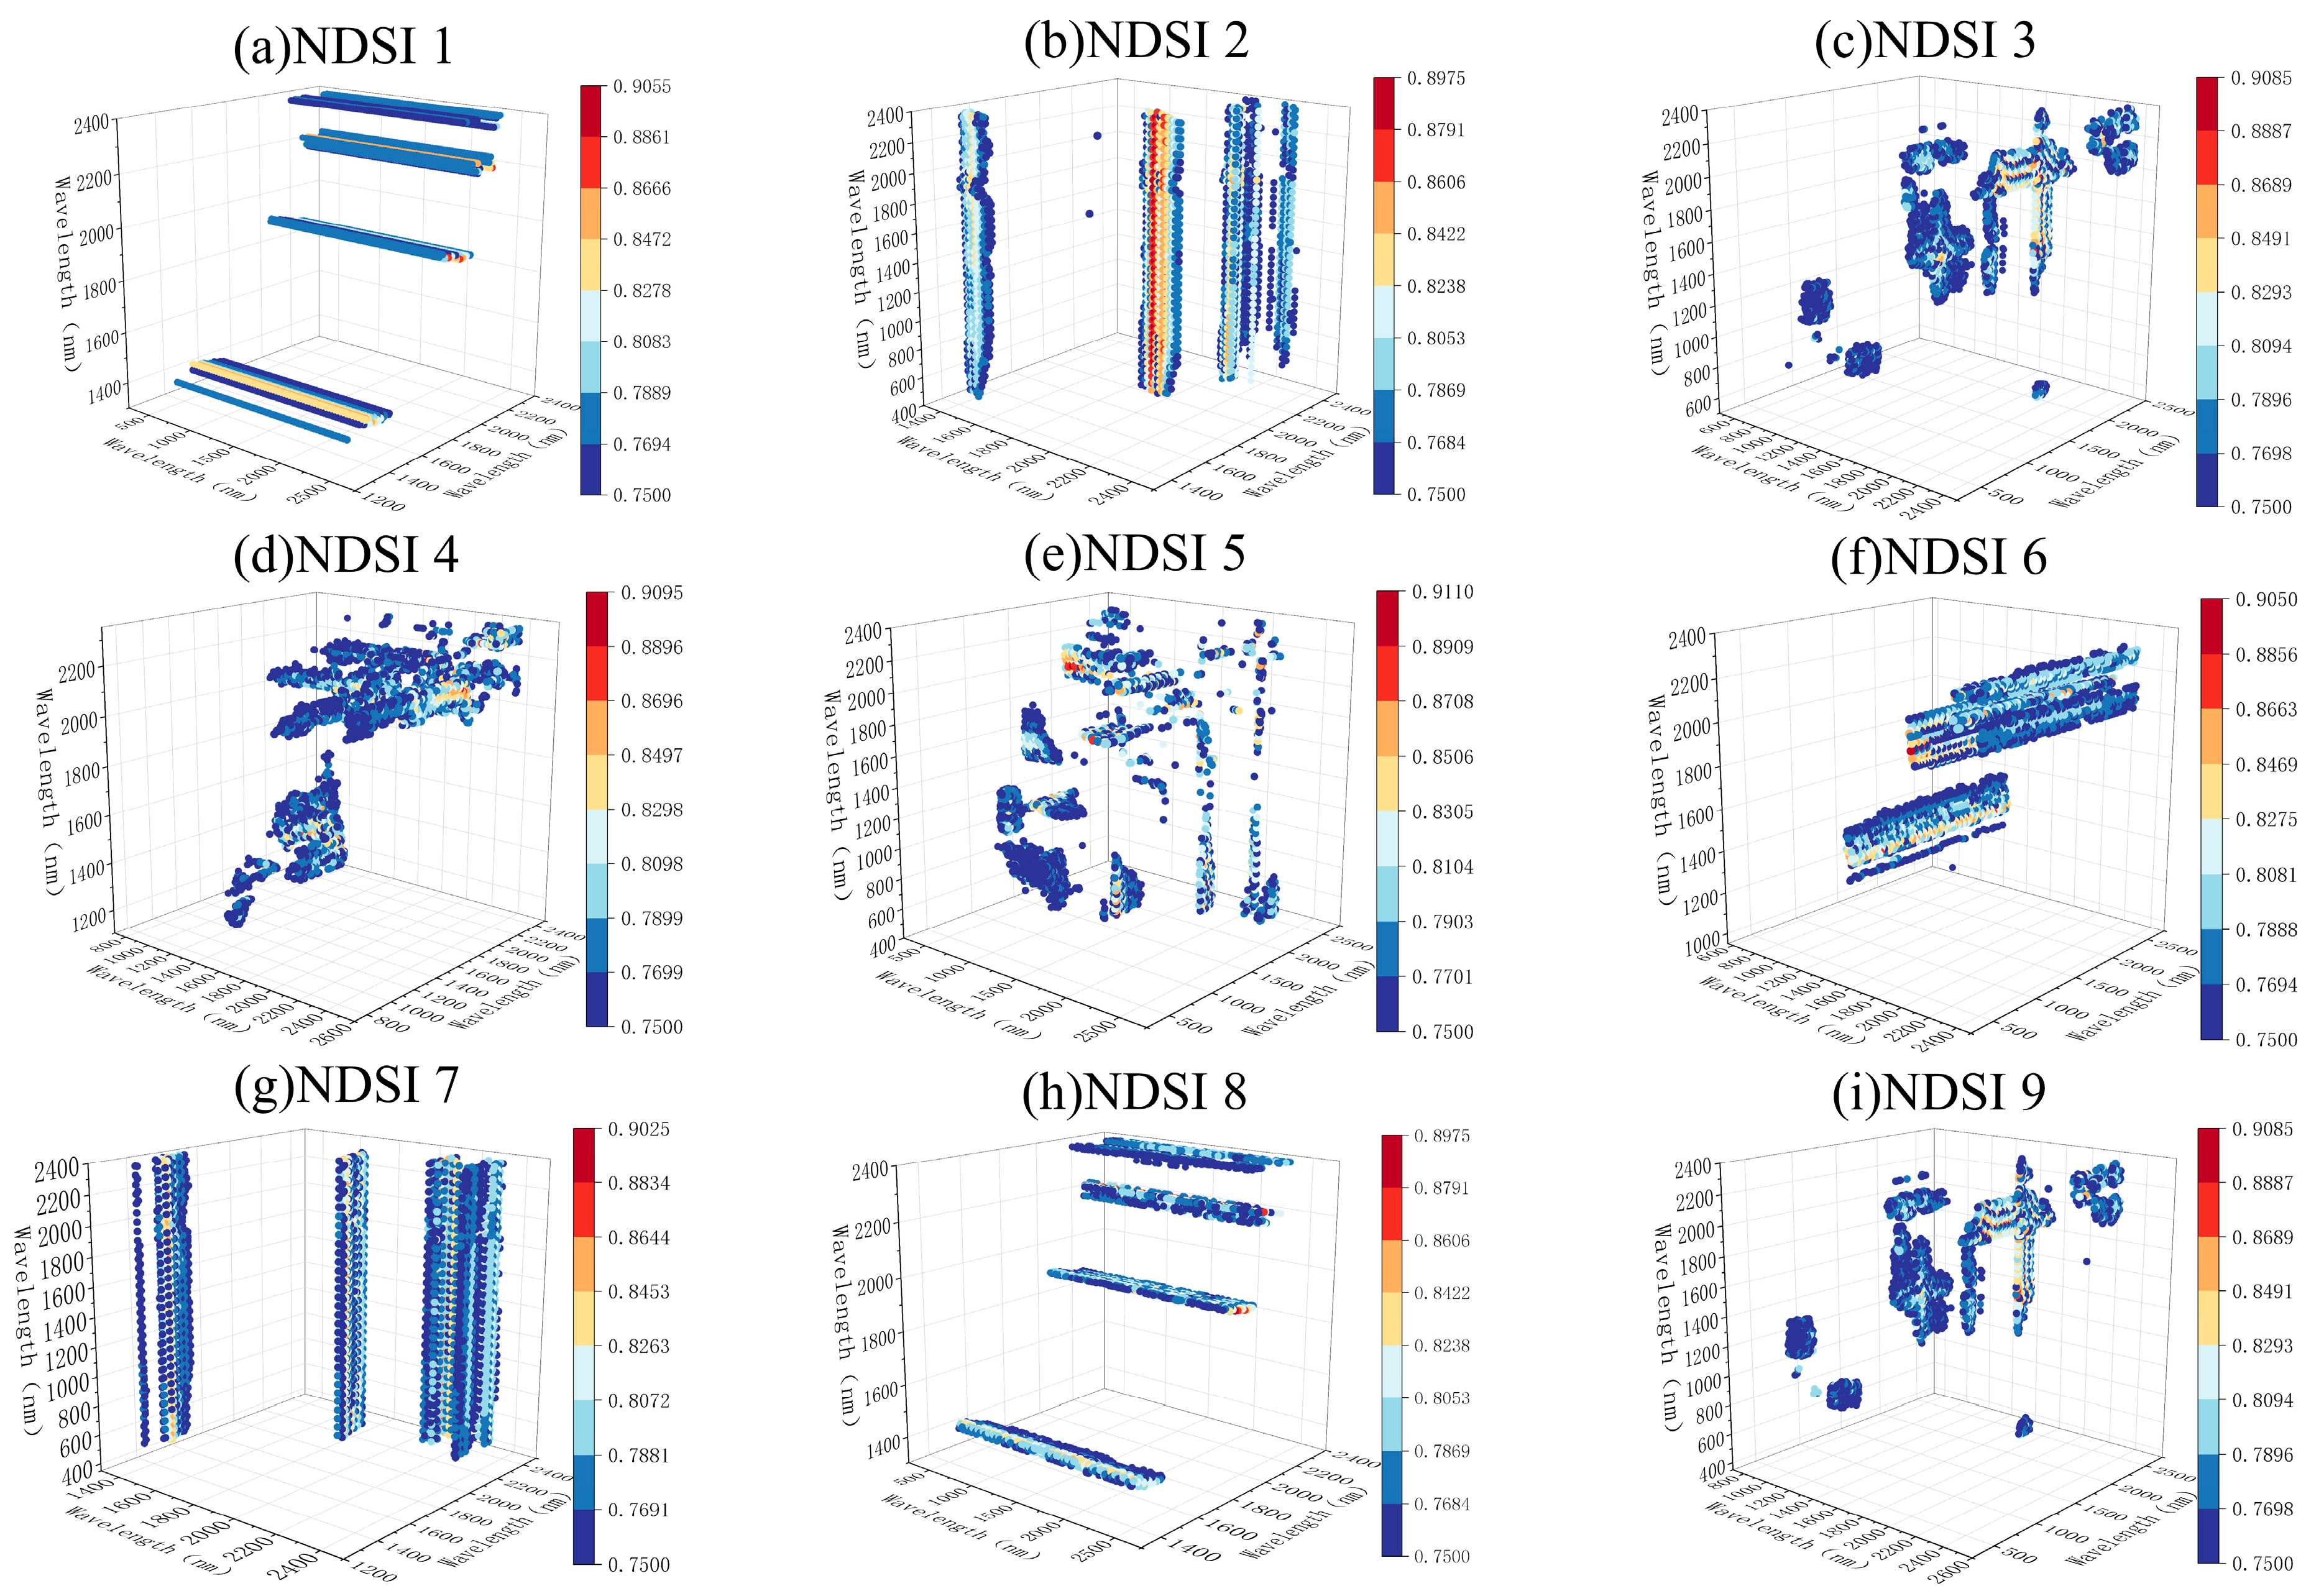
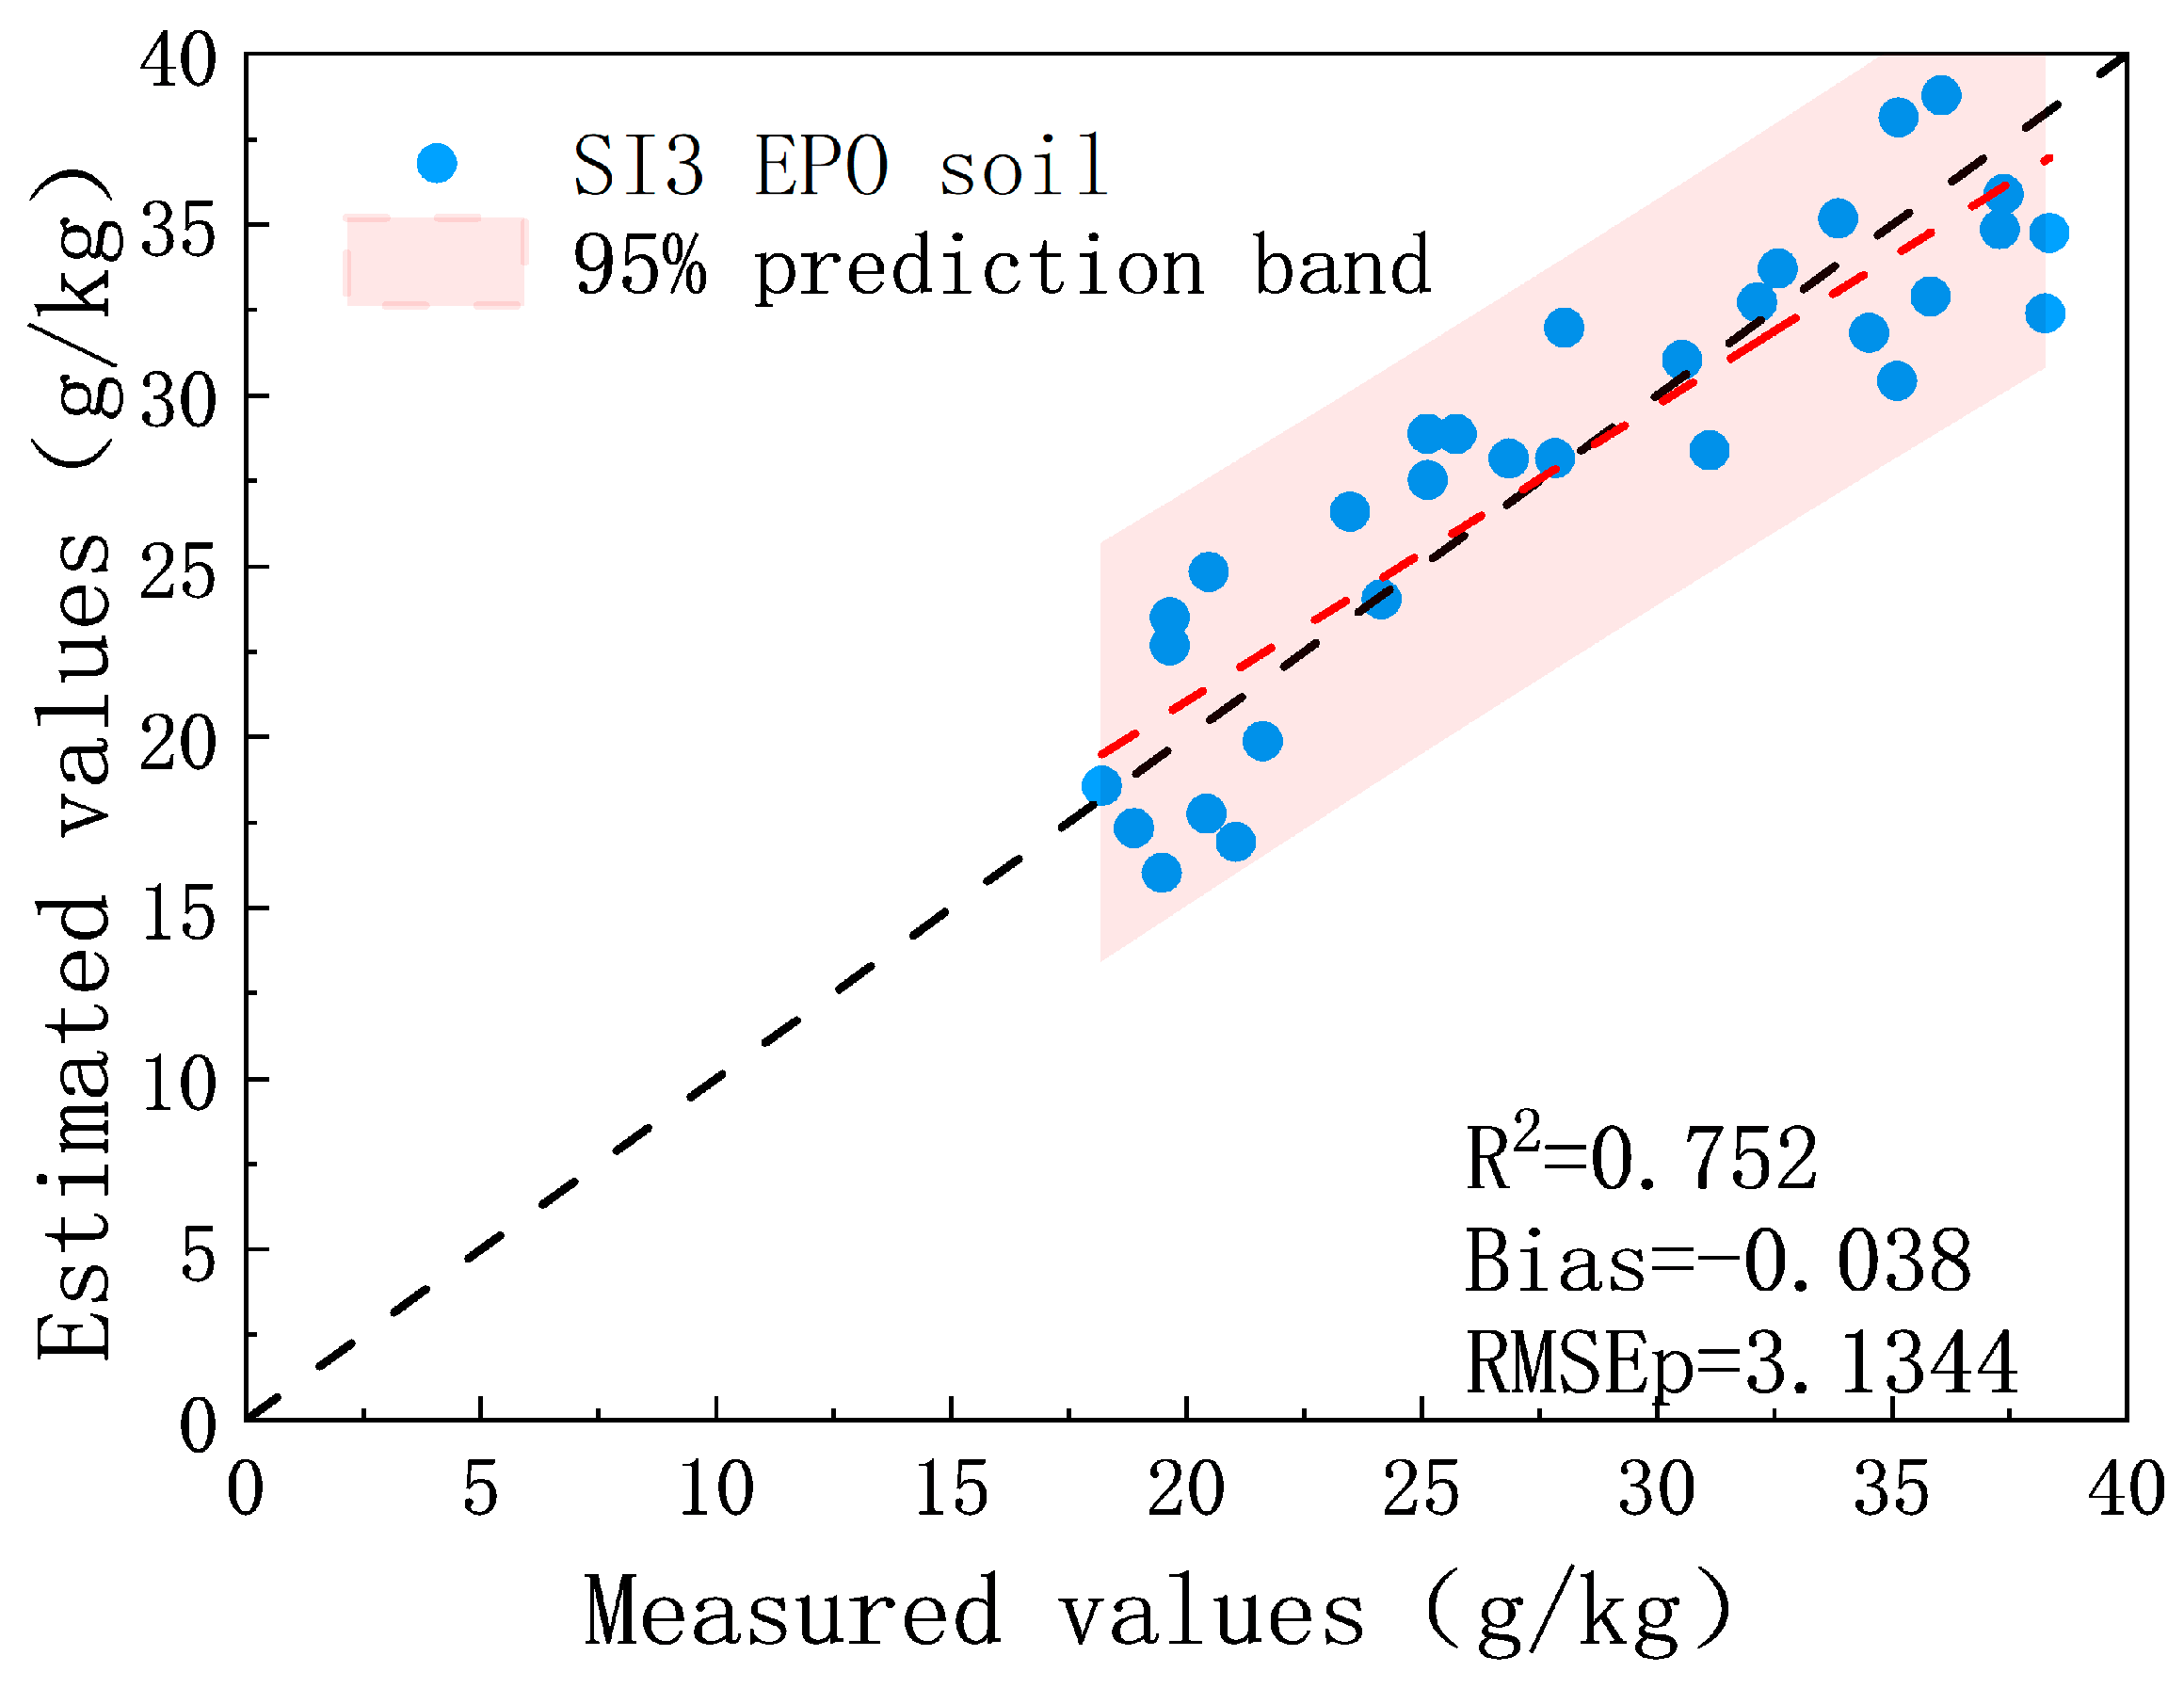
3.4. EPO-PLS Prediction Results after Using Three-Band Spectral Index

Comparing the effects of two different removal methods, full-band EPO and DS, on the estimation of SOM, it can be concluded that both SMC correction methods can alleviate the influence of soil moisture. However, in small-sample prediction, the performance of EPO (R2 = 0.63, RMSEp = 4.1021) is superior to DS (R2 = 0.61, RMSEp = 4.2806). Therefore, it is worth discussing whether the accuracy of SOM prediction can be further improved by discussing EPO combined with three-band spectral indices.
As mentioned above, the spectral index of the two bands uses three forms, of which the normalized form is the best. We apply the best of this form to three bands. This normalized three-band spectral index is not unique, so we introduce six coefficients.
The constructed spectral index form is as follows:
N D S I ( λ i , λ j , λ k ) = a R ( λ i ) + b R ( λ j ) + c R ( λ k ) d R ( λ i ) + e R ( λ j ) + f R ( λ k ) a , b , c , d , e , f [ 1 , 0 , 1 ]
The full spectrum (500–2400 nm) was traversed with band intervals of 5 nm and 10 nm. Spectral indices whose correlation with SOM was greater than 0.75 were screened and ranked by number. The top nine of them were selected and used to construct the three-band spectral indices in this paper. The resulting parameters are shown in Table 5.
It is worth noting that the nine initial spectral indices, arranged by their correlation coefficients with organic matter exceeding 0.75, remain consistent for both 5 nm and 10 nm intervals. This suggests that the bands sensitive to SOM constitute a distinct range, and the selection of wavelength intervals within this range is not significantly sensitive.
Figure 11 shows the contour map of the correlation coefficients between SOM content and nine three-band spectral indices in the study area. The contour map of the correlation coefficients clearly demonstrates the distribution range of characteristic indices with higher correlation coefficients.
In the selection of spectral indices, the input matrix for EPO should not be too small. Therefore, among the 9 three-band NDSIs with a correlation coefficient with SOM above 0.75, collinearity was detected using the Variance Inflation Factor (VIF). A total of 180 spectral indices were selected to replace the reflectance matrix as the input matrix for EPO. The predicted map obtained after removing the moisture information using EPO is shown in Figure 12.
The R2 value for the combined modeling analysis (SI3 EPO-PLS) utilizing three-band spectral indices and EPO is 0.752, with an RMSEp of 3.1344. Compared to SI EPO-PLS, the R2 increases by 0.022, and the RMSEp decreases by 0.3788. In comparison to EPO-PLS prediction, the R2 increases by 0.122, and the RMSEp decreases by 0.9677. This suggests that the combination of three-band spectral indices and EPO enables a more precise estimation of SOM across varying SMCs. This highlights the superior capacity of three-band spectral indices with respect to capturing SOM information compared to three-band spectral indices.

4. Discussion

4.1. Effect of SMC on Spectrum

When soil moisture content (SMC) is equal to or less than 16%, variations in soil spectral reflectance are notably influenced by changes in moisture content. However, when SMC exceeds 16%, the decrease in soil spectral reflectance occurs at a slower rate. Notably, between 20% and 22% SMC, the two curves nearly coincide (Figure 2). This observation indicates that at higher SMC levels, spectral reflectance becomes less sensitive to changes in moisture content. Principal Component Analysis (PCA) was conducted on the original spectra as well. Principal Component 1 and Principal Component 2 (PC1, PC2) collectively account for over 90% of the spectral variance within the dataset (Figure 3). Notably, dry soil samples exhibit clear differentiation, while the scores for the moist samples show overlapping PC1 and PC2 values, failing to form distinct clusters. However, clusters corresponding to low SMC levels (12%, 14%, 16%) and high SMC levels (18%, 20%, 22%) are discernible. Moisture alters the physical structure and color of the soil, resulting in diminished soil spectral reflectance. At a higher moisture content, changes in color become less pronounced. As soil moisture increases, water absorption by soil particles fills both micropores and macropores, altering the relative refractive index of the soil particle surface. However, this has minimal impact on reflectance when water covers these pores. This observation aligns with the findings of Yudina [34].
Therefore, an efficient and useful soil moisture elimination algorithm must be used to correct the spectra and reduce the impact of SMC on SOM prediction.

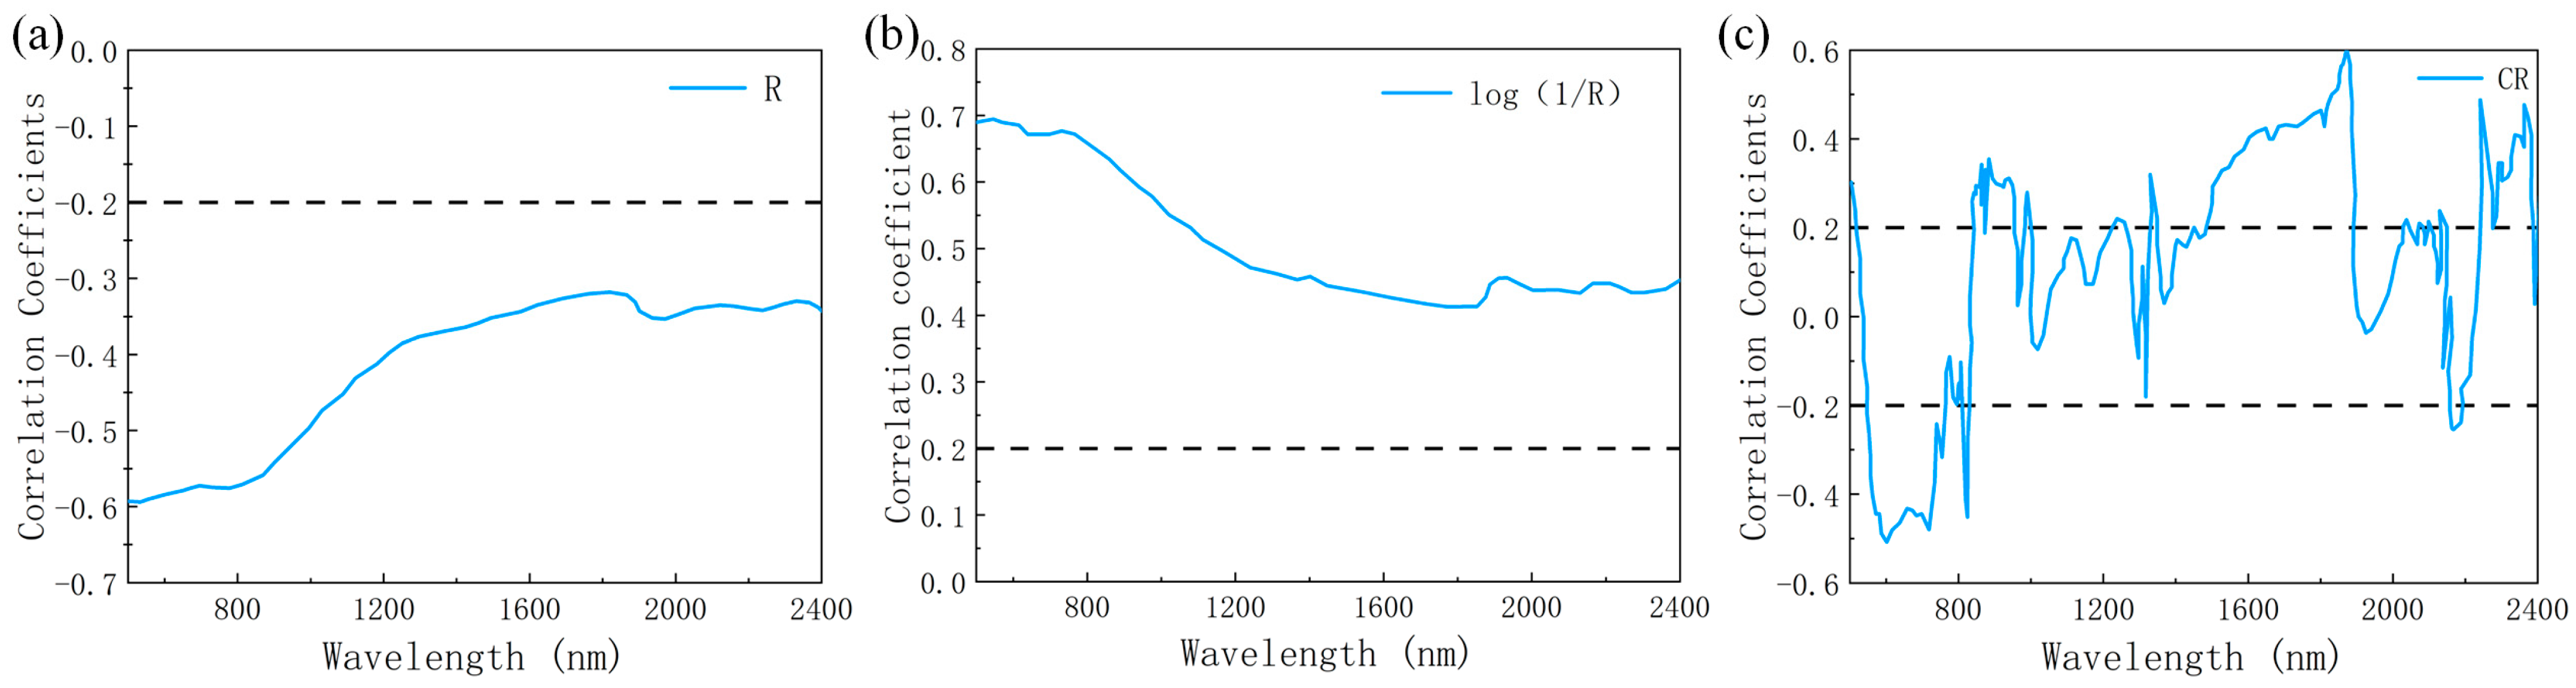
4.2. The Influence of the Spectral Index on the Correlation between Spectrum and SOM

Detecting soil organic matter content is pivotal for assessing soil fertility. Presently, most research relies on full-spectrum spectral data to predict soil properties. However, soil hyperspectral curves encompass multiple bands, leading to varying degrees of correlation among them and resulting in information redundancy [35]. In the spectral detection of SOM, extracting sensitive bands through spectral preprocessing is crucial to reduce redundant information from full-band modeling. This study focuses on extracting such sensitive bands of SOM. By utilizing soil spectral indices, the input variables for soil attribute spectral modeling can be streamlined, enhancing modeling efficiency. In summary, the one-band spectral index suits simple applications, the two-band spectral index offers more informative features, and the three-band spectral index provides comprehensive analysis capabilities. Moreover, this study visualizes the correlation between common spectral indices and measured properties in a visual format, taking into account the interrelationships between spectra.
This study found that the sensitive bands for the inversion of SOM content are mainly located at 500–900 nm, 1450–1700 nm, and 2200–2400 nm (Figure 4), which corresponds to previous research [36]. After calculating spectral reflectance in various bands using suitable characteristic indices, the correlation between spectral data and SOM was found to be strengthened, thereby enhancing modeling prediction accuracy to some degree. This paper introduces a method for constructing a three-band spectral index which shows a considerable improvement in correlation with SOM compared to the two-band spectral index. The directly constructed three-band spectral index exhibits a stronger correlation with SOM (Figure 11). The information of the three bands provides more comprehensive data characteristics, but it needs to process more band information, which requires a large amount of calculation and requires more careful screening.

4.3. The Model Advantage of Spectral Index Combined with Water Removal Algorithm

This study combined EPO with spectral index combination modeling, which can effectively deal with nonlinear influencing factors in different SMCs and improve the accuracy of SOM estimation (Figure 9). Compared with the EPO-PLS model, the R2 of the SI EPO-PLS model increased by 0.1, and the RMSE decreased by 0.7919. R2 is 0.745, which is close to the prediction result for dry soil in Figure 7b (R2 = 0.76, RMSE = 3.0161). The model has been improved from the usable level to the better level, which shows that the method of combining EPO and the spectral index can effectively handle the nonlinear influencing factors in different SMCs and improve the accuracy of SOM. In order to further verify the excellence of spectral index processing data, the method of combining DS and the spectral index was analyzed. This shows that the spectral index, combined with other algorithms, can be used to deal with non-linear influencing factors in different SMCs and further improve SOM accuracy, and it may be generalizable (Figure 10). Comparing the prediction accuracy of EPO-PLS (Figure 9a) and DS-PLS (Figure 10a) shows that the ability of EPO to remove SMC is better than that of DS in small-sample prediction.
At the same time, this method is comparable to other SOM prediction methods. In 2023, Cao proposed a dynamic normalized difference index method, which improved the R2 of organic matter prediction by 0.14 [37]. In the same year, Wu proposed the SESMRT model, which improved the R2 by 0.0064 [38]. The Kubelka–Munk theory-based spectral correction model for soil moisture removal proposed by Ou increased the R2 by 0.22 [39]. In 2024, Wu proposed an RF machine learning model combined with CARS selected feature bands to increase the R2 by 0.2 [40]. Comparing with other techniques published in recent years, the accuracy of SOM prediction by this method is higher than the average level (R2 increased by 0.23).
To further enhance the pretreatment method for spectral reflectance and improve the accuracy of SOM estimation, future research could focus on establishing an effective physical model combined with statistical methods or other physical models [41]. Additionally, expanding the sample set used in this study could provide more comprehensive insights for further in-depth discussion.

5. Conclusions

This study explores the feasibility of using two-band and three-band mixed spectral indices, a three-band spectral index, and two moisture removal algorithms (EPO and DS) to estimate SOM in soil affected by moisture. As shown in previous research results, the spectral reflectance decreases nonlinearly with the increase in water content, and the SOM estimation performance decreases significantly (R2: 0.76–0.5259, RMSEp: 3.0161–4.6433 g/kg). The spectral index after spectral transformation can effectively improve the correlation between spectral information and SOM. In general, the estimation accuracy of the spectral index combined with the water removal algorithm (R2 = 0.752, RMSEp = 3.1344 g/kg) is better than the estimation accuracy of the full-spectrum data (R2 = 0.63, RMSEp = 4.1021 g/kg). The three-band spectral index is better than the two-band and three-band mixed spectral indices (R2 = 0.735, RMSEp = 3.4102 g/kg). In addition, we also compared the effects of two different removal methods (EPO and DS), based on full-band modeling, on soil SOM estimation. It can be concluded that both of the soil moisture correction methods tested can alleviate the impact of soil moisture. However, in small-sample prediction, the performance of EPO is higher than that of DS (R2 = 0.61, RMSEp = 4.2806 g/kg).

Author Contributions

Conceptualization, J.X.; methodology, J.X.; software, J.X.; validation, J.X., J.Y. and C.Y.; formal analysis, J.X.; investigation, J.X.; resources, J.X. and Y.L.; data curation, J.X.; writing—original draft preparation, J.X.; writing—review and editing, C.Y., J.Y. and Y.L.; visualization, J.X. and J.Y.; supervision, C.Y. and J.Y.; project administration, C.Y.; funding acquisition, C.Y. All authors have read and agreed to the published version of the manuscript.

Funding

This research was funded by the Jilin Key R&D Program of China under Grant 20230201036GX; it was also funded in part by the National Natural Science Foundation of China (NSFC) under Grant 62105331 and Grant 62275114.

Data Availability Statement

The original contributions presented in the study are included in the article, further inquiries can be directed to the corresponding author.

Acknowledgments

The editor and the reviewers are thanked for their helpful comments and criticisms of the initial draft of this paper.

Conflicts of Interest

The authors declare no conflicts of interest.

References

  1. Li, Q.; Wang, L.; Fu, Y.; Lin, D.; Hou, M.; Li, X.; Hu, D.; Wang, Z. Transformation of soil organic matter subjected to environmental disturbance and preservation of organic matter bound to soil minerals: A review. J. Soils Sediments 2023, 23, 1485–1500. [Google Scholar] [CrossRef]
  2. Yu, B.; Yan, C.; Yuan, J.; Ding, N.; Chen, Z. Prediction of soil properties based on characteristic wavelengths with optimal spectral resolution by using Vis-NIR spectroscopy. Spectrochim. Acta Part A Mol. Biomol. Spectrosc. 2023, 293, 122452. [Google Scholar] [CrossRef]
  3. Debaene, G.; Bartmiński, P.; Siłuch, M. In Situ VIS-NIR Spectroscopy for a Basic and Rapid Soil Investigation. Sensors 2023, 23, 5495. [Google Scholar] [CrossRef]
  4. Hu, W.; Shen, Q.; Zhai, X.; Du, S.; Zhang, X. Impact of Environmental Factors on the Spatiotemporal Variability of Soil Organic Matter: A Case Study in a Typical Small Mollisol Watershed of Northeast China. J. Soils Sediments 2021, 21, 736–747. [Google Scholar] [CrossRef]
  5. Wu, M.; Dou, S.; Lin, N.; Jiang, R.; Zhu, B. Estimation and Mapping of Soil Organic Matter Content Using a Stacking Ensemble Learning Model Based on Hyperspectral Images. Remote Sens. 2023, 15, 4713. [Google Scholar] [CrossRef]
  6. Tan, K.; Wang, H.; Chen, L.; Du, Q.; Du, P.; Pan, C. Estimation of the Spatial Distribution of Heavy Metal in Agricultural Soils Using Airborne Hyperspectral Imaging and Random Forest. J. Hazard. Mater. 2020, 382, 120987. [Google Scholar] [CrossRef]
  7. Yuan, J.; Wang, X.; Yan, C.-X.; Wang, S.-R.; Ju, X.-P.; Li, Y. Soil Moisture Retrieval Model for Remote Sensing Using Reflected Hyperspectral Information. Remote Sens. 2019, 11, 366. [Google Scholar] [CrossRef]
  8. Arif, M.; Qi, Y.; Dong, Z.; Wei, H. Rapid Retrieval of Cadmium and Lead Content from Urban Greenbelt Zones Using Hyperspectral Characteristic Bands. J. Clean. Prod. 2022, 374, 133922. [Google Scholar] [CrossRef]
  9. Yu, L.; Hong, Y.; Geng, L.; Zhou, Y.; Zhu, Q.; Cao, J.; Nie, Y. Hyperspectral estimation of soil organic matter content based on partial least squares regression. Trans. Chin. Soc. Agric. Eng. 2015, 31, 103–109. (In Chinese) [Google Scholar]
  10. Chang, R.; Chen, Z.; Wang, D.; Guo, K. Hyperspectral Remote Sensing Inversion and Monitoring of Organic Matter in Black Soil Based on Dynamic Fitness Inertia Weight Particle Swarm Optimization Neural Network. Remote Sens. 2022, 14, 4316. [Google Scholar] [CrossRef]
  11. Ou, D.; Tan, K.; Lai, J.; Jia, X.; Wang, X.; Chen, Y.; Li, J. Semi-supervised DNN regression on airborne hyperspectral imagery for improved spatial soil properties prediction. Geoderma 2021, 385, 114875. [Google Scholar] [CrossRef]
  12. Zhang, X.; Sun, W.; Cen, Y.; Zhang, L.; Wang, N. Predicting cadmium concentration in soils using laboratory and field reflectance spectroscopy. Sci. Total Environ. 2019, 650, 321–334. [Google Scholar] [CrossRef]
  13. Ng, W.; Minasny, B.; Jones, E.; McBratney, A. To spike or to localize? Strategies to improve the prediction of local soil properties using regional spectral library. Geoderma 2022, 406, 115501. [Google Scholar] [CrossRef]
  14. Padarian, J.; Minasny, B.; McBratney, A. Using deep learning to predict soil properties from regional spectral data. Geoderma Reg. 2019, 16, e00198. [Google Scholar] [CrossRef]
  15. Zhang, Z.; Ding, J.; Zhu, C.; Wang, J.; Ma, G.; Ge, X.; Li, Z.; Han, L. Strategies for the efficient estimation of soil organic matter in salt-affected soils through Vis-NIR spectroscopy: Optimal band combination algorithm and spectral degradation. Geoderma 2021, 382, 114729. [Google Scholar] [CrossRef]
  16. Huang, S.; Ding, J.; Zou, J.; Liu, B.; Zhang, J.; Chen, W. Soil moisture retrival based on sentinel-1 imagery under sparse vegetation coverage. Sensors 2019, 19, 589. [Google Scholar] [CrossRef]
  17. Knadel, M.; Castaldi, F.; Barbetti, R.; Ben-Dor, E.; Gholizadeh, A.; Lorenzetti, R. Mathematical techniques to remove moisture effects from visible-near-infrared-shortwave-infrared soil spectra—Review. Appl. Spectrosc. Rev. 2023, 58, 629–662. [Google Scholar] [CrossRef]
  18. Liu, Y.; Deng, C.; Lu, Y.; Shen, Q.; Zhao, H.; Tao, Y.; Pan, X. Evaluating the characteristics of soil Vis-NIR spectra after the removal of moisture effect using external parameter orthogonalization. Geoderma 2020, 376, 114568. [Google Scholar] [CrossRef]
  19. Liu, Y.; Lu, Y.; Chen, D.; Zheng, W.; Ma, Y.; Pan, X. Simultaneous estimation of multiple soil properties under moist conditions using fractional-order derivative of Vis-NIR spectra and deep learning. Geoderma 2023, 438, 116653. [Google Scholar] [CrossRef]
  20. Lin, L.; Wang, Y.; Liu, X.; Zhang, X. Water-absorption-trough dewatering machine for estimation of organic carbon in moist soil. Environ. Pollut. 2021, 284, 117445. [Google Scholar] [CrossRef]
  21. Yang, P.; Wang, Y.; Hu, B.; Li, S.; Chen, S.; Luo, D.; Peng, J. Predicting soil organic carbon content using simulated insitu spectra and moisture correction algorithms in southern Xinjiang, China. Geoderma Reg. 2024, 37, e00783. [Google Scholar] [CrossRef]
  22. Tan, Y.; Jiang, Q.; Yu, L.; Liu, H.; Zhang, B. Reducing the moisture effect and improving the prediction of soil organic matter with VIS-NIR spectroscopy in black soil area. IEEE Access 2021, 9, 5895–5905. [Google Scholar] [CrossRef]
  23. Yang, M.; Chen, S.; Xu, D.; Zhao, X.; Shi, Z.; Qian, H.; Zhang, Z. Removing the moisture effect on predicting soil organic matter using vis-NIR spectroscopy with external parameter orthogonalization. Geoderma Reg. 2024, 37, e00797. [Google Scholar] [CrossRef]
  24. Roudier, P.; Hedley, C.; Lobsey, C.; Rossel, R.V.; Leroux, C. Evaluation of two methods to eliminate the effect of water from soil vis-NIR spectra for predictions of organic carbon. Geoderma 2017, 296, 98–107. [Google Scholar] [CrossRef]
  25. Munnaf, M.A.; Mouazen, A.M. Removal of external influences from on-line vis-NIR spectra for predicting soil organic carbon using machine learning. CATENA 2022, 211, 106015. [Google Scholar] [CrossRef]
  26. Hong, Y.; Yu, L.; Chen, Y.; Liu, Y.; Liu, Y.; Liu, Y.; Cheng, H. Prediction of soil organic matter by VIS-NIR spectroscopy using normalized soil moisture index as a proxy of soil moisture. Remote Sens. 2017, 10, 28. [Google Scholar] [CrossRef]
  27. Chen, H.Y.; Zhao, G.X.; Zhang, X.H.; Wang, R.Y.; Sun, L.; Chen, J.C. Improvement of soil organic matter content prediction accuracy by removing the influence of soil moisture in hyperspectral estimation. J. Agric. Eng. 2014, 30, 91–100. (In Chinese) [Google Scholar]
  28. Yu, B.; Yuan, J.; Yan, C.; Xu, J.; Ma, C.; Dai, H. Impact of Spectral Resolution and Signal-to-Noise Ratio in Vis-NIR Spectrometry on Soil Organic Matter Estimation. Remote Sens. 2023, 15, 4623. [Google Scholar] [CrossRef]
  29. Savitzky, A.; Golay, M.J.E. Smoothing and differentiation of data by simplified least squares procedures. Anal. Chem. 1964, 36, 1627–1639. [Google Scholar] [CrossRef]
  30. Roger, J.-M.; Chauchard, F.; Bellon-Maurel, V. EPO-PLS external parameter orthogonalisation of PLS application to temperature-independent measurement of sugar content of intact fruits. Chemom. Intell. Lab. Syst. 2003, 66, 191–204. [Google Scholar] [CrossRef]
  31. Minasny, B.; McBratney, A.B.; Bellon-Maurel, V.; Roger, J.-M.; Gobrecht, A.; Ferrand, L.; Joalland, S. Removing the effect of soil moisture from NIR diffuse reflectance spectra for the prediction of soil organic carbon. Geoderma 2011, 167–168, 118–124. [Google Scholar] [CrossRef]
  32. Wang, Y.; Hu, B.; Hong, Y.; Chen, S.; Zhao, C.; Peng, J. Minimize of moisture effects from laboratory simulations of in-situ Vis-NIR spectral for the prediction of soil salinity. Infrared Phys. Technol. 2024, 137, 105194. [Google Scholar] [CrossRef]
  33. Ji, W.; Rossel, R.A.V.; Shi, Z. Accounting for the effects of water and the environment on proximally sensed vis-NIR soil spectra and their calibrations. Eur. J. Soil Sci. 2015, 66, 555–565. [Google Scholar] [CrossRef]
  34. Yudina, A.; Klyueva, V.; Romanenko, K.; Fomin, D. Micro- within macro: How micro-aggregation shapes the soil pore space and water-stability. Geoderma 2022, 415, 115771. [Google Scholar] [CrossRef]
  35. Xie, S.; Ding, F.; Chen, S.; Wang, X.; Li, Y.; Ma, K. Prediction of soil organic matter content based on characteristic band selection method. Spectrochim. Acta Part A Mol. Biomol. Spectrosc. 2022, 273, 120949. [Google Scholar] [CrossRef]
  36. Gu, X.; Wang, Y.; Sun, Q.; Yang, G.; Zhang, C. Hyperspectral inversion of soil organic matter content in cultivated land based on wavelet transform. Comput. Electron. Agric. 2019, 167, 105053. [Google Scholar] [CrossRef]
  37. Cao, J.; Yang, H. A dynamic normalized difference index for estimating soil organic matter concentration using visible and near-infrared spectroscopy. Ecol. Indic. 2023, 147, 110037. [Google Scholar] [CrossRef]
  38. Wu, F.; Tan, K.; Wang, X.; Ding, J.; Liu, Z. A novel semi-empirical soil multi-factor radiative transfer model for soil organic matter estimation based on hyperspectral imagery. Geoderma 2023, 437, 116605. [Google Scholar] [CrossRef]
  39. Ou, D.; Tan, K.; Li, J.; Wu, Z.; Zhao, L.; Ding, J.; Wang, X.; Zou, B. Prediction of soil organic matter by Kubelka-Munk based airborne hyperspectral moisture removal model. Int. J. Appl. Earth Obs. Geoinf. 2023, 124, 103493. [Google Scholar] [CrossRef]
  40. Wu, M.; Huang, Y.; Zhao, X.; Jin, J.; Ruan, Y. Effects of different spectral processing methods on soil organic matter prediction based on VNIR-SWIR spectroscopy in karst areas, Southwest China. J. Soils Sediments 2024, 24, 914–927. [Google Scholar] [CrossRef]
  41. Yuan, J.; Gao, J.; Yu, B.; Yan, C.; Ma, C.; Xu, J.; Liu, Y. Estimation of soil organic matter content based on spectral indices constructed by improved Hapke model. Geoderma 2024, 443, 116823. [Google Scholar] [CrossRef]
Figure 1. Soil collection locations in the study area.
Remotesensing 16 02065 g001
Figure 2. (a) The mean spectra for different SMCs. (b) The difference in average reflectance between dry soil samples and wet soil samples for different SMCs. (c) The average spectrum after continuum removal with different SMCs.
Remotesensing 16 02065 g002
Figure 3. PCA of original spectra.
Remotesensing 16 02065 g003
Figure 4. Correlation coefficient curves between SOM content and reflectance under different spectral transformations: (a) R, (b) Log(1/R), and (c) CR.
Remotesensing 16 02065 g004
Figure 5. Correlation coefficient equipotential diagram between SOM content and three spectral indices.
Remotesensing 16 02065 g005
Figure 6. Spectral index equipotential diagram with SOM correlation degree above 0.82.
Remotesensing 16 02065 g006
Figure 7. (a) PLS prediction of dry soil. (b) PLS prediction of wet soil.
Remotesensing 16 02065 g007
Figure 8. Cross-validation error curves generated by different combinations of i and j in the established EPO-PLS model: (a) RMSE; (b) R2.
Remotesensing 16 02065 g008
Figure 9. SOM prediction scatter plot: (a) EPO-PLS; (b) SI EPO-PLS.
Remotesensing 16 02065 g009
Figure 10. SOM prediction scatter plot: (a) DS-PLS; (b) SI DS-PLS.
Remotesensing 16 02065 g010
Figure 11. The contour map of the correlation coefficients between SOM content and 9 three-band spectral indices.
Remotesensing 16 02065 g011
Figure 12. SOM prediction scatter plot: SI3 EPO-PLS.
Remotesensing 16 02065 g012
Table 1. Spectral indices and formulas.
Spectral IndexFormula
Difference spectral index D S I ( λ i , λ j ) = R ( λ i ) R ( λ j )
Ratio spectral index R S I ( λ i , λ j ) = R ( λ i ) / R ( λ j )
SI2 Normalized difference spectral index N D S I ( λ i , λ j ) = R ( λ i ) R ( λ j ) R ( λ i ) + R ( λ j )
SI3 Normalized difference spectral index N D S I ( λ i , λ j , λ k ) = a R ( λ i ) + b R ( λ j ) + c R ( λ k ) d R ( λ i ) + e R ( λ j ) + f R ( λ k ) a , b , c , d , e , f [ 1 , 0 , 1 ]
R ( λ i ) and R ( λ j ) in the formulas indicate the reflectance value for any two wavelengths λ i and λ j in 500–2400 nm.
Table 2. Explained and accumulation variance in the first two Principal Components.
SMCPC1 (%)PC2 (%)Accumulation (%)
Dry soil98.730.7699.49
12%97.901.3599.25
14%99.050.5899.63
16%98.271.0399.29
18%97.401.5298.92
20%95.343.1198.45
22%90.538.0498.57
Table 3. Spectral index-sensitive bands and their correlations.
Spectral TransformationSpectral IndexMaximum Correlation Band CombinationCorrelation Coefficient
RDSI2267 21970.8851
RSI2004 19000.9094
NDSI2004 19000.9094
Log(1/R)DSI1900 20030.9080
RSI2198 22670.8890
NDSI2197 22660.8868
CRDSI2267 22010.8868
RSI2005 19010.9076
NDSI2005 19010.9069
Table 4. Filtered three-band spectral indices.
λ i (nm) λ j (nm)Correlation with Two Bands λ k (nm)Correlation with Three
Bands
200423800.9119000.91
230023800.7623800.77
212023600.7222980.74
226022000.8622700.89
214022000.7422660.82
136014000.7115090.88
112011000.7111910.74
214014200.7214850.80
146014400.8514480.88
154014000.8213420.85
Table 5. The filtered three-band spectral indices parameters.
Numberabcdef
NDSI 10−10101
NDSI 20011−10
NDSI 3100011
NDSI 4110001
NDSI 51−1001−1
NDSI 6110011
NDSI 71−10011
NDSI 811001−1
NDSI 9100111
Disclaimer/Publisher’s Note: The statements, opinions and data contained in all publications are solely those of the individual author(s) and contributor(s) and not of MDPI and/or the editor(s). MDPI and/or the editor(s) disclaim responsibility for any injury to people or property resulting from any ideas, methods, instructions or products referred to in the content.

