Abstract
The 143 A.D. west Gangu earthquake is documented to have occurred in the West Qinling area, which is located on the northeastern margin of the Tibetan Plateau. Initial limited historical records suggest the earthquake took place along the West Qinling fault (WQLF) in the western region of Gangu County. However, the absence of corresponding geological and geomorphological evidence has posed a considerable challenge in accurately quantifying parameters such as the precise location, magnitude, and seismogenic fault segment in earlier investigations. In this study, a comprehensive examination of multiple residual surface rupture zones within the macroseismic zone of this earthquake enabled the determination of the seismogenic structure, magnitude, and rupture zone scale through diverse methodologies, which include field geological investigations, chronology testing, Unmanned Aerial Vehicle (UAV) aerial surveying, and interpretation of landslides along the fault zone. The results reveal that the seismogenic structure of this seismic event is associated with the Zhangxian fault segment of the WQLF, also marked by a dense distribution of large landslides from Zhangxian to Yuanyangzhen. The epicenter was identified at the eastern end of the Zhangxian fault segment of the WQLF. Furthermore, the magnitude of the 143 A.D. west Gangu earthquake is estimated to be approximately Ms 7–7.3, with the residual surface rupture zone intermittently extending over about 22 km and a maximum horizontal dislocation along the rupture zone of 2.8 ± 0.5 m. This detailed investigation contributes foundational insights for further evaluating the seismic risk across various segments of the WQLF.
1. Introduction
Earthquake events, which are triggered by fault activity, provide valuable insights into the long-term behavior of faults. The northeastern margin of the Tibetan Plateau is characterized by multiple large active fault zones (Figure 1), which have been associated with significant historical earthquakes, such as the Haiyuan M 8.5 earthquake in 1920, the Gulang M 8 earthquake in 1927 along the Qilian–Haiyuan fault, the south Tianshui M 8 earthquake in 1654 along the Lixian–Luojiabao fault, the south Wudu (now Longnan) M 8 earthquake in 1879 along the Baoziba–Gaoloushan–Daoqizi fault, etc. [1,2,3]. The tectonic activity within these fault zones plays a pivotal role in regulating the latest structural deformation of the plateau. Accurately identifying historical seismic events in the northeastern margin region is particularly significant for studying active block interactions, recent fault activity, and the regional seismic risk assessment of the Tibetan Plateau [4,5,6].
Historical records documented a devasting earthquake in 143 A.D. that struck the western area of Gangu County, Gansu Province, China, resulting in extensive mountain collapses and widespread building damage, causing substantial casualties and profound societal impact. However, the elapsed time since the event has left us with limited information on critical parameters such as the magnitude, length of the surface rupture zone, and seismogenic structure. Early studies primarily relied on descriptions of damage extent and perceived shaking in historical records, identifying the seismogenic structure as the middle segment of the West Qinling fault with a magnitude of approximately M 7 and a macroseismic epicentral area between 104°E and 105.3°E to the west of Gangu County [7,8,9,10]. However, the absence of relevant field evidence regarding the fault geomorphology and geological profile has led to disputes about the accurate location, magnitude, and length of the rupture zone of this earthquake. Wang et al. [11] reported suspected seismic deformation along the Zhangxian fault segment of the WQLF, suggesting a potential connection with the 143 A.D. west Gangu earthquake, although further comprehensive research was not pursued. Building upon previous research, this study focuses on the 143 A.D. west Gangu earthquake. Through examining multiple surface residual fault phenomena along the WQLF, we conducted a comprehensive investigation using various methods, including UAV aerial surveying of fault microtopography, excavation of trench profiles, chronological testing, investigation of coseismic displacements, interpretation of landslides, and analysis of historical records. The aim of this investigation is to provide more comprehensive evidence concerning the seismogenic information on the 143 A.D. west Gangu earthquake and to elucidate the seismic activity patterns of the WQLF.
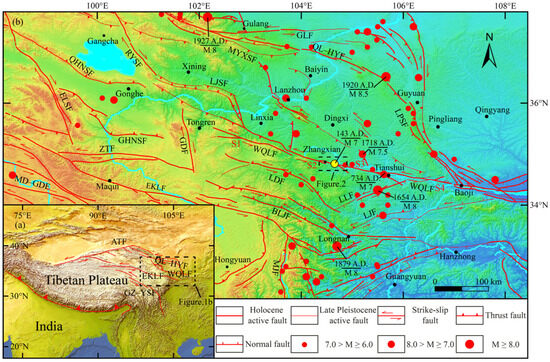
Figure 1.
Distribution map of major active faults in Tibetan Plateau (a) and active faults in the northeastern margin of the Tibetan Plateau (b). ATF: Altyn Tagh fault; QL–HYF: Qilian–Haiyuan fault; EKLF: East Kunlun fault; GZ–YSF: Ganzi–Yushu fault; MYXSF: Mayaxueshan fault; GLF: Gulang fault; RYSF: Riyueshan fault; ELSF: Elashan fault; QHNSF: Qinghainanshan fault; GHNSF: Gonghenanshan fault; LJSF: Lajishan fault; LPSF: Liupanshan fault; WQLF: West Qinling fault; GDF: Guide fault; LT–DCF: Lintan–Dangchang fault; LLF: Lixian–Luojiabao fault; BLJF: Bailongjiang fault; LJF: Liangdang–Jiangluo fault; MJF: Minjiang fault; MD–GDF: Maduo–Gande fault; ZTF: Zhongtie fault. Red arrows indicate the horizontal relative motion direction. S1–S4 indicates the segmentation of the WQLF. The base map is based on 30 m DEM of USGS [12], fault data are modified from Deng et al. [13] and Xu et al. [14], earthquake data are from the National Earthquake Data Center [15].
2. Geological Setting
The study area is situated along the West Qinling fault (WQLF) region, northeastern margin of the Tibetan Plateau. The WQLF is a left-lateral strike-slip fault that has been active during the Holocene, with a length of 470 km [11,16]. It is composed of four secondary faults (Guomatan fault segment S1, Zhangxian fault segment S2, Wushan fault segment S3, and Tianshui–Baoji fault segment S4, from west to east of the WQLF in Figure 1) and has exhibited a slip rate of approximately 2–3 mm/a [17,18,19]. Along the WQLF, a series of typical left-lateral gullies and terraces, fault passes, and ridge dislocations were formed, and multiple significant earthquakes have occurred in history, such as the Longxi M 7 earthquake in 47 B.C., Gangu M 6½ earthquake in 128 A.D. (magnitude classification standard used for historical earthquakes, which uses fractions such as ¼, ½, and ¾ to designate non-integer historical earthquake magnitudes, with an error margin of 1/4), Tianshui M 7 earthquake in 734 A.D., Gangu–Wushan M 6½ earthquake in 1765, and Kangle M 6¾ earthquake in 1936 [10,20,21,22,23], indicating that the fault has exhibited strong activity throughout the late Holocene. Li et al. [24] revealed that the recurrence interval of seismic events on the Zhangxian segment of the WQLF is approximately 2000 years according to paleoseismic trenches.
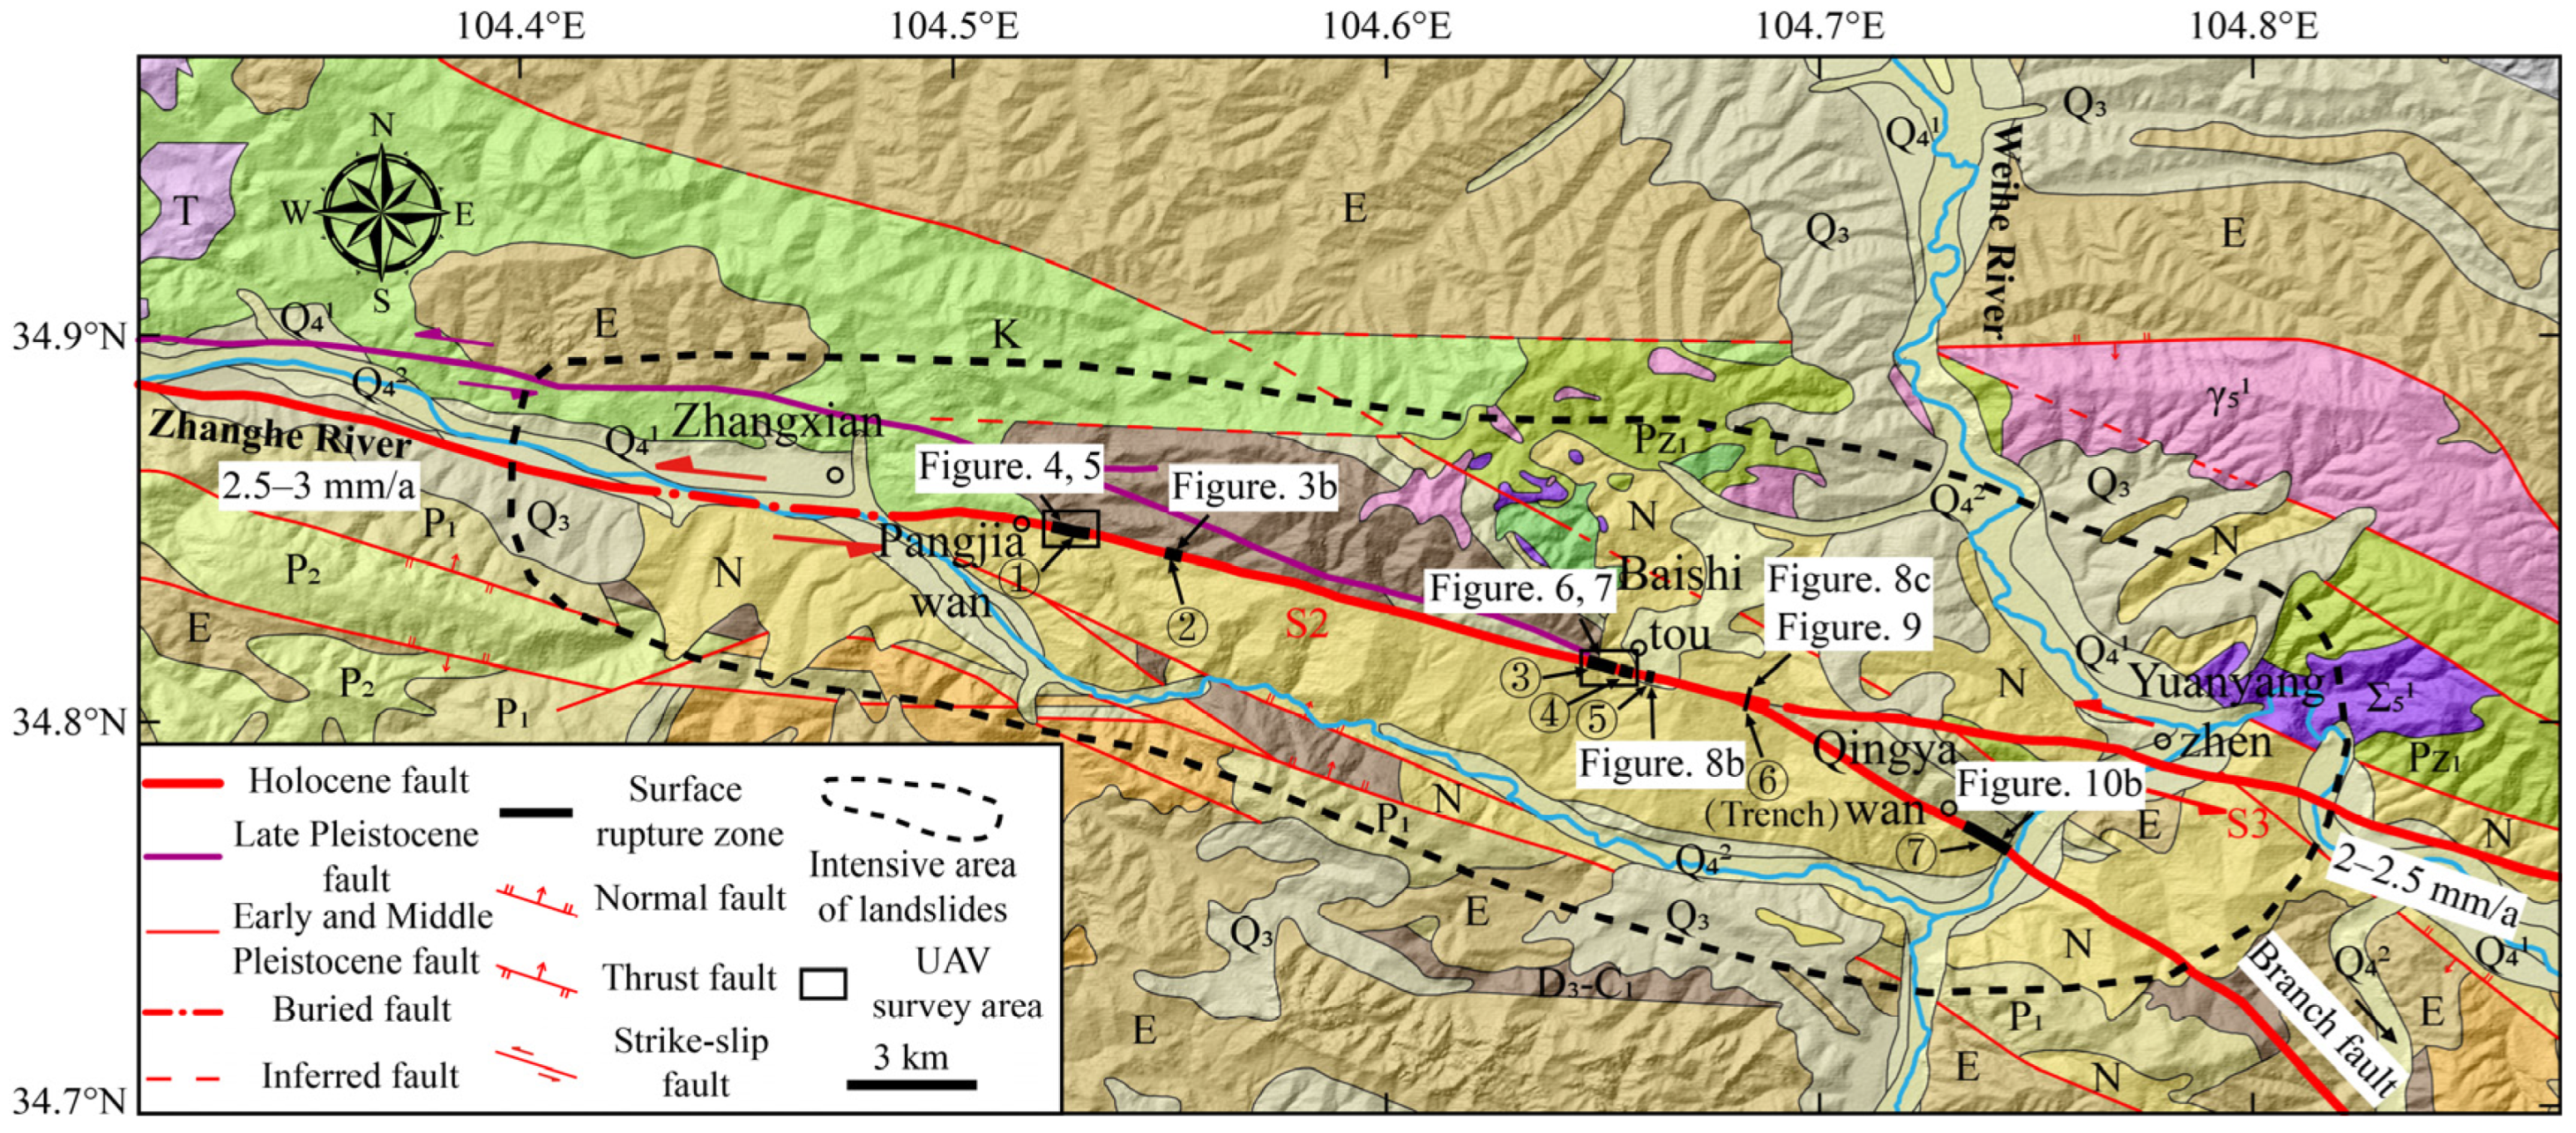
Previous understanding suggested that the 143 A.D. west Gangu earthquake occurred on the Zhangxian fault segment of the WQLF, relying solely on historical earthquake data [9,10]. However, despite extensive research, precise geological evidence has remained elusive. The Zhangxian segment (S2) starts west of the Taohe River and extends eastward to Yuanyangzhen in Wushan County, covering a total distance of approximately 105 km. In the west of Zhangxian County, the S2 bifurcates into two faults: the North Zhangxian fault, active during the late Pleistocene, and the Zhangxian fault, active during the Holocene. These faults converge southwest of Baishitou village (Figure 2). East of Baishitou village, the merged fault of S2 connects with the Wushan fault segment (S3), bearing the primary slip rate, while the south branch fault near the south of Yuanyangzhen ends by turning southeast and intersects with other faults. Our field survey unveiled several residual surface rupture zones spanning from the eastern reaches of Zhangxian to Yuanyangzhen. By conducting a meticulous analysis of the surface rupture zones and integrating the findings with the absolute chronology derived from typical profiles and trenches, the temporal occurrence of this earthquake has been determined.
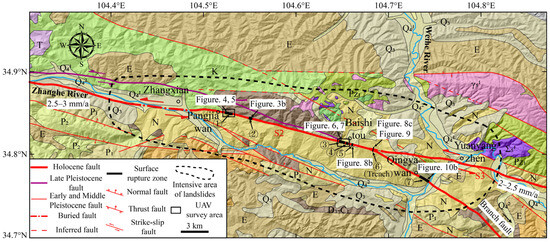
Figure 2.
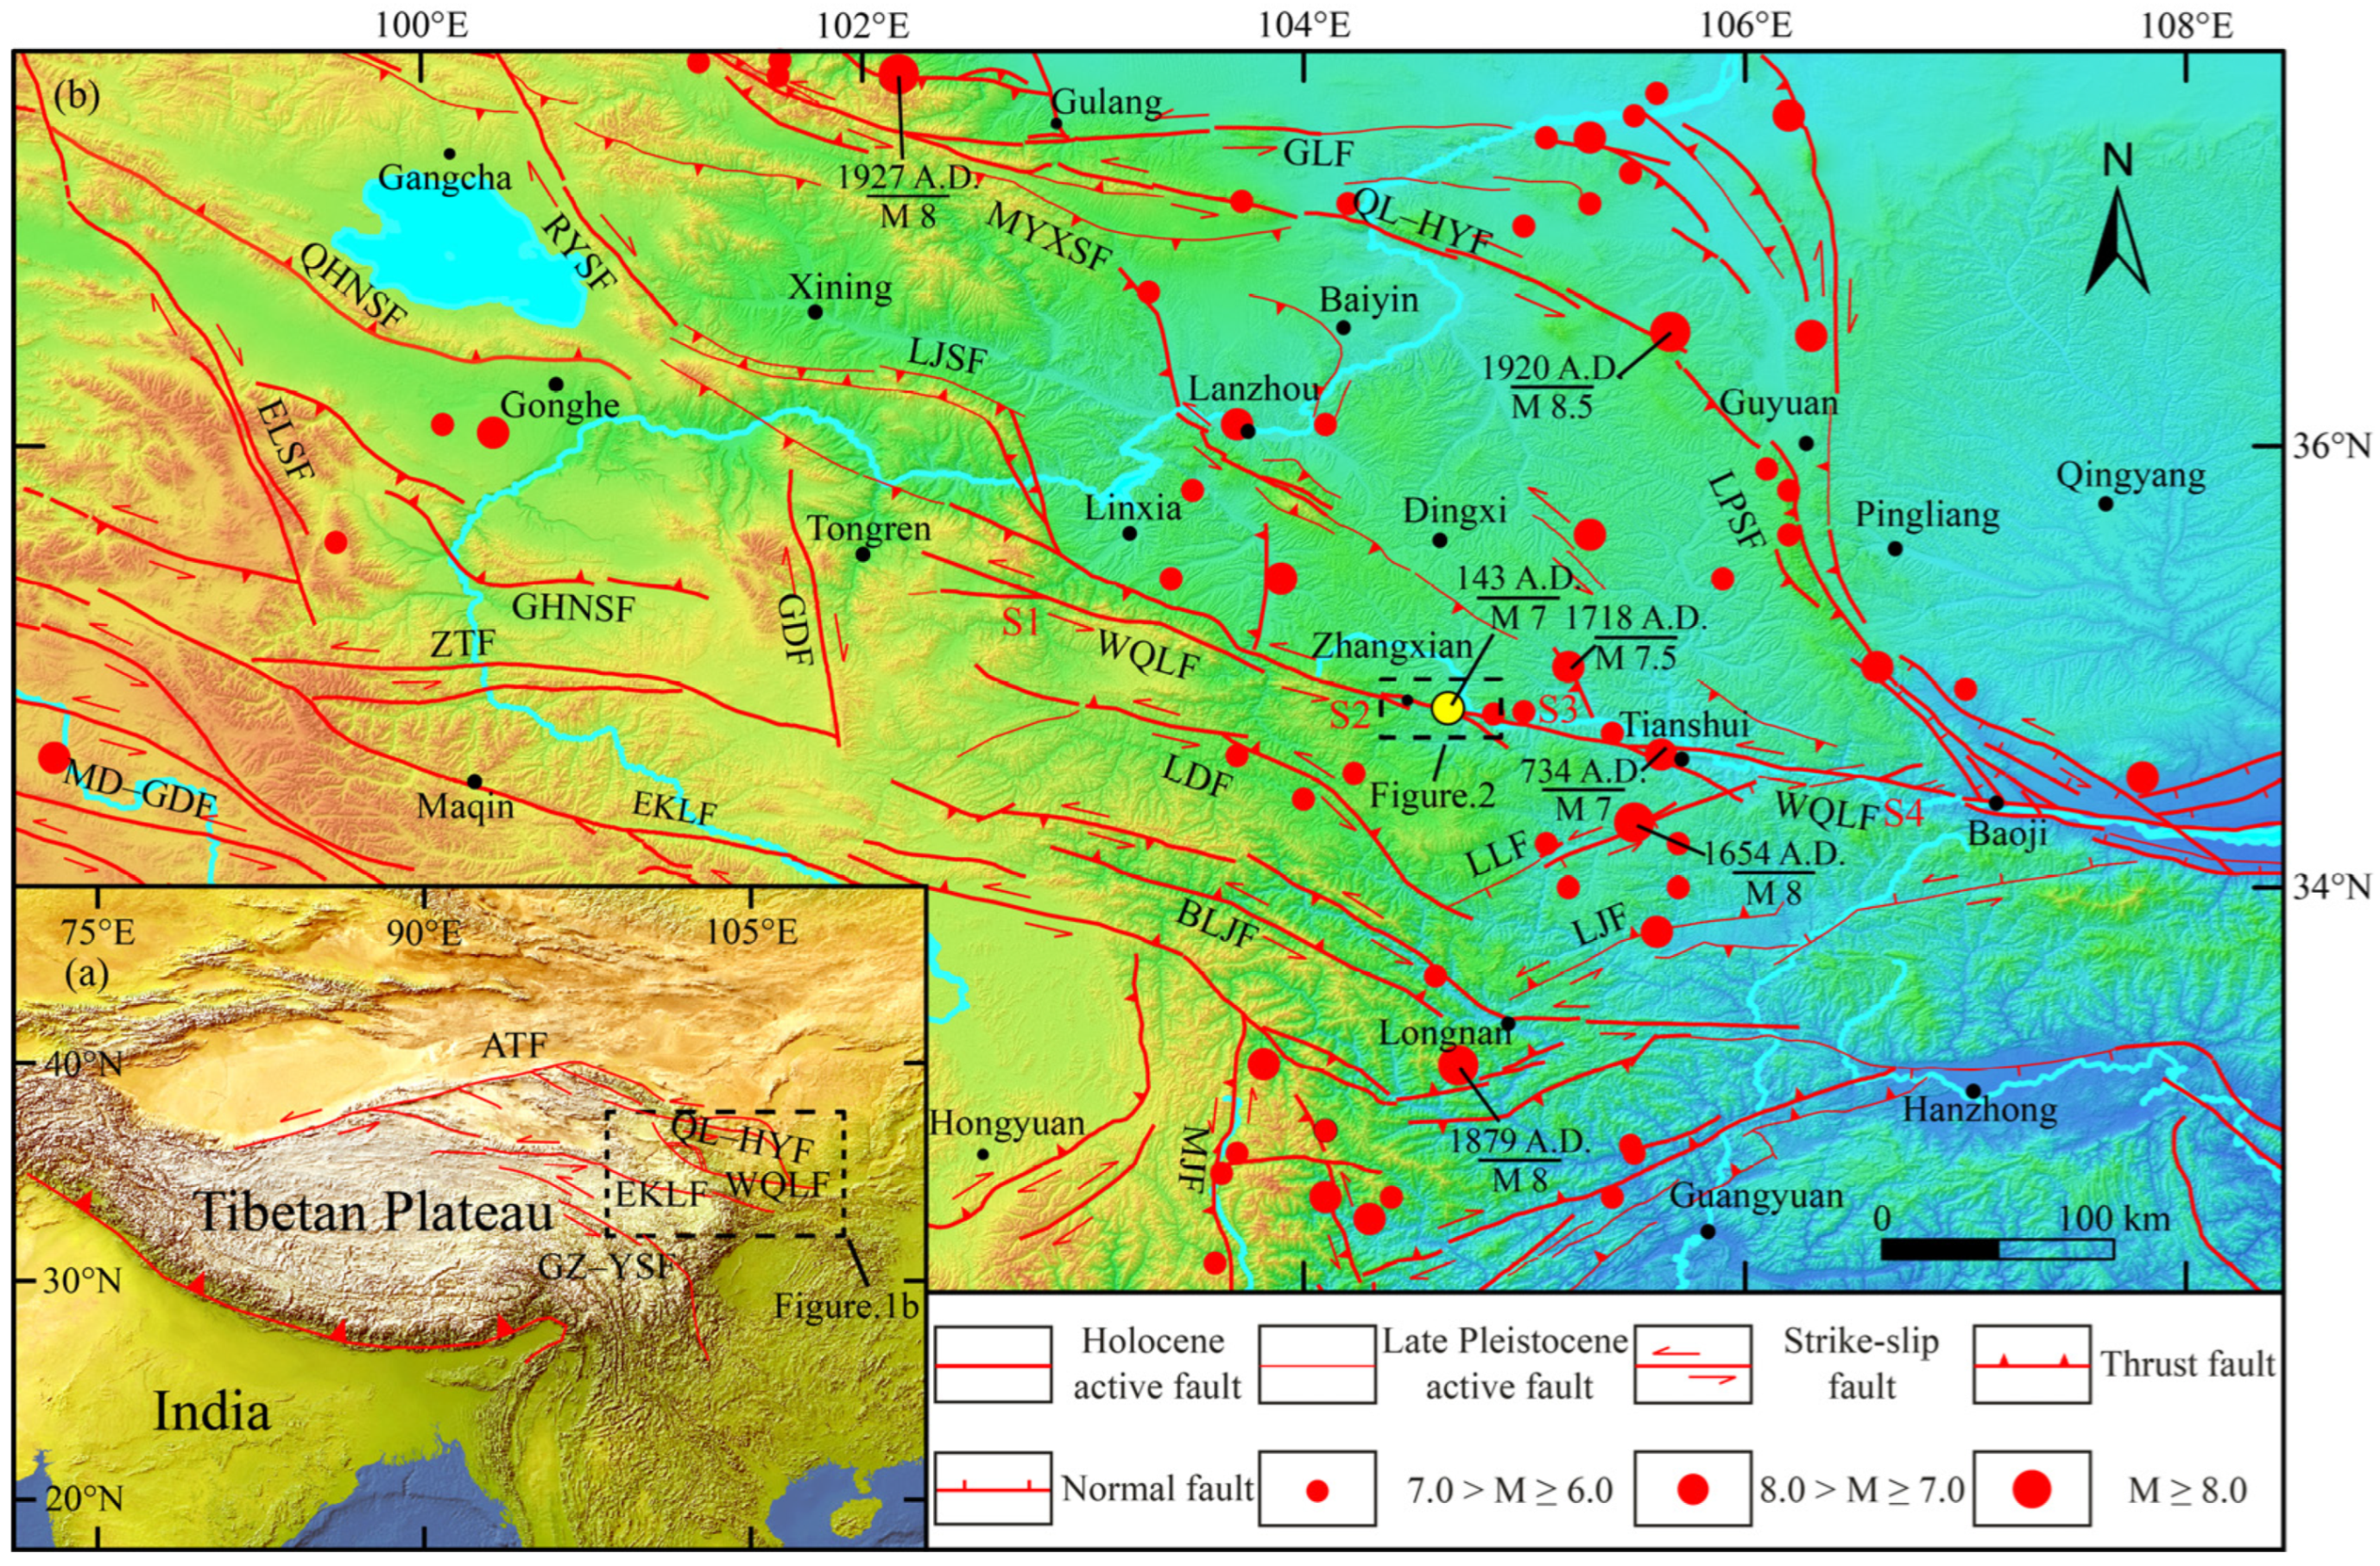
Regional geological situation and geometric distribution of the WQLF in the study area. Pz1: Lower Paleozoic Niutouhe Group; D3: Upper Devonian series; C1: Lower Carboniferous series; P1: Lower Permian series; P2: Upper Permian series; T: Triassic series; K: Cretaceous series; E: Paleogene series; N: Neogene series; Q3: Upper Pleistocene series; Q41–Q42: Holocene series; ∑51: serpentinized ultrabasic rock; γ51: medium-grained diorite. Sites ①–⑦ are the investigate areas of surface rupture zones. The stratigraphic information is modified from the 1:200,000 geological map.
3. Data and Methods
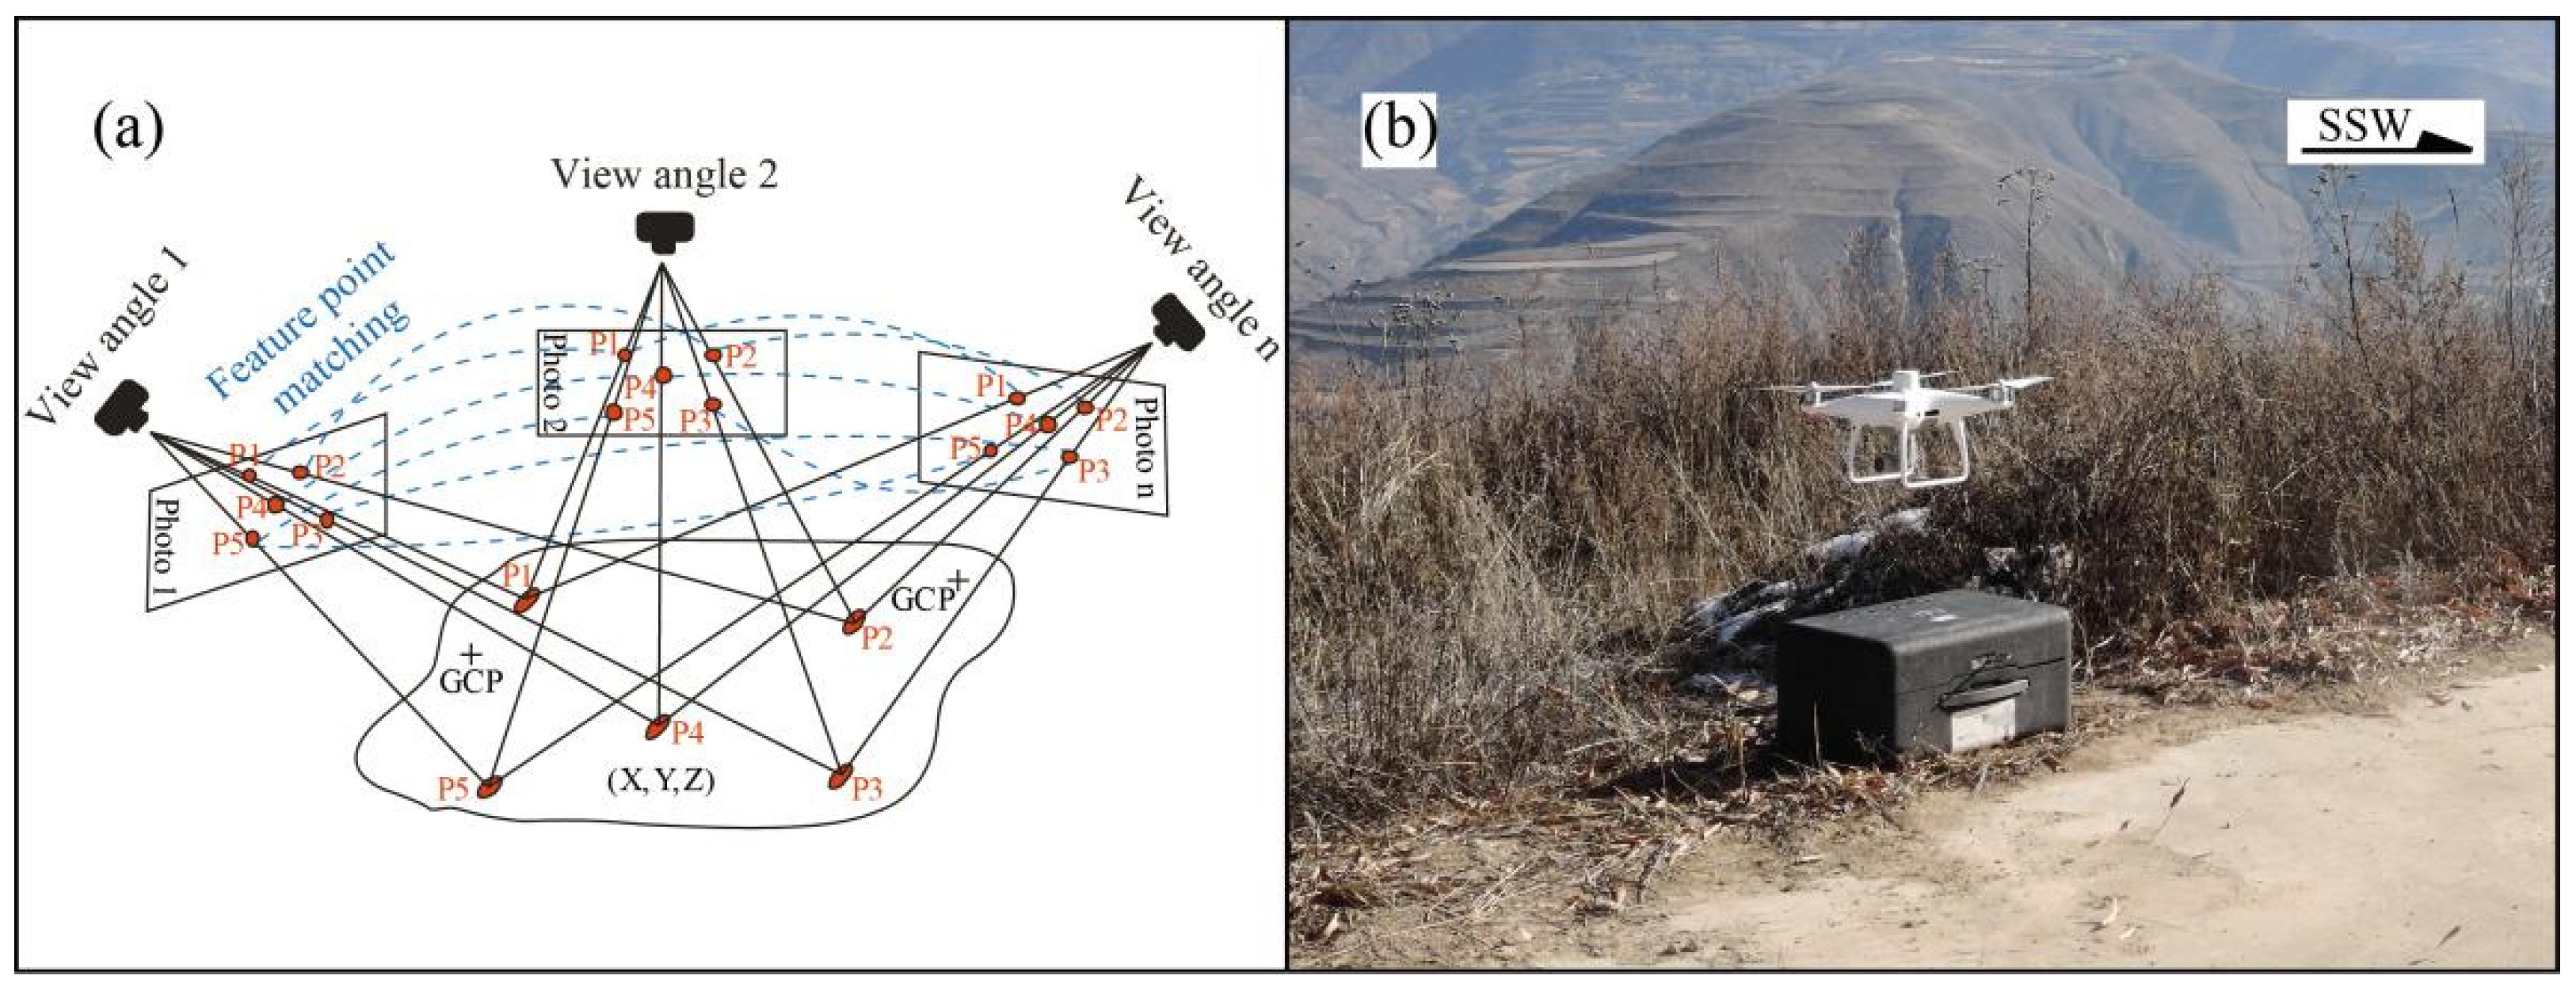
Aerial photogrammetry technology can provide detailed observations of surface morphology from multiple perspectives, facilitating the acquisition of high-precision terrain data. While lidar technology dominated early measurements, recent advancements in Structure from Motion (SfM) represent a significant breakthrough, enabling the extraction of three-dimensional terrain models. This process involves the analysis of multiple photographs taken from various angles using efficient pixel feature matching algorithms (Figure 3a). High-precision digital elevation models and regional imagery can be generated by extracting feature pixels from overlapping images obtained via Unmanned Aerial Vehicle (UAV) surveys. SfM operates by utilizing feature matching data from image pairs to automatically determine camera orientation and scene geometry through an iterative bundle adjustment procedure, thereby constructing spatial geographic information [25]. This methodology has been widely adopted in the earth sciences field. To discern detailed characteristics of fault zone distribution within the designated study area, we conducted regional aerial surveys using a DJI Phantom 4 RTK-equipped UAV (Figure 3b) with a 20 million pixel fixed-focus lens. Real-time correction during flight using the GNSS Real Time Kinematic (RTK) module resulted in a vertical accuracy of 1.5 + 1 ppm/km and a horizontal accuracy of 1 + 1 ppm/km. Depending on terrain and area-specific requirements, the UAV flew at heights of 50–100 m with a speed of 12 m/s, programmed to have an 80% overlap rate in the flight direction and a 70% overlap rate in the lateral direction. Aerial surveys included nadir and oblique angles (with a 5% tilt), conducted under clear, windless conditions for optimal results. Post-survey processing of UAV photos with Agisoft Metashape 1.8 software involved georeferencing, pixel point linking, and the creation of a dense point cloud with spatial attributes within the specified area. From these, a digital elevation model (DEM) and digital orthophoto model (DOM) were constructed, with resolutions of below 5 cm/pixel and 3 cm/pixel, respectively. Further analysis using ArcGIS 10.2 software involved constructing a hillshade model with a 45-degree illumination angle to identify seismic scarps, sinkholes, and seismic grooves along the fault zone accurately. The DOM accurately delineated fault zone features, such as sinkholes, seismic grooves, and typical left-lateral strike-slip geomorphic markers. Measurements were conducted to determine horizontal and vertical fault displacements, along with interpreting coseismic landslides triggered by earthquakes. Enhanced precision in these measurements was achieved by comparing horizontal and vertical displacements obtained from comprehensive field surveys along the fault zone. This comprehensive methodology ensures a high level of accuracy in analyzing fault zone characteristics and assessing seismic impacts.
Figure 3.
Principles of UAV SfM technology (a) modified from Wei et al. [25], and field survey photo of the Phantom 4 RTK (b).
4. Investigation of the Surface Rupture Zone
During our comprehensive field investigation, we identified a total of seven surface rupture phenomena positions spanning a stretch of approximately 22 km from Pangjiawan to Yuanyangzhen (Refer to Figure 2, Sites ①–⑦). The surface rupture zones are characterized by a series of sinkholes, seismic grooves, seismic scarps, and a few horizontal dislocations on the loess platform. Additionally, our findings reveal a noteworthy concentration of landslides within a 4–6 km range on both sides of the rupture zone.
4.1. Surface Rupture Zone East of Pangjiawan Village (Site ①)
During our field investigation to the east of Pangjiawan village, situated in the eastern region of Zhangxian, we identified a surface rupture zone exhibiting a WNW trend. Spanning approximately 800 m in length (Figure 4a), this zone comprises a series of seismic grooves and sinkholes formed on the loess platform (Figure 4b). Numerous seismic cracks within the loess layer were observed along the grooves of the rupture zone. To delve deeper into the characteristics of this seismic rupture zone, we selected a left-lateral gully that was formed in the early stage and underwent displacement during the seismic event for the purpose of conducting profile cleaning and sampling (Figure 4b,c). Employing UAV aerial survey interpretation and sample dating techniques, we conducted a thorough analysis of the dislocation and chronological features of the gully. This integrated approach facilitated a precise examination of the seismic rupture zone, offering valuable insights into its characteristics.
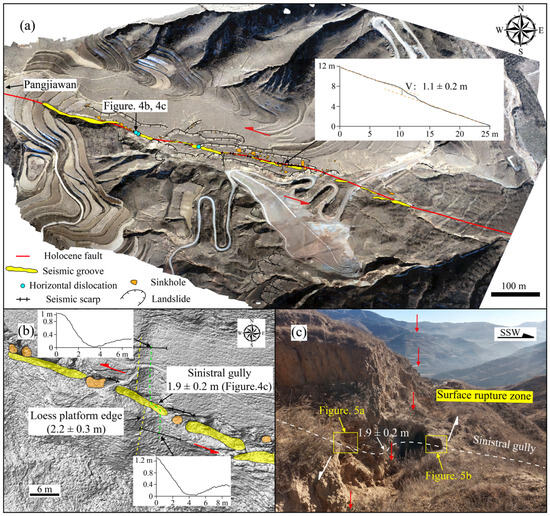
Figure 4.
UAV image (a) and field survey photos (b,c) of the surface rupture zone east of Pangjiawan village. Red and white arrows indicate the horizontal relative motion direction.
In Figure 4b,c, the early-formed gully displays a sinistral displacement of 1.9 ± 0.2 m (combining field measurements with indoor UAV image proofreading) attributed to seismic activity. While the drainage in front of the hill continues to impact the hanging wall of the gully, sedimentation in the footwall has ceased due to seismic activity. To unravel and comprehend the formation process, we gathered Optically Stimulated Luminescence (OSL) and 14C samples for chronological testing from various layers in both the hanging wall and footwall (Figure 5a,b). We then charted the planar and three-dimensional fault patterns of the gully (Figure 5c,d) to delineate its evolution. The chronological testing results are shown in Table 1 and Table 2. We obtained an OSL sample (O01) from the top of the U2 (Unit 2) layer in the hanging wall, and the test results showed an age of 18.0 ± 0.9 ka, which indicates the age of the gully base. This can be clearly distinguished from the C03 age of the bottom of the U3 layer (3960 ± 30 yr B.P.), which represents the formation age of the gully (Figure 5a). The base of the footwall consists of fragmented yellow-green bedrock at the bottom (Unit 1, Figure 5b), with a layer of loess on the top (Unit 2). In the hanging wall, there is a distinct color boundary between the U3 and U4 layers, indicating a significant change in the sediment source of the gully caused by the earthquake. We collected a 14C sample (C02) from the top of the U3 layer to determine the chronological age of the gully sediment prior to the tectonic disturbance. The obtained result showed an age of 2280 ± 30 yr B.P., indicating that the earthquake occurred after this period. Additionally, the timing of the earthquake likely aligns closely with this age based on the sediment relationship. In the footwall, the C05 age of the bottom sediment (U3) was determined to be 4230 ± 30 yr B.P. When determining the end of the gully footwall deposition period, we implemented a sampling strategy that avoided the influence of upper plant roots. As a result, we did not collect samples strictly from the surface of the gully sediment layer. The C04 chronological age of the upper part of the U3 layer was determined to be 2860 ± 30 yr B.P., which is slightly older than the age of the upper trench. However, when considering the relationship between the thickness of sediment layers and their distance from the top, the results of dating the seismic event age in the hanging wall and footwall are consistent.
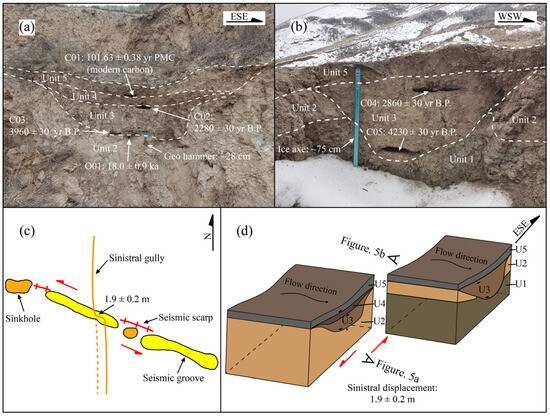
Figure 5.
Sampling profile and dislocation models of faulted gully east of Pangjiawan village. (a) Profile on hanging wall of the gully. (b) Profile on footwall of the gully. (c) Planar dislocation model of the gully. (d) Stereoscopic dislocation model of the gully. Red arrows indicate the horizontal relative motion direction.

Table 1.
Dating results of radiocarbon samples.
Table 2.
Dating results of OSL samples.
It is worth noting that the age results of the bottom of the hanging wall and footwall in the gully are 3960 ± 30 yr B.P. and 4230 ± 30 yr B.P., respectively. This further confirms that they are the same gully and began to form about 4000 yr B.P. In Figure 5c,d, intuitive planar and three-dimensional models are employed to illustrate the fault pattern of the gully.
4.2. Surface Rupture Zone Southwest of Baishitou Village (Site ③)
Southwest of Baishitou village, early traces of historical surface ruptures have been remarkably preserved, owing to limited human activity. Field observations reveal a surface rupture zone extending approximately 620 m in length (Figure 6a), showcasing grooves and sinkholes dispersed along the southern fault (Zhangxian fault) of the WQLF. Detailed analysis of DOM imagery highlights the long-term activity of two faults within this area leading to the development of two prominent left-lateral channels with displacements of around 130 m and 50 m. Field observations distinctly unveil lithological boundaries and fault traces, indicative of fault activity along the surface rupture zone (Figure 6c). The seismic activity also caused left-lateral displacements of 2.8 ± 0.5 m and 2.6 ± 0.3 m along the terrace edge and an early formed gully (Figure 6b,e). A preserved vertical scarp of 0.8 ± 0.2 m exists in the area where the surface remains intact between the two horizontal displacements (Figure 6c). Progressing eastward, the surface rupture zone transitions into a continuous array of sinkholes, ultimately disappearing beneath artificially modified farmland (Figure 6d).
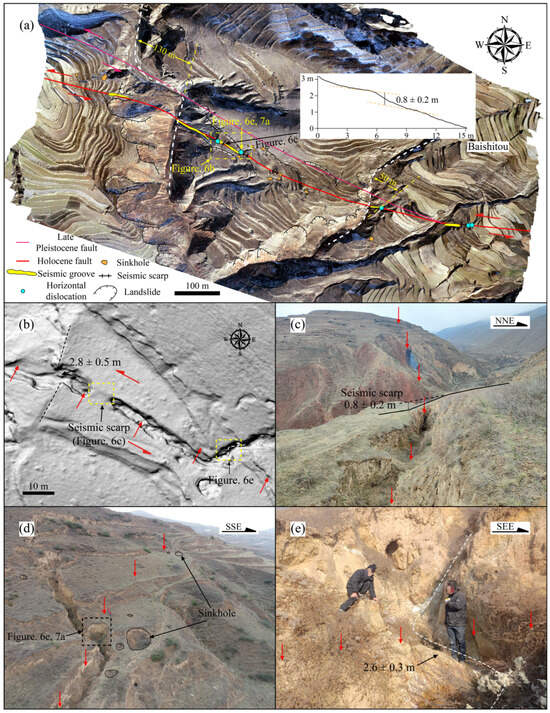
Figure 6.
UAV image of the surface rupture zone (a,b) and field survey photos (c–e) southwest of Baishitou village. Red and lavender arrows indicate the horizontal relative motion direction.
In Figure 6e, a profile of a faulted alluvial gravel layer observed on the east wall of the faulted gully shows the fault activity during the late Holocene (Figure 7). An earlier earthquake created a stratigraphic demarcation between the U1 and U3 layers, while the most recent fault activity created a distinct stratigraphic boundary among the U1, U2, and U3 layers. However, the U7 layer remains unaffected by the faulting. We conducted OSL dating (O02) at the bottom of the U7 layer, yielding an age of 0.7 ± 0.1 ka, which indicates that this earthquake occurred 700 years ago.
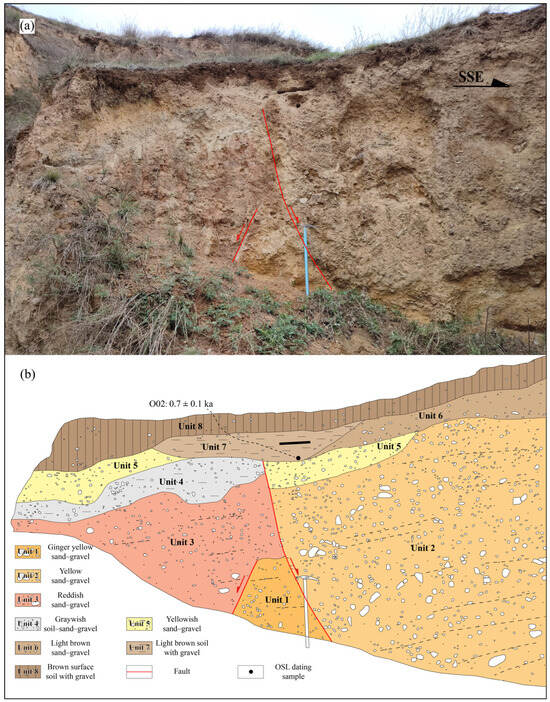
Figure 7.
Sampling profile (a) and sketch (b) of the side wall of the faulted gully southwest of Baishitou village. Red arrows indicate the motion direction.
4.3. Surface Rupture Zone South of Heiniuping–Yanjiaping Village (Site ⑤–⑥)
In the region spanning from south of Heiniuping to Yanjiaping village, instances of surface rupture phenomena are sporadic, primarily ascribed to human-induced modifications. The image in Figure 8a illustrates that this area is the structural transition zone where the WQLF extends eastward along the main fault and diverges at the termination of the Zhangxian fault segment. Proximate to Heiniuping village, the platform in front of the hill exhibits obvious left-lateral strike-slip characteristics. Field investigations in this vicinity reveal a surface rupture zone marked by reverse scarps and fault gullies south of Heiniuping village, spanning approximately 200 m (Figure 8b). In the vicinity of Yanjiaping village, a section of the rupture zone exposes the contact boundary between modern loess and fragmented yellow-green bedrock on the surface (Figure 8c,d). Subsequently, a trench was excavated across the rupture zone, and samples were collected for chronological testing, the findings of which are depicted in Figure 9.
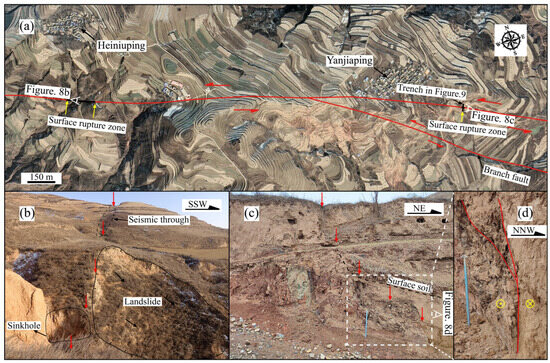
Figure 8.
(a) Satellite image of spatial distribution of the WQLF in the south of Heiniuping–Yanjiaping village. (b) Surface rupture zone in the south of Heiniuping village. (c) Surface rupture zone and fault profile in Yanjiaping village. (d) Detail features of the fault section in Figure 8c. Red arrows indicate the horizontal relative motion direction. Yellow circle symbols represent the direction of relative motion, the circle centered on a dot indicates the outward movement.
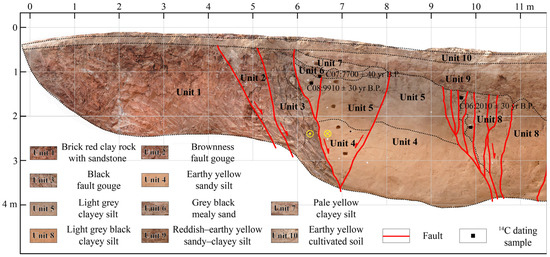
Figure 9.
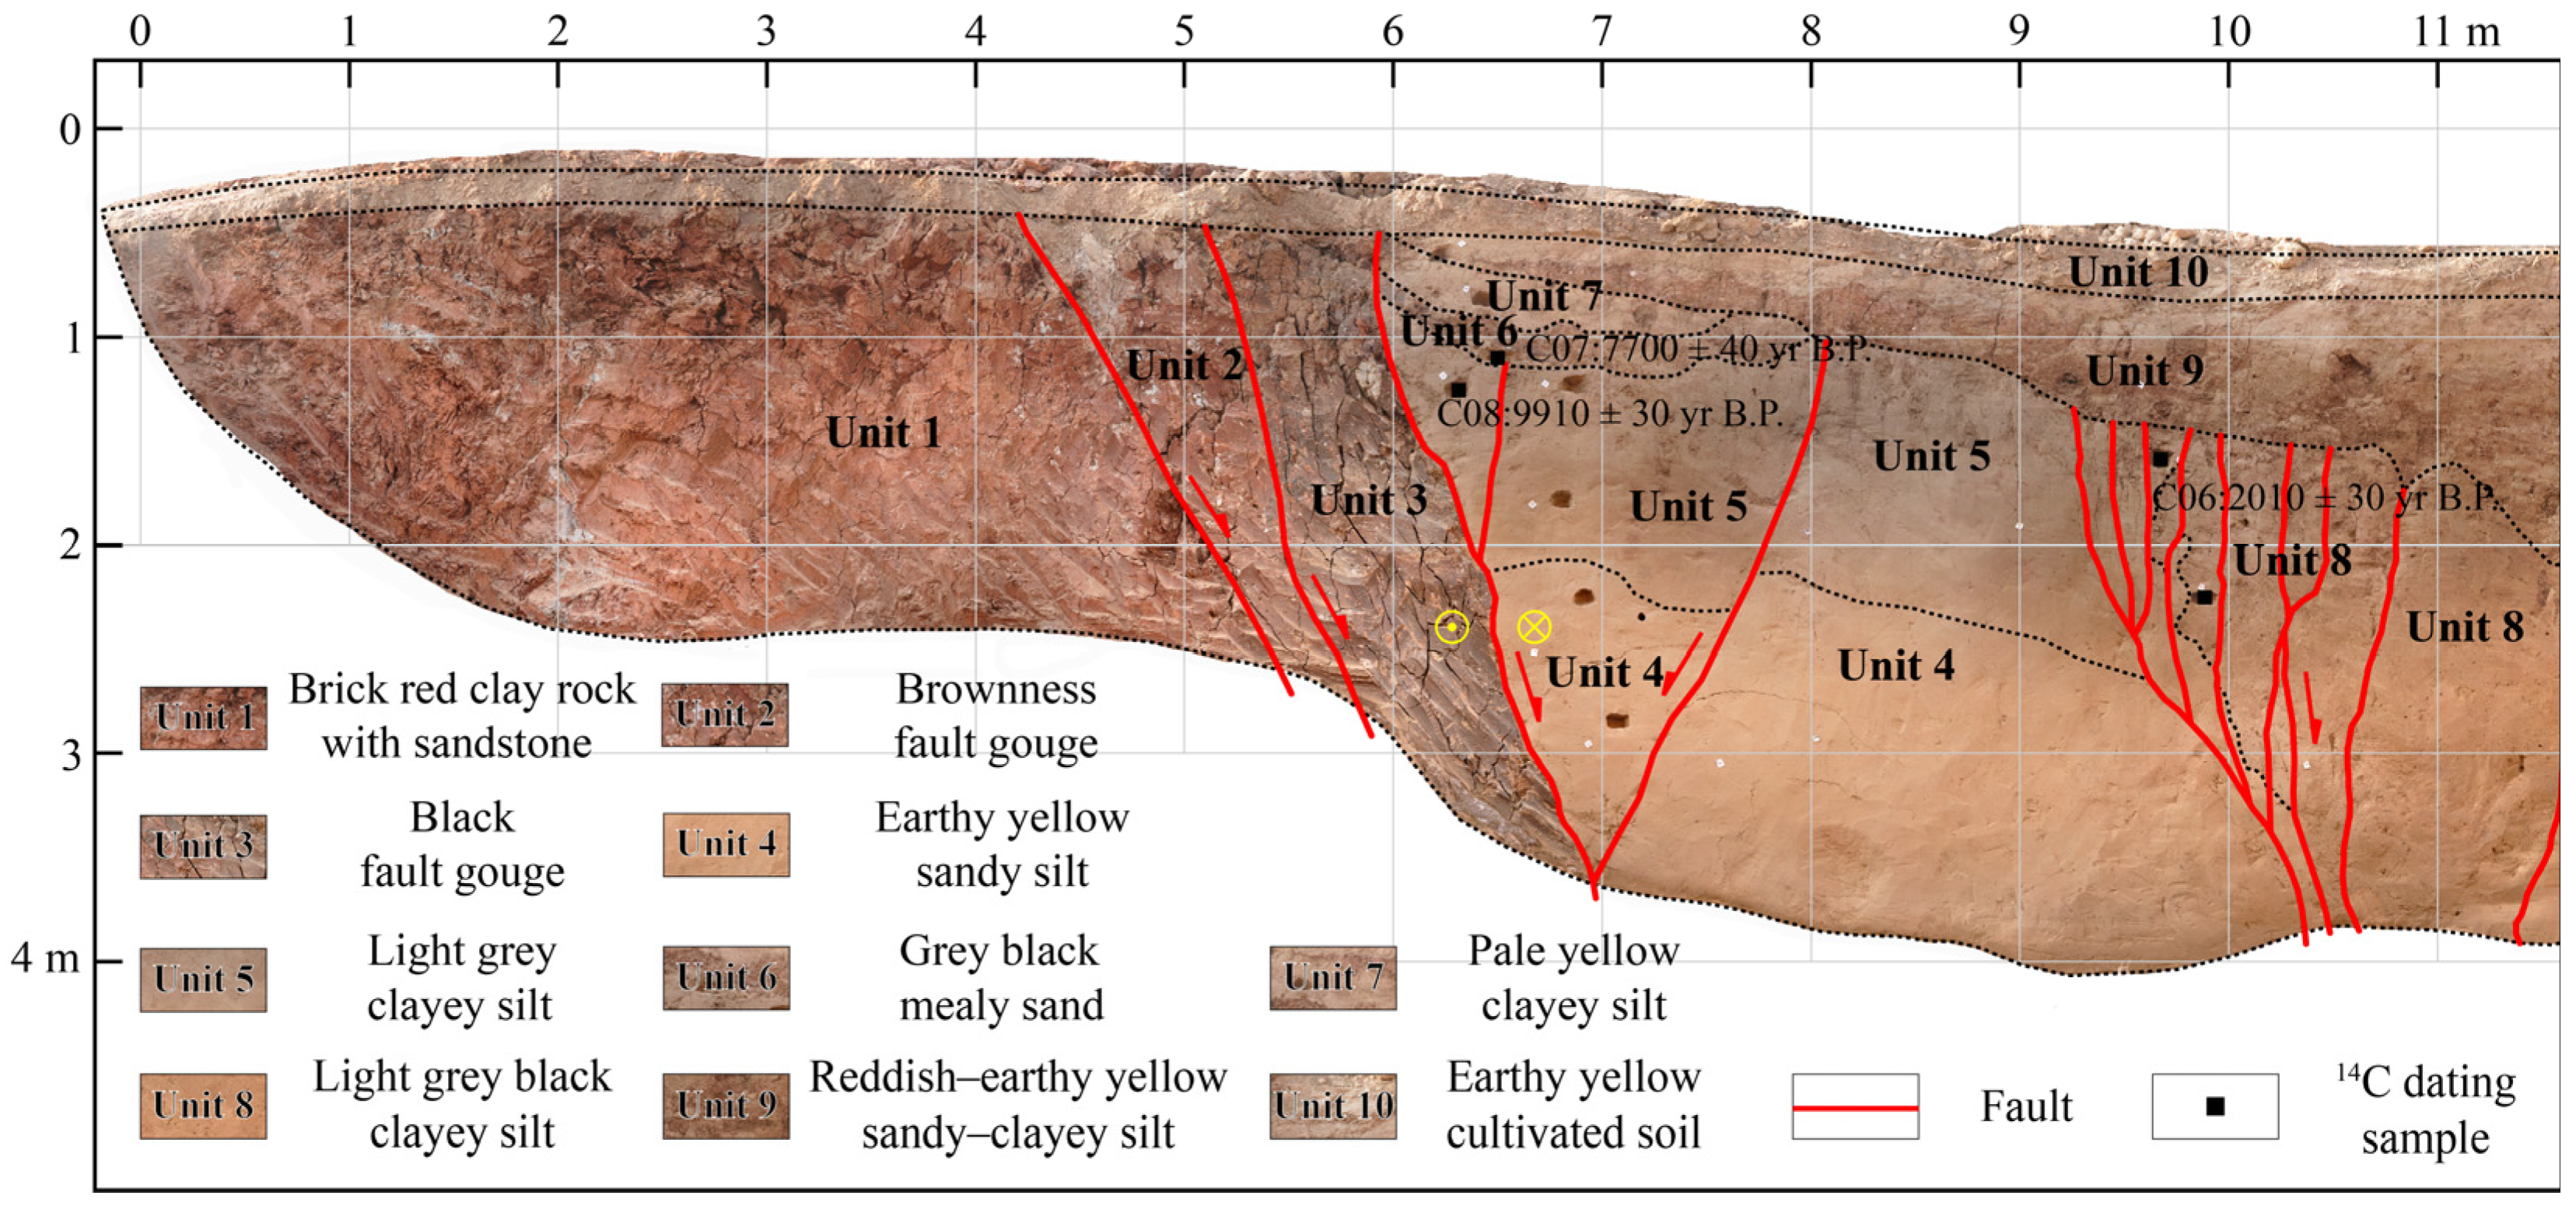
Lateral wall profile of the trench across the surface rupture zone in Yanjiaping village. Yellow circle symbols represent the direction of relative motion, the circle centered on a dot indicates the outward movement.
The exposure of the trench allowed for the clear observation of a distinct lithological boundary between fractured bedrock and loess (Figure 9). We further subdivided the loess layers in the trench and accurately delineated the fault traces. The C06 dating results of multiple fault traces with displaced stratigraphy indicate that the latest earthquake event occurred after 2010 ± 30 yr B.P., and multiple dense earthquake cracks were formed by fault activity at this location. In addition, the trench revealed that an earlier paleoearthquake event occurred between 7700 ± 40 yr B.P. (C07) and 9910 ± 30 yr B.P. (C08).
The rupture zone depicted in Figure 8 lies at the termination of the Zhangxian fault segment, extending towards the Wushan fault segment. Previous studies have suggested that the Yuanyangzhen step-over serves as the boundary between the Zhangxian fault segment and the Wushan fault segment of the WQLF [11,16]. Our recent study completed the spatial geometric distribution of the WQLF through field geological investigations. No evidence of seismic activity was detected in the Yuanyangzhen area. Instead, it propagated along the end of the Zhangxian fault segment, indicating that the primary impact of the earthquake was concentrated on the Zhangxian fault segment. This interpretation is further supported by the results from the densely distributed coseismic landslide area (Figure 2).
4.4. Surface Rupture Zone East of Qingyawan (Site ⑦)
In the eastern region of Qingyawan, fault activity has formed obvious fault pass and left-lateral strike-slip geomorphic features along the mountain ridge (Figure 10a). Through field investigations, we have observed that seismic activity led to the creation of continuous grooves, spanning approximately 1100 m in length, and densely distributed sinkholes on the surface (Figure 10b). It is crucial to emphasize that the identified surface rupture zone lies at the easternmost extremity of the investigation area, with the fault traversing the valley in a southeastern direction. Thus, considering this surface rupture zone as the endpoint, the distance to the surface rupture zone in Pangjiawan at the westernmost extremity can only be regarded as the minimum extent of the total length of the rupture zone, estimated to be approximately 22 km.
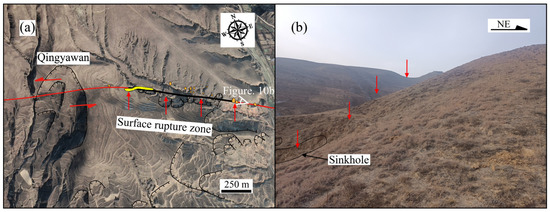
Figure 10.
Satellite image (a) and field survey photo (b) of the surface rupture zone east of Qingyawan. Red arrows indicate the horizontal relative motion direction.
5. Distribution Characteristics of Landslides
Seismic activity can trigger numerous coseismic landslides, leading to significant alterations in landforms and resulting in many casualties. The spatial distribution of these landslides generally diminishes as the distance from the earthquake epicenter or fault axis increases. As a result, coseismic landslides are typically concentrated near the seismic source [26,27,28]. For strike-slip earthquakes with magnitudes similar to the 143 A.D. west Gangu earthquake, such as the Hyogo-ken Nanbu Ms 7.2 earthquake in 1997 in Japan and the Yushu Ms 7.1 earthquake in 2010, prior research has indicated that coseismic landslides are densely distributed within a distance of 2–5 km from the fault zone [29,30]. Likewise, for non-strike-slip earthquakes, such as the Haiti earthquake in 2010 and the Wenchuan earthquake in 2008, landslides also tend to be concentrated along the fault zone [31,32].
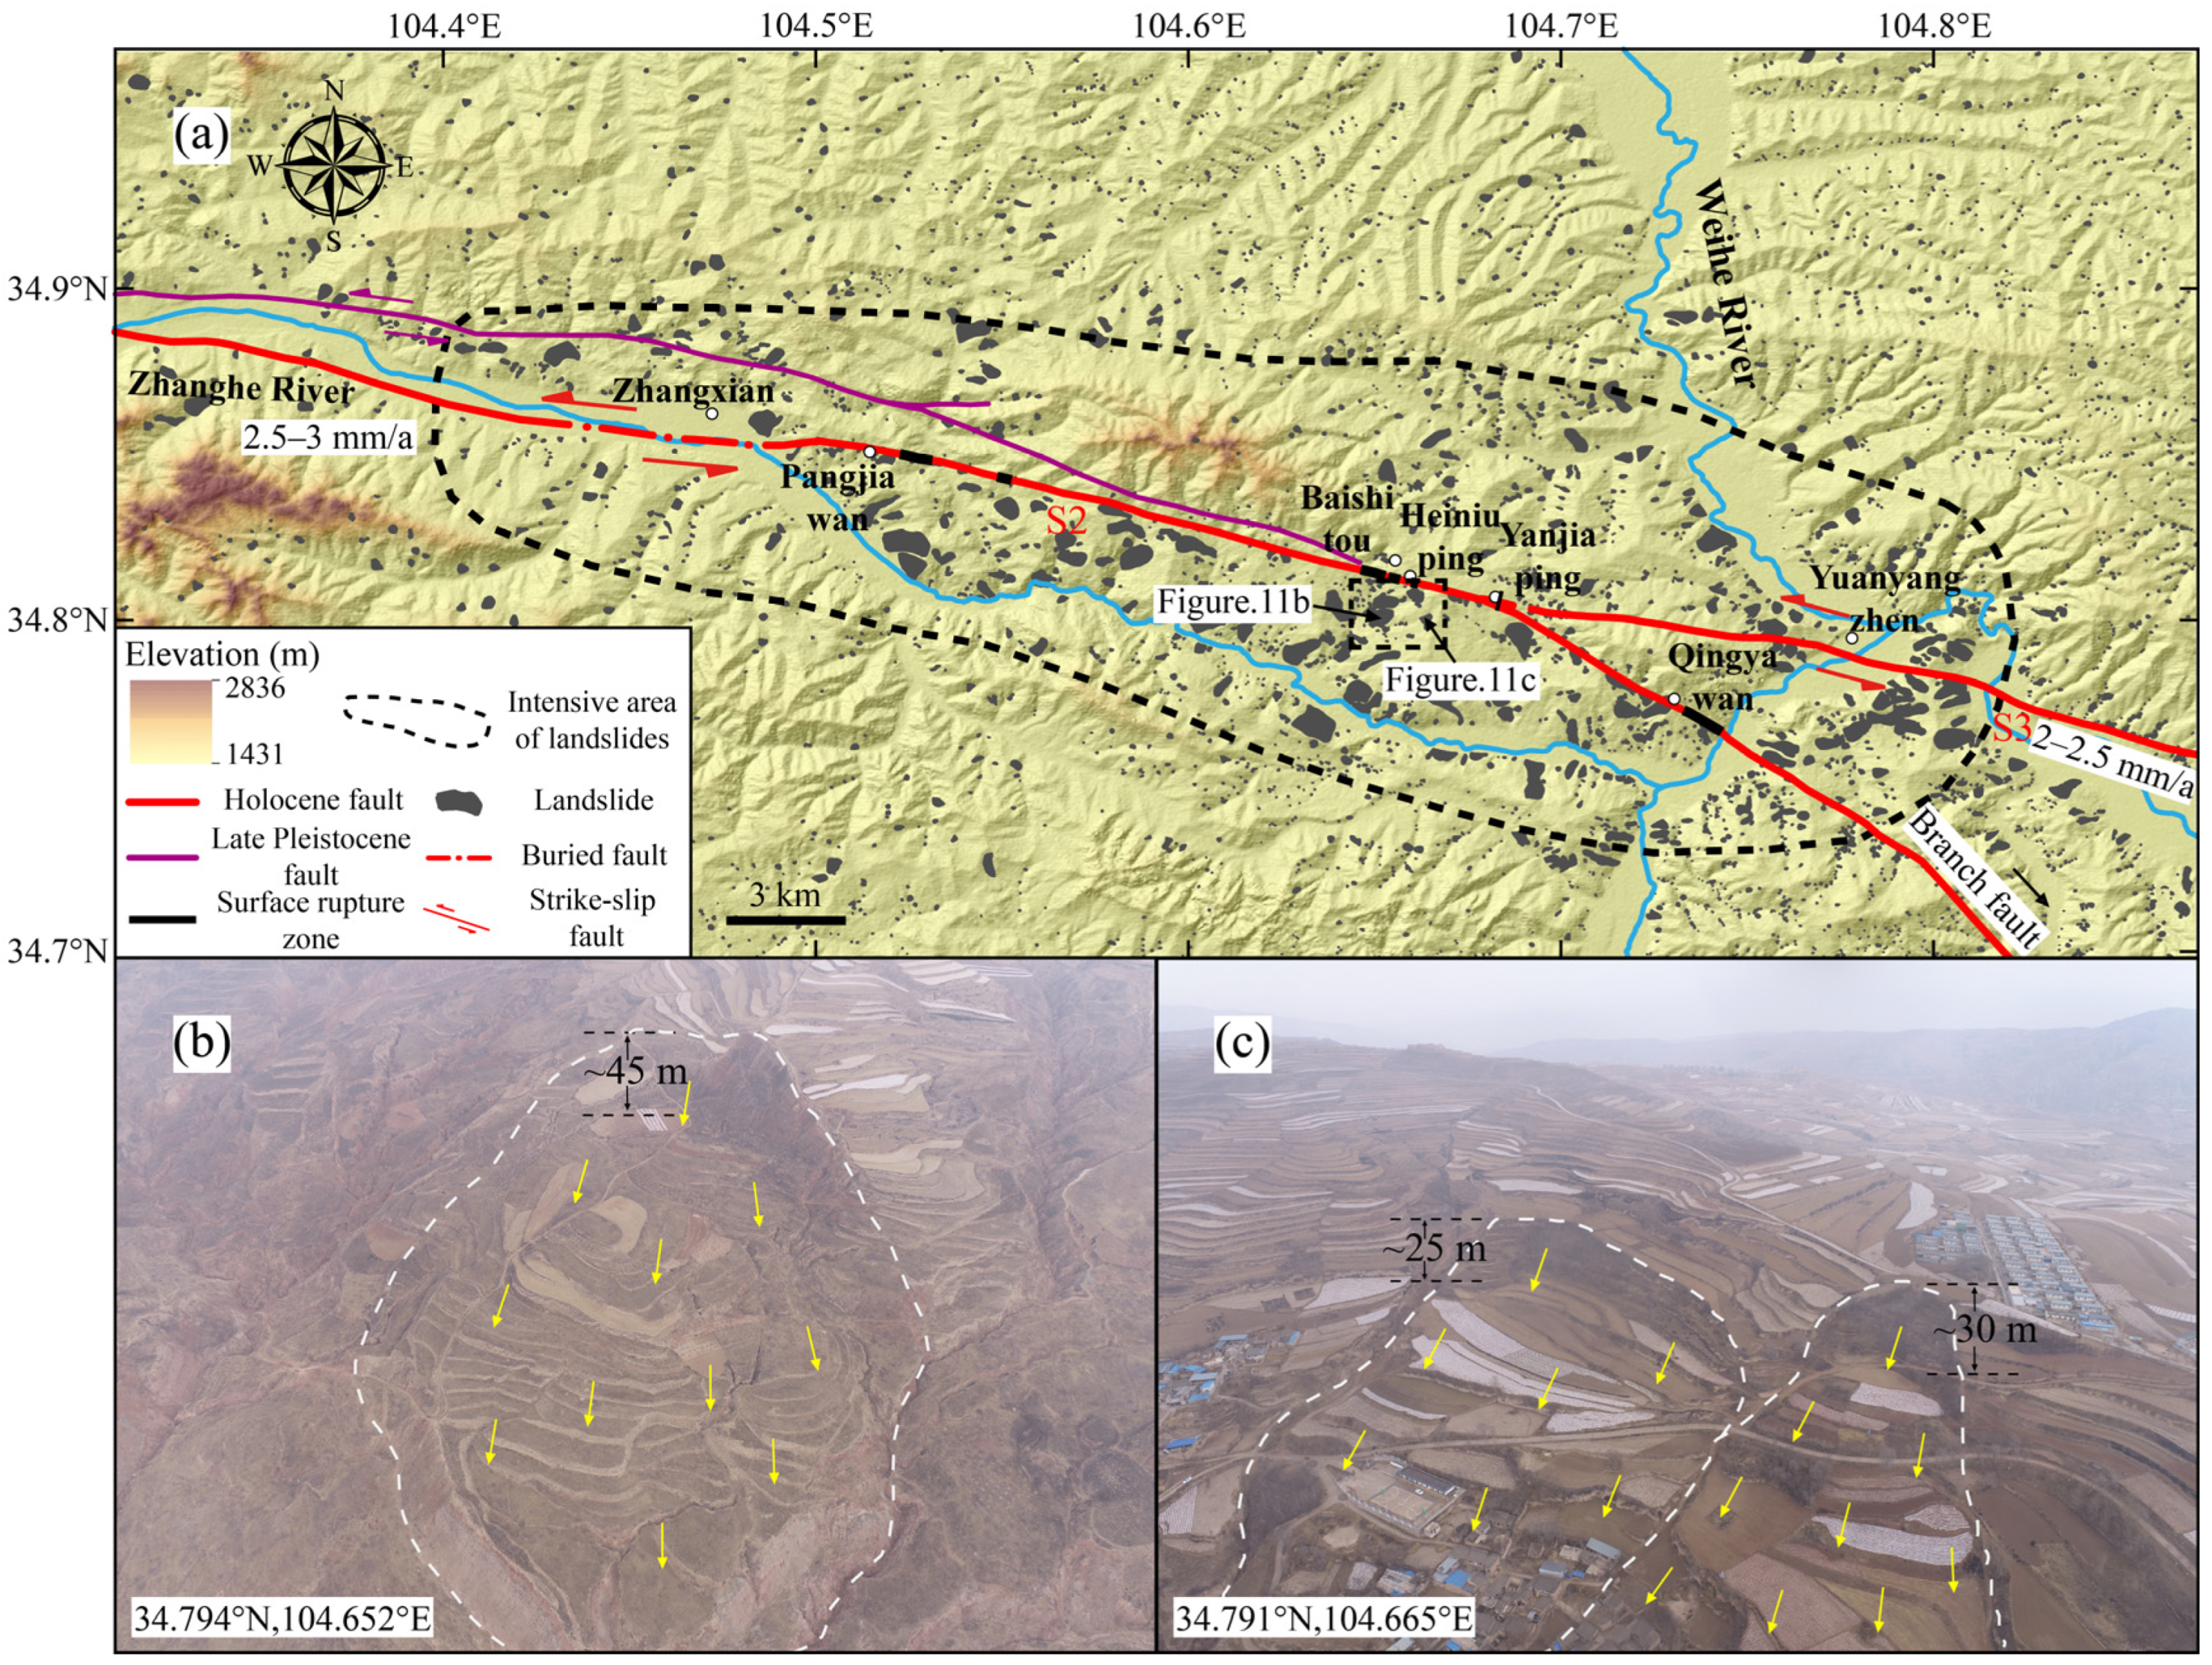
To analyze the spatial distribution of landslides along the fault, which coincides with the surface rupture zone in the epicentral area of the earthquake, we delineated a 51 km by 27 km rectangular investigation area covering the heavily affected region (Figure 11a). Initially, we presented the area’s three-dimensional surface morphology by integrating high-resolution Google Earth images with DEM data. We then employed a visual interpretation approach, utilizing multi-temporal satellite imagery to identify landslides within the watershed system. Subsequently, a blend of field investigations and visual interpretation was employed, with targeted field inspections and verifications conducted by outlining specific test areas (Figure 11b,c). Additionally, we employed small-scale, high-precision UAV surveys to enhance the accuracy of landslide interpretation.

Figure 11.
Spatial distribution map of landslide interpreted by visual interpretation (a) and UAV photos of landslides proofread in the field (b,c). The black dotted box represents the landslide field investigation area. Red and purple arrows indicate the horizontal relative motion direction. Blue lines indicate the rivers.
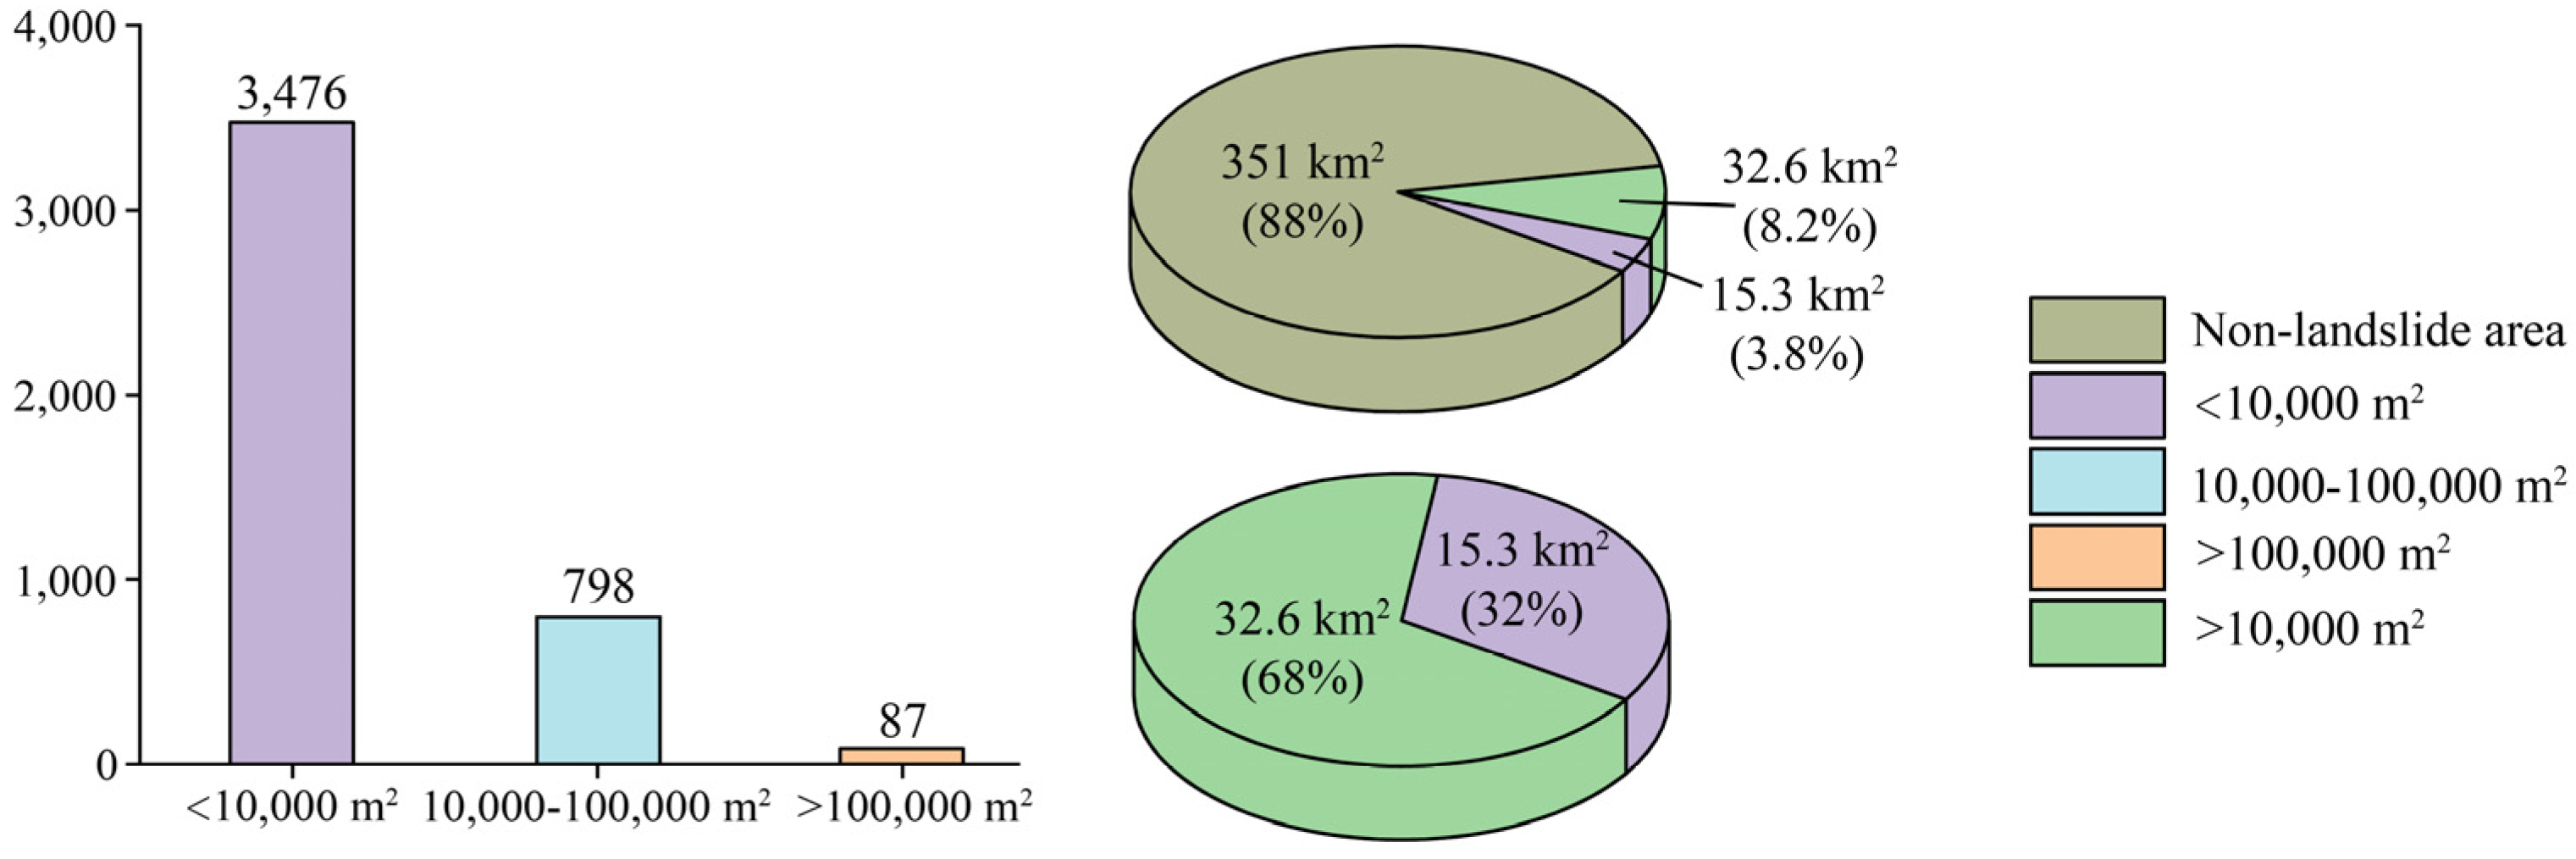
The investigation of landslides in the peripheral regions adjacent to the fault zone identified a total count of 4361, including those triggered by the earthquake and those triggered by rainfall. Among these, 87 landslides exceeded 100,000 m2 in area, while 798 fell within the range of 10,000 m2 to 100,000 m2 and the remainder were smaller than 10,000 m2. The largest landslide spanned an area of 662,524 m2 and the smallest spanned an area 121 m2. Collectively, these landslides covered a total area of 48.2 km2. Unlike shallow landslides triggered by rainfall in the loess plateau region, large-scale landslides triggered by earthquakes often exhibit long-term preservation. Therefore, we analyzed the distribution of large- (>100,000 m2) and medium-sized (10,000–100,000 m2) landslides, which were mainly triggered by earthquakes, and revealed a dense area of approximately 399 km2. Within this dense region, landslides occupied 32.6 km2, representing 68% of the total landslide area and 8.2% of the dense region’s total area (Figure 12). Interpretation results indicate that the dense area of coseismic landslides is primarily concentrated around the WQLF. Small-scale landslides exhibited a uniform distribution across the rectangular interpretation area, lacking a discernible clustering pattern, likely due to the considerable time elapsed since the earthquake. Hence, not all current small-scale landslides are attributed to fault activity. Conversely, large- and medium-sized landslides predominantly develop along the fault zone, extending from the east of Zhangxian to Yuanyangzhen.

Figure 12.
Histogram of landslide areas’ classification in the visual interpretation region and pie charts of landslide areas’ classification in the dense landslide area.
6. Discussion
6.1. Coseismic Displacements and Magnitude
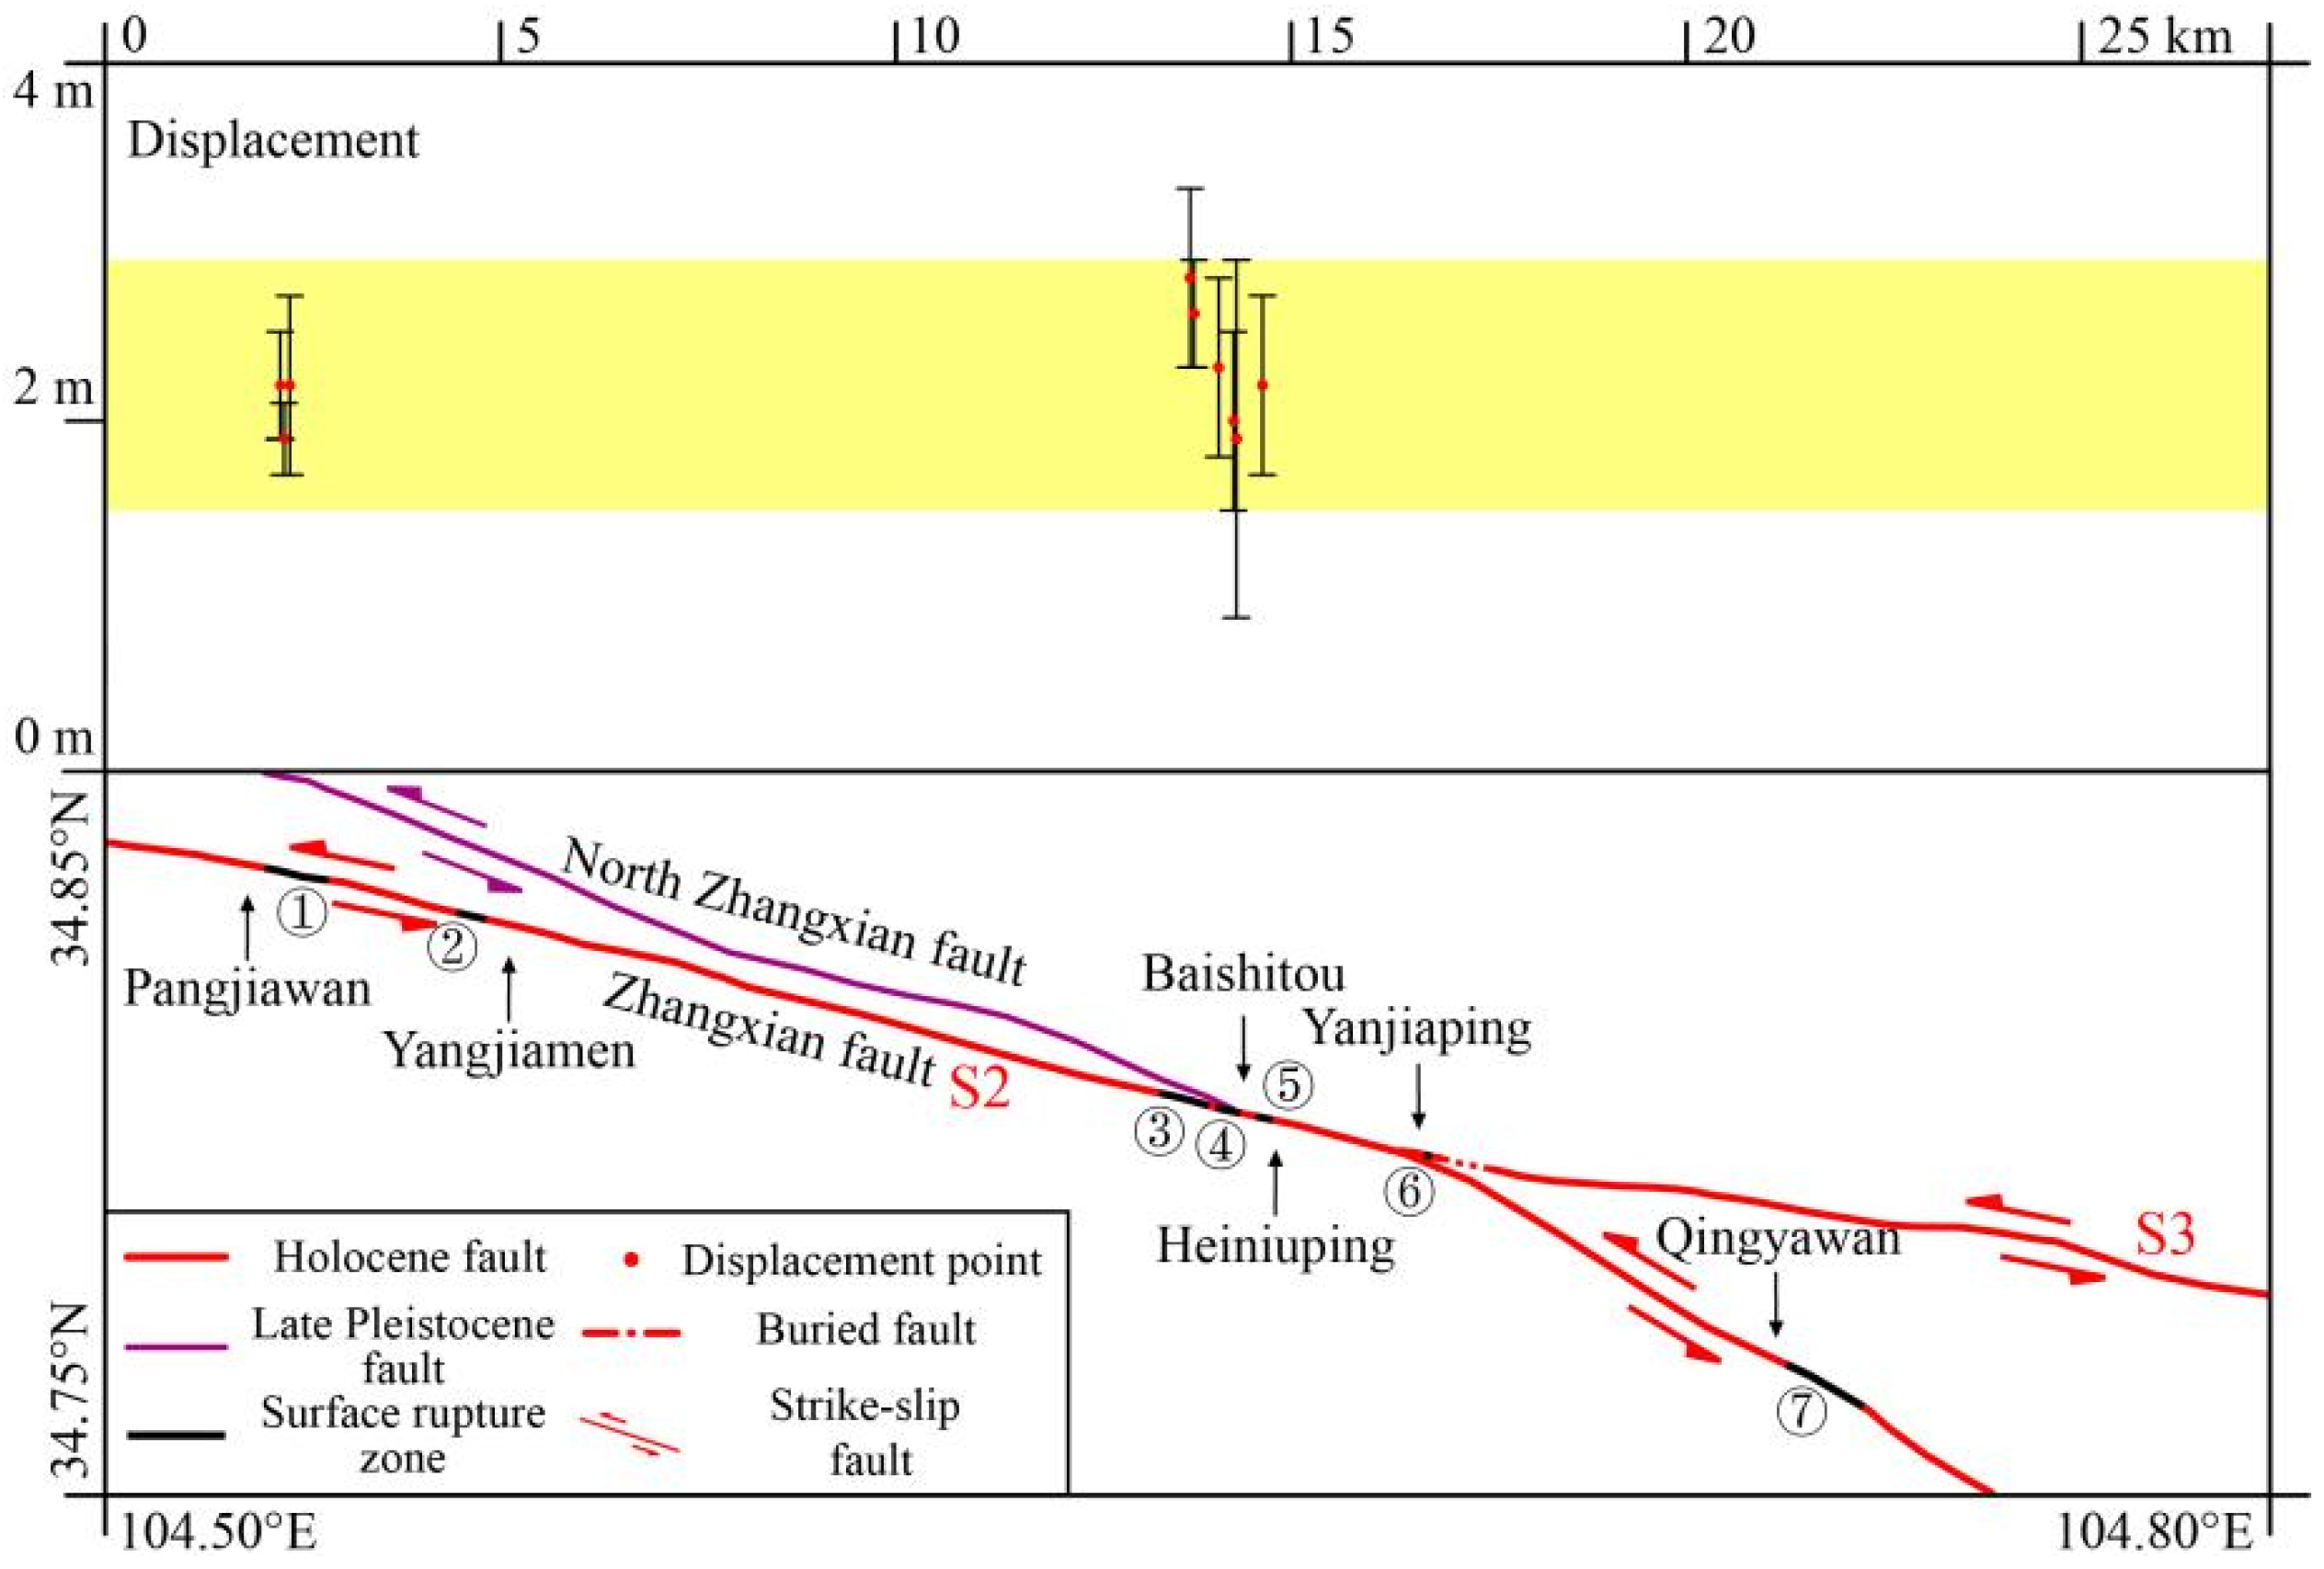
Through field investigations and high-resolution UAV image interpretation, we obtained nine horizontal offset values associated with the earthquake detailed in Table 3, with the overall distribution interval depicted in Figure 13. The largest displacement, approximately 2.8 ± 0.5 m, was observed at the edge of one platform southwest of Baishitou village (Figure 6b), while a nearby gully exhibited a displacement of 2.6 ± 0.3 m (Figure 6e). Varying heights of seismic scarps were observed along the rupture zone east of Pangjiawan village (Figure 4a), with some scarps possibly exaggerated due to topographical and landslide influences. Hence, Table 3 lists only the height information of scarps considered relatively reliable. Southwest of Baishitou village, field investigations revealed an original scarp height of 0.8 ± 0.2 m (Figure 6c), and the fault section of the side wall of the left-lateral gully also revealed the apparent normal faulting characteristics of the U5 formation (Figure 6b). These observations suggest a minor vertical component of motion in addition to the predominant strike-slip motion in this earthquake.
Table 3.
Distribution of surface displacements in the 143 A.D. west Gangu earthquake.
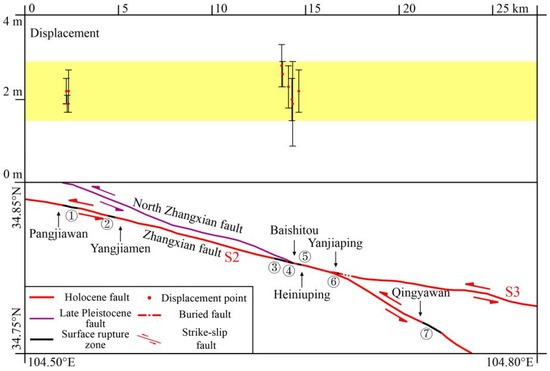
Figure 13.
Spatial distribution of surface rupture zone and coseismic dislocations. The yellow area represents the range of surface displacement values observed in this earthquake.
The magnitude of historical earthquakes can be estimated using empirical formulas related to the length of surface rupture or the maximum coseismic displacement induced by the earthquake [33,34]. By employing the empirical formula Mw = 6.69 + 0.74 × log(MD), where MD is the maximum displacement, proposed by Wells and Coppersmith [33] for estimation purposes, the magnitude of the earthquake is estimated to be approximately Mw 7.02. Utilizing the Ms-Mw magnitude conversion equation proposed by Cheng et al. [35] for mainland China yields Ms 7.2. Wells and Coppersmith [33] pointed out that the average surface displacement of a strike-slip earthquake is typically half of the maximum displacement. Hence, utilizing the formula Mw = 6.93 + 0.82 × lg(AD), where AD denotes the average displacement, the magnitude of this earthquake is estimated to be approximately Mw 7.1, which is also represented as Ms 7.3 by Cheng et al. [35]. Considering that the observed surface displacements may not accurately reflect the maximum coseismic displacement, the actual magnitude is likely to be greater. However, the nearby displacements closely aligning with the maximum displacement (Figure 13) suggest that the obtained maximum displacement within a confined range should closely approximate the actual maximum displacement.
6.2. Length of Surface Rupture Zone
The residual surface rupture zones of the earthquake span approximately 22 km in length intermittently. However, the actual length of the original rupture zone may be underestimated as it extends westward into the Zhanghe River valley and disappears eastward beneath the river beach (Figure 2). Insights into the true extent of the rupture zone are derived from identifying the densely affected area by coseismic landslides and analyzing coseismic displacements. Given the considerable time elapsed since the earthquake, the delineated dense landslide area is assumed to be relatively conservative in range. This dense area of landslides along the long axis of the rupture zone measures approximately 39 km in length. The furthest west end of the dense area has extended to the south of Zhangxian, about 12 km away from the surface rupture zone discovered east of Pangjiawan village, surpassing the distance of landslides on both sides of the rupture zone. By using the furthest triggering distance of landslides as the criterion for determining the termination of the rupture zone at both ends, the presumed original length of the rupture zone is approximately 30 km.
In contrast, the Mw 6.7 earthquake that occurred in Menyuan, Qinghai Province, China, in 2022 formed two surface rupture zones, with a total length of approximately 31 km [36,37]. In the northern rupture zone, the distance from the end (37.8161°N, 101.1816°E) to the horizontal fault phenomenon which measured 2.13 ± 0.08 m (37.8058°N, 101.2420°E) is roughly 5.5 km. Considering that the displacement value of the sinistral channel found in the surface rupture zone in Pangjiawan can still reach 1.9 ± 0.2 m (Figure 5c,d), it can be inferred that the rupture zone should extend westward for several kilometers, so the total length of the original rupture zone exceeds 22 km. Considering that this earthquake occurred at the intersection of the Zhangxian fault segment and the Wushan fault segment of the WQLF, the complex structural transformation would result in an asymmetric length of the rupture zone and the distance from the epicenter to the ends of the rupture zone. Employing the Wells and Coppersmith [33] empirical formula for strike-slip faults, M = 5.16 + 1.12 × lg(SRL), where SRL denotes the Surface Rupture Length, the estimated magnitude is around Mw 6.66 (represented as Ms 6.8 using the Ms-Mw magnitude conversion equation by Cheng et al. [35]), which is clearly underestimated. However, presuming an initial surface rupture zone length of 30 km yields a magnitude of Mw 6.81, which is also represented as Ms 7 by Cheng et al. [35].
6.3. Distribution of Coseismic Landslides
The landslides triggered on both sides of the fault in this earthquake display a roughly symmetrical distribution suggesting a high-angle strike-slip fault in the deep part, which differs from the asymmetric landslide distribution caused by thrust faults [31,38,39]. Fukuoka et al. [29] conducted a study on earthquakes and observed that coseismic landslides concentrate with a 3 km radius from the axis of the rupture zone, with the maximum distance not exceeding 10 km. This finding aligns with the dense area of landslides we have identified.
By combining field investigations with 1:200,000 geological map stratigraphic mapping (see Figure 2), we observed that the lithology of the strata in the landslide-prone area along the WQLF primarily comprises weakly consolidated sandstone and conglomerate from the Paleogene and Neogene epochs, alongside sandstone and shale from the Cretaceous period. With a thick layer of overlying loess, this area has witnessed a notable occurrence of landslides, including both loess landslides and loess–bedrock landslides. Devonian and Carboniferous strata are locally exposed in the northern region of the fault, predominantly consisting of more consolidated shale and slate, with a relatively thinner layer of loess. Consequently, large- and medium-sized landslides are notably scarce in this area. Beyond the densely landslide-affected area, the stratigraphic layers along the fault are primarily composed of Cretaceous and Cenozoic sandstone, conglomerate, and Quaternary loose sediments. In contrast to the inner densely affected area, there are no significant lithological variations, suggesting a limited influence of lithology on the overall landslide distribution in the study area.
Large- and medium-sized coseismic landslides often endure for millennia following an earthquake. We assume that the observed large- and medium-sized landslides primarily stemmed from the 143 A.D. west Gangu earthquake. Considering the empirical correlation between landslide distance from the epicenter and magnitude [40], assuming that most of the large landslides triggered by this earthquake remain identifiable and that the farthest identified large landslide falls approximately within the coseismic triggering range, the estimated earthquake magnitudes are both Ms 7.1 as per the empirical formula lgDe = 12.82 × lgMs − 9.508 [40] and Ms = 5.6425 × De0.071 [41], where De represents the farthest distance from the landslide concentration area to the epicenter. Recognizing the significant time elapsed since the earthquake, these magnitudes constitute the minimum estimate for the event.
6.4. Historical Records
With the utilization of trench excavation and chronological dating techniques, the temporal occurrence of this earthquake can be constrained to a period ranging from 2010 ± 30 yr B.P. to 0.7 ± 0.1 ka ago. Considering that the deposition time (2010 ± 30 yr B.P. and 2280 ± 30 yr B.P.) of the sampling layer is close to the representative time of the tectonic events, the occurrence of the earthquake should be estimated to be around 2000 years ago.
The historical records document several moderate to strong seismic events along the WQLF, including the Longxi M 7 earthquake in 47 B.C., west Gangu earthquake in 143 A.D., Gangu M 6½ earthquake in 128 A.D., Tianshui M 7 earthquake in 734 A.D., Gangu-Wushan M 6½ earthquake in 1765, and Kangle M 6¾ earthquake in 1936 [16,22,42,43]. Notably, the Longxi earthquake in 47 B.C., occurring close in time to the 143 A.D. west Gangu earthquake, has been confirmed to have taken place in the Wushan fault segment, substantiated by Yuan et al. [22]. The Gangu M 6½ earthquake in 128 A.D., located east of Wushan county, had a relatively low magnitude, insufficient to cause significant surface rupture. Moreover, there are no records of other historical earthquakes in the study area. Given the longstanding population dating back to the Qin and Han dynasties and the establishment of local institutions responsible for recording disaster events, major earthquakes in this area are comprehensive and unlikely to be overlooked. Therefore, we propose that the surface rupture zone in this area was formed by the 143 A.D. west Gangu earthquake.
We compiled historical records and relevant research findings concerning this earthquake (see Table 4). Early studies encountered significant challenges in accurately pinpointing the epicenter location [7,8,9,10], mainly due to sparse records and substantial geomorphic changes resulting from human activities. Despite these hurdles, historical records consistently indicated a magnitude around 7, with the epicenter situated west of Gangu County. Yuan et al. [10] conducted an exhaustive analysis of the seismic damage, timing, and societal impact, determining a maximum intensity of 9–10 degrees, with the felt range extending from west of Zhangxian County to Tianshui City. Our investigation corroborates this perspective, affirming that the historical earthquake rupture zone lies within the central part of the previously identified earthquake intensity area [10], thereby supporting the aforementioned viewpoint. By integrating landslide interpretations, fault length analysis, and coseismic displacement analysis, we estimate the earthquake’s magnitude to be equivalent to Ms 7–7.3, with the epicenter located at the maximum coseismic displacement on the surface (104.8°E, 34.7°N), primarily along the Zhangxian segment of the WQLF.
Table 4.
Historical records and research results of the 143 A.D. west Gangu earthquake.
6.5. Risk Assessment of Future Earthquakes
Throughout history, the WQLF has experienced several destructive earthquakes. Therefore, it is of great significance to assess the activity characteristics and future earthquake risk of different segments of the WQLF. Benefiting from comprehensive historical earthquake data, we have compiled information on past seismic events along the WQLF and its surrounding areas (Figure 14). Notably, the region encompassing the surface rupture zone of the 143 A.D. west Gangu earthquake has not recorded other destructive earthquakes in history. Thus, this earthquake remains the most recent occurrence within the eastern segment of the Zhangxian fault. Based on this, the earthquake interval for the Zhangxian fault segment of the WQLF approaches approximately 1900 years. Furthermore, through sample dating, it was revealed that an ancient earthquake occurred between 7700 ± 40 yr B.P. and 9910 ± 30 yr B.P., an event not recorded due to its antiquity. Comparing the earthquake recurrence interval of the eastern area to the western area of the Zhangxian fault segment (~2000 years, [17]), it becomes evident that greater attention should be directed towards the future earthquake risk in the eastern section of the Zhangxian fault segment. The analysis of seismic intervals further underscores the urgency of evaluating the earthquake risk, especially considering the dense population settlements in this area.
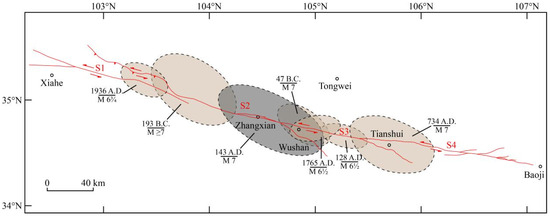
Figure 14.
Segmentation and structural geometry and historical earthquakes along the WQLF (modified after Shao et al. [16]). The ellipse represents severe damage in areas caused by historical earthquakes. Red arrows indicate the horizontal relative motion direction.
7. Conclusions
Through extensive field investigations of surface rupture zones, coseismic displacements, and natural outcrop profiles related to the 143 A.D. west Gangu earthquake, combined with interpretations of landslides, high-precision UAV surveys, trench excavations, sample dating, and analysis of historical data, a comprehensive study of this earthquake was conducted, and the main conclusions obtained are as follows:
(1) The epicenter of the 143 A.D. west Gangu earthquake is located at 104.8°E, 34.7°N, at the eastern end of the Zhangxian fault segment of the WQLF. The magnitude of the earthquake is estimated to be approximately Ms 7–7.3, and the earthquake rupture occurred along the Zhangxian fault segment.
(2) The residual surface rupture zone discovered during field investigations is discontinuously about 22 km in length and distributed from east of Zhangxian to Yuanyangzhen, which corresponds to the dense area of large and medium coseismic landslides along the fault zone. The maximum coseismic horizontal displacement of the ground measured is about 2.8 ± 0.5 m.
(3) Nearly 1900 years have passed since the 143 A.D. west Gangu earthquake occurred. Combined with the seismic recurrence periods of various sections of the WQLF, the present earthquake risk of the seismogenic region deserves attention, especially considering the dense population settlements in this area.
Author Contributions
All authors participated in editing and reviewing this manuscript. Conceptualization, R.S. and D.Y.; Methodology, D.Y.; Validation, D.Y., A.W. and H.X.; Formal Analysis, R.S. and Y.W.; Funding Acquisition, D.Y.; Investigation, R.S., D.Y., A.W., H.X., Y.W., J.Y., Y.C., H.L., H.S. and L.Z.; Project Administration, D.Y.; Resources, R.S. and D.Y.; Data Curation, R.S., D.Y. and A.W.; Supervision, D.Y.; Visualization, R.S.; Writing—Original Draft Preparation, R.S.; Writing—Review and Editing, D.Y. and H.X. All authors have read and agreed to the published version of the manuscript.
Funding
This research was funded by the National Natural Science Foundation of China (42172227) and the Second Tibetan Plateau Scientific Expedition and Research Program (2019QZKK0901).
Data Availability Statement
The data of the 30 m resolution DEM set were provided by the United States Geological Survey (USGS, https://lpdaac.usgs.gov/products/srtmgl1v003 (accessed on 12 February 2024)). The landslide data in this paper are available on request.
Acknowledgments
The 14C age dating data were measured by Lab Beta, and the OSL age dating data were measured by the Luminescence Research Laboratory of Linyi University.
Conflicts of Interest
The authors acknowledge there are no conflicts of interest recorded.
References
- Hou, K.; Wang, Q. Fundamental characteristics of Gulang Ms 8 Earthquake in 1927. Earthq. Res. Plateau 1999, 11, 12–18. (In Chinese) [Google Scholar]
- Yuan, D.; Lei, Z.; Yang, Q.; Wang, A.; Xie, H.; Su, Q. Seismic disaster features of the 1879 southern Wudu M 8 earthquake in Gansu Province. J. Lanzhou Univ. Nat. Sci. 2014, 50, 611–621. (In Chinese) [Google Scholar]
- Yang, X.; Feng, X.; Huang, X.; Song, F.; Li, G.; Chen, X.; Zhang, L.; Huang, W. The Late Quaternary activity characteristics of the Lixian-Luojiabu fault: A discussion on the seismogenic mechanism of the Lixian M 8 earthquake in 1654. Chin. J. Geophys. 2015, 58, 504–519. (In Chinese) [Google Scholar]
- Tapponnier, P.; Xu, Z.; Roger, E.; Meyer, B.; Arnaud, N.; Wittlinger, G.; Yang, J. Oblique stepwise rise and growth of the Tibetan Plateau. Science 2001, 294, 1671–1677. [Google Scholar] [CrossRef] [PubMed]
- Deng, Q.; Zhang, P.; Ran, Y.; Yang, X.; Min, W.; Chu, Q. Basic characteristics of active tectonics of China. Sci. China Ser. D 2002, 46, 356–372. (In Chinese) [Google Scholar] [CrossRef]
- Zhang, P.; Deng, Q.; Zhang, G.; Ma, J.; Gan, W.; Min, W.; Mao, F.; Wang, Q. Strong earthquake activity and active blocks in Chinese Mainland. Sci. China Ser. D 2003, S1, 12–20. (In Chinese) [Google Scholar]
- Gu, G.; Lin, T.; Shi, Z.; Li, Q.; Wu, H.; Lu, S.; Yang, Y.; Chen, H.; Wang, S. China Earthquake Catalogue (1831 BC–1969 AD); Science Press: Beijing, China, 1983. (In Chinese) [Google Scholar]
- Lanzhou Institude of Seismology; SSB. Catalogue of Strong Earthquakes in the Four Provinces (Region) of Shaanxi, Gansu, Ningxia and Qinghai (1177 BC–1982 AD); Shaanxi Scientific and Tectnological Press: Xi’an, China, 1985; p. 6. (In Chinese) [Google Scholar]
- Department of Earthquake Disaster Prevention; SSB. Catalogue of Chinese Strong Historical Earthquakes; Seicmological Press: Beijing, China, 1995; pp. 7–8. (In Chinese) [Google Scholar]
- Yuan, D.; Lei, Z.; Ge, W.; Liu, W.; Liu, B.; Zhang, J. A New Opinion abour the West of Gangu M 7.0 Earthquake in 143 A.D. in Gansu Province. Northwestern Seismol. J. 2007, 29, 58–63. (In Chinese) [Google Scholar]
- Wang, A.; Yuan, D.; Zhang, B.; Wu, Z.; Shao, Y.; Wang, J. Seismic hazard and harmfulness in the north margin of western Qinling Fault zone. City Disaster Reduct. 2018, 4, 48–54. (In Chinese) [Google Scholar]
- USGS. SRTMGL1 v003. 2000. Available online: https://lpdaac.usgs.gov/products/srtmgl1v003 (accessed on 5 February 2024).
- Deng, Q.; Ran, Y.; Yang, X.; Min, W.; Chu, Q. Map of Active Tectonics in China; Seismological Press: Beijing, China, 2007; Volume 2. (In Chinese) [Google Scholar]
- Xu, X.; Ran, Y.; Yang, X.; Zhang, S.; Yu, G.; Zhou, B.; Li, F.; Ma, B.; Chen, G.; Ran, Y. Seismotectonic Map of China and Adjacent Areas; Seismological Press: Beijing, China, 2016; Volume 1. (In Chinese) [Google Scholar]
- National Earthquake Data Center. Catalogue of Historical Earthquakes in China; National Earthquake Data Center: Beijing, China, 2023. (In Chinese) [Google Scholar]
- Shao, Y.; Yuan, D.; Wang, A.; Liang, M.; Liu, K.; Feng, J. The segmentation of rupture and estimate of earthquake risk along the north margin of western Qinling Fault zone. Seismol. Geol. 2011, 33, 79–90. (In Chinese) [Google Scholar]
- Li, C.; Zhang, P.; Zhang, J.; Yuan, D.; Wang, Z. Lare-Quaternary activity and sliprate of the western Qinling Fault zone at Huangxianggou. Quat. Sci. 2007, 27, 54–63. (In Chinese) [Google Scholar]
- Wu, Z. Study on New Features of Tectonic Activity and Seismic Hazard at the Middle-Eastern Segment of Western Qinling Fault Zone. Master’s Thesis, Lanzhou Institute of Seismology, CEA, Lanzhou, China, 2016. (In Chinese). [Google Scholar]
- Chen, P.; Lin, A. Tectonic topography and Late Pleistocene activity of the West Qinling Fault, northeastern Tibetan Plateau. J. Asian Earth Sci. 2019, 176, 68–78. [Google Scholar] [CrossRef]
- Lei, Z.; Yuan, D.; Ge, W.; He, W.; Liu, X. Textual research in the Tianshui M 7 Earthquake in 734 AD and analysis of its causative structure. Seismol. Geol. 2007, 29, 51–62. (In Chinese) [Google Scholar]
- Zhang, B.; He, W.; Fang, L.; Pang, W.; Zhao, Z.; Liu, X. Surveys on Surface Rupture Phenomena of Gansu Kangle M 6¾ Earthquake in 1936. J. Seismol. Res. 2015, 38, 262–271+333. (In Chinese) [Google Scholar]
- Yuan, D.; Lei, Z.; Wu, Z.; Feng, J. Textual research of Longxi Earthquake in 47 BC in Gangu province and analysis of its causative structure. Seismol. Geol. 2017, 39, 819–836. (In Chinese) [Google Scholar]
- Xu, Y.; Zeng, J.; Allen, M.; Du, P. Understanding historical earthquakes by mapping coseismic landslides in the Loess Plateau, northwest China. Earth Surf. Process. Landf. 2022, 47, 2266–2282. [Google Scholar] [CrossRef]
- Li, C.; Zhang, P.; Yuan, D.; Wang, Z.; Zhang, J. Late-Quaternary horizontal displacement and its associated micro-geomorphology of the western Qinling Fault zone at Huangxianggou. Seismol. Geol. 2006, 28, 391–404. (In Chinese) [Google Scholar]
- Wei, Z.; Arrowsmith, R.; He, H.; Gao, W. Accuracy analysis of terrain point cloud acquired by “Structure from Motion” using arial photos. Seismol. Geol. 2015, 37, 636–648. (In Chinese) [Google Scholar]
- Keefer, D. Landslides caused by earthquakes. Geol. Soc. Am. Bull. 1984, 95, 406–421. Available online: https://pubs.usgs.gov/publication/70014049 (accessed on 10 February 2024). [CrossRef]
- Rodriguez, C.; Bommer, J.; Chandler, R. Earthquake-induced landslides: 1980–1997. Soil Dyn. Earthq. Eng. 1999, 18, 325–346. [Google Scholar] [CrossRef]
- Xu, C.; Xu, X.; Shyu, B.; Zheng, W.; Min, W. Landslides triggered by the 22 July 2013 Minxian-Zhangxian, China, Mw 5.9 earthquake: Inventory compiling and spatial distribution analysis. J. Asian Earth Sci. 2014, 92, 125–142. [Google Scholar] [CrossRef]
- Fukuoka, H.; Sassa, K.; Scarascia-Mugnozza, G. Distribution of Landslides Triggered by the 1995 Hyogo-ken Nanbu Earthquake and Long Runout Mechanism of the Takarazuka Golf Course Landslide. J. Phys. Earth 1997, 45, 83–90. [Google Scholar] [CrossRef]
- Xu, C.; Xu, X.; Yu, G. Landslides triggered by slipping-fault-generated earthquake on a plateau: An example of the 14 April 2010, Ms 7.1, Yushu, China earthquake. Landslides 2013, 10, 421–431. [Google Scholar] [CrossRef]
- Dai, C.; Xu, C.; Yao, X.; Xu, L.; Tu, X.; Gong, Q. Spatial distribution of landslides triggered by the 2008 Ms 8.0 Wenchuan earthquake, China. J. Asian Earth Sci. 2011, 40, 883–895. [Google Scholar] [CrossRef]
- Gorum, T.; Western, C.; Korup, O.; Meijde, M.; Fan, X.; Meer, F. Complex rupture mechanism and topography control symmetry of mass-wasting pattern, 2010 Haiti earthquake. Geomorphology 2013, 184, 127–138. [Google Scholar] [CrossRef]
- Wells, D.; Coppersmith, K. New Empirical Relationships among Magnitude, Rupture Length, Rupture Width, Rupture Area, and Surface Displacement. Bull. Seismol. Soc. Am. 1994, 84, 974–1002. [Google Scholar] [CrossRef]
- Yeats, R.; Sieh, K.; Allen, C. The Geology of Earthquakes; Oxford University Press: New York, NY, USA, 1997; pp. 1–568. [Google Scholar]
- Cheng, J.; Rong, Y.; Magistrale, H.; Chen, G.; Xu, X. An Mw-Based Historical Earthquake Catalog for Mainland China. Bull. Seismol. Soc. Am. 2017, 107, 2490–2500. [Google Scholar] [CrossRef]
- Yuan, D.; Xie, H.; Su, R.; Li, Z.; Wen, Y.; Si, G.; Xue, S.; Chen, G.; Liu, B.; Liang, S.; et al. Characteristics of co-seismic surface rupture zone of Menyuan Ms 6.9 earthquake in Qinhai Province on 8 January 2022 and seismogenic mechanism. Chin. J. Geophys. 2023, 66, 229–244. (In Chinese) [Google Scholar]
- Wen, Y.; Yuan, D.; Xie, H.; Su, R.; Su, Q.; Li, Z.; Sun, H.; Si, G.; Yu, J.; Chen, Y.; et al. Typical Fine Structure and Seismogenic Mechanism Analysis of the Surface Rupture of the 2022 Menyuan Mw 6.7 Earthquake. Remote Sens. 2023, 15, 4375. [Google Scholar] [CrossRef]
- Harp, E.; Jibson, R.; Dart, R. The Effect of Complex Fault Rupture on the Distribution of Landslides Triggered by the 12 January 2010, Haiti Earthquake. Landslide Sci. Pract. 2013, 5, 157–161. [Google Scholar] [CrossRef]
- Xu, C.; Xu, X.; Yao, X.; Dai, F. Three (nearly) complete inventories of landslides triggered by the 12 May 2008 Wenchuan Mw 7.9 earthquake of China and their spatial distribution statistical analysis. Landslides 2014, 11, 441–461. [Google Scholar] [CrossRef]
- Wang, L.; Yuan, Z.; Shi, Y.; Sun, C. Study on the methods and indexes of zonation for seismic losessal disasters. J. Nat. Disasters 1999, 8, 87–92. (In Chinese) [Google Scholar]
- Cai, S.; Wang, L.; Yuan, Z. A preliminary study on the seismic landslide distance in the Shaanxi-Gansu-Ningxia-Shanxi loess region. Northwestern Seismol. J. 1998, 20, 75–82. (In Chinese) [Google Scholar]
- Han, Z.; Xiang, H.; Guo, S. Primary study on active features of Fenghuangshan-Tianshui fault, West Qinling north boundary fault zone since the late of Late-pleistocene. Acta Seismol. Sin. 2001, 23, 217–220. (In Chinese) [Google Scholar]
- Wang, W.; Yuan, D.; Lei, Z.; Zhang, B. Textual Research on the 1765 Zhuoni-Kangle Earthquake in Gansu Province and Its Causative Structure. China Earthq. Eng. J. 2020, 42, 714–720+758. (In Chinese) [Google Scholar]


Disclaimer/Publisher’s Note: The statements, opinions and data contained in all publications are solely those of the individual author(s) and contributor(s) and not of MDPI and/or the editor(s). MDPI and/or the editor(s) disclaim responsibility for any injury to people or property resulting from any ideas, methods, instructions or products referred to in the content. |
© 2024 by the authors. Licensee MDPI, Basel, Switzerland. This article is an open access article distributed under the terms and conditions of the Creative Commons Attribution (CC BY) license (https://creativecommons.org/licenses/by/4.0/).