Abstract
Tidal salt marshes offer crucial ecosystem services in the form of carbon sequestration, fisheries, property and recreational values, and protection from storm surges, and are therefore considered one of the most valuable and fragile ecosystems worldwide, where sea-level rise and direct human modifications resulted in the loss of vast regions of today’s marshland. The extent of salt marshes therefore relies heavily on the interplay between upland migration and edge erosion. We measured changes in marsh size based on historical topographic sheets from the 1850s and 2019 satellite imagery along the Texas coast, which is home to three of the largest estuaries in North America (e.g., Galveston, Corpus Christi, and Matagorda Bays). We further distinguished between changes in high and low marsh based on local elevation data in an effort to estimate changes in local ecosystem services. Our results showed that approximately 410 km2 (58%) of salt marshes were lost due to coastal erosion and marsh ponding and nearly 510 km2 (72%) of salt marshes were created, likely due to upland submergence. Statistical analyses showed a significant relationship between marsh migration and upland slope, suggesting that today’s marshland formed as a result of submergence of barren uplands along gently sloping coastal plains. Although the overall areal extent of Texas marshes increased throughout the last century (~100 km2 or 14%), economic gains through upland migration of high marshes (mostly in the form of property value (USD 0.7–1.0 trillion)) were too small to offset sea-level-driven losses of crucial ecosystem services of Texan low marshes (in the form of storm protection and fisheries (USD 2.1–2.7 trillion)). Together, our results suggest that despite significant increases in marsh area, the loss of crucial ecosystem services underscores the complexity and importance of considering not only quantity but also quality in marshland conservation efforts.
1. Introduction
Tidal salt marshes are considered one of the most valuable and fragile ecosystems in the world. Although marshes offer crucial ecosystem services in the form of carbon sequestration and protection from storm surges [1], accelerated sea-level rise and direct human modifications threaten low-lying coastal ecosystems. A rapid upsurge in the rate of sea-level rise was observed worldwide during the last 150 years, where many regions across the world experienced an approximate threefold increase in the rate of sea-level rise [2,3]. The Texas coastal region of the United States experiences rates of subsidence and relative sea-level rise that far exceed rates observed in other portions of the world [4], in particular around the Houston area [5], where future predictions of salt marsh loss exceed 20% by 2100 [6]. Although coastal salt marshes have long adapted to changing sea levels in some parts of the United States [7,8], researchers caution that rapid sea-level rise and insufficient sediment supply may threaten the survival of salt marsh ecosystems elsewhere [9,10].
Comparisons between relative sea-level rise rates and vertical marsh accretion have long been the standard for evaluating marsh vulnerability [11,12,13,14,15]. However, previous mapping efforts showed that sea-level rise also causes salt marshes to transgress laterally [7,8]. Wave-driven lateral marsh erosion significantly contributes to marsh collapse and can occur even without substantial increases in sea-level rise [16]. Rates of marsh edge erosion have been reported to range between ~0.1 and >3 m year−1, and largely depend on wave intensity, marsh height, and vegetation coverage [8,16,17,18]. Sea-level rise also leads to marsh migration at the expense of adjacent terrestrial ecosystems, where increasing saline conditions create new marsh soils depending on the interplay between local ecology and geomorphology, sea-level rise rate, slope of the adjacent upland, and sediment dynamics [7,8,15,19]. Reconstructions based on historical maps showed that recent marsh migration into retreating forests offset marsh loss along the Chesapeake Bay and Florida Gulf Coast and allowed marshes to survive some of the world’s most rapid sea-level rise rates [7,8].
Steep slopes and anthropogenic barriers commonly limit the land available for upland marsh migration [20,21], and previous observations of human development have already shown the limiting effects of artificial barriers to the response patterns of marsh vegetation [20]. Financial incentives to secure private property with hardened structures such as dikes, revetments, levees, and seawalls tend to reduce ecosystem connectivity and prevent landward migration [21]. Because coastal marshes lie between these human-built barriers and the encroaching ocean, such structures lead to marsh collapse through “coastal squeeze,” where erosion effectively reduces salt marsh area at the seaward edge and barriers prevent the addition of new marshland landwards [22]. Sea-level rise and continuously increasing real estate values are likely to bias decisions, prioritizing the maintenance of artificial barriers and sacrificing valuable marshland [20] when it leads to the most efficient result [23], addresses financial needs [24], or offers a greater financial gain from investments [20].
Sea-level rise and human development therefore threaten coastal wetlands, which are well known for their ecosystem services [1]. As nearly half the global salt marshes are either submerged or degraded, at least three crucial ecosystem services have previously experienced a decline in ecosystem value: number of fisheries (33%), nursery habitats such as coastal wetlands (69%), and filtering services of suspension feeders, seagrass, and coastal wetlands (63%) [1,25]. As a result, many coastal environments experience declining water quality and increasing occurrence of harmful algal blooms, biological invasions, fish and shellfish kills, beach closures, and oxygen depletion [25]. Marsh erosion and therefore vegetation loss ultimately decrease the ecosystem’s ability to protect against shore erosion, flooding, and storm surges [25,26,27]. As the Texas coast is particularly vulnerable to the impacts of hurricanes or other major storms, securing coastal uplands to promote marsh migration and therefore prevent economic losses from property damage represents a valuable resource for climate change mitigation. Here, we measured changes in the extent of tidal salt marshes and associated ecosystem services between historical topographic maps and recent satellite images along the Texas coast in an effort to identify patterns of historical sea-level-driven marsh transgression and to inform private landowners and conservation groups of past and therefore potential future threats to their properties.
2. Materials and Methods
2.1. Study Location
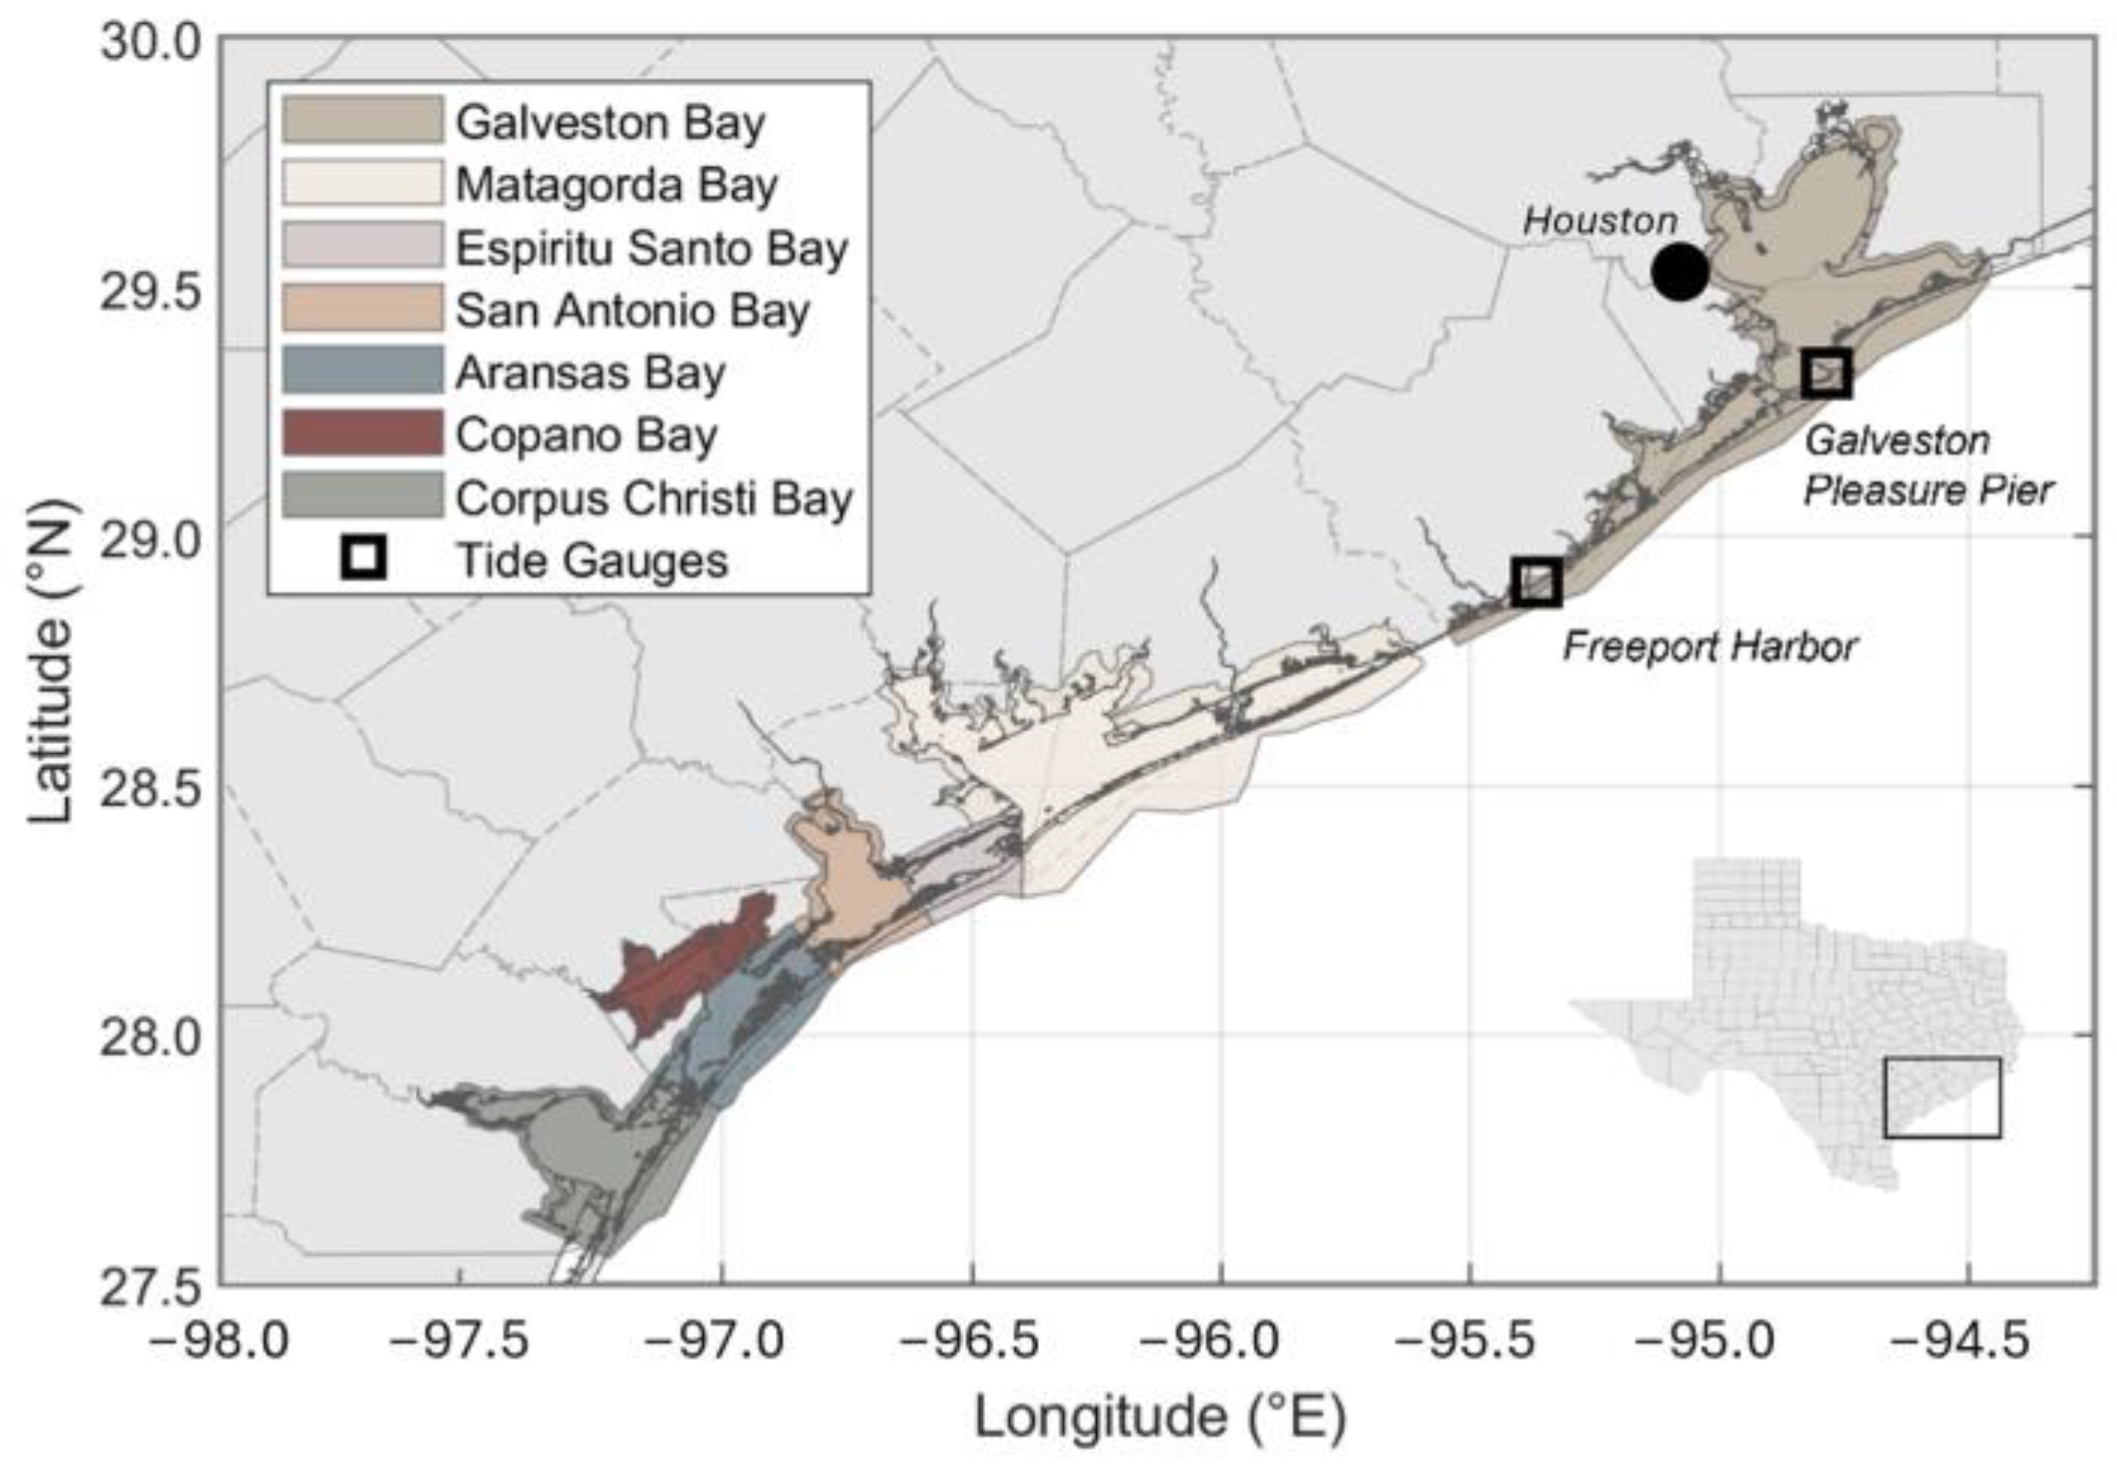
This study focuses on salt marshes along the Texas coast (Figure 1). The Texas coast is characterized by large bay complexes protected by barrier islands [28], with diurnal tides with an amplitude ranging from 0.37 to 0.52 m [29]. The study region has a subtropical climate, which is characterized by mild winters and hot, humid summers with year-round rainfall, peaking in the late spring and early fall [20]. The local tides and rain-induced flooding are occasionally exacerbated by tidal forcing from seasonal shifts in the wind direction and summer tropical storms that can lead to prolonged periods of waterlogging or exposed conditions [30,31,32,33]. Typical vegetation communities in low marshes include Spartina alterniflora with some Salicornia virginica and Batis maritima, high marshes include Spartina patens, with some Juncus roemerianus and Baccharis halimifolia, and the upland typically includes Axonopus affinis and Paspalum spp. with individual stands of Tamarix gallica and Sapium sebiferum as well as a few other grasses [20].
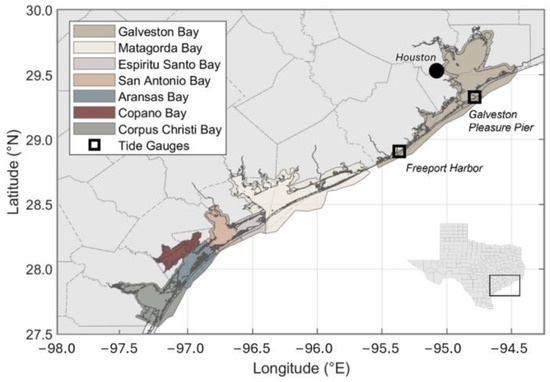
Figure 1.
Study area map of the Texas coast. Map shows the mapping extent, the location of the major estuaries, and the tide gauge stations displayed in Figure 2.
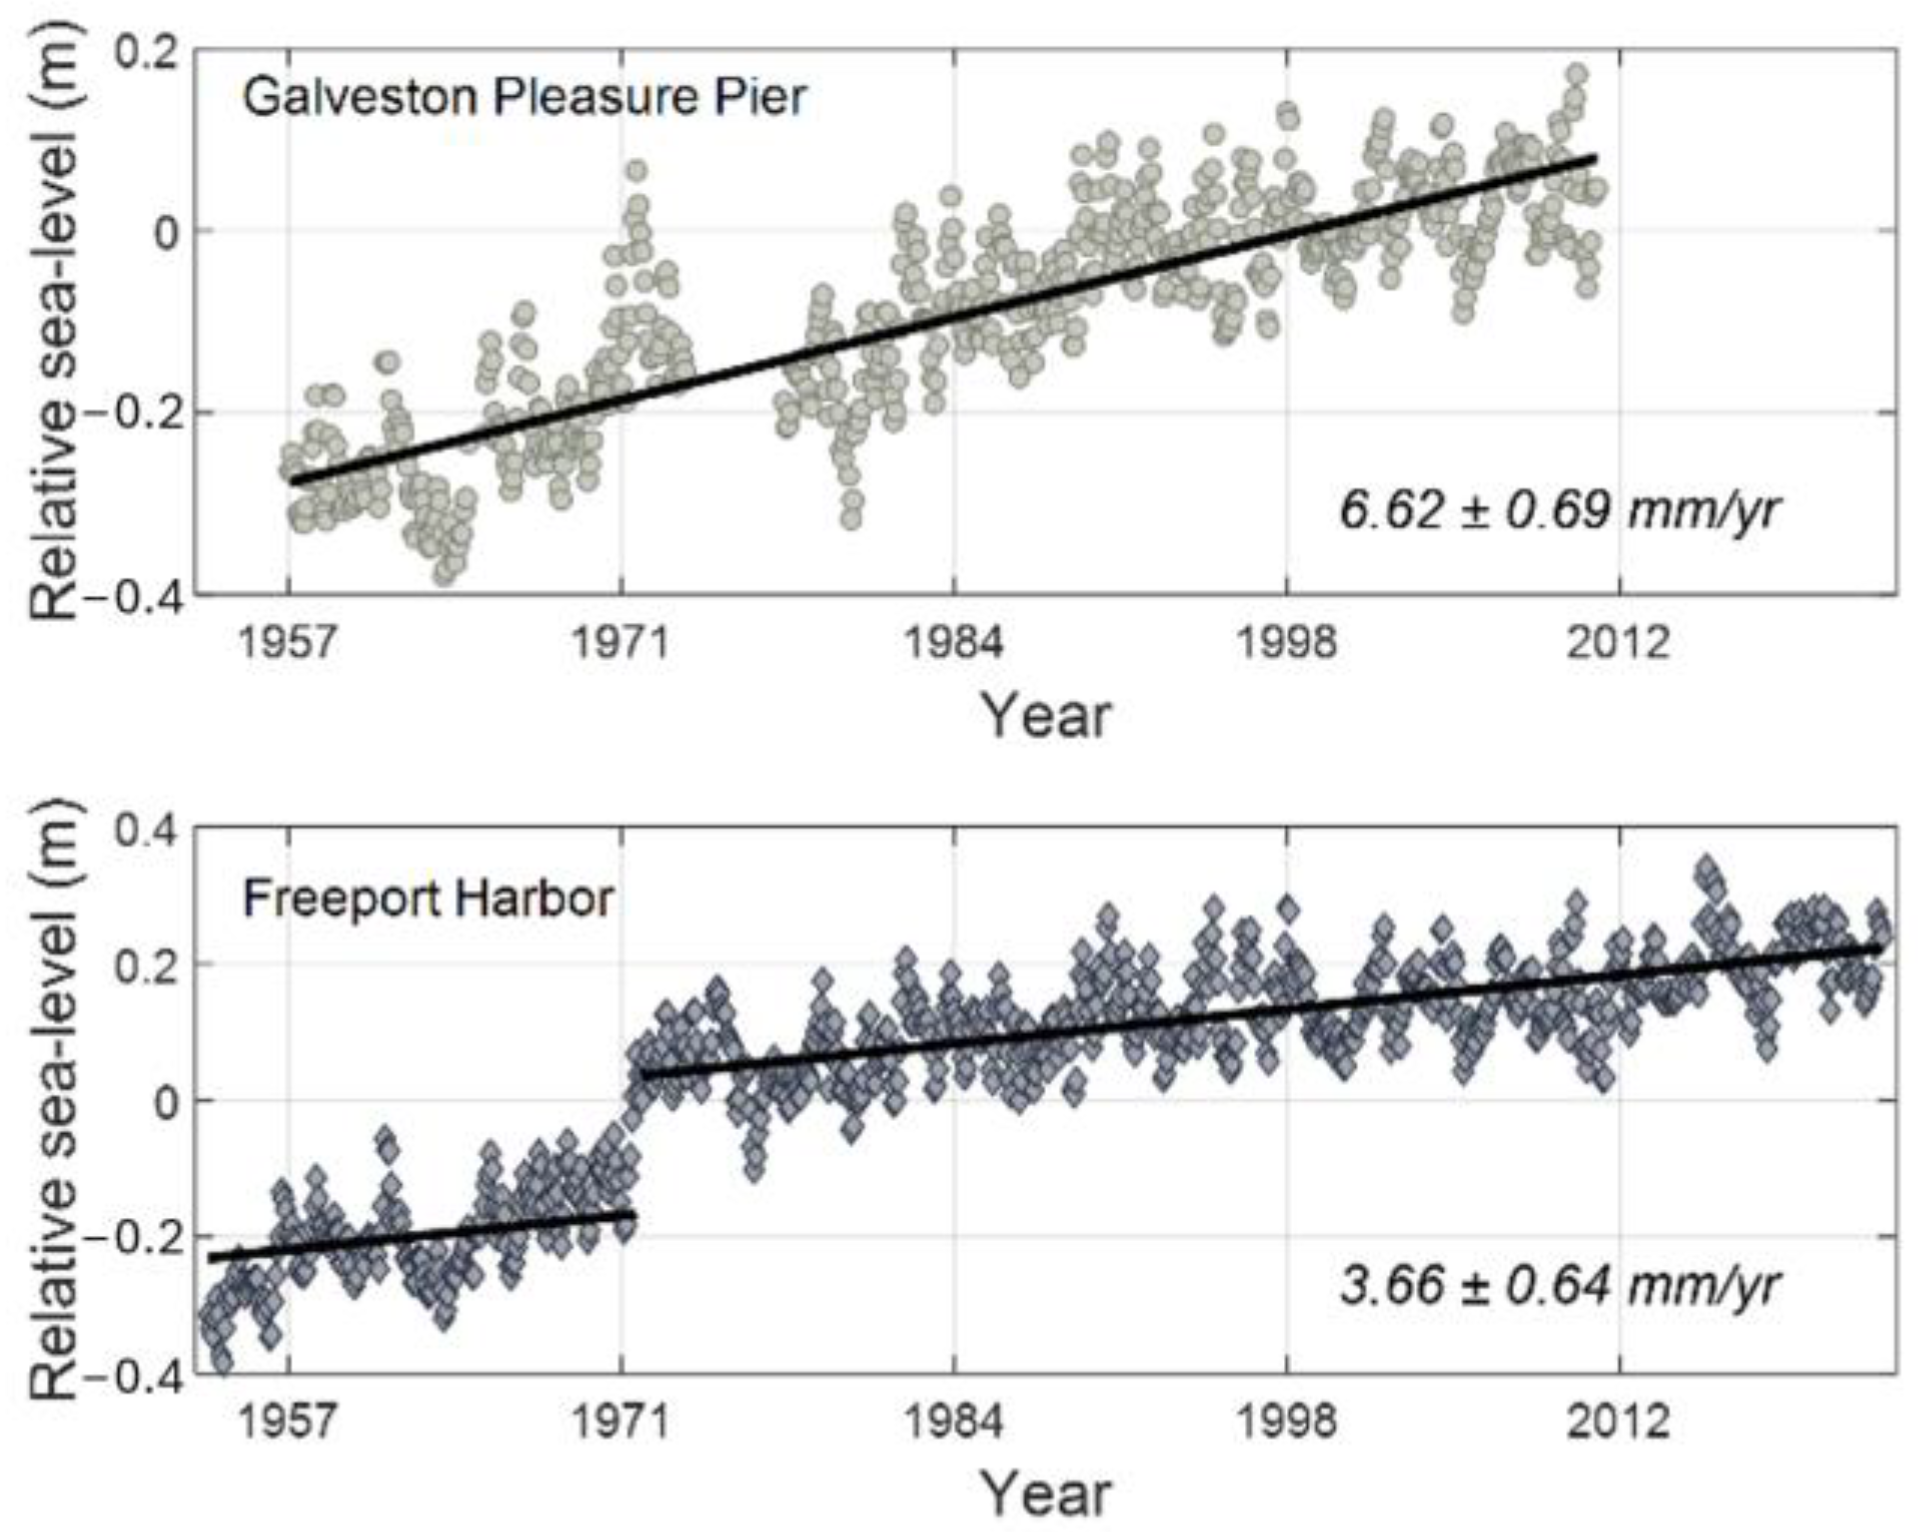
Relative sea-level rise rates along the studied portions of the Texas coast range between 3.66 ± 0.64 to 6.62 ± 0.69 mm year−1 (Figure 2) (http://tidesandcurrents.noaa.gov/sltrends/sltrends.html, accessed on 1 November 2023). Subsidence rates at the Galveston Pleasure Pier tide gauge (Figure 1) increased from 3.53 mm year−1 between 1909 and 1937 to 6.08 mm year−1 between 1937 and 1983 and decreased to 3.51 mm year−1 since 1983 [34]. Rates of relative sea-level rise in this region are particularly high due to enhanced land subsidence resulting from excessive groundwater withdrawal [4], which accounts for nearly 85% of the 0.7 m increase in relative sea level since the early 20th century [34]. As a response, coastal salt marshes are transgressing along the seaward edge in the form of marsh erosion and along the landward boundary in the form of upland migration [7,8,15,19].

Figure 2.
Relative sea-level trends. Trends are shown for Galveston Pleasure Pier and Freeport Harbor and were downloaded from the NOAA (http://tidesandcurrents.noaa.gov/sltrends/sltrends.html, accessed on 1 November 2023). The sudden switch in the vertical location of the relative sea-level trend at Freeport Harbor results from a datum shift. The difference between the two sites is likely due to enhanced land subsidence resulting from extensive groundwater extraction and expanding population within the Houston region [4].
2.2. Historical Mapping
To assess historical changes in marshlands and the associated ecosystem services along the Texas coastline, we compared historical topographic records from the 19th century and recent aerial imagery. Here, we located a total of 53 historical maps with a scale of 1:20,000 (“T-sheets”), which were created between 1850 and 1882 and contain information about various land types, such as marshes, farmland, and forests across the Texas coast and its estuaries (https://shoreline.noaa.gov/data/datasheets/t-sheets.html, accessed on 10 September 2022) [8]. However, a total of 21 T-sheets were excluded due to unclear symbology and representation of adjacent upland areas [8]. The T-sheets themselves were originally created by the US Coast and Geodetic Survey based on topographic surveys of the coastline, which relied on plane tables and a now obsolete but distortion-free polyconic projection and local datum [7,8,35]. Previous work estimated an accuracy of 19th/20th century T-sheets of 2.5–5.0 m with an error of less than 10 m [36]. T-sheets were previously georeferenced by the NOAA, and the average root mean square error of the remaining 32 maps was 0.49 m along the x-direction and 1.73 m along the y-direction (https://shoreline.noaa.gov/data/datasheets/t-sheets.html, accessed on 10 September 2022), which is less than that previously reported for similar mapping efforts [7,8,19]. The remaining maps were most abundant along the northern portion of the Texas coast and covered the majority of estuaries (Figure 1).
We compared the historic marsh extent to the modern marsh extent provided by the National Wetland Inventory (NWI), which includes information on the condition, attributes, and roles of low-lying coastal habitats (https://www.fws.gov/program/national-wetlands-inventory/download-state-wetlands-data, accessed on 12 April 2023). Previous work raised concerns about quality of the dataset, with a 15% error in wetland vegetation classification for the state of Massachusetts [37]. As the NWI dataset is largely based on aerial imagery, its accuracy is limited by the scale, quality, and timing of the photographs [38]. However, more recently, the NWI program created a procedure to improve their digital wetlands database in an effort to better characterize wetlands [39,40]. We therefore chose the NWI database, as it follows strict standards for wetland classification and mapping developed by both federal and non-government organizations and is updated twice a year so that it represents the most up-to-date and well-maintained data source for wetland layers. Here, we included wetlands, defined as estuarine intertidal emergent wetlands (E2EM), to represent our modern marsh extent. Modern tidal marshes were digitized at a similar resolution (1:24,000) as the 19th century marshes. To ensure consistency between the two datasets, we were careful to confine the extent of the modern marsh to match that defined by the T-sheets and therefore excluded marshlands and uplands that extended beyond the upland boundaries indicated on the T-sheets so that any observed changes in marsh area were not influenced by variations in mapping extent.
We calculated rates of marsh migration as the ratio of marsh area gained relative to the length of the marsh–upland boundary derived from modern aerial images and the rates of marsh erosion as the ratio of marsh area lost relative to the length of the seaward edge derived from historical T-sheets [8]. Here, the length of the upland and seaward boundary was based on our historical (for marsh erosion) and modern (for marsh migration) marsh extent and was therefore measured at a comparable resolution. We then summarized rates of marsh change across the watersheds associated with the major embayments along the Texas coastline (Figure 1).
We estimated the topography and degree of upland development within a 100 m buffer of the modern-day marsh. We calculated the upland slope based on 2018 DEMs with a scale of 1 × 1 m (https://data.tnris.org/, accessed on 2 June 2023). For each pixel, we obtained elevation and distance from the marsh edge and applied basic linear regression to compute an average upland slope for each T-sheet. We then estimated the degree of human development and therefore potential limitations to marsh migration based on the National Land Cover Database (NLCD) 2019 (https://www.mrlc.gov/data/nlcd-2019-land-cover-conus, accessed on 2 June 2023). The NLCD land cover map discerns between “developed high intensity, developed medium intensity, developed low intensity, and developed open space” [41], and we assumed that the degree of urban and agricultural extent closely resembles the effects of human barriers to marsh migration, such as bulkheads, roads, and revetments. Here, we identified uplands occupied by agricultural or urban areas as highly developed and estimated the proportion of agricultural and urbanized land relative to the area of the adjacent upland by dividing the number of pixels identified as urban and agriculture by the total number of pixels included within the 100 m buffer. We then used the Pearson correlation coefficient to compare rates of marsh migration to upland topography and the extent of urbanized and agricultural land for each analyzed T-sheet.
To determine changes in ecosystem services, we distinguished between high and low marsh based on the dominant vegetation type. Typical vegetation communities in low marshes include Spartina alterniflora with some Salicornia virginica and Batis maritima, and high marshes include Spartina patens, with some Juncus roemerianus and Baccharis halimifolia [20]. Because the upper growth limit of Spartina alterniflora tends not to exceed 0.5 m along the Gulf coast [42], we defined low marsh as salt marshes within elevation ranges of less than 0.5 m and high marshes as salt marshes within elevation ranges larger than 0.5 m. We overlaid areas of marsh migration and marsh erosion with high-resolution LiDAR data (1 × 1 m resolution (https://data.tnris.org/, accessed on 2 June 2023)) and measured the amount of marsh erosion and migration for each elevation zone. We note that the LiDAR dataset does not capture elevations of less than 0 m so that ecosystem services for marsh change within this elevation zone (in particular, marsh erosion) may not be estimated. Because lower elevation portions of marshes tend to be flooded more frequently as the sea level rises [15], we assumed portions of marsh loss that were not identified as either low or high marsh to likely present low marsh conditions. We then calculated ecosystem service values for each marsh change scenario. Ecosystem services were previously estimated for the Galveston area on a per hectare per year basis and can be divided into five services: “recreation (i.e., hunting and bird watching tourism values), carbon sequestration, storm protection, fisheries support, and market-based property appraisal values” (Table 1) [20]. The property value was calculated based on two different tax appraisal rates (i.e., 6% [43,44] and 3% [45]). Because the Texas coast contains some of the most productive estuaries in the United States with regard to fisheries and migratory birds, these ecosystem service values are generally higher than those mentioned in other work [20,46,47]. Changes in ecosystem services were then calculated by summing each service. We note that our ecosystem service calculations are based on previous economic values for Galveston Island [20] and were extrapolated for the entire northern portion of the Texas coast. We caution that these calculations have not been validated locally and may contain significant errors. Unfortunately, as of this writing, we are unaware of any other ecosystem service estimates along the Texas coast apart from the one on Galveston Island. Our estimates therefore do not account for small changes in specific and localized components of individual ecosystems [48] and are mainly used to emphasize the importance of local salt marshes for the general public.

Table 1.
Economic value of ecosystem services for high and low marsh for Galveston Island. All values are per hectare per year and adjusted to 2006 USD (i.e., $/ha/year). Property values indicated by parentheses are calculated at a tax appraisal rate of 6% [43,44], as opposed to 3% [45]. Table modified from [20].
3. Results
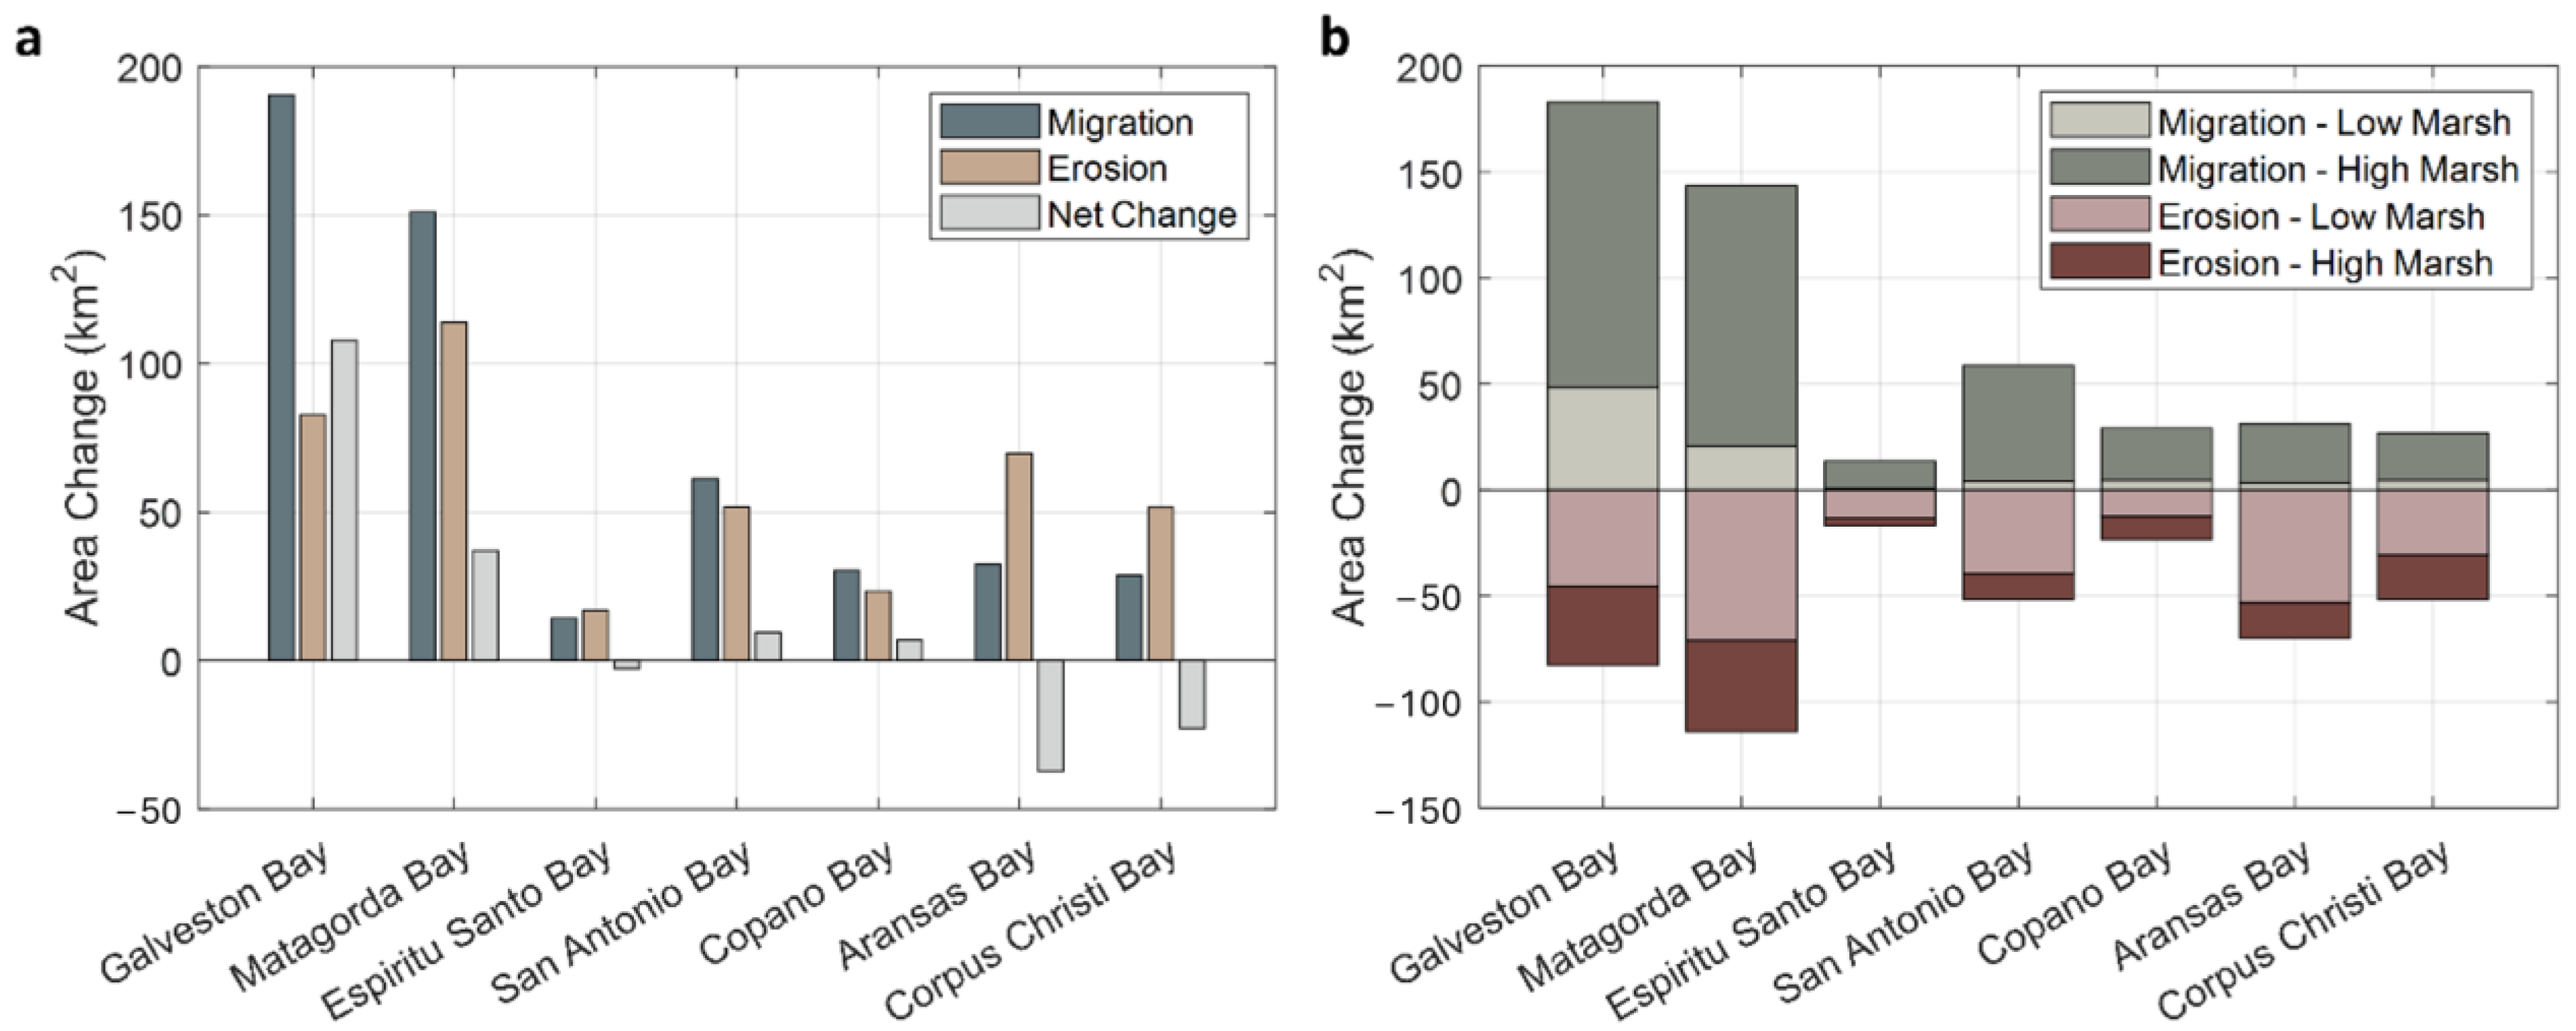
Texas salt marshes increased in extent from 701.8 km2 in the 1850s to 800.5 km2 in 2019, a net increase of 98.7 km2 or 14.1%. Approximately 508.6 km2 of salt marshes were created due to upland drowning, while approximately 409.9 km2 of salt marshes were lost, presumably due to edge erosion or ponding. Marsh migration largely outpaced edge erosion in Galveston, Matagorda, San Antonio, and Copano Bays, whereas marsh loss exceeded gain in Espiritu Santo, Aransas, and Corpus Christi Bays (Figure 3a).
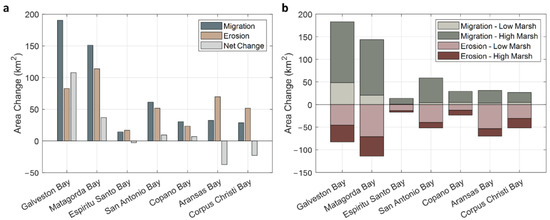
Figure 3.
Marsh areal change along the Texas coast. (a) Marsh gain (blue), marsh loss (brown), and net change (gray) (gain minus loss) for each embayment along the Texas coast. (b) Marsh gain and loss of high and low marsh for each embayment. Green colors show marsh gain, and red colors show marsh loss.
Net change varied largely between individual T-sheets and across the Texas coast (Figure 3a). Here, a maximum marsh gain of 377.6% was recorded for West Galveston Bay, whereas a maximum marsh loss of 67.6% was recorded for Corpus Christi Bay. A total of 16 out of 32 T-sheets showed a net gain of more than 10%, 9 showed a net loss of more than 10%, and 7 showed a net gain or loss of less than 10%. On average, Texas salt marshes expanded at a rate of 1.28 ± 1.14 m year−1, and decreased in area at a rate of 1.29 ± 0.59 m year−1. The highest migration rates of 6.14 m year−1 were recorded along the shores of Laguna Madre, and the highest erosion rates of 2.81 m year−1 were recorded in Galveston Bay.
Approximately 21% of marsh loss occurred in low marshes, 35% of marsh loss occurred in high marshes, and approximately 44% of marsh loss could not be identified as either low or high marsh (Figure 3b, Table 2). Because lower-elevation portions of marshes are prone to more frequent flooding as the sea level continues to rise [15], the remaining unidentified portion of marsh loss (i.e., 44%) is likely to represent low marsh conditions because many of the regions previously occupied by marshes are now submerged. Approximately 17% of marsh gain occurred in low marshes, 79% of marsh gain occurred in high marshes, and only 4% of marsh gain could not be identified as either low or high marsh. We therefore excluded the remaining 4% of unidentified marsh gain from our ecosystem service calculations (Table 2). Overall, approximately 266.5 km2 of low marshes and 143.4 km2 of high marshes were lost throughout the last century, whereas 86.3 km2 of low marshes and 399.2 km2 of high marshes were gained during the same time.
Table 2.
Changes in extent of marshes identified as low and high marsh and associated economic value of ecosystem services along the Texas coast. Values indicated by parentheses include property values calculated at a tax appraisal rate of 6% [43,44] as opposed to 3% [45]. Changes in ecosystem services were calculated in 2006 USD. We note that approximately 4% of marsh gain could not be identified as either low or high marsh, so “total marsh gain” (485.5 km2) is less than “marsh gain” mentioned in the main text (508.6 km2). We caution that our ecosystem service calculations are based on previous economic values for Galveston Island [20] and were extrapolated for the entire northern portion of the Texas coast. Our estimates therefore do not account for small changes in specific and localized components of individual ecosystems [48]. We caution that these calculations have not been validated locally and may contain significant errors.
Over the last century, Texas salt marshes have lost USD 1.4 × 10¹² (3%) or USD 1.7 × 10¹² (6%) in ecosystem services (Table 2). Here, migration of low marshes accounted for approximately USD 6.7 × 10¹¹ (3%) or USD 8.6 × 10¹¹ (6%), whereas high marshes accounted for approximately USD 5.0 × 10¹⁰ (3%) or USD 1.2 × 10¹¹ (6%). On the other hand, erosion of low marshes resulted in the loss of ecosystem services of approximately USD 2.1 × 10¹² (3%) or USD 2.7 × 10¹² (6%), whereas erosion of high marshes resulted in the loss of ecosystem services of approximately USD 1.8 × 10¹⁰ (3%) or USD 4.2 × 10¹⁰ (6%).
Marsh migration rates were significantly correlated with upland slope (r = −0.74; p << 0.05) (Figure 4). The average slope was 0.011 ± 0.008 and ranged between 0.003 and 0.045. The steepest slope was observed along the shores of Nueces Bay, and the gentlest slope was observed along West Galveston Bay.
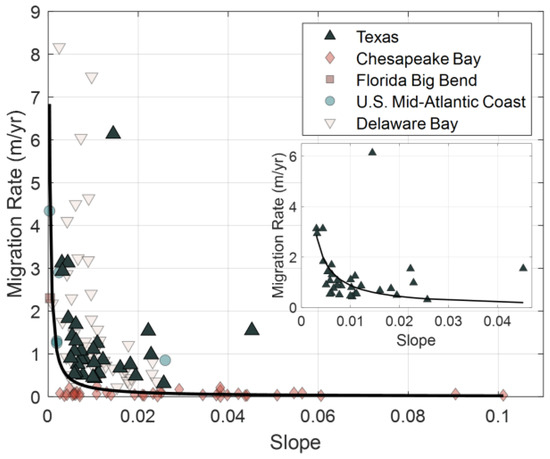
Figure 4.
Comparisons between marsh migration rates and the slope of the adjacent upland. Each marker represents one T-sheet. Upland slope was based on high-resolution LiDAR within a 100 m buffer surrounding the present-day marsh. Marsh migration rates are significantly correlated with upland slope (y = 0.002/x; r = −0.74; p << 0.05). Migration rates for the Chesapeake Bay are based on [8], those for the Florida Big Bend are based on [7], those for the US Mid-Atlantic Coast are based on [19], and those for the Delaware Bay are based on [49].
On average, uplands adjacent to the present-day marsh extent consisted of 27.5% urban, 15.9% agriculture, 6.7% forest, and 49.9% barren land/grassland. The fraction of urbanized and agricultural land for each T-sheet varied between 1.2% and 79.0%. There was no significant correlation between the rate of upland migration and the degree of urbanization (r = −0.005; p >> 0.1).
4. Discussion
4.1. Texas Marsh Health
Although the location of Texas salt marshes changed rapidly throughout the past century, our study mainly focused on changes in the overall marsh extent rather than overall marsh health or vegetation distribution. Previous work identified salt marshes across a portion of the Chesapeake Bay to be rapidly submerging and eroding primarily through pond expansion [50]. Similarly, ponds and lakes started forming along a portion of the coast between the Gulf Intracoastal Waterway and the San Bernard River as a result of the foundering deltaic plain and are growing in size and number [51,52]. Pond formation and expansion are further exacerbated by surface fault activity and nearby hydrocarbon production in this region [53]. Here, increased land subsidence on the downthrown sides of faults leads to increased submergence and therefore a shift in the type of marsh vegetation (e.g., Spartina patens to Spartina alterniflora) or a gradual conversion of marsh plants to open water [53]. For example, artificially induced fault movement led to the loss of approximately 10,700 hectares of marshland in southeastern Texas since the 1930s [54]. Locally, however, increasingly wetter conditions along faults may also lead to marsh migration into uplands previously mapped as prairie grasses [53]. Nevertheless, it is entirely possible that while marsh erosion has been offset by the formation of new marshland along other portions of the Texas coast during the last century, Texas salt marshes are being increasingly dissected by small tidal creeks and ponds. This is underscored by our findings that despite the increase in marsh area, salt marshes suffered a substantial loss in ecosystem services (USD 1.4 (3%)–1.7 (6%) trillion), suggesting that changes in marsh area do not adequately reflect marsh health or the quality of crucial ecosystem services.
4.2. Texas Marsh Migration and Erosion
Rates of marsh loss (1.29 m year−1) and gain (1.28 m year−1) estimated across the Texas coast lie within the range of previously observed marsh change rates (0.2–3.2 m year−1 [7,8,19,55,56,57,58,59]. Our rates are likely faster than erosion rates along other portions of the United States because Texas salt marshes are generally located along the estuary edge and major tributaries, whereas previous work commonly includes marshes located along small tidal creeks with limited fetches and therefore edge erosion. Observations along the western part of Galveston Bay suggest that the large sediment deficit (i.e., the low sediment accretion rate (~0.20 cm year−1) relative to the local rate of relative sea level rise (~0.65 cm year−1)) is likely to be the main reason for marsh erosion in this region, where recent dam constructions along the Trinity and Mississippi Rivers significantly decreased sediment supply to Galveston Bay by 50–75% [60].
Upland migration rates commonly range from approximately 0.26 to 8.2 m year−1 (Figure 4) [7,8,19,49,61]. The fastest migration rates were measured across the Chesapeake Bay (3.5–6.8 m year−1 [61]; 1.9–3.3 m year−1 [19]) and North Carolina (1.7–4.6 m year−1 [19]) and are based on individual transects. The same work further mapped spatially averaged rates for the same region (0.9–4.3 m year−1 [19]) to account for changes in upland topography and localized disturbance events (e.g., fire, insect invasion, storms, etc.), but focused on regions well known for rapid transgression, whereas we included regions with significant anthropogenic barriers (e.g., the Houston area). Texas marsh migration rates were lower than migration rates along the Florida Big Bend coast [7] owing to Florida’s gentle upland topography (m = 0.0004). On the other hand, Texas marsh migration rates exceeded migration rates in the Chesapeake Bay region (0.49 m year−1 [8]) because Chesapeake marshes are predominantly located adjacent to coastal forests, where forest retreat substantially lags behind relative sea-level rise, and a disturbance event is necessary to facilitate the mortality of adult trees [19].
4.3. Marsh Resilience across the United States
Our findings that Texas tidal salt marshes have historically increased in size (Figure 3) provides further proof that sea-level rise may in fact enhance marsh migration (Figure 5) [7,8,19], despite previous findings that identified marsh drowning as an inevitable consequence of sea-level rise [9,12,62,63,64,65]. Ghost forests, deserted agricultural land, and signs of upland flooding are most commonly observed along the southeastern and mid-Atlantic coast of the United States, where large, systematic flood control structures are scarce [66]. For example, mapping efforts along Chesapeake Bay found that sea-level rise has created approximately 100,000 acres of new marshland through upland drowning and compensated for historical marsh loss throughout the last century [8]. Similar work along the Florida Gulf Coast suggests that marsh migration into retreating forests along this sediment-limited coast significantly outpaced shoreline loss, resulting in a net increase of 23% of intertidal area [7]. Previous work estimated approximately 26,000 km2 of coastal salt marshes across the conterminous United States [67] and the area potentially inundated by a sea-level rise of 1.2 m to be similar to the current salt marsh extent (~12,000–49,000 km2) [68]. In fact, modeling efforts suggest that a moderate rise in sea level may even increase the total salt marsh area along undeveloped gently sloping uplands [15,20].

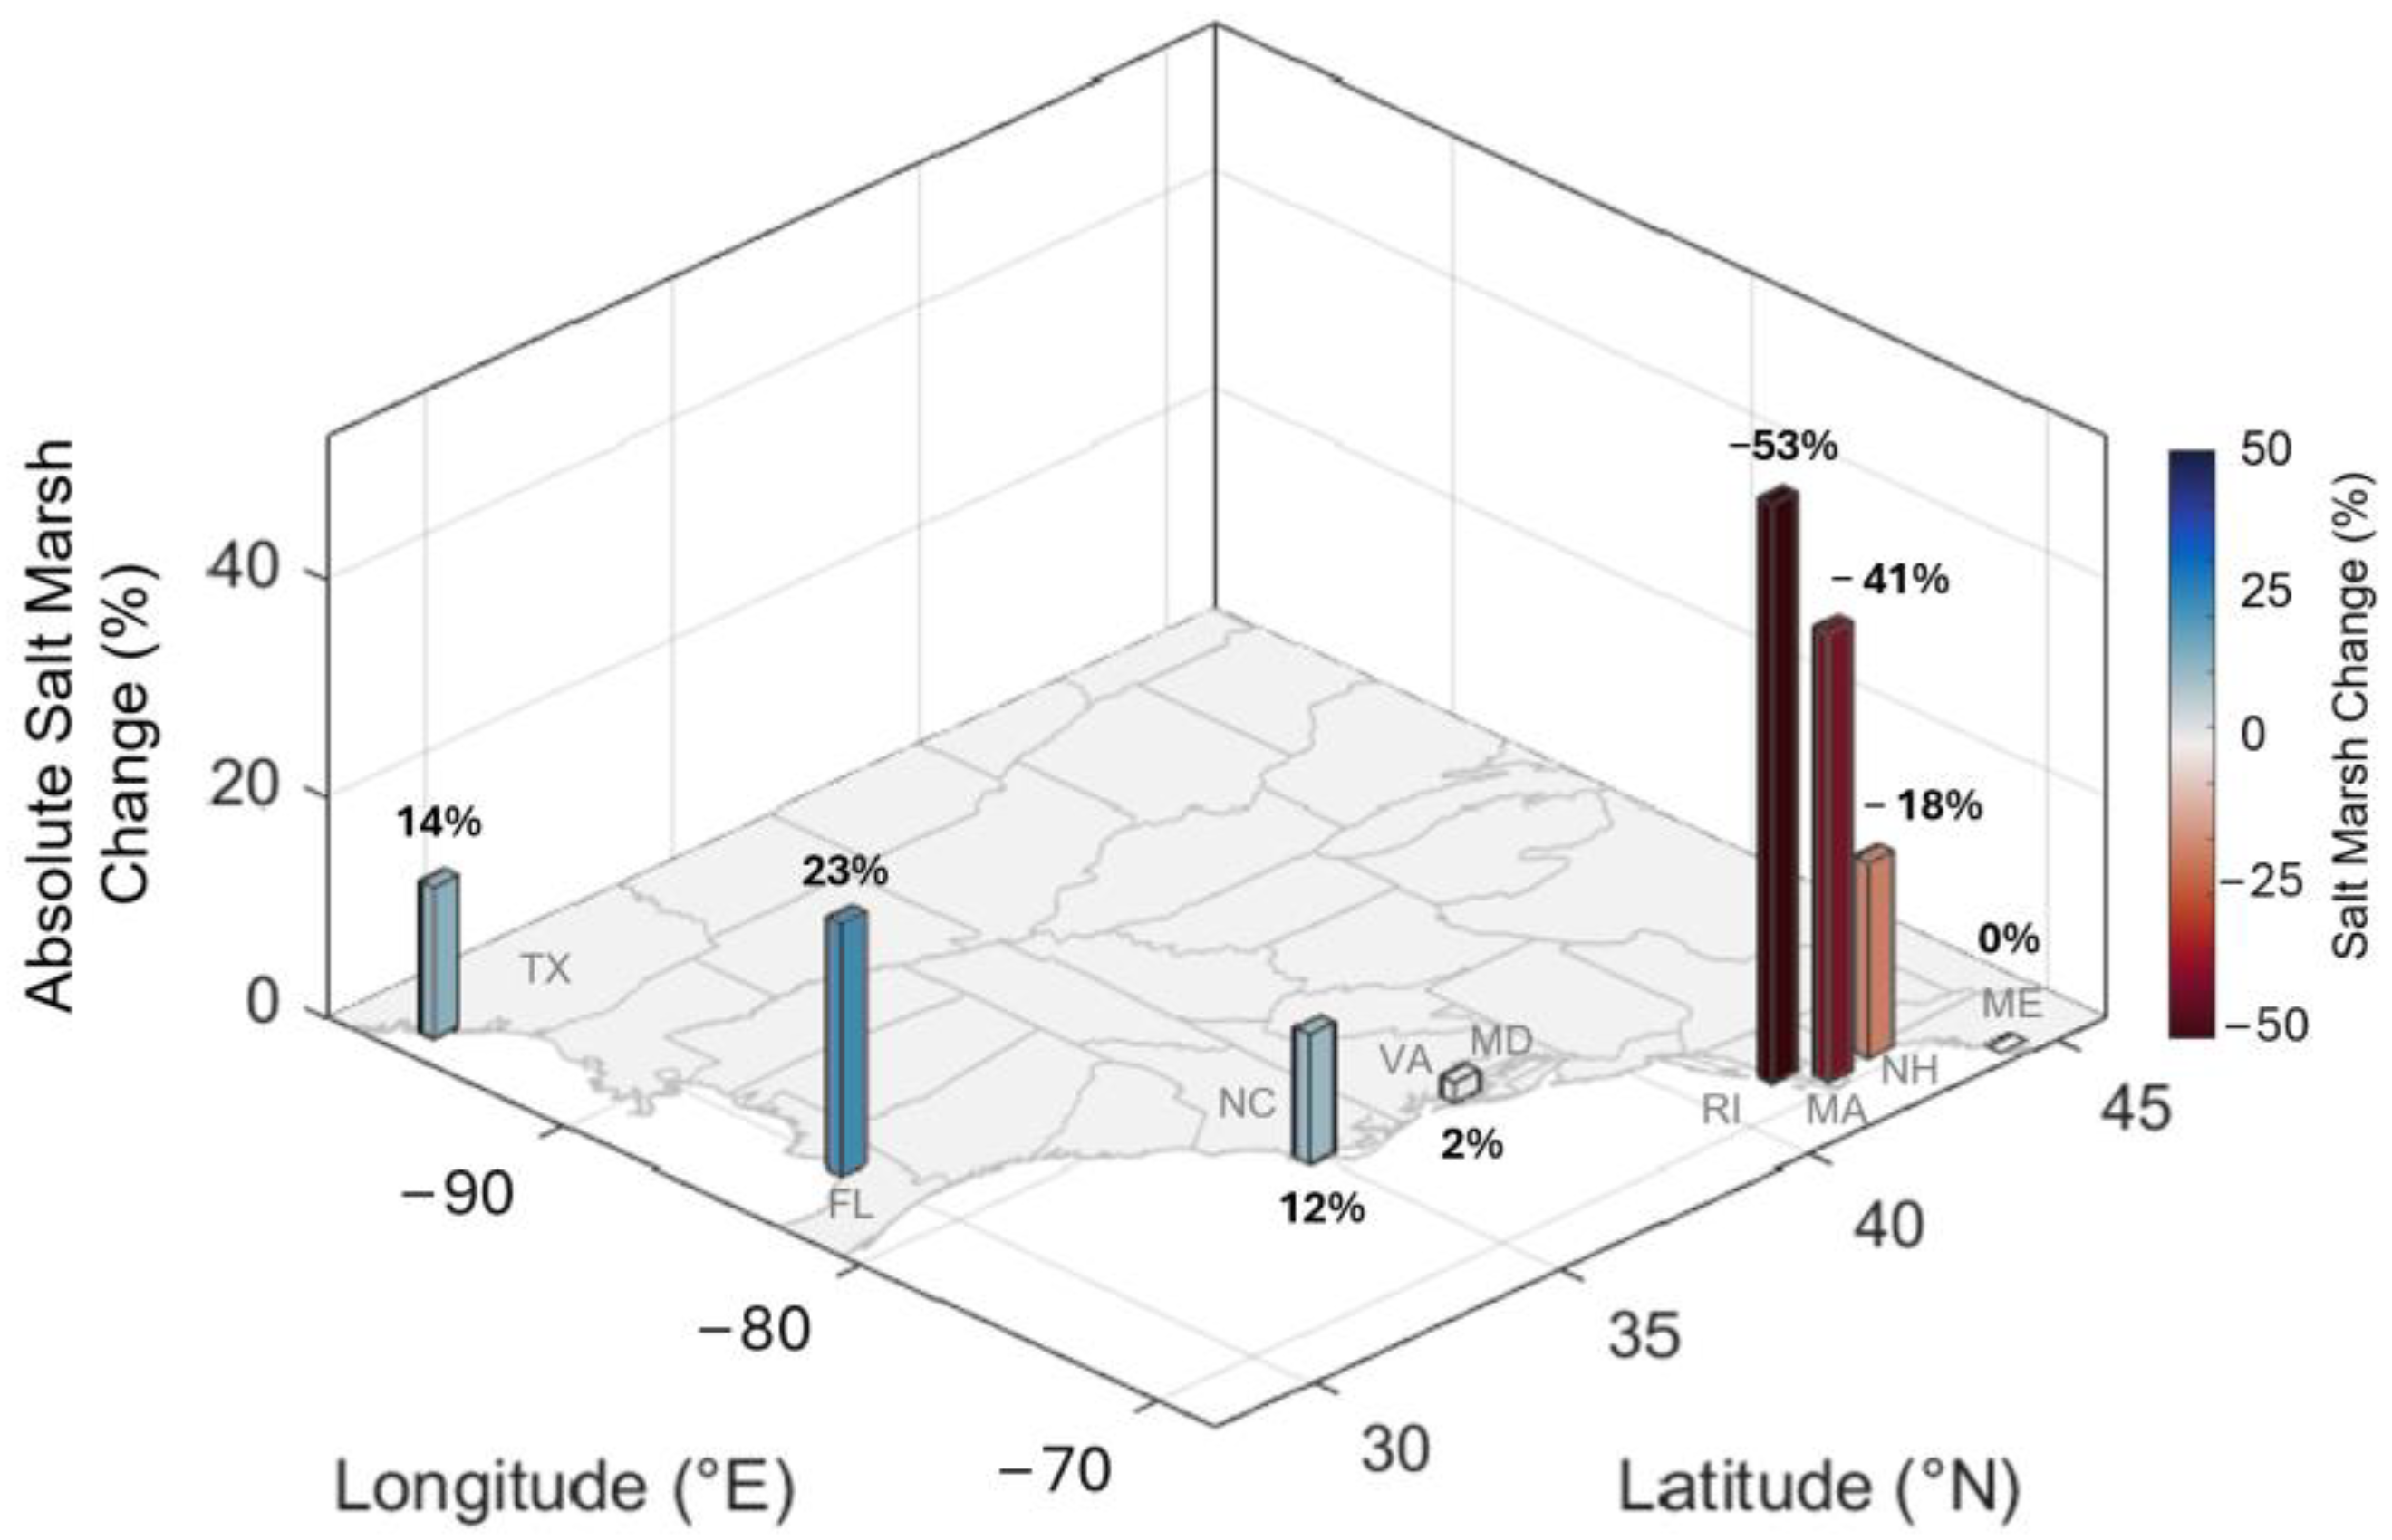
Figure 5.
Map showing marsh area change along the United States Atlantic and Gulf coasts. Heights of bars show the magnitude of salt marsh change (%), and colors show the direction of salt marsh change (i.e., gain or loss) (%). Florida salt marsh change is based on [7], North Carolina salt marsh change is based on [19], Chesapeake Bay (VA + MD) salt marsh change is based on [8], and Rhode Island, Massachusetts, New Hampshire, and Maine salt marsh changes are based on [69].
While salt marshes along the Texas Coast, Florida Gulf Coast, and Chesapeake Bay were able to maintain or even increase in extent throughout the past century, salt marsh landscapes in New England and along the United States Pacific coast may experience a different fate (Figure 5) as rates of upland migration are significantly lower along the United States Pacific and New England coastlines (<10 cm year−1) [70,71] compared to those observed across mid-Atlantic coastal lowlands (~7 m year−1) [8,49,61]. Here, coastal development and steep topographic slopes may prevent upland to wetland conversion. For example, urban growth around the Boston area has resulted in the loss of 81% of its salt marshes, and Rhode Island and Massachusetts have lost a significant portion of tidal wetlands, amounting to a massive 53% and 41% since the late 1700s and early 1800s, respectively [69]. Within California, 90% of local marshes have been significantly influenced by farming, infrastructure, and urbanization [72]. Field observations across a Central California estuary showed that steep slopes further inhibit marsh migration in this region such that local marshes mainly comprise narrow fringe marshes located along the steeply sloping uplands [70]. Salt marshes throughout the entire United States Pacific region are particularly vulnerable to end-of-century submergence, where approximately 85% of valuable marshland has been converted to open water since European settlement [73]. Additionally, predictions of future marsh extent suggest a substantial wetland loss in Washington (68%) and a complete wetland loss in California and Oregon (100%) by 2110 [74]. Here, only two out of the analyzed fourteen estuaries had sufficient space available for marshes to migrate into adjacent uplands and potential for an almost equal replacement ratio, whereas marsh migration at the remaining sites was obstructed by coastal development and/or steep slopes [74]. Low vertical marsh accretion rates and limited upland accommodation space further raise concerns over the survival of tidal salt marshes under projected rates of sea-level rise in this region.
4.4. Implications for Ecosystem Functions and Resilience Management
Tidal salt marshes are considered one of the most valuable and fragile ecosystems worldwide and offer crucial ecosystem services in the form of carbon sequestration, fisheries, property and recreational values, and protection from storm surges [1]. For this section, we caution that our ecosystem service calculations are based on previous economic values for Galveston Island [20] and were extrapolated for the entire northern portion of the Texas coast. Our estimates therefore do not account for small changes in specific and localized components of individual ecosystems [48].
Along the United States Atlantic and South coastlines alone, salt marshes have previously been shown to mitigate USD ~23.2 billion year−1 of damage caused by storm surges and rising sea level [75]. Although salt marshes along the Texas coast increased overall, we observed a shift in ecosystem functions with a gain in high marsh vegetation communities (~79% of marsh migration) and potentially a substantial loss in low marsh community zones (~65% of marsh erosion) (Figure 3, Table 2). The transition to a predominantly high marsh vegetation type resulted in the loss of important storm protection and fisheries habitat while increasing ecosystem service gains from birding or hunting recreation and property values (Table 1). Previous work suggests that carbon sequestration rates of Spartina alterniflora-dominated low marshes (60,240 C/ha/year) and Spartina patens-dominated high marshes (57,020 C/ha/year) are nearly identical [76], so carbon sequestration values are similar for both community zones (Table 1). Because tidal salt marshes exhibit higher rates of carbon sequestration and storage per unit area compared to their terrestrial counterparts [68], historical marsh migration into adjacent uplands potentially led to the increase in total carbon sequestration along the Texas coast, assuming that marsh migration is not outpaced by marsh edge erosion [65]. Although gains in wetland area offset (or even increased) the overall marsh extent along the Texas coast, coastal ecosystems experienced a tremendous loss in ecosystem services of more than USD 1 trillion, highlighting possible limitations of marsh ecosystem services and their ability to protect from storm-induced damage. The high economic value of low marsh communities can mostly be attributed to the provision of fisheries services and protection from storm surges (USD 11,748.9 ha/year) (Table 1). However, this value drastically decreases by an order of magnitude for high marsh zones (USD 1174.9 ha/year), where the high economic value is mostly provided by the recreation value. With hurricane storm surge risk predicted to increase along the United States Gulf coast by 25–47% [77] and a potential loss of wetland ecosystem services of USD 40 million annually by 2100 [6], our results emphasize the need to protect coastal infrastructure and natural ecosystems from sea-level rise.
Despite the imminent threat of sea-level rise, our results emphasize the intense spatial variability of possibilities and impediments to marsh resilience along the Texas coast. Previous work suggests that current and future anthropogenic barriers along the Gulf Coast are relatively small compared to the area of land available for marsh migration (~20%), so the total amount of land created by potential marsh migration will be large, regardless of artificial barriers [66]. An increasing number of regions are now considering incorporating nature-based engineering approaches such as “managed retreat” or migration corridors [21,78], especially because they are considered to be largely self-sustaining and cost-efficient such that deltas are less likely to suffer from rising energy costs [79,80]. For example, ecosystem-based engineering initiatives in the Mississippi Delta aim to redirect sediment-rich river water back to the delta plain in order to create or preserve over 500,000 ha of salt marshes, effectively reducing flood-related damages to New Orleans and the coastal regions of Louisiana by USD 5.3–18 billion within the next 50 years [80,81,82,83]. Other work recommends the use of dredged sediments to create and restore wetlands by increasing wetland elevation either to keep pace with sea-level rise or to aid wetlands to recover from storms quickly [82]. Because restoring lost marshland through marsh terracing, mound construction, or marsh island construction is expensive (e.g., USD 5310–40,608/ha) for different construction sites in Galveston Bay) and original ecosystem functions may not return until years or decades later [84], future restoration efforts should focus on preserving existing wetlands and promoting land conversion through wetland migration corridors in order to maintain the quality of important ecosystem functions.
Author Contributions
Conceptualization, N.W.J.; methodology, N.W.J.; validation, N.W.J.; formal analysis, T.A.D., Y.J. and N.W.J.; investigation, T.A.D., Y.J. and N.W.J.; resources, T.A.D., Y.J. and N.W.J.; data curation, T.A.D., Y.J. and N.W.J.; writing—original draft preparation, N.W.J.; writing—review and editing, N.W.J. and T.M.D.; visualization, N.W.J. and Y.J.; supervision, T.M.D.; project administration, T.M.D. All authors have read and agreed to the published version of the manuscript.
Funding
This work was partially funded by the Texas A&M University at Galveston Campus Blue Economy Postdoctoral Fellowship program.
Data Availability Statement
Historical maps of the United States can be obtained from https://shoreline.noaa.gov/data/datasheets/t-sheets.html, accessed on 10 September 2022. The National Wetlands Inventory (NWI) dataset can be downloaded from https://www.fws.gov/program/national-wetlands-inventory/download-state-wetlands-data, accessed on 12 April 2023. The land cover maps can be downloaded from https://www.mrlc.gov/data/nlcd-2019-land-cover-conus, accessed on 2 June 2023. The high-resolution dataset can be found at https://data.tnris.org/, accessed on 2 June 2023.
Conflicts of Interest
The authors declare no conflicts of interest.
References
- Barbier, E.B.; Hacker, S.D.; Kennedy, C.; Koch, E.W.; Stier, A.C.; Silliman, B.R. The value of estuarine and coastal ecosystem services. Ecol. Monogr. 2011, 81, 169–193. [Google Scholar] [CrossRef]
- Church, J.A.; Clark, P.U.; Cazenave, A.; Gregory, J.M.; Jevrejeva, S.; Levermann, A.; Merrifield, M.A.; Milne, G.A.; Nerem, R.S.; Nunn, P.D.; et al. Sea level change. In Climate Change 2013: The Physical Science Basis. Contribution of Working Group I to the Fifth Assessment Report of the International Panel on Climate Change; Stocker, T.F., Qin, D., Plattner, G.-K., Tignor, M., Allen, A.K., Boschung, J., Nauels, A., Xia, Y., Bex, V., Midgley, P.M., Eds.; Cambridge University Press: Cambridge, UK; New York, NY, USA, 2013. [Google Scholar]
- Kemp, A.C.; Horton, B.P.; Culver, S.J.; Corbett, D.R.; van de Plassche, O.; Gehrels, W.R.; Douglas, B.C.; Parnell, A.C. Timing and magnitude of recent accelerated sea-level rise (North Carolina, United States). Geology 2009, 37, 1035–1038. [Google Scholar] [CrossRef]
- Al Mukaimi, M.E.; Dellapenna, T.M.; Williams, J.R. Enhanced land subsidence in Galveston Bay, Texas: Interaction between sediment accumulation rates and relative sea level rise. Estuar. Coast. Shelf Sci. 2018, 207, 183–193. [Google Scholar] [CrossRef]
- Sweet, W.V.; Kopp, R.E.; Weaver, C.P.; Obeysekera, J.; Theiler, E.R.; Zervas, C. Global and Regional Sea-Level Rise Scenarios for the United States; Technical Report NOS CO-OPS 083; National Oceanic and Atmospheric Administration: Silver Spring, MD, USA, 2017. [Google Scholar]
- Yoskowitz, D.; Carollo, C.; Pollack, J.B.; Santos, C.; Welder, K. Integrated ecosystem services assessment: Valuation of changes due to sea level rise in Galveston Bay, Texas, USA. Integr. Environ. Assess. Manag. 2017, 13, 431–443. [Google Scholar] [CrossRef] [PubMed]
- Raabe, E.A.; Stumpf, R.P. Expansion of tidal marsh in response to sea-level rise: Gulf Coast of Florida, USA. Estuar. Coast 2016, 39, 145–157. [Google Scholar] [CrossRef]
- Schieder, N.W.; Walters, D.C.; Kirwan, M.L. Massive upland to wetland conversion compensated for historical marsh loss in Chesapeake Bay, USA. Estuar. Coast 2018, 41, 940–951. [Google Scholar] [CrossRef]
- Kearney, M.S.; Russel, E.G.; Stevenson, J.C. Marsh loss in Nanticoke Estuary, Chesapeake Bay. Geogr. Rev. 1988, 78, 205–220. [Google Scholar] [CrossRef]
- Kearney, M.S.; Stevenson, J.C. Island land loss and marsh vertical accretion rate evidence for historical sea-level changes in Chesapeake Bay. J. Coast. Res. 1991, 7, 403–415. [Google Scholar]
- DeLaune, R.D.; Patrick, W.H., Jr.; Buresh, R.J. Sedimentation rates determined by 137Cs dating in a rapidly accreting salt marsh. Nature 1978, 275, 532–533. [Google Scholar] [CrossRef]
- Stevenson, J.C.; Kearney, M.S.; Pendleton, E.C. Sedimentation and erosion in a Chesapeake Bay brackish marsh system. Mar. Geol. 1986, 67, 213–235. [Google Scholar] [CrossRef]
- Reed, D.J. The response of coastal marshes to sea-level rise: Survival or submergence? Earth Surf. Process. Landf. 1995, 20, 39–48. [Google Scholar] [CrossRef]
- Chmura, G.L.; Hung, G.A. Controls on salt marsh accretion: A test in salt marshes of Eastern Canada. Estuaries 2004, 27, 70–81. [Google Scholar] [CrossRef]
- Kirwan, M.L.; Temmerman, S.; Skeehan, E.E.; Guntenspergen, G.R.; Fagherazzi, S. Overestimation of marsh vulnerability to sea level rise. Nat. Clim. Change 2016, 6, 253–260. [Google Scholar] [CrossRef]
- Fagherazzi, S.; Mariotti, G.; Wiberg, P.L.; McGlathery, K.J. Marsh collapse does not require sea level rise. Oceanography 2013, 26, 70–77. [Google Scholar] [CrossRef]
- Schwimmer, R.A. Rates and processes of marsh shoreline erosion in Rehoboth Bay, Delaware, USA. J. Coast. Res. 2001, 17, 678–683. [Google Scholar]
- Wilson, C.A.; Allison, M.A. An equilibrium profile model for retreating marsh shorelines in southeast Louisiana. Estuar. Coast. Shelf Sci. 2008, 80, 483–494. [Google Scholar] [CrossRef]
- Schieder, N.W.; Kirwan, M.L. Sea-level driven acceleration in coastal forest retreat. Geology 2019, 47, 1151–1155. [Google Scholar] [CrossRef]
- Feagin, R.A.; Martinez, M.L.; Mendoza-Gonzalez, G.; Costanza, R. Salt marsh zonal migration and ecosystem service change in response to global sea level rise: A case study from an urban region. Ecol. Soc. 2010, 15, 14. [Google Scholar] [CrossRef]
- Enwright, N.M.; Griffith, K.T.; Osland, M.J. Barriers to and opportunities for landward migration of coastal wetlands with sea-level rise. Front. Ecol. Environ. 2016, 14, 307–316. [Google Scholar] [CrossRef]
- Kirwan, M.L.; Megonigal, J.P. Tidal wetland stability in the face of human impacts and sea-level rise. Nature 2013, 504, 53–60. [Google Scholar] [CrossRef]
- Titus, J.G.; Park, R.A.; Leatherman, S.P.; Weggel, J.R.; Greene, M.S.; Mausel, P.W.; Brown, S.; Gaunt, G.; Trehan, M.; Yohe, G. Greenhouse effect and sea level rise: The cost of holding back the sea. Coast. Manag. 1991, 19, 171–204. [Google Scholar] [CrossRef]
- Barbier, E.B. Natural barriers to natural disasters: Replanting mangroves after the tsunami. Front. Ecol. Environ. 2006, 4, 124–131. [Google Scholar] [CrossRef]
- Barbier, E.B. Progress and challenges in valuing coastal and marine ecosystem services. Rev. Environ. Econ. Policy 2012, 6, 1. [Google Scholar] [CrossRef]
- Alongi, D.M. Mangrove forests: Resilience, protection from tsunamis and response to global climate change. Estuar. Coast. Shelf Sci. 2008, 76, 1–13. [Google Scholar] [CrossRef]
- Koch, E.W.; Barbier, E.B.; Silliman, B.R.; Reed, D.J.; Perillo, G.M.E.; Hacker, S.D.; Granek, E.F.; Primavera, J.H.; Muthiga, N.; Polasky, S.; et al. Non-linearity in ecosystem services: Temporal and spatial variability in coastal protection. Front. Ecol. Environ. 2009, 7, 29–37. [Google Scholar] [CrossRef]
- Montagna, P.; Ward, G.; Vaughan, B. The importance and problem of freshwater inflows to Texas estuaries. In Water Policy in Texas: Responding to the Rise of Scarcity; Griffin, R.C., Ed.; The RFF Press: Washington, DC, USA, 2011; pp. 107–127. [Google Scholar]
- Zetler, B.; Hansen, D. Tides in the Gulf of Mexico: A review and a proposed program. Bull. Mar. Sci. 1970, 20, 57–69. [Google Scholar]
- Eleuterius, L.N.; Eleuterius, C.K. Tide levels and salt marsh zonation. Bull. Mar. Sci. 1979, 29, 2471–2485. [Google Scholar]
- Stout, J.P. The Ecology of Irregularly Flooded Salt Marshes of the Northeastern Gulf of Mexico: A Community Profile; US Department of the Interior, Fish and Wildlife Service: Washington, DC, USA, 1984.
- Wang, F.C. Dynamics of intertidal marshes near shallow estuaries in Louisiana. Wetl. Ecol. Manag. 1997, 5, 131–143. [Google Scholar] [CrossRef]
- Kunza, A.E.; Pennings, S.C. Patterns of plant diversity in Georgia and Texas salt marshes. Estuar. Coast 2008, 31, 673–681. [Google Scholar] [CrossRef]
- Liu, Y.; Li, J.; Fasullo, J.; Galloway, D.L. Land subsidence contributions to relative sea level rise at tide gauge Galveston Pier 21, Texas. Sci. Rep. 2020, 10, 17905. [Google Scholar] [CrossRef]
- Shalowitz, A.L. Shore and Sea Boundaries. U.S. Department of Commerce; U.S. Government Printing Office: Washington, DC, USA, 1964; Publication 10-1; Volume 2.
- Crowell, M.; Leatherman, S.P.; Buckley, M.K. Historical shoreline change: Error analysis and mapping accuracy. JCR 1991, 7, 839–852. [Google Scholar]
- Swartwout, D.J. An Evaluation of the National Wetlands Inventory in Massachusetts. Master’s Thesis, University of Massachusetts, Amherst, MA, USA, 1982. [Google Scholar]
- Hefner, J.M.; Storrs, C.G. Classification and inventory of wetlands in the Southern Appalachian Region. Wat. Air Soil Poll. 1994, 77, 209–216. [Google Scholar] [CrossRef]
- Tiner, R.W. Assessing cumulative loss of wetland functions in the Nanticoke River watershed using enhanced National Wetlands Inventory data. Wetlands 2005, 25, 405–419. [Google Scholar] [CrossRef]
- Vanderhoof, M.K.; Alexander, L.C.; Todd, M.J. Temporal and spatial patterns of wetland extent influence variability of surface water connectivity in the Prairie Pothole Region, United States. Landsc. Ecol. 2016, 31, 805–824. [Google Scholar] [CrossRef]
- Borchert, S.M.; Osland, M.J.; Enwright, N.M.; Griffith, K.T. Coastal wetland adaptation to sea level rise: Quantifying potential for landward migration and coastal squeeze. J. Appl. Ecol. 2018, 55, 2876–2887. [Google Scholar] [CrossRef]
- McKee, K.L.; Patrick, W.H. The relationship of smooth cordgrass (Spartina alterniflora) to tidal datums: A review. Estuaries 1988, 11, 143–151. [Google Scholar] [CrossRef]
- Environmental Protection Agency (EPA). Guidelines for Preparing Economic Analyses; EPA 240-R-00-003; United States Environmental Protection Agency, Office of the Administration: Washington, DC, USA, 2000. Available online: http://yosemite.epa.gov/ee/epa/eed.nsf/webpages/Guidlines.html/$file/Guidlines.pdf (accessed on 5 August 2023).
- Galveston Country Appraisal District. 2009. Available online: http://www.galvestoncad.org/PA/Shapeidx/shapes.htm (accessed on 5 August 2023).
- National Oceanic and Atmospheric Administration. Discounting and the Treatment of Uncertainty in Natural Resource Damage Assessment; Technical Paper 99; Damage Assessment and Restoration Program, National Oceanic and Atmospheric Administration (NOAA): Silver Spring, MD, USA, 1999. Available online: http://www.darrp.noaa.gov/economics/pdf/discpdf2.pdf (accessed on 5 August 2023).
- Brander, L.M.; Florax, R.J.G.M.; Vermaat, J.E. The empirics of wetland evaluation: A comprehensive summary and meta-analysis of the literature. Environ. Resour. Econ. 2006, 33, 223–250. [Google Scholar] [CrossRef]
- Woodward, R.T.; Wui, Y.-S. The economic value of wetland services: A meta-analysis. Ecol. Econ. 2001, 37, 257–270. [Google Scholar] [CrossRef]
- Bockstael, N.E.; Freeman, A.M., III; Kopp, R.J.; Portney, P.R.; Smith, V.K. On measuring economic values for nature. Environ. Sci. Technol. 2000, 34, 1384–1389. [Google Scholar] [CrossRef]
- Smith, J.A.M. The role of Phragmites australis in mediating inland salt marsh migration in a Mid-Atlantic Estuary. PLoS ONE 2013, 8, e65091. [Google Scholar] [CrossRef]
- Schepers, L.; Kirwan, M.L.; Guntenspergen, G.R.; Temmerman, S. Spatio-temporal development of vegetation die-off in a submerging coastal marsh. Limnol. Oceanogr. 2017, 62, 137–150. [Google Scholar] [CrossRef]
- McGowen, J.H.; Brown, L.F.; Evan, T.J.; Fisher, W.L.; Groat, D.G. Environmental Geologic Atlas of the Texas Coastal Zone—Bay City—Freeport Area; University of Texas, Bureau of Economic Geology: Austin, TX, USA, 1976. [Google Scholar]
- Vaughan, R.J. Disturbance in a Stressed Environment: Bank Vegetation of the Gulf Intracoastal Waterway at Cedar Lake, Texas. Ph.D. Thesis, Texas A&M University, College Station, TX, USA, 1977. [Google Scholar]
- White, W.A.; Morton, R.A. Wetland losses related to fault movement and hydrocarbon production, Southeastern Texas Coast. J. Coast. Res. 1997, 13, 1305–1320. [Google Scholar]
- White, W.A.; Tremblay, T.A. Submergence of wetlands as a result of human-induced subsidence and faulting along the upper Texas Gulf Coas. J. Coast. Res. 1995, 11, 788–807. [Google Scholar]
- Byearne, R.J.; Anderson, G.L. Shoreline Erosion in Tidewater Virginia. Special Report in Applied Marine Science and Ocean Engineering 111; Virginia Institute of Marine Science: Gloucester Pt, VA, USA, 1978; p. 102. Available online: http://ccrm.vims.edu/gis_data_maps/shoreline_inventories/virginia/scan_reports/TidewaterShorelineErosion.pdf (accessed on 5 August 2023).
- Rosen, P.S. Erosion susceptibility of the Virginia Chesapeake Bay shoreline. Mar. Geol. 1980, 34, 45–59. [Google Scholar] [CrossRef]
- Corbett, D.R.; Walsh, J.P.; Riggs, S.R.; Ames, D.V.; Culver, S.J. Shoreline Change within the Albemarle-Pamlico Estuarine System, North Carolina. 1907–2007 Centennial. 2008. Available online: https://www.ecu.edu/cs-acad/icsp/upload/EstuarineShorelineChagneDec2008.pdf (accessed on 5 August 2023).
- Phillips, J.D. Spatial analysis of shoreline erosion, Delaware Bay, New Jersey. A. Assoc. Am. Geog. 1986, 76, 50–62. [Google Scholar] [CrossRef]
- Riggs, S.R. Shoreline Erosion in North Carolina Estuaries: The Soundfront Series UNC-SG_01-11; North Carolina Sea Grant: Raleigh, North Carolina, 2001; Pub. No. N.C., UNC-SG-01-11; p. 69. [Google Scholar]
- Santschi, P.H.; Oktay, S.D.; Cifuentes, L. Carbon isotopes and iodine concentrations in a Mississippi River delta core recording land use, sediment transport, and dam building in the river’s drainage basin. Mar. Environ. Res. 2007, 63, 278–290. [Google Scholar] [CrossRef]
- Hussein, A.H. Modeling of sea-level rise and deforestation in submerging coastal ultisols of Chesapeake Bay. Soil Sci. Soc. Am. J. 2009, 73, 185. [Google Scholar] [CrossRef]
- DeLaune, R.D.; Nyman, J.A.; Patrick, W.H., Jr. Peat collapse, ponding and wetland loss in a rapidly submerging coastal marsh. J Coast. Res. 1994, 10, 1021–1030. [Google Scholar]
- Nyman, J.A.; DeLaune, R.D.; Roberts, H.H.; Patrick, W.H., Jr. Relationship between vegetation and soil formation in a rapidly submerging coastal marsh. Mar. Ecol. Prog. Ser. 1993, 96, 269–279. [Google Scholar] [CrossRef]
- Kirwan, M.L.; Guntenspergen, G.R. Feedbacks between inundation, root production, and shoot growth in a rapidly submerging brackish marsh. J. Ecol. 2012, 100, 764–770. [Google Scholar] [CrossRef]
- Schepers, L.; Kirwan, M.L.; Guntenspergen, G.R.; Temmerman, S. Evaluating indicators of marsh vulnerability to sea level rise along a historical marsh loss gradient. Earth Surf. Process. Landf. 2020, 45, 2107–2117. [Google Scholar] [CrossRef]
- Kirwan, M.L.; Gedan, K.B. Sea-level driven land conversion and the formation of ghost forests. Nat. Clim. Change 2019, 9, 450–457. [Google Scholar] [CrossRef]
- Dahl, T.E.; Stedman, S.M. Status and Trends of Wetlands in the Coastal Watersheds of the Conterminous United States 2004 to 2009; US Department of the Interior, Fish and Wildlife Service: Washington, DC, USA; National Oceanic and Atmospheric Administration: Silver Spring, MD, USA, 2013.
- Morris, J.T.; Edwards, J.; Crooks, S.; Reyes, E. Assessment of carbon sequestration potential in coastal wetlands. In Recarbonization of the Biosphere; Lal, R., Lorenz, K., Hüttl, R.F., Schneider, B.U., von Braun, J., Eds.; Springer: Dordrecht, The Netherlands, 2012; pp. 517–531. [Google Scholar]
- Bromberg, K.D.; Bertness, M.D. Reconstructing New England salt marsh losses using historical maps. Estuaries 2005, 28, 823–832. [Google Scholar] [CrossRef]
- Wasson, K.; Woolfolk, A.; Fresquez, C. Ecotones as indicators of changing environmental conditions: Rapid migration of salt marsh-upland boundaries. Estuar. Coasts 2013, 36, 654–664. [Google Scholar] [CrossRef]
- Field, C.R.; Gjerdrum, C.; Elphick, C.S. Forest resistance to sea-level rise prevents landward migration of tidal marsh. Biol. Conserv. 2016, 201, 363–369. [Google Scholar] [CrossRef]
- Callaway, J.C.; Parker, V.T.; Vasey, M.C.; Schile, L.M. Emerging issues for the restoration of tidal marsh ecosystems in the context of predicted climate change. Madrono 2007, 54, 234–248. [Google Scholar] [CrossRef]
- Brophy, L.S.; Greene, C.M.; Hare, V.C.; Holycross, B.; Lanier, A.; Heady, W.N.; O’Connor, K.; Imaki, H.; Haddad, T.; Dana, R. Insights into estuary habitat loss in the western United States using a new method for mapping maximum extent of tidal wetlands. PLoS ONE 2019, 14, e0218558. [Google Scholar] [CrossRef] [PubMed]
- Thorne, K.; MacDonald, G.; Guntenspergen, G.; Ambrose, R.; Buffington, K.; Dugger, B.; Freeman, C.; Janousek, C.; Brown, L.; Rosencranz, J.; et al. Pacific coastal wetland resilience and vulnerability to sea-level rise. Sci. Adv. 2018, 4, eaao3270. [Google Scholar] [CrossRef] [PubMed]
- Costanza, R.; Pérez-Maqueo, O.; Martinez, M.L.; Sutton, P.; Anderson, S.J.; Mulder, K. The value of coastal wetlands for hurricane protection. Ambio 2008, 27, 241–248. [Google Scholar] [CrossRef]
- Pezeshki, S.R.; DeLaune, R.D. Ecophenic variation in Spartina patens: Growth and biomass partitioning. J. Aquat. Plant Manag. 1991, 29, 99–102. [Google Scholar]
- Balaguru, K.; Judi, D.R.; Leung, L.R. Future hurricane storm surge risk for the U.S. gulf and Florida coasts based on projections of thermodynamic potential intensity. Clim. Change 2016, 138, 99–100. [Google Scholar] [CrossRef]
- Rogers, K.; Saintilan, N.; Copeland, C. Managed retreat of saline coastal wetlands: Challenges and opportunities identified from the Hunter River Estuary, Australia. Estuar. Coasts 2014, 37, 67–78. [Google Scholar] [CrossRef]
- Temmerman, S.; Meire, P.; Bouma, T.J.; Herman, P.M.J.; Ysebaert, T.; De Vriend, H.J. Ecosystem-based coastal defence in the face of global change. Nature 2013, 504, 79–83. [Google Scholar] [CrossRef]
- Temmerman, S.; Kirwan, M.L. Building land with a rising sea. Science 2015, 349, 588–589. [Google Scholar] [CrossRef]
- CPRA. Louisiana’s Comprehensive Master Plan for a Sustainable Coast; Coastal Protection and Restoration Authority: Baton Rouge, LA, USA, 2012. [Google Scholar]
- Day, J.W., Jr.; Boesch, D.F.; Clairain, E.J.; Kemp, G.P.; Laska, S.B.; Mitsch, W.J.; Orth, K.; Mashriqui, H.; Reed, D.J.; Shabman, L.; et al. Restoration of the Mississippi Delta: Lessons from hurricanes Katrina and Rita. Science 2007, 315, 1679–1684. [Google Scholar] [CrossRef]
- Giosan, L.; Syvitski, J.; Constantinescu, S.; Day, J. Climate change: Protect the world’s deltas. Nature 2014, 516, 31–33. [Google Scholar] [CrossRef]
- Rozas, L.P.; Caldwell, P.; Minello, T.J. The fishery value of salt marsh restoration projects. J. Coast. Res. 2005, 40, 37–50. [Google Scholar]

Disclaimer/Publisher’s Note: The statements, opinions and data contained in all publications are solely those of the individual author(s) and contributor(s) and not of MDPI and/or the editor(s). MDPI and/or the editor(s) disclaim responsibility for any injury to people or property resulting from any ideas, methods, instructions or products referred to in the content. |
© 2024 by the authors. Licensee MDPI, Basel, Switzerland. This article is an open access article distributed under the terms and conditions of the Creative Commons Attribution (CC BY) license (https://creativecommons.org/licenses/by/4.0/).