1. Introduction
Precise point positioning (PPP) technology leverages a single Global Navigation Satellite System (GNSS) receiver to deliver highly accurate positioning [
1,
2]. Renowned for its adaptability, stability, and precision, PPP finds extensive applications across diverse domains such as high-precision positioning, atmospheric monitoring, and autonomous navigation [
3,
4,
5]. Central to PPP implementation are high-fidelity orbit and clock products [
6,
7,
8]. To enable real-time PPP, the International GNSS Service (IGS) introduced the Real-Time Service (RTS) in 2007. This service utilizes the Radio Technical Commission for Maritime Services (RTCM) and Internet Protocol (NTRIP) frameworks [
9], and employs the State Space Representation (SSR) format to disseminate correction data over networks. By leveraging SSR corrections, users can obtain precise real-time satellite orbits and clocks, thereby achieving accurate real-time PPP solutions. However, RTS is contingent upon a stable ground network environment, constraining its utility in regions with network limitations [
10,
11,
12]. In 2020, the BeiDou Global Navigation Satellite System (BDS-3) announced the provision of real-time PPP services through PPP-B2b signals broadcasted by Geostationary Orbit (GEO) satellites [
13]. This service enables users in China and surrounding areas to directly acquire precise orbit and clock corrections from satellites, eliminating the need for network infrastructure.
Although PPP-B2b eliminates the need for ground-based networks, it does require visibility of at least one GEO satellite. Presently, three GEO satellites are designated for PPP-B2b services, orbiting at an altitude of 35,786 km and positioned at 80 degrees east longitude, 110.5 degrees east longitude, and 140 degrees east longitude, respectively. Given the relatively fixed positions of GEO satellites, the elevation angle of GEO satellites is typically below 60 degrees and predominantly on the southern side of users, leading to the “south wall effect” [
14,
15]. During real-time dynamic positioning, this effect often triggers signal interruptions due to building block and other factors, thus disrupting PPP positioning. Moreover, accurate matching of correction information is imperative upon receiving PPP-B2b signals, yet matching errors are inevitable during real-time positioning [
16]. Additionally, to prioritize the accuracy of BDS-3 positioning, PPP-B2b services prioritize the broadcast of BDS-3 satellite correction data over GPS satellite correction data when downlink resources are limited [
17], resulting in the loss of GPS satellite correction data. The combination of the “south wall effect”, “correction data matching errors” and “broadcast priority” collectively restricts the continuity of PPP-B2b services. Therefore, detecting abnormal PPP-B2b situations and predicting PPP-B2b interruptions are essential for ensuring service continuity in continuous PPP high-precision positioning.
Satellite orbit corrections exhibit high temporal correlation, while satellite clock corrections change rapidly over time, resulting in weaker temporal correlation. For high-precision positioning, using non-synchronized satellite clock corrections typically maintains accuracy for only a few seconds. When precise ephemeris data are interrupted for tens of seconds to several minutes, the reliability of real-time positioning is compromised [
18]. Although studies have shown that using the last epoch product before a PPP-B2b interruption can maintain positioning accuracy for 10 min [
19], this empirical threshold is inadequate for real-time positioning reliability and usability. Clock offset prediction during RTS interruptions has been extensively researched, with common models including the Semiparametric Model (SM), Quadratic Polynomial (QP) model, Gray Model (GM), and Spectrum Analysis (SA) model [
20,
21,
22]. However, related studies indicate that BDS-3 and GPS products exhibit varying degrees and frequencies of jumps. Additionally, due to the frequent changes in the time reference of GPS satellites within PPP-B2b correction estimation strategy, GPS sometimes experiences common jumps across all satellites [
23,
24]. These reliance on historical data makes the aforementioned prediction methods less suitable. Hadas et al. [
25] processed RTS data based on polynomial fitting and achieved reliable prediction of GPS satellite corrections for 8 min. Nie et al. [
26] improved the polynomial model based on epoch difference data of the IGU product and achieved reliable prediction of the RTS clock up to 1 h. However, this method requires external information. Some of the research utilized more complex methods such as neural networks [
27] and long short-term memory [
28]. Although these algorithms demonstrated good performance, they significantly increased data storage and computational complexity. The differing characteristics of BDS-3 and GPS corrections of PPP-B2b necessitate differentiated treatment in prediction [
29].
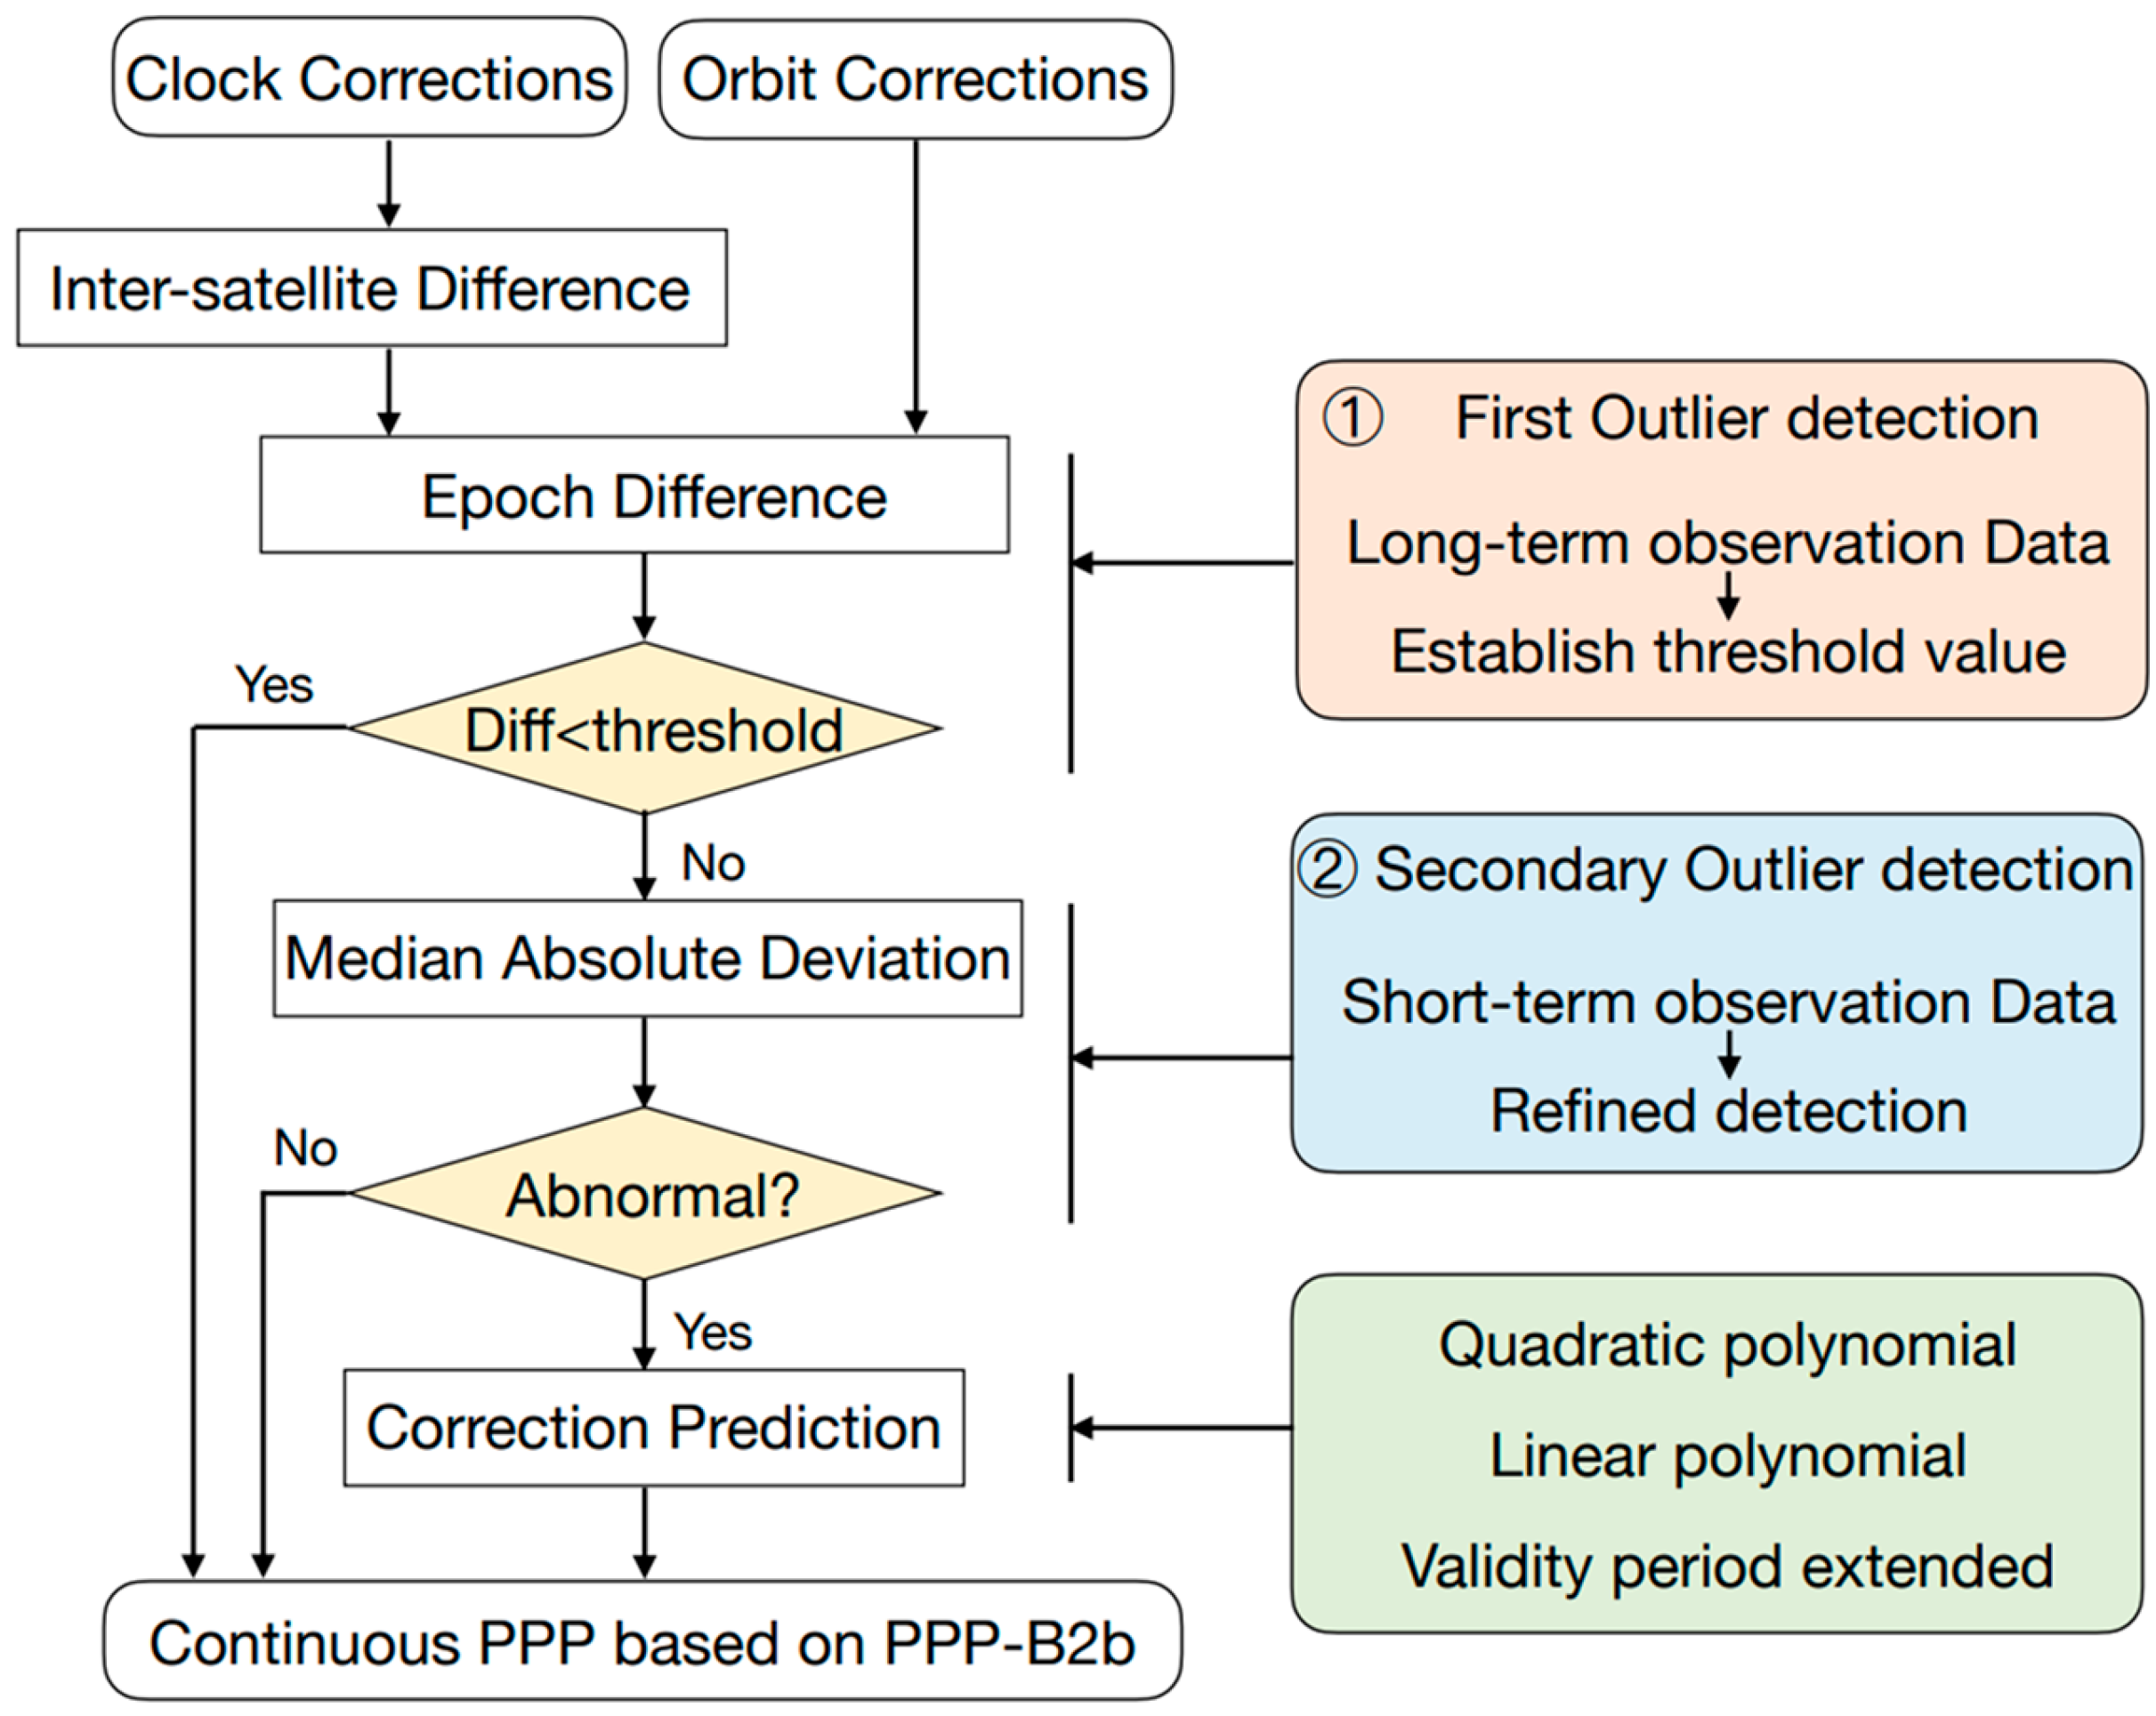
Based on the analysis of the continuity and time-varying characteristics of PPP-B2b signals, as well as the cause of the datum jumps, this paper established a “two-step” PPP-B2b orbit and clock outlier detection model and proposes a classification-based PPP-B2b orbit and clock prediction model to achieve real-time continuous positioning based on PPP-B2b. The paper is organized as follows: Firstly, the interruption situations and reasons for PPP-B2b signals are analyzed based on long-term observation data. Next, the temporal variation characteristics of PPP-B2b correction data, including interruption frequency, trend changes, etc., are analyzed, and the data processing strategies and methods for signal interruptions are elaborated. On this basis, suitable prediction models are established. Finally, the positioning accuracy of PPP maintained using predicted correction data is verified through simulated and real-time dynamic experiments.
2. Temporal Characteristics of Orbit and Clock Corrections for PPP-B2b
PPP-B2b currently broadcasts parameters such as satellite mask, orbit corrections, clock corrections for BDS-3 and GPS, and DCB for BDS-3. To ensure the accurate alignment between the PPP-B2b corrections and the broadcast ephemeris, four types of Issue of Data (IOD) are defined: IOD SSR (Issue of Data for State Space Representation), IODP (Issue of Data for Pseudo-Random Noise Mask), IODN (Issue of Data for Navigation), and IOD Corr [
13]. The receivable information types and their broadcast contents are detailed in
Table 1. It is crucial to match different types of information before utilizing them, and incorrect matching of IOD is identified as one of the primary causes of PPP-B2b signal interruption [
30]. This section begins by demonstrating the completeness and continuity of the orbit and clock corrections provided by PPP-B2b. Subsequently, it investigates the occurrence of orbit and clock correction jumps in PPP-B2b products.
2.1. PPP-B2b Signal Collection
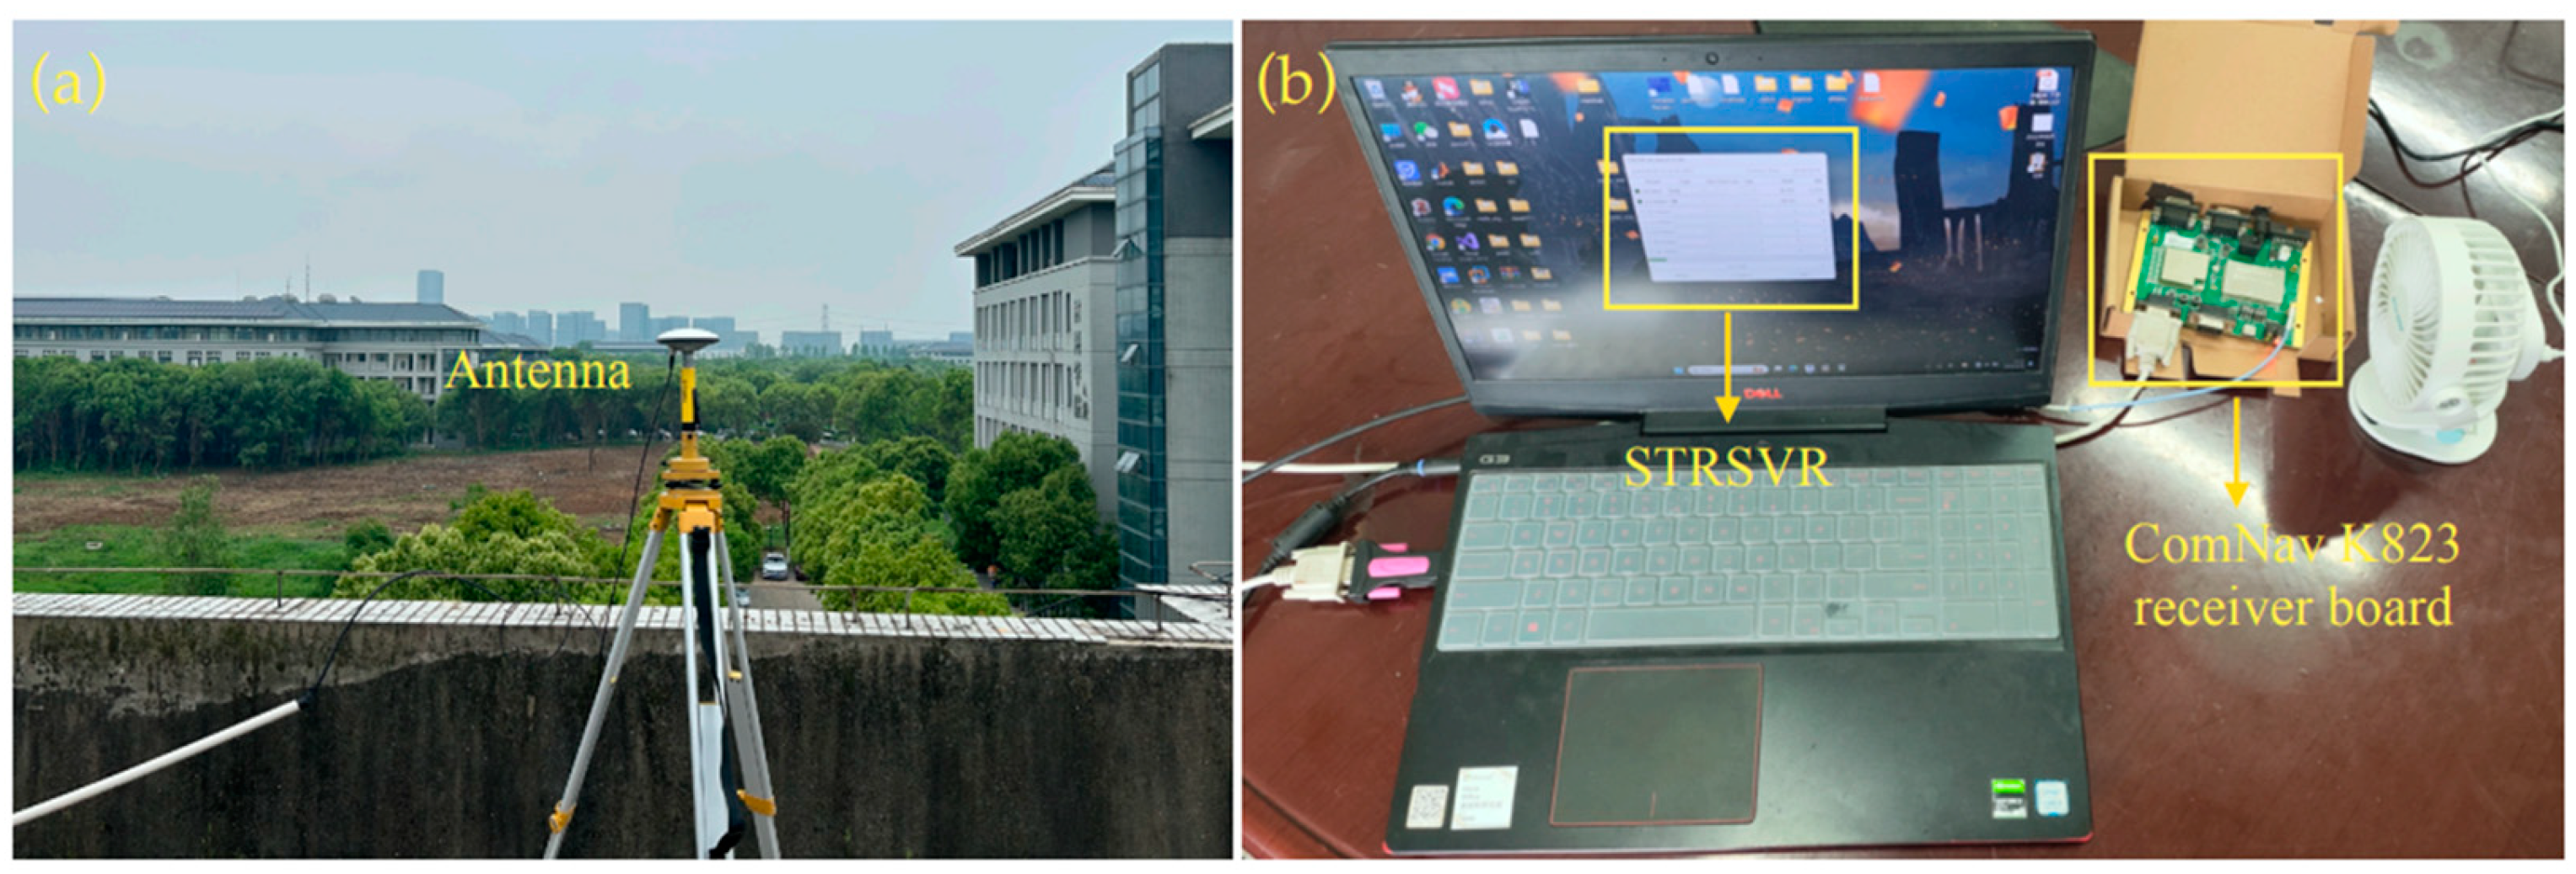
The ComNav K823 receiver board, with an antenna placed on the roof of the School of Transportation at Southeast University in Nanjing, China, as illustrated in
Figure 1, was employed to capture the PPP-B2b signal. Data collection spanned from DOY 340 to 354 of 2023, with each day’s collection duration surpassing 21 h. Subsequently, the received navigation message (B1C-CNAV1 for BDS-3 and LNAV for GPS) was used to decode and reconstruct the satellite orbit corrections, clock corrections, and DCB into satellite orbit and clock files.
2.2. Completeness and Continuity of the PPP-B2b Orbit and Clock
Figure 2 illustrates the PPP-B2b information from 2:00 to 3:00 on DOY 342 of the year 2023. In the top panel of
Figure 2, it is evident that clock corrections dominate the downlink resources. At 2:20, 2:30, and 2:50, information of type 1 is missing, as indicated by the red box. However, other information types remain complete during these times, suggesting that signal reception issues can be ruled out. Additionally, between 2:24 and 2:26, there is a roughly 2-min data interruption, as indicated by the black box.
For a more detailed analysis of this data interruption phenomenon, we zoom in on the sequence between 2:22 and 2:27, as shown in the bottom panel of
Figure 2. It becomes apparent that around 2:23:30, there is an anomaly in the intervals between clock corrections, where the interval is approximately 12 s—twice the broadcast interval. While these outliers do not affect usage, long-term observations have revealed that the absence of clock correction data is a significant cause of interruptions. Furthermore, between 2:24 and 2:27, all four types of correction data experience a 144-s interruption. However, the start and end times are inconsistent, indicating that the issue likely originates from the PPP-B2b service itself or the transmission process rather than signal reception.
According to the PPP-B2b Signal Interface Control Document (ICD) and the information type sequence depicted in
Figure 2, it is apparent that clock corrections (type 4), with a higher frequency, take precedence for broadcast following the initiation of a cycle indicated by information type 1. Subsequently, DCB corrections (type 3) and orbit corrections (type 2) are broadcast. The IODP of information type 1 exhibits remarkable stability, with its mask content generally remaining unchanged. Even in the absence of information, the most recent corrections can be directly utilized. The nominal effective time of DCB is 86400 s, remaining constant within a day, thus obviating the need for information matching. Conversely, the IOD SSR of orbit corrections (type 2) and clock corrections (type 4) undergo frequent changes, necessitating stringent requirements for information matching.
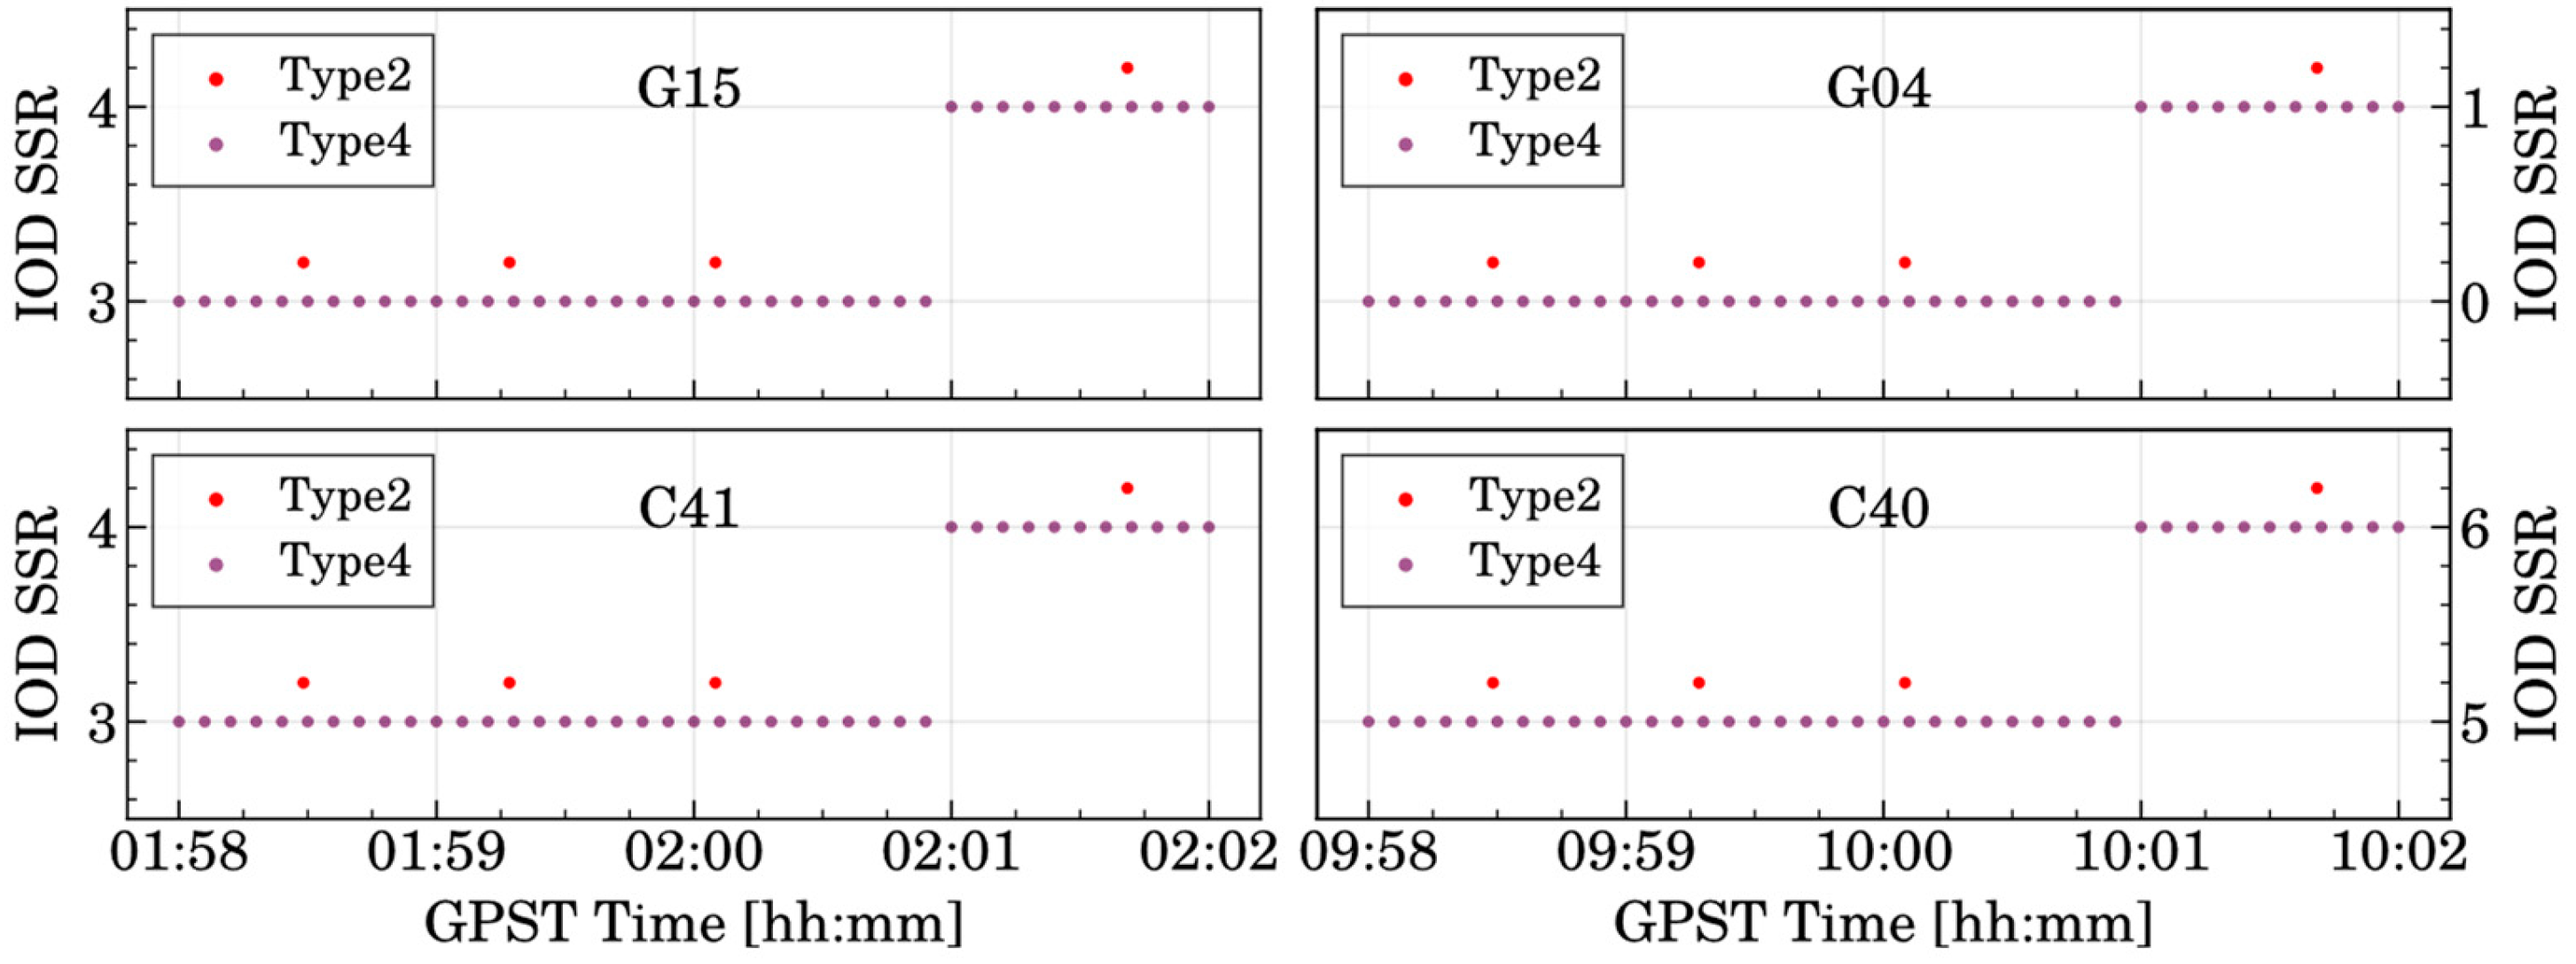
After the change in IOD SSR, there are instances where the first epoch orbit corrections are lost. Although the last orbit corrections are still within the validity period, the IOD SSR has not been updated, preventing the matching of orbit and clock corrections. It is only until the reception of the next orbit corrections that complete and accurate orbit and clock corrections can be obtained, leading to a 48-s service interruption.
Figure 3 illustrates the time series of failed satellite IOD SSR matches; similar occurrences often coincide with changes in IODN values, indicating changes in the broadcast ephemeris corresponding to the corrections. Only some satellites will loss information at the same epoch, meaning that the satellites involved in PPP positioning will frequently change. As can be seen, issues such as signal transmission and incorrect IOD matching can lead to interruptions in PPP-B2b services, even in open environments and static scenarios.
2.3. Jumps in Orbit and Clock Corrections
To provide a more intuitive display of the temporal characteristics of orbit and clock corrections, we selected the data from DOY 342 of 2023 for analysis, as shown in
Figure 4. The corrections show short-term continuity, segmented roughly every 1 h for BDS-3 and every 2 h for GPS, corresponding to the ephemeris broadcast frequency. Notably, even without changes in the ephemerides, orbit corrections may undergo abrupt changes, often triggered by alterations in IOD SSR. BDS-3 orbit corrections mainly fall within 0.2 m, while GPS corrections concentrate within 2 m, a notable difference possibly attributed to additional observations from the BDS-3 satellites’ intersatellite link (ISL) terminals, enhancing orbit determination precision [
31]. Both BDS-3 and GPS exhibit the most stable radial correction data, followed by along data, while cross data exhibit the highest variability. The magnitude of correction variation plays a crucial role in determining correction prediction strategies.
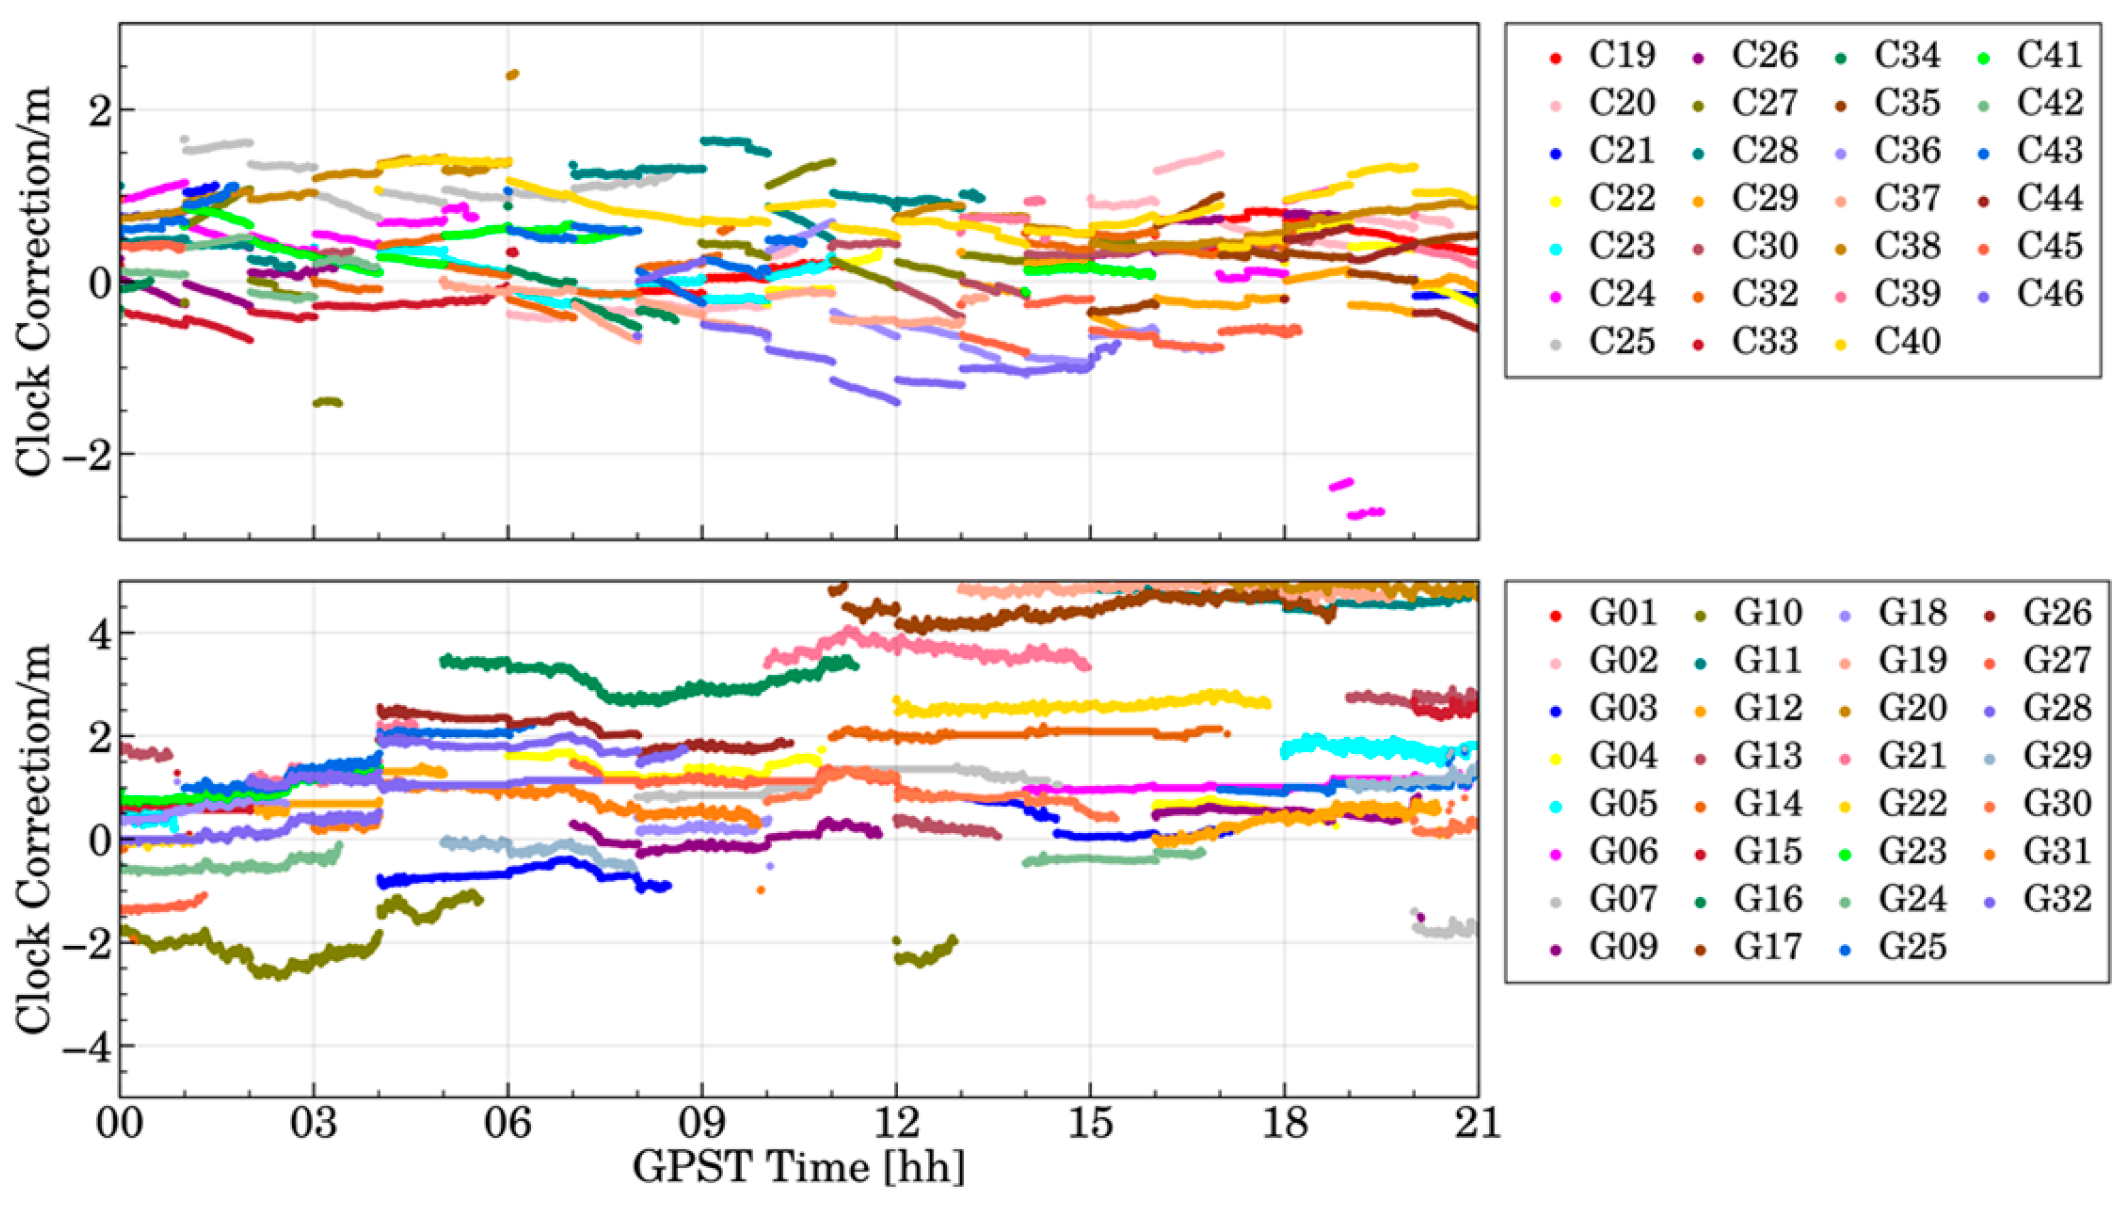
The time series of BDS-3 and GPS clock corrections for the same day are depicted in
Figure 5. From the black box ①, it can be seen that both BDS-3 and GPS clock corrections exhibit significant abnormal jumps; as indicated in the black box ②, there are also some small jumps. Additionally, the range of variation in BDS-3 clock corrections exceeds that of orbit corrections, consistent with findings indicating that BDS-3 broadcast ephemeris precision is primarily limited by clock accuracy [
23]. GPS clock corrections display irregular behavior, with some periods showing small variations while others display significant irregular fluctuations and the occurrence of frequent jumps. In addition to segments caused by corresponding changes in broadcast ephemeris, GPS sometimes experiences common jumps among all satellites (e.g., at 6:00, 16:45, 18:30) stemming from changes in clock time standards, specifically the transition of satellites with clock corrections of 0 [
32]. It is noteworthy that BDS-3 lacks satellites with clock corrections of 0, indicating disparate correction generation strategies between BDS-3 and GPS. While these common jumps do not affect PPP calculations [
33], they do disrupt the trend of correction increments and decrements, posing challenges for clock prediction.
Both the BDS-3 and GPS correction sequences display instances of individual satellite jumps, highlighting the need for outlier detection and correction. Given the occurrence of common jumps, identifying anomalies solely based on the correction variation from individual satellites is impractical. Instead, an analysis of the overall changes across all satellites is necessary.
4. Experiments and Results
This section will validate the effectiveness of outlier detection methods and the prediction model for orbit and clock corrections. Firstly, based on long-term observation data, a quantitative analysis of the temporal characteristics of PPP-B2b corrections is conducted to determine the threshold and effectiveness of outlier detection. Then, static and dynamic data collected over multiple days are used for positioning experiments to analyze the positioning accuracy using predicted corrections.
4.1. Threshold for Outlier Detection
We conducted a quantitative analysis of the temporal characteristics of PPP-B2b corrections based on long-term observation data to establish outlier detection thresholds. Based on the PPP-B2b corrections collected from DOY 340 to 354 in 2023 as described in
Section 2.1, we calculated single differences between epochs using the length of the orbit correction vector as a reference. Subsequently, we conducted a statistical analysis of the differences in corrections between adjacent epochs.
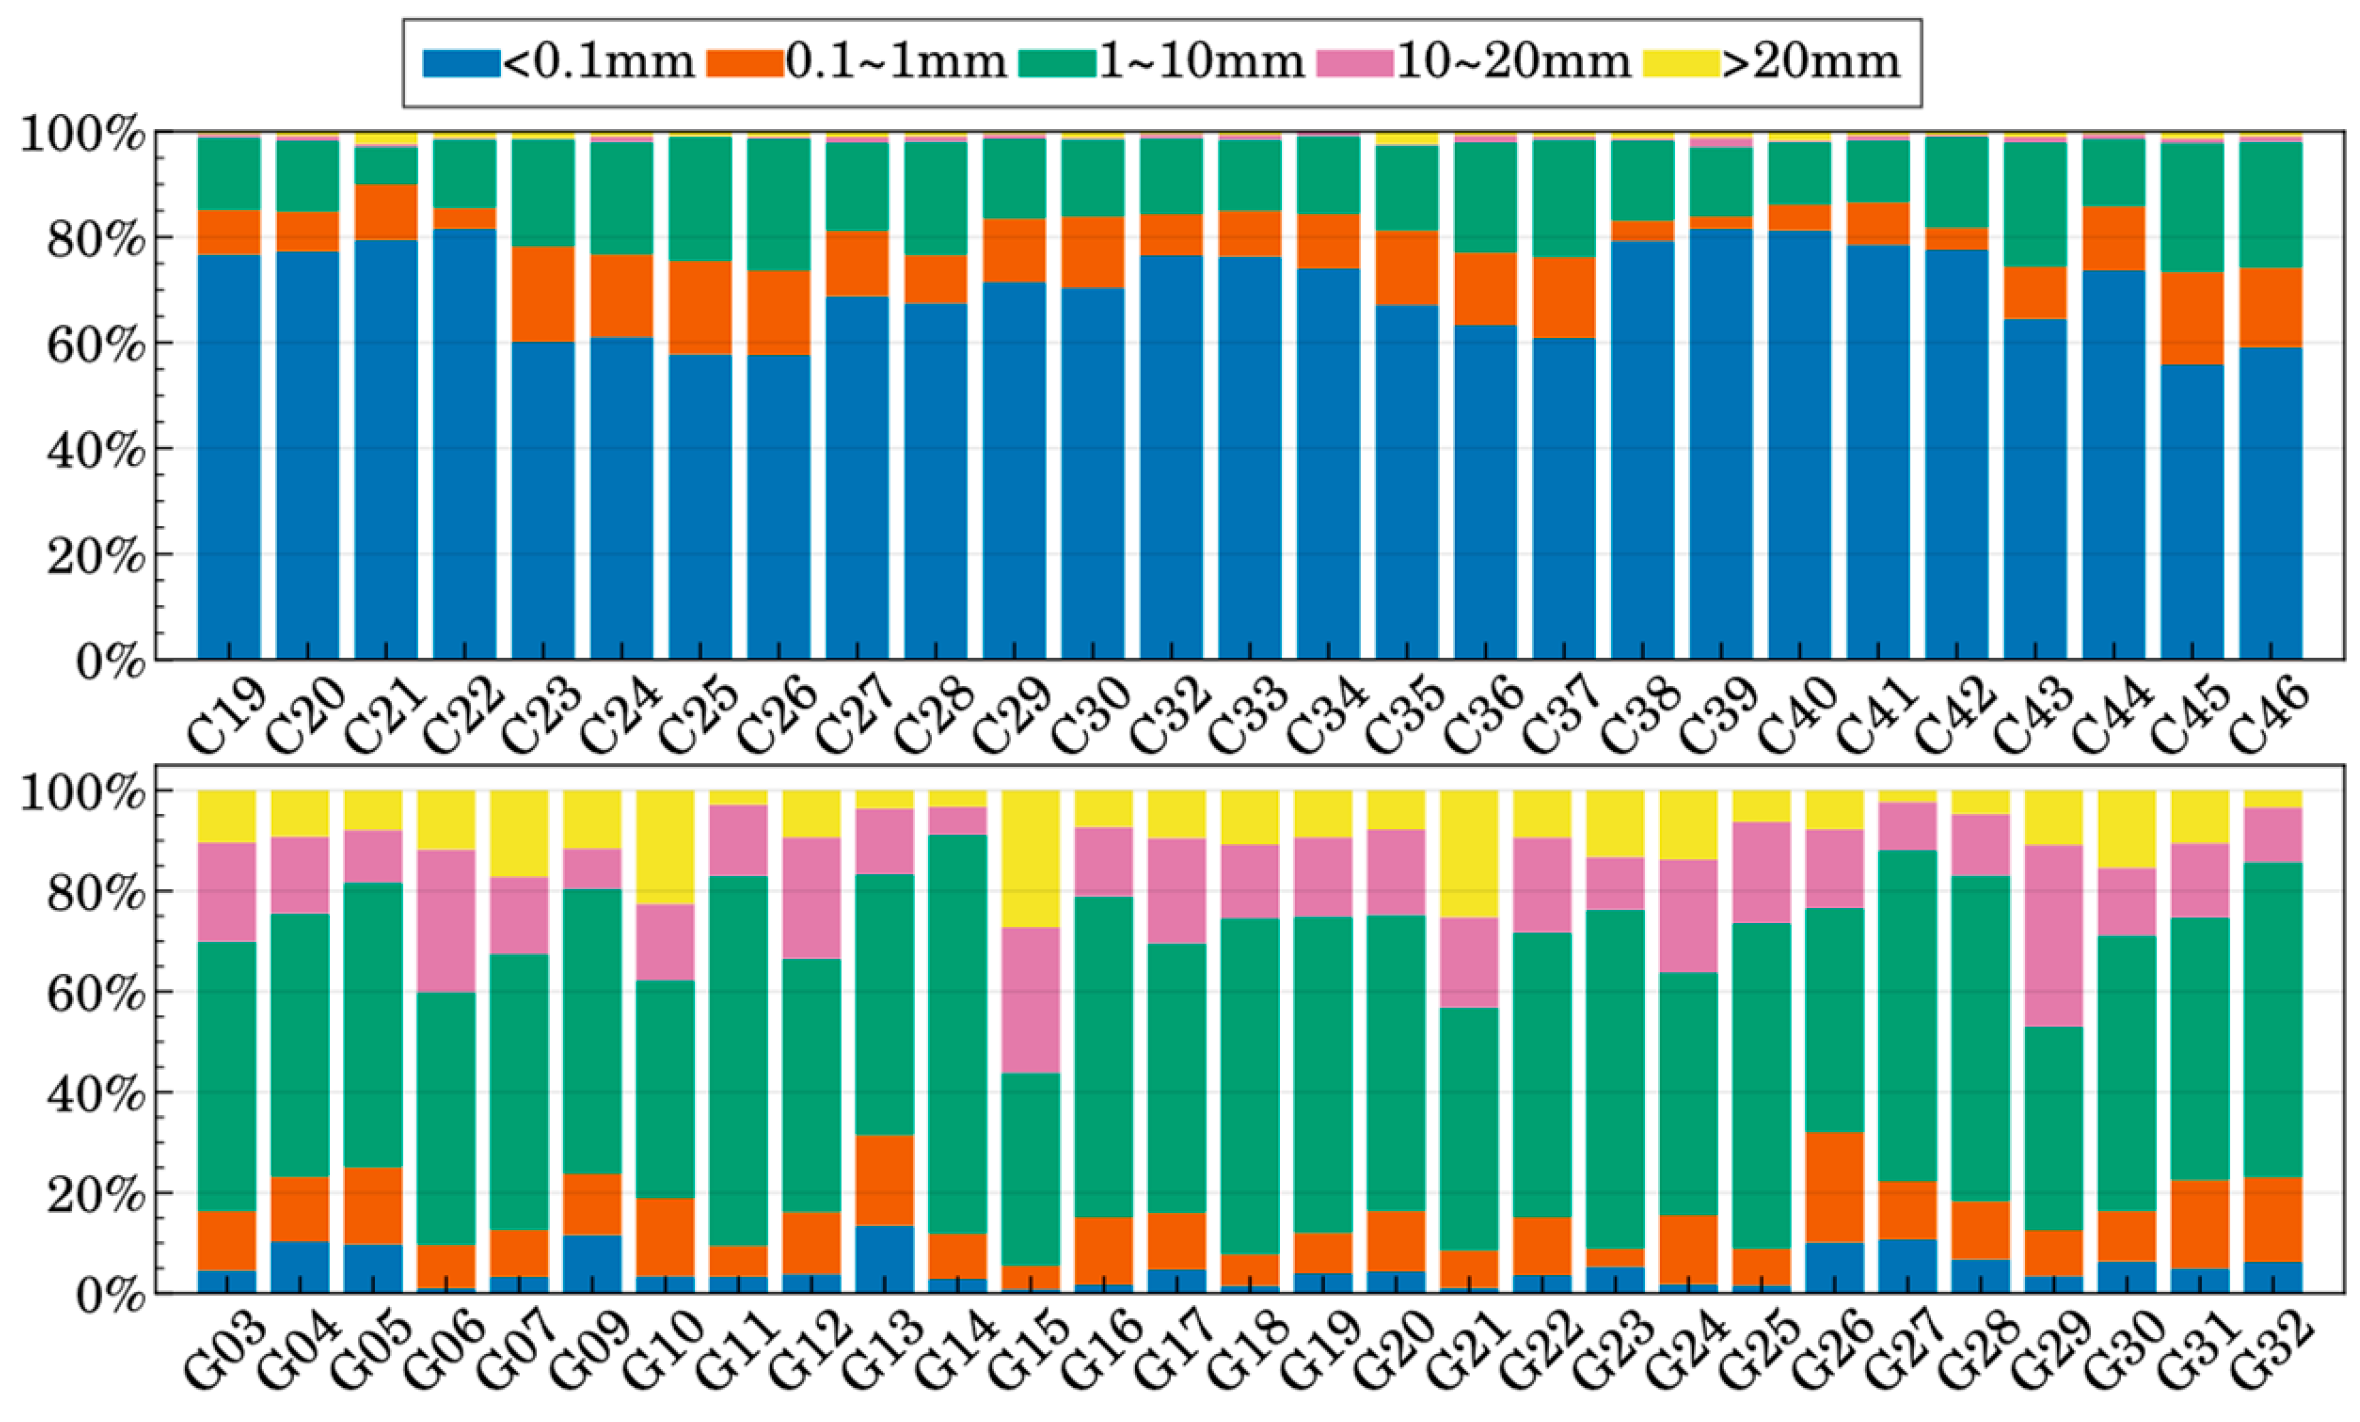
Figure 7 illustrates the distribution of these differences, with an epoch interval of 48 s.
The variation in BDS-3 satellite orbit corrections appears relatively stable, with over 60% of the time intervals exhibiting differences within 0.1 mm (with most values being 0). Even when exceeding the 10-min validity period, errors can still be contained within the millimeter range. Approximately 80% of the time intervals display differences within 1 mm, with very few instances exceeding 20 mm, mainly attributed to data outliers and interruptions in satellite arcs. Conversely, the rate of change in GPS satellite orbit corrections is notably higher than that of BDS-3 satellites, with about 80% of the time intervals showing differences above 1 mm, and approximately 40% exhibiting differences exceeding 10 mm. In such scenarios, if the corrections from the last epoch are directly applied, the accumulated error will escalate to the decimeter level within 10 min.
Considering the distribution of differences in orbit correction values, it is entirely rational to utilize direct BDS-3 satellite values and predict GPS satellite values. Additionally, in outlier detection, the threshold for BDS-3 satellites is set to 1 mm, while for GPS satellites, it is set to 10 mm.
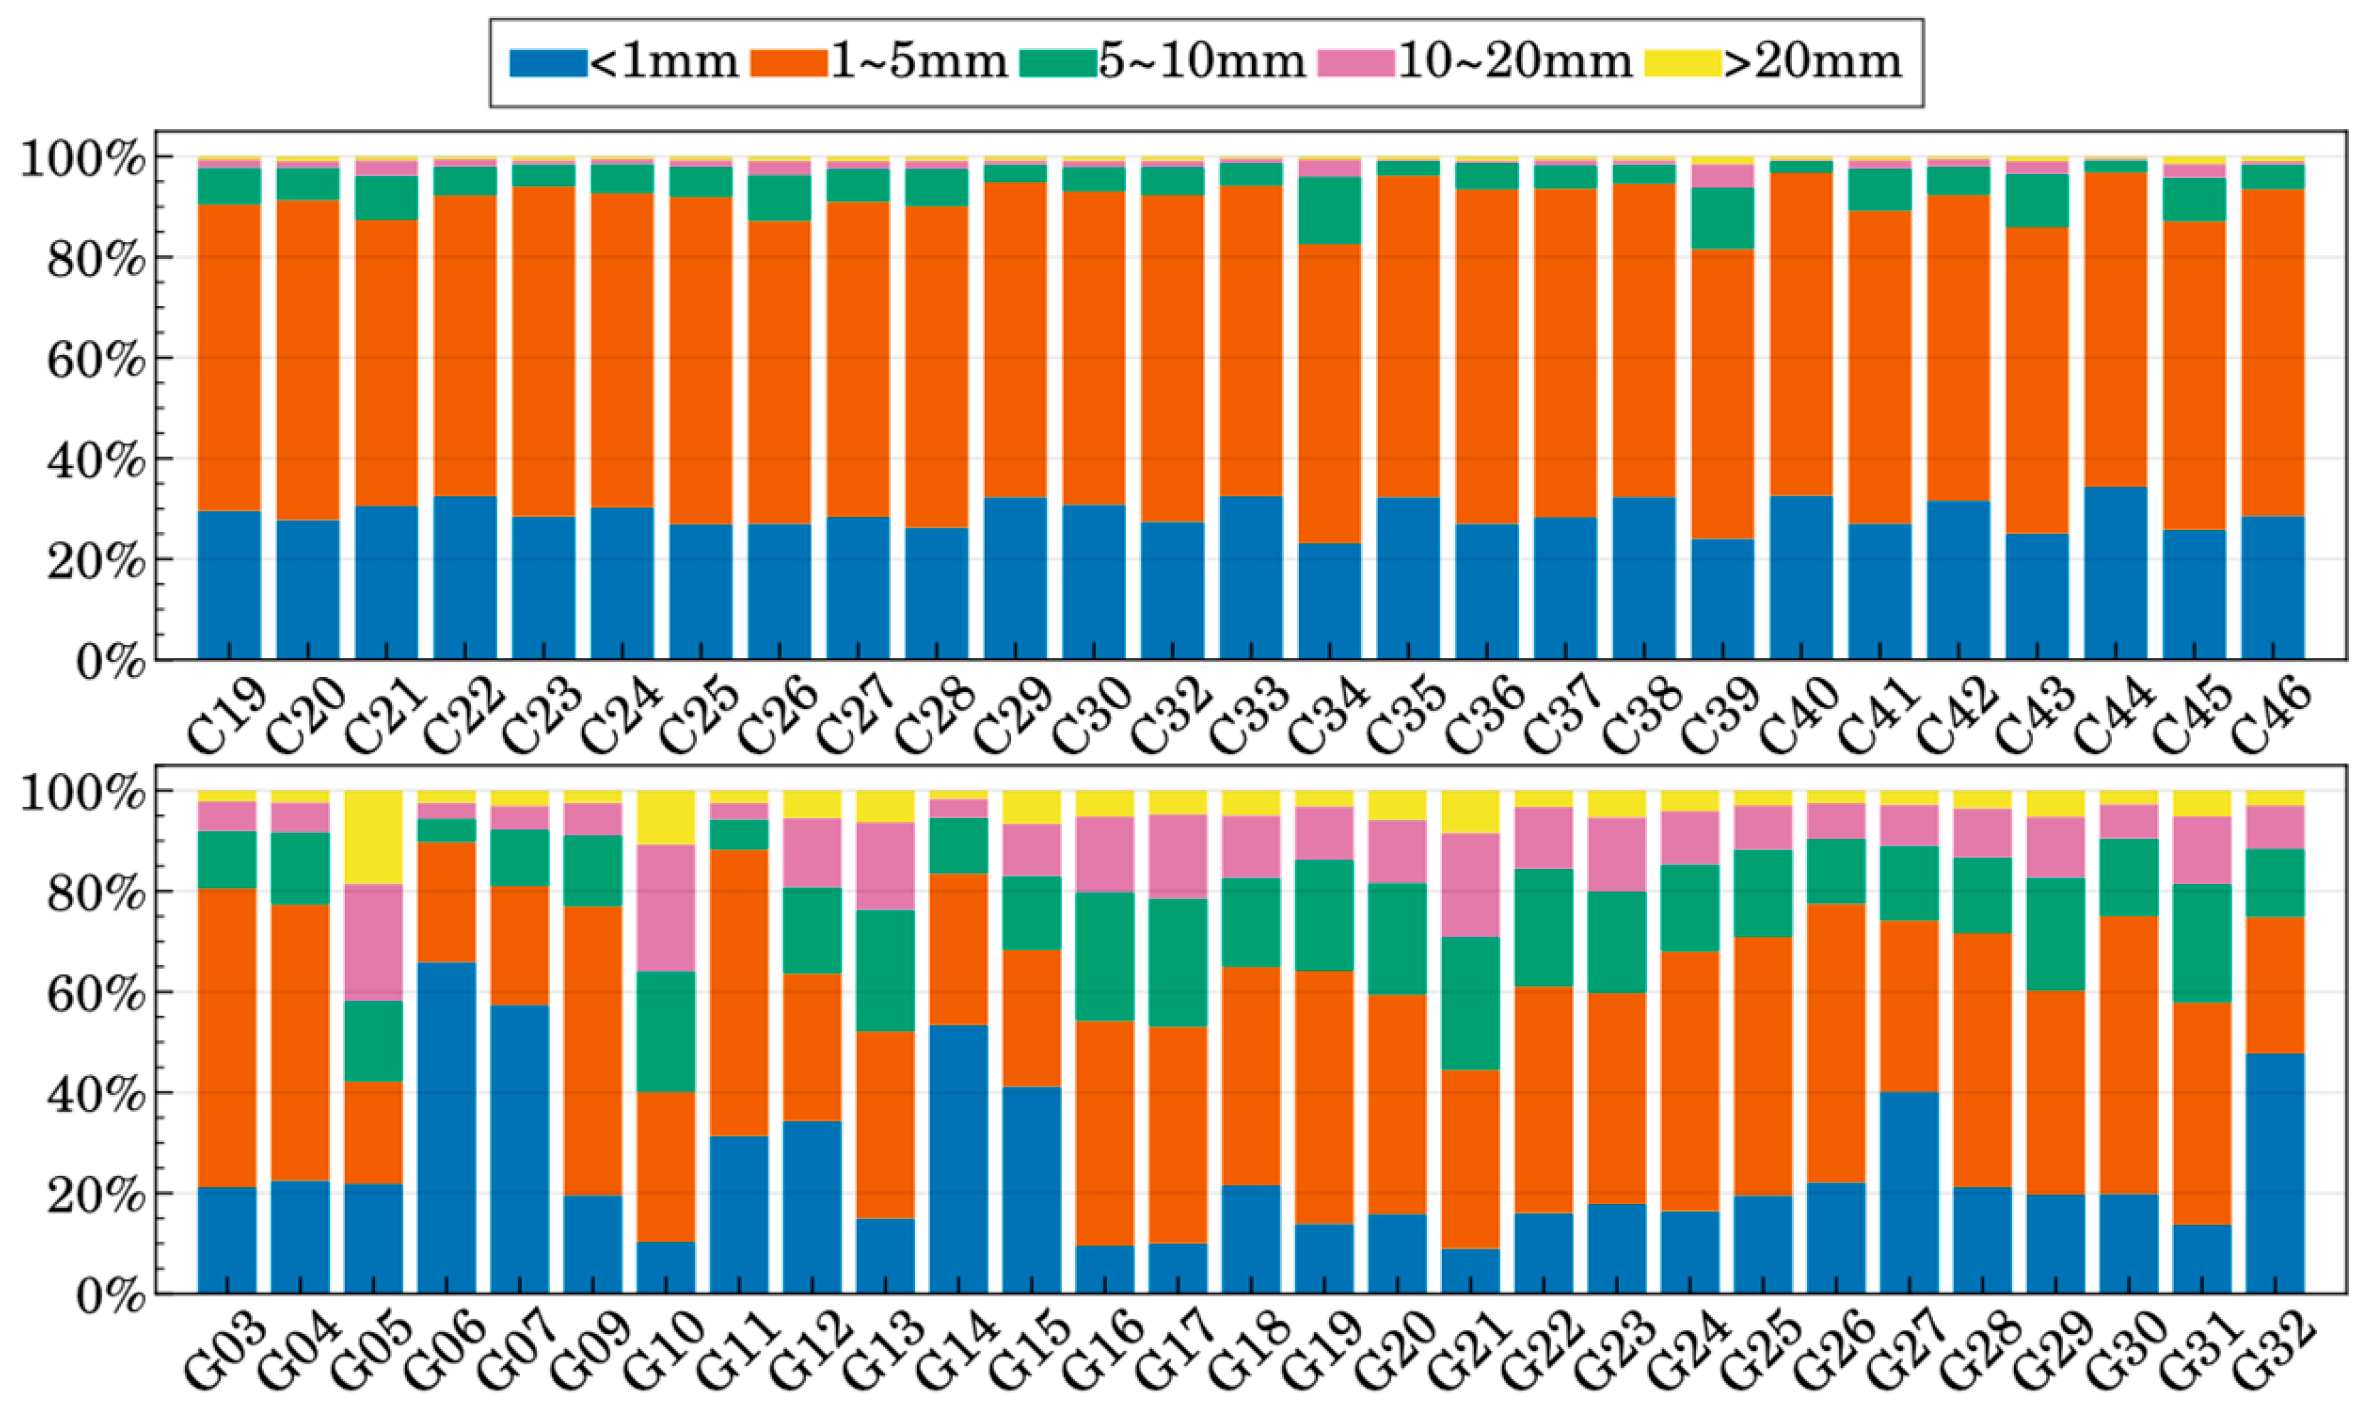
The distribution of differences in clock correction values is depicted in
Figure 8 (with an epoch interval of 6 s). For BDS-3 satellites, approximately 30% of the time intervals exhibit absolute differences within 1 mm. By extending the validity period of clock corrections, deviations within 10 min can be contained within 0.33 ns. Around 70% of the time intervals display absolute differences ranging between 1 and 10 mm, with reliability diminishing rapidly after surpassing the validity period. Instances with differences exceeding 10 mm are rare, primarily stemming from IOD alterations and outliers. Conversely, the absolute differences among GPS epochs are notably larger and more scattered compared to BDS-3, underscoring the frequency of clock correction jumps in GPS. Moreover, there are notable discrepancies among GPS satellites, with over 50% of the time intervals within 1 mm for G06, G07, and G14, indicating the importance of considering their stability when extrapolating. However, G05 exhibits absolute differences exceeding 10 mm in over 18.5% of the time intervals, much higher than other satellites, suggesting challenges in continuing to use the clock correction values of G05 after surpassing the validity period. Each day’s data were processed independently within the statistical time intervals, demonstrating high stability and consistency for each satellite daily. Therefore, for clock correction value outlier detection, the threshold was set to 10 mm for BDS-3 satellites and 20 mm for GPS satellites.
After identifying an outlier, if it persists for 2 epochs or less, it can be deemed acceptable to continue using the value from the last normal epoch. However, if it persists for more than 2 epochs, it is classified as an interruption, prompting correction value prediction. In actual scenarios, most outlier values persist for only 1 epoch. Following the rectification of abnormal data and common jumps, the clock correction value sequence is as depicted in
Figure 9. In comparison to
Figure 5, the sequence’s continuity and stability show marked improvement, facilitating enhanced correction prediction and real-time PPP calculations.
4.2. Positioning Experiments
This section aims to validate the efficacy of outlier detection and prediction methods for PPP-B2b orbit and clock corrections by the positioning performance in both simulated and real-time dynamic scenarios.
4.2.1. Dataset and PPP Strategy
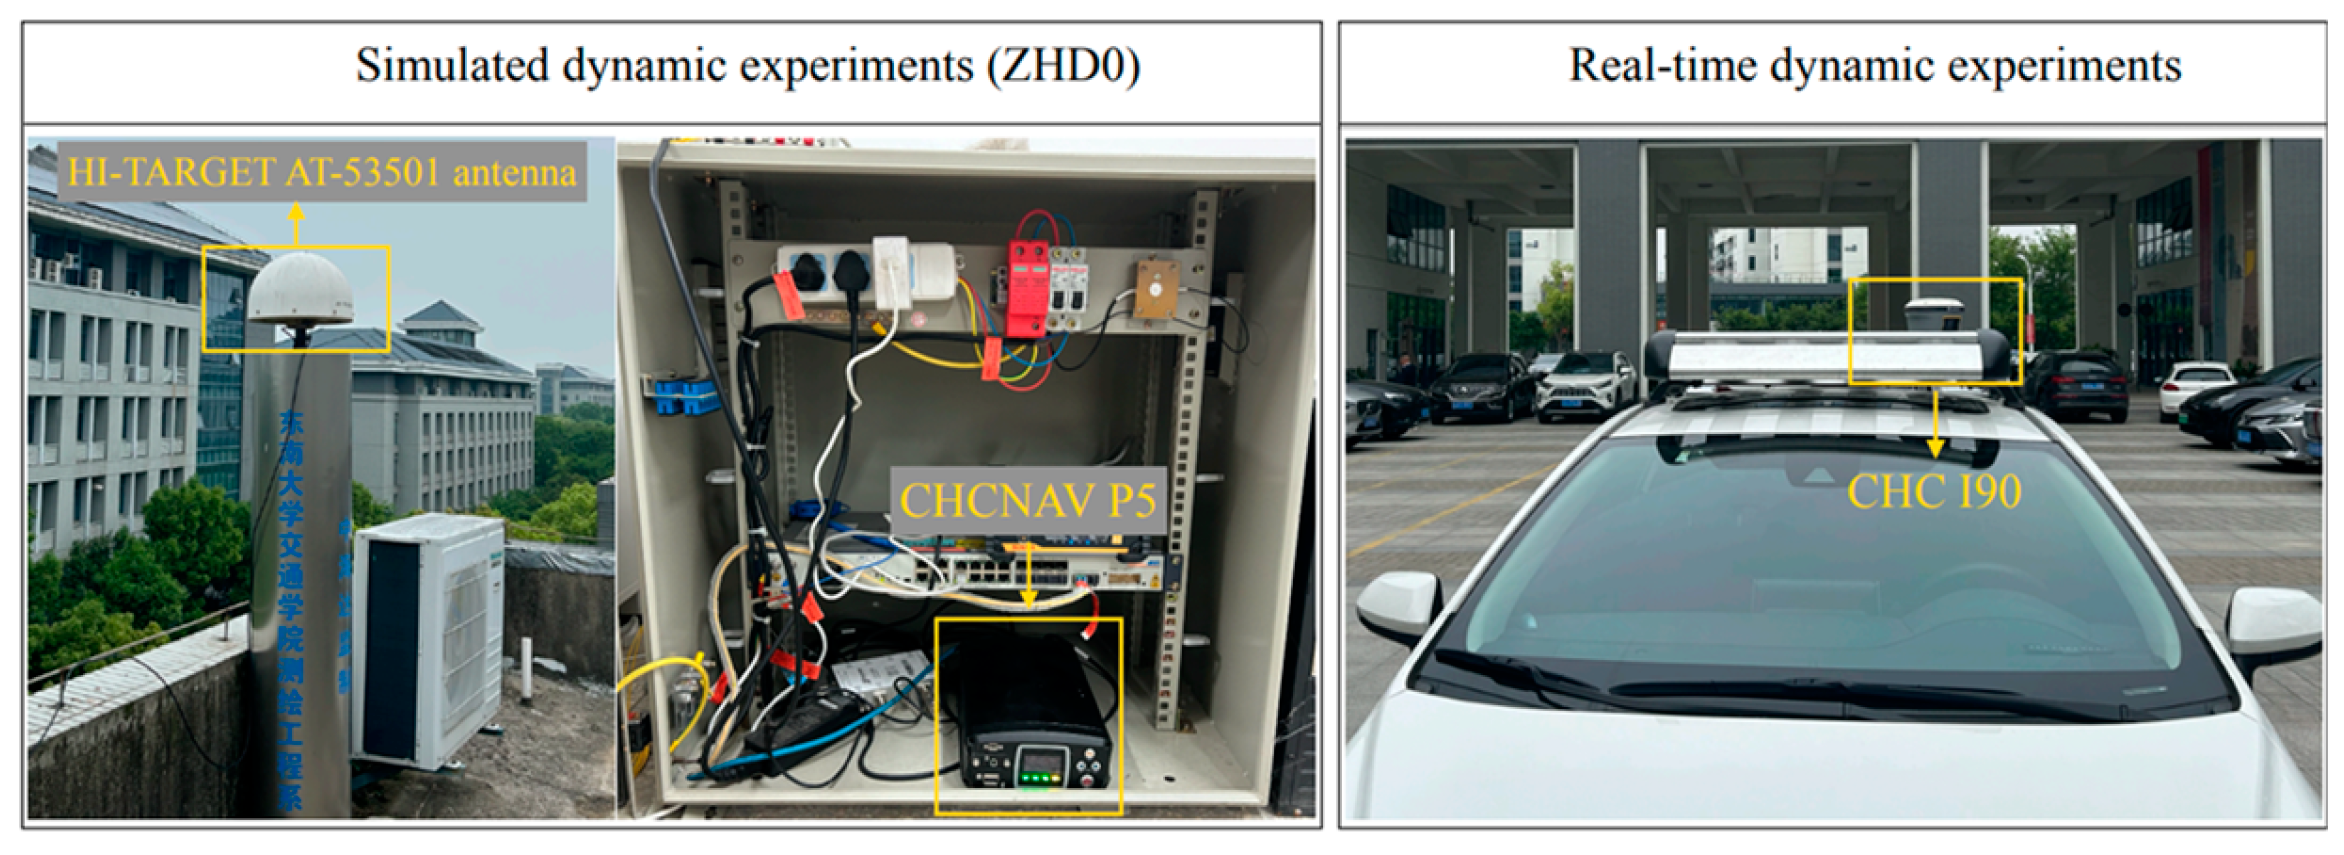
As illustrated in
Figure 10, the ZHD0 base station, one of the Continuously Operating Reference Stations (CORS) at Southeast University, was utilized for simulated dynamic PPP positioning accuracy assessment. The ZHD0 is equipped with geodetic GNSS receivers CHCNAV P5 and a HI-TARGET AT-53501 antenna, and observations were collected from 00:00:00 of DOY 13 to 23:59:30 of DOY 14, 2024, with a sampling interval of 1 s. Additionally, a field experiment was conducted on DOY 094 of 2024 at the campus of Southeast University to evaluate the performance of predicted corrections in real-time dynamitic scenarios. The CHC I90 geodetic receiver was used for data collection in this experiment. Alongside the utilization of predicted corrections (Predicted Correction), an extended validity period approach was employed for comparison (Extended Correction). Details of the data processing strategies are outlined in
Table 2.
4.2.2. Simulated Dynamic Experiments
To validate the reliability of the prediction method, simulated dynamic experiments were conducted across multiple different time periods within DOY 13-16.
Table 3 presents the selected specific time periods. “PPP Solution” denotes the periods used for the PPP calculation, each lasting two hours, while “Interruption” refers to the duration of the PPP-B2b signal that was interrupted.
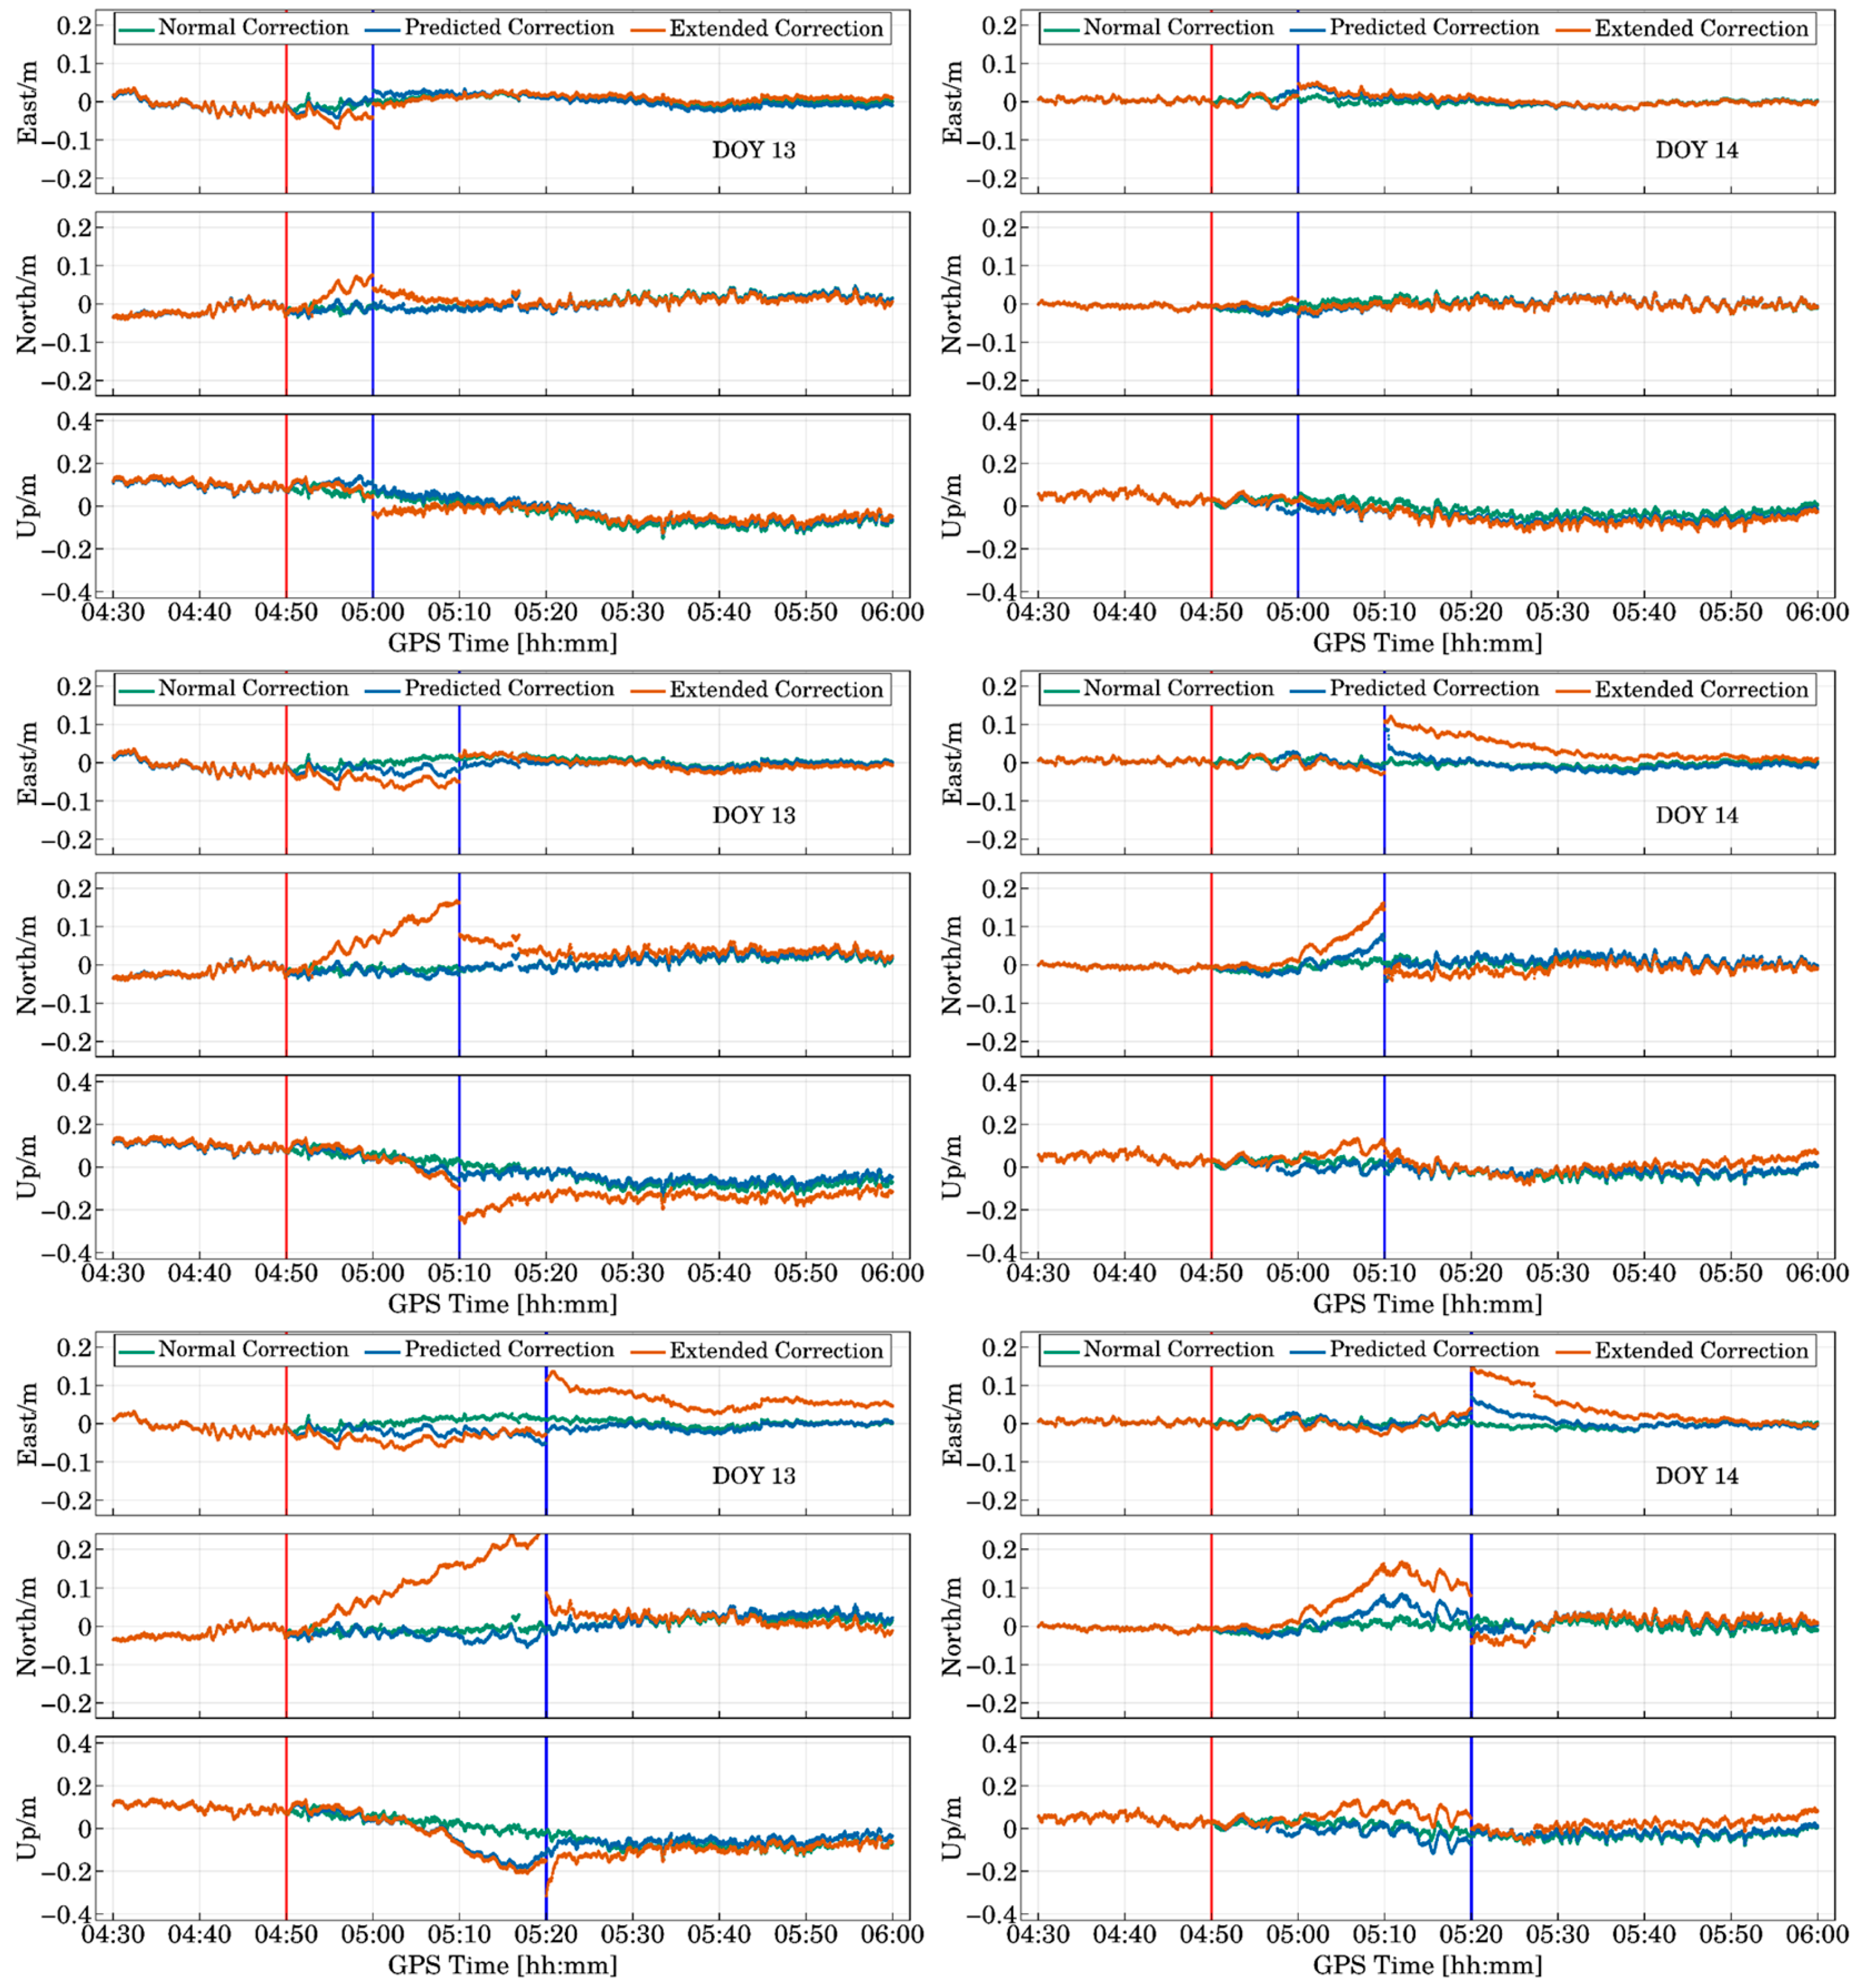
Figure 11 illustrates the positioning errors over the same timeframe on two consecutive days employing normal, predicted, and extended corrections. The experiment spanned from 4:00 to 6:00, with PPP fully converging by 4:30. At 4:50, the PPP-B2b information flow was interrupted and restored after intervals of 10, 20, and 30 min, respectively.
On DOY 13, utilizing extended corrections resulted in significant deviation after 10 min, notably with a North direction deviation reaching 7.6 cm. In contrast, predicted corrections exhibited superior stability. With prolonged interruptions, positioning deviation using extended corrections continued to escalate. A 20-min interruption led to an East direction deviation of 5.0 cm, North direction deviation of 16.7 cm, and Up direction deviation of 10.2 cm, indicating a decline in positioning accuracy to the decimeter level. However, predicted corrections maintained positioning deviation at the centimeter level throughout. Specifically, the North direction deviation remained consistent with normal corrections, while improvements were observed in the East and Up direction deviations compared to extended corrections. Following a 30-minute interruption, East and Up direction positioning deviations ceased to rise further, showing some rebound due to non-monotonic corrections. However, this does not imply accurate results, as deviations from orbit and clock corrections are absorbed by parameters like ionospheric delay and ambiguity, disrupting filtering estimation. Upon signal reacquisition, positioning outcomes using extended corrections did not immediately normalize. North and Up directions reconverged after approximately 10 min, while the East direction exhibited a system deviation of about 5 cm. In practice, prolonged interruptions may lead to similar issues with predicted corrections.
Hence, adjusting filter parameters appropriately after extended interruptions is necessary. This indirectly highlights that predicted corrections can prolong correction effectiveness and uphold the continuity and stability of positioning outcomes in the short term.
The positioning results on DOY 14 closely resembled those on DOY 13. Throughout the interruption, the employment of extended corrections exhibited a minor deviation in the East direction, while the North direction deviation demonstrated a discernible upward trend over time. However, following a 20-min signal disruption and reacquisition, it took 30 min for the East direction to fully realign with normalcy, initially showing an error of 14.7 cm. Similarly, the North direction displayed an initial deviation of approximately 4.5 cm, which normalized after about 10 min. Moreover, during the 20~30 min disruption interval, there was a declining trend in the North direction deviation, akin to the occurrence on DOY 13, attributed to irregular alterations in corrections. Notably, the rollback phenomenon on DOY 13 manifested in the East direction, while on DOY 14, it emerged in the North direction, underscoring the unpredictability of solely extending the effective period of corrections. The disparate initial deviations and reacquisition times for identical disruption durations further affirm this notion. The utilization of predicted corrections markedly enhanced positioning outcomes. Although discernible deviations and discontinuities persisted in the positioning results, their magnitudes were significantly mitigated, with the horizontal direction consistently within an 8.5 cm range, and the Up direction generally aligning with the results from normal corrections.
Table 4 illustrates the root mean square (RMS) values of positioning errors under different interruption durations, comparing the outcomes obtained using extended corrections and predicted corrections. “0 min” indicates no interruption, and the statistical indicator is the positioning accuracy during the last 10 min of the uninterrupted time period. As the interruption time increases, the positioning accuracy using both extended correction numbers and predicted correction numbers decreases. However, when using extended corrections, the positioning error in the North direction has exceeded 10 cm when the interruption duration reaches 20 min. When using the predicted corrections, the horizontal centimeter level positioning accuracy can be maintained for 30 min. Even with a 60-min interruption, the positioning accuracy using predicted corrections remains within 15 cm, while the accuracy of the extended corrections exceeds 30 cm. Overall, the positioning accuracy in the East and North directions improves by more than 20%, and the Up accuracy improves by over 10%. Therefore, using the predictive correction model proposed in this paper can effectively enhance the positioning accuracy of PPP-B2b during interruption periods.
4.2.3. Real-time Dynamic Experiments
The real-time dynamic localization experiments conducted on the campus of Southeast University in Nanjing, China, are illustrated in the left panel of
Figure 12. The right panel of
Figure 12 depicts our testing environment, which included open spaces, tree-shaded areas, and areas obstructed by buildings. The campaign lasted 120 min, from GPS time 4:30 to 6:30. To establish reference positions for the trajectory, we established a baseline between the receiver and the base station ZHD0. The maximum distance from the real-time kinematic (RTK) station to the trajectory was 2 km. RTK solutions calculated by RTKLib [
39] were considered as a reference to evaluate the positioning performance of PPP models.
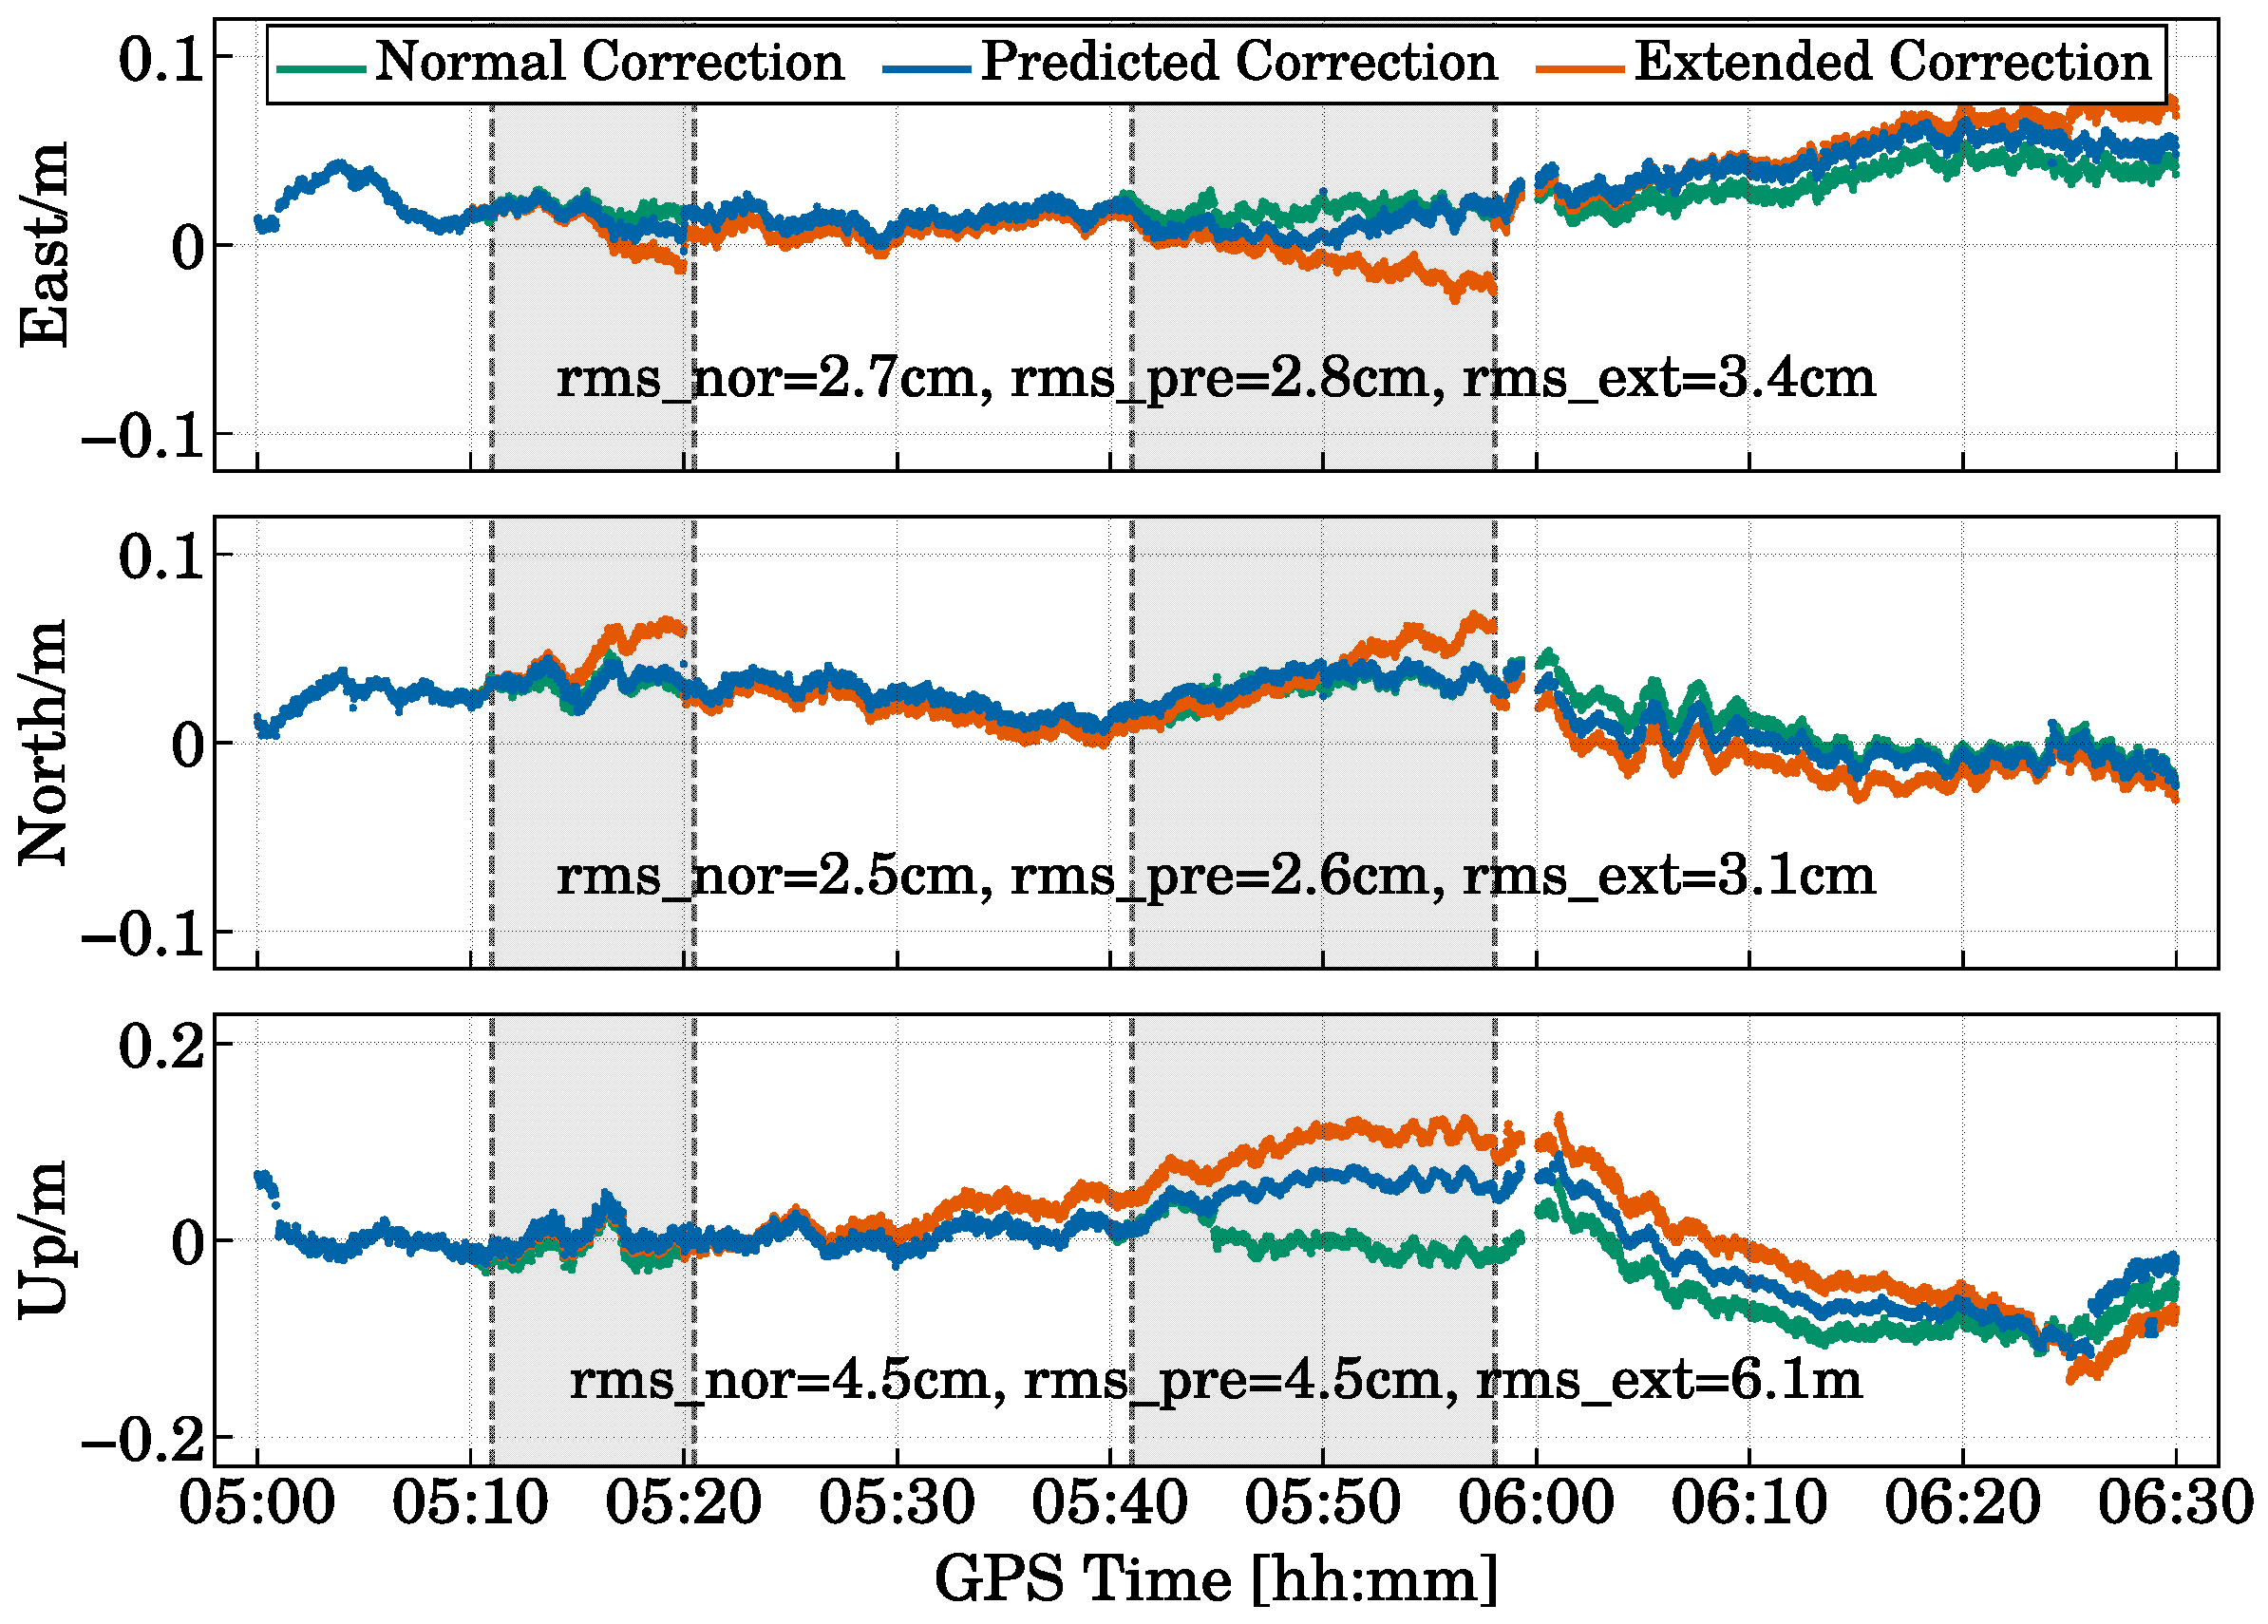
The positioning errors in dynamic scenarios are shown in
Figure 13. And
Table 5 provides the RMS values and maximum values of positioning errors during the interruption period. After 30 min, the PPP had fully converged. At 05:11, there was an interruption of about 8 min. During this interruption, a significant deviation of up to 7.0 cm occurred in the horizontal direction when employing the extended correction term. Meanwhile, there was no significant deviation in the vertical direction using either the extended or predicted corrections. However, after the signal was restored, the positioning results using the extended correction term showed a deviation and exhibited a trend of increasing over time, reaching 3.1 cm after 20 min of signal recovery. Similarly to the simulated dynamic experiment, this was mainly due to the erroneous estimation of filtering parameters during the signal interruption. The positioning results using the predicted correction term maintained good consistency with the normal corrections. At 05:41, there was an interruption of about 15 min, and as the interruption duration increased, the deviation in the positioning results also significantly increased. The maximum deviation in the horizontal direction using the extended correction term was 6.4 cm, while the maximum deviation in the vertical direction reached 12.3 cm. The predicted corrections still maintained high accuracy in the horizontal direction, with a maximum value of 5.2 cm. The accuracy in the vertical direction decreased somewhat, with a maximum deviation of 7.4 cm, but it was still much smaller than the positioning results using the extended corrections. In terms of overall accuracy, the horizontal positioning accuracy using predicted corrections improved by more than 10% compared to using extended corrections. Both showed significant deviations in the vertical direction, mainly due to the more rapid decay in clock precision, which had a greater impact on the vertical direction.
5. Discussion
To address the need for PPP services in areas lacking internet coverage, the provision of satellite-based PPP services has become a recent trend. Europe’s Galileo initiative aims to offer global free high-precision PPP services via the E6B signal [
40]. Japan’s QZSS provides centimeter-level augmentation services (CLAS) covering Japan through the L6D signal, supporting GPS, QZSS, and Galileo systems [
41]. In 2019, the BeiDou Office released preliminary documentation for the B2b signal and PPP-B2b signal. In August 2020, they followed up with the official release of interface protocol documentation, marking the commencement of free high-precision PPP-B2b services for China and its surrounding areas.
However, issues like signal matching and broadcast priority can lead to discontinuous reception of PPP-B2b signals. Thus, a detailed analysis of PPP-B2b data anomaly characteristics and the development of effective outlier detection methods are crucial for enhancing the utilization of PPP-B2b for high-precision positioning. Additionally, the PPP-B2b signal, broadcast via GEO satellites, inevitably experiences the “south wall effect”. During continuous real-time positioning processes, such as in smart connected vehicles, the PPP-B2b signal is easily obstructed, which can prevent continuous positioning. Simply extending the validity period of PPP-B2b corrections does not ensure reliable positioning. This paper begins by analyzing the time series characteristics of the orbit and clock corrections for BDS-3 and GPS provided by PPP-B2b, quantitatively examining their variation patterns. The analysis revealed that the corrections for BDS-3 and GPS exhibit different trends and have significantly different ranges of variation. Based on these findings, we developed an outlier detection mechanism tailored to each constellation and type, thereby enhancing the reliability of PPP-B2b positioning. Additionally, to address the issue of interrupted PPP-B2b signals leading to discontinuous positioning, we established differentiated prediction models. Experimental results demonstrate that with the outlier detection method and prediction model proposed in this paper, the positioning accuracy based on PPP-B2b can be maintained at the centimeter level within 30 min. This is of great significance for achieving continuous positioning based on PPP-B2b.

 ,
, 


